original research decomposing the decoupling of … the decoupling of carbon emissions and economic...
TRANSCRIPT
Introduction
There is growing scientific evidence of an increase in greenhouse gas (GHG) concentrations in the atmosphere since preindustrial times, contributing to rising global temperatures and to changes in climate patterns [1].
The ongoing emissions of GHG, which gives priority to carbon dioxide (CO2), undertakes the due obligations of both global warming and climate change. However, the share of power generation in global energy-related CO2 emissions has increased from 36% (8.8 Gt CO2) in 1990 to 41% (11.0 Gt CO2) in 2005, and if the current trends continue, this share is projected to increase to 45% (18.7 Gt CO2) in 2030 [2]. The power industry, the national backbone and the industry of the current national economy for China, has been suffering serious problems
Pol. J. Environ. Stud. Vol. 26, No. 5 (2017), 2407-2418
Original Research
Decomposing the Decoupling of carbon emissions and economic growth in china’s
power Industry
Jianguo Zhou, Fengtao guang*, Shijuan Du
Department of Economics and Management, North China Electric Power University, 689 Huadian Road, Baoding 071000, China
Received: 22 November 2016Accepted: 22 February 2017
Abstract
The power industry is the leading source of man-made carbon emissions in China, and it is supposed to assume most of the responsibility for reducing carbon emissions. To study the decoupling status between carbon emissions and economic growth in China’s power industry, a new OECD decoupling analysis with LMDI model is employed in this paper. The results are as follows: 1. Growth and volatility are the main characteristic features of carbon emissions in the power industry,
and carbon emissions increased from 25,059.65 ktce in 1995 to 100,805.75 ktce in 2014, with an annual average growth rate of 15.11%.
2. Per capita output effect, energy structure effect, and population scale effect play a positive role in the increment of carbon emissions, with contributions of 202.69%, 1.42%, and 19.96%, respectively. Energy intensity effect is the only driving force on the decline of carbon emissions, with a contribution rate of -124.07%.
3. There exists a weak decoupling relationship between carbon emissions and economic growth in the power industry for most of the study years. It should be noted that energy intensity effect plays a prominent role in the development of decoupling.
Keywords: carbon emissions, economic growth, LMDI model, OECD decoupling index, China’s power industry
*e-mail: [email protected]
DOI: 10.15244/pjoes/69103
2408 Zhou J., et al.
of high energy consumption and carbon emissions. Bound by resources endowment, combustion of abundant coal for China’s power generation comes into being as excessive carbon discharge. In the long term, the power industry is the chief resource of carbon emissions in China.
China, as the world’s largest carbon emitter, officially announced Actions on Climate Change: China’s Intended Nationally Determined Contributions (INDC) on 30 June 2015, and made clear the target of tackling climate change. Details of the target are as follows: CO2 emissions will reach the peak around 2030 or much earlier; CO2 emissions will be reduced by 60-65% per unit of GDP in 2030 as compared to 2005, and the non-fossil energy share of total primary energy consumption will reach 20% by 2030. Thus, the development of low-carbon economy and the establishment of a low-carbon society pose a great challenge to China’s power industry, which should take most of the responsibility for reducing carbon emissions to achieve the goals early, making climate change better.
The power industry plays a vital role in modern society and economic development, and electricity supply and security have a close relationship with the national security strategy. “1035” (the 13th Five-year plan) provides a great chance to accelerate the development of transformation for China’s power industry. Along with robust economic development, all of society relies more and more on electrical power. While maintaining the rapid development of the power industry, how to protect the continued and reliable supply of electricity and curb carbon emissions is an urgent and arduous task. In this sense, this paper, which studies carbon emissions of China’s power industry, is realistic and significant.
At present, lots of in-depth research related to carbon emissions [3], which mainly focuses on the national [4], regional [5] and sector levels [6], have been extensively conducted. This research can be categorized into two groups: applying decomposition analysis (DA) to quantify different factors contributing to changes in carbon emissions [7], and measuring the relationship of decoupling between economic development and carbon emissions based on the decoupling model [8].
The DA has been widely adopted to construe the changes of energy use and emissions in a considerable amount of literature [9-11]. To decompose total energy use and emissions into quantifiable explanatory variables is the primary purpose of DA. At present, studies pertinent to two popular decomposition techniques mainly encompass structural decomposition analysis (SDA) and index decomposition analysis (IDA) [12]. The application of SDA in energy and energy-related CO2 emissions can be found in Nie H. [13] and Su. B [14], while the studies on IDA can be found in Ang [15] and González [16]. The detailed concrete input-output (I-O) data and close association with I-O tables accounting for the indirect requirement in an economic system are basic requirements in SDA [17]. Because of the dependence on the I-O tables, the decomposition can only be performed additively, which
constrains the extensive use of SDA in empirical analysis. Compared to SDA, IDA requires less data-intensive and more diversified forms of decomposition than SDA, thereby decomposing the continuity of annual data on both economy-wide and industrial levels [18]. The IDA can be divided into the Laspeyres and Divisia techniques. The Laspeyres technique is easier to understand without the “zero-value” problem, but the decomposition results have large residual terms. The logarithmic mean divisia index technique (LMDI) is derived from the Divisia technique. Ang and Zhang demonstrated that LMDI is more suitable for the current study of CO2 emissions than Laspeyres, and that the LMDI decomposition results in no residuals, avoiding zero and being a perfect index decomposition method [19].
There are many studies that suggest a strong link between carbon emissions and economic development [20-22], and sustaining the decoupling state between carbon emissions and economic growth is an inevitable choice for the low-carbon economy [23], which shows economic development trends. The decoupling model is the best technique to characterize the real-time dynamic index of the relationship between carbon emissions and economic growth, which can identify the main part of circumstance contradiction in complex relations. The Organization for Economic Cooperation and Development (OECD) implemented the concept of decoupling in 2002 for the first time in the report of Indicator to measure Decoupling of Environmental Press from Economic Growth [24], which has been widely followed and adopted since then. The basic methodologies of decoupling analysis can be classified into the OECD decoupling index [25] and Tapio decoupling elasticity. The Tapio decoupling elasticity was first developed by Tapio for his research in exploring the decoupling status in the European transport industry [26]. Each of them has different benefits and applications. Although the Tapio decoupling elasticity can’t be affected by changes of statistical dimensions, there are not consistent understandings about the division of decoupling degree. The OECD decoupling index is applied widely due to its simple operation, but it is too sensitive to the selection of base year. Wang [27] measured the total decoupling index between economic growth and energy consumption of China. Wu et al. [28] assessed the relationship between resource-environment and its growth by way of decoupling elasticity coefficient as evaluation indicators. Compared with Tapio decoupling elasticity, OECD decoupling index is more suitable for macroscopic research owing to the advantage of ease of use and ease of understanding.
From the previous literature, it can be concluded that the LMDI model and decoupling analysis are always used separately for issues related to carbon emissions. However, there is little literature discussing the decoupling effect between carbon emissions and economic growth through the combination of LMDI with decoupling analysis. Meanwhile, there is little research on the carbon emissions of the power industry in China, and the time span of selected samples in existing studies is relatively
2409Decomposing the Decoupling of carbon...
short. Malla [29] utilized LMDI to identify the driving factors of carbon emissions in the power industry for seven countries. Zhang et al. [30] first adopted LMDI to analyze the influencing factors of China’s CO2 from power generation during 1991 to 2009. However, this paper will combine LMDI and OECD to study the carbon emissions from China’s power industry from 1995 to 2014. In conclusion, the main objectives of this paper are as follows:1. To identify, quantify and construe the major
affecting factors regarding carbon emissions of China’s power industry using LMDI.
2. To probe the relationship between economic growth and carbon emissions in China’s power industry from the perspective of an improved OECD decoupling index.
3. To assess the decoupling stability of the carbon emissions in China’s power industry along with a quantitative analysis of affecting factors.The paper is constructed as follows: Section 1 makes
a brief introduction of related theoretical foundation and previous studies. Section 2 describes the model and data used to undertake the analysis. Section 3 shows and discusses the empirical results. Conclusions and implications are given in Section 4.
Material and Methods
Estimation of Energy-Related Carbon Emissions
With no official data of carbon emissions releases scheduled today from China’s power industry, there is a need to calculate energy-related carbon emissions in this paper. According to the usual practice of accoun-ting for carbon emissions, renewable energy sources such as solar energy and tidal and wind power can be set to zero. In addition, almost no carbon is emitted in the process of desulfurization, which can often be ignored. Consequently, carbon emissions of the power industry only involve that of fossil energy consumption (coal, oil, and natural gas) in the process of thermal power gene- ration [31]. Based on the industry carbon emissions formula proposed by Li Hong and Ya Kun [32] and considering the characteristics of the power industry, this paper puts forward the following specific calculation formula:
(1)
… where ctot represents total carbon emissions of the power industry; i refers to fossil energy types, including “coal and its products,” “oil and its products,” and “gas and its products”; ρi is the consumption based on fossil energy i; γi is the conversion coefficient of fossil energy i to standard coal; and ki is the carbon emission coefficient of fossil energy i.
LMDI Decomposition Model
To conduct delicate research on the driving factors of the carbon emissions from China’s power industry, further decomposition analysis of each factor is a must. This paper will utilize the LMDI decomposition model, which possesses the characteristics of simple, convenient and effective, strong practicability, wide application scope. The decomposition of carbon emissions in the power industry from seven Asia-Pacific and North American countries by Malla provides a reference for this paper [29]. Making improvement on this basis, the improved decomposition model is shown as follows:
(2)
…where ci represents carbon emissions emitted by the consumed fossil energy i; Ei is the energy consumption of fossil energy i, E is total energy consumption, namely
; Y denotes the total value of output in the power industry; and P is the number of average annual employed population in the power industry.
In order to study the effect of driving factors on carbon emissions, it is desirable first to transform Eq. (2) into the following forms:
(3)
To solve the problem of boundary value in carbon emissions decomposition, Ang took the time factor into account [33]. According to this treatment, carbon emissions changes of China’s power industry can be expressed as:
(4)
Converse the right side of Eq. (4) into the form of growth rate:
(5)
…where, gcGE, gEcS, gEcI, gPcO and gP, respectively, denote the change rate of carbon emission coefficients, energy structure, energy intensity, and per capita output in the process of power generation.
Assuming that t represents base year and T represents target year, then and indicate carbon emissions of power industry in base year and target year, respectively. Suppose ΔC equals the variation of carbon emissions
2410 Zhou J., et al.
during this period, which is . With the time interval of [t, T], Eq. (5) can be transformed into:
(6)
The variation of carbon emissions from base year t to target year T can be adequately decomposed as follows:
(7)
…where represents the effect of carbon emission coefficients. This paper assumes that each fossil energy source is burnt fully, which means the carbon emission coefficients of various types of fossil energy are constant. In other words, the contribution of the carbon emission coefficients effect to the variation of carbon emissions can be set to zero.
is the variation of carbon emissions caused by energy structure effect, which can be expressed as:
(8)
is the variation of carbon emissions caused by energy intensity effect, which can be expressed as:
(9)
is the variation of carbon emissions caused by per capita output effect, which can be expressed as:
(10)
is the variation of carbon emissions caused by population scale effect, which can be expressed as:
(11)
The function called the logarithmic mean function in the above formula is introduced by Ang and Choi [34] to solve the Divisia decomposition. Specific forms are listed as:
(12)
OECD Decoupling Index
LMDI decomposition can quantify the emission effects of different factors influencing emissions from China’s power industry, but it can’t measure the changes in relationships between carbon emissions reduction and the development of power industry. However, “decoupling” proposed by OECD is one of the most effective tools to explore the relationship between economic development
and the consumption of material and energy, and its theoretical basis is the framework of driving force-pressure-state-impact-response, which mainly reflects how driving force and pressure changes over the same period [35]. The use of the OECD decoupling index can efficiently reflect the constantly changing process of the relationship between carbon emissions and economic growth.
The government’s reduction efforts involves direct or indirect measurements to inhibit the increase of carbon emissions, and such measures are mainly embodied as the industrial structure adjustment, energy efficiency improvement, the change in energy structure, and so on [36]. In this case, the government's reduction efforts can be presented as:
(13)
Based on the previous LMDI model, the paper defines an improved OECD decoupling index model:
(14)
…where Dtot indicates the total effect of power industry, and DEcS, DEcI, and DP refer to the decoupling effect of energy structure, energy intensity, and population scale, respectively.
If Dtot ≤ –1, there exists a strong decoupling effect, which signifies that the effect of carbon emissions reduction is more significant than the driving effect of economic growth.
If –1 < Dtot <0, there exists a weak decoupling effect, which indicates that the effect of carbon emissions reduction is weaker than the driving effect.
If Dtot >0, there is no decoupling effect, indicating that the possible inhibiting factors can’t decrease the carbon emissions efficiently. Conversely, it induces an increase.
To delve into the relative contribution of each factor to the overall decoupling progress, an evaluation model with fractional form is established as follows:
(15)
Xu [37] demonstrated that the relationship between economic growth and carbon emission of the power industry presents a trend of fluctuations including various decouplings and re-links. The decoupling stability index can be defined as:
(16)
…where N is the total number of samples, σ(i) is the decoupling value during the period of i, ε and reflects the stability of the decoupling state – the smaller the better.
2411Decomposing the Decoupling of carbon...
Data Sources and Usage
The annual data adopted in this paper covers the period from 1995 to 2014 of China’s power industry. The data of energy consumption of various types in power generation, the total output of power industry, power production, and power consumption are acquired from the China Statistical Yearbook and the China Energy Statistical Yearbook, the number of average annual employed population in the power industry and power industry’s PPI come from the China Population Statistics Yearbook and the China Industrial Statistical Yearbook, standard coal coefficient and carbon emission coefficients are derived from the China Energy Statistical Yearbook 2015, IPCC Guidelines for National Greenhouse Gas Inventories 2006, and GHG Protocol Tool for Energy Consumption. Excluding price effect, the total output of the power industry is converted to 1995 prices by power industry’s PPI.
Results and Discussion
Evolution of Energy Consumption and Carbon Emissions
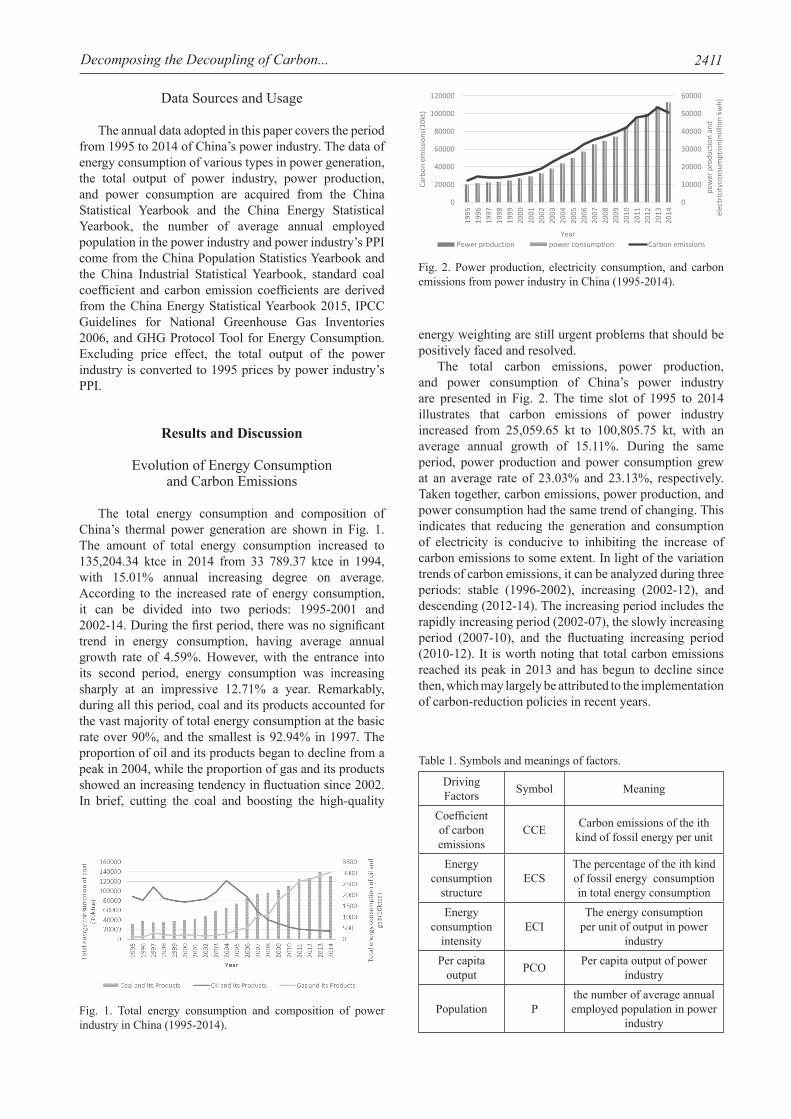
The total energy consumption and composition of China’s thermal power generation are shown in Fig. 1. The amount of total energy consumption increased to 135,204.34 ktce in 2014 from 33 789.37 ktce in 1994, with 15.01% annual increasing degree on average. According to the increased rate of energy consumption, it can be divided into two periods: 1995-2001 and 2002-14. During the first period, there was no significant trend in energy consumption, having average annual growth rate of 4.59%. However, with the entrance into its second period, energy consumption was increasing sharply at an impressive 12.71% a year. Remarkably, during all this period, coal and its products accounted for the vast majority of total energy consumption at the basic rate over 90%, and the smallest is 92.94% in 1997. The proportion of oil and its products began to decline from a peak in 2004, while the proportion of gas and its products showed an increasing tendency in fluctuation since 2002. In brief, cutting the coal and boosting the high-quality
energy weighting are still urgent problems that should be positively faced and resolved.
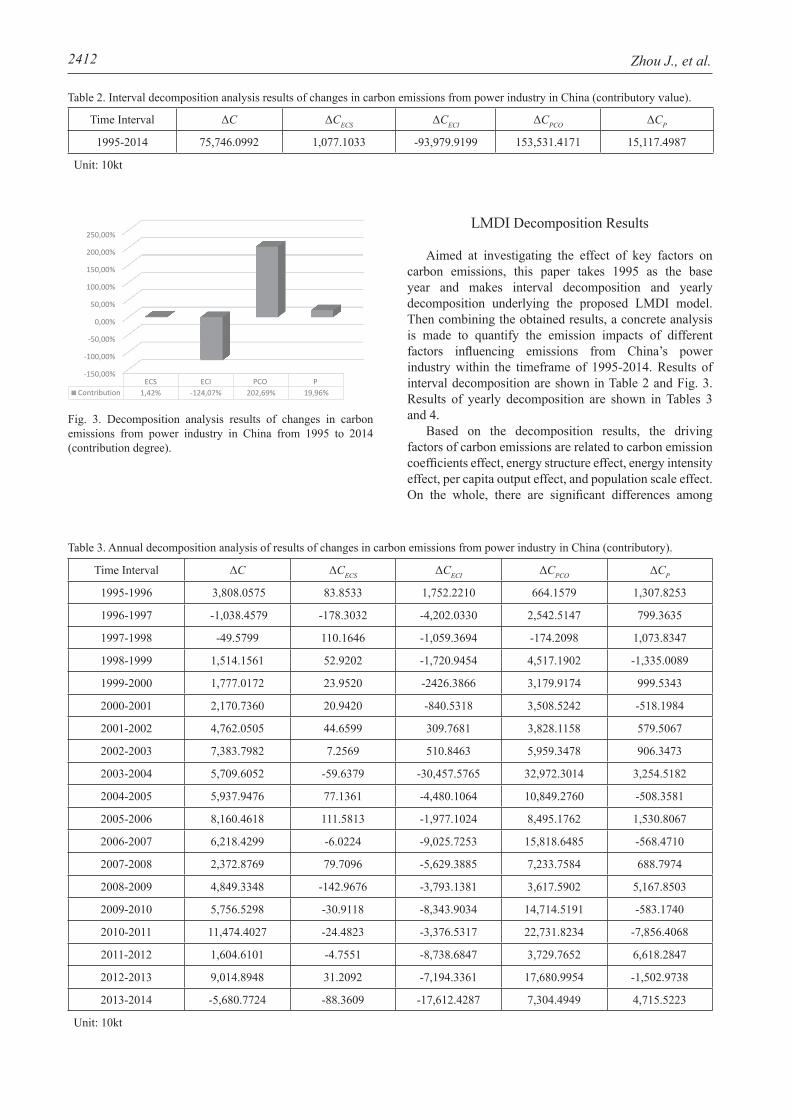
The total carbon emissions, power production, and power consumption of China’s power industry are presented in Fig. 2. The time slot of 1995 to 2014 illustrates that carbon emissions of power industry increased from 25,059.65 kt to 100,805.75 kt, with an average annual growth of 15.11%. During the same period, power production and power consumption grew at an average rate of 23.03% and 23.13%, respectively. Taken together, carbon emissions, power production, and power consumption had the same trend of changing. This indicates that reducing the generation and consumption of electricity is conducive to inhibiting the increase of carbon emissions to some extent. In light of the variation trends of carbon emissions, it can be analyzed during three periods: stable (1996-2002), increasing (2002-12), and descending (2012-14). The increasing period includes the rapidly increasing period (2002-07), the slowly increasing period (2007-10), and the fluctuating increasing period (2010-12). It is worth noting that total carbon emissions reached its peak in 2013 and has begun to decline since then, which may largely be attributed to the implementation of carbon-reduction policies in recent years.
Fig. 1. Total energy consumption and composition of power industry in China (1995-2014).
Fig. 2. Power production, electricity consumption, and carbon emissions from power industry in China (1995-2014).
Driving Factors Symbol Meaning
Coefficient of carbon emissions
CCE Carbon emissions of the ith kind of fossil energy per unit
Energy consumption
structureECS
The percentage of the ith kind of fossil energy consumption in total energy consumption
Energy consumption
intensityECI
The energy consumption per unit of output in power
industryPer capita
output PCO Per capita output of power industry
Population Pthe number of average annual employed population in power
industry
Table 1. Symbols and meanings of factors.
2412 Zhou J., et al.
LMDI Decomposition Results
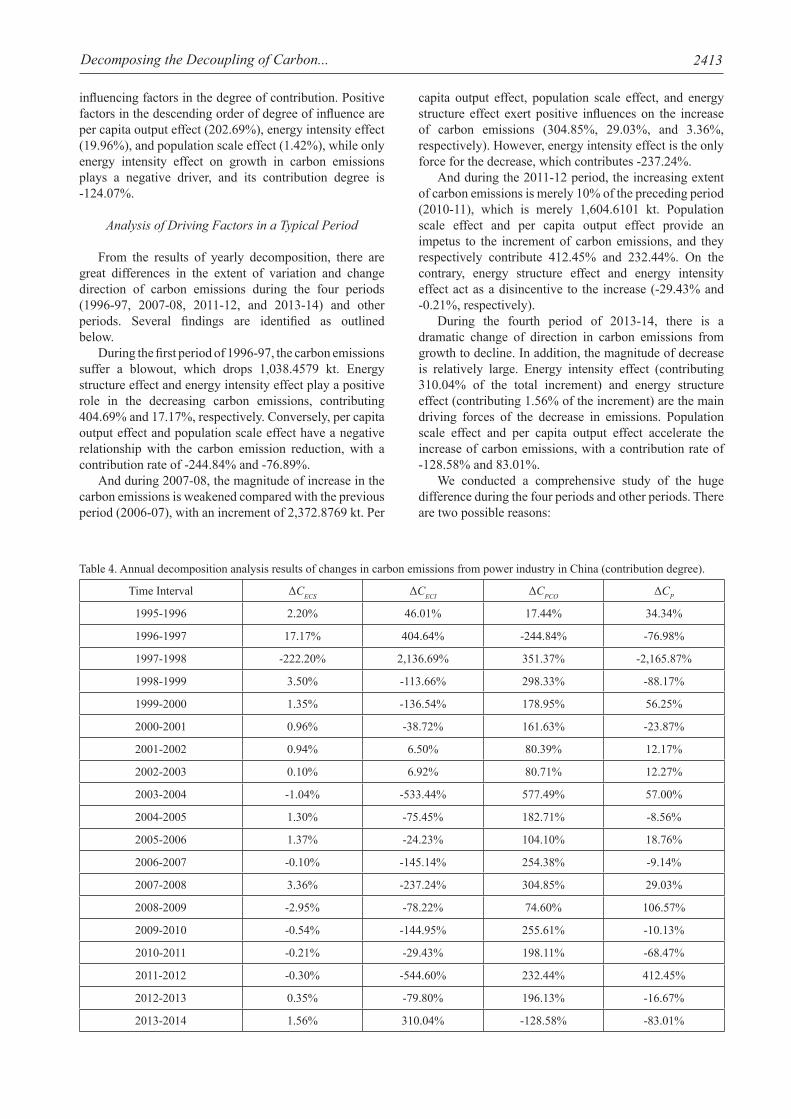
Aimed at investigating the effect of key factors on carbon emissions, this paper takes 1995 as the base year and makes interval decomposition and yearly decomposition underlying the proposed LMDI model. Then combining the obtained results, a concrete analysis is made to quantify the emission impacts of different factors influencing emissions from China’s power industry within the timeframe of 1995-2014. Results of interval decomposition are shown in Table 2 and Fig. 3. Results of yearly decomposition are shown in Tables 3 and 4.
Based on the decomposition results, the driving factors of carbon emissions are related to carbon emission coefficients effect, energy structure effect, energy intensity effect, per capita output effect, and population scale effect. On the whole, there are significant differences among
Time Interval Δc ΔcEcS ΔcEcI ΔcPcO ΔcP
1995-2014 75,746.0992 1,077.1033 -93,979.9199 153,531.4171 15,117.4987
Unit: 10kt
Table 2. Interval decomposition analysis results of changes in carbon emissions from power industry in China (contributory value).
Fig. 3. Decomposition analysis results of changes in carbon emissions from power industry in China from 1995 to 2014 (contribution degree).
Time Interval Δc ΔcEcS ΔcEcI ΔcPcO ΔcP
1995-1996 3,808.0575 83.8533 1,752.2210 664.1579 1,307.8253
1996-1997 -1,038.4579 -178.3032 -4,202.0330 2,542.5147 799.3635
1997-1998 -49.5799 110.1646 -1,059.3694 -174.2098 1,073.8347
1998-1999 1,514.1561 52.9202 -1,720.9454 4,517.1902 -1,335.0089
1999-2000 1,777.0172 23.9520 -2426.3866 3,179.9174 999.5343
2000-2001 2,170.7360 20.9420 -840.5318 3,508.5242 -518.1984
2001-2002 4,762.0505 44.6599 309.7681 3,828.1158 579.5067
2002-2003 7,383.7982 7.2569 510.8463 5,959.3478 906.3473
2003-2004 5,709.6052 -59.6379 -30,457.5765 32,972.3014 3,254.5182
2004-2005 5,937.9476 77.1361 -4,480.1064 10,849.2760 -508.3581
2005-2006 8,160.4618 111.5813 -1,977.1024 8,495.1762 1,530.8067
2006-2007 6,218.4299 -6.0224 -9,025.7253 15,818.6485 -568.4710
2007-2008 2,372.8769 79.7096 -5,629.3885 7,233.7584 688.7974
2008-2009 4,849.3348 -142.9676 -3,793.1381 3,617.5902 5,167.8503
2009-2010 5,756.5298 -30.9118 -8,343.9034 14,714.5191 -583.1740
2010-2011 11,474.4027 -24.4823 -3,376.5317 22,731.8234 -7,856.4068
2011-2012 1,604.6101 -4.7551 -8,738.6847 3,729.7652 6,618.2847
2012-2013 9,014.8948 31.2092 -7,194.3361 17,680.9954 -1,502.9738
2013-2014 -5,680.7724 -88.3609 -17,612.4287 7,304.4949 4,715.5223
Unit: 10kt
Table 3. Annual decomposition analysis of results of changes in carbon emissions from power industry in China (contributory).
2413Decomposing the Decoupling of carbon...
influencing factors in the degree of contribution. Positive factors in the descending order of degree of influence are per capita output effect (202.69%), energy intensity effect (19.96%), and population scale effect (1.42%), while only energy intensity effect on growth in carbon emissions plays a negative driver, and its contribution degree is -124.07%.
Analysis of Driving Factors in a Typical Period
From the results of yearly decomposition, there are great differences in the extent of variation and change direction of carbon emissions during the four periods (1996-97, 2007-08, 2011-12, and 2013-14) and other periods. Several findings are identified as outlined below.
During the first period of 1996-97, the carbon emissions suffer a blowout, which drops 1,038.4579 kt. Energy structure effect and energy intensity effect play a positive role in the decreasing carbon emissions, contributing 404.69% and 17.17%, respectively. Conversely, per capita output effect and population scale effect have a negative relationship with the carbon emission reduction, with a contribution rate of -244.84% and -76.89%.
And during 2007-08, the magnitude of increase in the carbon emissions is weakened compared with the previous period (2006-07), with an increment of 2,372.8769 kt. Per
capita output effect, population scale effect, and energy structure effect exert positive influences on the increase of carbon emissions (304.85%, 29.03%, and 3.36%, respectively). However, energy intensity effect is the only force for the decrease, which contributes -237.24%.
And during the 2011-12 period, the increasing extent of carbon emissions is merely 10% of the preceding period (2010-11), which is merely 1,604.6101 kt. Population scale effect and per capita output effect provide an impetus to the increment of carbon emissions, and they respectively contribute 412.45% and 232.44%. On the contrary, energy structure effect and energy intensity effect act as a disincentive to the increase (-29.43% and -0.21%, respectively).
During the fourth period of 2013-14, there is a dramatic change of direction in carbon emissions from growth to decline. In addition, the magnitude of decrease is relatively large. Energy intensity effect (contributing 310.04% of the total increment) and energy structure effect (contributing 1.56% of the increment) are the main driving forces of the decrease in emissions. Population scale effect and per capita output effect accelerate the increase of carbon emissions, with a contribution rate of -128.58% and 83.01%.
We conducted a comprehensive study of the huge difference during the four periods and other periods. There are two possible reasons:
Time Interval ΔcEcS ΔcEcI ΔcPcO ΔcP
1995-1996 2.20% 46.01% 17.44% 34.34%
1996-1997 17.17% 404.64% -244.84% -76.98%
1997-1998 -222.20% 2,136.69% 351.37% -2,165.87%
1998-1999 3.50% -113.66% 298.33% -88.17%
1999-2000 1.35% -136.54% 178.95% 56.25%
2000-2001 0.96% -38.72% 161.63% -23.87%
2001-2002 0.94% 6.50% 80.39% 12.17%
2002-2003 0.10% 6.92% 80.71% 12.27%
2003-2004 -1.04% -533.44% 577.49% 57.00%
2004-2005 1.30% -75.45% 182.71% -8.56%
2005-2006 1.37% -24.23% 104.10% 18.76%
2006-2007 -0.10% -145.14% 254.38% -9.14%
2007-2008 3.36% -237.24% 304.85% 29.03%
2008-2009 -2.95% -78.22% 74.60% 106.57%
2009-2010 -0.54% -144.95% 255.61% -10.13%
2010-2011 -0.21% -29.43% 198.11% -68.47%
2011-2012 -0.30% -544.60% 232.44% 412.45%
2012-2013 0.35% -79.80% 196.13% -16.67%
2013-2014 1.56% 310.04% -128.58% -83.01%
Table 4. Annual decomposition analysis results of changes in carbon emissions from power industry in China (contribution degree).
2414 Zhou J., et al.
1) The impact of the financial crisis.The Asian financial crisis broke out in 1997, then the
American secondary mortgage crisis spread and became the global financial crisis in 2008, and the American debt crisis and the European debt crisis erupted in 2011. Under the trend of economic globalization, these three crises led to China’s economic growth slowdown, which in turn, however, has had a positive effect on the efficiency of power production and power consumption. On the one hand, the slower economic growth is beneficial to the minimization of the coal consumption rate of power generation and optimization of power production structure in the short term. There exists a steady equilibrium link between economic growth and power consumption, and the slowdown in the economy results in a slight increase of power consumption, and power production is largely dependent on power consumption, hence it is believed that the slower economic growth will eventually lead to the decline of power generation. According to China’s power generation dispatching, in addition to hydropower and nuclear having priority access to electric grids, thermal power gives priority to efficiency for winning more orders. In situations where the aggregate electricity demand is insufficient, thermal power units with high coal consumption rate are at risk of closure. On the other hand, the slower economic growth is helpful for reducing energy intensity and optimizing industrial structure. When economic growth is anemic, enterprises with high energy consumption, high discharge, and high pollution will gradually withdraw from the market due to high costs and poor competitiveness. With respect to the power industry, the closure of small thermal power units and the development of clean electricity can stimulate the optimization and upgrading of industrial structure.2) The impact of national policies related to energy-saving emission reduction.
The Chinese government carried out the development strategy of “Insist on resources development and conservation simultaneously, the saving in the first place” in 1996, and “Law of the People’s Republic of China on Conserving Energy” is promulgated in 1997. Thereafter, the Chinese government has carried out a series of drastic measures and policies to control emissions, such as “Emission standard of air pollutants for thermal power plants 2011” and “Notice of the State Council on printing and distributing air pollution control action plan 2013.” The implementation of these policies and measures brings a lot of advantages: – Reducing fossil energy consumption in the power
industry. Total energy consumption in 2014 has fallen by 7,497.60 ktce compared with 2013.
– Promoting the reduction of energy intensity in power industry. In 2014, energy intensity in the power industry slowed to 2.11 kt/billion yuan from 12.06 kt/billion yuan in1995.
– Strengthening development of clean renewable energies. As to September 2014, the accumu- lated installed renewable capacity reached about
404.37 million kW·h, which accounted for more than 30% of all installed capacity in China.
classification Analysis of Driving Factors
1) Energy structure effect. According to yearly decomposition results, the
contribution of energy structure effect on carbon emissions, which changes from positive value to negative value, can be broadly divided into two stages: 1995-2006 and 2006-14. The first stage of energy structure effect is promoting the increase of carbon emissions, while the second stage is inhibiting the increase of carbon emissions, and the absolute value of contribution goes up contrarily. These results are related to the variation trend of consumption of each energy. During the first stage of 1995-2016, the shortage of oil resources and the transformation from early oil combustion units to coal-fired units accelerated the increment of carbon emissions. The proportion of coal and its products in total energy consumption rose from 93.95% to 97.23%, and the proportion of oil and its products declined from 5.74% to 2.2%. In 2006-14 the share of gas and its products in total energy consumption rose by close to 1.7%, which may be explained by the promulgation and implementation of the “China Renewable Energy Law” in January 2006.2) Energy intensity effect.
The results of yearly decomposition show that the contribution value of energy intensity effect is negative over the years, which demonstrates that energy intensity effect constructs a major factor in restricting the exhaust of carbon emissions. Thanks to the advancement of the modern power installed capacity, the proliferation of system automation as well as the rapid scale development, energy efficiency has been greatly improved. China has accelerated the speed of closing small thermal power units with high pollution and high energy consumption since 2006. By the end of 2009, the number of plant closures reached 60 million kW. With its further implementation, energy-saving technology is widely applied in power industry, such as the integrated gasification combined cycle (IGCC) and combined cooling heating and power (CCHP).3) Per capita output effect.
The yearly decomposition results shows that per capita output effect has a positive impact on the increment of carbon emissions. Per capita out of power industry was up by factor of 16 in this period, which indicates that China’s power industry has developed rapidly. On the one hand China, in its mad dash for industrialization and economic growth, requires considerable power resources to support development progress. On the other hand, as the country’s economy has proposed, the quality and standard of living of residents have been increasingly improved. The per capita living power has increased from 83 kWh in 1995 to 508 kWh in 2014. People’s large demand for electricity stimulates development of industry; however, as electricity consumption continues to grow, carbon emissions are
2415Decomposing the Decoupling of carbon...
also augmented, which to some extent results in environ-mental deterioration.4) Population scale effect.
From the yearly decomposition results, it is obvious that population scale effect shows a jumbled variation that sometimes is regarded as a stimulus to the increment of carbon emissions or not. The power industry has always been recognized as a high capital and high-tech industry that relates greatly to other industries. Owing to its high threshold, employees in the power industry require a higher educational background and higher-level technological knowledge for power production and management. During 1995 to 2014, the number of average annual employment in power industry is creeping up from 2.1067 million to 2.7895 million. On the whole, the annual growth rate is relatively small at merely 1.6%. Improving the overall educational and technical level of employees in the power industry is a potential factor restricting carbon emissions.
Decoupling Analysis Results
To investigate a decoupling issue on energy-related carbon emissions and economic growth in China’s power industry, this paper has applied a new decoupling analysis. The combination of OECD decoupling index and LMDI
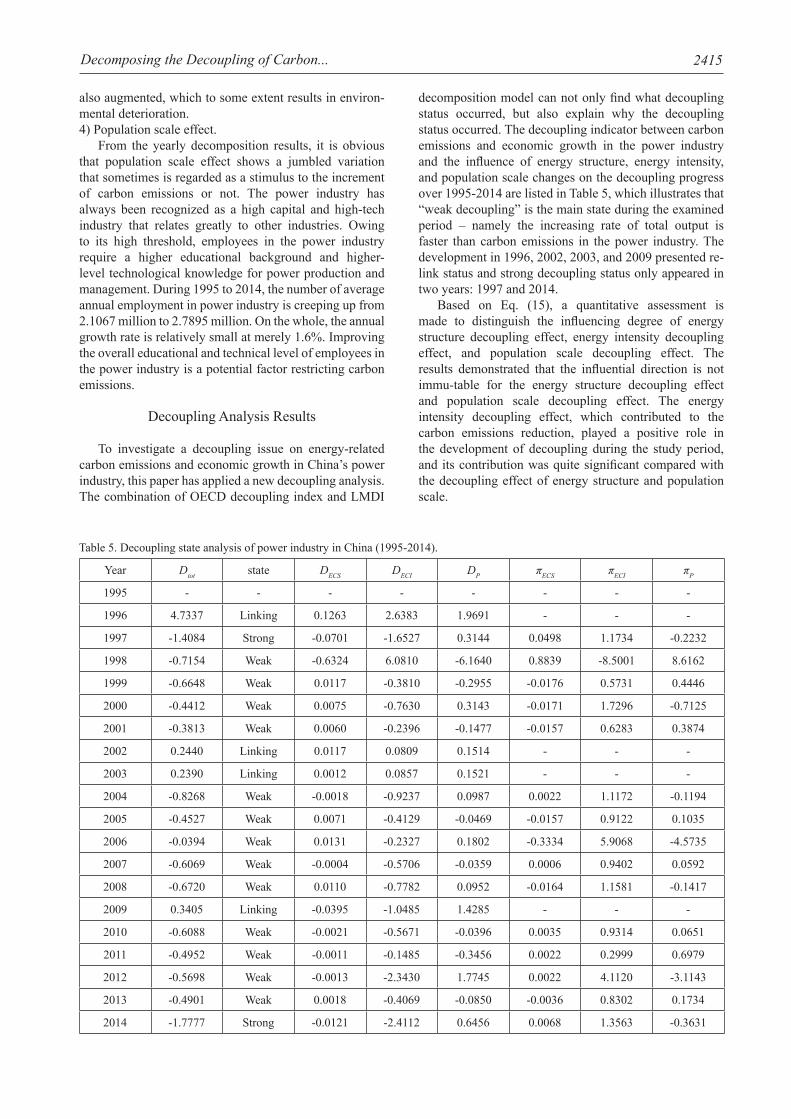
decomposition model can not only find what decoupling status occurred, but also explain why the decoupling status occurred. The decoupling indicator between carbon emissions and economic growth in the power industry and the influence of energy structure, energy intensity, and population scale changes on the decoupling progress over 1995-2014 are listed in Table 5, which illustrates that “weak decoupling” is the main state during the examined period – namely the increasing rate of total output is faster than carbon emissions in the power industry. The development in 1996, 2002, 2003, and 2009 presented re-link status and strong decoupling status only appeared in two years: 1997 and 2014.
Based on Eq. (15), a quantitative assessment is made to distinguish the influencing degree of energy structure decoupling effect, energy intensity decoupling effect, and population scale decoupling effect. The results demonstrated that the influential direction is not immu-table for the energy structure decoupling effect and population scale decoupling effect. The energy intensity decoupling effect, which contributed to the carbon emissions reduction, played a positive role in the development of decoupling during the study period, and its contribution was quite significant compared with the decoupling effect of energy structure and population scale.
Year Dtot state DEcS DEcI DP πEcS πEcI πP
1995 - - - - - - - -
1996 4.7337 Linking 0.1263 2.6383 1.9691 - - -
1997 -1.4084 Strong -0.0701 -1.6527 0.3144 0.0498 1.1734 -0.2232
1998 -0.7154 Weak -0.6324 6.0810 -6.1640 0.8839 -8.5001 8.6162
1999 -0.6648 Weak 0.0117 -0.3810 -0.2955 -0.0176 0.5731 0.4446
2000 -0.4412 Weak 0.0075 -0.7630 0.3143 -0.0171 1.7296 -0.7125
2001 -0.3813 Weak 0.0060 -0.2396 -0.1477 -0.0157 0.6283 0.3874
2002 0.2440 Linking 0.0117 0.0809 0.1514 - - -
2003 0.2390 Linking 0.0012 0.0857 0.1521 - - -
2004 -0.8268 Weak -0.0018 -0.9237 0.0987 0.0022 1.1172 -0.1194
2005 -0.4527 Weak 0.0071 -0.4129 -0.0469 -0.0157 0.9122 0.1035
2006 -0.0394 Weak 0.0131 -0.2327 0.1802 -0.3334 5.9068 -4.5735
2007 -0.6069 Weak -0.0004 -0.5706 -0.0359 0.0006 0.9402 0.0592
2008 -0.6720 Weak 0.0110 -0.7782 0.0952 -0.0164 1.1581 -0.1417
2009 0.3405 Linking -0.0395 -1.0485 1.4285 - - -
2010 -0.6088 Weak -0.0021 -0.5671 -0.0396 0.0035 0.9314 0.0651
2011 -0.4952 Weak -0.0011 -0.1485 -0.3456 0.0022 0.2999 0.6979
2012 -0.5698 Weak -0.0013 -2.3430 1.7745 0.0022 4.1120 -3.1143
2013 -0.4901 Weak 0.0018 -0.4069 -0.0850 -0.0036 0.8302 0.1734
2014 -1.7777 Strong -0.0121 -2.4112 0.6456 0.0068 1.3563 -0.3631
Table 5. Decoupling state analysis of power industry in China (1995-2014).
2416 Zhou J., et al.
There are several reasons that may account for the aforementioned results: – The enhancement of the overall technical level in
the power industry, especially the power generation technique. China insists on stepping up efforts to conserve energy, reduce emissions, and import new equipment and technology. In addition, with units tending to large capacity and high parameters, the power industry has become more friendly to and harmonious with the environment. The net coal consumption rate has declined from 412 g/ kWh (1995) to 318 g/ kWh (2014) for 6,000 kW and above power plants.
– Power generation and energy consumption continue to be dominated by coal, which has not been improved. The consumption of natural gas in China’s power industry reached 228.19 billion m3 in 2014, accounting for only 2.24% of total energy consumption. Considering that the unit carbon emissions of gas power is two-thirds of coal-fired power’s, only by greatly increasing the proportion of gas power in the future can the energy structure decoupling effect become more prominent.
– No much change occurred in the number of average annual employment in the power industry. The influence of the number of employees on the development of decoupling is limited due to its industry characteristics of capital and technology intensity. It is crucial to improve the number of practitioners of renewable energy to achieve the goal of strong decoupling.Given the decoupling relationship between carbon
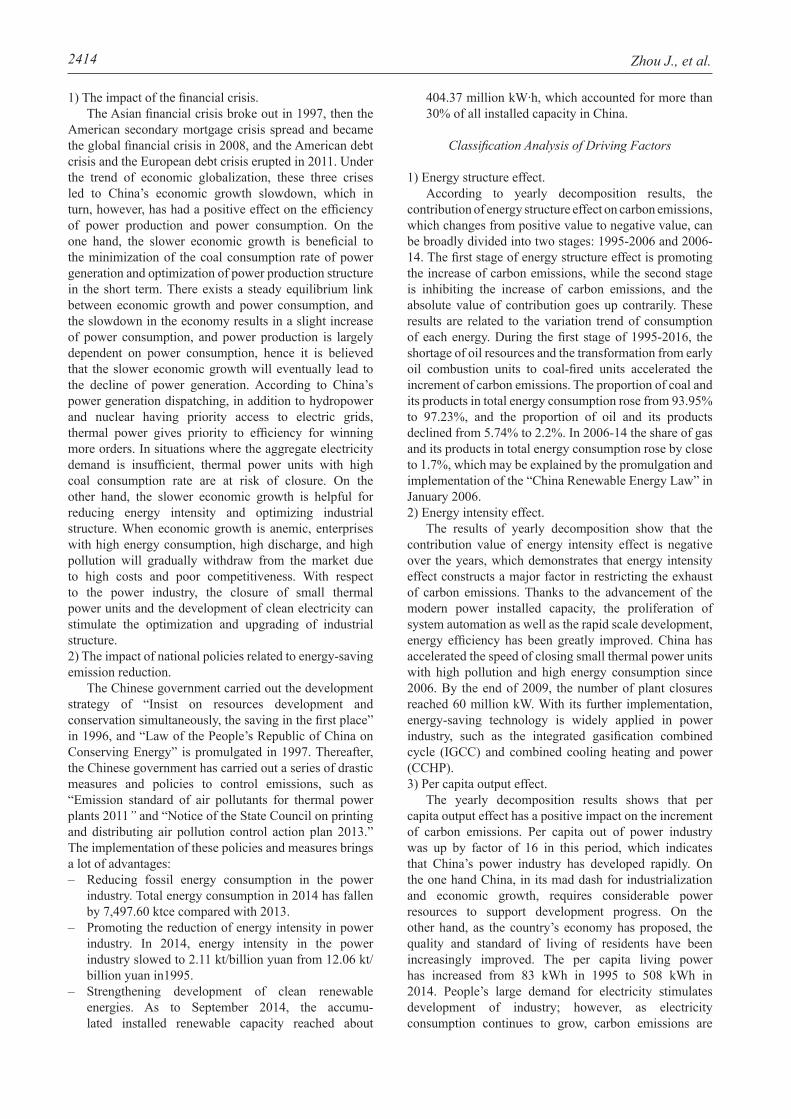
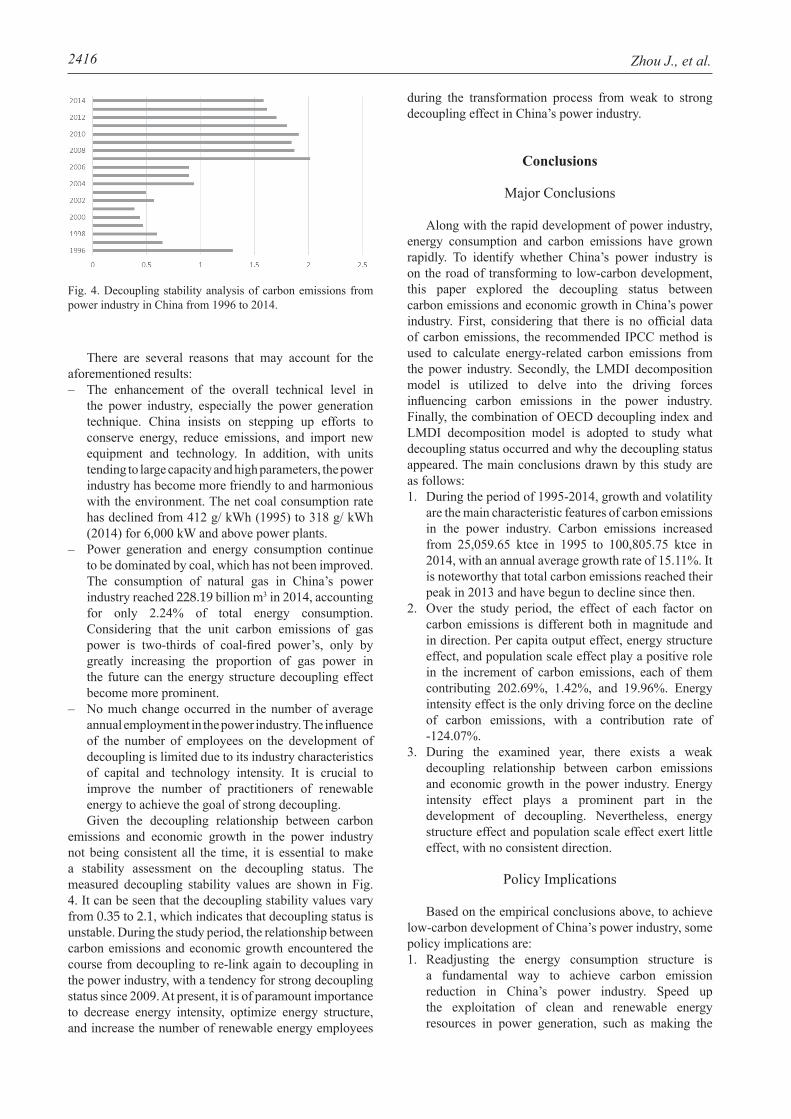
emissions and economic growth in the power industry not being consistent all the time, it is essential to make a stability assessment on the decoupling status. The measured decoupling stability values are shown in Fig. 4. It can be seen that the decoupling stability values vary from 0.35 to 2.1, which indicates that decoupling status is unstable. During the study period, the relationship between carbon emissions and economic growth encountered the course from decoupling to re-link again to decoupling in the power industry, with a tendency for strong decoupling status since 2009. At present, it is of paramount importance to decrease energy intensity, optimize energy structure, and increase the number of renewable energy employees
during the transformation process from weak to strong decoupling effect in China’s power industry.
conclusions
Major Conclusions
Along with the rapid development of power industry, energy consumption and carbon emissions have grown rapidly. To identify whether China’s power industry is on the road of transforming to low-carbon development, this paper explored the decoupling status between carbon emissions and economic growth in China’s power industry. First, considering that there is no official data of carbon emissions, the recommended IPCC method is used to calculate energy-related carbon emissions from the power industry. Secondly, the LMDI decomposition model is utilized to delve into the driving forces influencing carbon emissions in the power industry. Finally, the combination of OECD decoupling index and LMDI decomposition model is adopted to study what decoupling status occurred and why the decoupling status appeared. The main conclusions drawn by this study are as follows:1. During the period of 1995-2014, growth and volatility
are the main characteristic features of carbon emissions in the power industry. Carbon emissions increased from 25,059.65 ktce in 1995 to 100,805.75 ktce in 2014, with an annual average growth rate of 15.11%. It is noteworthy that total carbon emissions reached their peak in 2013 and have begun to decline since then.
2. Over the study period, the effect of each factor on carbon emissions is different both in magnitude and in direction. Per capita output effect, energy structure effect, and population scale effect play a positive role in the increment of carbon emissions, each of them contributing 202.69%, 1.42%, and 19.96%. Energy intensity effect is the only driving force on the decline of carbon emissions, with a contribution rate of -124.07%.
3. During the examined year, there exists a weak decoupling relationship between carbon emissions and economic growth in the power industry. Energy intensity effect plays a prominent part in the development of decoupling. Nevertheless, energy structure effect and population scale effect exert little effect, with no consistent direction.
Policy Implications
Based on the empirical conclusions above, to achieve low-carbon development of China’s power industry, some policy implications are:1. Readjusting the energy consumption structure is
a fundamental way to achieve carbon emission reduction in China’s power industry. Speed up the exploitation of clean and renewable energy resources in power generation, such as making the
Fig. 4. Decoupling stability analysis of carbon emissions from power industry in China from 1996 to 2014.

2417Decomposing the Decoupling of carbon...
most of wind, solar resources, and biomass energy. Furthermore, facilitating diversification of energy supply and consumption types will be the key to optimizing the energy structure. Furthermore, it’s necessary and imperative for the Chinese government to implement the economic regulations to cut down coal consumption. For instance, the reformation of the coal pricing mechanism is a more feasible path for China in the short term; accordingly, the fundamental incentive to energy savings is to reform the power pricing mechanism.
2. Decreasing energy intensity is a critical way to curb carbon emissions in China’s power industry. As mentioned above, energy intensity effect is a major contributor to carbon emissions reduction, and lowering the consumption of fossil energy and enhancing the efficiency of energy utilization can be beneficial ways to restrain the growth of energy intensity. Therefore, government should focus on exploiting, importing, and popularizing energy-related technologies while accelerating the elimination of obsolete equipment and adhering to the commitment of large-capacity and high-parameter generating units. Meanwhile, great significance should be attached to the exploitation of clean and renewable energy technology.
3. Building a smart grid is an effective and indispensable approach to achieving a win-win situation for the electric power grid and consumers. A smart grid provides people with an interactive platform to participate in and communicate with each other. The electric power grid offers efficient electric energy management to avoid the power losses of transmission and distribution, and the diminution of carbon emissions can be achieved. In particular, a smart grid will enable consumers to choose the high-quality power based on the available power information, then adapt it to their requirements as necessary.
Acknowledgements
This research was supported by the National Natural Science Foundation of China (NSFC) (grant No. 71471061).
References
1. SUNIL MALLA. CO2 Emissions from Electricity Generation in Seven Asia-Pacific and North American Countries: A Decomposition analysis, Energy Policy, 37, 1, 2009.
2. IEA, 2007a. World Energy Outlook 2007: China and India Insights. IEA, Paris.
3. QZTURK F., KELES M., EVERNDILEK F., KAZMERSKI L. Quantifying rates and drivers of change in long-term sector- and country- specific trends of carbon dioxide-equivalent greenhouse gas emissions, Renewable & Sustainable Energy Reviews, 65, 823, 2016.
4. CETIN M. A change in the mount of CO2 at the center of examination halls: Case study of Turkey, Studies on Ethno-Medicine, 10, 146, 2016.
5. WEN L., LIU Y. The peak value of carbon emissions in the Beijing-Tianjin-Hebei Region based on the STIRPAT model and scenario design, Polish Journal of Environment Studies, 25, 823, 2016.
6. JOHANSSON M.T. Effects on global CO2 emissions when substituting LPG with bio-SNG as fuel in steel industry reheating furnaces-the impact of different perspectives on CO2 assessment, Energy efficiency, 1, 2016.
7. NIE H., KEMP R., VIVANCO D.F., VASSEUR V. Structural decomposition analysis of energy-related CO2 emissions in China from 1997 to 2010, Energy Efficiency, 1, 2016.
8. SCHANDL H., HATFIELD-DODDS S., WIEDMANN T., GESCHKE A., CAI Y. Decoupling global environmental pressure and economic growth: scenarios for energy use, materials use and carbon emissions, Journal of Cleaner Production, 132, 45, 2016.
9. GAO C., LIU Y., JIN J, WEI T., ZHANG J., ZHU L. Driving forces in energy-related carbon dioxide emissions in east and south coastal China: commonality and variations, Journal of Cleaner Production, 135, 240, 2016.
10. MOUTINHO V., MOREIRA A.C., SILVA P.M. The driving forces of change in energy-related CO2, emissions in Eastern, Western, Northern and Southern Europe: The LMDI approach to decomposition analysis, Renewable & Sustainable Energy Reviews, 50, 1485, 2015.
11. NETO A.B.F., PEROBELLI F.S., BASTOS S.Q. A. Comparing energy use structures: An input-output decom-position analysis of large economies, Energy Economics, 43 (2), 102, 2014.
12. HOEKSTRA R., JEROEN C J.M., VAN DEN BERGH. Comparing structural decomposition analysis and index, Energy economics, 25 (1), 39, 2003.
13. SU B., ANG B.W. Structural decomposition analysis applied to energy and emissions: some methodological developments, Energy Economics, 34, 177, 2012.
14. CHANG N., LAHR M.L. Changes in China’s production-source CO2 emissions: insights from structural decomposition analysis and linkage analysis, Economic Systems Research, 28, 1, 2016.
15. ANG B.W., WANG H. Index decomposition analysis with multidimensional and multilevel energy data, Energy Economics, 51, 67, 2015.
16. LIN B., DU K. Decomposing energy intensity change: A combination of index decomposition analysis and production-theoretical decomposition analysis, Applied Energy, 129, 158, 2014.
17. HOEKSTRA R., JEROEN C.J.M., VAN DEN BERGH. Structural decomposition analysis of physical flows in the economy, Environmental and resource economics, 23 (3), 357, 2002.
18. WU Y., ZHANG W. The driving factors behind coal demand in China from 1997 to 2012: An empirical study of input-output structural decomposition analysis, Energy Policy, 95, 126, 2016.
19. ANG B.W., ZHANG F.Q. A survey of index decomposition analysis in energy and environmental studies, Energy, 25 (12), 1149, 2000.
20. HAMMOND G.P., NORMAN J.B. Decomposition analysis of energy-related carbon emissions from UK manufacturing, Energy, 41 (1), 220, 2012.
21. FARHANI S., CHAIBI A., RAULT C. CO2 emissions, output, energy consumption, and trade in Tunisia. Economic Modelling, 38 (38), 426, 2014.
22. GOVINDARAJU V.G.R.C., TANG C.F. The dynamic links between CO2 emissions, economic growth and coal
2418 Zhou J., et al.
consumption in China and India, Applied Energy, 104 (2), 310, 2013.
23. ZHANG Y.J., DA Y.B. The decomposition of energy-related carbon emissions and its decoupling with economic growth in China, Renewable & Sustainable Energy Reviews, 41, 1255, 2015.
24. OECD. Indicators to measure decoupling of environmental pressure from economic growth, Paris: OECD, 2002.
25. WANG YANGHONG, LUO JI. Electric energy structure, electric power emissions and economic growth: An empirical study based on decoupling, Science and Technology Management Research, 19, 211, 2013.
26. TAPIO P. Towards a theory of decoupling: degrees of decoupling in the EU and the case of road traffic in Finland between 1970 and 2001, Transport Policy, 12 (2), 137, 2005.
27. WANG HONG. Decoupling measure between economic growth and energy consumption of China, Energy Procedia, 24 (9), 23, 2010.
28. WU YONGHUA, XU LI, ZHU TONGBIN. Decoupling research on resource-environment change from electricity growth, Science and Technology Management Research, 4, 78, 2012.
29. MALLA S. CO2 emissions from electricity generation in seven Asia-Pacific and North American countries: a decomposition analysis. Energy Policy, 37 (1), 1, 2009.
30. ZHANG M., LIU X., WANG W., ZHOU M. Decomposition analysis of CO2 emissions from electricity generation in China. Energy Policy, 52 (52), 159, 2013.
31. HOU JIANCHAO, SHI DAN. Driving factors for the evolution of carbon dioxide emissions from electricity sector in China, China Industrial Economics, 6, 44, 2014.
32. LI HONG, YA KUN. The study on relationship between industrial carbon emission and the development of economy, Macroeconomics, 11, 46, 2012.
33. ANG B.W. Decomposition analysis for policy making in energy: which is the preferred method? Energy Policy, 32 (9), 1131, 2004.
34. ANG B.W., CHOI K. Decomposition of aggregate energy and gas emission intensities for industry: A refined divisia index method, Energy Journal, 18 (3), 59, 1997.
35. PENG JIAWEN, HUANG XIANJIN, ZHONG TAIYANG, ZHAO SHATAI. Decoupling analysis of economic growth and energy carbon emissions in China, Resources Science, 33 (4), 626, 2011.
36. DIAKOULAKI D., MANDARAKA M. Decomposition analysis for assessing the progress in decoupling industrial growth from CO2 emissions in the EU manufacturing sector, Energy Economics, 29 (4), 636, 2007.
37. XU HONGXING, XIAO XU, XU SONGTAO. An analysis of carbon dioxide emissions by Chinese industries based on LMDI method, Journal of Central South University, 4, 31, 2014.