a geospatial cyberinfrastructure for urban economic · pdf filea geospatial...
TRANSCRIPT
ISPRS Int. J. Geo-Inf. 2013, 2, 413-431; doi:10.3390/ijgi2020413
ISPRS International
Journal of
Geo-Information ISSN 2220-9964
www.mdpi.com/journal/ijgi/
Article
A Geospatial Cyberinfrastructure for Urban Economic Analysis
and Spatial Decision-Making
Wenwen Li 1,
*, Linna Li 2, Michael F. Goodchild
2 and Luc Anselin
1
1 GeoDa Center for Geospatial Analysis and Computation, School of Geographical Sciences and
Urban Planning, Arizona State University, Tempe, AZ 85287, USA; E-Mail: [email protected] 2
Center for Spatial Studies, Department of Geography, University of California, Santa Barbara,
CA 93106, USA; E-Mails: [email protected] (L.L.); [email protected] (M.F.G.)
* Author to whom correspondence should be addressed; E-Mail: [email protected];
Tel.: +1-480-727-5987; Fax: +1-480-965-8313.
Received: 1 March 2013; in revised form: 26 April 2013 / Accepted: 8 May 2013 /
Published: 21 May 2013
Abstract: Urban economic modeling and effective spatial planning are critical tools towards
achieving urban sustainability. However, in practice, many technical obstacles, such as
information islands, poor documentation of data and lack of software platforms to facilitate
virtual collaboration, are challenging the effectiveness of decision-making processes. In
this paper, we report on our efforts to design and develop a geospatial cyberinfrastructure
(GCI) for urban economic analysis and simulation. This GCI provides an operational
graphic user interface, built upon a service-oriented architecture to allow (1) widespread
sharing and seamless integration of distributed geospatial data; (2) an effective way to
address the uncertainty and positional errors encountered in fusing data from diverse
sources; (3) the decomposition of complex planning questions into atomic spatial analysis
tasks and the generation of a web service chain to tackle such complex problems; and
(4) capturing and representing provenance of geospatial data to trace its flow in the
modeling task. The Greater Los Angeles Region serves as the test bed. We expect this
work to contribute to effective spatial policy analysis and decision-making through the
adoption of advanced GCI and to broaden the application coverage of GCI to include urban
economic simulations.
OPEN ACCESS

ISPRS Int. J. Geo-Inf. 2013, 2 414
Keywords: cyberinfrastructure; conflation; OGC; WPS; WMS; WFS; provenance;
spatial decision support (SDS); service chaining; urban economic simulation
1. Introduction
Urban areas, as characterized by very high population density and vast human activities, are where
over 50% of the world’s population lives and where over 75% of the world’s energy is used [1]. This
proportion is only expected to continue increasing as the 21st Century continues. The rapid growth of
population in urban areas raises serious concerns about whether this growth can be sustained without
severely compromising quality of life. One determining factor is how well policy issues are addressed
with quality economic analysis to support practical policy formulation. Providing specific and useful
answers to policy questions requires complex analysis, since environment, energy, land use, housing
and transit infrastructure are not isolated economic subsystems, but instead interact with feedbacks.
Modeling the interactions between and within these subsystems is necessary in order to understand
how specific policies and plans work. For example, when a policy bearing on the transit system is
studied using a transportation model in isolation, it may show well-defined impacts, but when all
subsystems, such as land use, environment, housing and regional economy, are considered together, a
more accurate and complete picture of benefits and costs will emerge.
In practice, urban planning and policy-making have become increasingly complex, due to the
dynamics raised through the urbanization process [2,3], asymmetric development in spatial planning [4]
and the rise of big urban data [5]. Meanwhile, many technical obstacles have been challenging the
effectiveness in the decision-making process. First, different types of geospatial resources are scattered
across government agencies, public and private sectors. There is limited coordination and inadequate
timely adoption of advanced technologies to share these resources, leading to the problem of an
―information island‖ [6]. Second, the available data are poorly documented, making it difficult if not
infeasible for researchers to understand their lineage and content and to make sound judgment about
their applicability for a specific problem. Third, the data are typically produced using local standards
with respect to format, metadata structure, etc., resulting in a high degree of heterogeneity and, thus,
hampering the goal of achieving geospatial interoperability [7]. Fourth, failures in open collaboration
lead to duplicate efforts in the development of software to analyze and process geospatial data.
Geospatial cyberinfrastructure (GCI), which integrates computer hardware, software, communication
networks, data and human resources into a seamless whole, provides a software platform to allow
complex system modeling and the integration of distributed scientific data [8,9]. The GCI represents a
movement away from the stand-alone desktop paradigm to a virtual web service-based framework in
which computation is carried out in the cloud rather than tied to a specific terminal computer [10]. The
implementation of a GCI focuses on improving interoperability of distributed geospatial resources [11].
It promotes widespread sharing of geospatial data and analytical functionalities based upon a
service-oriented architecture [12] and empowers data-driven scientific analysis in an open and
collaborative fashion [13]. In this vein, the GCI provides a promising solution framework to address
several technical challenges encountered in the domain of urban economic modeling.

ISPRS Int. J. Geo-Inf. 2013, 2 415
In this paper, we report our findings based on our efforts to design and develop an urban GCI for
effective policy analysis and decision-making. We found that moving spatial analytical tools to
cyberspace and providing adequate provenance information greatly facilitates the collaborative
decision-making process. This GCI is built upon a service-oriented architecture that allows (1) widespread
sharing and seamless integration of distributed geospatial data; (2) an effective way to address the
uncertainty and positioning errors introduced by fusing data from diverse sources; (3) the decomposition
of complex planning questions into atomic spatial analysis tasks and the generation of a web service
chain to tackle such complex problems; and (4) capturing and representing provenance of geospatial
data to trace its flow in the modeling task. The Greater Los Angeles Region (LA County, Ventura
County, San Bernardino County, Riverside County, Imperial County and Orange County), which is
one of the most populous regions in the US, serves as our study area.
The rest of the paper is organized as follows: Section 2 describes a planning use case that requires
advanced cyber-technologies to address challenges in effective decision-making. Section 3 reviews
related work in the literature. Section 4 proposes three advanced techniques, including optimized
conflation of multi-source data, composition of geoprocessing services to tackle complex spatial
analysis tasks and data provenance to trace the flow of data through processing. Section 5 introduces
the software architecture and the graphic user interface of the urban GCI, and Section 6 concludes the
paper and discusses further research directions.
2. Planning Use Case
Rapid population growth in a region, such as the greater Los Angeles region, our study area, creates
pressures on the economy, environment and transportation systems, among other factors. Urban
planners are tasked to manage this growth and take into account multiple objectives and constraints in
developing future plans. For example, when an urban planner needs to make decisions on which
parcels are suitable for development, a set of environmental and infrastructural constraints must be
taken into consideration. For instance, there should be no construction on the 50-year flood zones of
high-risk. Figure 1 shows an overlay of the distribution of vacant land parcels and flood zone data in
Riverside County, a subset of the study area. To support spatial analysis and practical decision-making,
a number of Geographic Information System (GIS) operations need to be conducted in sequence:
(1) subset the parcel database to retrieve all parcels in the study area; (2) filter out parcels that are not
vacant; (3) retrieve flood zone data covering the study area; and (4) overlay vacant parcel data with the
flood zone data to generate a map of potential development sites. When accessibility factors, such as
the distance between a parcel and its nearest highway entrance, are considered, more comprehensive
network-based analysis is needed, such as (1) data preprocessing to conflate GIS data from disparate
sources to ensure high accuracy and (2) shortest path identification from potential residential housing
sites to highway entrances. Land use and transportation planners need such information to make
comprehensive plans to meet the goal of sustainable development. Three key research questions arise
in cyber-enabling such a system: (1) How to implement information integration from multiple sources
at the actual data level? (2) How to implement seamless interoperation among heterogeneous datasets
and develop a standard interface to data and analytical tools? (3) How to provide effective provenance
to trace the origin of data and its movement among databases?

ISPRS Int. J. Geo-Inf. 2013, 2 416
Figure 1. Distribution of vacant land and high-risk flood zones of Riverside County in the
greater LA region.
3. Literature
Since its emergence in the late 1990s, cyberinfrastructure has increasingly played a role in advancing
a number of fields, such as particle physics, system biology and GIS [14]. In this respect, four major
aspects of the cyberinfrastructure (CI) are important: providing access to data, integrating disparate
data sources, service chaining and provenance. We briefly review each in turn.
A growing body of research literature exists concerning data sharing [15] and the establishment of
geoportals [16–18]. However, in practice, much work is still needed to improve the technical design
and long-term viability of a geoportal implementation [19]. Some recent examples of ongoing efforts
include the National Carbon Sequestration Database and Geographic Information System (NATCARB),
the first national cyberinfrastructure for carbon capture and storage (CCS). The NATCARB portal
provides an online tool to visualize disparate data and perform web-based analysis, such as pipeline
measurement, cost estimation, etc., on carbon sequestration. A related example pertains to the Arctic
research community, where efforts have been made to efficiently discover, integrate and visualize
relevant data and web services in order to facilitate Arctic environmental research [20]. In addition,
geolibraries, such as the Alexandria Digital Library (http://www.alexandria.ucsb.edu/), were established
to provide distributed library services for georeferenced data [21].
One of the functionalities of CI-enabled geoportals is to find and integrate disparate geographic
data. However, this is still limited in that the focus is on providing simple access to different data
sources or to visual overlay of different layers. The data themselves are not conflated into a consistent
data structure. Therefore, heterogeneous geographic data cannot be used directly for further analysis,
because the same location in different sources may correspond to different locations on the Earth’s
surface. Conflation, a technique that deals with resolving discrepancies between different sources, is a
solution to this problem [22,23]. The most challenging task in data conflation is feature matching,
which relies on a similarity measurement to decide the correspondence between two features. Various
similarity metrics have been developed, based on geometry, attribute and topology [22,24,25]. After a

ISPRS Int. J. Geo-Inf. 2013, 2 417
similarity measurement is defined, most methods use a greedy strategy to find matched pairs of
geographic features in a sequential manner. One major problem with this strategy is that a matching
mistake in a previous step leads to more errors in later stages. The conflation method we use for data
integration in this urban GCI adopts an optimization method [26] that overcomes the shortcomings of
the greedy strategy by taking into consideration the total similarity of all corresponding pairs
simultaneously, thus resulting in a higher percentage of correct matches and a general improvement of
data quality.
Once the data quality is ensured, geoportals tend to rely on Web Map Service (WMS), the most
widely used OGC (Open Geospatial Consortium) protocol [27–30]. However, WMS lacks the capability
to query individual geographic features and to perform spatial analysis and, therefore, is not suitable
for carrying intermediate results throughout a web service chain. Alameh [31] conducted a pilot study
to discuss the possibility of chaining OGC web services and reviewed a number of communication
protocols (Web Service Description Language WSDL; Universal Description, Discovery and Integration
UDDI; Simple Object Access Protocol SOAP, etc.) that could be adopted to facilitate the execution of
web services. Yue et al. [32] proposed a conceptual model for composite geospatial analytical services
by extending ebRIM (ebXML Registry Information Model). However, no implementation details were
revealed. As a backend support to our GCI, the OGC Web Feature Service (WFS) and OGC Web
Processing Service (WPS) are enabled for interaction with individual features and decomposition of a
complex spatial task into subprocesses using service chaining [20].
Another component that is missing in existing geoportals is provenance. Provenance, also known as
lineage, records the origins of data and procedures performed on the data as they are shared and
analyzed. In the 1990s, a conceptual design of GIS with the capability to record provenance
was proposed to document data sources, data transformations and intermediate and final data
products [33]. Since then, a number of methods to capture provenance have been proposed in the
geospatial domain [34–39], but little research has been done in the context of a service-oriented
environment. In contrast to the desktop environment, a service-oriented architecture combines
distributed data and loosely coupled web services to conduct scientific study or to provide decision
support [32,40]. Our GCI portal for urban economic analysis and simulation presents a way to generate
standardized provenance information based on W3C PROV.
4. Methodology
4.1. Conflation
Accurate data are a foundation for the urban GCI. First, the urban GCI serves as a data portal for
browsing and downloading data that are relevant for regional economic analysis and decision-making.
Usually, such a process requires separate data for different aspects of the study area, such as land use
and transportation. Different geographic data layers are overlaid based on spatial location, so good
spatial accuracy is desirable. Second, adequate attribute data are required for spatial analysis and
policy-making. The central model of this GCI is a regional economy, land use and transportation
model, which requires land use data, transportation data, trip data, and so on, as input. No single source
satisfies our data needs. For example, land use data and trip data are provided by the Southern

ISPRS Int. J. Geo-Inf. 2013, 2 418
California Association of Governments (SCAG) and US Department of Transportation, respectively.
Even for the same themes, such as road networks, one single data source does not meet both spatial
and attribute quality standards. High spatial accuracy is critical for integrating road networks with
other data layers. On the other hand, attributes of road networks, including speed limit and road
category, are required to run the model. Since required information is not provided by a single data
source, we integrated road networks from two data sources using geographic data conflation.
Geographic data conflation is a process of integrating data from multiple sources in order to
generate a new dataset with improved spatial and attribute accuracies. There are two major components
in geographic data conflation: feature matching and feature transformation [23]. Feature matching
refers to the process of finding two features in different datasets that represent the same entity in
reality. The criterion for determination of two corresponding geographic features is usually a similarity
measurement that characterizes the important aspects of a feature, such as location, geometry, topology
and attribute information. After two features are matched, the resultant feature in a conflated dataset
can be generated by transforming the two original datasets, such as through integration of relevant
attributes and adjustment of spatial locations.
In our use case, we need both high spatial accuracy and adequate attributes for roads. Two data
sources of road networks were used: road networks provided by SCAG and the TIGER (Topologically
Integrated Geographic Encoding and Referencing) files provided by the US Census Bureau. Data from
SCAG contain many valuable attributes, including speed limit and road capacity, while the TIGER
data have minor roads that are not available in the SCAG data and have better spatial accuracy. As
shown in Figure 2, the geographic location and shape are better aligned with the true location of the
feature in the TIGER map. In addition, some minor roads represented in the TIGER file are not
represented in the SCAG data. The two datasets were conflated to provide a more complete and
accurate representation of the road networks in the study area.
Figure 2. The discrepancy between Southern California Association of Governments
(SCAG) data (red) and Topologically Integrated Geographic Encoding and Referencing
(TIGER) data (blue).
ISPRS Int. J. Geo-Inf. 2013, 2 419
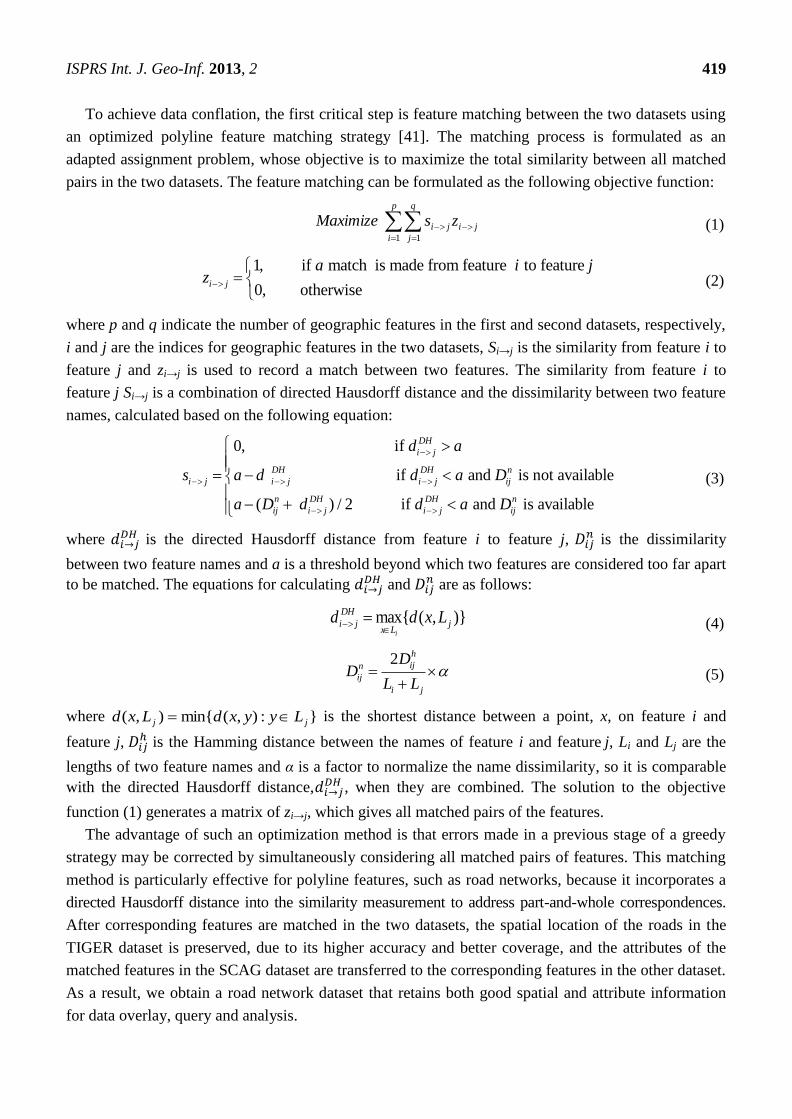
To achieve data conflation, the first critical step is feature matching between the two datasets using
an optimized polyline feature matching strategy [41]. The matching process is formulated as an
adapted assignment problem, whose objective is to maximize the total similarity between all matched
pairs in the two datasets. The feature matching can be formulated as the following objective function:
p
i
q
j
jiji zs Maximize1 1
(1)
1, if match is made from feature to feature
0, otherwisei j
a i jz
(2)
where p and q indicate the number of geographic features in the first and second datasets, respectively,
i and j are the indices for geographic features in the two datasets, Si→j is the similarity from feature i to
feature j and zi→j is used to record a match between two features. The similarity from feature i to
feature j Si→j is a combination of directed Hausdorff distance and the dissimilarity between two feature
names, calculated based on the following equation:
0, if
if and is not available
( ) / 2 if and is available
DH
i j
DH DH n
i j i j i j ij
n DH DH n
ij i j i j ij
d a
s a d d a D
a D d d a D
(3)
where is the directed Hausdorff distance from feature i to feature j,
is the dissimilarity
between two feature names and a is a threshold beyond which two features are considered too far apart
to be matched. The equations for calculating and
are as follows:
)},({max jLx
DH
ji Lxddi
(4)
2 h
ijn
ij
i j
DD
L L
(5)
where }:),(min{),( jj LyyxdLxd is the shortest distance between a point, x, on feature i and
feature j, is the Hamming distance between the names of feature i and feature j, Li and Lj are the
lengths of two feature names and α is a factor to normalize the name dissimilarity, so it is comparable
with the directed Hausdorff distance, , when they are combined. The solution to the objective
function (1) generates a matrix of zi→j, which gives all matched pairs of the features.
The advantage of such an optimization method is that errors made in a previous stage of a greedy
strategy may be corrected by simultaneously considering all matched pairs of features. This matching
method is particularly effective for polyline features, such as road networks, because it incorporates a
directed Hausdorff distance into the similarity measurement to address part-and-whole correspondences.
After corresponding features are matched in the two datasets, the spatial location of the roads in the
TIGER dataset is preserved, due to its higher accuracy and better coverage, and the attributes of the
matched features in the SCAG dataset are transferred to the corresponding features in the other dataset.
As a result, we obtain a road network dataset that retains both good spatial and attribute information
for data overlay, query and analysis.

ISPRS Int. J. Geo-Inf. 2013, 2 420
4.2. Service Chain of Geospatial Processes in the Service-Oriented GCI
Conflation ensures the quality of GIS data used for modeling the land use, transportation and
housing for regional economic analysis in the study area. The next question is how to openly share
these heterogeneous resources across the geographically distributed team, how to assure a smooth flow
of data in the application of complex spatial analysis procedures and how to automate this process in
such a way that policy makers with limited GIS expertise can freely execute different scenarios and get
timely answers in an intuitive manner.
The Open Geospatial Consortium (OGC), which aims to develop community-consensus open
geospatial standards, provides a family of enabling technologies for sharing geospatial data and
analytical capabilities on a distributed network. To support sharing of geospatial data hosted in the
urban GCI, two types of data services are developed, Web Map Services (WMS) and Web Feature
Services (WFS). WMS [42] interacts with clients through HTTP requests and returns geo-referenced
static images in the region of interest (ROI). As WMS does not return the actual data, but a map
rendered from the data, it is mainly used for visualizing results of a spatial analysis. A WFS [43] was
developed mainly for the purpose of exchanging actual feature data rather than visual display. The raw
GIS shapefiles are encoded into an intermediate format GML (Geographic Markup Language) [44]—a
geo-enhanced version of XML (eXtensive Markup Language). A WFS (version 1.1.0) defines up to
twelve operations, of which the most commonly used are ―GetCapabilities‖, ―DescribeFeatureType‖
and ―GetFeature‖. ―GetCapabilities‖ generates a metadata document describing the WFS, as well
as supported WFS operations. ―DescribeFeatureType‖ returns a description of feature types (Point,
Polyline or Polygon) supported by a WFS service. ―GetFeature‖ returns the actual data encoded in
GML for heterogeneous data interoperation from multiple sources.
In addition to data services, the urban GCI also implements a Web Processing Service (WPS), in
order to facilitate sharing, discovery and dynamic binding of geospatial processes. The concept of
WPS realizes a paradigm shift from service providing data, such as the aforementioned WMS and
WFS, to service providing information [45,46]. Therefore, it fits the goal of generic CI in maximizing
the reuse of existing analytical tools, as well as the goal of our urban GCI to tackle complex policy
questions into chained workflows of geospatial operations. A WPS supports three standardized web
requests: ―GetCapabilities‖, ―DescribeProcess‖ and ―Execute‖. ―GetCapabilities‖ returns the metadata
that describe a processing service, including the service provider and online geoprocesses it supports.
Once a geoprocess of interest is identified, the ―DescribeProcess‖ can be invoked to get the definitions
of a geoprocess. These definitions include functional descriptions about the process, input/output and
supported data formats for input/output. Once the input data are organized into desired formats, a
GET/POST ―Execute‖ request can be sent to the GCI portal’s WPS server. An important feature of our
WPS implementation is its ability to support subprocesses, in the sense that the input of one WPS
process can come from the output of another WPS process. This feature enables service chaining for
tackling complex processes by carrying out a sequence of subprocesses. In our WPS implementation,
WFS/GML is used to transfer data between different processing services.
Following the scenario given in Figure 1, our GCI portal gets a request to estimate the total
developable land area for Riverside County’s planning department. First, the ―developable land area‖
must be defined. A developable area should satisfy two constraints: its land use type is vacant and the

ISPRS Int. J. Geo-Inf. 2013, 2 421
land is not within an area with a 2% annual chance of flooding and additional hazards associated with
storm waves. Land use classifications (residential, industrial, commercial, vacant, etc.) are recorded in
the SCAG parcel database, and the parcel data are hosted as a WFS in our urban GCI portal. The
raw flood zone data in Esri shapefile format can be retrieved from FEMA (Federal Emergency
Management Agency) and are published as WFS. In order to obtain all vacant land parcels, a ―Filter‖
operation, which extracts parcel records by its land use type ―vacant‖ needs to be performed on top of
the WFS ―GetFeature‖ request. Figure 3 demonstrates the example request in XML. The 50-year flood
plain data for Riverside County can be obtained in a similar fashion. The resulting dataset is encoded
in GML for multi-source data interoperation.
Figure 3. A sample Web Feature Service (WFS) ―GetFeature‖ request to subset SCAG
parcel dataset to obtain all records of vacant land in Riverside County. The first filter
condition ―PropertyIsEqualTo‖ returns all parcel polygons with land use type vacant (land
use code is: ―3000‖ and field name is: ―LU08‖). The second filter condition returns parcel
polygons belonging to Riverside County only.
Once the datasets are prepared and made interoperable through WFS/GML, a nested processing
service is orchestrated to tackle the given problem. Figure 4 shows a complete chart of data flows
through multiple processing services in sequence. Briefly, in order to calculate the total developable
area, the WPS process ―GetGeometryArea‖ is needed. This process takes a projected polygon as input
and returns the polygon area in numerical value (the same unit as the input data). Therefore, the
developable parcel polygons generated from previous steps must be consolidated into a multi-part
polygon. To fit the right type of data into the ―GetGeometryArea‖ process, a subprocess
―CollectGeometryFeatures‖, (a WPS), is launched to take in data representing multiple developable
parcels and output one multi-part polygon. As discussed earlier, the developable parcels are the parcels
that are vacant and not within the high-risk flood zones. This dataset is generated by taking the spatial
differences of geometries that are in Set 1 (the vacant parcels) and Set 2 (the floodplain zones) by a
<wfs:GetFeature xmlns:xsi="http://www.w3.org/2001/XMLSchema-instance"
xsi:schemaLocation="http://www.opengis.net/wfs
http://localhost:9090/geoserver/schemas/wfs/1.0.0/WFS-basic.xsd"
xmlns:gml="http://www.opengis.net/gml" xmlns:wfs="http://www.opengis.net/wfs"
xmlns:ogc="http://www.opengis.net/ogc" service="WFS" version="1.0.0"
outputFormat="text/xml; subtype=gml/3.2">
<wfs:Query typeName="mrpi:SCAGparcel"
xmlns:mrpi="http://localhost/ows/featuretype">
<ogc:Filter xmlns="http://www.opengis.net/ogc">
<ogc:PropertyIsEqualTo>
<ogc:PropertyName>LU08</ogc:PropertyName>
<ogc:Literal>3000</ogc:Literal>
</ogc:PropertyIsEqualTo>
<ogc:PropertyIsEqualTo>
<ogc:PropertyName>County</ogc:PropertyName>
<ogc:Literal>Riverside</ogc:Literal>
</ogc:PropertyIsEqualTo>
</ogc:Filter>
</wfs:Query>
</wfs:GetFeature>

ISPRS Int. J. Geo-Inf. 2013, 2 422
processing service called ―Difference‖. Both sets of data are encoded in GML and are subsets of
original raw data from two heterogeneous sources: SCAG parcel database and FEMA Esri shapefile.
Figure 5 shows the XML-encoded WPS request that implements the entire chain of data/processing
services illustrated in Figure 4. The desired response gives an answer for the total developable area in
Riverside County as 334.97 square miles.
Figure 4. Workflow chart of chained geoprocessing.
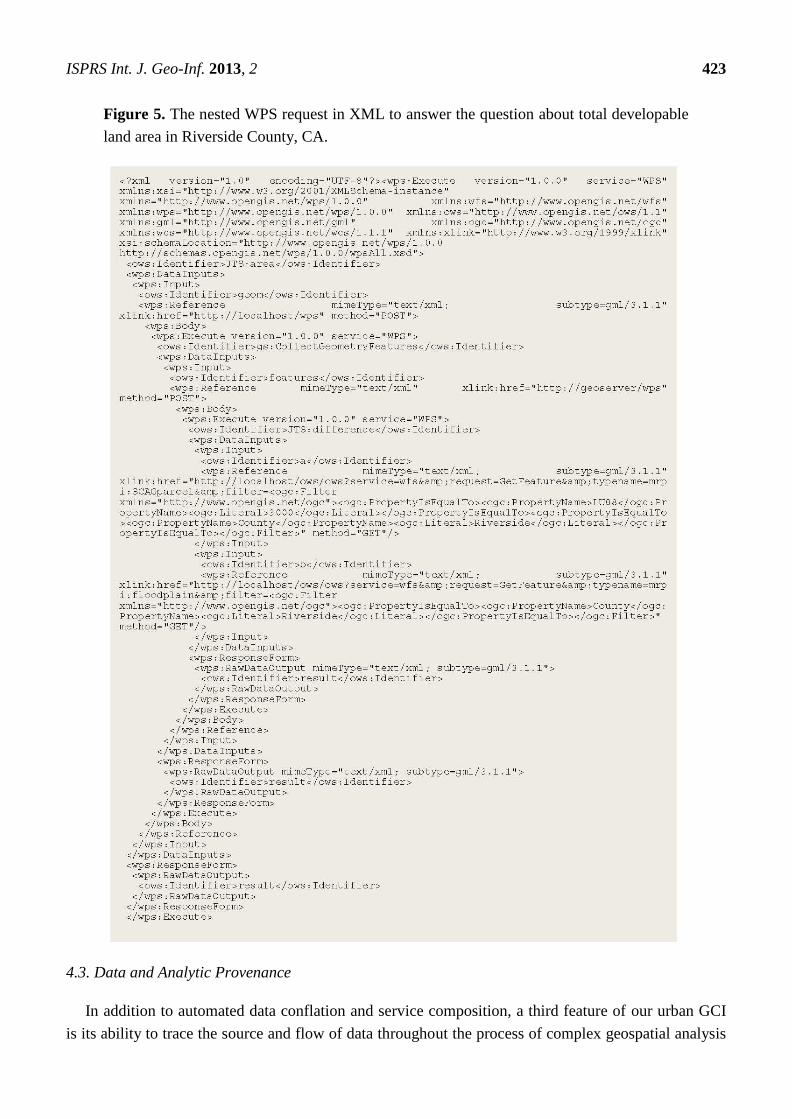
ISPRS Int. J. Geo-Inf. 2013, 2 423
Figure 5. The nested WPS request in XML to answer the question about total developable
land area in Riverside County, CA.
4.3. Data and Analytic Provenance
In addition to automated data conflation and service composition, a third feature of our urban GCI
is its ability to trace the source and flow of data throughout the process of complex geospatial analysis

ISPRS Int. J. Geo-Inf. 2013, 2 424
until it enters the database. This information is also called provenance data/information. The provenance
information is of great importance for a distributed team to gain (1) a common understanding of the content
of data and how the data can be used; (2) an assessment of datasets to decide if they meet the requirements
(on data quality, accuracy, timeliness, etc.) for specific applications; (3) a way to acknowledge the producer
of the data; and (4) replicability of a dataset. Figure 6 demonstrates the conceptual provenance model built
upon W3C PROV (http://www.w3.org/TR/2011/WD-prov-dm-20111018/). Five main classes (Activity,
Entity, Agent, Time and Location) are defined. All of these classes are inherited from a superclass
―Thing‖. ―Activity‖ refers to the procedure followed to generate a dataset. ―Subset‖, ―Difference‖,
―CollectGeomtryFeatures‖ and ―Area‖, described in Figure 4, are objects of ―Activity‖. An ―Entity‖, in
general, can be viewed as a type of ―Thing‖ with some fixed aspects. This could be a physical entity
(such as a hard drive), a digital entity (a dataset) or a conceptual element (such as the model
demonstrated in Figure 6). By definition, an entity may be real or imagery, but in the context of our
work, an entity refers mainly to a digital object, such as a dataset, a document or a software tool.
―Agent‖ is responsible for an activity to take place, for an entity to be generated or for another agent’s
activity. An agent could be an organization (such as SCAG), a person or a software agent. Two
additional nodes ―Time‖ and ―Location‖ are also included in this model to define the spatiotemporal
dimensions of provenance information.
Figure 6. Conceptual model of W3C provenance ontology.
The interrelationship (arrows in Figure 6) among ―Activity‖, ―Agent‖ and ―Entity‖ indicate that an
activity uses one or more entities to generate a new entity or update an existing entity. One activity can
be informed or invoked by another activity, such as calling a subprocess WPS in the main WPS thread.
An activity is associated with an agent or an organization. The agent can conduct an activity on behalf
of another agent. An activity instance is directly associated with a ―Time‖ node, which defines the start
and end time of this activity. This could also describe the time when an entity is generated. Each entity
belongs to an agent, which is responsible for performing an activity. Each of the three classes can be
associated with node ―Location‖, indicating where an agent is physically located, where an entity is
stored or where an activity takes place.
ISPRS Int. J. Geo-Inf. 2013, 2 425
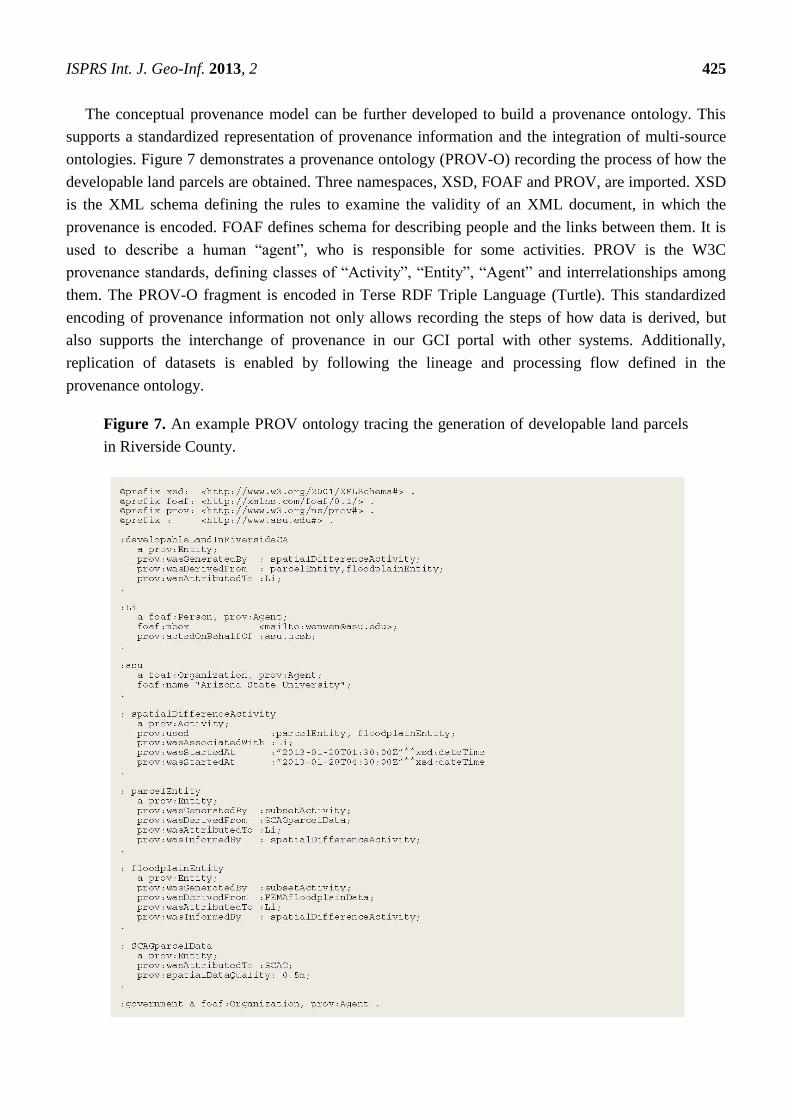
The conceptual provenance model can be further developed to build a provenance ontology. This
supports a standardized representation of provenance information and the integration of multi-source
ontologies. Figure 7 demonstrates a provenance ontology (PROV-O) recording the process of how the
developable land parcels are obtained. Three namespaces, XSD, FOAF and PROV, are imported. XSD
is the XML schema defining the rules to examine the validity of an XML document, in which the
provenance is encoded. FOAF defines schema for describing people and the links between them. It is
used to describe a human ―agent‖, who is responsible for some activities. PROV is the W3C
provenance standards, defining classes of ―Activity‖, ―Entity‖, ―Agent‖ and interrelationships among
them. The PROV-O fragment is encoded in Terse RDF Triple Language (Turtle). This standardized
encoding of provenance information not only allows recording the steps of how data is derived, but
also supports the interchange of provenance in our GCI portal with other systems. Additionally,
replication of datasets is enabled by following the lineage and processing flow defined in the
provenance ontology.
Figure 7. An example PROV ontology tracing the generation of developable land parcels
in Riverside County.

ISPRS Int. J. Geo-Inf. 2013, 2 426
5. System Architecture of Urban GCI and Prototypes
Figure 8 demonstrates the system architecture of our urban GCI portal. First, all datasets, including
road network, floor space, land use, etc., and their provenance are stored in the geospatial database
PostGreSQL (module a). They are published through an open source package Geoserver
(http://www.geoserver.org) into both OGC Web Map Services (WMS) and Web Feature Services
(WFSs) for resource integration purposes (module c). Specifically, WMSs are mainly used for client-side
visualization and interoperation of data in various formats; whereas WFSs, carrying the actual
geometries of raw data in a GML format, are used for transferring intermediate results through a
sequence of geospatial processes. These geospatial processes (module b), including buffer, intersection,
area, etc., supported by the JTS Topology Suite (http://tsusiatsoftware.net/jts/main.html) are published
into standard OGC Web Processing Services (WPSs) to facilitate service composition and chaining.
All web services are registered into a service registry (module d) to make them discoverable and
reusable by other researchers. The service registry is implemented as an OGC Web Catalogue Service
(CSW) and the registration process contains two steps: parsing service metadata (module e) and
insertion of these metadata into a back-end service database (module f). These components are the
back-end settings of our GCI portal. In the front end, a web application server (module g) is deployed
to communicate with the service database, pull out data and processing services as requested from a
user and display them visually through the web map client (module h).
Figure 8. Service-oriented system architecture for the GCI portal. Items in blue show the
protocols or standard interfaces for communications between different modules.
Figure 9 demonstrates the GUI (graphic user interface) of this urban GCI. The panel on the
left-hand side lists available datasets organized in a hierarchical tree. Five categories of data are
currently available: abstracted road networks, transportation, physical barriers, model zones and
boundaries. By checking layers of interest, these data can be overlaid and displayed in the map panel.
The map legend for each visible layer is displayed below the data layers. The base map of this user
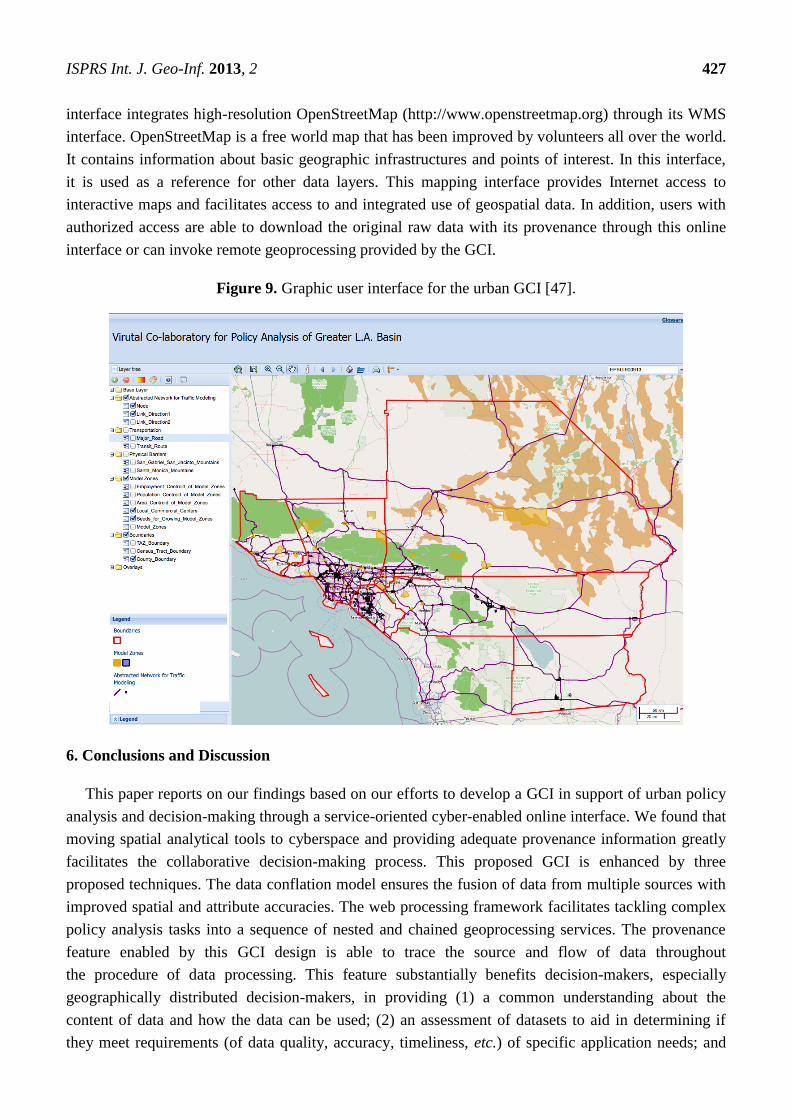
ISPRS Int. J. Geo-Inf. 2013, 2 427
interface integrates high-resolution OpenStreetMap (http://www.openstreetmap.org) through its WMS
interface. OpenStreetMap is a free world map that has been improved by volunteers all over the world.
It contains information about basic geographic infrastructures and points of interest. In this interface,
it is used as a reference for other data layers. This mapping interface provides Internet access to
interactive maps and facilitates access to and integrated use of geospatial data. In addition, users with
authorized access are able to download the original raw data with its provenance through this online
interface or can invoke remote geoprocessing provided by the GCI.
Figure 9. Graphic user interface for the urban GCI [47].
6. Conclusions and Discussion
This paper reports on our findings based on our efforts to develop a GCI in support of urban policy
analysis and decision-making through a service-oriented cyber-enabled online interface. We found that
moving spatial analytical tools to cyberspace and providing adequate provenance information greatly
facilitates the collaborative decision-making process. This proposed GCI is enhanced by three
proposed techniques. The data conflation model ensures the fusion of data from multiple sources with
improved spatial and attribute accuracies. The web processing framework facilitates tackling complex
policy analysis tasks into a sequence of nested and chained geoprocessing services. The provenance
feature enabled by this GCI design is able to trace the source and flow of data throughout
the procedure of data processing. This feature substantially benefits decision-makers, especially
geographically distributed decision-makers, in providing (1) a common understanding about the
content of data and how the data can be used; (2) an assessment of datasets to aid in determining if
they meet requirements (of data quality, accuracy, timeliness, etc.) of specific application needs; and
ISPRS Int. J. Geo-Inf. 2013, 2 428
(3) replicability of datasets. We consider this work to be a pilot study of moving the urban economic
simulation into an open web-based environment by resolving technical obstacles in information islands
and dissymmetry of policy decisions through this open, interoperable and web-accessible platform.
We expect a further adoption of GCI in terms of automated workflow composition and execution to
contribute to effective spatial policy analysis and decision-making, as well as broaden the application
coverage of GCI into urban economic simulations.
This project is still ongoing and our next step is to enable sophisticated system modeling through
the RELU-TRAN model (Regional Economy Land Use—Transformation) [48] to establish a virtual
collaborative laboratory and assess its performance in practice. This involves model validation and
calibration in the back-end and a statistical analysis feature in the front-end of our GUI. In addition, as
more data and services are being produced, we will develop a spatial search tool that utilizes advanced
semantic search technology [49–56] to allow users to quickly identify the resources in need.
Meanwhile, we will also develop an intuitive and user-friendly interface to manage the spatial
analytical workflow and intermediate results generated through it. Once this virtual collaborative
laboratory is fully established for urban studies in the LA region, we will extend our study area into
other metropolitan regions that urgently need coordinated policy analysis, such as Beijing in China, to
benefit broader communities.
Acknowledgements
This research was funded in part by the University of California Multi-campus Research Programs
and Initiatives (MRPI) and NSF OCI-1047916, SI2-SSI.
Conflict of Interest
The authors declare no conflict of interest.
References
1. Hunt, J.C.; Maslin, M.; Killeen, T.; Backlund, P.; Schellnhuber, H.J. Introduction. Climate change
and urban areas: Research dialogue in a policy framework. Phil. Trans. Roy. Soc. A-Math. Phy.
2007, 365, 2615–2629.
2. Kelly, P.F. Everyday urbanization: The social dynamics of development in Manila’s extended
metropolitan region. Int. J. Urban Reg. Res. 1999, 23, 283–303.
3. Webster, D. Urbanization Dynamics and Policy Frameworks in Developing East Asia; East Asia
Infrastructure Department Working Paper 2004; World Bank: Washington, DC, USA, 2004.
4. Davoudi, S. Asymmetric Development in Spatial Planning: Positivist Content and Post-Modernist
Processes? In Conceptions of Space and Place in Strategic Spatial Planning; Routledge: London,
UK, 2009; pp. 207–244.
5. Bollier, D.; Firestone, C.M. The Promise and Peril of Big Data; Aspen Institute, Communications
and Society Program: Washington, DC, USA, 2010; p. 56.
6. Antoniou, G.; van Harmelen, F. A Semantic Web Primer; MIT Press: Cambridge, USA, 2004;
p. 264.
ISPRS Int. J. Geo-Inf. 2013, 2 429
7. Li, W.; Yang, C.; Yang, C. An active crawler for discovering geospatial web services and their
distribution pattern—A case study of OGC Web Map Service. Int. J. Geogr. Inf. Sci. 2010, 24,
1127–1147.
8. Atkins, D.; Droegemeier, K.; Feldman, S.; Garcia-Molina, H.; Klein, M. Messerschmitt, D.;
Messina, P.; Ostriker, J.; Wright, M. Revolutionizing Science and Engineering through
Cyberinfrastructure; Report of the National Science Foundation Blue-Ribbon Advisory Panel on
Cyberinfrastructure; NSF: Washington, DC, USA, 2003. Avaiable online: http://www.nsf.gov/cise/
sci/reports/atkins.pdf (accessed on 12 May 2013).
9. Yang, C.; Raskin, R.; Goodchild, M.; Gahegan, M. Geospatial cyberinfrastructure: Past, present
and future. Comput. Environ. Urban Syst. 2010, 34, 264–277.
10. Anselin, L. From SpaceStat to CyberGIS: Twenty years of spatial data analysis software. Int. Reg.
Sci. Rev. 2012, 35, 131–157.
11. Yang, C.; Li, W.; Xie, J.; Zhou, B. Distributed geospatial information processing: Sharing
distributed geospatial resources to support Digital Earth. Int. J. Digit. Earth 2008, 1, 259–278.
12. Li, W.; Goodchild, M.F.; Anselin, L.; Weber, K. A Service-Oriented Smart CyberGIS Framework
for Data-Intensive Geospatial Problems. In CyberGIS: Fostering a New Wave of Geospatial
Discovery and Innovation; Wang, S., Goodchild, M.F., Eds.; Springer: New York, NY, USA, 2013,
in press.
13. Wright, D.J.; Wang, S. The emergence of spatial cyberinfrastructure. Proc. Nat. Acad. Sci. USA
2011, 108, 5488–5491.
14. Hey, T.; Trefethen, A.E. Cyberinfrastructure for e-science. Science 2005, 308, 817–821.
15. Goodchild, M.F.; Fu, P.; Rich, P. Sharing geographic information: An assessment of the
Geospatial One-Stop. Ann. Assn. Amer. Geogr. 2007, 97, 250–266.
16. Beaumont, P.; Longley, P.A.; Maguire, D.J. Geographic information portals—A UK perspective.
Comput. Environ. Urban Syst. 2005, 29, 49–69.
17. Maguire, D.J.; Longley, P.A. The emergence of geoportals and their role in spatial data
infrastructures. Comput. Environ. Urban Syst. 2005, 29, 3–14.
18. Li, Z.; Li, W. Spatial Web Portal and Geobrowser. In Advanced Geoinformation Science;
Yang, C., Wong, D., Miao, Q., Yang, R., Eds.; Taylor & Francis: Boca Raton, FL, USA, 2011;
pp. 234–239.
19. Carr, T.R.; Rich, P.M.; Bartley, J.D. The NATCARB geoportal: Linking distributed data from the
carbon sequestration regional partnerships. J. Map Geogr. Libr. (Geoscapes.) 2007, 4, 131–147.
20. Li, W.; Yang, C.; Nebert, D.; Raskin, R.; Houser, P.; Wu, H.; Li, Z. Semantic-based web service
discovery and chaining for building an Arctic spatial data infrastructure. Comput. Geosci. 2011,
37, 1752–1762.
21. Goodchild, M.F. The Alexandria digital library project review, assessment, and prospects. Trend.
Inf. Manage. (TRIM) 2005, 1, 20–25.
22. Saalfeld, A. Conflation automated map compilation. Int. J. Geogr. Inf. Syst. 1988, 2, 217–228.
23. Li, L. Design of a Conceptual Framework and Approaches for Geo-Object Data Conflation.
Ph.D. Thesis, University of California, Santa Barbara, CA, USA, 2010; p. 152.
24. Samal, A.; Seth, S.; Cueto, K. A feature-based approach to conflation of geospatial sources. Int. J.
Geogr. Inf. Sci. 2004, 18, 459–489.
ISPRS Int. J. Geo-Inf. 2013, 2 430
25. Beeri, C.; Kanza, Y.; Safra, E.; Sagiv, Y. Object Fusion in Geographic Information Systems.
In Proceedings of the Thirtieth International Conference on Very Large Data Bases, Toronto, ON,
Canada, 29 August–3 September 2004; Volume 30, pp. 816–827.
26. Li, L.; Goodchild, M.F. An optimisation model for linear feature matching in geographical data
conflation. Int. J. Image Data Fusion 2011, 2, 309–328.
27. Yang, P.; Li, W.; Xiao, D.; Raskin, R.; Bambacus, M. Earth information exchange: Sharing earth
science information through interoperable approach and cyber infrastructure. Proc. SPIE 2007,
6753, doi: 10.1117/12.761878.
28. Li, W.; Yang, C.; Zhou, B.; Ren, Y.; Yang, C.; Yuan, L. Design and Implementation of an
Integrated WMS Service Portal. In Proceedings of IEEE International Conference on Geoscience
and Remote Sensing Symposium 2006 (IGARSS 2006), Denver, CO, USA, 31 July–4 August
2006; pp. 924–927.
29. Sample, J.T.; Ladner, R.; Shulman, L.; Ioup, E.; Petry, F.; Warner, E.; Shaw, K.; McCreedy, F.P.
Enhancing the US Navy’s GIDB portal with web services. IEEE Internet Comput. 2006, 10,
53–60.
30. Li, Z.; Yang, C.P.; Wu, H.; Li, W.; Miao, L. An optimized framework for seamlessly integrating
OGC Web Services to support geospatial sciences. Int. J. Geogr. Inf. Sci. 2011, 25, 595–613.
31. Alameh, N. Service chaining of interoperable geographic information web services. Internet
Comput. 2002, 7, 22–29.
32. Yue, P.; Gong, J.; Di, L. Augmenting geospatial data provenance through metadata tracking in
geospatial service chaining. Comput. Geosci. 2010, 36, 270–281.
33. Lanter, D.P. Design of a lineage-based meta-data base for GIS. Cartogr. Geogr. Inform. Sci. 1991,
18, 255–261.
34. Lanter, D. GEOLINEUS: Data Management and Flowcharting for ARC/INFO; Technical
Software Series S-92–2; National Center for Geographic Information and Analysis: Santa Barbara,
CA, USA, 1992.
35. Alonso, G.; Hagen, C. Geo-Opera: Workflow Concepts for Spatial Processes. In Advances in
Spatial Databases; Springer: Berlin/Heidelberg, Germany, 1997; pp. 238–258.
36. Frew, J.; Bose, R. Earth System Science Workbench: A Data Management Infrastructure for Earth
Science Products. In Proceedings of the 13th International Conference on Scientific and Statistical
Database Management, Fairfax, VA, USA, 18–20 July 2001; pp. 180–189.
37. Frew, J.; Metzger, D.; Slaughter, P. Automatic capture and reconstruction of computational
provenance. Concurr. Comput. Pract. Exp. 2008, 20, 485–496.
38. Wang, S.; Padmanabhan, A.; Myers, J.D.; Tang, W.; Liu, Y. In Towards Provenance-Aware
Geographic Information Systems. In Proceedings of the 16th ACM SIGSPATIAL International
Conference on Advances in Geographic Information Systems, Irvine, CA, USA, 5–7 November
2008; p. 70.
39. Tilmes, C.; Fleig, A. Provenance Tracking in an Earth Science Data Processing System. In
Provenance and Annotation of Data and Processes; Springer: Berlin/Heidelberg, Germany, 2008;
pp. 221–228.
40. Simmhan, Y.L.; Plale, B.; Gannon, D. A survey of data provenance in e-science. ACM Sigmod.
Rec. 2005, 34, 31–36.
ISPRS Int. J. Geo-Inf. 2013, 2 431
41. Li, L.; Goodchild, M.F. Automatically and accurately matching objects in geospatial datasets.
Adv. Geo-Spat. Inf. Sci. 2012, 10, 71–79.
42. De La Beaujardière, J., Ed. Web Map Service Implementation Specification; Open GIS
Consortium Inc.: Washington, DC, USA, 2002; p. 82.
43. Vretanos, P.A., Ed. Web Feature Service Implementation Specification; Open GIS Consortium
Inc.: Washington, DC, USA, 2005; p. 94.
44. Cox, S.; Cuthbert, A.; Daisey, P.; Davidson, J.; Johnson, S.; Keighan, E.; Lake, R.; Mabrouk, M.;
Margoulies, S.; Martell, R. OpenGIS Geography Markup Language (GML) Implementation
Specification, Version 2.1.2; Open GIS Consortium Inc.: Washington, DC, USA, 2002.
45. Schut, P.; Whiteside, A. OpenGIS Web Processing Service; Open Geospatial Consortium:
Wayland, MA, USA, 2007.
46. Zhang, C.; Li, W. The roles of Web Feature and Web Map Services in real time geospatial data
sharing for time-critical applications. Cartogr. Geogr. Inf. Sci. 2005, 32, 269–283.
47. Virtual Co-Laboratory for Policy Analysis of Greater L.A. Basin. Available online:
http://mrpi.geog.ucsb.edu:8080/geonetwork/ (accessed on 13 May 2013).
48. Anas, A.; Liu, Y. A regional economy, land use, and transportation model (RELU-TRAN):
formulation, algorithm design and testing. J. Reg. Sci. 2007, 47, 415–455.
49. Li, W. Automated Data Discovery, Reasoning and Ranking in Support of Building an Intelligent
Geospatial Search Engine. Ph.D. Thesis, George Mason University, Fairfax, VA, USA, 2010;
p. 168.
50. Li, W.; Goodchild, M.F.; Raskin, R. Towards geospatial semantic search: Exploiting latent semantic
relations in geospatial data. Int. J. Digit. Earth 2012, doi: 10.1080/17538947.2012.674561.
51. Li, W.; Raskin, R.; Goodchild, M.F. Semantic similarity measurement based on knowledge
mining: An artificial neural net approach. Int. J. Geogr. Inf. Sci. 2012, 26, 1415–1435.
52. Li, W.; Yang, C.; Raskin, R. A Semantic Enhanced Search for Spatial Web Portals; AAAI Spring
Symposium Technical Report, SS-08–05; AAAI: Palo Alto, CA, USA, 2008; pp. 47–50.
53. Raskin, R.; Zhou, N.; Li, W. Geoinformation Knowledge Representation and Applications. In
Advanced Geoinformation Science; Taylor and Francis: Boca Raton, FL, USA, 2011; pp. 276–299.
54. Wu, H.; Li, Z.; Zhang, H.; Yang, C.; Shen, S. Monitoring and evaluating web map service
resources for optimizing map composition over the internet to support decision making. Comput.
Geosci. 2011, 37, 485–494.
55. Zhang, C.; Li, W.; Zhao, T. Geospatial data sharing based on geospatial semantic web
technologies. J. Spat. Sci. 2007, 52, 35–49.
56. Zhang, C.; Zhao, T.; Li, W. The Framework of a geospatial semantic web based spatial decision
support system for digital earth. Int. J. Digit. Earth 2010, 3, 111–134.
© 2013 by the authors; licensee MDPI, Basel, Switzerland. This article is an open access
article distributed under the terms and conditions of the Creative Commons Attribution license
(http://creativecommons.org/licenses/by/3.0/).