a gis-based approach to microclimate monitoring in ... · a gis-based apptoach to microclimate...
TRANSCRIPT

A GIS-Based Apptoach toMicroclimate Monitoring in
Singapore's High-Rise Housing EstatesJanet E. Nichol
AbstractSurface temperature data of urban areas derived from satel'lite thermal sensors arc under-utilized in planning applica-tions due to the inability to demonstrate meaningfulrelationships between the satellite-derived data and the ur-ban microclimate. The study uses GIS operations to demon-strate such relationships for high rise housing estates in atopical city where climate control is of paramount impor-tance. The procedure for emissivity correction decreased thepixel size to 30 metres and enhanced the spatial characteris-tics of vegetated areas to approximate the high spatial fre-quency of the urban environment. This gave a highcorrelation between sotellite derived surfoce temperature ondbiomass indices, as well as similarity with air temperaturedata. While noting the limitations of the data for obtainingabsolute quantitative values for ambient air temperature, thestudy suggests specific planning contexts in which image-de-rived values can be input into planning models.
lntroductionClimatic characteristics of urban areas have been examinedusing relatively low resolution thermal sensors on satellites,including the NOAA AVHRR with a spatial resolution of 1.1km (Ball ing and Brazell, L988; Roth ef o/., ls8g) and theHCMR sensor with a 0.6-km pixel size (Carlson and Boland,1978; Carlson et al., ' l .g81i Vukovitch, 1983; Henry ef o1.,1e89).
In these studies, the authors cite the coarse spatial reso-Iution of the data compared with the high spatial frequencyof urban surfaces as responsible for the inability to derive ac-curate and meaningful relationships between ground temper-atures calculated from corrected sensor radiance values andthose measured on the ground (Balling and Brazell, lgBB;Desjardins ef d1., 1.990; Roth et o1., 1989). In this context,Desjardins ef o,l. warn against using satellite derived-data,even including the much higher resolution data of LandsatThematic Mapper (thermal band, rz0 metres) for the acquisi-tion of precise ground temperatures for areas other thanthose characterized by large isotropic surfaces such as lakes,oceans, and deserts.
While Carnahan and Larson have utilized Landsat's ther-mal band to observe meso-scale temperature differences be-tween urban and rural areas in Indianapolis, no significantattempts have been made to investigate its application to mi-croclimate monitoring.
Division of Geography, Nanyang Technological University,469 Bukit Timah Road, Singapore 1025, Republic of Singa-pore.
PE&RS
Yet accurate and spatially detailed information relating tothe urban heat island would Le invaluable to the urban plan-ner. particularlv in tropical cities where human comfort issubldct to effeciive landscaping of areas where people live andwork. Because near surface climates are known to be inti-mately related to those of the active surface (Chandler' 1967;Goldr-eich. 1985; Price, 1979; Roth et al.,7g1g; Carlson andBoland, 1981), surface temperature data derived from satellitesare under-utilized in urbanplanning for the evaluation of ex-isting, and formulation of future, landscaping policies.
Effective "greening" campaigns may ameliorate the heatisland effect. This is the strategy adopted by environmentallyconscious planning authorities in Singapore since 1967 in or-der to mitigate the effects of a high rise lifestyle in thedensely populated nation state.
However, such greening campaigns are expensive andcan only be judged empirically by t!'eir direct impact on mi^-croclimite modification, for which data on spatial aspects ofthe urban heat island would be of obvious value.
0bjectivesTh-e objective of the present study is to evaluate Landsat'I'he objectrve ot tlre present stuoy rs to evaluale L
Themaiic Mapper's thermal waveband for indicati
ature differences in Sinature drtterences rn Srngapore s nlgn-nse murrrL;rPar rluusurl
estates. Bearing in mind the close relationship between sur-
Photogrammetric Engineering & Remote Sensing,Vol. 60, No. 10, October 1994, pp. 1'225-7232.
0099-LLL2 I S4 I 6070-'t'225$3. 00/0O 1994 American Society for Photogrammetry
and Remote Sensing
face temperature (Ts) and the climate near the ground, the
following specific questions are addressed:
r Can the satellite data indicate temperature differentials atmeso- and micro-scales in Singapore, as represented bytemperature differences between and within housing estates?
o Is thi spatial resolution sufficient to accurately relate these^pat-terns to individual parcels of land cover within the estates?
. Are such data suffiiiently meaningfuI for use in urban plan-ning, and can they be conveyed to planners-at a scale com-patible with city 6ase maps, i.e., at the level of the individualIand parcel?
Singaporc's EnvironmentThJ combination of high temperature and high humidity inSingapore creates a human physioclimate characterized byso-e degree of thermal discomfort for approximately 40 per-cent of tfie hours of any one year (DeDear, 19Bg). Low windspeeds (mean wind speed <2 m sec-1) accentuate the temper-

ature related effects of land-use changes on human comfort byincreasing the correspondence between the active surface andair temperature in the urban canopy layer (Oke, 1926), thusenhancing the potential usefulness of satellite derived values.
Existing studies of Singapore's urban climate (singaporeMeteorological Service, 1982; Toh, 1990), confirm the exis-tence of land cover related temperature differences. In thesecases, day- and night-time air temperature data were col-lected in sifu using vehicle traverses over a period of severalhours. Temperature differences of 5"C in the warmer mid-year months and 2.5oC during the fanuary to February mon-soon were observed between urban and "rural" situaiions onthe island (Singapore Meteorological Service, 1982). This issmall compared with heat islands in temperate zone cities,but is comparable to those of other tropical cities (Jauregui,1984). Temperature differences were greatest around 10 ptr,lto midnight.
The high moisture availability year-round in the humidtropics and immediate vegetation growth on all areas of baregro_und wo_uld _promote high evapotranspiration rates, espe-cially on cloud-free days when humidity at the time of ii^rnageacquisition can be as low as Z0 percent. Under these condi--tions, Iatent heat energy is Iost from all but the most denselybuilt urban areas. This, as well as the Singapore govern-ment's urban planting campaign, diminishes the urban ruralland-cover contrasts on thermal imagery. Plate 1 indicatesthat some areas in the Central Business District (A) andhousing estates vicinity (B) are as cool as in the forested na-ture reserves (C).
BackgroundRemote Sensing of the Urban Heat lsfandSatellite-derived thermal data correspond to Surface Temper-ature (Ts) for which rural-urban differences are said to begreatest during the daytime (Roth ef o/., 1989). These differ-ences in daytime Ts are not likely to correspond spatially tothe conventional urban heat island based on measurementsof air temperature by night-time traverse.
Oke's recognition of two distinct types of heat island(Oke, 1976) is relevant to the different methods of measure-ment. These are
(r) The urban canopy layer heat is/and, which consists of airbetween the roughness elements (mainly buildings and treecanopies) and whose upper boundary may be visualized aslying-just below roof level, though in large open spaces itmay be entirely absent. This layer consists oi a distinctivecombination of horizontal and vertical facets comprisingbuilding assemblages, in which roof areas alternat-e witli ur-ban street "canyons." Within the canopy layer there is con-vergence of sensible heat due to reduced wind speeds (Oke,1 979).
(2) The urban boundary loyer heat island, situated above theformer, whose characteristics are affected bv the presence ofan urban area at its lower boundarv, and miv adiect down-wind as an urban plume.
Satellite derived surface temperature corresponds moreclosely with canopy layer climate which may be discontinu-ous between urban structures. Thus, accurate representationrequires discrete data, i.e., small pixel sizes.
A precise transfer function between Ts and the near-ground air temperature is not available. However, Carlsonand Boland, using data from three mid-latitude cities, foundthat daytime Ts and surface flux are closely related to land-cover characteristics, of which moisture av-ailabilitv is domi-
t:226
Plate 1. Thematic Mapper image of black body tempera-ture of Singapore, Approximate locations: (A) CentralBusiness District. (B) Housing Estates. (C) Forested Na-ture Reserves. (D) Industrial and Reclaimed Land.
nant (Carlson and Boland, 19ZB). In their studv. surfaceroughness was found to be the next most influential factor,but this, along with wind speed, conductivity, and other fac-tors, accounted for an error of only 1 to 2oC in ground tem-perature estimatesl. These findings support thos-e of otherworkers. (e.g., Morgan- et al., tgZi; Sclimiat, 1925) in suggest-ing the importance of vegetated surfaces, which retain alidtranspire moisture, for controlling and modifying the urbanclimate.
However, the surface as "seen" by the satellite is only aproportiorr of the active surface, partiiularly in high-rise ur-ban developments, and this may not realistically ipresentactive. surface tempe-rature. This effect is accentuatel in trop-ical cities where high solar elevation means that horizontal'surfaces, inclu-ding-roofs and tree canopies, may be signifi-cantly hotter than the mean temperatuie of the activeiur-face. Thus, even assuming a cloie relationship between thetemperature of the active surface (Ts) and air temperature.the satellite-derived Ts may be unrepresentative biecause incertain land-cover types the active surface is underrepre-sented and the "seen" surface may be disproportionaiely hot(Roth et o1., 1989).
On the other hand, the advantages of a satellite-basedapproach to urban micro-climatology include the ,,instanta-neous" nature of the data collected over an urban area com-pared with the difficulty of synchroni zing in sjfu field data.Secondly, in order to represent spatial temperature variationswithin a heat island, a dense sanipling grid extending acrossan urban area, such as is providea by sitellite sensori, is re-g"]t_"q. For large urban areas, high resolution synchronizedfield data collection would not be feasible.
lThe same study found that thermal inertia was the most responsiblefactor for shaping nigh!time temperature patterns.'?ln the 12 years prior to 1980, less than 2 percent of studies of theurb_an climate published in English w".e oi tropical areas (Oke, citedin /auregui (1984)).
PE&RS

The Relationship between lmage Data and Suface Temperatute (Ts)Satellite derived observations of Earth surface temperatureare affected by the complexity of interactions between elec-tromagnetic radiation and the Earth surface and atmospherewithin the field of view of the sensor. These interactions in-clude differential emissivity of land-cover types and the ab-sorption and emittance properties of water vapor and otheratmospheric constituents. Both these effects are likely to beparticularly pronounced in Singapore due in the first case tolhe heterogeneity of the urban land cover and secondly tothe humid tropical climate where absorption and emittanceof infrared radiation by atmospheric water vapor may ac-count for as much as 10"C difference between actual surfacetemperatures and satellite data (Deschamps and Phulpan,1980; Pr ice, 1983).
Thus, although satellite-derived radiance values canreadily be converted to equivalent black body temperatures(Tb) using Planck's law (Malaret et d1., 1985), this underesti-mates Ts if corrections for emissivity differences according toland cover are not carried out'z. The resulting Ts, moreover,can only be considered accurate in clear, dry atmospheres,and a further correction using atmospheric data should bemade, if absolute temperatures are desirable.
Low spatial resolution constitutes a further source of in-accuracy; thus, Desjardins et o1. (1990, p. 1386) discoveredthat a difference between satellite-derived Ts and groundtemperature data of 2'K using 120-metre spatial resolutiondata from Landsat rM improved to 0.6"K with airborne dataof 11-metre resolution. This is attributed to the greater pro-portion of "pure" pixels using higher spatial resolution (Des-jardins et a1.,1990).
In summary, among the parameters which contribute toerror in the derivation of actual Ts from satellite radiancedata, those which produce relative inaccuracy between land-cover types are the most serious for monitoring temperaturevariations within the urban heat island. Thus correction foremissivity (e) is more important than atmospheric correctionif only relative comparisons are to be made. Studies whichutilize data from low resolution sensors such as HCMM, andcorrect for atmospheric factors but not for emissivity differ-ences between surface materials, would appear to be ignor-ing two major sources of potential error while mitigating aminor source.
The Study AreaThe study area corresponds to an image extract containingnine of Singore's high density municipal housing estates, lo-cated near the center of the island. The estates are spatiallyin close proximity but are of varying size, age, and propor-tion of built-up area. Individual housing blocks are typically150 by 30 metres in area by 60 metres high. Spacing betweenblocks is typically 30 metres and spatial arrangement is inthe form of parallel rows, or quadrangles with inner court-yards. Orthophoto measurements of the active:plan area ratioin a typical estate give the proportions listed in Table 1.
The table indicates that the active surface is 1.7 timesthe planimetric (satellite "seen") area. The "seen" surface isdefined as that part of the active surface whose projection to-wards the satellite comprises the instantaneous field of view(rFov).
Roofing material is concrete, as are walkways, forecourts,and carparks which occupy a substantial portion of the inter-stitial space between blocks. The remainder is occupied-bygrassy zurfaces and trees which are well established in theolder estates. Depending on the sun angle, substantial por-
TnaLE 1. Rnrto or Measunro SuRmcEs ro PLANIMETRIC Anel tl n HoustllcBonRo Esnrr, StttcPone'
Roof areaGround area
o . 7 70.83
Total planimetric areaTotal nlanimetric areaBuilding sidesTree canopies
1 . O '1 .00.54@
0.16@
Total active surface r . 70
* Corresoonds to the satellite "seen" surface, of which built (hard)surfaces^: 5070, vegetated surfaces = 50%.@ Corresponds to saiellite "unseen" surfaces, including buildingsides and areas below tree canopies. These areas have no direct con-tribution to radiance at satellite altitudes'
tions of ground may be in shadow at any time. Population
density ive.aget 37,500 per square kilometre, in a combinedarea of 17 square kilometres.
MethodsThe main source of temperature data was a 24 May 1989Landsat TM image, and the Iocal time of overpass at 10:4oAM corresponded to a sun elevation of 51 degrees and azi-muth of 5^B degrees, respectively. The thermal band (Plate 1)at'1,0.4 to L25"pm has a spatial resolution of 120 metres anda noise equivalent temperature difference of 0.5"C (Gibbonsand Wukelic, 1989).
Because absolute temperature values are not required forthe study, atmospheric correction was not carried out'though calibration with anniversary sea water temperature!which vary by less than 1"C from year to year (emissivity isassumed t; be 1) suggest that Ts values derived for the pres-ent study are approiimately 11'C lower than actual Ts. Thisestimate is likely to be at least as accurate as the use of radi-osonde data, foi which accuracies of I 2 or 3"C are achieva-ble fPrice, 1979).
Conversion to Ts was carried out on a pixel-by-pixel ba-sis using a simple FORTRAN Program. First, radiance values-e.e co-trn"rted to Tb using a quadratic conversion (Malaretet d1., 1985). Second, emissivity correction (Equation 1) wascarried out according to land cover, of which two main clas-ses were recognized. These were areas comprising high riseapartment blocks and associated hard surfaced walkways'roads, and car parks, which were classified as non-vegetatedsurfaces, while the remainder, comprising grassy surfacesbordered by ornamental shrubs and trees, were classed asvegetated. ihese could easily be differentiated on Landsat TMreflective bands.
Sudace Emisslvity ValuesDue to the significant variation in published values of e forvegetated and man-made surfaces (e.g., Table 2) and in viewof the importance of this parameter in deriving accurate rela-tive values for Ts', field measurements were carried out inthe study area. These comprised measurements of Ts usingcontact fhermistors attached to a data logger, and measure-ments of effective radiant temperature using a Wahl Heat
3A variation of only 1 percent in e results in a variation in Ts of ap-proximately 0.4'K for a body whose temperature approaches the av-Lrage value for the Earth's surface (Desjardins et dl', 19s0).
Spy Thermal Radiometer. Mean values of e for non-vegetatedand vegetated areas respectively were 0.92 and 0.9S.
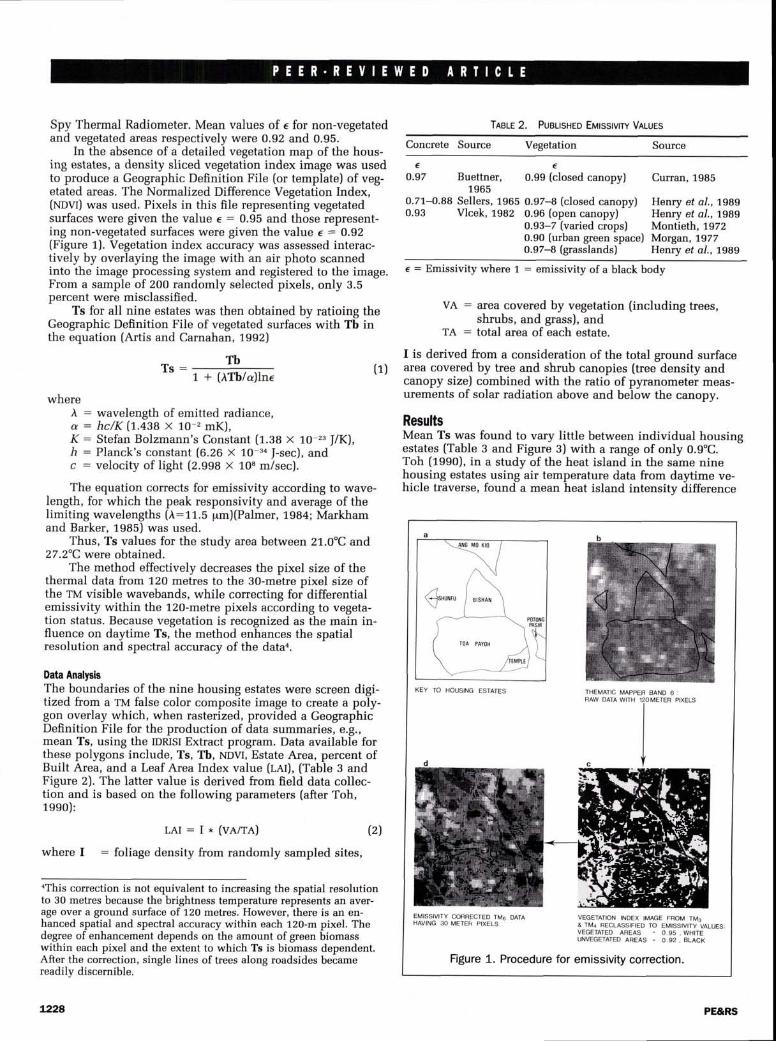
In the absence of a detailed vegetation map of the hous-ing estates, a density sliced vegetation index image was usedto produce a Geographic Definition File (or template) of veg-etated areas. The Normalized Difference Vegetation Index,(runvl) was used. Pixels in this file representing vegetatedsurfaces were given the value e = 0.95 and those represent-ing non-vegetated surfaces were given the value e : O,92(Figure 1). Vegetation index accuracy was assessed interac-tively by overlaying the image with an air photo scannedinto the image processing system and registered to the image.From a sample of 200 randomly selected pixels, only 3.5percent were misclassified.
Ts for all nine estates was then obtained by ratioing theGeographic Definition File of vegetated surfaces with Tb inthe equation (Artis and Carnahan, 1992)
T s :1 + (,\Tb/a)lne
TleLe 2. PueLrsFteo Eurssrvrw Vnlues
Concrete Source Vegetation Source
e
O.97 Buettner,1965
0.71--0.88 Sellers, 1965 0.97-8 (closed canopy)0.93 Vlcek, 1982 0.96 (open canopy)
0.93-7 (varied crops)0.90 (urban green space)0.97-8 (grasslands)
e
0.99 (closed canopy) Curran, 1985
Henry ef a/., 1989Henry ef a/,, tgagMontieth, 1972Morgan, 1977Henry ef a1,, 1989
e : Emissivity where 1 = emissivity of a black body
where,\ : wavelength of emitted radiance,a : hc/K (1.43s x 10-, mK),K : Stefan Bolzmann's Constant (r.ee x to-2" l/K),/r : Planck's constant (6.26 x 10⁻³⁴ f-sec), andc : velocity of light (2.998 x l08 m/sec).
The equation corrects for emissivity according to wave-length, for which the peak responsivity and average of thelimiting wavelengths (i:11.5 pm)(Palmer, 1984; Markhamand Barker, 1985) was used.
Thus, Ts values for the study area between 21.0"C and27.2oC were obtained.
The method effectively decreases the pixel size of thethermal data hom 120 metres to the 3O-metre pixel size ofthe TM visible wavebands, while correcting for differentialemissivity within the 120-metre pixels according to vegeta-tion status. Because vegetation is recognized as the main in-fluence on daytime Ts, the method enhances the spatialresolution and spectral accuracy of the dataa.
Data AnalysisThe boundaries of the nine housing estates were screen digi-tized from a tM false color composite image to create a poly-gon overlay which, when rasterized, provided a GeographicDefinition File for the production of data summaries, e.g.,mean Ts, using the IDRISI Extract program. Data available forthese polygons include, Ts, Tb, NDVI, Estate Area, percent ofBuilt Area, and a Leaf Area Index value (rar), (Table 3 andFigure 2). The latter value is derived from field data collec-tion and is based on the following parameters (after Toh,1ee0):
L A r : I * ( v a l r A ) ( z )
where I : foliage density from randomly sampled sites,
VA : a-rea covered by vegetation (including trees,shrubs, and grass), and
TA : total area of each estate.
I is derived from a consideration of the total ground surfacearea covered by tree and shrub canopies (tree density andcanopy size) combined with the ratio of p5nanometer meas-urements of solar radiation above and below the canopy.
ResultsMean Ts was found to vary little between individual housingestates (Table 3 and Figure 3) with a range of only 0.9"C.Toh (1990), in a studv of the heat island in the same ninehousing estates using air temperature data from daytime ve-hicle traverse, found a mean heat island intensity difference
a
KEY TO HOUSINO ESTAIES THEMATIC MAPPER AAND 6:RAW DATA WITH 12OMETER PIXELS
CORRECTED TM6 DAIA VEGETATION INDEX IMAGE FROM TM2METEH PIXELS & rMa RECLASSTFTED rO eUrSSrvrtV-Urues,
Ii9.'II1:?,JHH, . 3 3!, H',fli.-Figure 1. Procedure for emissivity correction.
EMISSIVITY CORRECTED TM6 DATAHAVING 30 METEH PIXELS
Tb(1)
aThis conection is not equivalent to increasing the spatial resolutionto 30 metres because the brightness temperature represents an aver-age over a ground surface of 120 metres. However, there is an en-hanced spatial and spectral accuracy within each 120-m pixel. Thedegree ofenhancement depends on the amount ofgreen biomasswithin each pixel and the extent to which Ts is biomass deoendent.After the coriection, single lines of trees along roadsides becamereadily discernible.
u22A

Tnerr 3. ATTRTBUTE Dnrn roR HousrNG Esrnre PoLvcor.rs (MEAN VALUES)
1 . 2 . 3 . 4 . 5 .BB SURF
TM6 TEMP TEMP AREA BUILTDN fC) TC) (HA) (%)
6 . 7
Estate LAI NDVI
Ang Mo KioBishanHougangPotong PasirSerangoon C.Serangoon N.ShunfuTempleToa Payoh
1.28.8 22.22729.2 22.39729.1 22.33128.8 22 .27728.9 22.75728.7 22.24130.0 22 .79729.2 22.40130.0 22 .28
s9 16 176.341 2 168 .359 2 .4 167 .643 7 .3 166 .551 2 767.452 2 .8 169 .246 4 .3 166 .837 0 .5 172 .663 14 .3 173 .5
a a a
24.424 .424 .O24 .224 .724.624 .324.O
52072847046
72854142 8
298
of r"C. Additionallv. the same three estates were found to beamong the four waimest in both studies. This suggests a de-gree of correspondence between satellite measurements of Tsand near-ground air temperature during the daytime in spiteof the fact that satellite measurements are from varying ele-vations above ground, whereas the air temperature data rep-resent screen height.
Because 67 percent of the surface "seen" by the satelliteis at ground level (Table f ), the remainder being at tree can-opy (16 percent) and roof level (17 percent), and becauseground temperature is taken by many authors as a surrogatefor screen temperature (heat island)(Goldreich, 1985), and be-cause in many cases horizontal surfaces are more radiativelyactive than vertical surfaces (Nunez and Oke, 1977), such acorrespondence is not unlikely.
This correspondence is supported by other empirical re-sults concerning the distribution of biomass related to Ts.Thus, the three warmest estates happen to be the most re-cently developed, with immature tree planting programs.
Additionally, for all the estates, a close inverse relation-ship was obtained between Ts and LAI (r : -o.78, n : 7)indicating that the presence of green biomass may effectivelyIower temperatures in this type of high-rise residential devel-opment (Figure 3). The correlation increases to -0.90 ifShunfu estate, which is very small in area, is omitted.
A higher correlation observed between the emissivitycorrected mean temperatures and LAI, than for the uncor-rected Tb (r : -0.25), was expected because the originaldata suffers from greater spatial averaging over each 120-mpixel of micro-scale temperature differences associated withiurface materials as well as from appiuent Ts differences dueto differential emissivity.
In order to further investigate the correspondence be-tween cool temperature and vegetation, pixels representingareas which were cool but unvegetated were identified usinga Boolean overlay operation in IDRISI, e.9., by using IDRISI'sOVERLAY (multiply) operation on a binary image of vegetatedareas and a binary image representing areas below one stan-dard deviation of mean temperature. Only 0.3 percent of pix-els satisfied the two conditions. They correspond entirely toshadows cast by high rise residential buildings, e.g., innercourtyards and housing blocks oriented at right angles to thesun direction. At the time of the overpass, a sun angle of 51degrees gives buildings 60 metres high a shortest shadowlength (for buildings at right angles to sun azimuth) of 50metres. Figure 4 shows Shunfu Estate with pixels represent-ing unvegetated areas having Ts values of less than 22.5'C inareas shaded by tall buildings. Except for vegetated areas,much of the remainder of the estate has Ts values more thanone standard deviation above mean temperature (i.e., above25"C), with a very steep (almost vertical) temperature gradi-ent existing between cool, shaded and much warmer, un-shaded surfaces. The GIS overlay operation confirms theintimate relationship between the satellite-derived heat is-Iand and moisture availability as represented by vegetated
CORRELATION BETWEEN Ts AND LAI
247 I,an I
21.5 ;
k-0.78 h-71
l.rrl..*
)
IU
F
21.1
21.3
21.2
21.1
21
23.9
23.0
TElvlPtf -
\rooJlro"
0l - l - l r l -
2 1 6 0 r t 0 1 21 3 5 7 9 [
IEAF AREA INDEX ILAI)
|4t3
ANGI,IOKIO
I ' il5
Figure 3. Mean surface temperature ("C) for nine housingestates related to leaf area index.
EOCRAPHIC DEF1N1TION f lLE
[+iIII
I oa ta tase Ar t r ibu te F i re
I ten At t r ibu te
L r D j
ESTATE NME Toa PayohBBCK BoDY TEUP. 22 .3"cSURFACE TEMP. 24 .8CAREA 298 l la .BUILT UP NEA 638LEAF NEA INDEX 14. ]v E G . r N D . ( D N ) 1 7 3 - 5
I
l
I o.a.our. Attr ibute Fire
I r tem Attr ibute
L PIXELv E G . r N D . ( D N ) 1 9 8Ng COVER Vegetat€dE M I S S I V I T Y 0 . 9 5
Figure 2. Geographic Definition File and Database Attritsute File. (a) Housing estate polygons with associated at-tributes. (b) Vegetation Index image used as mask foremissivitv correction.
PE&RS u229

surfaces, as well as the importance of the geometric arrange-ment of surfaces in relation to sun angle.
The potentially smoothing effects of meso-scale advec-tive heat transport do not apparently affect Ts. A low risehousing estate immediately downwind of the cool, forestedcentral catchment area (mean Ts 19.0'C, wind speed 3km.p.h) had the same mean Ts of 24.6'C as the same type ofestate downwind of Bishan New Town whose mean Ts is24.4"C. A similar effect is observed across all major land-cover boundaries on the image. Thus, strong horizontal tem-perature gradients were maintained, with little apparentinfluence from adjacent surfaces upwind.
This finding accords with that of Chandler (1967) whofound that urban-rural temperature differences were moreclosely related to local building density than to city size(and thus to fetch from upwind). Oke (1976) confirms thisobservation, stating that in Vancouver the canopy thermalclimate appears to be governed by the immediate site char-acter (especially building geometry and materials) and notby the accumulation of thermally modified air from upwindareas,
Studies by the Singapore Meteorological Service (t982)of Singapore's heat island based on night-time air tempera-ture traverses found that Ang Mo Kio and Toa Payoh newtowns constitute distinct heat islands separated by a moredispersed cool corridor of air along the Singapore river. Thiswas true for both warm situation (May-August) and cool situ-ation (fanuary-February) models. The values obtained in thepresent study do not correspond to these observations, ex-cept for a localized "surface heat island approximately 25 hain extent at Toa Payoh town center. In fact, Ang Mo Kio andToa Payoh estates are the coolest of the nine high-rise hous-ing estates studied as well as the most densely built (Table3J. Some adiacent, low-rise middle income estates with bun-galow style development appear considerably warmer thanall nine high rise estates. These differences are not surprisingdue to two main factors:
o The distinct characteristics of the davtime satellite derivedand nigJtt-time traverse deriied heat' islands.In low-rise estates, because a greater portion of the active sur-face is horizontal, more of it is heated, thus giving a warmermean active surface during the daytime. The short buildingshadows comprise only a minor portion of a pixel even at a3O-metre pixel size. Additionally, smaller buildings have bothlower thermal inertia as well as form only shallow canyonsdeffning the depth of the urban canopy liyer. Thus, daytimeheat is less effectively retained. Conversely, in high-rise areasthe retention of daytime heat in large buildings and deepcanyons would produce a marked night time heat island.Thus, Toa Payoh, being densely built (63 percent), as well ashigh-rise, would be expected to exhibit a marked night+imeheat island whereas it may act as a heat "sink" relative tolow-rise areas at times of day before the daily solar heatingmaximum, i.e., at the time of the satellite pass, 10:40 AM.
o The satellite view of the active surfaceThe satellite views proportionally more of the active surfacein low-rise estates with shorter building sides. These appeardisproportionally hot relative to high-rise areas, due to morehorizontal surfaces "seen."
Thus, areas dominated by high-rise residential buildingsdo not appear as particularly warm on Landsat TM thermalimagery even where buildings have been placed very closetogether. The high sun angle in low latitude cities means thatshortwave radiation may be lost by direct reflectance (Arn-field, 1982) due to a high sky view factor. Additionally, the
u230
close spacing appears advantageous and ensures that the in-ter-building space is not greater than the shadow length;thus, shady canyons are maintained between blocks at mosttimes during the day. The coolness of high-rise areas corre-sponds with the observations of Roth ef a1. (1989) on theheat island in the city of Vancouver, that the commercialcore of the city, comprising many densely packed tall build-ings, is not the warmest area on AVHRR imagery. They weresurprised to observe that light industrial activities located inbuildings large in plan a-rea exhibited the highest surfacetemperatures.
The high degree of spatial precision obtained using 30-metre pixels is illustrated in Figure 5, which shows Ts val-ues for two housing estates geometrically corrected to, andoverlaid onto, a 1:20,000-scale air photo. Density slicing ofthe image has isolated areas over one standard deviationabove mean Ts of 24"C (i.e., areas 25'C and above). The fig-ure identifies specific buildings and building complexes withparticularly warm surfaces. The warmest areas appear to cor-respond to town center commercial complexes, schools, hos-pitals, bus terminals, sports complexes, markets, and foodcenters, with schools overwhelmingly represented. Theycomprise low-rise buildings and building complexes oftenseparated by extensive barren patches of concrete corre-sponding to car parks, playgrounds (in the case of schools),and forecourts (in the case of bus terminals).
Thus, the imagery is able to identify the potential heatgenerating surfaces responsible for modification of near-ground air temperatures, although the effects of those at roof-top level cannot be predicted without further investigation ofthe nature of heat exchanges between rooftops and canopylayer climate. However, rooftops are likely to contribute tomicro-scale advective interaction within the canopy layer(Nunez and Oke, 7977), as well as impact on meso-scale cli-mate of the lower boundary layer.
Conversely, a density slice of cool areas identifies spe-cific features such as a double row of hees or a grassy borderwider than 30 metres, though not all such features appearcool, i.e., not all tree plantings appear to be equally effectiveclimatically.
Edge ollmage
Sun Azi. 58'( Sun Et . 5 i " )
_llI
!!E
i. "_:\1-9 Bui lding Block Nos.
! eixets cooler than22.dC
/-'l Areas watmet lhan 25 Ct - ; ' { t s o a b o v e m e a n }
DISTRIBUTION OF COOL TEMPERATURE PIXELS
Figure 4. Influence of building layout and solar elevationand azimuth on surface temperature of Shunfu Estate.
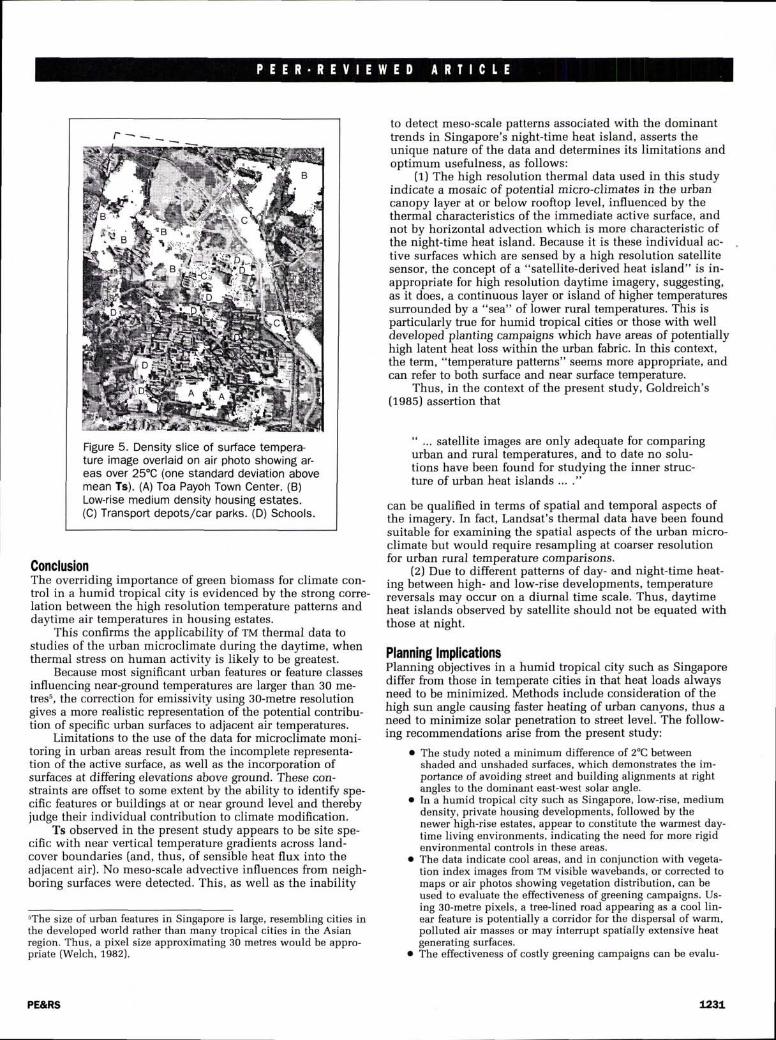
Figure 5. Density slice of surface temperature image overlaid on air photo showing ar-eas over 25'C (one standard deviation abovemean Ts). (A) Toa Payoh Town Center. (B)Low-rise medium density housing estates.(C) Transport depots/car parks. (D) Schools.
ConclusionThe overriding importance of green biomass for climate con-trol in a humid tropical city is evidenced by the strong corre-lation between the high resolution temperature patterns anddaytime air temperatures in housing estates.
This confirms the applicability of TM thermal data tostudies of the urban microclimate during the daytime, whenthermal stress on human activity is likely to be greatest.
Because most significant urban features or feature classesinfluencing near-ground temperatures are larger than 30 me-tress, the correction for emissivity using 30-metre resolutiongives a more realistic representation of the potential contribu-tion of specific urban surfaces to adjacent air temperatures.
Limitations to the use of the data for microclimate moni-toring in urban areas result from the incomplete representa-tion of the active surface, as well as the incorporation ofsurfaces at differing elevations above ground. These con-straints are offset to some extent by the ability to identify spe-cific features or buildings at or near ground level and therebyjudge their individual contribution to climate modification.
Ts observed in the present study appears to be site spe-cific with near vertical temperature gradients across land-cover boundaries (and, thus, of sensible heat flux into theadjacent air). No meso-scale advective influences from neigh-boring surfaces were detected. This, as well as the inability
sThe size of urban features in Singapore is large, resembling cities inthe developed world rather than many tropical cities in the Asianregion. Thus, a pixel size approximating 30 metres would be appro-priate (Welch, 1982).
PE&RS
to detect meso-scale patterns associated with the dominanttrends in Singapore's night-time heat island, asserts theunioue nature of the data and determines its limitations andoptimum usefulness, as follows:
(r) The high resolution thermal data used in this studyindicate a mosaic of potential micro-climates in the urbancanopy layer at or below rooftop level, influenced by thethermal characteristics of the immediate active surface, andnot by horizontal advection which is more characteristic ofthe night-time heat island. Because it is these individual ac-tive surfaces which are sensed by a high resolution satellitesensor, the concept of a "satellite-derived heat island" is in-appropriate for high resolution daytime imagery, suggesting,as it does, a continuous layer or island of higher temperaturessurrounded by a "sea" of lower rural temperatures. This isparticularly true for humid tropical cities or those with welldeveloped planting campaigns which have areas of potentiallyhigh latent heat loss within the urban fabric. In this context,the term, "temperature patterns" seems more appropriate, andcan refer to both surface and near surface temperature.
Thus, in the context of the present study, Goldreich's(1985) assertion that
" ... satellite images are only adequate for comparingurban and rural temperatures, and to date no solu-tions have been found for studying the inner struc-ture of urban heat islands ... ."
can be qualified in terms of spatial and temporal aspects ofthe imagery. In fact, Landsat's thermal data have been foundsuitable for examining the spatial aspects of the urban micro-climate but would require resampling at coarser resolutionfor urban rural temperature comparisons.
(2) Due to different patterns of day- and night-time heat-ing between high- and low-rise developments, temperaturereversals may occur on a diurnal time scale. Thus, daytimeheat islands observed by satellite should not be equated withthose at night.
Planning lmplicationsPlanning objectives in a humid tropical city such as Singaporediffer from those in temperate cities in that heat loads alwaysneed to be minimized. Methods include consideration of thehigh sun angle causing faster heating ofurban canyons, thus aneed to minimize solar penetration to street level. The follow-ing recommendations arise from the present study:
e The study noted a minimum difference of 2'C betweenshaded and unshaded surfaces, which demonstrates the im-pofiance of avoiding street and building alignments at rightangles to the dominant east-west solar angle.
o In a humid tropical city such as Singapore, low-rise, mediumdensity, private housing developments, followed by thenewer high-rise estates, appear to constitute the warmest day-time living environments, indicating the need for more rigidenvironmental controls in these areas.
o The data indicate cool areas, and in conjunction with vegeta-tion index images from ru visible wavebands, or corrected tomaps or air photos showing vegetation distribution, can beused to evaluate the effectiveness of greening campaigns. Us-ing 3O-metre pixels, a treelined road appearing as a cool lin-ear feature is potentially a corridor for the dispersal of warm,polluted air masses or may interrupt spatially extensive heatgenerating surfaces.
o The effectiveness of costly greening campaigns can be evalu-

ated because not all tree-lined roads and grassy areas areequally cool.
o Overlay of the imagery onto maps or air photos in a cts maypermit modeling of the impact of proposed land-coverchanges in terms of the topological arangement of warm andcool polygons. Thus, the optimum location ofgreen corridorsand buffer zones can be suggested.
o Satellite data can contribute to the understanding of the roleof the type and spatial arrangement of different surface mate-rials in urban microclimatology, as well as indicate potentialareas of energy interaction with the overlying boundary layerfor modeling of air pollution dispersal.
AcknowledgmentThe author would like to thank Dr. Richard DeDear of theSchool of Earth Sciences, Macquarie University, Sydney, forhelpful discussions and criticisms on the subject of this pa-per. Equipment purchased under grant RP 18/92 IN from Nan-yang Technological University assisted the research.
RefelencesArnfield, A.1.,7582. An approach to the estimation of the surface ra-
diative properties and radiation budget of cities, Pfiysical Geog-rcphy, 32t97-'1.22.
Artis, D.A., and W.H. Carnahan, 1982. Survey of emissivity variabil-ity in thermography of urban areas, Remote Sensrng of Environ-ment, I2i373-329.
Balling, R.C., and S.W. Brazell, 1988. High resolution surface tem-perature patterns in a complex urban terrain, PhotogrammetricEngineering & Remote Sensi ng, 54(9) : 1 289-1 293.
Buettner, K.J.K., and C.D. Kern, f 965. The determination of infra-redemissivities of terrestrial surfaces, lournal of Geophysical Re-search, z o(t):7329-1337 .
Carlson, T.N., and F.E. Boland, 1978. Analysis of urban-rural canopyusing a surface heat flux temperature model, /ournol of AppliedMeteorology, 1 7:998-101 3.
Carlson, T.8., I.K. Dodd, S.G. Benjamin, and f.N. Cooper, 1981. Sat-ellite estimation of the surface energy balance, moisture availa-bility and thermal inertia, /ournol of Applied Meteorology,2o:o t - t l t .
Carnahan, W.H., and R. C. Larson, 1990. An analvsis of an urbanheat sink, Remote Sensing of Environment, 3i:65-71.
Chandler, T. J., 7967. Night time temperatures in relation to Leices-ter's urban form, Meteorological Magazine, 96:244-25O.
Curran, P., 1985. Principles of Remote Sensing, Longman.DeDear, R., 1989. Diurnal and seasonal variations in the human ther-
mal climate of Singapore, Singapore lournal of Tropical Geogra-phy, 1O(7):1.3-26.
Deschamps, P.Y., and T. Phulpin, 1980. Atmospheric correction ofinfra-red measurements of sea surface temperature using chan-nels at 3.7, 11 and 17 pm, Boundary Layer Meteorolog5r, 18:131-143.
Desjardins, R., /. Gray, and F. Bonn, 199O. Atmospheric correctionsfor remotely sensed thermal data in a cool humid temperatezone, International lournal of Remote Sensrng, 118:1369-1389.
Gibbons, D.E., and G.E. Wukelic, 1989. Application of Landsat The-matic Mapper data for coastal thermal plume analysis at DiabloCanyon, Photogrammetric Engineering & Remote Sensing, 55(61:903-909.
Goldreich, V., 1985. The structure of the ground level heat island ina Central Business District, lournal of Climate and Applied Me-te o ro lo gy, 24:1237 -7244.
Henry, f.A., S.E. Dicks, O.F. Wetterqvist, and S.f. Roguski, 1989.Comparison of satellite, ground-based and modelling techniquesfor analyzing the urban heat island, Photogrammetric Engineer-ing & Remote Sensing, 55(1):69-76.
t:232
Jauregui, E., 1984. Tropical urban climates: review and assessment,Urban climatology and its applications with special reference totropical arcas, Proceedings of Technical Conference WMO, Mex-ico, 26-30 November, pp. 26-45.
Malaret, E., L.A. Bartolucci, D. Fabian Lozano, P.E. Anuta, and C.D.McGillen, 1985. Thematic Mapper data quality analysis, Pioto-grammetri c Engineeri ng & Re mote Sensing, 5 1 (9): 1407-141 6.
Markham, B.L., and f.K. Barker, 1985. Spectral characteristics of theLANDSAT Thematic mapper sensors, International Journal ofRemote Sensi n g, 6(5) :697-7 76.
1986, LANDSAT MSS and TM post-calibration dvnamicranges, exoatmospheric refl ectances^ and at-satellite tLmpera-tures, EOSAT LANDSAT Technical Notes, No. 1, EOSAT, Lan-ham, Maryland.
Monteith, l. L., 7973, Principles of Envircnmental Physics, Arnold.Morgan, D., L. Mymp, D. Rogers, and R. Baskett, 1977. Microcli-
mates within an urban area, Annols of the Association of Ameri-co n Geographers, 67:55-65.
Nunez, M., and T.R. Oke, 7977. The energy balance of an urban can-yon, Journal of Applied Meteorolog5t, 16:11-19.
Oke, T.R., 1976. The distinction between canopy and boundary layerurban heat islands, Atmosphere, 74(4)268-27 7.
1979. Technical Note No. 167, Review of Urban Climatology,W.M.O.. Geneva.
Palmer, J.M., 1984. Effective bandwidths for LANDSAT-4 and LAND-SAT-D Multispectral Scanner and Thematic Mapper subsystems.Transactions of Institute of Electrical and Electronic Engineers,Geoscience and Remote Sensing, 3:336-338.
Price /.C., 1979. Assessment of t}le heat island effect through the useof satellite data, Monthly Weather Review, 7O7 :1554-tES7.
1983. Estimating surface temperatures from satellite thermalinfra-red data: a simple formulation for the atmospheric effect,Remote Sensing of Environment, 13:353-361.
Roth, M., T.R. Oke, and W./. Emery, 1989. Satellite derived urbanheat islands from three coastal cities and the utilisation of suchdata in urban climatology, International lournal of Remofe Sens-rng, 10(11):1699-7720.
Schmidt, I.A., 1975. Urban Vegetation, University of Chicago Press.Singapore Meteorological Service, 1982. A study of the urban cli-
mate of Singapore, The biophysical environment of Singaporeand its neighbouring countries (L. S. Chia, editor), GeographyTeachers Assocn. of Singapore, pp. 50-76.
Smith, R.C.G., and B.f. Choudhury, 1990. On the correlation of indi-ces ofvegetation and surface temperature over souti-east Aus-tralia, Internad onal I ournal of Remote Se nsing, 1 1 (1 1 ):2 1 1 3-2120.
Toh, S., 1990. ?fie Microclimatic Response of Vegetation in Housingand Development Board Estates, Academic Exercise in Geogra-phy, Department of Geography, National University of Singa-pore.
Vlcek, f., 1982. A field method for determination of emissivity withimaging radiometers, Photogrammetric Engineering & RemoteSensing, a8(4):609-614.
(Received 27 April 1992; revised and accepted 1Z March 1993)|anet Nichol|anet Nichol is currently a Senior Lecturer inthe Division of Geography, Nanyang Technologi-cal University, Singapore, She has a backgroundin Remote Sensing from the University of Colo-rado (M.A.) and Aston Universitv's Remote
Sensing Unit (Ph.D.). Subsequently, she spent six years as auniversity lecturer in Kano, northern Nigeria. As a biogeogra-pher and environmentalist, she has carried out a range ofconsultancy work, including fuel wood surveys in west Af-rica, coastal resource management in The Philippines, andsetting up a cIS at the Singapore National Parks Board.
PE&RS