a global geometric framework for nonlinear dimensionality...
TRANSCRIPT
A Global Geometric Framework for Nonlinear Dimensionality
Reduction
Presented by Jonas Schwertfeger
Brown University
CS296-3
April 4th, 2007
J.B. Tenenbaum V. de Silva J.C. Langford
2Jonas Schwertfeger, CS296-3, Brown University Isomap
Intuition for Dimensionality Reduction
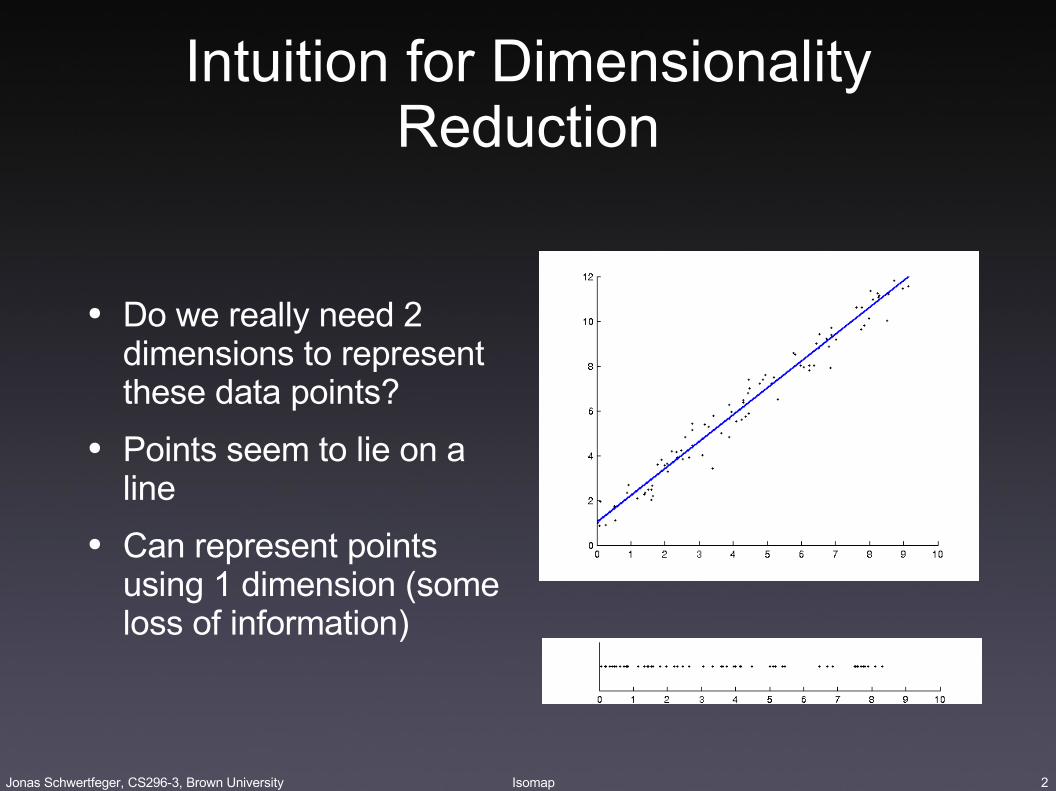
● Do we really need 2 dimensions to represent these data points?
● Points seem to lie on a line
● Can represent points using 1 dimension (some loss of information)

3Jonas Schwertfeger, CS296-3, Brown University Isomap
Intuition for Dimensionality Reduction
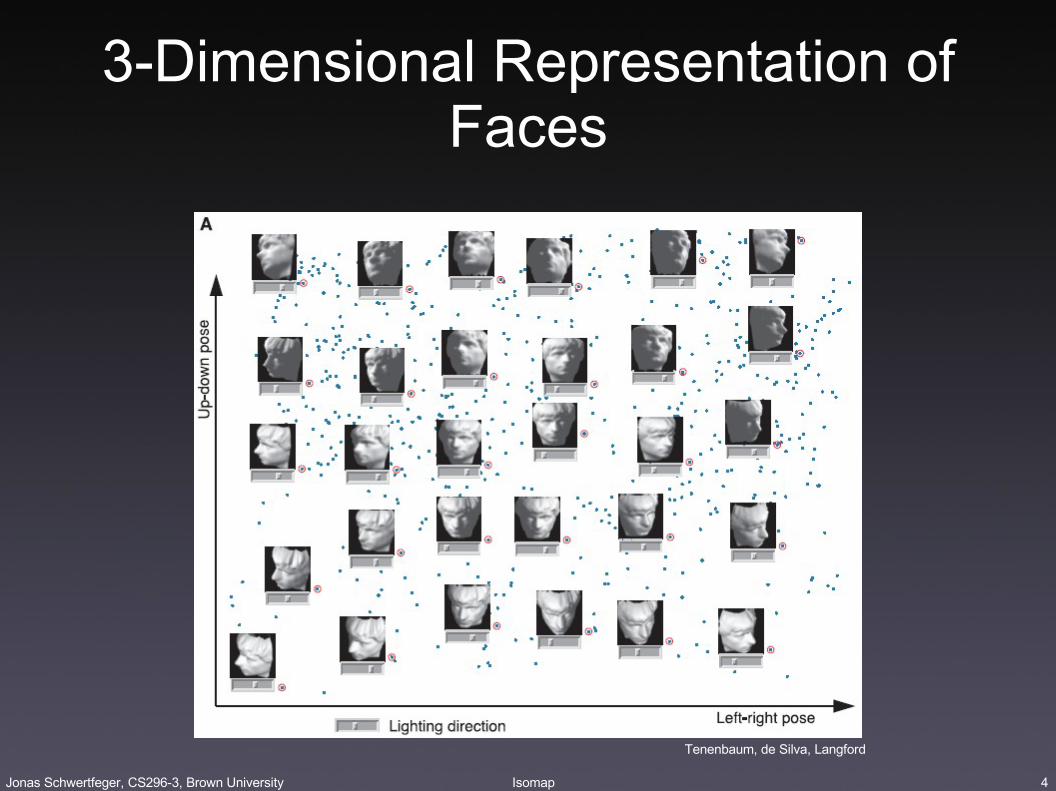
● How do humans memorize these images?
● Memorize all 4096 pixels per image?
● Or some underlying structure?
● Up-down pose● Left-right pose● Lighting direction
● Our brain reduces high-dimensional input to an intrinsic low-dimensional representation!
Tenenbaum, de Silva, Langford
4Jonas Schwertfeger, CS296-3, Brown University Isomap
3-Dimensional Representation of Faces
Tenenbaum, de Silva, Langford
5Jonas Schwertfeger, CS296-3, Brown University Isomap
Why Dimesionality Reduction?
● Data compression● Number of dimensions in input data can be huge and
too large to process/store (e.g. think of pixels in images), „curse of dimensionality“
● Feature selection● Many input dimensions might not contain useful
information, lower-dimensional representation often contains „most important“ aspects of data
● Visualization● For visualization purposes some form of reduction of
the input dimensions to 2D or 3D is often required
6Jonas Schwertfeger, CS296-3, Brown University Isomap
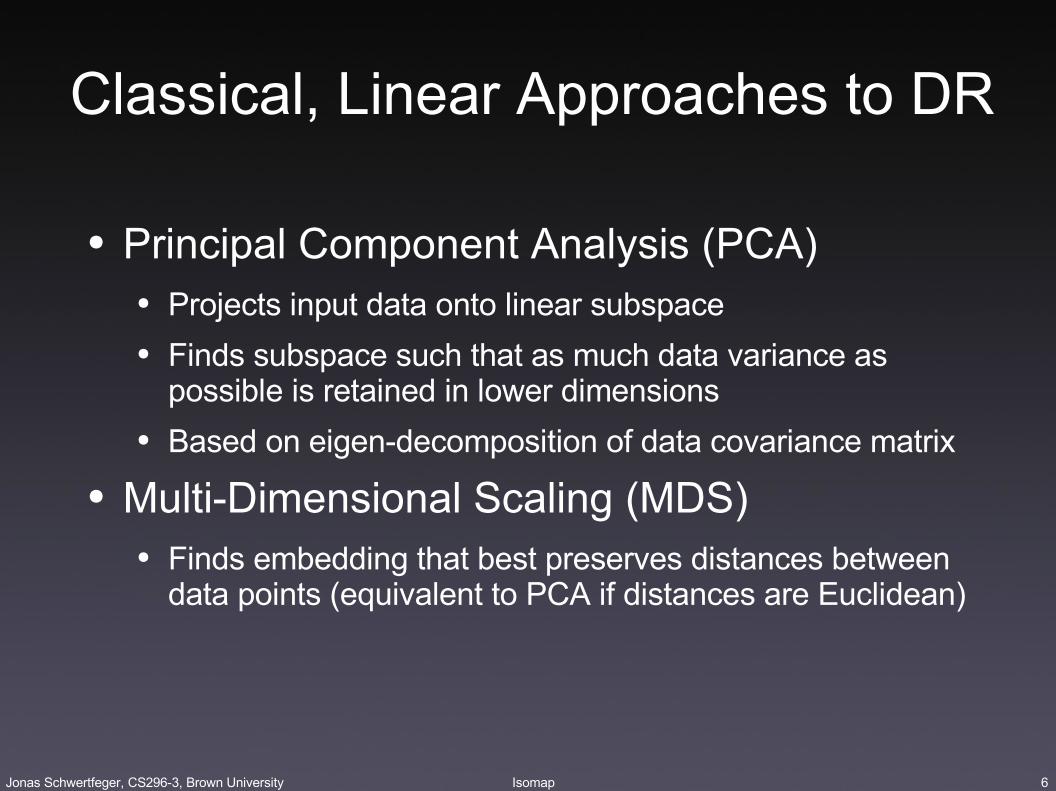
Classical, Linear Approaches to DR
● Principal Component Analysis (PCA)● Projects input data onto linear subspace● Finds subspace such that as much data variance as
possible is retained in lower dimensions● Based on eigen-decomposition of data covariance matrix
● Multi-Dimensional Scaling (MDS)● Finds embedding that best preserves distances between
data points (equivalent to PCA if distances are Euclidean)
7Jonas Schwertfeger, CS296-3, Brown University Isomap
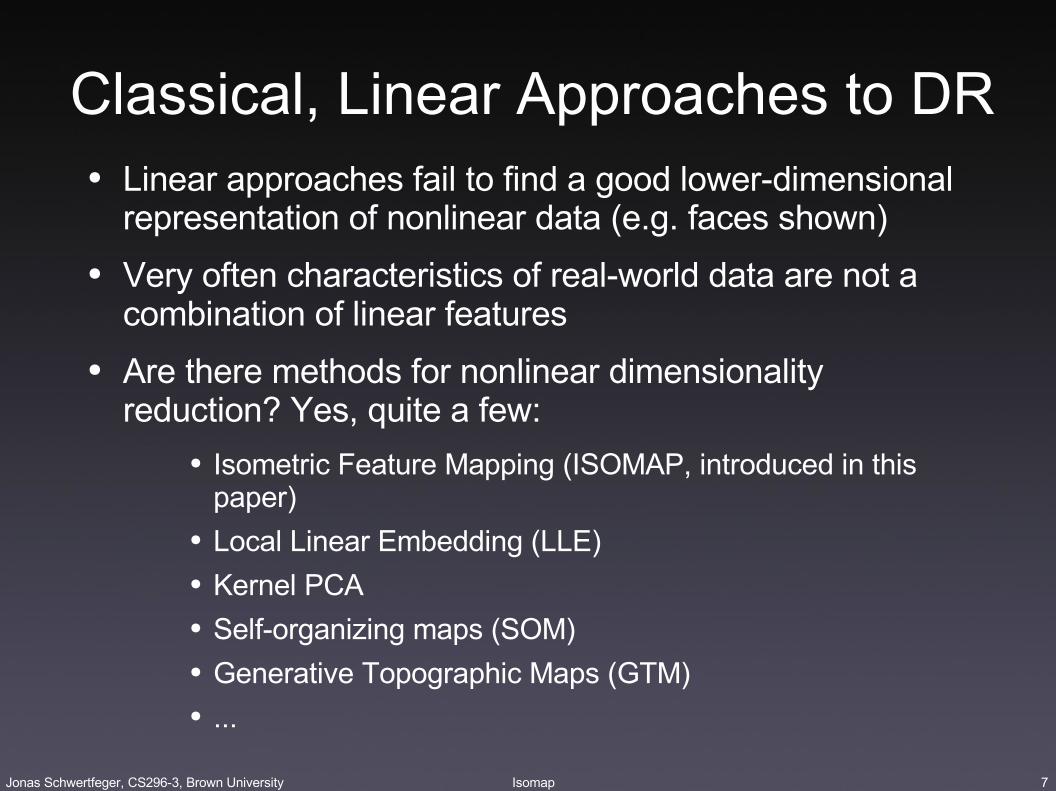
● Linear approaches fail to find a good lower-dimensional representation of nonlinear data (e.g. faces shown)
● Very often characteristics of real-world data are not a combination of linear features
● Are there methods for nonlinear dimensionality reduction? Yes, quite a few:
● Isometric Feature Mapping (ISOMAP, introduced in this paper)
● Local Linear Embedding (LLE)● Kernel PCA● Self-organizing maps (SOM)● Generative Topographic Maps (GTM)● ...
Classical, Linear Approaches to DR
8Jonas Schwertfeger, CS296-3, Brown University Isomap
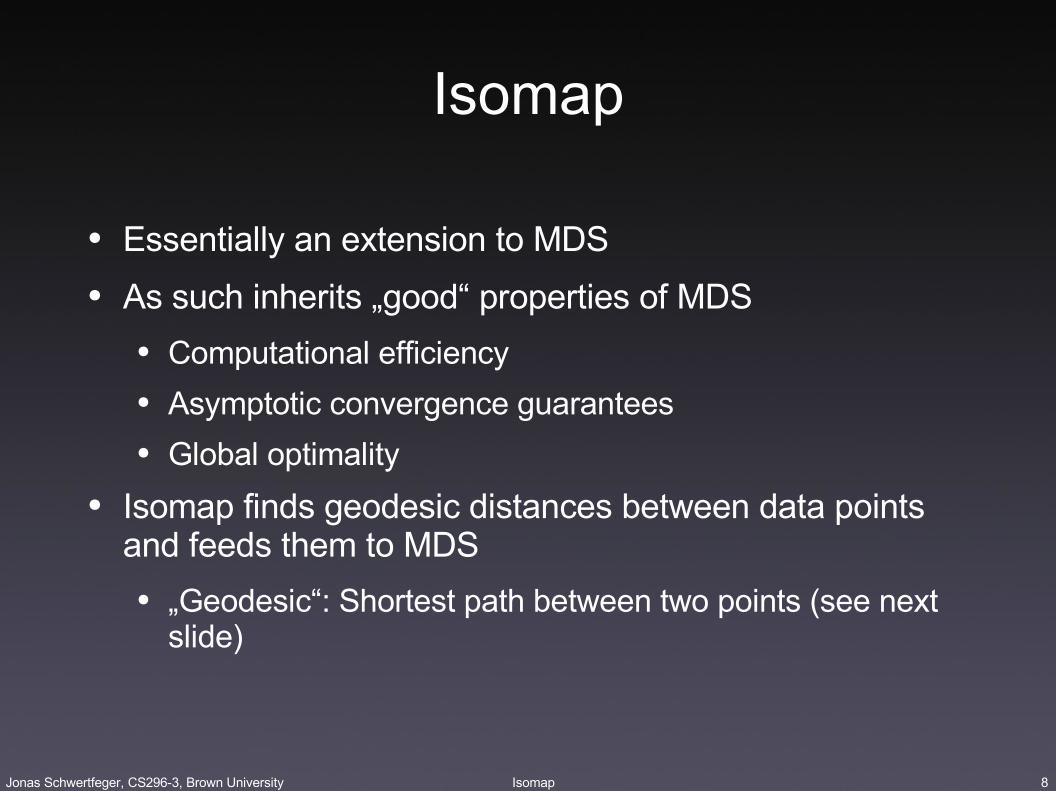
● Essentially an extension to MDS
● As such inherits „good“ properties of MDS
● Computational efficiency● Asymptotic convergence guarantees● Global optimality
● Isomap finds geodesic distances between data points and feeds them to MDS
● „Geodesic“: Shortest path between two points (see next slide)
Isomap
9Jonas Schwertfeger, CS296-3, Brown University Isomap
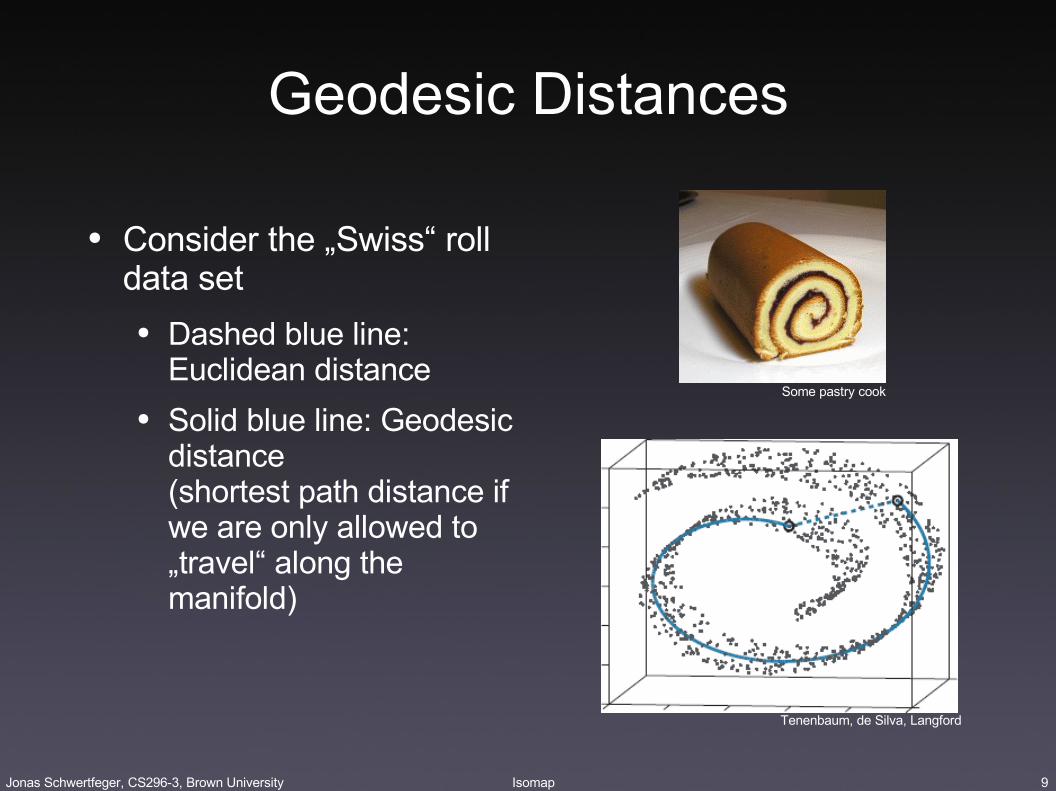
Geodesic Distances
● Consider the „Swiss“ roll data set
● Dashed blue line: Euclidean distance
● Solid blue line: Geodesic distance(shortest path distance if we are only allowed to „travel“ along the manifold)
Tenenbaum, de Silva, Langford
Some pastry cook
10Jonas Schwertfeger, CS296-3, Brown University Isomap
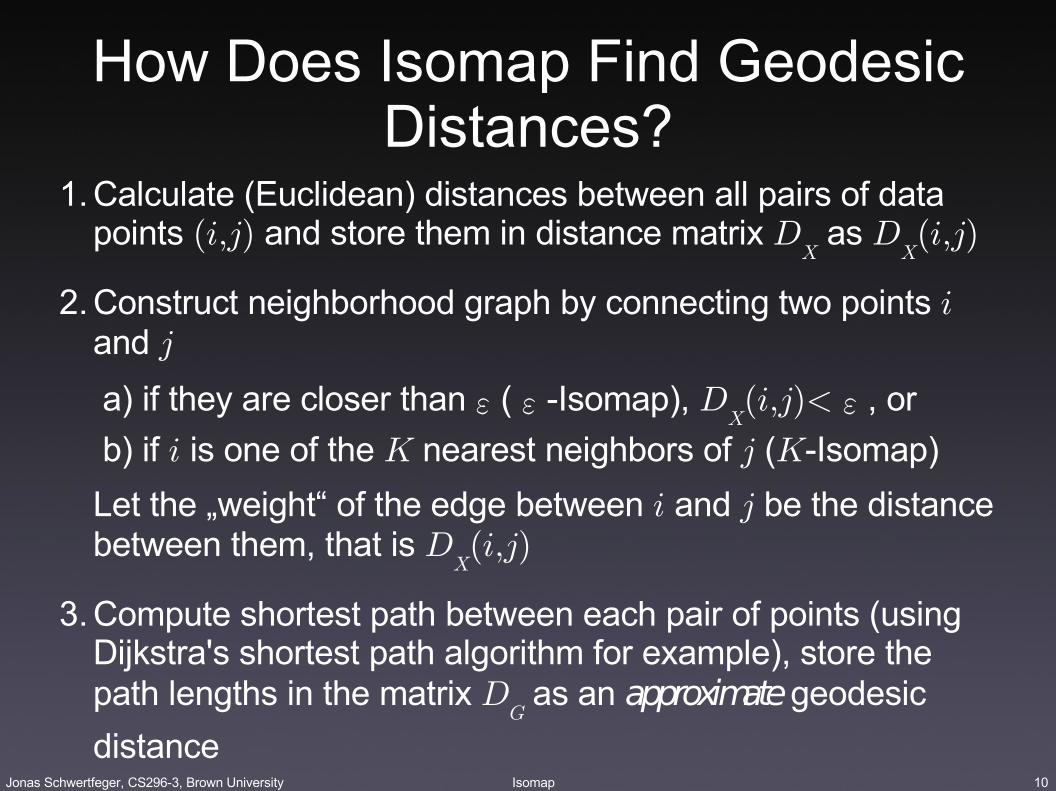
How Does Isomap Find Geodesic Distances?
1. Calculate (Euclidean) distances between all pairs of data points (i,j) and store them in distance matrix D
X as D
X(i,j)
2. Construct neighborhood graph by connecting two points i and j
a) if they are closer thanε(ε-Isomap), DX(i,j)<ε, or
b) if i is one of the K nearest neighbors of j (K-Isomap)
Let the „weight“ of the edge between i and j be the distance between them, that is D
X(i,j)
3. Compute shortest path between each pair of points (using Dijkstra's shortest path algorithm for example), store the path lengths in the matrix D
G as an approximate geodesic
distance

11Jonas Schwertfeger, CS296-3, Brown University Isomap
Sample Neighborhood Graph
Tenenbaum, de Silva, Langford
12Jonas Schwertfeger, CS296-3, Brown University Isomap
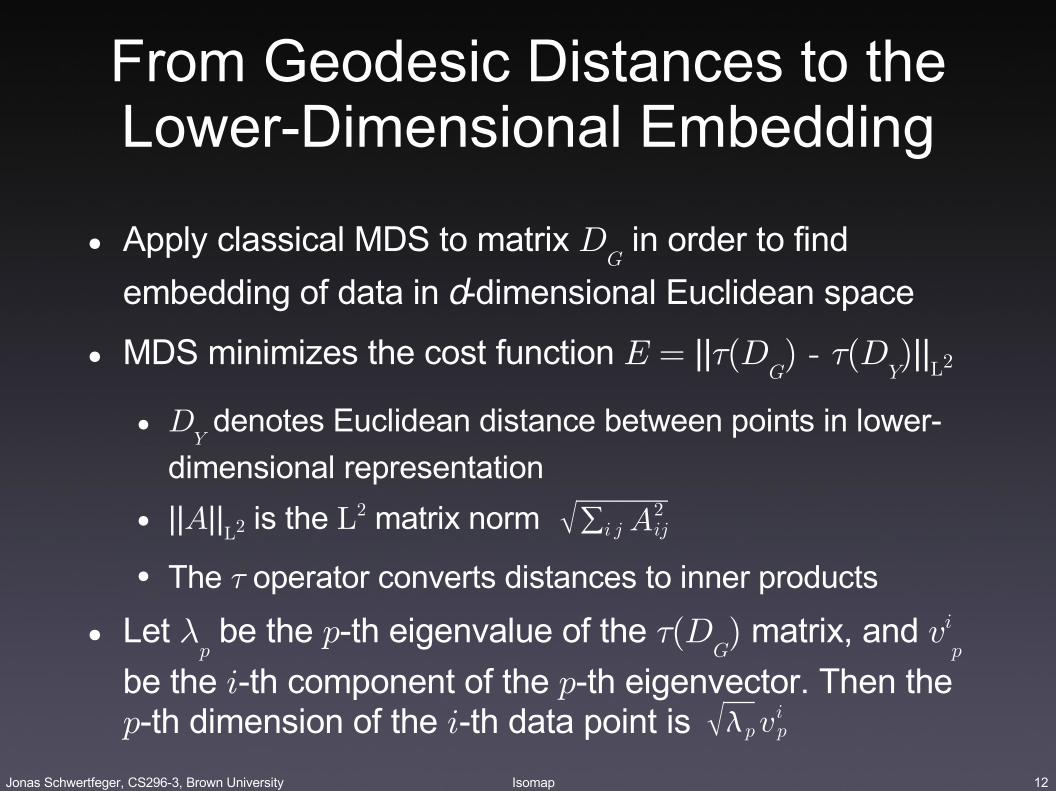
From Geodesic Distances to the Lower-Dimensional Embedding
● Apply classical MDS to matrix DG in order to find
embedding of data in d-dimensional Euclidean space
● MDS minimizes the cost function E = ||¿(DG) - ¿(D
Y)||
L2
● DY denotes Euclidean distance between points in lower-
dimensional representation
● ||A||L2 is the L2 matrix norm
● The ¿ operator converts distances to inner products
● Let ¸p be the p-th eigenvalue of the ¿(D
G) matrix, and vi
p
be the i-th component of the p-th eigenvector. Then the p-th dimension of the i-th data point is
∑i j Aij2
pvpi
13Jonas Schwertfeger, CS296-3, Brown University Isomap
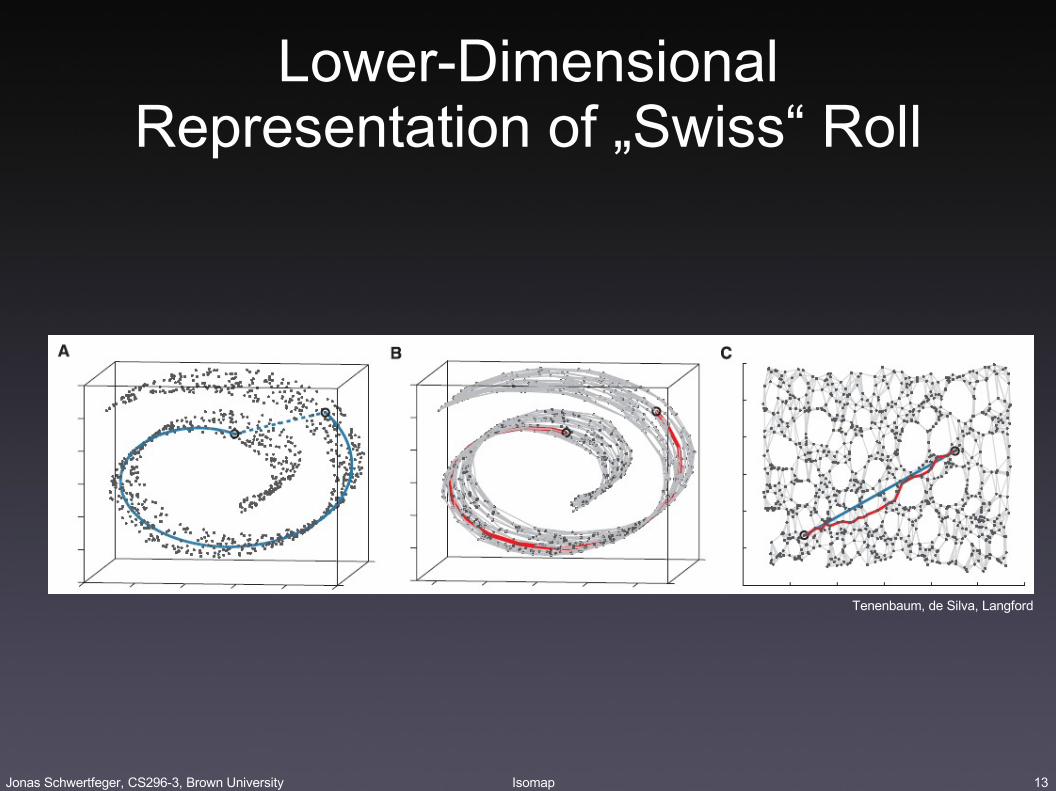
Lower-Dimensional Representation of „Swiss“ Roll
Tenenbaum, de Silva, Langford
14Jonas Schwertfeger, CS296-3, Brown University Isomap
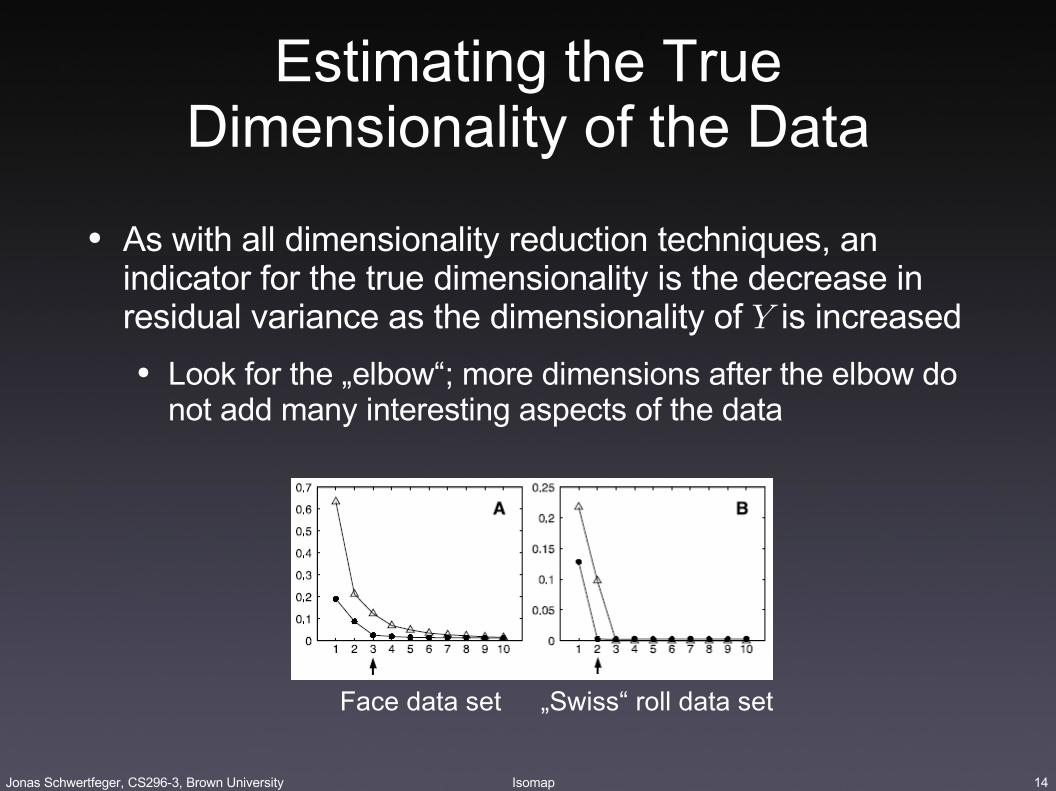
Estimating the True Dimensionality of the Data
● As with all dimensionality reduction techniques, an indicator for the true dimensionality is the decrease in residual variance as the dimensionality of Y is increased
● Look for the „elbow“; more dimensions after the elbow do not add many interesting aspects of the data
Face data set „Swiss“ roll data set
15Jonas Schwertfeger, CS296-3, Brown University Isomap
How Good is Isomap?
● Works with nonlinear data
● Globally optimal even if input space is highly folded
● Guaranteed to asymptotically recover true lower-dimensional representation
● Stability depends heavily on parametersεand K (see next slide)
● Need enough data points, o.w. geodesic distance approximation is inaccurate
Advantages: Disadvantages:
16Jonas Schwertfeger, CS296-3, Brown University Isomap
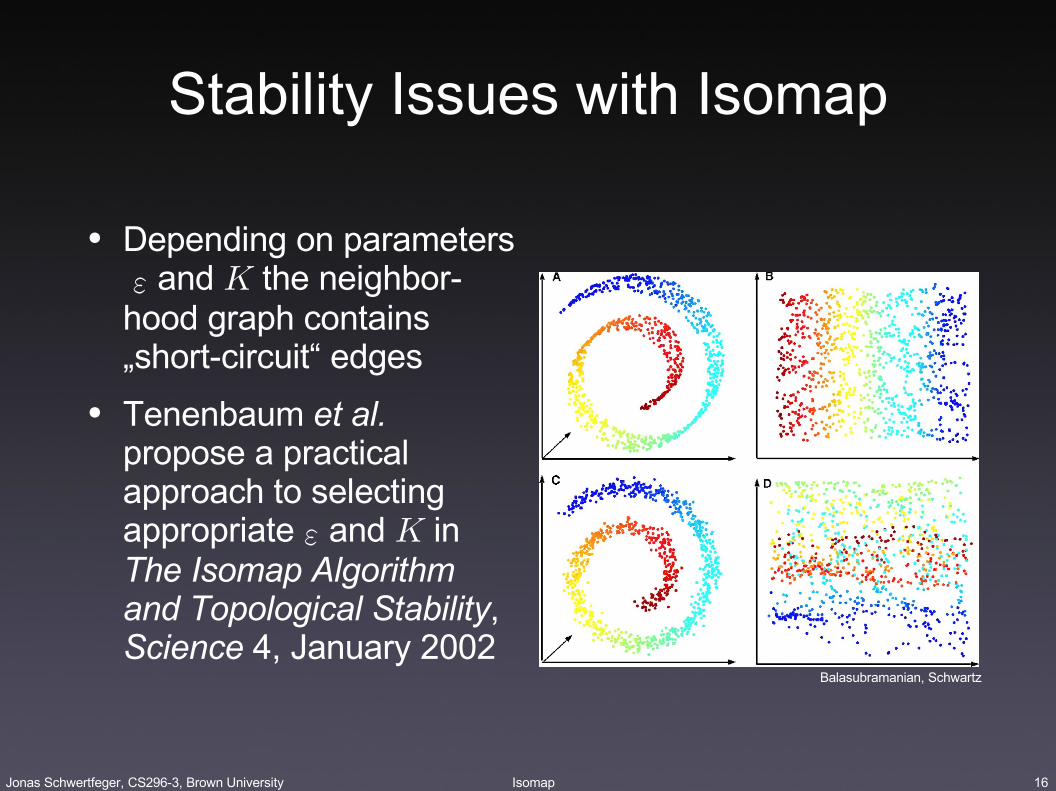
Stability Issues with Isomap
● Depending on parameters εand K the neighbor-hood graph contains „short-circuit“ edges
● Tenenbaum et al. propose a practical approach to selecting appropriateεand K in The Isomap Algorithm and Topological Stability, Science 4, January 2002
Balasubramanian, Schwartz
17Jonas Schwertfeger, CS296-3, Brown University Isomap
Conclusions
● Dimensionality reduction helps
● compress data● select features in high-dimensional data● allows visualization of high-dimensional data
● Distinction between linear and nonlinear methods is important
● Isomap is a popular nonlinear DR technique
● Computes geodesic distances between data points on manifold and runs Multi-Dimensional Scaling on them

18Jonas Schwertfeger, CS296-3, Brown University Isomap
Relevance for CS296-3
● We deal with nonlinear high-dimensional data (camera images, other robot sensors, control commands from users)
● Can we apply Isomap for DR?
● Problems of applying Isomap (?)
● Isomap is not online, it reduces a set of collected data points in batch mode; what if new point is collected? Can we map that Rn point to Rd without running batch Isomap again?