a link mining algorithm for earnings forecast and trading
TRANSCRIPT

Data Min Knowl Disc (2009) 18:419–445DOI 10.1007/s10618-008-0124-z
A link mining algorithm for earnings forecastand trading
Germán Creamer · Sal Stolfo
Received: 7 March 2007 / Accepted: 17 November 2008 / Published online: 18 December 2008Springer Science+Business Media, LLC 2008
Abstract The objective of this paper is to present and discuss a link miningalgorithm called CorpInterlock and its application to the financial domain. This algo-rithm selects the largest strongly connected component of a social network and ranksits vertices using several indicators of distance and centrality. These indicators aremerged with other relevant indicators in order to forecast new variables using a boost-ing algorithm. We applied the algorithm CorpInterlock to integrate the metrics of anextended corporate interlock (social network of directors and financial analysts) withcorporate fundamental variables and analysts’ predictions (consensus). CorpInterlockused these metrics to forecast the trend of the cumulative abnormal return and earn-ings surprise of S&P 500 companies. The rationality behind this approach is that thecorporate interlock has a direct effect on future earnings and returns because thesevariables affect directors and managers’ compensation. The financial analysts engagein what the agency theory calls the “earnings game”: Managers want to meet thefinancial forecasts of the analysts and analysts want to increase their compensation
Responsible editor: Eamonn Keogh.
A preliminary version of this paper was presented at the Link Analysis: Dynamics and Statics of LargeNetworks Workshop on the International Conference on Knowledge Discovery and Data Mining (KDD)2006.
G. Creamer (B) · S. StolfoDepartment of Computer Science, Columbia University, 500 W 120 St, New York, NY 10027, USAe-mail: [email protected]
S. Stolfoe-mail: [email protected]
G. CreamerCentrum Catolica, Pontificia Universidad Católica del Peru, Lima, Perue-mail: [email protected]
123

420 G. Creamer, S. Stolfo
or business of the company that they follow. Following the CorpInterlock algorithm,we calculated a group of well-known social network metrics and integrated with eco-nomic variables using Logitboost. We used the results of the CorpInterlock algorithmto evaluate several trading strategies. We observed an improvement of the Sharperatio (risk-adjustment return) when we used “long only” trading strategies with theextended corporate interlock instead of the basic corporate interlock before the regu-lation Fair Disclosure (FD) was adopted (1998–2001). There was no major differenceamong the trading strategies after 2001. Additionally, the CorpInterlock algorithmimplemented with Logitboost showed a significantly lower test error than when theCorpInterlock algorithm was implemented with logistic regression. We conclude thatthe CorpInterlock algorithm showed to be an effective forecasting algorithm and sup-ported profitable trading strategies.
Keywords Link mining · Social network · Machine learning · Computationalfinance · Trading strategies · Data mining applications
1 Introduction
The application of networks to social science has a long tradition since the semi-nal works of Moreno (1932) and Milgram (1967) about the representation of groupdynamics in a sociogram and the “small world” problem. In Milgram’s experimentletters are passed from acquaintance to acquaintance. As a result, he showed howapparently distant people are connected by a very short chain of acquaintances. Mostof the current literature in social networks is oriented to classify networks, to identifytheir properties, or to develop new cluster algorithms. Less attention has been devotedto use social networks as a forecasting tool. Recently, link mining has emerged as anew area of research that partially fills this gap.
Link mining1 is a set of techniques that uses different types of networks and theirindicators to forecast or to model a linked domain. Link mining has had severalapplications (Senator 2005) to different areas such as money laundering (Kirklandet al. 1999), telephone fraud detection (Fawcett and Provost 1999), crime detection(Sparrow 1991), and surveillance of the NASDAQ and other markets (Kirkland et al.1999; Goldberg et al. 2003). One of the most important business applications of linkmining is in the area of viral marketing or network-based marketing. Following thistrend, Domingos and Richardson (2001) simulate markets as Markov random fieldswhere customer value depends of the profitability of each customer according toits buying decisions and its capacity to influence other customers. Richardson andDomingos (2006) apply this latter work to knowledge-sharing sites. Leskovec et al.(2006) show, using a stochastic viral marketing model, that the effectiveness of recom-mendations of highly connected persons decline as the number of recommendationsare larger than a certain threshold. However, very limited research has been done com-bining social network indicators with other relevant indicators. An innovative paperin the area of direct marketing is Hill et al. (2006) which has combined link mining
1 For a recent survey see Getoor and Diehl (2005).
123
A link mining algorithm 421
indicators with demographic and consumer-specific attributes to evaluate the responserate2 of prospects associated to existent customers of a telecommunications company.In this paper we propose a link mining algorithm called CorpInterlock that mergessocial network indicators with any other relevant indicators to forecasting a variablethat is mostly associated with the social network. We apply this algorithm for finan-cial forecasting using social networks of corporate directors and financial analysts,however it can be applied to other related areas such as direct marketing.
We refer to the social network among directors as the basic corporate interlock, andthe social network among directors and analysts as the extended corporate interlock.We use the definition of cumulative abnormal return (CAR) as the return of a specificasset less the average return of all assets in its risk-level portfolio for each trading date,and earnings surprise or forecast error (FE) as the difference between the forecast offinancial analysts and the actual earnings at the end of the period of evaluation (seeAppendix 1). The implementation of our algorithm specifically forecast CAR and FEusing indicators of the basic and extended corporate interlock and a group of well-known investment variables presented in the appendix 1. From our perspective, we donot know of any previous research that has used social network indicators combinedwith economic determinants to forecast CAR and FE. We think that if the corporateinterlock plays such an important role in corporate governance, it may also have animpact to forecast CAR and FE.
The reason that we study the extended social network of directors and analystsis because their relationship is part of what is called the principal agent problem infinance literature. The principal agent problem stems from the tension between theinterests of the investors in increasing the value of the company (principals) and thepersonal interests of the managers (agents). This conflict of interest is evident in manyof the recent bankruptcy scandals in publicly held US companies such as Enron andWorldCom, and has also led to the so-called “earnings game”. CEOs’ compensationdepends on their stock options. So, top managers concentrate on the managementof earnings and surprises. Wall Street companies want to keep selling stocks. Thus,analysts try to maintain positive reviews of the companies.3 Once a prediction is pub-lished, CEOs do whatever is necessary to reach that prediction or boost the resultsabove analysts’ prediction. CEOs play this game, even though a company may losevalue in the long-term. Hence, the extended corporate interlock could help to transferinformation between directors and analysts and also may bring more information toforecast earnings surprise than a basic corporate interlock. Additionally, we expectthat statistics of an extended corporate interlock could be able to predict return orearnings surprises better than cumulative abnormal return because of the informalcommunications among directors and analysts that may explain earnings surprises.This methodology could also be applied to a larger class of measures as long as thesocial network used is relevant to the selected indicator. For instance, a labor economist
2 Response rate is the number of solicitations that prospects respond in relation to the total number ofsolicitations.3 This situation is changing because of the regulations introduced by the regulation FD and the Sarbanes-Oxley Act of 2002.
123

422 G. Creamer, S. Stolfo
may use a social network that includes board of directors members and workers leadersin order to evaluate labor productivity or quality of workers benefits.
The rest of the paper is organized as follows: Sect. 2 describes the “small world”model and the corporate interlock; Sect. 3 introduces the finance literature on earn-ings surprise; Sect. 4 presents the methods used to forecast the stock market: a linkmining algorithm, and boosting; Sect. 5 explains in detail our forecasting and tradingstrategies; Sect. 6 presents the results of our forecast; Sect. 7 discusses the results,and Sect. 8 presents the conclusions. The appendix 1 introduces the main investmentindicators used in this research.
2 Corporate interlock
Watts (1999), Watts and Strogatz (1998), Newman et al. (2001) and Newman et al.(2002) have formalized and extended the “small world” model. The relevant aspectof the “small world” model is that it is possible to characterize an undirected graphG(V, E) by its structural indicators where V = v1, v2,..., vn is the set of vertices, Eis the set of edges, and ei j is the edge between vertices vi and v j :
– Clustering coefficient: C.= 1
n
∑ni=1 CCi , where:
• CCi.= 2|{ei j }|
deg(vi )(deg(vi )−1): v j ∈ Ni , ei j ∈ E . Each vertex vi has a neighborhood
N defined by its immediately connected neighbors: Ni = {v j } : ei j ∈ E .• deg(vi ) is the degree centrality or degree of a vertex vi : deg(vi )
.= ∑j ai j
• ai j is an element of the adjacent matrix A of G• k is the average degree of the vertices• n is the number of vertices in G
– Mean of characteristic path lengths between its vertices: L.= 1
n
∑j di j , where
di j ∈ D and D is the geodesic distance matrix (matrix of all shortest path betweenevery pair of vertices) of G.
In the case of a random network, these structural indicators are Lrandom ≈ ln(n)ln(k)
and Crandom ≈ kn .
Using the above indicators, the four properties that characterize a “small world”network are:
I n is fixed and numerically large n � 1.II k is fixed so that G is sparse (k � n), and with a minimum number of potential
structures (k � 1).III G is decentralized. So, there is not a single dominant vertex: kmax � n where
kmax is the maximal degree.IV G must be strongly connected.
C works as a measure of order in G, where if C � k/n, then G is considered locallyordered, while random graphs are not ordered and therefore Crandom is very small asthe above property II (k � n) implies. If a graph is locally ordered or highly clus-tered, then it should have long characteristic path lengths in order to communicate itsdifferent clusters. Obviously, a random graph is not ordered, therefore Crandom � C ,
123

A link mining algorithm 423
and L ≈ Lrandom . As a result, a simple way to evaluate the “small world” propertiesof a network is if the “small world” ratio (SW
.= CL · Lrandom
Crandom) is much larger than one.
Other additional indicators of social networks that we have used in this study are:
1. Closeness centrality (normalized): Cc(vi ).= n−1∑
j di j, where di j is an element of
the geodesic distance matrix D (Freeman 1979; Borgatti and Everett 2006).2. Betweenness centrality Bc(vi )
.= ∑i∑
jgki jgk j
. This is the proportion of all geode-sic distances of all other vertices that include vertex vi where gki j is the numberof geodesic paths between vertices k and j that include vertex i, and gkj is thenumber of geodesic paths between k and j (Freeman 1979).
3. Normalized clustering coefficient: CC ′i
.= deg(vi )Max Deg CCi , where MaxDeg is the
maximum degree of vertex in a network (de Nooy et al. 2005).
Several networks in the social and natural sciences have been identified to havethe properties of a “small world” (Watts and Strogatz 1998; Barabasi 2002). We areparticularly interested in those organizational studies about the corporate interlock orthe social network of directors. Davis et al. (2003) have found that the basic corpo-rate interlock of the major US corporations (those in the Fortune 500 list) between1982 and 1999 has the characteristics of a “small world” as described above. A “smallworld” in the case of the corporate interlock implies that the average distance betweenfirms, between directors, and (if applicable) between analysts is very short. Daviset al. (2003) also find that the basic corporate interlock is highly stable, even aftermajor changes in corporate governance. Mintz and Schwartz (1985), following Mills(1956), study how commercial banks have a central position in the corporate interlockbecause of the participation of the major leaders of US non-financial corporations onthe banks’ boards. The original thesis of Mills (1956) is that a small group of businessleaders, interconnected by being part of the same boards of directors, is able to coor-dinate policies, share practices, and finally control the major corporations. One of thecontributions of the “small world” literature in this area is to understand that this con-nection in the corporate elite is based on the direct link among different actors such asdirectors, and is not necessarily based on the banking sector or does not require a highlevel of ownership concentration.4 As we demonstrate in this paper, the “small world”phenomenon is observed in the basic and extended corporate interlock. Hence, thestrength of these corporate interlocks might be the result of the interaction of differentindividuals that interact among several firms and boards, and not the result of a smallcentral group that tries to control the society.
The use of the corporate interlock to understand and solve finance problems is justbecoming more relevant. Larcker et al. (2005) have found that the distance betweeninside and outside directors, excluding the links when directors are part of the sameboard, affect CEO’s compensation. The interesting aspect of this latter paper is thatthe authors control for standard economic determinants besides the organizationalvariables. Cohen et al. (2008) have observed that sell-side equity analysts outper-form on their recommendations when there is an educational link to senior officers
4 For a dynamic demonstration of the network of directors of the largest American companies see 〈http://www.theyRule.net/〉.
123

424 G. Creamer, S. Stolfo
of companies that they follow. Very few previous papers have studied the economiceffects of corporate interlocks such as their effect on the decision process of: 1. makingpolitical contributions (Mizruchi 1992), 2. poison pills (Davis 1991), and 3. switchingfrom NASDAQ to NYSE (Rao et al. 2000).
We expect that the literature of finance may significantly enrich if the corporateinterlock dimension is included into the analysis. Most of the current studies in corpo-rate finance treat the board of directors of every firm independent of the rest. However,the above evidence as well as the one presented in this paper indicates that board ofdirectors are highly linked among themselves and among other networks such as thenetwork of financial analysts. An interesting line of research for board of directors isthe valuation of their members according to their connectiveness with other companies.Members highly connected may bring additional businesses or relevant informationthat may improve company performance. In the case of companies that depend ofgovernment contracts, financial analysts might be very interested to take into accountthe connections among directors and senior government officers that may facilitate theaccess to future contracts. Likewise, companies that desire to have a global presence,may have a different level of valuation according to the participation of its directorsinto international business.
3 Earnings surprise
A very well-known phenomenon studied in the accounting and behavioral financeliterature is the earnings surprise effect. Earnings surprise or forecast error refers tothe difference between financial analysts’ predictions and the actual earnings reportedby companies. The earnings surprise effect emphasizes how the market reacts moreto negative surprises than to positive surprises. Therefore, investors and fund manag-ers have developed many trading strategies around the earnings announcement periodand invest significant resources trying to predict earnings surprises. An importantsource of information for investors are the predictions of more than 3,000 analystscollated in huge databases created by several companies such as IBES InternationalInc., Zacks Investment Research, and First Call Corporation. These provide investorswith a “consensus”, or simple average of the market analysts’ predictions, which theyuse to estimate what the market will do.
Other researchers use analysts’ predictions for such forecasts, allowing them tomake early investment decisions before quarterly announcements. The method theyuse is linear regression analysis using variables such as the characteristics of compa-nies, and analysts. These studies suggested that analysts’ forecasts may have predictivevalue (Ou and Penman 1989; Stober 1992; Bernard and Thomas 1990; Mendenhall1991; Abarnabell and Bernard 1992; Peters 1993a,b). Brown et al. (1996) standardizeda method to calculate the earnings surprise with an indicator that they call “earningssurprise predictor”. This “earnings surprise predictor” outperforms the market usinga portfolio of S&P 500 companies during the period 1985–1994.5 We believe thatrecent developments in the area of machine learning and link mining can contribute to
5 For a detailed list of references about the academic use of analysts’ predictions see Brown (2000).
123

A link mining algorithm 425
this debate, and especially formalize the study of patterns of behavior for trading andfinancial forecasting as proposed by the behavioral finance approach. This approachsustains that markets are inefficients and move on individual biases or behavioral pat-terns (Thaler 2005). In this paper we propose a link mining algorithm that improvesthe earnings and return predictions combining well-known corporate variables withmetrics of a social network of directors and analysts. The association among directorsand financial analysts may allow companies to adjust earnings to the forecast of finan-cial analysts. However, this relationship is not easily captured by linear regressionanalysis. Link mining algorithms may explain the relationship among organizationaland economic variables, and therefore improve stock price prediction.
Earlier studies on analysts and earnings surprise show at least two types of majorvariables that are typical of these studies. First, researchers have quantified companies’characteristics or actions, since companies’ changes have been shown to relate to ana-lysts’ recommendations (Stickel 1995).6 Secondly, there are variables which quantifyanalysts’ predictions, such as the quality of their recommendation (Womack 1996;Elton et al. 1986; Barber et al. 2001); the accuracy of their past predictions (Brown2001); the revisions they make (Peterson and Peterson 1995); the company variablesthey use (Finger and Landsman 1999; Stickel 1995; Krische and Lee 2000); the careermoves of analysts (Hong and Kubik 2003); the timing of analyst’s predictions;7 theherding behavior of analysts (Clement and Tse 2005); and the information content ofanalysts’ reports (Asquith et al. 2005).
Several studies have evaluated investment strategies that follow consensusrecommendations of analysts. A particularly sophisticated model was developed bythe company Starmine, which ranks analysts and makes its predictions “Smart esti-mate” using the forecasts of the most highly ranked analysts. Barber et al. (2001) findthat after taking transaction costs into account, the high-trading level of strategies thatfollow consensus recommendations of analysts do not give a consistent return greaterthan zero. A similar result is obtained by Mikhail et al. (2002) even after taking into ac-count analysts’ prior performance. They recommend that those investors that still wantto follow analysts’ recommendations may benefit if they use the forecasts of highlyranked analysts with at least 5 years of superior performance in rankings surveys suchas those collected by The Wall Street Journal. Jegadeesh et al. (2004) reported thatanalysts from sell-side firms recommend mostly “glamour stocks” (characterized bypositive momentum, high growth, high volume, and relatively high prices); however,investors that blindly follow a strategy that invests in these recommended stocks maynot obtain positive returns because investment in these stocks also requires favorablequantitative indicators (i.e. high value and positive momentum).8
6 Beckers et al. (2004) find that after the European integration in 1992, country differences is not a relevantfactor to explain earnings forecasts differences between analysts, however sector is still an important factor.7 Ivkovic and Jegadeesh (2004) find that the information content of upward earnings forecast revisions andrecommendation upgrades increase near the earnings announcement date, while they are less informativein the week that follows this date. This situation is not observed for recommendation downgrades anddownward revisions.8 Abarbanell (1991) finds that analyst’s forecasts do not completely integrate the information of past priceschanges; additionally, Abarnabell and Bernard (1992) find that the under-reaction of analysts to recentearnings is only a partial explanation for the under-reaction of stock prices to earnings.
123

426 G. Creamer, S. Stolfo
4 Methods
4.1 Boosting
Adaboost is a machine learning algorithm invented by Freund and Schapire (1997)that classify its outputs applying a simple learning algorithm (weak learner) to sev-eral iterations of the training set where the misclassified observations receive moreweight. Freund and Mason (1999) proposed a decision tree learning algorithm calledan alternating decision tree (ADT). In this algorithm, boosting is used to obtain thedecision rules and to combine them using a weighted majority vote.
Friedman et al. (2000), followed by Collins et al. (2004) suggested a modificationof Adaboost, called Logitboost. Logitboost can be interpreted as an algorithm forstep-wise logistic regression. This modified version of Adaboost—known as Logit-boost—assumes that the labels yi ′s were stochastically generated as a function of thex ′
i s. Then it includes Ft−1(xi ) in the logistic function to calculate the probability of yi ,and the exponent of the logistic function becomes the weight of the training examples.Figure 1 describes Logitboost.
4.2 CorpInterlock: a link mining algorithm
In this paper we propose a link mining algorithm called CorpInterlock (see Fig. 2).This algorithm transforms a bipartite graph into a one-mode graph, selects the largeststrongly connected component of a social network and ranks its vertices using severalindicators of distance and centrality. These indicators are merged with other relevantindicators in order to forecast new variables using a machine learning algorithm.
The algorithm also calculates the “small world” ratio. Even though this ratio isnot used as an input in the forecast and there is not a recommended level requiredfor the CorpInterlock algorithm, this indicator is very useful to understand the natureof the corporate interlock. In our current application to finance problems, the “smallworld” property of a network may explain how information is transmitted. Step 3 ofthe CorpInterlock algorithm (Fig. 2) satisfies the requirement that a “small world” net-work must be strongly connected, and the weakly connected requirement of closenesscentrality. Step 4 calculates the adjacency matrix A and geodesic distance matrix Dused as inputs of the social network indicators and the “small world” ratio calculatedin step 6.
Fig. 1 The Logitboostalgorithm (Friedman et al.2000). yi is the binary label to bepredicted, xi corresponds to thefeatures of an instance i, wt
i isthe weight of instance i at timet, ht and Ft (x) are the predictionrule and the prediction score attime t respectively
123

A link mining algorithm 427
Fig. 2 The CorpInterlock algorithm
4.2.1 Application to forecasting earnings surprise
We used the CorpInterlock link mining algorithm (see Fig. 2) to build a bipartite socialnetwork where the nodes of the partition V12 representing the directors and analystsare connected to nodes of the partition V11 representing companies that they direct orcover. This social network is converted into a one-mode network where the verticesare the companies and the edges are the number of directors and analysts that everypair of companies have in common. This is the extended corporate interlock. Thebasic corporate interlock is calculated in the same way using only directors. The algo-rithm merges a group of investment variables presented in the appendix 1 and a groupof social network statistics obtained from the basic or extended corporate interlock.Finally, the algorithm predicts FE and CAR using a machine learning algorithm suchas boosting.
We consider that this financial application of the CorpInterlock algorithm is appro-priate because the increasing importance of organizational and corporate governanceissues in the stock market requires the extraction of indicators from the extended andbasic corporate interlock and integration with more traditional economic indicatorsin order to forecast CAR and FE. The indicators calculated by the CorpInterlockalgorithm captures the power relationship among directors and financial analysts asfollows:
1. Degree centrality directors and analysts of a company characterized by a highdegree or degree centrality coefficient are connected among them through severalcompanies.
123

428 G. Creamer, S. Stolfo
2. Closeness centrality directors and analysts of a company characterized by a highcloseness centrality coefficient are connected among them through several com-panies that are linked through short paths.
3. Betweenness centrality directors and analysts of a reference company charac-terized by a high betweenness centrality coefficient are connected among themthrough several companies. Additionally, the reference company mentioned abovehas a central role because it lies between several other companies, and no othercompany lies between this reference company and the rest of the companies.
4. Clustering coefficient directors and analysts of a company characterized by a highclustering coefficient are probably as connected among them as it is possiblethrough several companies.
Each of the above measures show a different perspective of the connection betweendirectors and analysts as described in the “earnings game” where the earnings forecastof analysts are aligned with management’s expectations. Hence, we can include themin a decision system to forecast FE and CAR.
CorpInterlock can be implemented with any efficient machine learning algorithmthat is appropriate for the problem under study. However, the importance of featuresused to predict earnings surprises, and cumulative abnormal returns may change sig-nificantly in different periods of time. As we do not know in advance what the mostimportant features are and because of its feature selection capability, its error boundproofs (Freund and Schapire 1997), its interpretability, and its capacity to combineeconomic and organizational variables to optimize the earnings surprise and cumula-tive abnormal return prediction we decided to use boosting, specifically Logitboost,as our learning algorithm. Additionally, Creamer and Freund (2004, 2005, 2007) havealready applied boosting to forecast equity prices and corporate performance and ourtests showed that Logitboost performs significantly better than logistic regression, ourbaseline algorithm.
Dhar and Chou (2001) have already compared the predictive accuracy of tree-induction algorithms, neural networks, naive Bayesian learning, and genetic algo-rithms to classify the earnings surprise before announcement. They used a defi-nition of earnings surprise or forecast error that we have also adopted in thisresearch:
F E.= CONSENSUSq − EPSq
|CONSENSUSq | + |EPSq |where CONSENSUSq is the mean of earnings estimate by financial analysts for quar-ter q, and EPSq is the actual earnings per share for quarter q. FE is a normalizedvariable with values between −1 and 1. Additionally, when CONSENSUSq is closeto zero and EPSq is not, then the denominator will not be close to zero.
4.2.2 Other applications: viral marketing
The CorpInterlock algorithm could also be used in other domains where socialnetwork indicators are part of the inputs used in the prediction. A good exampleexplored by Hill et al. (2006) comes from direct marketing. Corporations that use
123

A link mining algorithm 429
direct marketing intensively have large databases of their current customers, and theyspend a significant amount of time and money trying to reach new customers. How-ever, the response rate of prospects is extremely low considering that the best prospectsreceive a significant number of weekly offers from many different companies. There isthe possibility that this response rate may increase when prospects are related to exis-tent loyal customers. In our future research, we could use the CorpInterlock algorithmto test the following hypotheses: demographic, and marketing indicators combinedwith the indicators of a social network of existent customers and prospects that live inthe same household may improve the selection of prospects that show a higher rate ofresponse in relation to a network that does not include existent customers.
5 Experiments
We restricted our experiments to companies that are part of the US stock market. Weobtained the price and return series from the Center for Research in Security Prices(CRSP), the accounting variables from COMPUSTAT,9 the list of financial analystsand earnings forecast or consensus from IBES, and the list of directors from the Inves-tor Responsibility Research Center. The list of directors exists only on an annual basisfor the period 1996–2005. This restricts our analysis to this period. The number ofcompanies under study changes every year. The minimum and maximum number ofcompanies included in our study are 3,043 for 2005 and 4,215 for 1998.
We applied the CorpInterlock algorithm described in Fig. 2 using the softwaresEMT (Stolfo et al. 2006) and Pajek (de Nooy et al. 2005) to obtain the basic andextended corporate interlock. We computed the investment signals and a group ofthe social network statistics introduced in Sect. 1 [average distance, betweennesscentrality, closeness centrality, degree centralization, degree, and clustering coeffi-cient (normalized and unnormalized)] of the basic and extended corporate interlock.We merged our accounting information, analysts’ predictions (consensus) and socialnetworks statistics using quarterly data, and selected the last quarter available forevery year. Most of the fundamental and accounting variables used are well-knownin finance literature and Jegadeesh et al. (2004) demonstrated that these variables aregood predictors of cross-sectional returns (see the appendix 1 for an explanation ofthe variables used). We forecasted two different trends: FE and CAR. In both cases,we labeled an instance as 1 if the trend was positive and −1 otherwise. We calculatedthe label of CAR using the cumulative abnormal return of the month following theearnings announcement. CAR is calculated as the return of a specific asset less thevalue weighted average return of all assets in its risk-level portfolio according to CRSP.We computed FE using the predictions of the analysts available 20 days before theearnings announcement as fund managers may suggest (Dhar and Chou 2001). Fundmanagers take a position, short or long,10 a certain number of days before the earningsannouncement and, according to their strategy, they will liquidate the position a givennumber of days after the earnings announcement. If fund managers know the trend of
9 COMPUSTAT is an accounting database managed by Standard & Poor’s.10 Long or short positions refer to buy a specific asset or to sell a borrowed asset based on the expectationthat price of the asset will increase or decrease respectively.
123

430 G. Creamer, S. Stolfo
FE or CAR, they make take a position according to their expectations; however theydo not need to know exactly what the future stock price is going to be. They profitwhen the market moves in the direction expected, and above a certain threshold, eventhough the market movement might not be in the exact amount forecasted. For thisreason, the emphasis of this paper is in the improvement of the prediction of the trendof FE and CAR–and not in their value–with the inclusion of the extended corporateinterlock information.
We implemented the CorpInterlock algorithm using Logitboost. To evaluate thedifficulty of the classification task, we compared our method with random forests(Breiman 2001), and logistic regression (Cessie and Houwelingen 1992). The latteralgorithm was our baseline method. We implemented ADTs and Logitboost with 50iterations, and random forests with 100 trees and five features11 using the Weka pack-age (Witten and Frank 2005). We generated eight training models for each learningalgorithm on a growing window, each one for every year from 1997 to 2004. Our firstdata set is from 1997 so that it has the accumulated data of 1996 and 1997. Everyyear we tested our training model with two test samples of the following year from1998 to 2005. As a result we have 16 test samples that we can use to evaluate how ouralgorithm and our trading strategies perform with samples of different time periods.The test errors that we obtained were the result of averaging the results of running ourmodels with all variables over the 16 sets.
As we are including all the companies that are part of the US stock market forevery year, if a company is listed during our period of evaluation it becomes part ofour sample. Likewise, if a company is delisted during our period of evaluation, thenthis company is not anymore part of our sample. Therefore, we avoided the very com-mon survivorship bias. We eliminated companies that did not have earnings or CARinformation.
We ran linear regressions using FE and CAR as dependent variables, and evaluatedthe importance of the variables listed in the appendix 1 for the model. We tested ourmodel for heteroscedasticity and multicollinearity using the test of Breusch and Pagan(1979), and the variance inflation factor (VIF) (Davis et al. 1986) respectively. We didnot find heteroscedasticity or multicollinearity in our sample. In any case, if there wasany multicollinearity, it was overcome by boosting’s feature selection capability.12
We also tested several trading strategies assuming that traders will take a positionbased on the results of our forecast and will liquidate their positions a month after eachearnings announcement. These trading positions are taken only in the last quarter ofthe year because the data of our social network indicators is annual. We did not takeinto account transaction costs considering that they are very low because there is onlya major buy–sell transaction per year, and all our strategies are affected by the samecosts. So, there is no difference in relative terms. The trading positions that we simu-late have the opposite sign of the Logitboost prediction for FE. In cases that we predicta positive FE, we take a short position and vice versa. The reason for this policy is
11 We implemented random forests with five features in order to optimize its performance.12 The regression is heteroscedastic if the variance of the residuals is not constant across observations. Mul-ticollinearity is the presence of correlation among dependent variables. For a more detailed presentationsee Greene (2007).
123
A link mining algorithm 431
that the numerator of FE is the difference between the consensus of financial analystsand actual EPS for each quarter. Hence, a positive FE indicates that financial analystsoverestimate EPS. As a result, a short position might be profitable and vice versa.We restricted our analysis to trading strategies using FE because our tests presentedbelow showed that the prediction of FE by the CorpInterlock algorithm outperformedthe prediction of CAR. The trading strategies that we test are the following:
I Take only long positions for negative FE.II Take long and short positions for negative and positive FE respectively.
III Take long and short positions for negative and positive FE respectively only forthe most precise decile.
IV Take only long positions for negative FE when analysts predict that earnings willbe larger than consensus.
We evaluated the results of the trading strategies using the Sharpe ratio. The Sharperatio is a risk adjusted return indicator calculated as the mean of cumulative abnormalreturn divided by its standard deviation.
We expect that the “long only” strategies (I and IV) perform better than the “long/short” strategies (II and III) because the former strategies are based on the directionof the social networks indicators. If these indicators are not very strong, it does notnecessarily mean that the stock will not perform well. Trading strategy III assumesthat to take a trading position, signals should be above a certain threshold or actionsshould be taken only based on the most precise forecasts regardless of the sign of theprediction. Trading strategy IV limits the “long only” strategy to those cases whereanalysts anticipate that earnings will be larger than consensus. This last strategy rein-forces the positive selection of analysts with the forecast capability of our algorithm.The shortcoming with these last two strategies is that the number of observations mightbe reduced substantially affecting the Sharpe ratio.
We split the presentation of our results before and after 2001 because in October 23,2000, the SEC issued regulation Fair Disclosure (FD). This regulation requires thatcompanies disseminate material information evenly, without giving any preferences toany investor or analyst. Critics of this regulation indicated that market volatility mayincrease and the volume of information disseminated in the market will be reduced.However, Lee et al. (2004) neither find any significant increase in volatility, nor anincrease in certain components of the bid-ask spread around new releases as a resultof regulation FD. During the year 2001 there were also a significant numbers of IPOs,mergers, and acquisitions that were affected by the presence of analysts; it was also thelast “bullish” year of the internet “bubble”, and also after this year the market becamemore regulated.
6 Results
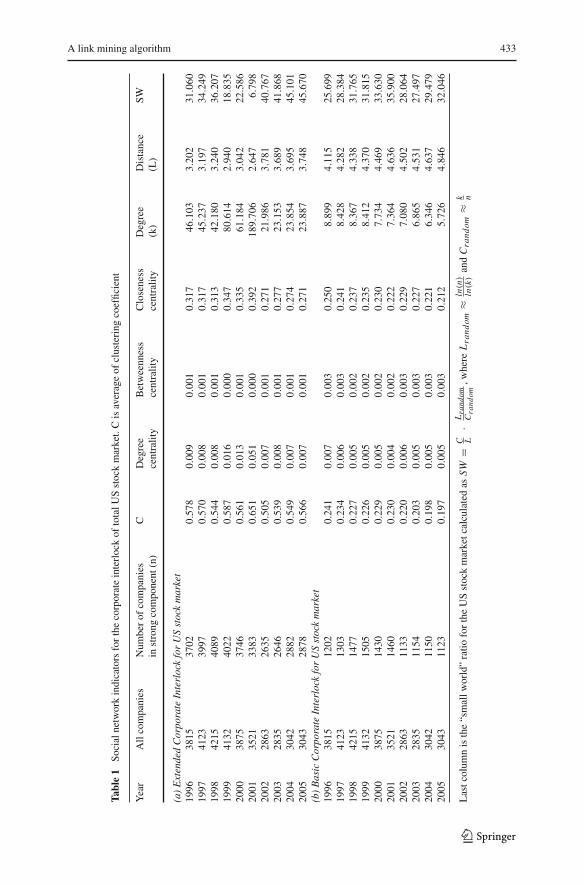
The “small world” ratio for the basic and extended corporate interlock is much largerthan one according to Table 1. Hence, both corporate interlocks are clearly consideredto be of the “small world” type as Davis et al. (2003) found for the Fortune 500 com-panies. Even though we did not use the “small world” ratio as a predictor, the above
123
432 G. Creamer, S. Stolfo
results confirm that directors and analysts belong to a “small world” network charac-terized by the connection among its members by a very short chain of acquaintances.As the “small world” properties of the extended corporate interlock are stronger thanthose observed in the basic corporate interlock, we think that the strength of thesecorporate interlocks might be the result of the relationships of different individualsthat interact among several firms and boards, and not the result of a small central groupthat tries to control the society as was proposed by Mills (1956).
We also find that the average distance among boards is stable during a 10 yearsperiod, although the increase from 4.1◦ to 4.85◦ is slightly larger than the one observedby Davis et al. (2003) during the eighties and nineties. The extended corporate inter-lock shows a similar increase in the average distance from 3.2◦ to 3.75◦. The indicatorthat shows a major change is the average degree of the extended corporate interlockwhich decreases about 50% between the periods 1996–2000 and 2002–2005. Duringthe year 2001, there is a major jump of this indicator which might be explained by theimportance of analysts in the last period of the internet bubble. In May 10, 2002 theSecurities and Exchange Commission (SEC) approved the rule 2711 “Research Ana-lysts and Research Reports” issued by the National Association of Securities Dealers(NASD), and the rule 472 “Communications with the Public” issued by the New YorkStock Exchange (NYSE). These rules establish that no research analyst might be con-trolled by a firm’s investment banking department. It also shows that the company thatis subject of the report can review the report only for factual accuracy checks. Thisadditional regulations may explain the significant reduction of average degree in theperiod 2002–2005.
The implementation of CorpInterlock using Logitboost with all variables showsa significantly lower test error than its implementation using logistic regression, ourbaseline algorithm, and Adaboost. The Logitboost implementation shows similar testerrors than the implementation of CorpInterlock using random forests. Additionally,the test errors for the prediction of FE are much lower than those observed for the pre-diction of CAR (see Table 2). Based on these results, we decided to limit our analysisto the implementation of the CorpInterlock algorithm with Logitboost to predict FE.
The regression analysis for the prediction of FE (Table 5) shows a higher adjustedR-square (0.43) for the extended corporate interlock in relation to the basic corporateinterlock (0.37) during the period 1996–2001. This advantage disappear or is reversedduring the period 2002–2005. In all cases, the p-value of the F-statistics is highly sig-nificant indicating that the model has explanatory power. Additionally, Fig. 3 showsthat the plot of the majority of residuals against forecasts for the extended corporateinterlock using all variables during the period 1996–2001 follows a horizontal line inthe graph indicating equality of variance or homoscedasticity. A similar behavior isobserved in the rest of the cases.
The most important variables in the prediction of FE using the extended corporateinterlock are lagged cumulative abnormal return for the preceding 6 months (CAR1)and for the second preceding 6 months (CAR2), total accruals to total assets (TA),size, the lagged of the number of analysts predicting that earnings surprise increase(ANFORLAG), the lagged value of FE (FELAG), consensus, betweenness centrality,
123
A link mining algorithm 433
Tabl
e1
Soci
alne
twor
kin
dica
tors
for
the
corp
orat
ein
terl
ock
ofto
talU
Sst
ock
mar
ket.
Cis
aver
age
ofcl
uste
ring
coef
ficie
nt
Yea
rA
llco
mpa
nies
Num
ber
ofco
mpa
nies
CD
egre
eB
etw
eenn
ess
Clo
sene
ssD
egre
eD
ista
nce
SWin
stro
ngco
mpo
nent
(n)
cent
ralit
yce
ntra
lity
cent
ralit
y(k
)(L
)
(a)
Ext
ende
dC
orpo
rate
Inte
rloc
kfo
rU
Sst
ock
mar
ket
1996
3815
3702
0.57
80.
009
0.00
10.
317
46.1
033.
202
31.0
6019
9741
2339
970.
570
0.00
80.
001
0.31
745
.237
3.19
734
.249
1998
4215
4089
0.54
40.
008
0.00
10.
313
42.1
803.
240
36.2
0719
9941
3240
220.
587
0.01
60.
000
0.34
780
.614
2.94
018
.835
2000
3875
3746
0.56
10.
013
0.00
10.
335
61.1
843.
042
22.5
8620
0135
2133
830.
651
0.05
10.
000
0.39
218
9.70
62.
647
6.79
820
0228
6326
350.
505
0.00
70.
001
0.27
121
.986
3 .78
140
.767
2003
2835
2646
0.53
90.
008
0.00
10.
277
23.1
533.
689
41.8
6820
0430
4228
820.
549
0.00
70.
001
0.27
423
.854
3.69
545
.101
2005
3043
2878
0.56
60.
007
0.00
10.
271
23.8
873.
748
45.6
70(b
)B
asic
Cor
pora
teIn
terl
ock
for
US
stoc
km
arke
t19
9638
1512
020.
241
0.00
70.
003
0.25
08.
899
4.11
525
.699
1997
4123
1303
0.23
40.
006
0.00
30.
241
8.42
84.
282
28.3
8419
9842
1514
770.
227
0.00
50.
002
0.23
78.
367
4.33
831
.765
1999
4132
1505
0.22
60.
005
0.00
20.
235
8.41
24.
370
31.8
1520
0038
7514
300.
229
0.00
50.
002
0.23
07.
734
4.46
933
.630
2001
3521
1460
0.23
00.
004
0.00
20.
222
7.36
44.
636
35.9
0020
0228
6311
330.
220
0.00
60.
003
0.22
97.
080
4.50
228
.064
2003
2835
1154
0.20
30.
005
0.00
30.
227
6.86
54.
531
27.4
9720
0430
4211
500.
198
0.00
50.
003
0.22
16.
346
4.63
729
.479
2005
3043
1123
0.19
70.
005
0.00
30.
212
5.72
64.
846
32.0
46
Las
tcol
umn
isth
e“s
mal
lwor
ld”
ratio
for
the
US
stoc
km
arke
tcal
cula
ted
asS
W=
C L·
Lra
ndom
Cra
ndom
,whe
reL
rand
om≈
ln(n
)ln
(k)
and
Cra
ndom
≈k n
123

434 G. Creamer, S. Stolfo
Table 2 Mean of test errors for learning algorithms by CAR and FE
Total CAR FE
Mean (%) SD (%) Mean (%) SD(%) Mean (%) SD (%)
Logistic regression 39.44** 9.59 48.33 2.92 30.54** 3.88Random forests 33.11 14.66 47.49 2.81 18.73 1.59Adaboost 33.87* 13.92 47.47 2.74 20.27** 2.25Logitboost 33.33 14.58 47.56 2.97 19.09 2.35
*,** Represent significance levels of 1% and 5% respectively for the paired t-test of the difference betweentest errors among each algorithm and Logitboost
−0.5 0.0 0.5
−1.
5−
1.0
−0.
50.
00.
51.
01.
5
Fitted values
Res
idua
ls
Fig. 3 Residuals plotted against FE fitted values for extended corporate interlock using all variables,1996–2001
and closeness centrality.13 Most of the economic variables mentioned above that areassociated with FE are either lagged variables (CAR1, CAR2, and FELAG) or reflectthe peer effect of financial analysts (ANFORLAG and consensus). This is not surpris-ing if we take into account that FE is based on analysts’ expectations. Additionally,according to the “earnings game” companies that have shown earnings surprises inthe past or analysts that have predicted earnings surprise in the past may also havesimilar trends in the future as long as there are still players participating in this game.So, variables that are able to capture expectations of analysts or the peer effect amonganalysts have a higher predictive power than the rest.
The trading strategies based on FE show that the predictions using the extendedcorporate interlock lead to a higher risk-adjusted return (Sharpe ratio) than those usingthe basic corporate interlock or only economic variables (Table 3) during the period1998–2001. This advantage is not maintained during the period 2002–2005 as was
13 These last two variables are only relevant during the period 1996–2001.
123

A link mining algorithm 435
Table 3 Sharpe ratio using Logitboost forecast of FE for US stock market for the following trading strat-egies: long and short portfolio when FE expected is −1 and 1 respectively (panel a); long only when FEexpected is −1 (panel b); long and short portfolio when FE expected is −1 and 1 respectively only for themost exact decile (panel c), and long only when FE expected is −1 and analysts predict earnings largerthan consensus (panel d). Sharpe ratio is calculated as the mean of abnormal returns during a complete yeardivided by its standard deviation. Abnormal returns used for calculation are the mean of monthly abnormalreturns for each year. “Econ. only” stands for Economic variables only; “Extended net” stands for ExtendedCorporate Interlock, and “Basic net” for Basic Corporate Interlock
Econ. only Extended net Basic net
(a) Long/short strategy1998–2001 1.51 1.72 1.602002–2005 2.08 2.07 2.061998–2005 1.74 1.84 1.78(b) Long only strategy1998–2001 1.86 1.87 1.742002–2005 2.05 2.05 2.051998–2005 1.99 1.99 1.91(c) Long/short strategy. Top decile1998–2001 1.01 1.10 0.802002–2005 1.09 0.89 0.951998–2005 1.08 1.01 0.90(d) Long only strategy when analysts predict that earnings are larger than consensus1998–2001 1.22 1.20 1.192002–2005 1.50 1.49 1.481998–2005 1.39 1.37 1.38
also observed in the regression analysis. The “long only” strategy is the most risk-adjusted profitable strategy (Tables 3, 4; panel b). In all cases, the trading strategiesgenerate significant abnormal returns according to the t-statistic (Table 4) and theSharpe ratio is larger during the period 2002–2005. We think that the accumulationof additional years of training improve the trading and forecasting capability of thealgorithm.
When we only use the cases where analysts predict that earnings are larger thanconsensus (Tables 3, 4; panel d), the difference between the Sharpe ratios of differentsets is very small. However, the abnormal return (Table 4) is larger than the return ofthe other trading strategies.
7 Discussion
Our results indicate that the CorpInterlock algorithm leads to profitable trading strate-gies forecasting the FE during all the years under study. This finding can be explainedif we consider that many fund managers or their representatives have influence or evenhave a seat or more in the board of the corporations where they invest. Hence, they canuse their knowledge about the financial health of the companies where they have somepresence to optimize their portfolios. Additionally, institutional investors have accessto their own research team and could maintain certain independence of the analysts’influence. They are able to deeply evaluate the companies in which they are interested
123

436 G. Creamer, S. Stolfo
Table 4 Abnormal return using Logitboost forecast of FE for US stock market for the following tradingstrategies: long and short portfolio when FE expected is −1 and 1 respectively (panel a); long only whenFE expected is −1 (panel b); long and short portfolio when FE expected is −1 and 1 respectively only forthe most exact decile (panel c), and long only when FE expected is −1 and analysts predict earnings largerthan consensus (panel d)
Econ. only (%) Extended net (%) Basic net (%)
(a) Long/short strategy1998–2001 1.17** 1.22** 1.19**2002–2005 1.78** 1.77** 1.78**1998–2005 1.47** 1.49** 1.48**(b) Long only strategy1998–2001 2.90** 2.94** 2.91**2002–2005 2.60** 2.59** 2.60**1998–2005 2.75** 2.77** 2.75**(c) Long/short strategy. Top decile1998–2001 2.79** 2.52* 2.14*2002–2005 2.61* 2.44* 2.45*1998–2005 2.70** 2.48** 2.30**(d) Long only strategy when analysts predict that earnings are larger than consensus1998–2001 3.46** 3.45* 3.21*2002–2005 3.40** 3.36** 3.39**1998–2005 3.43** 3.40** 3.31**
“Econ. only” stands for Economic variables only; “Extended net” stands for Extended Corporate Interlock,and “Basic net” for Basic Corporate Interlock. Returns are monthly∗,∗∗ Represent significance levels of 1% and 5% respectively for the t statistic
in investing. Therefore, they have an understanding of the fundamental valuation of thecompanies where they invest regardless of the day to day market speculation. This factexplains that even though our algorithm is able to improve the forecast of the trend ofFE in relation to logistic regression, our baseline algorithm, the inclusion of the socialnetwork information improves the prediction of FE only in the period 1998–2001.The main explanation is that the period 1998–2001 corresponds to the last part of theinternet “bubble”. During this period, stock prices increased very quickly and the valu-ation multiples such as price-to-earnings ratio of technology companies like YAHOOwere much higher than what a fundamental analysis would indicate. Many individualinvestors were participating in the market, and even small investors left their regularjobs to become full-time day traders. An important source of information for theseinvestors was the forecast of the analysts (consensus). Suddenly, technology analystsbecame stars and were interviewed in popular shows. Their opinions were able toinfluence the market and therefore the returns, while fundamental or value investorshad less importance. Additionally, analysts were also hired by investment banks thatwere participating in new deals such as IPOs, mergers, and acquisitions. Analysts hada strong pressure from the investment bankers to favorably cover companies wherethey expected to have a new deal or already had one. Also, if an analyst was coveringa company that was merged or acquired another company, suddenly she expandedher coverage to a new company or even a new industry, if the company was tryingto diversify itself. For example, Microsoft has grown through acquisitions and hassignificantly expanded its initial area of economic activity as “software developer”.
123

A link mining algorithm 437
The analysts of Microsoft have to understand the new business operations. This latteridea also explains why in 2001 there is such an unusual increase in the degree of theextended corporate interlock of the US market as Table 1 shows.
The relationship between analysts and directors is partially explained by the “earn-ings game” that we introduced in Sect. 1. The value of the stock options of CEO’s andsenior managers depends on the earnings surprises. Managers try to reach or improvethe analysts’ predictions. At the same time, analysts need the investment bankingbusiness because their compensation might be based on it. As a result there are incen-tives on both sides to find a mutually satisfying prediction and selective disclosureof material information to analysts. If the same game is played in several companieswith various common directors, then the inclusion of analysts in the social networkof directors may increase the profitability of trading strategies formulated around FEduring the period 1998–2001. However, the degree of the extended corporate interlockand the profitability of its associated trading strategies are reduced in the period 2002–2005. This contraction might be explained because of the regulations introduced bythe Sarbanes-Oxley Act and the regulation FD that prohibits selective disclosure ofmaterial information.
The results of our trading strategies is consistent with the results of Cohen et al.(2008) who show the profitability of a trading strategy that takes a long position with“buy” recommendations and school ties among analysts and directors, and a shortposition with “buy” recommendations without school ties only until regulation FDwas established. Regulation FD enforces the fair disclosure of material information toall interested parties. Hence, the direct link that Cohen et al. (2008) show when direc-tors and analysts share the same “Alma mater” or—according to our research—whendirectors and analysts are connected through several companies indicate that these con-nections allowed analysts to receive privileged information that may have improvedtheir predictions. In our simulations of trading strategies, the Sharpe ratio is smallerwhen we use either the top decile of predictions or only those cases where analysts pre-dict that earnings are larger than consensus, however their abnormal returns are higherthan those of other strategies. The main explanation for this apparent contradictionis that the selection of the above sample significantly reduce the number of observa-tions. Hence, their standard deviations increase and their Sharpe ratios decrease. Thetrading strategy where analysts predict that earnings are larger than consensus showthe highest abnormal return of all the trading strategies. In this case, the importanceof social network indicators is less relevant because there is already a combination ofthe selection of those companies with the best analysts’ forecast and the restrictionthat analysts are part of the major strongly connected network similar to the results ofCohen et al. (2008). A possible explanation is that the best companies to invest attracta large group of analysts which help to strength the social network of directors andanalysts and to transmit information not only about earnings, but also about competi-tors’ plans or strategies. This additional information may help the board to take moreinformed decisions and as a consequence, improve corporate performance.
The problem explored in this paper has some similarities with the direct marketingproblem that Hill et al. (2006) approached. In both cases, the algorithm must make adecision to invest in a prospect (mail an offer) or in a stock (long or short position), andthe prediction is improved when very well-known marketing or investment variables
123
438 G. Creamer, S. Stolfo
are combined with social network properties. Cohen et al. (2008), Hill et al. (2006)and Creamer and Stolfo (2006) show that social networks have a significant effect inhow people take investment decisions. Acquiring a new credit card, expanding phoneservices, recommending a firm or taking a long position in a stock are decisions thatmight be affected by the social network affiliation of the economic agent. The detailsof how the information transmission process happens might be different. In the directmarketing case, the continuous interaction between neighbors or members of the samehousehold may explain that it is easier to expand services or acquire prospects whenthey are affiliated to loyal customers because loyal customers may act as diffusionagents. In the extended corporate interlock case, the school ties (Cohen et al. 2008)might explain the relevance of the social network variables as predictors, however thesocial network effect might be due to more recent associations such as professionalnetworks or the attraction of similar people to same firms. Many corporations choosedirectors that are highly connected in the industry because of the additional informa-tion or business that these connections may bring. Hence, top 500 Fortune companiesmay have very well-known directors such as Vernon Jordan who is in the top ten listof the most connected directors in the study of Davis et al. (2003). This bias of compa-nies to select highly connected directors is confirmed by our regression analysis (seeTable 5) which shows that the most important social network variables for the period1996–2001 are betweenness centrality and closeness centrality. The most successfulanalysts of these companies might also be very well connected either by educationor social status. If this is the case, the likelihood that analysts and directors knoweach other, interact and exchange information in professional or social events or clus-ters increase. This interaction among directors and analysts may determine that somecompanies are highly connected with other companies by very few degrees (closenesscentrality) or that they become “bridges” to facilitate the connection among manyother firms (betweenness centrality).
8 Conclusions
The link mining algorithm, CorpInterlock, demonstrated to be a flexible mechanismto increase the profitability of trading strategies using social network indicators. Thecapacity to improve the forecast of earnings surprises and abnormal return using a mix-ture of well-known economic indicators with organizational and behavioral variablesalso enriches the debate between the modern finance theory and behavioral finance toshow how behavioral patterns can be recognized under a rigorous method of analysisand forecast.
The basic and extended corporate interlocks have the properties of a “small world”network. However, the expansion of the original corporate interlock to include newactors, such as financial analysts, bring additional information especially during a“bull” market that leads to profitable trading strategies.14
14 A “bull” market is a market where prices are increasing or there is the expectation that they will increase.“Bear” market is the opposite.
123

A link mining algorithm 439
Table 5 Results of regression model for the periods 1996–2001 (panel a) and 2002–2005 (panel b) usingFE as the dependent variable and the following independent variables: 1. only economic variables, and 2.economic and social network variables (All)
Variables Extended Corp. Interlock Basic Corp. Intelock
Economic var. All Economic var. All
1996–2001CAR1 0.035 0.035 0.024 0.024
(6.854)*** (6.967)*** (2.658)** (2.564)*CAR2 −0.025 −0.026 0.008 0.007
(−4.991)*** (−5.354)*** (0.886) (0.871)SIZE 0.012 0.011 0.008 0.009
(9.526)*** (−6.848)*** (4.146)*** (4.219)***FREV −0.045 −0.041 −0.115 −0.116
(−1.809) (−1.643) (−2.276)* (−2.304)*LTG 0.000 0.000 0.000 0.000
(−0.363) (−0.087) (0.255) (−0.073)SUE 0.000 0.000 0.000 0.000
(−0.103) (−0.139) (0.119) (0.128)SG 0.000 0.000 0.000 0.000
(−0.215) (−0.206) (−0.380) (−0.371)TA −0.062 −0.065 −0.031 −0.031
(−3.687)*** (−3.840)*** (−1.246) (−1.245)CAPEX 0.069 0.066 0.005 0.007
(1.942) (1.849) (0.109) (0.145)BP 0.000 0.000 0.000 0.000
(−0.083) (0.009) (1.402) (1.399)EP 0.000 0.000 0.000 0.000
(0.355) (0.293) (−0.604) (−0.591)ANFOR 0.001 0.001 0.002 0.002
(1.257) (1.296) (1.435) (1.377)ANFORLAG 0.005 0.006 0.004 0.004
(5.975)*** (6.219)*** (4.339)*** (4.337)***FELAG 0.646 0.645 0.594 0.594
(84.612)*** (84.481)*** (50.159)*** (50.109)***CONSENSUS −0.001 −0.001 −0.001 −0.001
(−3.423)*** (−3.321)*** (−0.874) (−0.866)CC ′ −0.011 −0.001
(−1.108) (−0.058)deg 0.007 −0.918
(0.062) (0.534)Bc −5.417 0.388
(−2.768)** (0.221)Cc 0.253 −0.042
(2.731)** (−0.277)Adj. R square 0.432 0.433 0.371 0.371p-value (F-stat.) 0.000 0.000 0.000 0.000
2002–2005CAR1 0.036 0.036 0.036 0.036
(3.490)*** (3.505)*** (2.514)* (2.517)*CAR2 −0.004 −0.004 0 0.000
(−0.473) (−0.476) (−0.018) (0.036)SIZE 0.004 0.003 0.003 0.004
(2.133)* −1.545 −1.327 (1.324)
123

440 G. Creamer, S. Stolfo
Table 5 continued
Variables Extended Corp. Interlock Basic Corp. Intelock
Economic var. All Economic var. All
FREV −0.097 −0.097 −0.114 −0.115(−3.360)*** (−3.354)*** (−1.394) (−1.413)
LTG 0 0 0.001 0.001(−0.463) (−0.391) (2.420)* (2.337)*
SUE 0.002 0.002 0.004 0.004−0.587 −0.601 −1.316 (1.310)
SG 0 0 0 0.000(−0.158) (−0.155) (−0.142) (−0.170)
TA 0.009 0.01 0.037 0.036−0.498 −0.516 −1.379 (1.356)
CAPEX −0.047 −0.047 −0.059 −0.059(−0.831) (−0.829) (−0.860) (−0.862)
BP 0 0 −0.001 −0.001(−0.493) (−0.491) (−1.315) (−1.244)
EP 0 0 0.063 0.063−0.24 −0.244 (4.418)*** (4.369)***
ANFOR 0 0 0 0.000(−0.143) (−0.120) (−0.127) (−0.077)
ANFORLAG 0.003 0.003 0.002 0.002(3.855)*** (3.896)*** (3.549)*** (3.572)***
FELAG 0.661 0.661 0.69 0.690(63.097)*** (63.071)*** (49.831)*** (49.823)***
CONSENSUS −0.004 −0.004 −0.004 −0.004(−0.911) (−0.951) (−1.009) (−0.947)
CC ′ −0.014 0.006(−1.316) (0.451)
deg 0.009 2.317−0.015 (1.133)
Bc −0.14 −1.822(−0.077) (−1.189)
Cc −0.017 −0.144(−0.134) (−0.833)
Adj. R square 0.444 0.444 0.474 0.473p-value (F-stat.) 0 0 0 0.000
Models include intercept and dummy variables to control for economic sector of activity which are notincluded in the table, the rest of variables are included. Economic variables are cumulative abnormal returnfor the preceding 6 months (CAR1) and for the second preceding 6 months (CAR2) since the earningsannouncement day; natural logarithm of market capitalization (SIZE); analysts earnings forecast revisionsto price (FREV); mean of analysts’ long-term growth forecast (LTG); standardized unexpected earnings(SUE); sales growth (SG); total accruals to total assets (TA); rolling sum of capital expenditures to totalassets (CAPEX); book to price ratio (BP); earnings to price ratio (EP); number of analysts predictingthat earnings surprise increase (ANFOR) and its lagged value (ANFORLAG); and lagged forecast error(FELAG). Social network variables are clustering coefficient (CC ′), degree centrality (deg), betweennesscentrality (Bc), and closeness centrality (Cc). Numbers in parentheses are t-statistics∗,∗∗,∗∗∗ Represent significance levels of 0.1%, 1%, and 5% respectively
The application of link mining algorithms to problems of finance or social sciencesmay enrich the discussion in two ways: on one hand, a link mining algorithm cancontribute to the understanding of social phenomena with the integration of differentdomains and especially quantifying the network perspective. On the other hand, thecomplex social problems offer scenarios to tests the adequacy or the development
123

A link mining algorithm 441
of new algorithms to solve interdisciplinary problems. For example, the oil supplyis controlled by rich-oil countries with authoritarian or autocratic governments. Alink mining algorithm may help to integrate the different domains in play: political,social, economical and cultural, and to find links that may bring new solutions to oldproblems.
A future line of research is the extension of the CorpInterlock algorithm to prob-lems of direct marketing that showed to be very similar to the investment questionsexplored in this paper. The key problem is to quantify the main social network thatoffer additional information about how agents take economic decisions.
Acknowledgments This research was supported by the National Science Foundation grant “Email MiningToolkit Supporting Law Enforcement Forensic Analysis“ from the Digital Government research program,No. 0429323. GC would also like to thank Patrick Jardine for proof-reading the article; David Waltz, HubertDelany, Shlomo Hershkop, Zeph Grunschlag, Tony Jebara, Vasant Dhar, and the anonymous referees ofthis journal and of the “Link Analysis: Dynamics and Statics of Large Networks“ Workshop on SIGKDD2006 for their valuable comments. The opinions presented are the exclusive responsibility of the authors.
Appendix 1 Investment signals used for prediction
We do not include firm-specific subscripts in order to clarify the presentation. Sub-script q refers to the most recent quarter for which an earnings announcement wasmade. The fundamental variables are calculated using the information of the previousquarter (SUE,SG,TA,and CAPEX) and our notation is similar to the notation usedby Jegadeesh et al. (2004).
Variable Description Calculation detail
SECTOR Two-digit sector classification according tothe Global Industrial ClassificationStandards (GICS) code
Energy 10, Materials 15, Industrials20, Consumer Discretionary 25,Consumer Staples 30, Health Care35, Financials 40, InformationTechnology 45 TelecommunicationServices 50, Utilities 55
Price momentumCAR1 Cumulative abnormal return for the
preceding 6 months since the earningsannouncement day
[�m−1t=m−6(1 + Rt ) − 1]
− [�m−1t=m−6(1 + Rtw) − 1], where
Rt is return in month t, Rtw is valueweighted market return in month t,and m is last month of quarter
CAR2 Cumulative abnormal return for the secondpreceding 6 months since the earningsannouncement day
[�m−7t=m−12(1 + Rt ) − 1]
− [�m−1t=m−6(1 + Rtw) − 1]
Analysts variablesANFOR(ANFORLAG)
Number of analysts predicting that earningssurprise increase (lagged value)
CONSENSUS Mean of earnings estimate by financialanalysts
FELAG Lagged forecast errorCONSENSUSq −EPSq
|CONSENSUSq |+|EPSq | (Dhar and
Chou 2001) where EPS is earningsper share
123

442 G. Creamer, S. Stolfo
Earnings momentum
FREV Analysts earningsforecast revisions toprice
∑5i=0
CONSENSUSm−i −CONSENSUSm−i−1Pm−i−1
where Pm−1 is price at end of monthm − 1, and i refers to the previous earningsrevisions
SUE Standardizedunexpected earnings
(EPSq −EPSq−4)
σtwhere EPS is earnings per
share, and σt is standard deviation of EPSfor previous seven quarters
Growth indicatorsLTG Mean of analysts’
long-term growthforecast
SG Sales growth∑3
t=0 Salesq−t∑3
t=0 Salesq−4−tFirm sizeSIZE Market cap (natural
log)ln(Pq sharesq ) where sharesq are
outstanding shares at end of quarter qFundamentals
TA Total accruals tototal assets
�C.As.q −�Cashq −(�C.Lb.q −�C.Lb.Dq )−�Tq−D&Aq(T.As.q −T.As.q−4)
2where � Xq = Xq − Xq−1 and C.As.,C.Lb., C.Lb.D., T,D&A, and T.As. standsfor current assets, current liabilities, debtin current liabilities, deferred taxes,depreciation and amortization, and totalassets respectively.
CAPEX Rolling sum of capitalexpenditures to totalassets
∑3t=0 capital expendituresq−t
(T .As.q −T .As.q−4)/2
Valuation multiples
BP Book to price ratiobook value of common equityq
market capq,
where market capq = Pq sharesq
EP Earnings to price ratio(rolling sum of EPSof the previous fourquarters deflated byprices)
∑3t=0 EPSq−t
Pq
Social networksdeg(vi ) Degree centrality or
degree: number ofedges incidents invertex vi
∑j ai j , where ai j is an element of the
adjacent matrix A
Cc(vi ) Closeness centrality(normalized):inverse of theaverage geodesicdistance from vertexvi to all othervertices
n−1∑j di j
, where di j is an element of the
geodesic distance matrix D (Freeman1979; Borgatti and Everett 2006)
123

A link mining algorithm 443
Bc(vi ) Betweenness centrality:proportion of all geodesicdistances of all othervertices that include vertexvi
∑i∑
jgki jgk j
, where gki j is the
number of geodesic pathsbetween vertices k and j thatinclude vertex i, and gk j is thenumber of geodesic pathsbetween k and j (Freeman1979)
CCi Clustering coefficient:cliquishness of a particularneighborhood or theproportion of edgesbetween vertices in theneighborhood of vi dividedby the number of edges thatcould exist betweenthem (Watts and Strogatz1998)
2|{ei j }|deg(vi )(deg(vi )−1)
: v j ∈Ni , ei j ∈ E , where eachvertex vi has a neighborhood Ndefined by its immediatelyconnected neighbors:Ni = {v j } : ei j ∈ E
CC ′i Normalized clustering
coefficient
deg(vi )Max Deg CCi , where MaxDeg is
the maximum degree of vertexin a network (de Nooy et al.2005)
C (not used for forecasting) Mean of all the clusteringcoefficients
1n
∑ni=1 CCi
SW (not used for forecasting) “Small world” ratio (Wattsand Strogatz 1998).
CL
LrandomCrandom
, where
Lrandom ≈ ln(n)ln(k)
and
Crandom ≈ kn
LabelsLABELFE Label of forecast error (FE) 1 if CONSENSUS ≥ EPS
(current quarter) , −1 otherwiseLABELCAR Label of cumulative abnormal
return (CAR)1 if CARm+1 ≥ 0, -1 otherwise,
where CARm+1 refers to theCAR of the month that followsthe earnings announcement
References
Abarbanell J (1991) Do analysts earnings forecasts incorporate information in prior stock price changes?.J Account Econ 14:147–165
Abarnabell J, Bernard V (1992) Tests of analysts’ overreaction/underreaction to earnings information as anexplanation for anomalous stock price behavior. J Finance 47:1181–1207
Asquith P, Mikhail MB, Au AS (2005) Information content of equity analyst reports. J Financ Econ 75:245–282
Barabasi A (2002) Linked: the new science of networks. Perseus, Cambridge, MABarber B, Lehavy R, McNichols M, Trueman B (2001) Can investors profit from the prophets? Security
analysts recommendations and stock returns. J Finance 56:531–563Beckers S, Steliaros M, Thomson A (2004) Bias in European analysts’ earnings forecasts. Financ Anal J
60:74–85Bernard VL, Thomas JK (1990) Evidence that stock prices do not fully reflect the implications of current
earnings for future earnings. J Account Econ 13Borgatti SP, Everett M (2006) A graph-theoretic perspective on centrality. Soc Netw 28:466–484Breiman L (2001) Random forests. Mach Learn 45:5–32Breusch TS, Pagan A (1979) A simple test for heteroscedasticity and random coefficient variation.
Econometrica 47:1287–1294
123

444 G. Creamer, S. Stolfo
Brown LD (2000) I/B/E/S Research Bibliography, 6th edn. I/B/E/S International Incorporated. http://www2.gsu.edu/~wwwacc/Faculty/lbrown/Bibliography.pdf
Brown LD (2001) How important is past analyst forecast accuracy? Financ Anal J 57:44–49Brown LD, Han JCY, Keon EF Jr, Quinn WH (1996) Predicting analysts’ earnings surprise. J Invest 5:17–23Cessie SL, Houwelingen JCV (1992) Ridge estimators in logistic regression. Appl Stat 41:191–201Clement M, Tse S (2005) Financial analyst characteristics and herding behavior in forecasting. J Finance
40:307–341Cohen L, Frazzini A, Malloy C (2008) Sell side school ties. Working paper, Harvard Business SchoolCollins M, Schapire RE, Singer Y (2004) Logistic regression, adaboost and Bregman distances. Mach Learn
48:253–285Creamer G, Freund Y (2004) Predicting performance and quantifying corporate governance risk for latin
american adrs and banks. In: I Proceedings of the financial engineering and applications conference,MIT-Cambridge
Creamer G, Freund Y (2005) Using adaboost for an equity investment/board balanced scorecard. In: Machinelearning in finance workshop in NIPS 2005, Whistler, B.C
Creamer G, Freund Y (2007) A boosting approach for automated trading. J Trading (Summer 2007):84–95Creamer G, Stolfo S (2006) A link mining algorithm for earnings forecast using boosting. In: Proceedings
of the link analysis: dynamics and statics of large networks workshop on international conference onknowledge discovery and data mining (KDD), Philadelphia, PA
Davis CE, Hyde JE, Bangdiwala S, Nelson J (1986) Modern statistical methods in chronic disease epide-miology, chapter An example of dependencies among variables in a conditional logistic regression.Wiley, New York
Davis G (1991) Agents without principles? The spread of the poison pill through the intercorporatenetwork. Adm Sci Q 36:586–613
Davis G, Yoo M, Baker W (2003) The small world of the american corporate elite, 1982–2001. StrategOrgan 1:301–326
de Nooy W, Mrvar A, Batagelj V (2005) Exploratory social network analysis with Pajek. CambridgeUniversity Press, New York
Dhar V, Chou D (2001) A comparison of nonlinear methods for predicting earnings surprises and returns.IEEE Trans Neural Netw 12:907–921
Domingos P, Richardson M (2001) Mining the network value of customers. In: KDD ’01: proceedings ofthe seventh ACM SIGKDD international conference on Knowledge discovery and data mining, ACM,New York, NY, USA, pp 57–66
Elton JE, Gruber MJ, Grossman S (1986) Discrete expectational data and portfolio performance. J Finance41:699–714
Fawcett T, Provost F (1999) Activity monitoring: noticing interesting changes in behavior. In: Proceed-ings of the fifth ACM SIGKDD international conference on knowledge discovery and data mining(KDD-99), pp 53–62
Finger CA, Landsman WR (1999) What do analysts’ stock recommendations really mean? Working paper,University of Illinois and U.N.C., Chapel Hill
Freeman L (1979) Centrality in networks: I. conceptual clarification. Soc Netw 1:215–239Freund Y, Mason L (1999) The alternating decision tree learning algorithm. In: Machine learning: proceed-
ings of the sixteenth international conference, pp 124–133Freund Y, Schapire RE (1997) A decision-theoretic generalization of on-line learning and an application
to boosting. J Comp Sys Sci 55:119–139Friedman J, Hastie T, Tibshirani R (2000) Additive logistic regression: a statistical view of boosting. Ann
Stat 38:337–374Getoor L, Diehl CP (2005) Link mining: a survey. SIGKDD Explorations 7:3–12Goldberg HG, Kirkland JD, Lee D, Shyr P, Thakker D (2003) The NASD securities observation, news
analysis and regulation system (sonar). In: IAAI 2003, Acapulco, MexicoGreene W (2007) Econometric analysis,. 6th edn. Prentice Hall, Upper Saddle River, NJHill S, Provost F, Volinsky C (2006) Network-based marketing: identifying likely adopters via consumer
networks. Stat Sci 21:256–276Hong HG, Kubik JD (2003) Analyzing the analysts: career concerns and biased earnings forecasts. J Finance
58:313–351Ivkovic Z, Jegadeesh N (2004) The timing and value of forecast and recommendation revisions. J Financ
Econ 73:433–463
123

A link mining algorithm 445
Jegadeesh N, Kim J, Krische SD, Lee CMC (2004) Analyzing the analysts: when do recommendations addvalue?. J Finance 59:1083–1124
Kirkland JD, Senator TE, Hayden JJ, Dybala TG, Goldberg H, Shyr P (1999) The nasd regulation advanceddetection system (ads). AI Mag 20:55–67
Krische SD, Lee CMC (2000) The information content of analyst stock recommendations. Working paper,Cornell University
Larcker DF, Richardson SA, Seary AJ, Tuna I (2005) Back door links between directors and executivecompensation. Working paper
Lee CI, Rosenthal L, Gleason KC (2004) Effect of regulation FD on asymmetric information. Financ AnalJ 60:79–89
Leskovec J, Adamic LA, Huberman BA (2006) The dynamics of viral marketing. In: EC ’06: proceedingsof the 7th ACM conference on electronic commerce, pp 228–237, ACM, New York, NY, USA
Mendenhall RR (1991) Evidence on the possible underweighting of earnings information. J Account Res29:170–179
Mikhail MB, Walther B, Willis R (2002) Do security analysts exhibit persistent differences in stock pickingability?. J Financ Econ 74:67–91
Milgram S (1967) The small world problem. Psychol Today 2:60–67Mills C (1956) The power elite. Oxford Press, New YorkMintz B, Schwartz M (1985) The power structure of American business. University of Chicago Press,
ChicagoMizruchi M (1992) The structure of corporate political action: interfirm relations and their consequences.
Harvard University Press, Cambridge, MAMoreno J (1932) Application of the group method to classification. National committee on prisons and
prison labor, New YorkNewman M, Strogatz S, Watts D (2001) Random graphs with arbitrary degree distributions and their appli-
cations. Phys Rev E 64Newman MEJ, Watts DJ, Strogatz SH (2002) Random graph models of social networks. Proc Natl Acad
Sci USA 99(Suppl 1):2566–2572. doi:10.1073/pnas.012582999Ou JA, Penman SH (1989) Accounting measurement, price-earnings ratios, and the information content of
security prices. J Account Res 27Peters D (1993a) Are earnings surprises predictable?. J Invest 2:47–51Peters D (1993b) The influences of size on earnings surprise predictability. J Invest 2:54–59Peterson D, Peterson P (1995) Abnormal returns and analysts earnings forecast revisions associated with
the publication of ’stock highlights’ by value line investment survey. J Financ Res 18:465–477Rao H, Davis G, Ward A (2000) Embeddedness, social identity and mobility: why firms leave the NASDAQ
and join the New York Stock Exchange. Adm Sci 45:268–292Richardson M, Domingos P (2006) Markov logic networks. Mach Learn 62:107–136Senator TE (2005) Link mining applications: progress and challenges. SIGKDD Explor 7:76–83Sparrow M (1991) The application of network analysis to criminal intelligence: an assessment of the pros-
pects. Soc Netw 13:251–274Stickel SE (1995) The anatomy of the performance of buy and sell recommendations. Financ Anal J 51:25–
39Stober T (1992) Summary financial statements measures and analysts’ forecasts of earnings. J Account
Econ 15:347–372Stolfo S, Creamer G, Hershkop S (2006) A temporal based forensic discovery of electronic communication.
In: Proceedings of the national conference on digital government research, San Diego, CaliforniaThaler R (2005) Advances in behavioral finance II. Princeton University Press, Princeton, NJWatts D (1999) Networks, dynamics, and the small-world phenomenon. Am J Sociol 105:493–527Watts D, Strogatz S (1998) Collective dynamics of small world networks. Nature 393:440–442Witten IH, Frank E (2005) Data mining: practical machine learning tools and techniques,. 2nd edn. Morgan
Kaufmann, San FranciscoWomack K (1996) Do brokerage analysts’ recommendations have investment value?. J Finance 51:137–167
123