a mechanistic model for river incision into bedrock by...
TRANSCRIPT
A mechanistic model for river incision into bedrock
by saltating bed load
Leonard S. Sklar
Department of Geosciences, San Francisco State University, San Francisco, California, USA
William E. Dietrich
Department of Earth and Planetary Science, University of California, Berkeley, California, USA
Received 16 July 2003; revised 20 March 2004; accepted 6 April 2004; published 18 June 2004.
[1] Abrasion by bed load is a ubiquitous and sometimes dominant erosional mechanismfor fluvial incision into bedrock. Here we develop a model for bedrock abrasion bysaltating bed load wherein the wear rate depends linearly on the flux of impact kineticenergy normal to the bed and on the fraction of the bed that is not armored by transientdeposits of alluvium. We assume that the extent of alluvial bed cover depends on the ratioof coarse sediment supply to bed load transport capacity. Particle impact velocity andimpact frequency depend on saltation trajectories, which can be predicted using empiricalfunctions of excess shear stress. The model predicts a nonlinear dependence of bedrockabrasion rate on both sediment supply and transport capacity. Maximum wear rates occurat moderate relative supply rates due to the tradeoff between the availability of abrasivetools and the partial alluviation of the bedrock bed. Maximum wear rates also occur atintermediate levels of excess shear stress due to the reduction in impact frequency as grainmotion approaches the threshold of suspension. Measurements of bedrock wear in alaboratory abrasion mill agree well with model predictions and allow calibration of the onefree model parameter, which relates rock strength to rock resistance to abrasive wear. Themodel results suggest that grain size and sediment supply are fundamental controls onbedrock incision rates, not only by bed load abrasion but also by all other mechanisms thatrequire bedrock to be exposed in the channel bed. INDEX TERMS: 1824 Hydrology:
Geomorphology (1625); 1815 Hydrology: Erosion and sedimentation; 1886 Hydrology: Weathering (1625);
1899 Hydrology: General or miscellaneous; KEYWORDS: abrasion, bedrock incision, erosion, landscape
evolution, saltation
Citation: Sklar, L. S., and W. E. Dietrich (2004), A mechanistic model for river incision into bedrock by saltating bed load, Water
Resour. Res., 40, W06301, doi:10.1029/2003WR002496.
1. Introduction
[2] Surprisingly little is known about the physical con-trols on rates of erosion of bedrock river beds [Whipple etal., 2000a], given the importance of river incision intobedrock in driving landscape evolution [e.g., Howard etal., 1994] and linking climate and tectonics to topography[e.g., Molnar and England, 1990]. Most numerical modelsof landscape evolution use bedrock incision rules that arerelated to the physics of bedrock wear only through simplescaling arguments, typically by assuming that incision rateis proportional to some measure of flow intensity such asunit stream power [Seidl and Dietrich, 1992; Anderson,1994; Tucker and Slingerland, 1994; Willett, 1999] oraverage boundary shear stress [Howard and Kerby, 1983;Howard, 1994; Moglen and Bras, 1995; Tucker andSlingerland, 1996]. These models are difficult to applyin real landscapes because they lump the potentiallycomplex influence of fundamental variables such as rockstrength, channel slope, discharge, sediment supply and
grain size, into a set of poorly constrained parametersunrelated to any particular erosional mechanism. Modelparameters are calibrated using longitudinal profiles ofrivers with a known incision history [e.g., Seidl et al.,1994; Stock and Montgomery, 1999; Whipple et al.,2000b; van der Beek and Bishop, 2003] or by assumingsteady state topography [e.g., Sklar and Dietrich, 1998;Snyder et al., 2000], in effect using landscape form to inferprocess. Here we take the reverse approach, and develop aphysically based model for bedrock incision by a singlemechanism, abrasion by saltating bed load. Our goals are(1) to explore whether detailed consideration of themechanics of bedrock wear will lead to a view of riverincision fundamentally different from the simple scalingmodels, (2) to use the model to refine mechanistic hy-potheses that can be tested in the field and in laboratoryexperiments, and (3) to explain river profile form in termsof the dynamics of bedrock incision.[3] Many erosional mechanisms operate at the interface
between a river and its rock bed, including cavitation,dissolution, abrasion by both bed load and suspended load,and the plucking of rock fragments by fluid shear stressesacting without the aid of sediment impacts. We focus on bed
Copyright 2004 by the American Geophysical Union.0043-1397/04/2003WR002496$09.00
W06301
WATER RESOURCES RESEARCH, VOL. 40, W06301, doi:10.1029/2003WR002496, 2004
1 of 21

load abrasion for several reasons: (1) all rivers carrysediment in some quantity so abrasion should be a ubiqui-tous process; (2) other mechanisms occur only under limitedconditions, for example cavitation requires extreme flowvelocities and plucking may primarily occur in weak orhighly fractured rock; (3) particle impacts are an efficientpathway for the transfer of energy and momentum from theflow to the bed; (4) by definition, bed load interacts with theunderlying bedrock far more frequently than does sus-pended load; (5) much is known about the motion ofsaltating bed load from both theoretical and experimentalstudies; and (6) we have direct experimental evidence thatsaltating bed load causes measurable bedrock wear [Sklarand Dietrich, 2001]. Furthermore, by focusing on abrasionby saltating bed load, we are forced to consider in detail therole of sediment in influencing incision rates, not only inproviding tools for abrasion, but also in controlling theextent of bedrock exposure on the channel bed. Ultimately,by focusing on bed load abrasion, we hope to gain insightinto the potential feedbacks between incision rate, sedimentsupply and grain size that may strongly influence landscaperesponse to changes in climate or rock uplift rate.[4] Actively incising channels in hilly and mountainous
terrain exhibit a wide range in the extent of alluvial coverand size distribution of bed sediment. Figure 1 showsphotographs of two bedrock canyon channel beds in theCoast Range mountains of southern Oregon and northernCalifornia. The bedrock bed of the Smith River is nearlydevoid of sediment deposits, in contrast to the South ForkEel River, where bedrock is exposed only in isolated patchesamid a nearly continuous mantle of coarse alluvium. Yetboth of these channels, which are separated by about150 km, are actively incising through similar marine
sedimentary rocks. To what extent does the size and rateof sediment supply to these two channels contribute to orinhibit the lowering of the bedrock bed?[5] Recent experimental results from bedrock abrasion
mills [Sklar and Dietrich, 2001] support the hypothesis ofGilbert [1877] that the quantity of sediment supplied to theriver should influence bedrock incision rates in two essen-tial yet opposing ways: by providing tools for abrasion ofexposed bedrock and by limiting the extent of exposure ofbedrock in the channel bed. Incision is limited at lowersupply rates by a shortage of abrasive tools (what we termthe ‘‘tools effect’’) and at higher supply rates by partialburial of the bedrock substrate beneath transient sedimentdeposits (‘‘the cover effect’’). Thus, as observed experimen-tally, the maximum rate of river incision should occur whenthe stream receives a moderate supply of sediment, relativeto its sediment transport capacity. It follows that the sizedistribution of sediment grains supplied to the channelshould also influence incision rates because only the coarserfraction is capable of forming an alluvial cover and becausethe finer fraction is carried in suspension and rarely collideswith the bedrock bed. As suggested by the bedrock abrasionmill results [Sklar and Dietrich, 2001], the most efficientabrasive tools are sediments of intermediate size, largeenough to travel as bed load rather than suspended loadbut not so large as to be immobile.[6] Gilbert’s hypothesis is also consistent with numerous
field observations. Sediment clearly contributes to incisionthrough the scouring of potholes [e.g., Alexander, 1932] andlongitudinal grooves [Wohl, 1992a]. Boulders deposited inextreme flows [Wohl, 1992b] or eroded from steep canyonwalls [Seidl et al., 1994] have been shown to shut off theincision process over decadal to millennial timescales. In
Figure 1. Photographs of two incising rivers with contrasting alluvial cover. (a) Smith River, Oregoncoast range mountains. (b) South Fork Eel River, northern California coast range mountains. See colorversion of this figure at back of this issue.
2 of 21
W06301 SKLAR AND DIETRICH: BEDROCK INCISION BY SALTATING BED LOAD W06301
contrast, incision under a thin alluvial cover has beendocumented in a badlands eroded into weak shale [Howardand Kerby, 1983]. Bedrock channel beds partially mantledwith alluvial deposits are common in actively incisingterrain [Howard, 1998] and occur even in lowland coastalstreams [Ashley et al., 1988]. Montgomery et al. [1996] andMassong and Montgomery [2000] have shown that, for agiven drainage area, a wide range in extent of alluviationcan occur over a narrow range in channel slope, due in partto the influence of large woody debris. This suggests thatthe extent of bedrock exposure in incising channels may behighly dynamic.[7] Sediment supply and grain size must be explicitly
represented in bedrock incision models to adequately cap-ture the potentially complex influence of sediment onincision rates. Although to first approximation the long-term flux of sediment to a given channel reach will besimply the product of the landscape denudation rate timesthe upstream drainage area, the supply rate of sediment inthe bed load size class will be considerably less. Some masseroded from upstream is transported as dissolved load. Howmuch of the solid load moves as bed load, and thuscontributes to bed load abrasion and partial bed cover, willdepend on the size distribution of sediment entering thechannel network, the rate of particle comminution withdownstream travel distance, and the fluid shear stressavailable to transport sediment. Unlike fully alluvial chan-nels in depositional environments, the sediment load inmixed bedrock-alluvial channels is commonly assumed tobe less than the sediment transport capacity, because there isa limited supply of sediment available to be scoured fromthe channel bed. Therefore the transport capacity of adjacentupstream reaches cannot be used as a proxy for localsediment supply. At the short timescale of individualincision events, sediment delivery can be highly episodic,particularly in steep landslide-dominated terrain [e.g.,Benda and Dunne, 1997]. Significant spatial and temporalvariability in sediment supply should also occur due toheterogeneous lithology, nonuniform rates of landscapelowering, fans and other upstream sediment storage ele-ments, and the discrete locations of sediment input such astributary junctions and stream bank failures.[8] Few bedrock incisionmodels have attempted to explic-
itly account for the influence of sediment supply and grainsize on incision rate, although many landscape evolutionmodels [e.g., Howard, 1994; Tucker and Slingerland, 1994]represent the cover effect as a sudden shift from bedrock toalluvial conditions when sediment supply exceeds transportcapacity. Beaumont et al. [1992] proposed that bedrockincision could be treated like alluvial incision, with incisionrate scaling with the sediment transport capacity in excess ofthe sediment supply, in effect modeling the coverage effectbut not the tools effect. Foley [1980] modified Bitter’s[1963a, 1963b] sandblast abrasion model to apply to wearby saltating bed load, accounting for the tools effect butneglecting the coverage effect. A preliminary version of thefull model developed here [Sklar et al., 1996; Sklar andDietrich, 1998] captured both the coverage and tools effectsand has inspired efforts to incorporate sediment into thesimple stream power incision rule [Whipple and Tucker,2002]. Slingerland et al. [1997] used studies of slurrypipeline wear [e.g., de Bree et al., 1982] to support the view
that the coverage and tools effects should occur in rivers. Herewe describe in detail a model for bedrock incision by saltatingbed load based directly on themechanics of bed load sedimenttransport and the wear of brittle materials by particle impacts.[9] The paper is divided into four sections. We begin by
deriving an expression for the rate of bedrock incision bysaltating bed load, using established theory for wear ofbrittle materials by low-velocity particle impacts, in whichthe erosion rate depends on saltation hop length and impactvelocity. We then use data from a suite of published studieson saltation trajectories to parameterize the model directlyin terms of shear stress. Next, we explore the sensitivity ofthe predicted bedrock abrasion rates to variations in sedi-ment supply, shear stress and grain size, and then use anondimensional framework to collapse the full model be-havior onto a single graph. Finally, we compare the modelpredictions to laboratory measurements of bedrock wearrates [Sklar and Dietrich, 2001] to calibrate the one adjust-able parameter, which characterizes rock resistance tofluvial abrasion.
2. Model Development
2.1. Assumptions
[10] Our goal in constructing this model is to capture, in ageneral way, how the rate of bedrock incision by bed loadabrasion depends on rock strength, shear stress, sedimentsupply, and grain size. We do not seek to predict theabsolute magnitude of abrasion rates precisely, nor do weattempt to describe the exact motion of any individualsediment grain. Rather, the model is intended as a tool toquantify Gilbert’s [1877] hypothesis and translate the ex-perimental observations of the influence of sediment onrates of bedrock wear [Sklar and Dietrich, 2001] from aclosed rotational abrasion mill to the open translationalsetting of natural river channels. In attempting to balancephysical realism with simplicity, we seek to represent themechanics at a sufficient level of detail to capture theessential elements, while minimizing the introduction offree parameters and the use of unrealistic or untestableassumptions.[11] We limit our analysis to abrasion of rock by bed load,
neglecting all other possible mechanisms for fluvial inci-sion. We assume that all bed load motion is by saltation; ineffect we assume that rolling and sliding either do not causesignificant wear or that the net effect of those processesscales with the effect of saltating bed load. We considerflow through a simple rectangular cross section with aplanar bed. The assumption of vertical banks of infiniteheight is equivalent to a confined canyon channel withoutoverbank flow onto a floodplain because flow width doesnot change with stage. Finally, we assume for simplicity thatall bed load is composed of spherical grains of uniform size.[12] The model is developed at the temporal scale of a
constant discharge (i.e., on the order of several hours), andis essentially a zero-dimensional spatial model, simulatingerosion of a unit area of channel bed. We do not attempt toaccount for cross channel variations in shear stress, localvariation in rock strength, or other reach-scale spatialheterogeneities, although these factors may influence therate of incision by bed load abrasion and by other mecha-nisms. Importantly, we assume that the net effect of spatial
W06301 SKLAR AND DIETRICH: BEDROCK INCISION BY SALTATING BED LOAD
3 of 21
W06301
variations in sediment supply effects can be parameterizedat the scale of the unit bed area.
2.2. General Expression
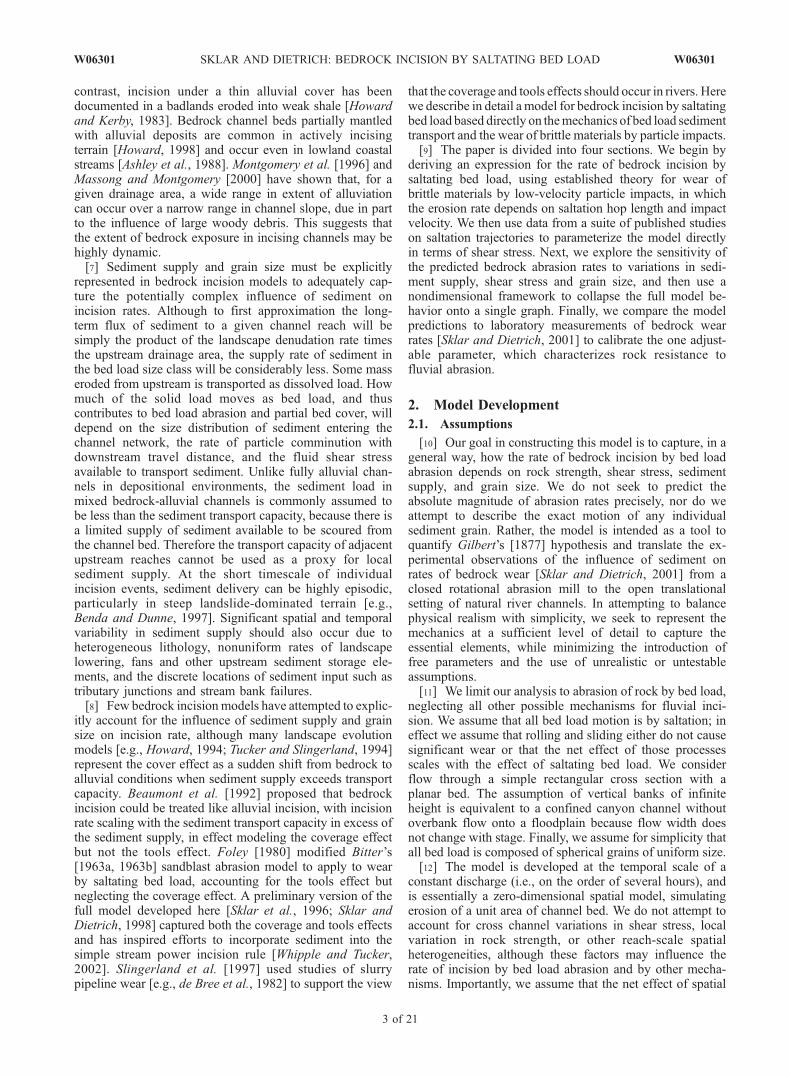
[13] Consider an idealized flux of saltating bed load,moving across an approximately planar river bed composedof a mixture of exposed bedrock and alluvial patches, asdepicted in Figure 2. Bedrock erosion occurs as the inte-grated result of numerous grain collisions with exposedbedrock. Many nondestructive grain impacts occur as sed-iment travels across local sediment deposits where bedrockis covered. Bedrock incision rate (E) can be expressedsimply as the product of three terms: the average volumeof rock detached per particle impact (Vi), the rate of particleimpacts per unit area per unit time (Ir), and the fraction ofthe river bed made up of exposed bedrock (Fe)
E ¼ ViIrFe: ð1Þ
Below we develop expressions for each of these terms usingempirical relationships for wear by particle impacts, bedload sediment transport capacity, and the trajectory ofsaltating bed load motion.[14] Saltating grains move in a characteristic trajectory
(Figure 3). The magnitude of particle velocities and salta-tion hop length and height are well described by functionsof boundary shear stress in excess of the threshold ofmotion [e.g., Wiberg and Smith, 1985], as is bed loadsediment transport capacity [e.g., Gomez and Church,1989]. Ultimately, we will obtain an expression for erosionrate in terms of sediment supply rate, grain size, excessshear stress, and rock strength.
2.3. Volume Eroded Per Unit Impact (Vi)
[15] Erosion of brittle materials by low-velocity particleimpacts occurs through the formation, growth and intersec-tion of a network of cracks [Engle, 1978]. Cracks occur dueto tensile stresses arising from elastic deformation aroundthe point of impact. Detachment of an eroded fragment isgenerally the result of an accumulation of intersectingcracks due to multiple particle impacts. Erosion of brittlematerials by repeated impacts is referred to as ‘‘deformationwear’’ [e.g., Bitter, 1963a]. Although the volume eroded byany single impact will depend on the local fracture density,the wear rate averaged over a large number of impactsscales with the flux of kinetic energy transferred by theimpacting grains [Engle, 1978].
[16] Here we treat bedrock as an elastic brittle material,and thus do not consider ductile or nonelastic behavior. Thenet transfer of kinetic energy (DeN) in a collision between asmall particle and an essentially infinite rock mass is
DeN ¼1=2Mp U2i � U2
r
� �¼ 1=2MpU
2i 1� U2
r
U2i
� �ð2Þ
where Mp is the mass of the impacting particle, Ui and Ur
are the velocities of impact and rebound respectively, and(1 � Ui
2/Ur2) = f(sin a) where a is the angle of impact [Head
and Harr, 1970]. Some of the kinetic energy transferredmay contribute to deformation wear of the bedrock (DeD),while the remainder is lost (DeL) through transformationinto other energy forms such as sound and heat (i.e., DeN =DeD + DeL). Thus, bedrock wear depends on the energytransferred in excess of losses, DeD = DeN � DeL. Thisforms the basis of the classic impact wear model of Bitter[1963a], which we write as
Vi ¼1=2Mp Ui sinað Þ2� et
evð3Þ
where Vi is the mean volume eroded per impact, ev is thetotal energy required to erode a unit volume of rock, and etis the threshold energy that must be exceeded fordetachment to occur. Erosion depends on the sine of theimpact angle because the magnitude of the peak tensilestress varies with the normal component of the impactvelocity [Engle, 1978].[17] Note that the tangential velocity component can
contribute to erosion by scratching or gouging, referred toas ‘‘cutting wear’’ [Bitter, 1963b]. Cutting wear is importantin ductile materials and when the impacting particles arehighly angular, but is not significant when brittle materialsare impacted by rounded grains [Head and Harr, 1970], asis generally the case in bedrock rivers. Note also that thisformulation implicitly assumes that the mass of impactingparticles is conserved, because it does not account for theenergy that may contribute to wear of the impacting grain orfor the kinetic energy of any fragments that may beproduced by the grain impact.[18] The linear dependence of impact abrasion rate on
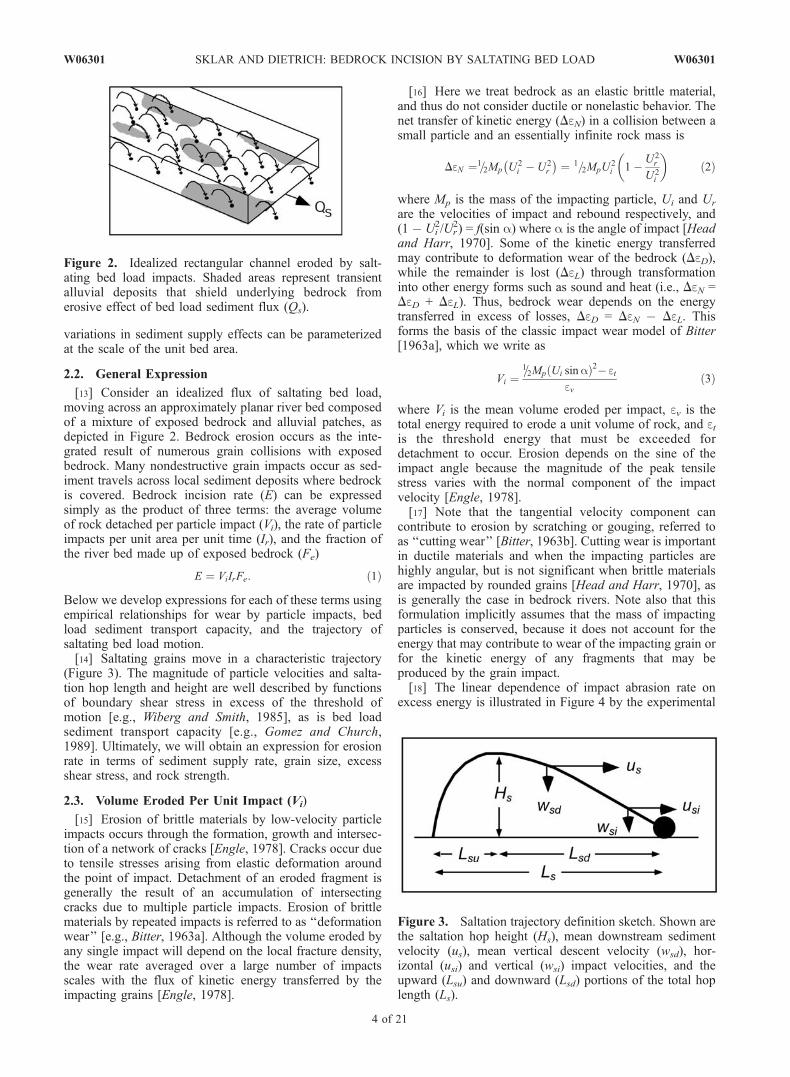
excess energy is illustrated in Figure 4 by the experimental
Figure 2. Idealized rectangular channel eroded by salt-ating bed load impacts. Shaded areas represent transientalluvial deposits that shield underlying bedrock fromerosive effect of bed load sediment flux (Qs).
Figure 3. Saltation trajectory definition sketch. Shown arethe saltation hop height (Hs), mean downstream sedimentvelocity (us), mean vertical descent velocity (wsd), hor-izontal (usi) and vertical (wsi) impact velocities, and theupward (Lsu) and downward (Lsd) portions of the total hoplength (Ls).
4 of 21
W06301 SKLAR AND DIETRICH: BEDROCK INCISION BY SALTATING BED LOAD W06301
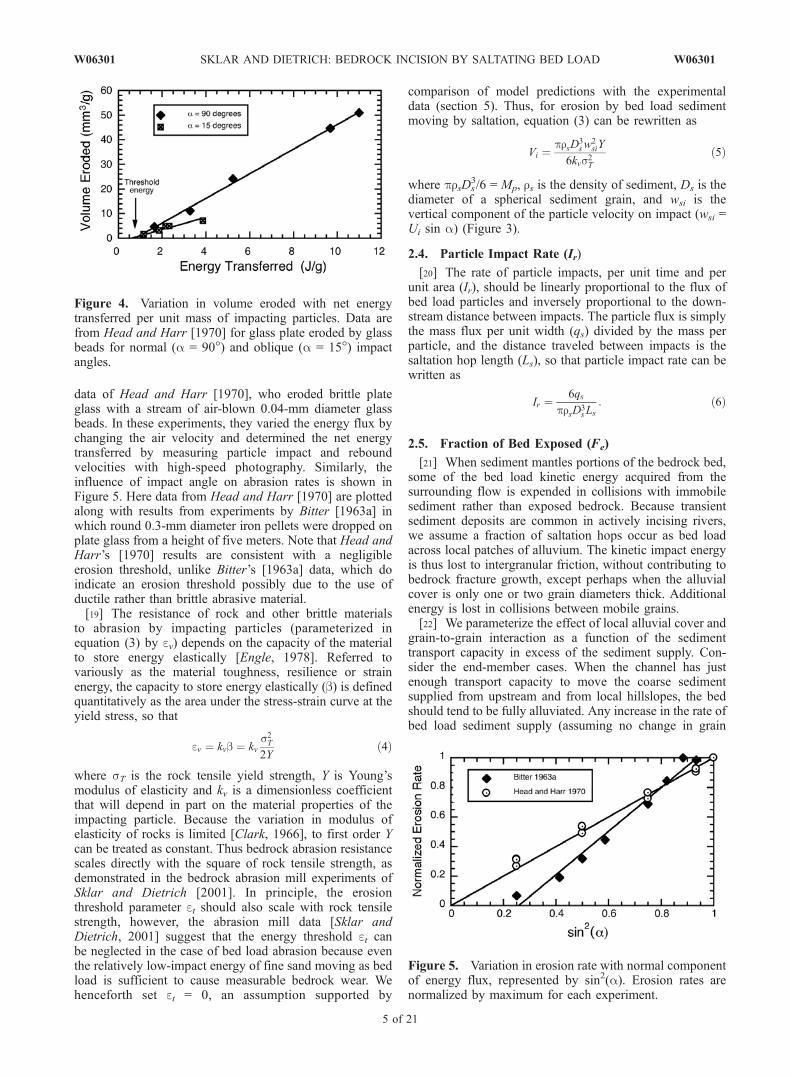
data of Head and Harr [1970], who eroded brittle plateglass with a stream of air-blown 0.04-mm diameter glassbeads. In these experiments, they varied the energy flux bychanging the air velocity and determined the net energytransferred by measuring particle impact and reboundvelocities with high-speed photography. Similarly, theinfluence of impact angle on abrasion rates is shown inFigure 5. Here data from Head and Harr [1970] are plottedalong with results from experiments by Bitter [1963a] inwhich round 0.3-mm diameter iron pellets were dropped onplate glass from a height of five meters. Note that Head andHarr’s [1970] results are consistent with a negligibleerosion threshold, unlike Bitter’s [1963a] data, which doindicate an erosion threshold possibly due to the use ofductile rather than brittle abrasive material.[19] The resistance of rock and other brittle materials
to abrasion by impacting particles (parameterized inequation (3) by ev) depends on the capacity of the materialto store energy elastically [Engle, 1978]. Referred tovariously as the material toughness, resilience or strainenergy, the capacity to store energy elastically (b) is definedquantitatively as the area under the stress-strain curve at theyield stress, so that
ev ¼ kvb ¼ kvs2T2Y
ð4Þ
where sT is the rock tensile yield strength, Y is Young’smodulus of elasticity and kv is a dimensionless coefficientthat will depend in part on the material properties of theimpacting particle. Because the variation in modulus ofelasticity of rocks is limited [Clark, 1966], to first order Ycan be treated as constant. Thus bedrock abrasion resistancescales directly with the square of rock tensile strength, asdemonstrated in the bedrock abrasion mill experiments ofSklar and Dietrich [2001]. In principle, the erosionthreshold parameter et should also scale with rock tensilestrength, however, the abrasion mill data [Sklar andDietrich, 2001] suggest that the energy threshold et canbe neglected in the case of bed load abrasion because eventhe relatively low-impact energy of fine sand moving as bedload is sufficient to cause measurable bedrock wear. Wehenceforth set et = 0, an assumption supported by
comparison of model predictions with the experimentaldata (section 5). Thus, for erosion by bed load sedimentmoving by saltation, equation (3) can be rewritten as
Vi ¼prsD
3sw
2siY
6kvs2Tð5Þ
where prsDs3/6 = Mp, rs is the density of sediment, Ds is the
diameter of a spherical sediment grain, and wsi is thevertical component of the particle velocity on impact (wsi =Ui sin a) (Figure 3).
2.4. Particle Impact Rate (Ir)
[20] The rate of particle impacts, per unit time and perunit area (Ir), should be linearly proportional to the flux ofbed load particles and inversely proportional to the down-stream distance between impacts. The particle flux is simplythe mass flux per unit width (qs) divided by the mass perparticle, and the distance traveled between impacts is thesaltation hop length (Ls), so that particle impact rate can bewritten as
Ir ¼6qs
prsD3s Ls
: ð6Þ
2.5. Fraction of Bed Exposed (Fe)
[21] When sediment mantles portions of the bedrock bed,some of the bed load kinetic energy acquired from thesurrounding flow is expended in collisions with immobilesediment rather than exposed bedrock. Because transientsediment deposits are common in actively incising rivers,we assume a fraction of saltation hops occur as bed loadacross local patches of alluvium. The kinetic impact energyis thus lost to intergranular friction, without contributing tobedrock fracture growth, except perhaps when the alluvialcover is only one or two grain diameters thick. Additionalenergy is lost in collisions between mobile grains.[22] We parameterize the effect of local alluvial cover and
grain-to-grain interaction as a function of the sedimenttransport capacity in excess of the sediment supply. Con-sider the end-member cases. When the channel has justenough transport capacity to move the coarse sedimentsupplied from upstream and from local hillslopes, the bedshould tend to be fully alluviated. Any increase in the rate ofbed load sediment supply (assuming no change in grain
Figure 4. Variation in volume eroded with net energytransferred per unit mass of impacting particles. Data arefrom Head and Harr [1970] for glass plate eroded by glassbeads for normal (a = 90�) and oblique (a = 15�) impactangles.
Figure 5. Variation in erosion rate with normal componentof energy flux, represented by sin2(a). Erosion rates arenormalized by maximum for each experiment.
W06301 SKLAR AND DIETRICH: BEDROCK INCISION BY SALTATING BED LOAD
5 of 21
W06301
size) will cause aggradation until a steeper slope is achievedso that transport capacity again equals the sediment supplyrate. In contrast, when the channel receives no coarsesediment supply, as might occur in mechanically weaklithologies that weather rapidly to suspended load sizeparticles, no coarse sediment is available to form patchesof alluvial cover, and bedrock should be exposed across theentire bed. Here we assume that the fraction of the bedcomposed of exposed bedrock (Fe) varies linearly betweenthese end-members, so that
Fe ¼ 1� qs=qtð Þ for qs � qtf g ð7Þ
where qt is the sediment transport capacity for a fullyalluviated bed. In subsequent calculations we use theFernandez-Luque and van Beek [1976] bed load sedimenttransport relation
qt ¼ 5:7rs RbgD3s
� �1=2t*� tc*ð Þ3=2 ð8Þ
where qt is the sediment mass transport capacity per unitwidth, rs is the sediment density, Rb is the nondimensionalbuoyant density of sediment (Rb = rs/rw � 1), rw is thedensity of water, g is the acceleration due to gravity, t* =tb/[(rs � rw)gDs] is the nondimensional form of theboundary shear stress (tb), and t*c is the value of t* at thethreshold of particle motion.[23] The linear assumption of equation (7) is supported
by flume experiments [Sklar and Dietrich, 2002] in whichwe observe a generally linear increase in bed cover withincreasing sediment supply. The experiments also demon-strate the potential for more complex behavior, such as athreshold supply rate below which alluviation does notoccur and instabilities associated with changing bed rough-ness, particularly for the case of smooth, planar bedrockchannels. We do not attempt to model such nonlinearbehavior, in effect assuming that it will be suppressed by theirregular topography typical of bedrock channel beds.
2.6. Composite Expression
[24] Our simple expression for bedrock abrasion rate, E =ViIrFe, can now be restated by substituting equations (5),(6), and (7) into equation (1) and simplifying, resulting inthe composite expression for bedrock incision rate
E ¼ qsw2siY
Lskvs2T1� qs
qt
� �: ð9Þ
3. Saltation Trajectories
[25] In this section we develop expressions for the salta-tion hop length (Ls) and the vertical component of the
particle impact velocity (wsi), so that we can expressbedrock abrasion rate (equation (9)) directly in terms ofshear stress. The most mechanistically rigorous approachwould be to build a model for saltation over both bedrockand alluvial beds that solves the equations of motion for anindividual grain throughout the saltation trajectory. Theore-tical models have been developed for saltation in water overan alluvial bed [Wiberg and Smith, 1985; Sekine andKikkawa, 1992] and for saltation in air [e.g., Anderson andHaff, 1988]. Such models need to account for the forces dueto hydrodynamic lift and drag, gravity, the virtual masseffect (caused by the relative accelerations of the fluid andparticle), the spinning motion of saltating grains, andcollisions with the bed [Wiberg and Smith, 1985]. This levelof complexity is unnecessary for our purposes here. Instead,we use a large set of published data to obtain a set ofempirical expressions that together constitute a self-consistent description of how saltation trajectories vary asa function of shear stress and grain size.
3.1. Data Sources
[26] The pioneering experimental saltation studies ofFrancis [1973], Fernandez Luque and van Beek [1976],and Abbott and Francis [1977] produced an important set ofobservations and data that has helped guide the develop-ment of bed load transport theory [e.g., Bridge andDominic, 1984]. More recently, the available experimentaldata set has grown considerably with studies by Sekine andKikkawa [1992], Lee and Hsu [1994], Nino et al. [1994],and Hu and Hui [1996a, 1996b]. In each of these studies,measurements of saltation trajectories were obtained fromhigh-speed photographs or video images. In addition tothese seven experimental data sets, we also make use ofsaltation trajectories predicted by the theoretical model ofWiberg and Smith [1985]. A wide range of experimentalconditions are represented in these studies, including fixedand moveable beds, natural and artificial particles, andsupercritical and subcritical flow. We limit our analysis tomeasurements made under hydraulically rough conditions(i.e., Rep > 100, where Rep = rwDsu*/m is the particleReynolds number, u* = (tb/rw)
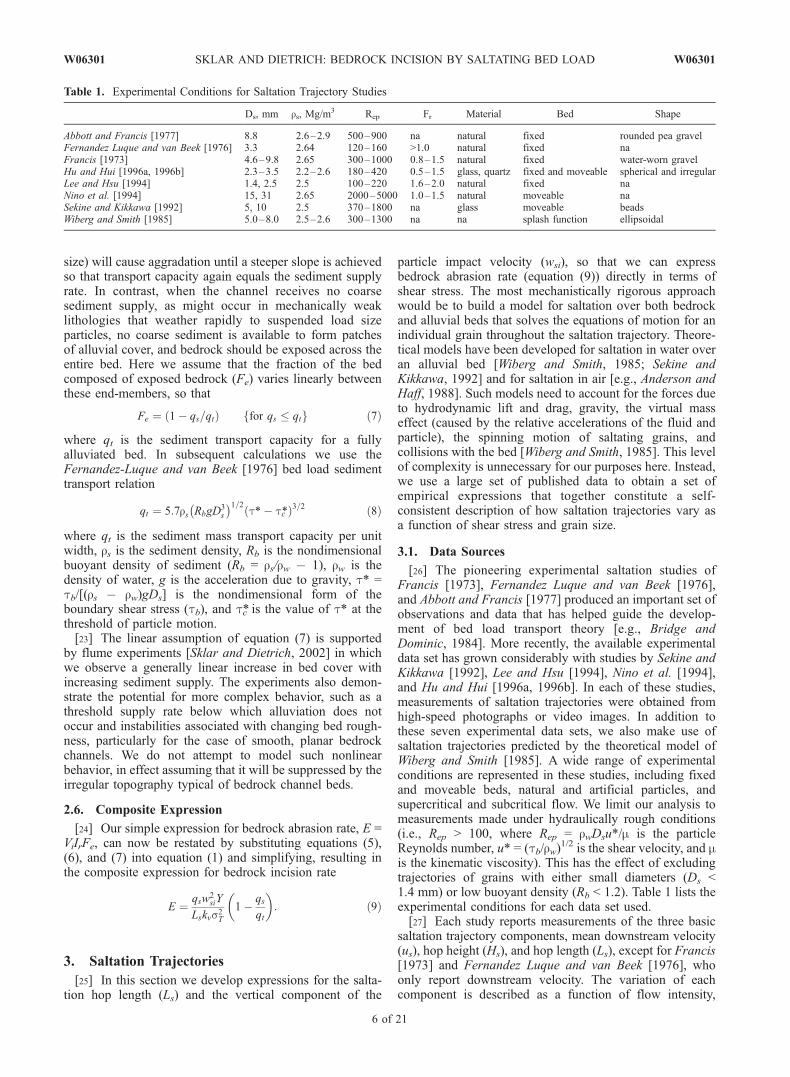
1/2 is the shear velocity, and mis the kinematic viscosity). This has the effect of excludingtrajectories of grains with either small diameters (Ds <1.4 mm) or low buoyant density (Rb < 1.2). Table 1 lists theexperimental conditions for each data set used.[27] Each study reports measurements of the three basic
saltation trajectory components, mean downstream velocity(us), hop height (Hs), and hop length (Ls), except for Francis[1973] and Fernandez Luque and van Beek [1976], whoonly report downstream velocity. The variation of eachcomponent is described as a function of flow intensity,
Table 1. Experimental Conditions for Saltation Trajectory Studies
Ds, mm rs, Mg/m3 Rep Fr Material Bed Shape
Abbott and Francis [1977] 8.8 2.6–2.9 500–900 na natural fixed rounded pea gravelFernandez Luque and van Beek [1976] 3.3 2.64 120–160 >1.0 natural fixed naFrancis [1973] 4.6–9.8 2.65 300–1000 0.8–1.5 natural fixed water-worn gravelHu and Hui [1996a, 1996b] 2.3–3.5 2.2–2.6 180–420 0.5–1.5 glass, quartz fixed and moveable spherical and irregularLee and Hsu [1994] 1.4, 2.5 2.5 100–220 1.6–2.0 natural fixed naNino et al. [1994] 15, 31 2.65 2000–5000 1.0–1.5 natural moveable naSekine and Kikkawa [1992] 5, 10 2.5 370–1800 na glass moveable beadsWiberg and Smith [1985] 5.0–8.0 2.5–2.6 300–1300 na na splash function ellipsoidal
6 of 21
W06301 SKLAR AND DIETRICH: BEDROCK INCISION BY SALTATING BED LOAD W06301
represented either by nondimensional shear stress (t*) orshear velocity (u*). No study reports direct measurementsof the vertical component of the impact velocity (wsi),one of the two saltation trajectory components we seek topredict. We can, however, estimate wsi from the meanparticle descent velocity (wsd), which depends on thethree basic saltation trajectory components, us, Hs and Ls(Figure 3).[28] Rather than select the results of any single study as
the best general representation of saltation trajectories, wechoose to find relationships that best fit the trends of thedata taken as an ensemble. This requires finding thenondimensionalization that provides the best collapse ofthe data for each variable. These algebraic manipulationsrequire no additional information except in two cases, thedata of Abbott and Francis [1977] and Sekine andKikkawa [1992] for which we must assume a value fort*c. We chose t*c = 0.03 because a low value is appropriatefor motion over fixed beds and for grains introduced intothe flow from above [Buffington and Montgomery, 1997].Table 2 provides details on the data source and conversioninformation for each data set.
3.2. Mean Downstream Saltation Velocity (us)
[29] We find the best data collapse when we nondimen-sionalize us by dividing by (RbgDs)
1/2. Figure 6 shows thevariation in mean downstream saltation velocity withtransport stage (t*/t*c). The best fit log-log linear regressionline through the data ensemble is
us
RbgDsð Þ0:5¼ 0:83
t*tc*
� �0:83
: ð10Þ
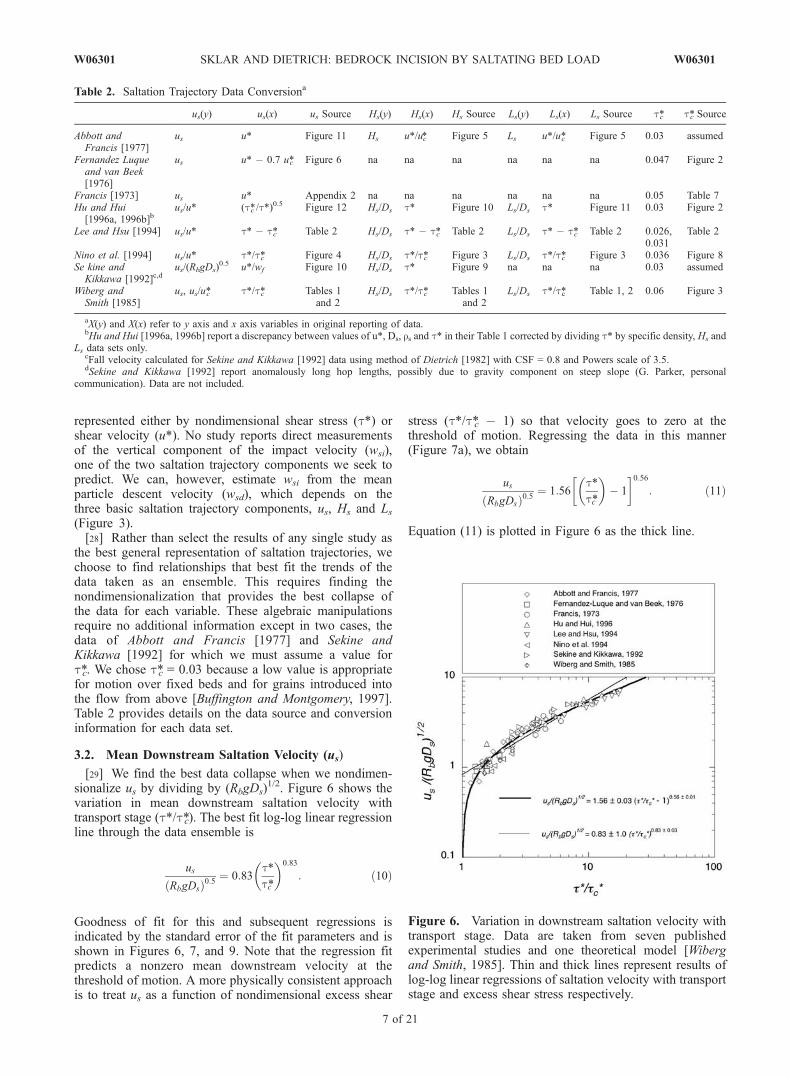
Goodness of fit for this and subsequent regressions isindicated by the standard error of the fit parameters and isshown in Figures 6, 7, and 9. Note that the regression fitpredicts a nonzero mean downstream velocity at thethreshold of motion. A more physically consistent approachis to treat us as a function of nondimensional excess shear
stress (t*/t*c � 1) so that velocity goes to zero at thethreshold of motion. Regressing the data in this manner(Figure 7a), we obtain
us
RbgDsð Þ0:5¼ 1:56
t*tc*
� �� 1
� �0:56: ð11Þ
Equation (11) is plotted in Figure 6 as the thick line.
Table 2. Saltation Trajectory Data Conversiona
us(y) us(x) us Source Hs(y) Hs(x) Hs Source Ls(y) Ls(x) Ls Source t*c t*c Source
Abbott andFrancis [1977]
us u* Figure 11 Hs u*/uc* Figure 5 Ls u*/u*c Figure 5 0.03 assumed
Fernandez Luqueand van Beek[1976]
us u* � 0.7 u*c Figure 6 na na na na na na 0.047 Figure 2
Francis [1973] us u* Appendix 2 na na na na na na 0.05 Table 7Hu and Hui
[1996a, 1996b]bus/u* (t*c /t*)
0.5 Figure 12 Hs/Ds t* Figure 10 Ls/Ds t* Figure 11 0.03 Figure 2
Lee and Hsu [1994] us/u* t* � t*c Table 2 Hs/Ds t* � t*c Table 2 Ls/Ds t* � t*c Table 2 0.026,0.031
Table 2
Nino et al. [1994] us/u* t*/t*c Figure 4 Hs/Ds t*/t*c Figure 3 Ls/Ds t*/t*c Figure 3 0.036 Figure 8Se kine and
Kikkawa [1992]c,dus/(RbgDs)
0.5 u*/wf Figure 10 Hs/Ds t* Figure 9 na na na 0.03 assumed
Wiberg andSmith [1985]
us, us/u*c t*/t*c Tables 1and 2
Hs/Ds t*/t*c Tables 1and 2
Ls/Ds t*/t*c Table 1, 2 0.06 Figure 3
aX(y) and X(x) refer to y axis and x axis variables in original reporting of data.bHu and Hui [1996a, 1996b] report a discrepancy between values of u*, Ds, rs and t* in their Table 1 corrected by dividing t* by specific density, Hs and
Ls data sets only.cFall velocity calculated for Sekine and Kikkawa [1992] data using method of Dietrich [1982] with CSF = 0.8 and Powers scale of 3.5.dSekine and Kikkawa [1992] report anomalously long hop lengths, possibly due to gravity component on steep slope (G. Parker, personal
communication). Data are not included.
Figure 6. Variation in downstream saltation velocity withtransport stage. Data are taken from seven publishedexperimental studies and one theoretical model [Wibergand Smith, 1985]. Thin and thick lines represent results oflog-log linear regressions of saltation velocity with transportstage and excess shear stress respectively.
W06301 SKLAR AND DIETRICH: BEDROCK INCISION BY SALTATING BED LOAD
7 of 21
W06301
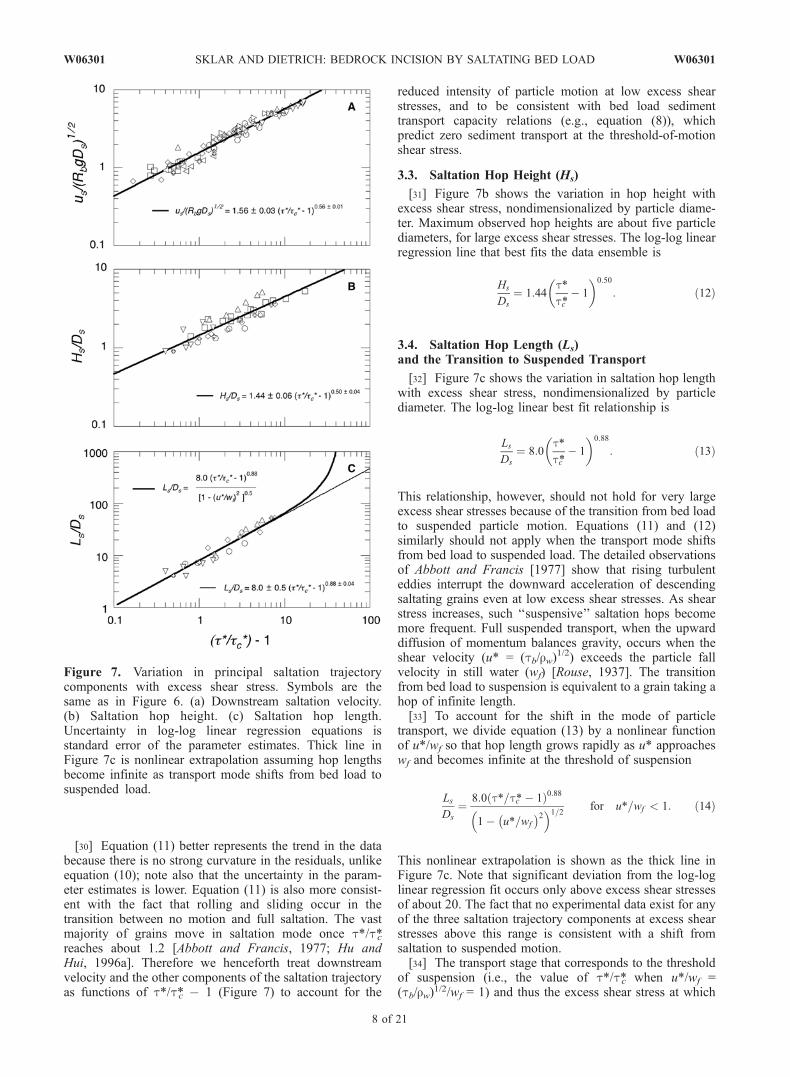
[30] Equation (11) better represents the trend in the databecause there is no strong curvature in the residuals, unlikeequation (10); note also that the uncertainty in the param-eter estimates is lower. Equation (11) is also more consist-ent with the fact that rolling and sliding occur in thetransition between no motion and full saltation. The vastmajority of grains move in saltation mode once t*/t*creaches about 1.2 [Abbott and Francis, 1977; Hu andHui, 1996a]. Therefore we henceforth treat downstreamvelocity and the other components of the saltation trajectoryas functions of t*/t*c � 1 (Figure 7) to account for the
reduced intensity of particle motion at low excess shearstresses, and to be consistent with bed load sedimenttransport capacity relations (e.g., equation (8)), whichpredict zero sediment transport at the threshold-of-motionshear stress.
3.3. Saltation Hop Height (Hs)
[31] Figure 7b shows the variation in hop height withexcess shear stress, nondimensionalized by particle diame-ter. Maximum observed hop heights are about five particlediameters, for large excess shear stresses. The log-log linearregression line that best fits the data ensemble is
Hs
Ds
¼ 1:44t*tc*
� 1
� �0:50
: ð12Þ
3.4. Saltation Hop Length (Ls)and the Transition to Suspended Transport
[32] Figure 7c shows the variation in saltation hop lengthwith excess shear stress, nondimensionalized by particlediameter. The log-log linear best fit relationship is
Ls
Ds
¼ 8:0t*tc*
� 1
� �0:88
: ð13Þ
This relationship, however, should not hold for very largeexcess shear stresses because of the transition from bed loadto suspended particle motion. Equations (11) and (12)similarly should not apply when the transport mode shiftsfrom bed load to suspended load. The detailed observationsof Abbott and Francis [1977] show that rising turbulenteddies interrupt the downward acceleration of descendingsaltating grains even at low excess shear stresses. As shearstress increases, such ‘‘suspensive’’ saltation hops becomemore frequent. Full suspended transport, when the upwarddiffusion of momentum balances gravity, occurs when theshear velocity (u* = (tb/rw)
1/2) exceeds the particle fallvelocity in still water (wf) [Rouse, 1937]. The transitionfrom bed load to suspension is equivalent to a grain taking ahop of infinite length.[33] To account for the shift in the mode of particle
transport, we divide equation (13) by a nonlinear functionof u*/wf so that hop length grows rapidly as u* approacheswf and becomes infinite at the threshold of suspension
Ls
Ds
¼ 8:0 t*=tc*� 1ð Þ0:88
1� u*=wf
� �2� �1=2 for u*=wf < 1: ð14Þ
This nonlinear extrapolation is shown as the thick line inFigure 7c. Note that significant deviation from the log-loglinear regression fit occurs only above excess shear stressesof about 20. The fact that no experimental data exist for anyof the three saltation trajectory components at excess shearstresses above this range is consistent with a shift fromsaltation to suspended motion.[34] The transport stage that corresponds to the threshold
of suspension (i.e., the value of t*/t*c when u*/wf =(tb/rw)1/2/wf = 1) and thus the excess shear stress at which
Figure 7. Variation in principal saltation trajectorycomponents with excess shear stress. Symbols are thesame as in Figure 6. (a) Downstream saltation velocity.(b) Saltation hop height. (c) Saltation hop length.Uncertainty in log-log linear regression equations isstandard error of the parameter estimates. Thick line inFigure 7c is nonlinear extrapolation assuming hop lengthsbecome infinite as transport mode shifts from bed load tosuspended load.
8 of 21
W06301 SKLAR AND DIETRICH: BEDROCK INCISION BY SALTATING BED LOAD W06301
saltation hop length becomes infinite, depends nonlinearlyon grain size
t*tc*
� �susp
¼w2f
tc*RbgDs
ð15Þ
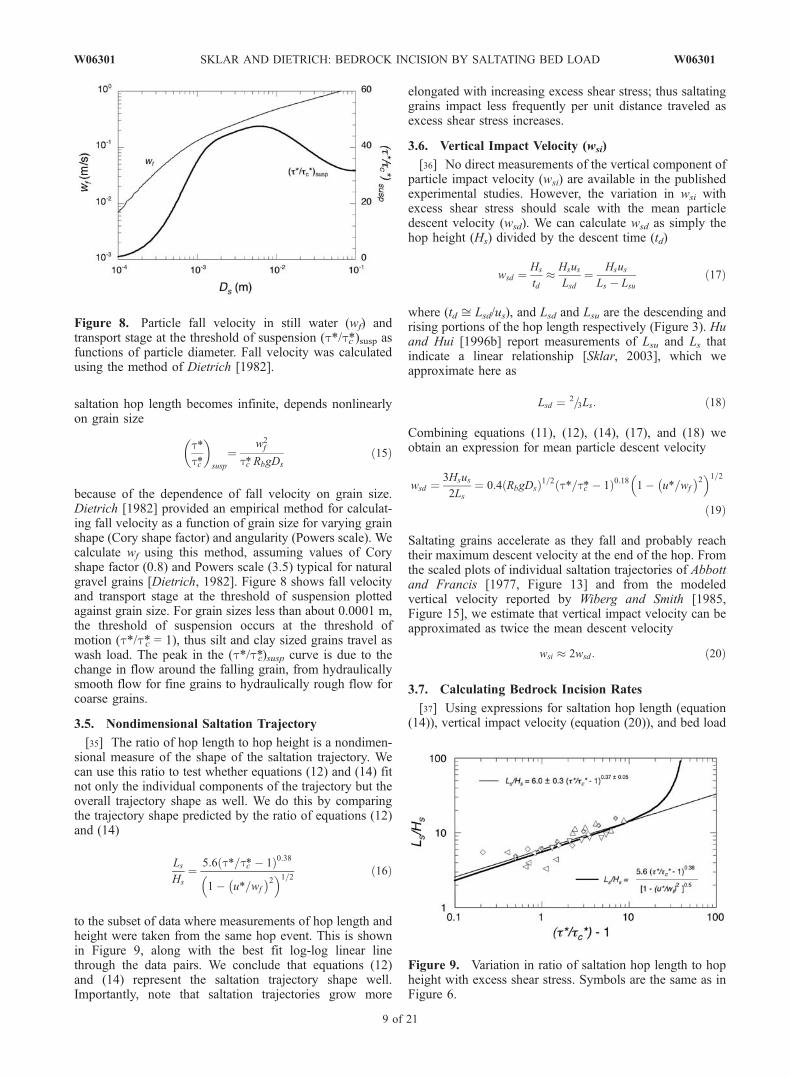
because of the dependence of fall velocity on grain size.Dietrich [1982] provided an empirical method for calculat-ing fall velocity as a function of grain size for varying grainshape (Cory shape factor) and angularity (Powers scale). Wecalculate wf using this method, assuming values of Coryshape factor (0.8) and Powers scale (3.5) typical for naturalgravel grains [Dietrich, 1982]. Figure 8 shows fall velocityand transport stage at the threshold of suspension plottedagainst grain size. For grain sizes less than about 0.0001 m,the threshold of suspension occurs at the threshold ofmotion (t*/t*c = 1), thus silt and clay sized grains travel aswash load. The peak in the (t*/t*c)susp curve is due to thechange in flow around the falling grain, from hydraulicallysmooth flow for fine grains to hydraulically rough flow forcoarse grains.
3.5. Nondimensional Saltation Trajectory
[35] The ratio of hop length to hop height is a nondimen-sional measure of the shape of the saltation trajectory. Wecan use this ratio to test whether equations (12) and (14) fitnot only the individual components of the trajectory but theoverall trajectory shape as well. We do this by comparingthe trajectory shape predicted by the ratio of equations (12)and (14)
Ls
Hs
¼ 5:6 t*=tc*� 1ð Þ0:38
1� u*=wf
� �2� �1=2 ð16Þ
to the subset of data where measurements of hop length andheight were taken from the same hop event. This is shownin Figure 9, along with the best fit log-log linear linethrough the data pairs. We conclude that equations (12)and (14) represent the saltation trajectory shape well.Importantly, note that saltation trajectories grow more
elongated with increasing excess shear stress; thus saltatinggrains impact less frequently per unit distance traveled asexcess shear stress increases.
3.6. Vertical Impact Velocity (wsi)
[36] No direct measurements of the vertical component ofparticle impact velocity (wsi) are available in the publishedexperimental studies. However, the variation in wsi withexcess shear stress should scale with the mean particledescent velocity (wsd). We can calculate wsd as simply thehop height (Hs) divided by the descent time (td)
wsd ¼Hs
td� Hsus
Lsd¼ Hsus
Ls � Lsuð17Þ
where (td ffi Lsd/us), and Lsd and Lsu are the descending andrising portions of the hop length respectively (Figure 3). Huand Hui [1996b] report measurements of Lsu and Ls thatindicate a linear relationship [Sklar, 2003], which weapproximate here as
Lsd ¼ 2=3Ls: ð18Þ
Combining equations (11), (12), (14), (17), and (18) weobtain an expression for mean particle descent velocity
wsd ¼3Hsus
2Ls¼ 0:4 RbgDsð Þ1=2 t*=tc*� 1ð Þ0:18 1� u*=wf
� �2� �1=2ð19Þ
Saltating grains accelerate as they fall and probably reachtheir maximum descent velocity at the end of the hop. Fromthe scaled plots of individual saltation trajectories of Abbottand Francis [1977, Figure 13] and from the modeledvertical velocity reported by Wiberg and Smith [1985,Figure 15], we estimate that vertical impact velocity can beapproximated as twice the mean descent velocity
wsi � 2wsd : ð20Þ
3.7. Calculating Bedrock Incision Rates
[37] Using expressions for saltation hop length (equation(14)), vertical impact velocity (equation (20)), and bed load
Figure 8. Particle fall velocity in still water (wf) andtransport stage at the threshold of suspension (t*/t*c )susp asfunctions of particle diameter. Fall velocity was calculatedusing the method of Dietrich [1982].
Figure 9. Variation in ratio of saltation hop length to hopheight with excess shear stress. Symbols are the same as inFigure 6.
W06301 SKLAR AND DIETRICH: BEDROCK INCISION BY SALTATING BED LOAD
9 of 21
W06301
sediment transport capacity (equation (8)), we can nowexpress the three component terms of the saltation-abrasionbedrock incision model directly in terms of excess shearstress
Vi ¼prsRbgD
4s Y
9:4kvs2T
t*tc*
� 1
� �0:36
1� u*
wf
� �2 !
ð21Þ
Ir ¼3qs
4prsD4s
t*tc*
� 1
� ��0:88
1� us
wf
� �2 !0:5
ð22Þ
Fe ¼ 1� qs
5:7rs RbgD3stc*
3� �0:5 t*
tc*� 1
� ��1:5
: ð23Þ
Multiplying these three terms, rounding the resultingexponent on excess shear stress to one decimal place (i.e.,�0.52 �0.5), and simplifying we obtain a final form ofthe saltation-abrasion bedrock incision model
E ¼ 0:08RbgY
kvs2tqs
t*tc*
� 1
� ��1=2
1� qs
qt
� �1� us
wf
� �2 !3=2
ð24aÞ
for qs � qt and u* � wf (E = 0 for qs > qt or for u* > wf). Ifwe neglect the suspension effect term, or equivalentlyconsider only excess shear stresses well below the thresholdof suspension{i.e., 0 < (t*/t*c � 1) < 10}, and substituteequation (8) for qt and rearrange, we obtain a simplerexpression for bedrock abrasion rate
E ¼ k1qs
t*=tc*� 1ð Þ1=2� k2
q2s
D3=2s t*=tc*� 1ð Þ2
ð24bÞ
where the tools effect and cover effect are represented bythe first and second terms respectively, k1 = 0.08YRbg/kvsT,k2 = 0.014Y(Rbg)
0.5/(t*c)1.5kvst
2rs, valid for qs � qt.[38] In the model results reported below, we use
equation (24a) to calculate bedrock incision rates fromseven input variables: channel slope (S), channel width(W), total sediment supply rate (Qs = qsW), discharge (Qw),grain size (Ds), a channel roughness parameter (n), androck tensile strength (sT). Average boundary shear stress(tb) is calculated using the hydraulic radius (rh) in placeof flow depth (Hw) to account for drag due to the channelbanks
tb ¼ rwgrhS ð25Þ
where rh is found using the Manning equation for meanflow velocity uw = rh
2/3S1/2/n and assuming a rectangularchannel cross section
rh ¼HwW
2Hw þW¼ Qwn
HwWS1=2
� �3=2
: ð26Þ
All other quantities (rs, rw, g, t*c, and Y) are consideredconstants. Note that the only remaining free parameter is
kv, the dimensionless proportionality constant relating rockresistance (ev) to elastic strain energy (b = sT
2/2Y) inequation (4). In section 6 we use experimental measure-ments of bedrock wear [Sklar and Dietrich, 2001] toobtain an order of magnitude estimate for kv of 1012.
4. Model Results
[39] The saltation-abrasion model (equation (24)) sug-gests that rates of bedrock incision by saltating bed loadshould depend, for a given rock strength, on three principalvariables: shear stress, sediment supply, and grain size. Inthis section, we explore the behavior of the saltation-abrasion bedrock incision model as we vary each of thosethree principal variables independently. We then use anondimensional form of the model to show that the fullmodel behavior can be depicted compactly in a singlenondimensional graph. Note that in all the calculationsreported below we have been careful not to violate theassumptions underlying the development of the model, forexample flow depths are always greater than the graindiameter and particle Reynolds numbers remain in thehydraulically rough regime.[40] To help guide our selection of model input values
we use a particular reach of bedrock river as a referencesite, a gauged reach of the South Fork Eel River innorthern California (Figure 1) [Seidl and Dietrich, 1992;Howard, 1998]. This actively incising, mixed alluvial-bedrock bedded canyon river motivated many of theassumptions underlying development of this model. Weuse the reference site as a device to ensure a physicallyreasonable set of values for the variables held constant aswe conduct the following model sensitivity analysis, andto provide perspective on the extent of the range ofpossible input values encompassed by the model para-meter space.[41] Table 3 lists the reference site values for channel
geometry, roughness, rock strength, discharge, sedimentsupply, and grain size used as model inputs in thefollowing sensitivity analysis. Also listed are some ofthe calculated hydraulic conditions, such as flow depthand mean velocity, and model output for the referencesite. The choice of values of discharge and sedimentsupply to represent the reference site is developed fullyby Sklar [2003]. The reference discharge of 39.1 m3/s hasan exceedence probability of 0.013 for mean daily flow,based on analysis of a 24 year record of daily meandischarges, USGS gauge 11475500 ‘‘S.Fork Eel nearBranscom, CA.’’ A 24 hour duration of the reference bedload sediment supply of 42.6 kg/s would represent 6% ofthe annual coarse sediment yield to the reach assuming anaverage landscape lowering rate of 0.9 mm/yr [Merritts andBull, 1989] and that 22% of the total load is in the bed loadsize range.[42] We assume here that the net effect of the full
distribution of discharge and sediment supply events intransporting sediment and eroding bedrock, can beaccomplished by the reference discharge and sedimentsupply acting over a limited duration, which in thiscase is approximately 22 days per year. We assume thatflows too low to mobilize sediment (and thus erodebedrock) occur on the remaining 343 days. For refer-ence site conditions, the saltation-abrasion model pre-
10 of 21
W06301 SKLAR AND DIETRICH: BEDROCK INCISION BY SALTATING BED LOAD W06301
dicts an instantaneous bedrock incision rate of 20 mm/yr(0.056 mm/day), which is equivalent to an annual averageincision rate of 0.9 mm/yr. Note that in each of the figuresshowing model results in this section (Figures 10, 11, 12,
13, 14, and 15), the curve passing through the reference sitevalues is plotted with a thick solid line; an open circleindicates the reference site.
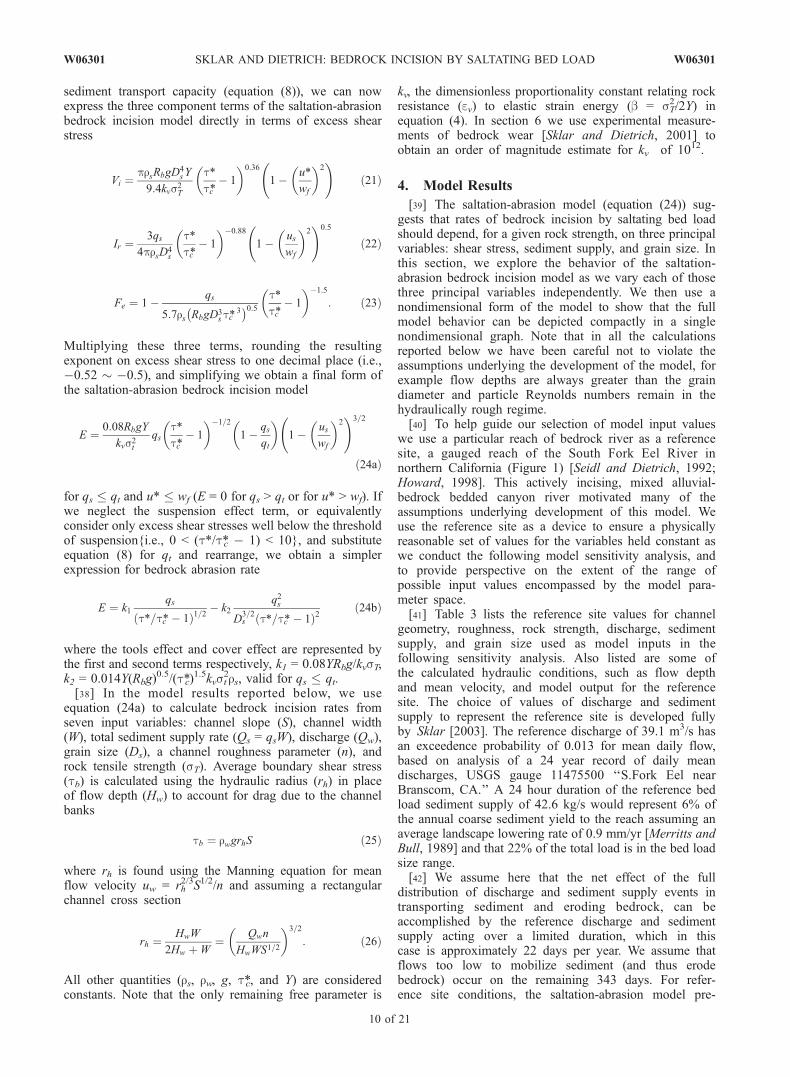
4.1. Influence of Sediment Supply
[43] Figure 10 shows how incision rate predicted bythe saltation-abrasion model varies with sediment supply,holding all other input variables to constant referencesite values. Also plotted are the component terms fromequation (1), the volume eroded per impact (Vi), the rate ofimpacts by saltating grains (Ir), and the fraction of bed areaexposed to abrasive wear (Fe). We find a parabolicvariation in erosion rate, as expected from equation (24).At low supply rates, incision rate grows with increasingsediment supply, reflecting the growth in impact rate. Athigh supply rates, incision rate decreases with increasingsupply rate, due to the reduction in the fraction of bedarea exposed. Erosion rate is zero when the sedimentsupply equals the transport capacity and the bed is fullyalluviated, and in the trivial case when there is nosediment supply. The maximum incision rate correspondsto a critical level of sediment supply where the growth inimpact rate is balanced by the reduction in fraction of bedarea exposed. Because shear stress and grain size are notvaried here, the volume eroded per impact remainsconstant.[44] If we repeat this calculation for different values of
channel slope, and thus different shear stresses, we generatea set of parabolic erosion rate curves, as shown in Figure 11.As shear stress increases from the threshold of motion, thepeak erosion rate increases along with the sediment supplyrate required to alluviate the bed and shut off incision. Astransport stage rises above a value of about 10, however, themagnitude of the peak erosion rate begins to decline. Thisoccurs because the increase in particle impact energy withgreater excess shear stress is more than offset by the
Table 3. Reference Site Model Input and Output Valuesa
Value
Model InputsChannel slope S 0.0053b
Discharge Qw 39.1 m3/sc
Grain diameter Ds 0.060 mb
Sediment supply Qs 42.6 kg/sc
Channel width W 18.0 mb
Roughness n 0.035d
Rock tensile strength sT 7.0 MPae
Rock elastic modulus Y 5.0 � 104 MPad
Dimensionless rock resistance parameter kv 1.0 � 1012 e
Nondimensional critical shear stress t*c 0.030d
Sediment density rs 2650 kg/m3 d
Water density rw 1000 kg/m3 d
Model OutputsInstantaneous erosion rate E 20.5 mm/yrFlow depth Hw 1.1 mMean flow velocity uw 2.0 m/sFroude number Fr 0.62Transport stage t*/t*c 1.7Sediment transport capacity Qt 50.2 kg/sRatio of shear velocity to fall velocity u*/wf 0.24Boundary shear stress tb 53.7 Pa
aThese values are used in model calculations unless otherwise specified.Values for channel conditions and water and sediment fluxes are intended toapproximate a gauged reach of the South Fork Eel River, MendocinoCounty, California. Also listed are values of model output for reference siteconditions.
bField survey.cMagnitude frequency analysis [Sklar, 2003].dAssumed.eLaboratory measurement.
Figure 10. Erosion rate as a function of sediment supplypredicted by saltation-abrasion model (equation (24a)). Alsoplotted are the model component terms: volume eroded perunit impact (Vi), impact rate per unit area (Ir), and thefraction of the bedrock bed exposed (Fe). Table 3 lists thevalues of input variables held constant. The open circledenotes the predicted instantaneous erosion rate at the SouthFork Eel reference site.
Figure 11. Erosion rate as a function of sediment supplyfor various channel slopes, with corresponding transportstage noted. Thick solid line corresponds to ‘‘reference site’’conditions (Table 3) and curve of Figure 10.
W06301 SKLAR AND DIETRICH: BEDROCK INCISION BY SALTATING BED LOAD
11 of 21
W06301
reduction in frequency of particle impact as the saltationhop length rapidly lengthens.
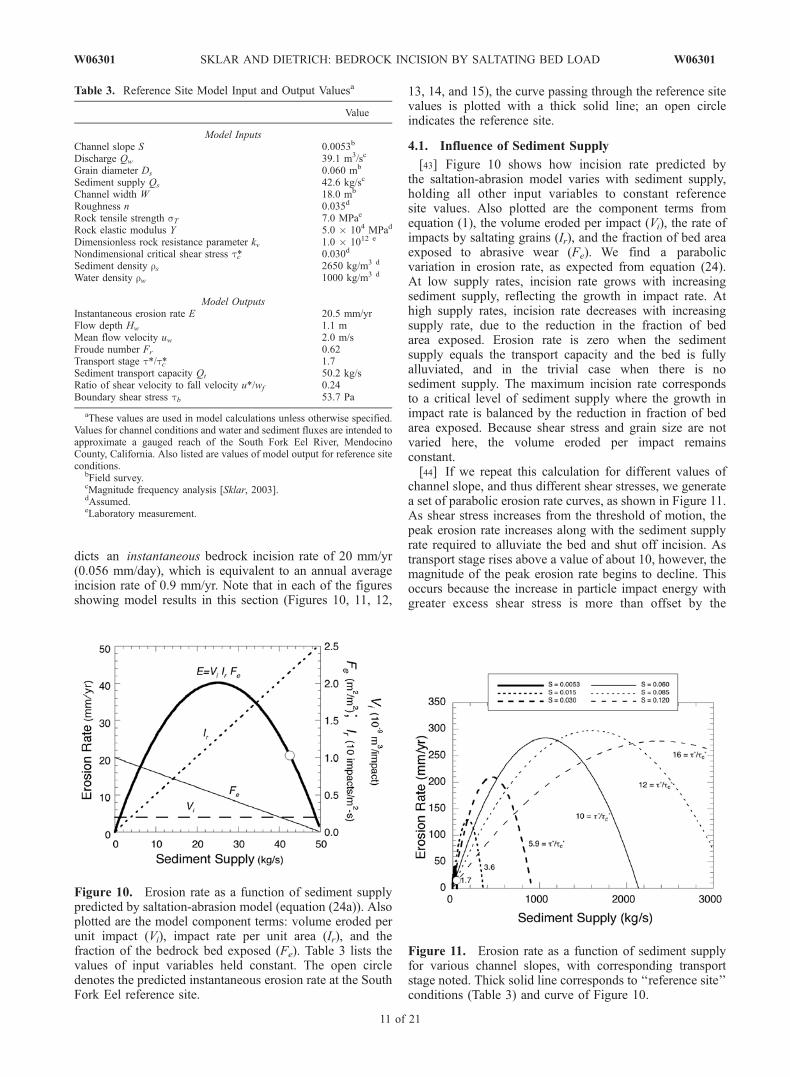
4.2. Influence of Transport Stage
[45] The dependence of erosion rate on excess shearstress is more clearly illustrated in Figure 12, where weagain plot erosion rate along with the component terms fromequation (1), now holding sediment supply and othervariables constant. Erosion rate is zero below the transportstage required to transport the supplied sediment load. Eventhough transport stage exceeds the threshold of motion, thebed is assumed fully alluviated. Erosion rate increasesrapidly once there is excess sediment transport capacity,reflecting the growth in both the extent of bedrock exposurein the channel bed and the particle impact energy. Theerosion rate peaks due to a decline in the rate of growth in Viand Fe, so that these two terms no longer offset thecontinuous reduction in impact frequency (plotted sepa-rately on a logarithmic scale) with increasing shear stress.Erosion rates go to zero for high-transport stage as thesaltation hop length approaches infinity at the threshold ofsuspension. Note that the peak erosion rate occurs at anexcess shear stress well within the range of experimentalsaltation data used to parameterize the model, and is not anartifact of the extrapolation we use to account for thetransition from bed load to suspended transport mode(equation (14)). The peak in erosion rate with increasingshear stress (hereafter called the ‘‘transport peak’’ asdistinguished from the ‘‘supply peak’’ discussed above)occurs at a relatively low transport stage in Figure 12because sediment supply is held constant. The transportpeak would occur at a higher excess shear stress if weallowed sediment supply to increase along with shear stress.[46] Figure 13 illustrates the variation in incision rate
with shear stress for various levels of sediment supply,holding the remaining variables constant. Greater rates ofsediment supply require greater excess transport capacity toexpose bedrock and initiate incision (i.e., for qt > qs). Peakerosion rates occur at greater transport stages for larger
sediment supply rates. The magnitude of the peak erosionrate rises and then declines with increasing sediment supplyrate. This is similar to the pattern of the erosion rate peaksshown in Figure 11, except that now the roles of sedimentsupply and shear stress are reversed. Erosion rate goes to zeroin all cases as transport stage approaches the threshold ofsuspension, which forDs = 0.06 m occurs when t*/t*c ffi 30.
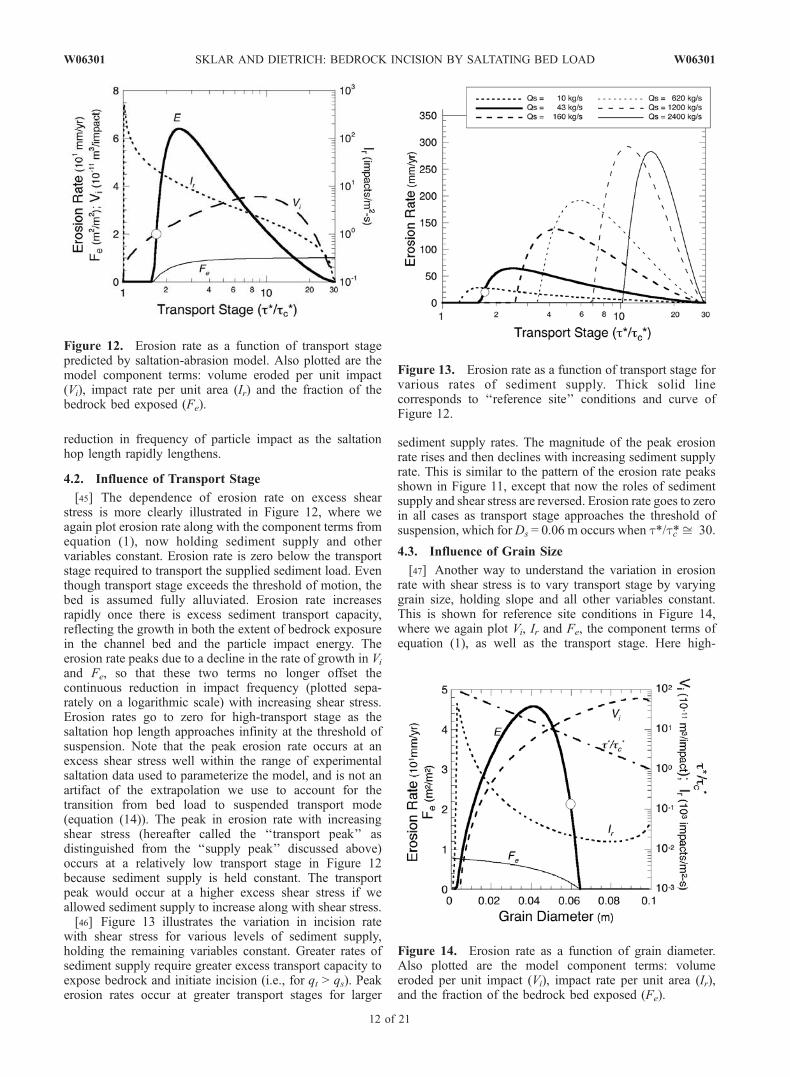
4.3. Influence of Grain Size
[47] Another way to understand the variation in erosionrate with shear stress is to vary transport stage by varyinggrain size, holding slope and all other variables constant.This is shown for reference site conditions in Figure 14,where we again plot Vi, Ir and Fe, the component terms ofequation (1), as well as the transport stage. Here high-
Figure 12. Erosion rate as a function of transport stagepredicted by saltation-abrasion model. Also plotted are themodel component terms: volume eroded per unit impact(Vi), impact rate per unit area (Ir) and the fraction of thebedrock bed exposed (Fe).
Figure 13. Erosion rate as a function of transport stage forvarious rates of sediment supply. Thick solid linecorresponds to ‘‘reference site’’ conditions and curve ofFigure 12.
Figure 14. Erosion rate as a function of grain diameter.Also plotted are the model component terms: volumeeroded per unit impact (Vi), impact rate per unit area (Ir),and the fraction of the bedrock bed exposed (Fe).
12 of 21
W06301 SKLAR AND DIETRICH: BEDROCK INCISION BY SALTATING BED LOAD W06301
transport stage corresponds to small grain size, because Ds
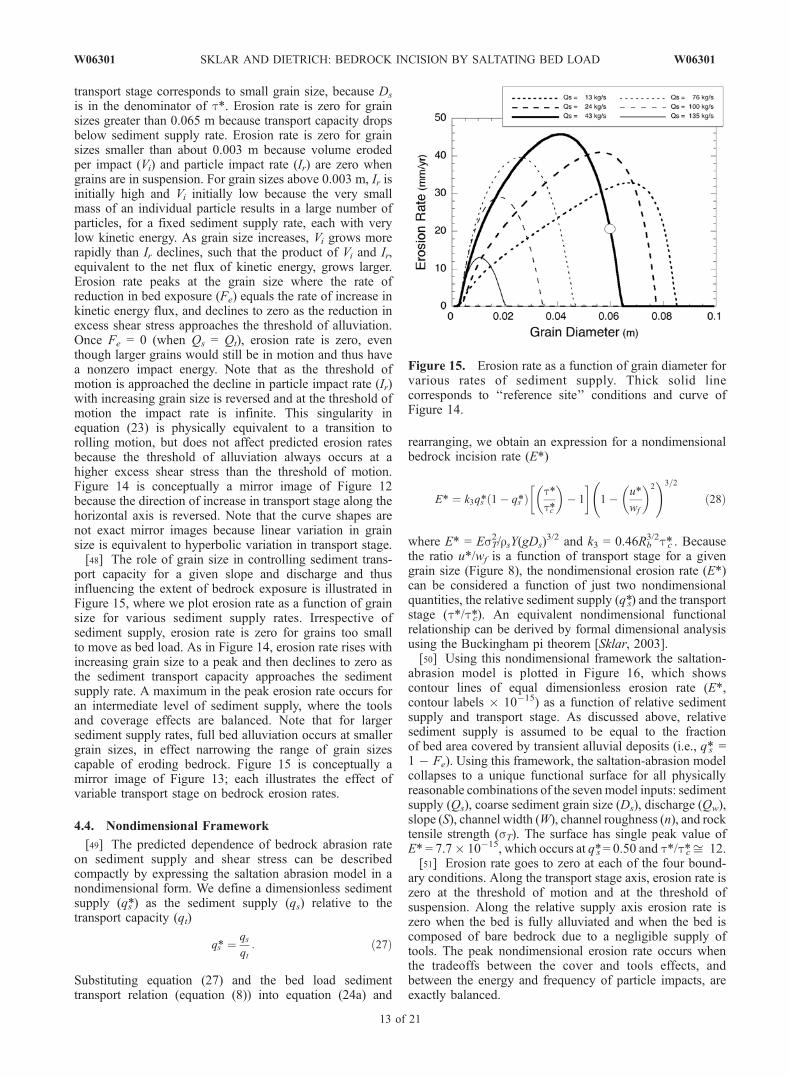
is in the denominator of t*. Erosion rate is zero for grainsizes greater than 0.065 m because transport capacity dropsbelow sediment supply rate. Erosion rate is zero for grainsizes smaller than about 0.003 m because volume erodedper impact (Vi) and particle impact rate (Ir) are zero whengrains are in suspension. For grain sizes above 0.003 m, Ir isinitially high and Vi initially low because the very smallmass of an individual particle results in a large number ofparticles, for a fixed sediment supply rate, each with verylow kinetic energy. As grain size increases, Vi grows morerapidly than Ir declines, such that the product of Vi and Ir,equivalent to the net flux of kinetic energy, grows larger.Erosion rate peaks at the grain size where the rate ofreduction in bed exposure (Fe) equals the rate of increase inkinetic energy flux, and declines to zero as the reduction inexcess shear stress approaches the threshold of alluviation.Once Fe = 0 (when Qs = Qt), erosion rate is zero, eventhough larger grains would still be in motion and thus havea nonzero impact energy. Note that as the threshold ofmotion is approached the decline in particle impact rate (Ir)with increasing grain size is reversed and at the threshold ofmotion the impact rate is infinite. This singularity inequation (23) is physically equivalent to a transition torolling motion, but does not affect predicted erosion ratesbecause the threshold of alluviation always occurs at ahigher excess shear stress than the threshold of motion.Figure 14 is conceptually a mirror image of Figure 12because the direction of increase in transport stage along thehorizontal axis is reversed. Note that the curve shapes arenot exact mirror images because linear variation in grainsize is equivalent to hyperbolic variation in transport stage.[48] The role of grain size in controlling sediment trans-
port capacity for a given slope and discharge and thusinfluencing the extent of bedrock exposure is illustrated inFigure 15, where we plot erosion rate as a function of grainsize for various sediment supply rates. Irrespective ofsediment supply, erosion rate is zero for grains too smallto move as bed load. As in Figure 14, erosion rate rises withincreasing grain size to a peak and then declines to zero asthe sediment transport capacity approaches the sedimentsupply rate. A maximum in the peak erosion rate occurs foran intermediate level of sediment supply, where the toolsand coverage effects are balanced. Note that for largersediment supply rates, full bed alluviation occurs at smallergrain sizes, in effect narrowing the range of grain sizescapable of eroding bedrock. Figure 15 is conceptually amirror image of Figure 13; each illustrates the effect ofvariable transport stage on bedrock erosion rates.
4.4. Nondimensional Framework
[49] The predicted dependence of bedrock abrasion rateon sediment supply and shear stress can be describedcompactly by expressing the saltation abrasion model in anondimensional form. We define a dimensionless sedimentsupply (q*s ) as the sediment supply (qs) relative to thetransport capacity (qt)
qs* ¼ qs
qt: ð27Þ
Substituting equation (27) and the bed load sedimenttransport relation (equation (8)) into equation (24a) and
rearranging, we obtain an expression for a nondimensionalbedrock incision rate (E*)
E* ¼ k3qs* 1� qs*ð Þ t*tc*
� �� 1
� �1� u*
wf
� �2 !3=2
ð28Þ
where E* = EsT2/rsY(gDs)
3/2 and k3 = 0.46Rb3/2t*c . Because
the ratio u*/wf is a function of transport stage for a givengrain size (Figure 8), the nondimensional erosion rate (E*)can be considered a function of just two nondimensionalquantities, the relative sediment supply (q*s) and the transportstage (t*/t*c). An equivalent nondimensional functionalrelationship can be derived by formal dimensional analysisusing the Buckingham pi theorem [Sklar, 2003].[50] Using this nondimensional framework the saltation-
abrasion model is plotted in Figure 16, which showscontour lines of equal dimensionless erosion rate (E*,contour labels � 10�15) as a function of relative sedimentsupply and transport stage. As discussed above, relativesediment supply is assumed to be equal to the fractionof bed area covered by transient alluvial deposits (i.e., q*s =1 � Fe). Using this framework, the saltation-abrasion modelcollapses to a unique functional surface for all physicallyreasonable combinations of the sevenmodel inputs: sedimentsupply (Qs), coarse sediment grain size (Ds), discharge (Qw),slope (S), channel width (W), channel roughness (n), and rocktensile strength (sT). The surface has single peak value ofE* = 7.7� 10�15, which occurs at q*s = 0.50 and t*/t*cffi 12.[51] Erosion rate goes to zero at each of the four bound-
ary conditions. Along the transport stage axis, erosion rate iszero at the threshold of motion and at the threshold ofsuspension. Along the relative supply axis erosion rate iszero when the bed is fully alluviated and when the bed iscomposed of bare bedrock due to a negligible supply oftools. The peak nondimensional erosion rate occurs whenthe tradeoffs between the cover and tools effects, andbetween the energy and frequency of particle impacts, areexactly balanced.
Figure 15. Erosion rate as a function of grain diameter forvarious rates of sediment supply. Thick solid linecorresponds to ‘‘reference site’’ conditions and curve ofFigure 14.
W06301 SKLAR AND DIETRICH: BEDROCK INCISION BY SALTATING BED LOAD
13 of 21
W06301

[52] Figure 17 shows how the three curves correspondingto reference site conditions in Figures 11, 13, and 15 are, ineffect, vertical slices through the nondimensional erosionfunction surface. Varying sediment supply while holdingshear stress constant (Figure 17a, as in Figure 11) creates avertical slice parallel to the relative supply axis. Similarly,varying transport stage while holding supply constant,either by increasing slope (Figure 17b, as in Figure 13) orby decreasing grain size (Figure 17c, as in Figure 15),creates a vertical slice through the erosion function surfacethat bends away from the thresholds of motion and alluvia-tion, and toward the threshold of suspension and maximumbedrock exposure. The variable transport stage slices(Figures 17b and 17c) bend because transport stage occurson both axes, as sediment transport capacity, in the denom-inator of the relative supply axis, depends on transport stagein equation (8).[53] The inverse relationship between bedrock incision
rate and excess shear stress at high-transport stages(equation (24a) and Figures 12–17), which results fromthe tendency of saltation trajectories to grow more elongatedwith increasing excess shear stress (equation (16) andFigure 9), is an unanticipated feature of the saltation-abrasion model. It suggests that there is a fundamental limitto how quickly bedrock can be eroded by the process of bedload abrasion. The critical shear stress at which erosion ratereaches a maximum for variable excess shear stress corre-sponds to a critical relative sediment supply rate, which forlow excess shear stress is approximately Qs/Qt = 0.25. Thiscan be seen most clearly by considering the derivative ofequation (24b) (the dimensional form of the saltation-abrasion model without the suspension term) with respect to
excess shear stress, which for compactness we representhere by g (i.e., g = t*/t*c � 1),
dE
dg¼ 2k2q
2s
D3=2s g3
� k1qs
2g3=2: ð29Þ
Equation (29) equals zero when
qs ¼k1D
3=2s g3=2
4k2¼ qt
4: ð30Þ
The critical relative sediment supply of 0.25 results fromthe ratio of the exponents on excess shear stress inequation (24b) (i.e., 0.5/2.0). The expression for thederivative of equation (24a), the saltation-abrasion modelincluding the suspension term, with respect to excess shearstress, is considerably more complex. The critical relativesupply is no longer a constant, but becomes an increasingfunction of excess shear stress.[54] Figure 18 is a contour map of the derivative of the
nondimensional erosion rate (E*) predicted by the fullsaltation-abrasion model (equation (24a)), with respect totransport stage, showing how the critical relative sedimentsupply varies between 1.0 at the threshold of suspension to0.25 at the threshold of motion. The point (t*/t*c, Qs/Qt)where the curves of erosion rate versus excess shear stress(Figures 13, 15, and 17) cross the curve of dE*/d(t*/t*c) = 0(Figure 18) corresponds to the maximum possible erosion
Figure 16. Nondimensional erosion rate (E*) � 10�15
(contours, axis out of view) as a function of transportstage and relative sediment supply. In this nondimen-sional framework the saltation-abrasion model collapsesto a unique surface for all physically reasonablecombinations of discharge, channel slope, width, rough-ness, rock tensile strength, and coarse sediment grainsize (Ds > 0.002 m). Erosion rate goes to zero as eachof the four end-member conditions are approached: thethresholds of motion and suspension and a fully alluvialor pure bedrock bed.
Figure 17. Dimensionalmodel results plotted in nondimen-sional setting to illustrate that curves plotted in Figures 11,13, and 15 are, in effect, slices though the nondimensionalerosion function surface. (a) Curves from Figure 11, variablesediment supply. (b) Curves from Figure 13, variable slope.(c) Curves from Figure 15, variable grain size.
14 of 21
W06301 SKLAR AND DIETRICH: BEDROCK INCISION BY SALTATING BED LOAD W06301
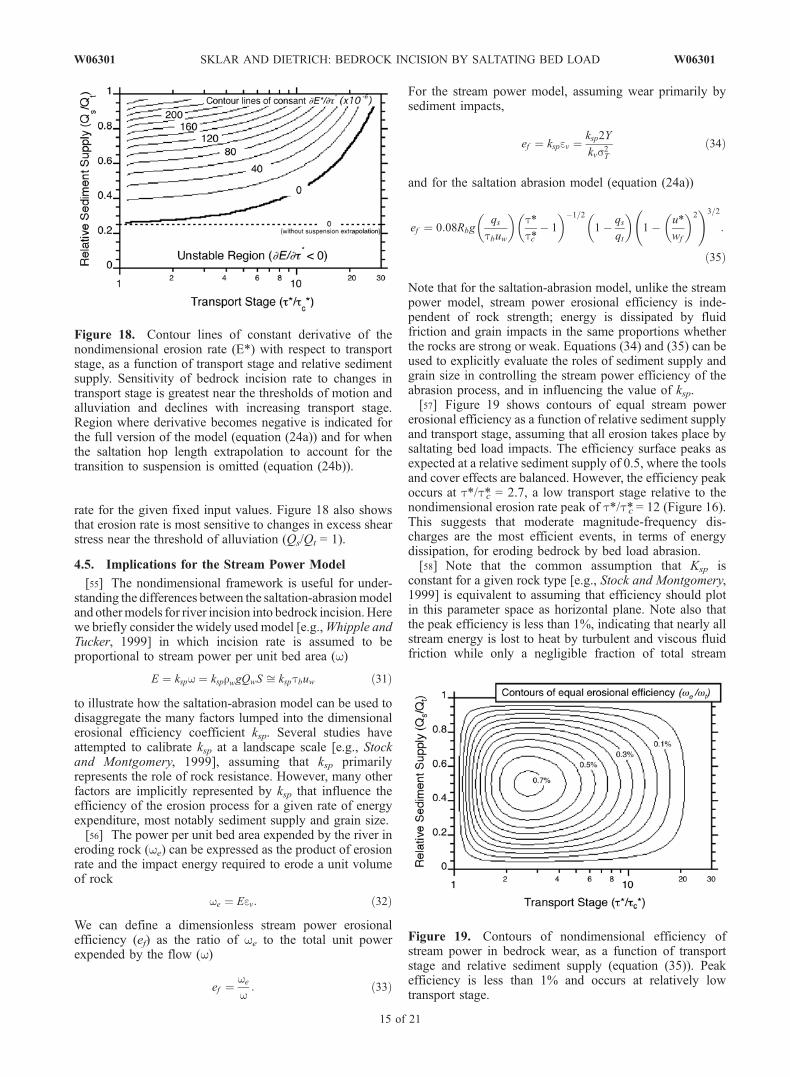
rate for the given fixed input values. Figure 18 also showsthat erosion rate is most sensitive to changes in excess shearstress near the threshold of alluviation (Qs/Qt = 1).
4.5. Implications for the Stream Power Model
[55] The nondimensional framework is useful for under-standing the differences between the saltation-abrasionmodeland othermodels for river incision into bedrock incision.Herewe briefly consider the widely used model [e.g.,Whipple andTucker, 1999] in which incision rate is assumed to beproportional to stream power per unit bed area (w)
E ¼ kspw ¼ ksprwgQwS ffi ksptbuw ð31Þ
to illustrate how the saltation-abrasion model can be used todisaggregate the many factors lumped into the dimensionalerosional efficiency coefficient ksp. Several studies haveattempted to calibrate ksp at a landscape scale [e.g., Stockand Montgomery, 1999], assuming that ksp primarilyrepresents the role of rock resistance. However, many otherfactors are implicitly represented by ksp that influence theefficiency of the erosion process for a given rate of energyexpenditure, most notably sediment supply and grain size.[56] The power per unit bed area expended by the river in
eroding rock (we) can be expressed as the product of erosionrate and the impact energy required to erode a unit volumeof rock
we ¼ Eev: ð32Þ
We can define a dimensionless stream power erosionalefficiency (ef) as the ratio of we to the total unit powerexpended by the flow (w)
ef ¼we
w: ð33Þ
For the stream power model, assuming wear primarily bysediment impacts,
ef ¼ kspev ¼ksp2Y
kvs2Tð34Þ
and for the saltation abrasion model (equation (24a))
ef ¼ 0:08Rbgqs
tbuw
� �t*tc*
� 1
� ��1=2
1� qs
qt
� �1� u*
wf
� �2 !3=2
:
ð35Þ
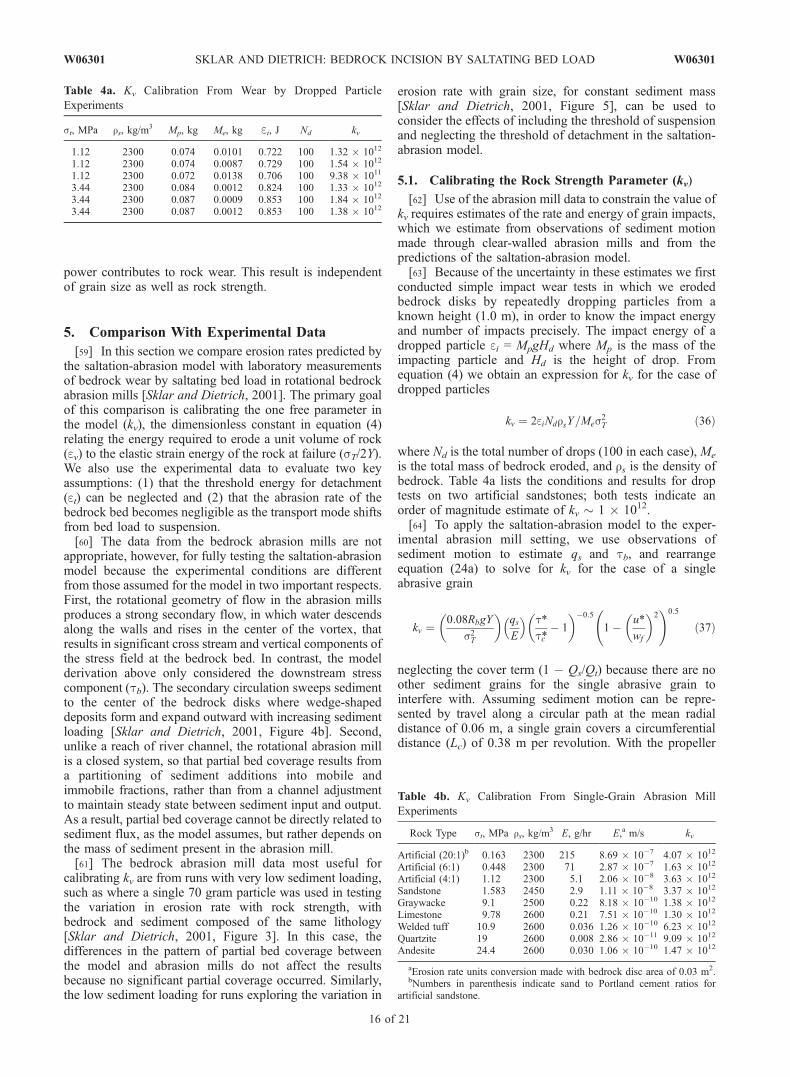
Note that for the saltation-abrasion model, unlike the streampower model, stream power erosional efficiency is inde-pendent of rock strength; energy is dissipated by fluidfriction and grain impacts in the same proportions whetherthe rocks are strong or weak. Equations (34) and (35) can beused to explicitly evaluate the roles of sediment supply andgrain size in controlling the stream power efficiency of theabrasion process, and in influencing the value of ksp.[57] Figure 19 shows contours of equal stream power
erosional efficiency as a function of relative sediment supplyand transport stage, assuming that all erosion takes place bysaltating bed load impacts. The efficiency surface peaks asexpected at a relative sediment supply of 0.5, where the toolsand cover effects are balanced. However, the efficiency peakoccurs at t*/t*c = 2.7, a low transport stage relative to thenondimensional erosion rate peak of t*/t*c = 12 (Figure 16).This suggests that moderate magnitude-frequency dis-charges are the most efficient events, in terms of energydissipation, for eroding bedrock by bed load abrasion.[58] Note that the common assumption that Ksp is
constant for a given rock type [e.g., Stock and Montgomery,1999] is equivalent to assuming that efficiency should plotin this parameter space as horizontal plane. Note also thatthe peak efficiency is less than 1%, indicating that nearly allstream energy is lost to heat by turbulent and viscous fluidfriction while only a negligible fraction of total stream
Figure 18. Contour lines of constant derivative of thenondimensional erosion rate (E*) with respect to transportstage, as a function of transport stage and relative sedimentsupply. Sensitivity of bedrock incision rate to changes intransport stage is greatest near the thresholds of motion andalluviation and declines with increasing transport stage.Region where derivative becomes negative is indicated forthe full version of the model (equation (24a)) and for whenthe saltation hop length extrapolation to account for thetransition to suspension is omitted (equation (24b)).
Figure 19. Contours of nondimensional efficiency ofstream power in bedrock wear, as a function of transportstage and relative sediment supply (equation (35)). Peakefficiency is less than 1% and occurs at relatively lowtransport stage.
W06301 SKLAR AND DIETRICH: BEDROCK INCISION BY SALTATING BED LOAD
15 of 21
W06301
power contributes to rock wear. This result is independentof grain size as well as rock strength.
5. Comparison With Experimental Data
[59] In this section we compare erosion rates predicted bythe saltation-abrasion model with laboratory measurementsof bedrock wear by saltating bed load in rotational bedrockabrasion mills [Sklar and Dietrich, 2001]. The primary goalof this comparison is calibrating the one free parameter inthe model (kv), the dimensionless constant in equation (4)relating the energy required to erode a unit volume of rock(ev) to the elastic strain energy of the rock at failure (sT/2Y).We also use the experimental data to evaluate two keyassumptions: (1) that the threshold energy for detachment(et) can be neglected and (2) that the abrasion rate of thebedrock bed becomes negligible as the transport mode shiftsfrom bed load to suspension.[60] The data from the bedrock abrasion mills are not
appropriate, however, for fully testing the saltation-abrasionmodel because the experimental conditions are differentfrom those assumed for the model in two important respects.First, the rotational geometry of flow in the abrasion millsproduces a strong secondary flow, in which water descendsalong the walls and rises in the center of the vortex, thatresults in significant cross stream and vertical components ofthe stress field at the bedrock bed. In contrast, the modelderivation above only considered the downstream stresscomponent (tb). The secondary circulation sweeps sedimentto the center of the bedrock disks where wedge-shapeddeposits form and expand outward with increasing sedimentloading [Sklar and Dietrich, 2001, Figure 4b]. Second,unlike a reach of river channel, the rotational abrasion millis a closed system, so that partial bed coverage results froma partitioning of sediment additions into mobile andimmobile fractions, rather than from a channel adjustmentto maintain steady state between sediment input and output.As a result, partial bed coverage cannot be directly related tosediment flux, as the model assumes, but rather depends onthe mass of sediment present in the abrasion mill.[61] The bedrock abrasion mill data most useful for
calibrating kv are from runs with very low sediment loading,such as where a single 70 gram particle was used in testingthe variation in erosion rate with rock strength, withbedrock and sediment composed of the same lithology[Sklar and Dietrich, 2001, Figure 3]. In this case, thedifferences in the pattern of partial bed coverage betweenthe model and abrasion mills do not affect the resultsbecause no significant partial coverage occurred. Similarly,the low sediment loading for runs exploring the variation in
erosion rate with grain size, for constant sediment mass[Sklar and Dietrich, 2001, Figure 5], can be used toconsider the effects of including the threshold of suspensionand neglecting the threshold of detachment in the saltation-abrasion model.
5.1. Calibrating the Rock Strength Parameter (kv)
[62] Use of the abrasion mill data to constrain the value ofkv requires estimates of the rate and energy of grain impacts,which we estimate from observations of sediment motionmade through clear-walled abrasion mills and from thepredictions of the saltation-abrasion model.[63] Because of the uncertainty in these estimates we first
conducted simple impact wear tests in which we erodedbedrock disks by repeatedly dropping particles from aknown height (1.0 m), in order to know the impact energyand number of impacts precisely. The impact energy of adropped particle ei = MpgHd where Mp is the mass of theimpacting particle and Hd is the height of drop. Fromequation (4) we obtain an expression for kv for the case ofdropped particles
kv ¼ 2eiNdrsY=Mes2T ð36Þ
where Nd is the total number of drops (100 in each case), Me
is the total mass of bedrock eroded, and rs is the density ofbedrock. Table 4a lists the conditions and results for droptests on two artificial sandstones; both tests indicate anorder of magnitude estimate of kv 1 � 1012.[64] To apply the saltation-abrasion model to the exper-
imental abrasion mill setting, we use observations ofsediment motion to estimate qs and tb, and rearrangeequation (24a) to solve for kv for the case of a singleabrasive grain
kv ¼0:08RbgY
s2T
� �qs
E
� � t*tc*
� 1
� ��0:5
1� u*
wf
� �2 !0:5
ð37Þ
neglecting the cover term (1 � Qs/Qt) because there are noother sediment grains for the single abrasive grain tointerfere with. Assuming sediment motion can be repre-sented by travel along a circular path at the mean radialdistance of 0.06 m, a single grain covers a circumferentialdistance (Lc) of 0.38 m per revolution. With the propeller
Table 4a. Kv Calibration From Wear by Dropped Particle
Experiments
st, MPa rs, kg/m3 Mp, kg Me, kg ei, J Nd kv
1.12 2300 0.074 0.0101 0.722 100 1.32 � 1012
1.12 2300 0.074 0.0087 0.729 100 1.54 � 1012
1.12 2300 0.072 0.0138 0.706 100 9.38 � 1011
3.44 2300 0.084 0.0012 0.824 100 1.33 � 1012
3.44 2300 0.087 0.0009 0.853 100 1.84 � 1012
3.44 2300 0.087 0.0012 0.853 100 1.38 � 1012
Table 4b. Kv Calibration From Single-Grain Abrasion Mill
Experiments
Rock Type st, MPa rs, kg/m3 E, g/hr E,a m/s kv
Artificial (20:1)b 0.163 2300 215 8.69 � 10�7 4.07 � 1012
Artificial (6:1) 0.448 2300 71 2.87 � 10�7 1.63 � 1012
Artificial (4:1) 1.12 2300 5.1 2.06 � 10�8 3.63 � 1012
Sandstone 1.583 2450 2.9 1.11 � 10�8 3.37 � 1012
Graywacke 9.1 2500 0.22 8.18 � 10�10 1.38 � 1012
Limestone 9.78 2600 0.21 7.51 � 10�10 1.30 � 1012
Welded tuff 10.9 2600 0.036 1.26 � 10�10 6.23 � 1012
Quartzite 19 2600 0.008 2.86 � 10�11 9.09 � 1012
Andesite 24.4 2600 0.030 1.06 � 10�10 1.47 � 1012
aErosion rate units conversion made with bedrock disc area of 0.03 m2.bNumbers in parenthesis indicate sand to Portland cement ratios for
artificial sandstone.
16 of 21
W06301 SKLAR AND DIETRICH: BEDROCK INCISION BY SALTATING BED LOAD W06301
speed set to 1000 rpm, we observed 70 gram particlesrotating with an average angular velocity of 70 rpm, so thataverage ‘‘downstream’’ sediment velocity us = 0.44 m/s.Total sediment flux Qs = Mpus/Lc = 0.081 kg/s, and, for atotal radial width (rw) of 0.075 m, sediment flux per unitwidth qs = Qs/rw = 1.08 kg/m s.[65] A 70 gram abrasive grain has a nominal diameter of
0.038 m. We observed that grains larger than this size wouldeither not move at all, or would only move sporadically.Grains with a diameter of about 0.045 m appeared to beclosest to the threshold of motion, vibrating in place andoccasionally sliding or rolling a short distance. Assuming alow value of t*c = 0.03 to account for the low friction anglefor a single grain on a nearly planar bedrock surface[Buffington and Montgomery, 1997], and rs = 2600 kg/m3,the ‘‘downstream’’ component of the average boundaryshear stress tb = Ds(rs � rw)gt*c = 22 Pa. For the 0.038 mdiameter grain, transport stage t*/t*c = 1.2 and the ratio u*/wf = 0.19. At this transport stage, the model prediction ofdownstream sediment velocity us = 0.49 m/s agrees wellwith the observed average sediment velocity. The modelprediction of impact rate Ir = 90 impacts/m2 s is alsoconsistent, for the bedrock disc area of 0.03 m2, with theobserved frequency of 2 to 3 audible grain impacts persecond.[66] To solve for kv using equation (37), we use the
measured wear rates for the set of runs in which bedrock ofvarious strengths was eroded by a single abrasive graincomposed of the same rock type [Sklar and Dietrich, 2001,Figure 3], assuming as before a constant elastic modulus Y =5 � 104 MPa [Clark, 1966]. Calculated values of kv average3 � 1012, and range between 1 � 1012 and 9 � 1012
(Table 4b), roughly consistent with an order of magnitudeestimate of kv = 1 � 1012.
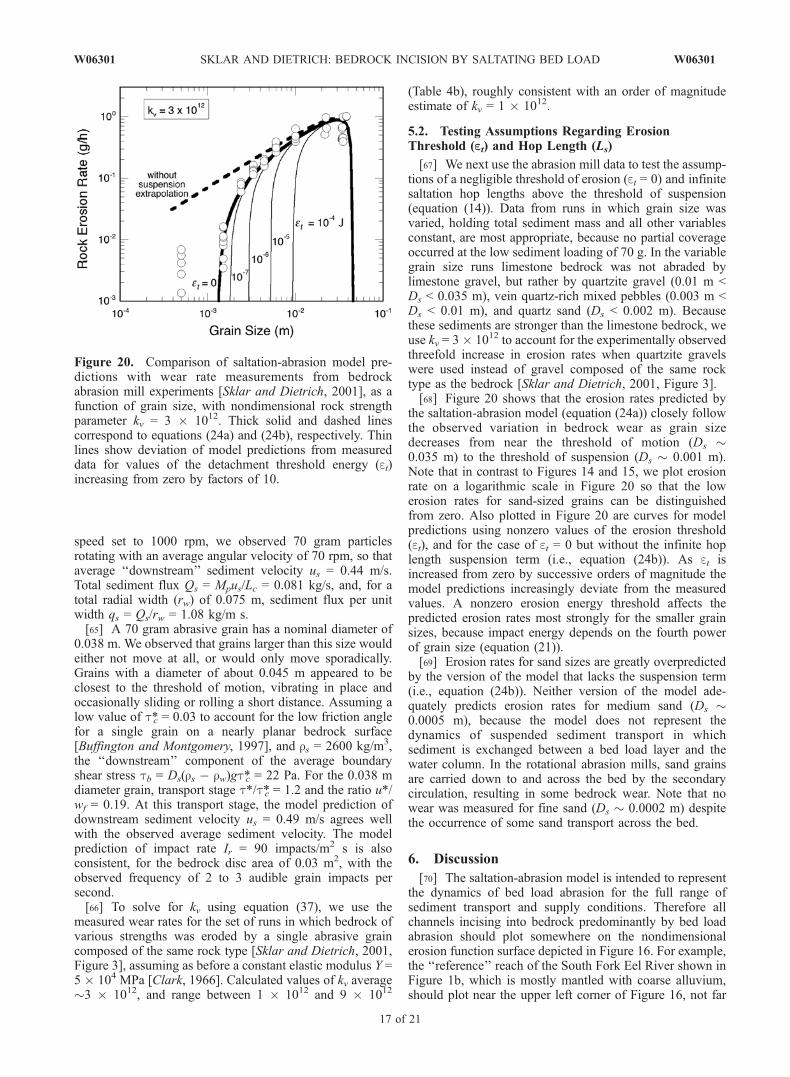
5.2. Testing Assumptions Regarding ErosionThreshold (Et) and Hop Length (Ls)
[67] We next use the abrasion mill data to test the assump-tions of a negligible threshold of erosion (et = 0) and infinitesaltation hop lengths above the threshold of suspension(equation (14)). Data from runs in which grain size wasvaried, holding total sediment mass and all other variablesconstant, are most appropriate, because no partial coverageoccurred at the low sediment loading of 70 g. In the variablegrain size runs limestone bedrock was not abraded bylimestone gravel, but rather by quartzite gravel (0.01 m <Ds < 0.035 m), vein quartz-rich mixed pebbles (0.003 m <Ds < 0.01 m), and quartz sand (Ds < 0.002 m). Becausethese sediments are stronger than the limestone bedrock, weuse kv = 3� 1012 to account for the experimentally observedthreefold increase in erosion rates when quartzite gravelswere used instead of gravel composed of the same rocktype as the bedrock [Sklar and Dietrich, 2001, Figure 3].[68] Figure 20 shows that the erosion rates predicted by
the saltation-abrasion model (equation (24a)) closely followthe observed variation in bedrock wear as grain sizedecreases from near the threshold of motion (Ds 0.035 m) to the threshold of suspension (Ds 0.001 m).Note that in contrast to Figures 14 and 15, we plot erosionrate on a logarithmic scale in Figure 20 so that the lowerosion rates for sand-sized grains can be distinguishedfrom zero. Also plotted in Figure 20 are curves for modelpredictions using nonzero values of the erosion threshold(et), and for the case of et = 0 but without the infinite hoplength suspension term (i.e., equation (24b)). As et isincreased from zero by successive orders of magnitude themodel predictions increasingly deviate from the measuredvalues. A nonzero erosion energy threshold affects thepredicted erosion rates most strongly for the smaller grainsizes, because impact energy depends on the fourth powerof grain size (equation (21)).[69] Erosion rates for sand sizes are greatly overpredicted
by the version of the model that lacks the suspension term(i.e., equation (24b)). Neither version of the model ade-quately predicts erosion rates for medium sand (Ds 0.0005 m), because the model does not represent thedynamics of suspended sediment transport in whichsediment is exchanged between a bed load layer and thewater column. In the rotational abrasion mills, sand grainsare carried down to and across the bed by the secondarycirculation, resulting in some bedrock wear. Note that nowear was measured for fine sand (Ds 0.0002 m) despitethe occurrence of some sand transport across the bed.
6. Discussion
[70] The saltation-abrasion model is intended to representthe dynamics of bed load abrasion for the full range ofsediment transport and supply conditions. Therefore allchannels incising into bedrock predominantly by bed loadabrasion should plot somewhere on the nondimensionalerosion function surface depicted in Figure 16. For example,the ‘‘reference’’ reach of the South Fork Eel River shown inFigure 1b, which is mostly mantled with coarse alluvium,should plot near the upper left corner of Figure 16, not far
Figure 20. Comparison of saltation-abrasion model pre-dictions with wear rate measurements from bedrockabrasion mill experiments [Sklar and Dietrich, 2001], as afunction of grain size, with nondimensional rock strengthparameter kv = 3 � 1012. Thick solid and dashed linescorrespond to equations (24a) and (24b), respectively. Thinlines show deviation of model predictions from measureddata for values of the detachment threshold energy (et)increasing from zero by factors of 10.
W06301 SKLAR AND DIETRICH: BEDROCK INCISION BY SALTATING BED LOAD
17 of 21
W06301
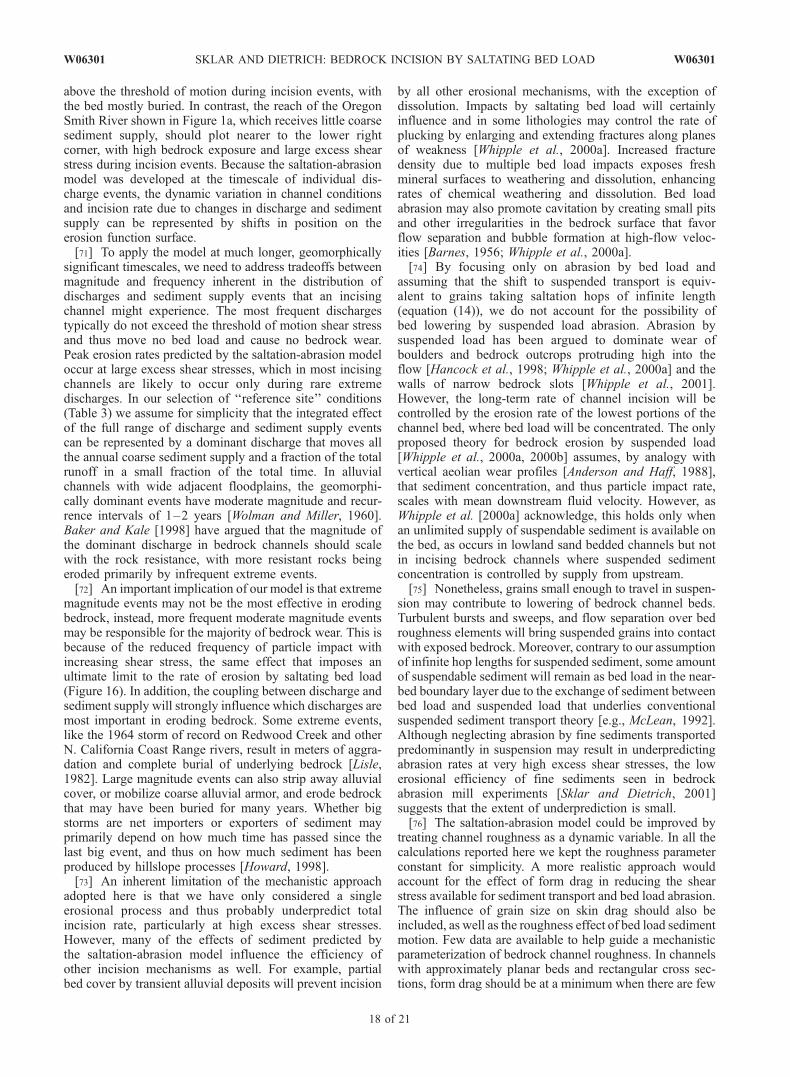
above the threshold of motion during incision events, withthe bed mostly buried. In contrast, the reach of the OregonSmith River shown in Figure 1a, which receives little coarsesediment supply, should plot nearer to the lower rightcorner, with high bedrock exposure and large excess shearstress during incision events. Because the saltation-abrasionmodel was developed at the timescale of individual dis-charge events, the dynamic variation in channel conditionsand incision rate due to changes in discharge and sedimentsupply can be represented by shifts in position on theerosion function surface.[71] To apply the model at much longer, geomorphically
significant timescales, we need to address tradeoffs betweenmagnitude and frequency inherent in the distribution ofdischarges and sediment supply events that an incisingchannel might experience. The most frequent dischargestypically do not exceed the threshold of motion shear stressand thus move no bed load and cause no bedrock wear.Peak erosion rates predicted by the saltation-abrasion modeloccur at large excess shear stresses, which in most incisingchannels are likely to occur only during rare extremedischarges. In our selection of ‘‘reference site’’ conditions(Table 3) we assume for simplicity that the integrated effectof the full range of discharge and sediment supply eventscan be represented by a dominant discharge that moves allthe annual coarse sediment supply and a fraction of the totalrunoff in a small fraction of the total time. In alluvialchannels with wide adjacent floodplains, the geomorphi-cally dominant events have moderate magnitude and recur-rence intervals of 1–2 years [Wolman and Miller, 1960].Baker and Kale [1998] have argued that the magnitude ofthe dominant discharge in bedrock channels should scalewith the rock resistance, with more resistant rocks beingeroded primarily by infrequent extreme events.[72] An important implication of our model is that extreme
magnitude events may not be the most effective in erodingbedrock, instead, more frequent moderate magnitude eventsmay be responsible for the majority of bedrock wear. This isbecause of the reduced frequency of particle impact withincreasing shear stress, the same effect that imposes anultimate limit to the rate of erosion by saltating bed load(Figure 16). In addition, the coupling between discharge andsediment supply will strongly influence which discharges aremost important in eroding bedrock. Some extreme events,like the 1964 storm of record on Redwood Creek and otherN. California Coast Range rivers, result in meters of aggra-dation and complete burial of underlying bedrock [Lisle,1982]. Large magnitude events can also strip away alluvialcover, or mobilize coarse alluvial armor, and erode bedrockthat may have been buried for many years. Whether bigstorms are net importers or exporters of sediment mayprimarily depend on how much time has passed since thelast big event, and thus on how much sediment has beenproduced by hillslope processes [Howard, 1998].[73] An inherent limitation of the mechanistic approach
adopted here is that we have only considered a singleerosional process and thus probably underpredict totalincision rate, particularly at high excess shear stresses.However, many of the effects of sediment predicted bythe saltation-abrasion model influence the efficiency ofother incision mechanisms as well. For example, partialbed cover by transient alluvial deposits will prevent incision
by all other erosional mechanisms, with the exception ofdissolution. Impacts by saltating bed load will certainlyinfluence and in some lithologies may control the rate ofplucking by enlarging and extending fractures along planesof weakness [Whipple et al., 2000a]. Increased fracturedensity due to multiple bed load impacts exposes freshmineral surfaces to weathering and dissolution, enhancingrates of chemical weathering and dissolution. Bed loadabrasion may also promote cavitation by creating small pitsand other irregularities in the bedrock surface that favorflow separation and bubble formation at high-flow veloc-ities [Barnes, 1956; Whipple et al., 2000a].[74] By focusing only on abrasion by bed load and
assuming that the shift to suspended transport is equiv-alent to grains taking saltation hops of infinite length(equation (14)), we do not account for the possibility ofbed lowering by suspended load abrasion. Abrasion bysuspended load has been argued to dominate wear ofboulders and bedrock outcrops protruding high into theflow [Hancock et al., 1998; Whipple et al., 2000a] and thewalls of narrow bedrock slots [Whipple et al., 2001].However, the long-term rate of channel incision will becontrolled by the erosion rate of the lowest portions of thechannel bed, where bed load will be concentrated. The onlyproposed theory for bedrock erosion by suspended load[Whipple et al., 2000a, 2000b] assumes, by analogy withvertical aeolian wear profiles [Anderson and Haff, 1988],that sediment concentration, and thus particle impact rate,scales with mean downstream fluid velocity. However, asWhipple et al. [2000a] acknowledge, this holds only whenan unlimited supply of suspendable sediment is available onthe bed, as occurs in lowland sand bedded channels but notin incising bedrock channels where suspended sedimentconcentration is controlled by supply from upstream.[75] Nonetheless, grains small enough to travel in suspen-
sion may contribute to lowering of bedrock channel beds.Turbulent bursts and sweeps, and flow separation over bedroughness elements will bring suspended grains into contactwith exposed bedrock. Moreover, contrary to our assumptionof infinite hop lengths for suspended sediment, some amountof suspendable sediment will remain as bed load in the near-bed boundary layer due to the exchange of sediment betweenbed load and suspended load that underlies conventionalsuspended sediment transport theory [e.g., McLean, 1992].Although neglecting abrasion by fine sediments transportedpredominantly in suspension may result in underpredictingabrasion rates at very high excess shear stresses, the lowerosional efficiency of fine sediments seen in bedrockabrasion mill experiments [Sklar and Dietrich, 2001]suggests that the extent of underprediction is small.[76] The saltation-abrasion model could be improved by
treating channel roughness as a dynamic variable. In all thecalculations reported here we kept the roughness parameterconstant for simplicity. A more realistic approach wouldaccount for the effect of form drag in reducing the shearstress available for sediment transport and bed load abrasion.The influence of grain size on skin drag should also beincluded, as well as the roughness effect of bed load sedimentmotion. Few data are available to help guide a mechanisticparameterization of bedrock channel roughness. In channelswith approximately planar beds and rectangular cross sec-tions, form drag should be at a minimum when there are few
18 of 21
W06301 SKLAR AND DIETRICH: BEDROCK INCISION BY SALTATING BED LOAD W06301
alluvial deposits due to low relative sediment supply; formdrag would grow with increasing bed coverage. Otherchannels with highly irregular bedrock topography may bemost rough at low coverage, so that form drag may reach aminimum at high bed coverage.[77] Our assumption of a planar bedrock bed neglects the
possible feedbacks between differential bedrock wear andthe process of partial bed alluviation. At low relativesediment supply, planar beds may be unstable becausebed load may preferentially move through local low points,increasing the impact rate and thus the erosion rate in thedepression at the expense of neighboring high points. Thispositive feedback would grow until the form drag associatedwith the bed depressions reduced the shear stress availableto transport bed load enough to force sediment deposition tooccur. Bed load impacts would then preferentially erode theexposed higher points, limiting the growth in the small-scalerelief of the bedrock bed. Temporal fluctuations in relativesediment supply would have a similar effect, shifting thefocus of bed load wear between higher and lower portionsof the bedrock bed. Topographic high points that protrudewell into the flow, above the reach of bed load abrasion, willbe eroded primarily by abrasion by suspended sediments[Whipple et al., 2000a]. Irregular bed topography will alsoinfluence the saltation impact angle, and thus the fraction oftotal kinetic energy that contributes to deformation wear.Thus bedrock high points that do not protrude above thezone of bed load transport will erode preferentially on theirupstream faces, leading to downstream migration of rockbed forms [e.g., Tinkler and Parrish, 1998].[78] Another important simplification in the saltation-
abrasion model is our assumption that bed cover is linearlyproportional to excess transport capacity. In addition toneglecting the threshold of alluviation, we also do notaccount for the interactions between bed sediments andthe water surface at critical flow. In flume experiments withFroude number 1, we have observed the sudden formationof antidunes as sediment supply and partial bed coveragereach a threshold value [Sklar and Dietrich, 2002]. Thelarge increase in form drag associated with the growth ofantidunes decreases the transport capacity resulting in rapidbed alluviation without further increases in the rate ofsediment supply. In a separate set of experiments [Sklar andDietrich, 2001], we have also observed bedrock wear undera thin but complete alluvial cover, presumably becausesufficient impact energy from mobile grains strikingstationary grains is transmitted to the underlying bedrock.We expect that a more sophisticated treatment of thecontrols on partial bed cover and its insulating effects mightalter the shape of the nondimensional erosion functionsurface (Figure 16), but would not alter the fundamentalconstraints that the cover and tools effects impose on ratesof bedrock erosion.[79] Perhaps the most important simplifying assumption
in the saltation-abrasion model is our use of a uniform grainsize to represent the wide distribution of grain sizes suppliedto incising channels. Grain size has a profound effect onpredicted incision rates, through (1) the threshold of motion,(2) by scaling the effect of shear stress (i.e., nondimensionaltransport stage), and (3) in influencing the height of theerosion function surface (Figure 16). The grain size distri-bution of sediment supplied to the channel network will
strongly influence the extent of alluvial cover and theavailability of bed load abrasive tools. As Howard [1980]has shown for coarse alluvial channels, the critical thresholdof motion is set by coarsest grain size fraction supplied inconcentrations sufficient to dominate channel spanningdeposits. The grain size distribution will largely determinethe fraction of the total load that moves as bed load and thusaffects the magnitude of the sediment supply variable (Qs).[80] Little is known about what controls the size distri-
bution of sediments supplied to channels by adjacent hill-slopes. The initial grain size distribution is likely to dependon the bedrock lithology and its tectonic history, theclimatically influenced weathering rate and style, and hill-slope sediment transport processes. Once sediments reachthe channel network, the distribution evolves rapidly due toselective transport [Paola et al., 1992], lateral sorting[Paola and Seal, 1995], and particle breakdown in transport[Kodama, 1994]. Downstream fining can be interrupted byresupply of coarse sediments at junctions with steep low-order tributaries [Rice, 1998].
7. Conclusion
[81] We have developed a mechanistic model for bedrockincision by saltating bed load using well established empir-ical relationships for impact wear of brittle materials and themotion of saltating bed load grains. The model predicts thatmaximum incision rates occur at moderate sediment supplyrates, relative to sediment transport capacity, because of atradeoff between the availability of abrasive tools and thepartial alluviation of the bed. Incision rates also peak atintermediate levels of excess shear stress due to a tradeoffbetween particle impact energy and impact frequency. Thepredicted bed load abrasion rate can be expressed in acompact nondimensional form as a function of excess shearstress and sediment supply relative to sediment transportcapacity. We nondimensionalize erosion rate by grain size,and by rock resistance, which scales with the square of rocktensile strength. In this parameter space, the saltation-abrasion model defines a unique functional surface boundedby four essential constraints on incision rate imposed bysediment supply, grain size and the dynamics of sedimentmotion. The rate of bed load abrasion will be zero at shearstresses below the threshold of motion and above the thresh-old of suspension, and when the supply of coarse sediment iseither negligible or exceeds the sediment transport capacity.[82] The saltation-abrasion model illustrates the benefits of
building geomorphic process models from the detailedmechanics of individual erosional mechanisms. Directlycoupling bed load transport with bedrock wear by saltatinggrain impacts leads to several important insights: (1) grain sizeis a key control on bedrock incision rate because the thresholdofmotion introduces aminimumshear stress required to erodebedrock, and because the erosional efficiency of a given shearstress depends on the grain size; (2) incision rate is mostsensitive to changes in shear stress when sediment supply isnearly equal to sediment transport capacity because smallincreases in shear stress can produce large changes in theextent of bedrock exposure (Figure 12); and (3) there is anupper limit to the rate at which bed load abrasion can erodebedrock due to the reduced frequency of bed load impactswith increasing shear stress (Figure 16), which suggests that
W06301 SKLAR AND DIETRICH: BEDROCK INCISION BY SALTATING BED LOAD
19 of 21
W06301
other erosional mechanisms may be dominant under tools-poor or high excess shear stress conditions.[83] Several priorities for future research emerge from
this work, including understanding: (1) the controls on thegrain size distribution supplied to river channels; (2) howcoarse sediment is transported through bedrock beddedchannels; (3) the role of the grain size distribution and thebedrock bed roughness in influencing the formation andgrowth of alluvial deposits; and (4) how to integrate incisionprocesses other than abrasion by bed load into a compre-hensive mechanistic model for fluvial erosion of bedrock.
Notation
Ds grain diameter (m).ef dimensionless stream power erosional
efficiency.E bedrock erosion rate (m/s).
E* nondimensional erosion rate per unit rockresistance.
Fe fraction of bed exposed.Fr Froude number.g gravitational acceleration (m/s2).
Hd particle drop height (m).Hs saltation hop height (m).Hw flow depth (m).ksp stream power erosional efficiency (m/s W).kv rock resistance coefficient.Ir impact rate per unit area per unit time (1/m2 s).Ls saltation hop length (m).Lsd hop length, descending limb (m).Lsu hop length, rising limb (m).Me mass of rock eroded (kg).Mp particle mass (kg).Ms total sediment mass supplied to abrasion mills
(kg).Nd number of particle drops.n mannings roughness coefficient.qs sediment supply per unit width (kg/ms).Qs total sediment supply (kg/s).qt sediment transport capacity per unit width
(kg/m s).Qt total sediment transport capacity (kg/s).Qw discharge (m3/s).Rb nondimensional bouyant density.Rep particle Reynolds number.rh hydraulic radius (m).rw total radial width of abrasion mill disc (m).S channel slope.td saltation descent time (s).Ui particle impact velocity (m/s).Ur particle rebound velocity (m/s).us horizontal sediment velocity (m/s).usi Horizontal sediment velocity on impact (m/s).uw mean flow velocity (m/s).u* flow shear velocity (m/s).Vi volume eroded per impact.W channel width (m).wf particle fall velocity (m/s).wsd mean saltation descent velocity (m/s).wsi vertical sediment velocity on impact (m/s).Y Young’s modulus of elasticity (MPa).a saltation impact angle (degrees).
b elastic strain energy (J/m3).DeN net impact energy transferred (J).DeD impact deformation energy (J).DeL impact energy lost (J).ei impact energy of dropped particle (J).et detachment threshold energy (J).ev unit volume detachment energy (J/m3).g nondimensional excess shear stress [t*/
t*c � 1].m kinematic viscosity (kg/ms).rs sediment density (kg/m3).rw water density (kg/m3).sT rock tensile strength (MPa).tb mean boundary shear stress (Pa).t* nondimensional shear stress.t*c nondimensional critical shear stress.
t*/t*c transport stage.(t*/t*c )susp transport stage at threshold of suspension.
w total unit stream power (W).we unit stream power expended in rock wear (W).
[84] Acknowledgments. We thank G. Hauer, A. Howard, J. Kirchner,A. Luers, C. Reibe, J. Rice, J. Roering, M. Stacey, and J. Stock forinsightful discussions. We are also grateful to K. Whipple and threeanonymous reviewers whose comments significantly improved the manu-script. This work was supported by the National Center for Earth-SurfaceDynamics, by NSF grant EAR 970608, and by a Switzer EnvironmentalFellowship to L.S.S.
ReferencesAbbott, J. E., and J. R. D. Francis (1977), Saltation and suspension trajec-tories of solid grains in a water stream, Philos. Trans. R. Soc. London,Ser. A, 284, 225–254.
Alexander, H. S. (1932), Pothole erosion, J. Geol., 40, 305–337.Anderson, R. S. (1994), Evolution of the Santa Cruz Mountains, California,through tectonic growth and geomorphic decay, J. Geophys. Res., 99,20,161–20,179.
Anderson, R. S., and P. K. Haff (1988), Simulation of aeolian saltation,Science, 241, 820–823.
Ashley, G. M., W. H. Renwick, and G. H. Haag (1988), Channel form andprocesses in bedrock and alluvial reaches of the Raritan River, NewJersey, Geology, 16, 436–439.
Baker, V. R., and V. S. Kale (1998), The role of extreme floods in shapingbedrock channels, in Rivers Over Rock: Fluvial Processes in BedrockChannels, Geophys. Monogr. Ser., vol. 107, edited by K. Tinkler andE. E. Wohl, pp. 153–166, AGU, Washington, D. C.
Barnes, H. L. (1956), Cavitation as a geological agent, Am. J. Sci., 254,493–505.
Beaumont, C., P. Fullsack, and J. Hamilton (1992), Erosional control ofactive compressional orogens, in Thrust Tectonics, edited by K. R.McClay, pp. 1–18, Chapman and Hall, New York.
Benda, L., and T. Dunne (1997), Stochastic forcing of sediment routing andstorage in channel networks, Water Resour. Res., 33, 2865–2880.
Bitter, J. G. A. (1963a), A study of erosion phenomena, part I,Wear, 6, 5–21.Bitter, J. G. A. (1963b), A study of erosion phenomena, part II, Wear, 6,169–190.
Bridge, J. S., and D. F. Dominic (1984), Bed load grain velocities andsediment transport rates, Water Resour. Res., 20, 476–490.
Buffington, J. M., and D. R. Montgomery (1997), A systematic analysisof eight decades of incipient motion studies, with special reference togravel-bedded rivers, Water Resour. Res., 33, 1993–2029.
Clark, S. P. (1966), Handbook of Physical Constants, Mem. Geol. Soc. Am.,97.
de Bree, S. E. M., W. F. Rosenbrand, and A. W. J. de Gee (1982), On theerosion resistance in water-sand mixtures of steels for application inslurry pipelines, paper presented at 8th International Conference onHydraulic Transport of Solids in Pipes, BHRA Fluid Eng., Johannesburg,South Africa.
Dietrich, W. E. (1982), Settling velocity of natural particles, Water Resour.Res., 18, 1615–1626.
20 of 21
W06301 SKLAR AND DIETRICH: BEDROCK INCISION BY SALTATING BED LOAD W06301
Engle, P. A. (1978), Impact Wear of Materials, Elsevier Sci., New York.Fernandez Luque, R., and R. van Beek (1976), Erosion and transport ofbed-load sediment, J. Hydraul. Res., 14, 127–144.
Foley, M. G. (1980), Bedrock incision by streams, Geol. Soc. Am. Bull.,Part II, 91, 2189–2213.
Francis, J. R. D. (1973), Experiments on the motion of solitary grains alongthe bed of a water-stream, Proc. R. Soc. London, Ser. A, 332, 443–471.
Gilbert, G. K. (1877), Report on the Geology of the Henry Mountains:Geographical and Geological Survey of the Rocky Mountain Region,160 pp., U.S. Gov. Print. Off., Washington, D. C.
Gomez, B., and M. Church (1989), An assessment of bed load sedimenttransport formulae for gravel bed rivers, Water Resour. Res., 25, 1161–1186.
Hancock, G. S., R. S. Anderson, and K. X. Whipple (1998), Beyond Power:Bedrock river process and form, in Rivers Over Rock: Fluvial Processesin Bedrock Channels, Geophys. Monogr. Ser., vol. 107, edited byK. Tinkler and E. E. Wohl, pp. 35–60, AGU, Washington, D. C.
Head, W. J., and M. E. Harr (1970), The development of a model to predictthe erosion of materials by natural contaminants, Wear, 15, 1–46.
Howard, A. D. (1980), Thresholds in river regimes, in Thresholds in Geo-morphology, edited by D. R. Coates and J. D. Vitek, pp. 227–258, Allenand Unwin, Concord, Mass.
Howard, A. D. (1994), A detachment-limited model of drainage basinevolution, Water Resour. Res., 30, 2261–2285.
Howard, A. D. (1998), Long profile development of bedrock channels:Interaction of weathering, mass wasting, bed erosion, and sediment trans-port, in Rivers Over Rock: Fluvial Processes in Bedrock Channels,Geophys. Monogr. Ser., vol. 107, edited by K. Tinkler and E. E. Wohl,pp. 237–260, AGU, Washington, D. C.
Howard, A. D., and G. Kerby (1983), Channel changes in badlands, Geol.Soc. Am. Bull., 94, 739–752.
Howard, A. D., W. E. Dietrich, and M. A. Seidl (1994), Modeling fluvialerosion on regional to continental scales, J. Geophys. Res., 99, 13,971–13,986.
Hu, C., and Y. Hui (1996a), Bed-load transport I: Mechanical characteris-tics, J. Hydraul. Eng., 122, 245–254.
Hu, C., and Y. Hui (1996b), Bed-load transport II: Stochastic characteris-tics, J. Hydraul. Eng., 122, 255–261.
Kodama, Y. (1994), Experimental study of abrasion and its role in produ-cing downstream fining in gravel-bed rivers, Journal of SedimentaryResearch, A64, 68–75.
Lee, H. Y., and I. S. Hsu (1994), Investigation of saltating particle motions,J. Hydraulic Engineering, 120, 831–845.
Lisle, T. E. (1982), Effects of aggradation and degradation on riffle-poolmorphology in natural gravel channels, northwestern California, WaterResour. Res., 18, 1643–1651.
Massong, T. M., and D. R. Montgomery (2000), Influence of sedimentsupply, lithology, and wood debris on the distribution of bedrock andalluvial channels, Geol. Soc. Am. Bull., 112, 591–599.
McLean, S. R. (1992), On the calculation of suspended load for noncohe-sive sediments, J. Geophys. Res., 97, 5759–5770.
Merritts, D., and W. B. Bull (1989), Interpreting Quaternary uplift rates atthe Mendocino triple junction, northern California, from uplifted marineterraces, Geology, 17, 1020–1024.
Moglen, G. E., and R. L. Bras (1995), The effect of spatial heterogeneitieson geomorphic expression in a model of basin evolution, Water Resour.Res., 31, 2613–2623.
Molnar, P., and P. England (1990), Late Cenozoic uplift of mountain rangesand global climate change: Chicken or egg?, Nature, 346, 29–34.
Montgomery, D. R., T. B. Abbe, J. M. Buffington, N. P. Peterson, K. M.Schmidt, and J. D. Stock (1996), Distribution of bedrock and alluvialchannels in forested mountain drainage basins, Nature, 381, 587–589.
Nino, Y., M. Garcia, and L. Ayala (1994), Gravel saltation: 1. Experiments,Water Resour. Res., 30, 1907–1914.
Paola, C., and R. Seal (1995), Grain size patchiness as a cause of selectivedeposition and downstream fining, Water Resour. Res., 31, 1395–1407.
Paola, C., G. Parker, R. Seal, S. K. Sinha, J. B. Southard, and P. R. Wilcock(1992), Downstream fining by selective deposition in a laboratory flume,Science, 258, 1757–1760.
Rice, S. (1998), Which tributaries disrupt fining along gravel-bed rivers?,Geomorphology, 22, 39–56.
Rouse, H. (1937), Modern conceptions of the mechanics of turbulence,Trans. Am. Soc. Civ. Eng., 90, 463–543.
Seidl, M. A., and W. E. Dietrich (1992), The problem of channel erosioninto bedrock, in Functional Geomorphology, edited by K. H. Schmidtand J. de Ploey, Catena Suppl., 23, 101–124.
Seidl, M. A., W. E. Dietrich, and J. W. Kirchner (1994), Longitudinalprofile development into bedrock: An analysis of Hawaiian channels,J. Geol., 102, 457–474.
Sekine, M., and H. Kikkawa (1992), Mechanics of saltating grains II,J. Hydraul. Eng., 118, 536–558.
Sklar, L. S. (2003), The influence of sediment supply, grain size, and rockstrength on rates of river incision into bedrock, Ph.D. dissertation, 342pp., Univ. of Calif., Berkeley, May.
Sklar, L. S., and W. E. Dietrich (1998), River longitudinal profiles andbedrock incision models: Stream power and the influence of sedimentsupply, in Rivers Over Rock: Fluvial Processes in Bedrock Channels,Geophys. Monogr. Ser., vol. 107, edited by K. Tinkler and E. E. Wohl,pp. 237–260, AGU, Washington, D. C.
Sklar, L. S., and W. E. Dietrich (2001), Sediment and rock strength controlson river incision into bedrock, Geology, 29, 1087–1090.
Sklar, L. S., and W. E. Dietrich (2002), Thresholds of alluviation in anexperimental bedrock channel and controls on river incision into bed-rock, Eos Trans. AGU, 83(47), Fall Meet. Suppl., Abstract H12F-09.
Sklar, L. S., W. E. Dietrich, and A. D. Howard (1996), The influence ofsediment supply on river incision into bedrock: A theoretical investiga-tion, Eos Trans. AGU, 77(46), Fall Meet. Suppl., Abstract H32A-12.
Slingerland, R., S. D. Willett, and H. L. Hennessey (1997), A new fluvialbedrock incision model based on the work-energy principle, Eos Trans.AGU, 78(46), Fall Meet. Suppl., Abstract H42F-12.
Snyder, N., K. X. Whipple, G. E. Tucker, and D. Merritts (2000), Land-scape response to tectonic forcing: Digital elevation model analysisof stream profiles in the Mendocino triple junction region, northernCalifornia, Geol. Soc. Am. Bull., 112, 1250–1263.
Stock, J. D., and D. R. Montgomery (1999), Geologic constraints on bed-rock river incision using the stream power law, J. Geophys. Res., 104,4983–4993.
Tinkler, K. J., and J. Parrish (1998), Recent adjustments to the long profileof Cooksville Creek, an urbanized bedrock channel in Mississauga, On-tario, in Rivers Over Rock: Fluvial Processes in Bedrock Channels,Geophys. Monogr. Ser., vol. 107, edited by K. Tinkler and E. E. Wohl,pp. 167–188, AGU, Washington, D. C.
Tucker, G. E., and R. L. Slingerland (1994), Erosional dynamics, flexuralisostasy, and long-lived escarpments: A numerical modeling study,J. Geophys. Res., 99, 12,229–12,243.
Tucker, G. E., and R. L. Slingerland (1996), Predicting sediment flux fromfold and thrust belts, Basin Res., 8, 329–349.
van der Beek, P., and P. Bishop (2003), Cenozoic river profile developmentin the Upper Lachlan catchment (SE Australia) as a test of quantitativefluvial incision models, J. Geophys. Res., 108(B6), 2309, doi:10.1029/2002JB002125.
Whipple, K. X., and G. E. Tucker (1999), Dynamics of the stream-powerriver incision model: Implications for height limits of mountain ranges,landscape response timescales, and research needs, J. Geophys. Res.,104, 17,661–17,674.
Whipple, K. X., and G. E. Tucker (2002), Implications of sediment-flux-dependent incision models for landscape evolution, J. Geophys. Res.,107(B2), 2039, doi:10.1029/2000JB000044.
Whipple, K. X., G. S. Hancock, and R. S. Anderson (2000a), River incisioninto bedrock: Mechanics and relative efficacy of plucking, abrasion, andcavitation, Geol. Soc. Am. Bull., 112, 490–503.
Whipple, K. X., N. P. Snyder, and K. Dollenmayer (2000b), Rates andprocesses of bedrock incision by the Upper Ukak River since the 1912Novarupta ash flow in the Valley of Ten Thousand Smokes, Alaska,Geology, 28(9), 835–838.
Wiberg, P. L., and J. D. Smith (1985), A theoretical model for saltatinggrains in water, J. Geophys. Res., 90, 7341–7354.
Willett, S. D. (1999), Orogeny and orography: The effects of erosion on thestructure of mountain belts, J. Geophys. Res., 104, 28,957–28,981.
Wohl, E. E. (1992a), Gradient irregularity in the Herbert Gorge of north-eastern Australia, Earth Surf. Processes Landforms, 17, 69–84.
Wohl, E. E. (1992b), Bedrock benches and boulder bars: Floods in theBurdekin Gorge of Australia, Geol. Soc. Am. Bull., 104, 770–778.
Wolman, M. G., and J. P. Miller (1960), Magnitude and frequency of forcesin geomorphic processes, J. Geol., 68, 54–74.
����������������������������W. E. Dietrich, Department of Earth and Planetary Science, University of
California, Berkeley, CA 94720, USA.
L. S. Sklar, Department of Geosciences, San Francisco State University,1600HollowayAvenue,SanFrancisco,CA94132,USA. ([email protected])
W06301 SKLAR AND DIETRICH: BEDROCK INCISION BY SALTATING BED LOAD
21 of 21
W06301
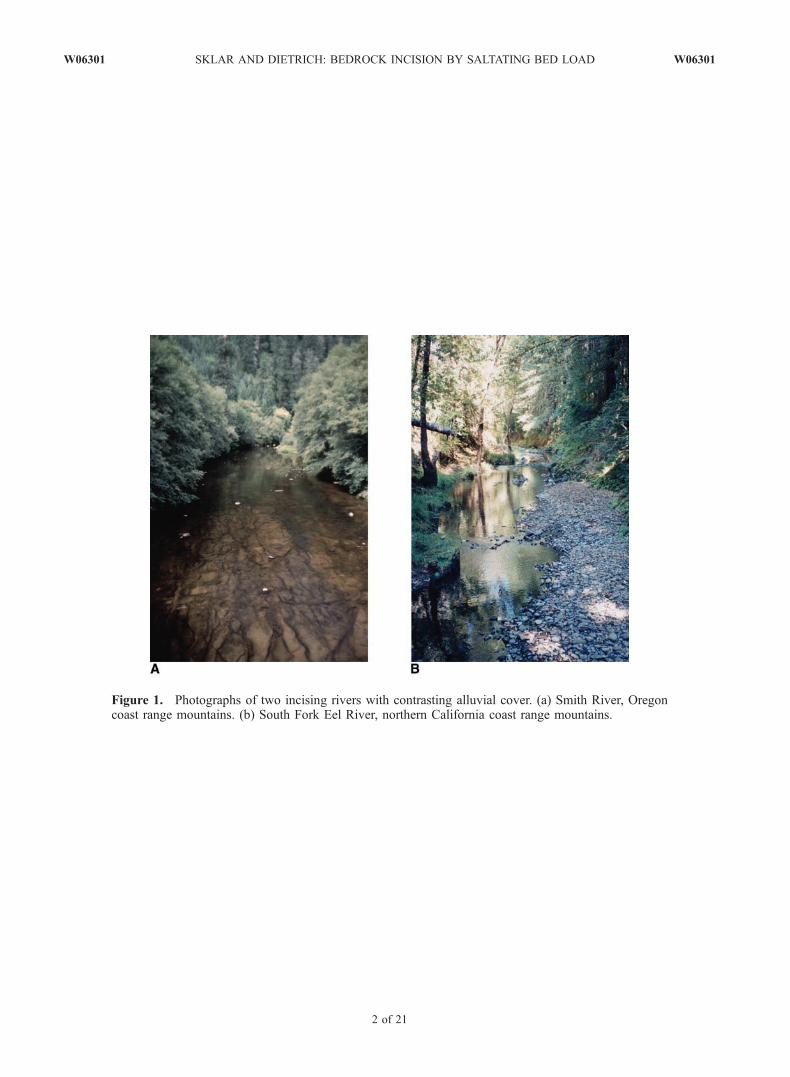
Figure 1. Photographs of two incising rivers with contrasting alluvial cover. (a) Smith River, Oregoncoast range mountains. (b) South Fork Eel River, northern California coast range mountains.
W06301 SKLAR AND DIETRICH: BEDROCK INCISION BY SALTATING BED LOAD W06301
2 of 21