a neutral model of stone raw material procurement
TRANSCRIPT

It is easy to invent a selectionist explanationfor almost any specific observation; proving itis another story. Such facile explanatoryexcesses can be avoided by being more quan-titative.
Motoo Kimura (1983:xiv)The Neutral Theory of Molecular Evolution
The richness of stone raw material types inan archaeological assemblage, the geo-graphic distances over which those materi-
als were transported, and the technological formsin which they were transported have providedempirical benchmarks for inferring the organiza-tion of Paleolithic adaptive strategies (Féblot-
A NEUTRAL MODEL OF STONE RAW MATERIAL PROCUREMENT
P. Jeffrey Brantingham
Stone tool assemblage variability is considered a reliable proxy measure of adaptive variability. Raw material richness,transport distances, and the character of transported technologies are thought to signal (1) variation in raw material selec-tivity based on material quality and abundance, (2) optimization of time and energy costs associated with procurement ofstone from spatially dispersed sources, (3) planning depth that weaves raw material procurement forays into foraging activ-ities, and (4) risk minimization that sees materials transported in quantities and forms that are energetically economicaland least likely to fail. This paper dispenses with assumptions that raw material type and abundance play any role in theorganization of mobility and raw material procurement strategies. Rather, a behaviorally neutral agent-based model is devel-oped involving a forager engaged in a random walk within a uniform environment. Raw material procurement in the modelis dependent only upon random encounters with stone sources and the amount of available space in the mobile toolkit. Sim-ulated richness-sample size relationships, frequencies of raw material transfers as a function of distance from source, andboth quantity-distance and reduction intensity-distance relationships are qualitatively similar to commonly observed archae-ological patterns. In some archaeological cases it may be difficult to reject the neutral model. At best, failure to reject theneutral model may mean that intervening processes (e.g., depositional time-averaging) have erased high-frequency adap-tive signals in the data. At worst, we may have to admit the possibility that Paleolithic behavioral adaptations were some-times not responsive to differences between stone raw material types in the ways implied by current archaeological theory.
Se considera la variabilidad de las colecciones de lítica como una medida confiable de la variabilidad de las adaptaciones almedio ambiente. La diversidad de materias primas, la distancia a sus yacimientos y la tecnología empleada reflejarían (1) laselección de la materia prima con base en su calidad y abundancia, (2) la optimización de gastos de tiempo y energía emplea-dos en la obtención de materia lítica de yacimientos dispersos; (3) la integración anticipada de las visitas a los yacimientoscon actividades de caza y recolección, y (4) una estrategia de reducción de riesgos que consiste en transportar la lítica en lascantidades y formas más eficientes del punto de vista energético y menos susceptibles al desgaste. En este trabajo prescindi-mos de suponer que el tipo y la abundancia de materia prima hayan jugado un papel en la organización de estrategias deobtención de ésta y de los desplazamientos en general. En su lugar, partimos de un modelo conductualmente neutral basadoen el agente (individuo), como sería un cazador que se desplaza al azar en un medio ambiente uniforme. La obtención de mate-ria prima depende entonces únicamente de hallazgos fortuitos de yacimientos de lítica y la cantidad de material que el cazadorpueda agregar a su equipaje. La simulación de la relación entre la diversidad y el tamaño de la muestra, así como de la fre-cuencia de uso, la cantidad y la reducción del volumen en función de la distancia al yacimiento, revelan patrones que se ase-mejan, de manera cualitativa, a los que arroja a menudo el registro arqueológico. En algunos casos arqueológicos resultaríaentonces difícil descartar tal modelo. En el mejor de los casos la imposibilidad de descartarlo señalaría que los procesos post-deposición (p.ej. la combinación de artefactos de distintas épocas en una sola colección) han borrado todos los indicadoresde la adaptación. En el peor de los casos, nos veríamos obligados a reconocer que las adaptaciones del comportamiento pale-olítico a veces no obedecían a las diferencias entre los tipos de materias primas de la lítica de la manera que sugieren lasteorías vigentes en arqueología.
P. Jeffrey Brantingham � Department of Anthropology, University of California, Los Angeles, 341 Haines Hall, Box951553, Los Angeles, CA 90095–1553. Email: [email protected]
American Antiquity, 68(3), 2003, pp. 487–509Copyright© 2003 by the Society for American Archaeology
487
*brantingham 6/26/03 4:19 PM Page 487

Augustins 1993, 1997a, 1997b, 1997c; Gamble1986, 1999; Geneste 1988, 1989; Kuhn 1995; Mel-lars 1996; Morala and Turq 1990; Potts 1994;Rensink et al. 1991). Such inferences make appealsto optimization of mobility and technologicalstrategies, depth of planning in landscape use, andrisk minimization.
One family of models focuses on differencesbetween generalist and specialist strategies of rawmaterial utilization as inferred from the richness(i.e., number of types) of stone raw materials foundin archaeological assemblages: generalists exploitmany different raw material types, while special-ists exploit only a few types. To complicate mat-
ters, observed assemblage richness is frequently—if not universally—constrained by sample size(Grayson 1984; Hayek and Buzas 1997; Shott1989). Consider, for example, the Middle Pale-olithic site of Grotte Vaufrey in the Aquitaine Basinof France, which spans the time interval from204,000–74,000 B.P. (Geneste 1988, 1989).Despite the appearance of changes in raw materialrichness through time, a single sample size–rich-ness relationship is apparent at this site (Figure 1a,b) (Geneste 1988). Changes in stone raw materialrichness, from only two unique raw material typesto as many as nine, do not necessarily diagnoseswitching between specialist and generalist strate-
488 AMERICAN ANTIQUITY [Vol. 68, No. 3, 2003
Figure 1. Raw material richness in assemblages from the Middle Paleolithic site of Grotte Vaufrey, approximately204,000–74,000 B.P. Richness changes through time (a) but is heavily dependent upon sample size (b). Procurement prob-abilities estimated from the observed raw material proportions (c) illustrate the structure of the distribution underlyingprocurement behaviors. The primary question is whether this probability distribution is derived from the environmen-tal densities of different raw materials, or whether a biased behavioral strategy is responsible. Data from Geneste (1988)with revisions.
*brantingham 6/26/03 4:19 PM Page 488

gies, but rather imply an unvarying set of raw mate-rial procurement behaviors (Figure 1c) (seeGrayson and Delpech 1998, 2002; Shott 1989).
There are two alternative, though not mutuallyexclusive, behavioral inferences that can be madeabout the nature of the underlying set of procure-ment behaviors. First, procurement could simplybe keyed to the natural densities of raw materialsin the environment (see Grayson 1984:116); somematerials are environmentally very abundant, havea higher probability of being procured, and there-fore will be observed at small sample sizes (e.g.,material types MP1 and MP2); other material typesare very rare, less likely to be procured, and there-fore will be observed only at very large samplesizes (e.g., material types MP4 and MP7). Second,stone procurement strategies could be biasedtoward some raw material types and away from oth-ers; differences in raw material quality, for instance,could lead to such procurement biases (Andrefsky1994; Brantingham et al. 2000). The anticipatedoutcome of a biased procurement strategy wouldbe higher probabilities of observing certain rawmaterial types at small sample sizes, independentof their environmental densities. The first situationis thought of as an “opportunistic” strategy of stoneraw material procurement, while the second is takento imply intentional raw material selectivity. Giventhat observed maximum richness at Grotte Vaufreyis very low relative to the number of known sources,numbering close to one thousand (Geneste 1985),it may be safe to assume that procurement behav-iors were in some way biased. Current theory wouldlead us to conclude that raw material procurementwas non-opportunistic, involved a significant mea-sure of planning depth to execute, and was, in fact,adaptive (Geneste 1989).
A second family of models focuses on a gener-ally recognized “decay-like” pattern in the fre-quencies of stone raw material transfers fromsources at different distances from sites (Blades1999; Féblot-Augustins 1993, 1997a, 1997b,1997c; Morala and Turq 1990; Potts 1994). Max-imum raw material transport distances are taken toreflect the geographic range of the populations inquestion (Roebroeks et al. 1988), with distinctionssometimes made between the “local” portion of therange, less than 5 km away, and the “distant” por-tion of the range, beyond 20–30 km (Féblot-Augustins 1993:214–215; Gamble 1999:88;
Geneste 1988, 1989). Two assumptions are neces-sary to infer geographic range from these data,namely that raw material procurement is embed-ded within other foraging activities (Binford 1979;Rensink et al. 1991), and that the maximumrecorded transport distance for a material translatesapproximately into the maximum radius of the for-aging area (Roebroeks et al. 1988:30). Thus, in theCentral European Middle Paleolithic, the maxi-mum recorded distance for raw material transfersis around 300 km, while in the Middle Paleolithicof Aquitaine Basin the maximum distance isapproximately 100 km (Figure 2) (Féblot-Augustins 1993). The differences between regionsare presumed to reflect range sizes adapted to dif-ferent ecological settings. Nonetheless, in bothcases the decline in the frequencies of transfersfrom greater distances is taken to indicate mini-mization of the costs associated with raw materialprocurement and transport (see below).
More interesting perhaps is Féblot-Augustins’(1993:243–245) interpretation of “internal modes”deviating from the decay-like trend for raw mate-rial transfers overall (Figure 2a) (see also Féblot-Augustins 1997b, 1997c). She views“unexpectedly” high frequencies of raw materialtransfers from distant sources as indicating eitherlogistical (sensu Binford 1980) use of distant eco-logical patches by specialized task groups, or sea-sonal residential moves to non-core areas in thesearch for migratory prey (see also Blades 1999;Féblot-Augustins 1997a, 1997b, 1997c; Rensink etal. 1991). This inference implies extensive depthof planning in landscape use.
A final family of models focuses in greater detailon the decay-like relationship between the quanti-ties of specific stone raw materials found in anassemblage and the distance from the sources ofthose materials. In general, the closest stone rawmaterial sources contribute the greatest quantitiesto an assemblage (60–80 percent from sources <5km away), while the most distant sources contributediminishingly small quantities (1–2 percent fromsources >20 km away) (Féblot-Augustins 1993;Geneste 1988). In Central Europe, Middle Pale-olithic assemblages show a dramatic decline in thepercentage frequency of stone materials fromsources beyond 50 km from the site (Figure 3). AtKulna (Layer 11), a Moravian Middle Paleolithiccave site, 87 percent of the assemblage is com-
P. Jeffrey Brantingham] NEUTRAL MODEL OF STONE RAW MATERIAL PROCUREMENT 489
*brantingham 6/26/03 4:19 PM Page 489

prised of materials from sources within 15 km ofthe site, while .7 percent (n specimens = 12) arefrom a source 230 km away (Féblot-Augustins1993:Table 4). This general pattern is thought toreflect optimization of the time and energy trade-offs inherent in the procurement of stone raw mate-rials from geographically adjacent vs.geographically distant sources (Féblot-Augustins1993:220; Gamble 1999:88; see Metcalfe and Bar-low 1992). As an extension of this decay-like pat-tern, the tendency for materials from distant sourcesto be introduced to sites as small, heavily reduced
technological forms—representing the end stagesof lithic reduction sequences as opposed to early-stage unmodified blocks or minimally utilizedcores—is thought to signal depth of planning andformal risk management strategies (Geneste 1989).In particular, technologies are expected to be for-mally designed from the outset to be small, lightweight, and resistant to failure if they are to betransported over long distances (Beck et al. 2002;Kuhn 1994; Nelson 1991; Torrence 1989). Accord-ing to Geneste (1989:80), these archaeological pat-terns diagnose real behavioral adaptations anddynamic economic strategies.
Here I would like to introduce the possibility thatmuch of the variation in the representation of stoneraw materials, both within and between lithicassemblages, could be of no functional or adaptivesignificance whatsoever. Ultimately, our ability todetermine whether adaptive variability is (or is not)measured by lithic assemblage variability is depen-dent upon having a null model for what assemblagevariability should look like under completely neu-tral assumptions. With this goal in mind, I developan agent-based model involving a forager engagedin a random walk in a uniform food-resource envi-ronment. Different stone raw material types occurat equal densities, but are distributed randomly inthe environment. Simulated raw material procure-
490 AMERICAN ANTIQUITY [Vol. 68, No. 3, 2003
Figure 2. Frequency histograms of raw material transferdistances for Middle Paleolithic assemblages in (a) CentralEurope and (b) the Aquitaine Basin. High frequencies ofshort-distance transfers (A) are interpreted in terms ofoptimization of time and energy costs associated with rawmaterial procurement. Internal modes (B) are interpretedin terms of logistical or seasonal use of distant ecologicalpatches. Raw material transfers from very distant sources(C) are thought to mark the maximum extent of the geo-graphic range of the populations in question. Data fromFéblot-Augustins (1993).
Figure 3. Percentage frequencies of specific stone rawmaterial types in Middle Paleolithic assemblages fromCentral Europe as a function of distance from source. Ageneral contrast between (A) high quantities of minimallyreduced materials from nearby sources and (B) low quan-tities of heavily reduced materials from distant sources isthought to reflect time-energy optimization, depth of plan-ning in raw material acquisition, and formal technologicalstrategies that minimize the risk of technological failure.Data from Féblot-Augustins (1993).
*brantingham 6/26/03 4:19 PM Page 490
ment, consumption, and discard are independent ofraw material type designations and therefore com-prise an unbiased stone raw material procurementstrategy. The model provides a baseline for com-parison where we can be certain that adaptation isnot responsible for observed patterns in raw mate-rial richness, transport distances, and both quan-tity-distance and reduction intensity-distancerelationships (see Gotelli and Graves 1996:6).
Elements of a Neutral Model
The core premise of any neutral model is that allsame-level components of a system are equivalentboth in terms of their innate behaviors and theimpact that the environment has on the expressionof those behaviors (Bell 2001; Gotelli and Graves1996). It is uncontroversial to note that somegenetic systems are accurately described by neu-tral dynamics, that nucleotide or gene sequenceschange in a stochastic manner because all same-level components (i.e., nucleotides or genes),exposed to the same environment, have equal prob-abilities of undergoing mutation or experiencingsampling drift (Kimura 1983). Indeed, geneticistsnow rarely object to the notion that natural selec-tion—a non-stochastic evolutionary force—some-times does not distinguish between purines andpyrmadines, or between one allele and its alterna-tives, despite the fact that these differences areempirically verifiable and are sometimes evolu-tionarily salient.
By contrast, neutral models of community ecol-ogy have been received with much greater skepti-cism (Abrams 2001; Bell 2001; Gotelli and Graves1996). In the most extreme “per capita” neutralmodels (e.g., Hubbell 2001), individual organismsare posited to have equivalent demographic prop-erties—probabilities of birth, death, and migra-tion—regardless of species affiliation. This is acontroversial starting point in that it dispenses withall assumptions about the unique functional oradaptive characteristics of clearly defined speciesand places the root cause of community ecologi-cal dynamics in the hands of purely stochasticmechanisms operating at the level of the individ-ual. However astonishing this may seem, suchextreme neutral assumptions provide reasonablyaccurate descriptions of some universal patternsseen in ecological communities such as species-area and range-abundance relationships (Bell 2001;
Hubbell 2001). Such models thus call into ques-tion the ultimate role of ecological assemblyrules—especially interspecific competition—inestablishing and maintaining community-level eco-logical diversity (Connell 1980; MacArthur andLevins 1967; Roughgarden 1983; Schoener 1983;Weiher and Keddy 1999).
A neutral model of lithic technological organi-zation based on similar first principles offers a rad-ical point of departure from traditional approaches(but see Neiman [1995] and Shennan and Wilkin-son [2001] for related discussions of “culturaldrift”). The neutral model of stone raw material pro-curement developed here jettisons the assumptionthat differences between stone raw materials nec-essarily influence both procurement decisions andhow stone toolkits are maintained and materialsultimately discarded. The alternative, neutral start-ing point is to assume that all stone raw materialsare equivalent on a per unit basis. For example, eachunit weight of raw material, regardless of whetherwe classify it as chert, obsidian, or quartzite, isassumed to be equivalent in terms of probabilitiesof procurement, consumption, and discard. Thedynamics of stone procurement, use, and discardin this neutral framework are therefore independentof how we might label raw material types and anyunique functional qualities we might attribute tothem.
It is pertinent to ask whether the patterns of rawmaterial diversity observed in the archaeologicalrecord are consistent with procurement strategiesmodeled using such extreme neutral assumptions.If they are consistent, then we must confront thedifficult possibility that empirically observable fea-tures of the archaeological record such as raw mate-rial richness and transport distances may not betelling us much of anything about optimization ofprocurement behaviors, depth of planning, riskmanagement strategies, and, ultimately, adaptivevariability. Of course, one may reject the neutralmodel if observed archaeological patterns are foundto be inconsistent with its expectations. Interpreta-tions linking patterns of raw material diversity tospecialized behavioral adaptations would be morerobust as a result.
Modeling Stone Raw Material Procurement
The neutral agent-based model of stone raw mate-rial procurement developed here assumes that (1)
P. Jeffrey Brantingham] NEUTRAL MODEL OF STONE RAW MATERIAL PROCUREMENT 491
*brantingham 6/26/03 4:19 PM Page 491

the foraging environment is uniform with respectto food resources (i.e., it is a single-resource mega-patch); (2) stone raw materials occur as pointsources distributed randomly within the environ-ment and each point source is arbitrarily labeled asa unique raw material type; (3) foragers follow a“random walk” foraging path; (4) each forager hasa “mobile toolkit” of fixed size (i.e., a forager cancarry a maximum amount of stone material); (5) ifa material source is encountered, raw material iscollected contingent upon the amount of emptyspace there is in the toolkit; and (6) if the mobiletoolkit contains raw material, then a fixed amountis selected at random with respect to raw materialtype, consumed and discarded from the mobiletoolkit.
Assumptions 1 and 3 ensure mobility-neutralforaging patterns. A random walk through a uni-form environment is neither logistical nor residen-tial (sensu Binford 1980). More technically, arandom walk does not seek to optimize any spe-cific currency associated with movement, involvesno depth of planning in that all move directions areequally likely, and is risk insensitive in that theresults of previous move decisions have no impacton the probability of the next move direction.Assumption 2 ensures source-neutrality in that allraw material sources occur at equal densities andare randomly distributed in the environment. Inother words, there are no abundance biases or non-random spatial clusters of individual raw materialtypes. Moreover, the random-walk foraging strat-egy employed by the forager ensures that each rawmaterial source has, in the limit, a probability equalto one of being encountered and that each uniquesource ultimately will be encountered an equalnumber of times. Assumptions 5 and 6 are unit rawmaterial-neutral. Assumption 5 ensures that all rawmaterials have an equal probability of procurementwhen encountered. Since all raw materials are alike,save for an arbitrary label, they are necessarily col-lected if there is empty space in the mobile toolkit(assumption 4). Once raw materials have been pro-cured from a source, assumption 6 ensures thateach unit of material in the toolkit has a probabil-ity of being consumed and discarded dependentonly upon its relative frequency in the toolkit.
Technical Meanderings
The simulation is based on the RePast agent-based
modeling platform (http://repast.sourceforge.net).The simulated “world” consists of a two-dimen-sional grid (500 x 500 cells) that holds all of theraw material sources and a single forager engagedin a random walk through the environment. Eachgrid cell is assumed to contain a uniform, infinitefood supply, ensuring that there are no patch choicedecisions to be made in forager movement (seebelow). The world can contain a variable numberof raw material sources (Figure 4). In most simu-lations, the world is seeded with 5,000 point sourcesof stone raw material and each of these sources isarbitrarily assigned a unique type label i = 1, 2, . .. 5,000. The coordinate location of each raw mate-rial source on the grid is chosen at random from auniform distribution (x, y) = [1, 500], withoutreplacement. There are 250,000 cells that couldpotentially hold a unique raw material source. Theprobability that any one cell contains stone rawmaterial is approximately .02 (i.e., 5,000 sources /250,000 cells) and, since each point source repre-sents an arbitrarily unique raw material type, theprobability that any one cell contains a specific rawmaterial type is approximately 4.0 x 10⁻⁶ (i.e., 1type / 250,000 cells). Alternatively, these numbersmay be thought of as the environmental densitiesof all stone raw materials and specific raw mater-ial types, respectively.
492 AMERICAN ANTIQUITY [Vol. 68, No. 3, 2003
Figure 4. A snapshot of a 100-x-100 cell area of the simu-lation world (total size 500 x 500 cells) showing the randomdistribution of raw material sources in the environment.The mean distance between nearest neighboring rawmaterial sources is 3.72 grid cells (standard deviation =1.85 cells; minimum = 1.0 cells; maximum = 8.25 cells).The entire simulated world contained 5,000 raw materialsources each arbitrarily assigned a unique type label.
*brantingham 6/26/03 4:19 PM Page 492

The initial coordinate position of the single for-ager in the environment is chosen in a manner sim-ilar to the positioning of raw material sources,namely from a uniform distribution (x, y) = [1,500]. At each time step, the forager moves to oneof the nearest eight neighboring cells (i.e., theMoore neighborhood) or stays in the present cell,with equal probability (p = 1/9). This movementrule defines a random walk wherein there are nofirst- or higher-order correlations in move directions(Turchin 1998:78).
When a raw material source is encountered, theforager evaluates the present size of the mobiletoolkit and collects only as much raw material asis necessary to provision the toolkit up to the max-imum size. The mobile toolkit is simulated as a vec-tor vi where each element represents the amount ofstone raw material in the toolkit of unique type i.In most simulations, the maximum amount of mate-rial that can be carried in the mobile toolkit is arbi-trarily set at 100 units. Accordingly, the mobiletoolkit must always meet the constraint:
(1)
The amount of raw material procured when a sourceof type i is encountered is given by:
(2)
The theoretical maximum richness kmax of themobile toolkit is simply the maximum toolkit capac-ity. In the baseline case, the mobile toolkit is max-imally rich when each unique material type isrepresented by only one unit and the left side ofequation (1) sums to 100. The mobile toolkit is min-imally rich when only one raw material type i is rep-resented, regardless of the sum from equation (1).
At each time step, a fixed amount of raw mate-rial from the mobile toolkit is consumed, even ifthe forager has not moved from its current positionand provided that the toolkit is not empty. In all sim-ulations, the consumption rate r is fixed at one unitof material per time step. Importantly, each mate-rial type i is consumed with a probability depen-dent only upon its relative frequency within themobile toolkit:
(3)
where ci is the probability that a material of type iis consumed at a single time step. If all materialsare equally represented in the toolkit, then they willeach have an equal probability of being consumedin the next time step. This is an important obser-vation because it ensures that the type i of rawmaterial does not influence the probability of con-sumption. For example, if there are five raw mate-rial types equally represented by one unit in themobile toolkit, then there are equal probabilities ci= .2 (or ci = 1/5) that type i is consumed. Alterna-tively, if type i = 1 in the mobile toolkit is repre-sented by 10 units and the remaining four typeseach by one unit, then the probabilities of con-sumption shift to c1 = 10/14 and c1–4 = 1/14, respec-tively.
Each unit of raw material consumed is immedi-ately discarded from the mobile toolkit. Because thechoice of material to consume is independent of rawmaterial type, discard is similarly independent ofraw material type. This is a critical point to recog-nize since any archaeological evaluations of themodel developed here are dependent on a clearunderstanding of the mechanism by which stone rawmaterials become part of the archaeological record.Substantial effort has been invested in modeling thediscard process (e.g., Schiffer 1987; Shott 1989;Varien and Potter 1997), and there is much to rec-ommend these models. In the spirit of the neutralapproach taken here, however, discard is consideredsimply to be a random sampling mechanism thatoperates on the mobile toolkit independent of rawmaterial type designations. Individual archaeolog-ical assemblages may be treated as repeated randomsamples of different sizes from the mobile toolkit.In the aggregate, multiple archaeological assem-blages should provide a reasonably complete pic-ture of stone raw material procurement dynamics.
Figure 5 presents a schematic diagram of thestructural and dynamic components of the simula-tion, and Table 1 lists the variables and parametersettings that define the baseline model. In all cases,the simulation is allowed to run until either 200unique sources have been encountered, or the for-ager reaches the “edge” of the simulation world.
Simulation Results
The simulation seeks to establish a set of neutralexpectations for trends in stone raw material rep-resentation within the mobile toolkit. Baseline data
cv
vii
ii
= ∑
a vi ii
= − ∑100
vii
≤∑ 100
P. Jeffrey Brantingham] NEUTRAL MODEL OF STONE RAW MATERIAL PROCUREMENT 493
*brantingham 6/26/03 4:19 PM Page 493

are generated on raw material richness, quantitiesof unique raw material types, and transport dis-tances for unique raw material types contained inthe mobile toolkit. These data combine to provideadditional expectations for the relationship betweenthe quantity of a material in the toolkit and the dis-tance from its source and the intensity of raw mate-rial reduction as a function of distance from source.
Raw Material Richness
The simulated mobile toolkit spends variable peri-ods of time in different richness states (Figure 6).
Most often the toolkit contains few raw materialtypes, 25 percent of the time containing no mater-ial at all. Occasionally the toolkit sustains richnesslevels of more than 10 unique types. Ten separatesimulation runs using baseline parameters estab-lish a median raw material richness within themobile toolkit of two unique material types andmaximum raw material richness of 11 unique types.These values are not significant in any global sense,though the general shape of the distribution maybe (see Hayek and Buzas 1997; Hubbell 2001).What is interesting, however, is that richness lev-els are always very low relative to the theoreticalmaximum, determined by the size of the mobiletoolkit (equation [1] above). In Figure 6, the sim-ulated maximum richness is only 11 percent of thetheoretical maximum of 100 unique types.
The proportion of time spent in various richnessstates and the observed maximum richness of themobile toolkit are dependent on the density of rawmaterials in the environment, the maximum capac-ity of the mobile toolkit, and the raw material con-sumption rate. A few analytical steps are requiredto explicate these constraints.
Consider first the number of time steps N it takes
494 AMERICAN ANTIQUITY [Vol. 68, No. 3, 2003
Figure 5. Structural and dynamic components of a neutralmodel of stone raw material procurement. Building thesimulation environment entails defining the size of the sim-ulation world and adding a fixed number of unique rawmaterial sources. A single forager with a mobile toolkit offixed maximum capacity is then added to the environment.At each time step, the forager moves to one of the eightnearest neighbors, or remains in its current location, withequal probability, and a fixed amount of raw material isconsumed dependent only upon its frequency in the mobiletoolkit. If a raw material source is encountered, the toolkitis reprovisioned up to its maximum capacity before mov-ing again at random. If no raw material source is encoun-tered, the forager moves immediately at random.Simulations are run until 200 unique raw material sourcesare encountered, or the edge of the simulation world isreached.
Figure 6. Frequency histogram showing mobile toolkitrichness for one complete simulation run of 22,830 timesteps. These simulation results provide empirical probabil-ities of observing a given raw material richness within themobile toolkit. In this representative simulation run themobile toolkit contained no raw material approximately25 percent of the simulation time, between one and fourunique raw material types 61.1 percent of the time, andfive or more types only 13.7 percent of the time. On aver-age, one would expect to see different richness states inroughly those proportions. Model parameters: world size= 500 x 500; number of unique sources = 5,000; mobiletoolkit size = 100; consumption rate = 1.
*brantingham 6/26/03 4:19 PM Page 494
to get from one raw material source to the next ran-domly encountered raw material source. This isapproximately:
(4)
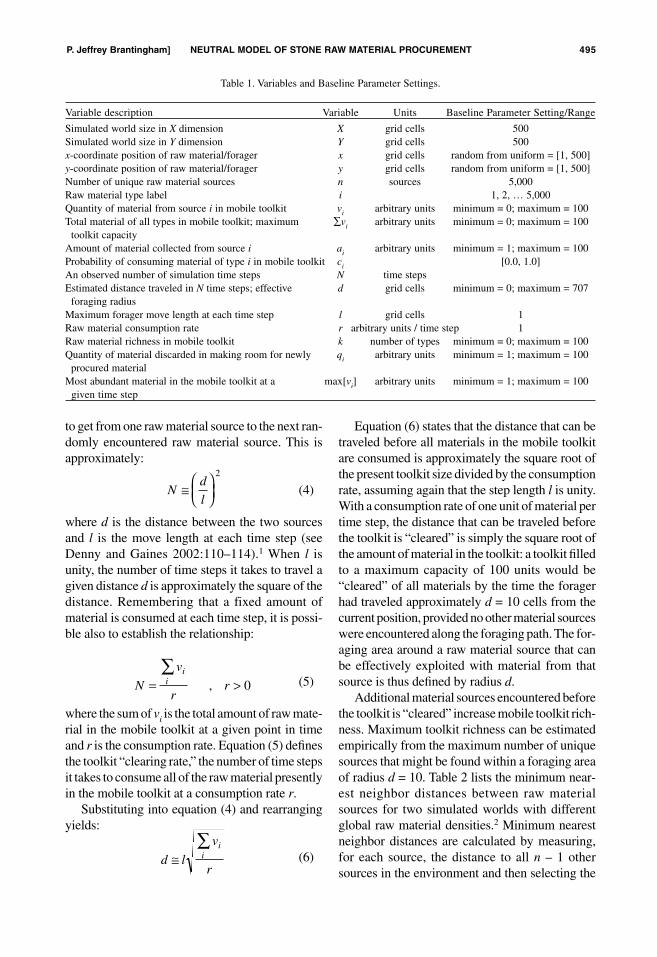
where d is the distance between the two sourcesand l is the move length at each time step (seeDenny and Gaines 2002:110–114).1 When l isunity, the number of time steps it takes to travel agiven distance d is approximately the square of thedistance. Remembering that a fixed amount ofmaterial is consumed at each time step, it is possi-ble also to establish the relationship:
(5)
where the sum of vi is the total amount of raw mate-rial in the mobile toolkit at a given point in timeand r is the consumption rate. Equation (5) definesthe toolkit “clearing rate,” the number of time stepsit takes to consume all of the raw material presentlyin the mobile toolkit at a consumption rate r.
Substituting into equation (4) and rearrangingyields:
(6)
Equation (6) states that the distance that can betraveled before all materials in the mobile toolkitare consumed is approximately the square root ofthe present toolkit size divided by the consumptionrate, assuming again that the step length l is unity.With a consumption rate of one unit of material pertime step, the distance that can be traveled beforethe toolkit is “cleared” is simply the square root ofthe amount of material in the toolkit: a toolkit filledto a maximum capacity of 100 units would be“cleared” of all materials by the time the foragerhad traveled approximately d = 10 cells from thecurrent position, provided no other material sourceswere encountered along the foraging path. The for-aging area around a raw material source that canbe effectively exploited with material from thatsource is thus defined by radius d.
Additional material sources encountered beforethe toolkit is “cleared” increase mobile toolkit rich-ness. Maximum toolkit richness can be estimatedempirically from the maximum number of uniquesources that might be found within a foraging areaof radius d = 10. Table 2 lists the minimum near-est neighbor distances between raw materialsources for two simulated worlds with differentglobal raw material densities.2 Minimum nearestneighbor distances are calculated by measuring,for each source, the distance to all n – 1 othersources in the environment and then selecting the
d l
v
r
ii≅∑
N
v
rr
ii= >∑
, 0
Nd
l≅
2
P. Jeffrey Brantingham] NEUTRAL MODEL OF STONE RAW MATERIAL PROCUREMENT 495
Table 1. Variables and Baseline Parameter Settings.
Variable description Variable Units Baseline Parameter Setting/Range
Simulated world size in X dimension X grid cells 500Simulated world size in Y dimension Y grid cells 500x-coordinate position of raw material/forager x grid cells random from uniform = [1, 500]y-coordinate position of raw material/forager y grid cells random from uniform = [1, 500]Number of unique raw material sources n sources 5,000Raw material type label i 1, 2, … 5,000Quantity of material from source i in mobile toolkit vi arbitrary units minimum = 0; maximum = 100Total material of all types in mobile toolkit; maximum ∑vi arbitrary units minimum = 0; maximum = 100
toolkit capacityAmount of material collected from source i ai arbitrary units minimum = 1; maximum = 100Probability of consuming material of type i in mobile toolkit ci [0.0, 1.0]An observed number of simulation time steps N time stepsEstimated distance traveled in N time steps; effective d grid cells minimum = 0; maximum = 707
foraging radiusMaximum forager move length at each time step l grid cells 1Raw material consumption rate r arbitrary units / time step 1Raw material richness in mobile toolkit k number of types minimum = 0; maximum = 100Quantity of material discarded in making room for newly qi arbitrary units minimum = 1; maximum = 100
procured materialMost abundant material in the mobile toolkit at a max[vi] arbitrary units minimum = 1; maximum = 100
given time step
*brantingham 6/26/03 4:19 PM Page 495

observed minima for the population of sourcesoverall. Two sources chosen at random from theenvironment, for example, each have nearest neigh-bors of rank 1, 2, 3 . . . 5,000. The correspondingdistances to neighbors of each rank may be, hypo-thetically, 1.0, 1.25, 4.3 . . . 698, and 1.2, 1.3, 2.6 .. . 687 grid cells for each source, respectively. Inthis hypothetical case, the first- and second-orderminimum nearest neighbors are defined on the basisof source 1, while the third and 5,000th nearestneighbors are defined on the basis of source 2. Thisprocess yields the set of minimum nearest neigh-bors 1.0, 1.25, 2.6 . . . 687, which subsequentlydefines the maximum possible packing of resourcesinto a local foraging area. When the simulatedworld contains 5,000 unique sources—a globaldensity of .02 sources/grid cell—the set of mini-mum nearest neighbors will on average include 11sources within the boundaries of a foraging area of
radius d = 10. With a total of 3,000 sources—.012sources/grid cell—on average there are sevenunique sources within a foraging area of radius d= 10 (Table 2). These sets provide reasonable esti-mates of maximum attainable raw material richnessunder different raw material density conditions.
In general, increasing the global density of rawmaterials in the environment, which increases prob-abilistically the maximum number of materialsfound in a foraging area of radius d, will alsoincrease the maximum attainable richness for themobile toolkit. Similarly, increasing maximumtoolkit capacity, leaving both the environmentaldensity of resources and raw material consumptionrate unchanged, effectively increases the foragingradius d. For example, from equation (6), doublingthe maximum capacity of the mobile toolkit to 200units of material increases the foraging radius d to14.1 grid cells. This expands the area over which
496 AMERICAN ANTIQUITY [Vol. 68, No. 3, 2003
Table 2. Minimum Nearest Neighbor Distances between Raw Material Sources and Predicted Maximum Toolkit Richness for Two Simulated Environments.
5,000 Unique Sources 3000 Unique Sourcesminimum distance to source (grid cells) minimum distance to source (grid cells)
Nearest source rank 1 1.00 1.00Nearest source rank 2 1.00 3.00Nearest source rank 3 2.24 4.24Nearest source rank 4 3.61 6.08Nearest source rank 5 4.47 6.40Nearest source rank 6 6.40 8.49Nearest source rank 7 7.07 9.22Nearest source rank 8 7.07 11.18Nearest source rank 9 7.81 12.04Nearest source rank 10 8.00 12.73Nearest source rank 11 9.22 14.21Nearest source rank 12 10.20 14.56Nearest source rank 13 10.82 16.03Nearest source rank 14 11.18 17.49Nearest source rank 15 11.31 18.25Nearest source rank 16 12.53 19.03Nearest source rank 17 13.00 19.31Nearest source rank 18 13.34 19.92Nearest source rank 19 13.60 21.02Nearest source rank 20 14.14 21.21Nearest source rank 21 14.32 22.02Nearest source rank 22 15.52 22.67Predicted maximum tool kit richness 11 7Observed maximum toolkit richness 11a 6b
Average distance to a neighbor within 5.69 5.49the foraging area
Note: Toolkit size is 100 and d = 10 in both cases; boldface numbers mark the minimum nearest neighbors that fall withinthe effective foraging radius d.aTen separate simulation runs.bFive separate simulation runs.
*brantingham 6/26/03 4:19 PM Page 496

raw material sources may be encountered and con-comitantly increases the maximum attainabletoolkit richness. Using Table 2, maximum attain-able richness increases to kmax = 19 in the case of5,000 unique sources in the environment and kmax= 10 in the case of 3,000 unique sources. Finally,increasing the consumption rate r reduces the effec-tive size of the mobile toolkit and therefore lowersthe maximum attainable toolkit richness.
Note that there is a tradeoff between toolkit rich-ness and the amount of time spent at a richness state.From equation (5), N = max[vi]/r is the amount oftime it takes to “clear” the most abundant materialtype from the mobile toolkit. The dynamic behav-ior of the mobile toolkit is similar to a zero-sumgame (see Hubbell 2001; MacArthur 1960). Whenall of the most abundant material is consumed, therichness state of the toolkit will decrease by 1. Ifthe toolkit is completely full (i.e., ∑vi = 100), anyincrease in richness of the toolkit—from k to k+1—must be accompanied by a decrease qi in a quan-tity of material already in the toolkit. The mostabundant material type in the toolkit is usually theone that must yield space since the probability ofconsuming a material type is dependent only uponits frequency in the toolkit (equation [3] above). Theestimated time spent at the new richness state N isnecessarily lower since max[vi – qi] < max[vi]. Con-sider the situation where the mobile toolkit is com-pletely full and contains only one raw material type(i.e., ∑vi = 100, k = 1). The expected amount oftime spent at this richness state is Nk = 1 = max[vi]= 100. To accommodate exactly one unit of a new
raw material, the material already in the toolkitmust be reduced by at least one unit (e.g., qi = 1).Consequently, the expected time spent at the newrichness state is reduced relative to the originalrichness state by a finite amount Nk = 2 = max[vi –qi] = 99. If it were possible to encounter 100 uniqueraw material sources within a foraging area ofradius d = 10, then a richness state k = 100 wouldrequire max[vi] = 1 for all raw material types in thetoolkit. If no further raw material sources wereencountered after time step 100, then the expectedtime at each richness state would be exactly Nk =
100 = Nk = 99 …= Nk = 1 = 1. Thus, the probability ofobserving a given richness state within the mobiletoolkit decreases as richness increases (Figure 6;see also Table 3).
It is also important to note that the probabilityof observing a given richness state is not distrib-uted evenly in time or space, but is dependent onthe local environmental distribution of raw mater-ial sources (Figure 7). Rapid increases in toolkitrichness will occur only in those local environ-ments where the number of stone sources is high;where the local set of nearest neighbors approachesthe minimum set. Random walk paths carrying theforager away from these local clusters of raw mate-rial sources rapidly decrease toolkit richness. WhileTable 2 illustrates that it is possible to predict globalmaximum toolkit richness simply on the basis ofthe density of stone raw material in the local envi-ronment, and given additional assumptions aboutmaximum toolkit capacity and raw material con-sumption rate, individual observations of the
P. Jeffrey Brantingham] NEUTRAL MODEL OF STONE RAW MATERIAL PROCUREMENT 497
Table 3. Procured Raw Material Package Sizes and Expected Consumption Rates.
Package Size Procured (Arbitrary Units)
Toolkit Richness Number of Occurrences Mean Std. Deviation Minimum Maximum
1 160 63.6 45.1 2 1002 104 30.3 29.0 2 953 93 29.7 30.0 2 954 49 26.6 25.8 2 955 54 14.9 18.6 2 706 18 20.8 19.2 3 667 3 6.7 4.7 3 12Total 481 38.7 38.5 2 100
Expected Amount Remaining At Distance da
d = 10 d = 20 d = 30 d = 4020.7 9.0 3.9 1.7
Note: Data are for one simulation run using baseline parameters.aExpected amount (arbitrary units) calculated from the equation y = 47.726e-0.0834x given in Figure 11.
*brantingham 6/26/03 4:19 PM Page 497

mobile toolkit in space and time may deviate sub-stantially from these expectations.
Finally, maximum toolkit richness increasessystematically with the log of the amount of mate-rial in the toolkit (i.e., sample size) (Figure 8).When the mobile toolkit contains low quantities ofmaterial, the limit on richness is trivial; it is onlypossible to have one unique raw material type ifthere is only one unit of raw material in the toolkit.This trivial limit appears to hold up through fourunits of raw material. When the mobile toolkit con-tains greater than four units of material, however,maximum richness increases at a much slower ratethan the amount of transported raw material. Abovethis level, the environmental density of raw mate-rials, combined with the constraints of toolkit sizeand consumption rate, is increasingly responsiblefor determining maximum toolkit richness: in the-ory it is possible to have 100 different stone sourcespacked into a foraging area of radius d = 10, but inpractice this never occurs. In the base model, themaximum richness value of 11 unique types isobserved only when the mobile toolkit is filled tonear its maximum capacity. Note also that this sam-ple size–richness relationship emerges in spite ofthe equal densities of different raw material typesin the environment.
Transport Distance
At each time step in a simulation, it is possible toevaluate how far the forager is from the procure-
ment point for each unique raw material type pre-sent in the mobile toolkit. This procedure providesan effective measure of how far a raw material typehas been transported from its source. Figure 9 pre-sents frequency histograms of distances fromsource for materials in the mobile toolkit measuredin two different spatial contexts. Figure 9a showsa random sample of approximately 10 percent ofall raw material occurrences in the mobile toolkitfor one simulation run lasting 24,294 time steps.Represented are the number of time steps in whicha material present in the mobile toolkit is found aspecified number of grid cells from the point source,regardless of whether the forager is presently at asource of material. Figure 9b, in contrast, showsthe distance from source for materials in the mobiletoolkit observed only at the points of encounterwith raw material sources. The two spatial contextsdisplay some interesting similarities.
When observations of the mobile toolkit aremade independent of spatial location, the frequencydistribution of distances displays an “internalmode” with a long right skew (Figure 9a). Theinternal mode indicates that the mobile toolkit mostoften contains material types from sources in rel-atively close proximity to the spatial location wherethe toolkit is observed. The median transport dis-tance (9 cells) represents 1.2 percent of the maxi-mum possible linear distance between two sources,the diagonal distance of 707 grid cells across thesimulation world. The modal transport distance (5
498 AMERICAN ANTIQUITY [Vol. 68, No. 3, 2003
Figure 7. Time series showing changes in raw materialrichness within the mobile toolkit of a single forager. Datarepresent observations over 5,000 time steps from a simu-lation run lasting 24,294 time steps. Model parameters:world size = 500 x 500; number of unique sources = 5,000;mobile toolkit size = 100; consumption rate = 1.
Figure 8. Maximum raw material richness (number oftypes) is strongly correlated with the log of the quantity ofmaterial in the mobile toolkit. Model parameters: worldsize = 500 x 500; number of unique sources = 5,000; mobiletoolkit size = 100; consumption rate = 1.
*brantingham 6/26/03 4:19 PM Page 498

cells) represents only .7 percent of the maximum.The median and mode are influenced, respectively,by distance to the edge of the foraging area, givenby radius d, and the average expected distance toneighboring raw material sources within the for-aging area, which is approximately d/2 (see Table2). The median and modal transport distances donot change appreciably with different environ-mental raw material densities. Rather, as raw mate-rial density decreases toward zero, the distribution
loses its right skew and clusters more tightly aroundthe interval [d/2, d].
Observing the mobile toolkit only at the spatiallocations where a raw material source is encoun-tered predictably inflates the observed number ofoccurrences where the distance from source is equalto zero (Figure 9b). This is a trivial outcome deter-mined by the spatial bias in the sample of obser-vations. What is perhaps more interesting is that theinternal mode is still evident even when the forageris at raw material sources. Moreover, the mode isin approximately the same location; as above, thisis approximately the interval [d/2, d].
Raw materials are also transported over dis-tances much greater than the radius of the local for-aging area. For the baseline parameters used here,the maximum transport distance (43 grid cells) isapproximately a factor of four greater than the for-aging area radius d = 10. To see why, consider whathappens following an encounter with a raw mate-rial source where the forager collects 100 units ofmaterial. At this point, the forager is guaranteed atleast 100 time steps of movement. This allows theforager to move an average distance of approxi-mately 10 grid cells (see equations [4]–[6]). If noadditional raw material sources are encountered inthe foraging area, then the maximum distance ofraw material transport would be approximately d= 10 grid cells. If, on the other hand, additional rawmaterial sources are encountered before 100 timesteps have passed from the initial procurementevent, then transport distances can be extendedgreatly beyond the standard foraging radius.
Consider again the situation where a foragerencounters a raw material source and procures 100units of raw material. Imagine that the forager thenmoves for 99 time steps, or a distance of approxi-mately 9.95 grid cells, before encountering a sec-ond source. Encountering the second source“rescues” the mobile toolkit from being cleared forat least 100 more time steps. There is thus a finiteprobability that the one unit of material remainingin the toolkit from the first source will be trans-ported over another 100 time steps, giving a cumu-lative transport distance of 19.95 grid cells fromsource. This distance may increase to approxi-mately 30 grid cells from source if a third sourceis encountered just before the next 100 time stepshave elapsed. However, the probability that at leastone raw material source is encountered every 100
P. Jeffrey Brantingham] NEUTRAL MODEL OF STONE RAW MATERIAL PROCUREMENT 499
Figure 9. Frequency histograms of the distance fromsource for stone raw materials occurring in the mobiletoolkit. (a) Distance from source measured at points bothat and away from raw material sources. Data representapproximately 10 percent sample of the total number ofraw material occurrences in the mobile toolkit from a sim-ulation run lasting 24,294 time steps. (b) Distance fromsource for stone raw materials occurring in the mobiletoolkit measured at encounters with raw material sources.There were a total of 513 separate encounters with rawmaterial sources over the entire simulation run lasting24,294 time steps. Model parameters: world size = 500 x500; number of unique sources = 5,000; mobile toolkit size= 100; consumption rate = 1.
*brantingham 6/26/03 4:19 PM Page 499

time steps, and thus the probability that the mobiletoolkit will continuously hold raw material beyondeach block of 100 time steps, declines rapidly (Fig-ure 10).
At the environmental density of materials,toolkit size and consumption rate specified in thebase model, it is quite common for the toolkit tocontain some amount of material continuously for200, 300, or even 400 sequential time steps. Usingthese simulated results and the relationship N ≈ d2,we should expect raw materials frequently to betransported distances between 14 and 20 grid cellsfrom source, or 1.4 to 2 times the standard forag-ing radius d = 10 grid cells (Figure 10). It is uncom-mon, however, for material to be continuouslytransported for more than 1,000 sequential timesteps. The longest period of continuous raw mate-rial transport observed in the base model is 1,050time steps, which leads to an estimated maximumtransport distance of 32.4 grid cells. This analyti-cal result is a reasonable approximation of the max-imum transport distance of 43 grid cells observedin the stochastic, discrete time case.3 In general, theneutral model predicts that maximum raw mater-
ial transport distances should be three to four timesthe foraging radius d. Of course, any modificationsto the maximum capacity of the mobile toolkit, orthe raw material consumption rate, necessarilychange d and also the absolute maximum transportdistance. Importantly, however, these “behavioral”modifications to the nature of the mobile toolkit donot alter the maximum transport distance relativeto d.4
Technology of Transported Materials
The simulation also provides neutral expectationsfor the quantity and technological character ofmaterials in the mobile toolkit transported fromsources at different distances. Figure 11 illustratesthat the quantity of material i in the mobile toolkitas a function of distance from the source of i fol-lows an exponential decline of the form y = b*e-ax.Materials from the closest sources are usually rep-resented in the greatest quantities, while those fromthe most distant sources are represented in thesmallest quantities. Note, however, that variationaround the mean increases with increasing prox-imity to the source of the material. Thus, materialsfrom nearby sources are frequently procured andtransported either both in high and low quantities.At greater distances from source, raw materials aremore uniformly represented by low quantities.
The high variance in the quantities of materialstransported over short distances stems from theinfluence that materials already in the toolkit haveon the size of raw material packages procured. Forexample, if raw material sources are close to oneanother in space, then there is a high probabilitythat the toolkit will be nearly full when a uniquesource is encountered. Because precedence is givento materials already in the toolkit—there is no dis-card of excess material—the quantity of materialprocured from the newly encountered source willbe relatively low. If material sources are spaced farapart, however, then the mobile toolkit will benearly or completely empty when a unique sourceis encountered. In this case, the size of the rawmaterial package procured from the newly encoun-tered source will approach maximum toolkit size.
The low variance in material quantities trans-ported from distant sources reflects a differentmechanism: materials transported from greater dis-tances display the effects of repeated consumptionevents, dampening out any effect of initial package
500 AMERICAN ANTIQUITY [Vol. 68, No. 3, 2003
Figure 10. The probability that a stone raw material willbe transported at least a distance d is a negative exponen-tial function of the distance from the source. Most materi-als procured have a relatively high probability (p = .33) ofbeing transported approximately 10 grid cells from theirpoint of procurement. This probability drops to p = .14 fordistances of around 15 grid cells. The probability that amaterial is transported greater than 30 grid cells fromsource falls below .02. Transport distances are estimatedusing the relationship N ≈ d2 from observed durations ofcontinuous raw material transport. Note that the scale forplotting the duration of continuous transport is the squareof the transport distance and is therefore nonlinear in thisfigure.
*brantingham 6/26/03 4:19 PM Page 500

size. In essence, raw materials transported from themost distant sources have been “at risk” for con-sumption the longest and therefore occur consis-tently in the smallest quantities within the mobiletoolkit. Table 3 presents data on the sizes of rawmaterial packages procured when the mobile toolkitis at different richness levels. Mean package sizeprocured decreases as richness increases, illustrat-ing that materials already in the mobile toolkit placecertain limits on the amount of material that can beprocured from a newly encountered source.
Table 3 also illustrates, as alluded to above, afundamental relationship between distance fromsource and intensity of material consumption.Quantities of materials in the mobile toolkit fromnearby sources generally have spent the leastamount of time in the toolkit and have thereforebeen exposed to limited risk of consumption. Pre-dictably, these materials are not intensivelyreduced. Risk of consumption increases with theamount of time a material type has spent in themobile toolkit, which equations 4–6 show isdirectly related to raw material transport distance.Materials from more distant sources are thus pre-dictably more intensively reduced. This pattern isindependent of raw material type designations. Forexample, for a starting mobile toolkit of richness k
= 1, the mean procured raw material package sizeis 63.6 units (Table 3). After traveling a distance of10 grid cells, the expected remaining amount ofmaterial from that source is 20.7 units, represent-ing consumption and discard of 60 percent of thematerial originally procured. By the time the for-ager has traveled 20 grid cells the remaining amountof material in the mobile toolkit is 9 units (70 per-cent consumed), and by 40 grid cells only 1.7 unitsremain (~97 percent consumed).
Archaeological Parallels
Several important observations and predictions arederived from the neutral model developed above.First, raw material richness within the mobiletoolkit should be expected to vary dynamically asa function of both spatial location and time, but inall cases richness is constrained to be much less thanthe maximum richness theoretically attainable. Thesignature of this process is a dependence of maxi-mum toolkit richness on sample size. Remember-ing that all materials in the simulated environmentoccur at equal densities, it is clear that the biasesin the representation of raw materials within thetoolkit arise solely from a neutral, non-adaptiveraw material procurement strategy. The fact thatsome materials present in the environment are neverprocured, others are only rarely procured, while afew are commonly procured need not imply rawmaterial selectivity on the part of the forager.
Second, the frequency distribution of raw mate-rial transport distances displays an internal modeand a long right skew. Maximum transport dis-tances are expected to be three to four times thedistance represented by the internal mode. The ratioof the maximum to the modal raw material trans-port distance is largely unaffected by changes inmobile toolkit size, consumption rate, or the nat-ural densities of raw materials in the environment.Maximum transport distances may translate into the“utilization range” of a given raw material type, butare equivocally related to the “geographic range”of the forager.
Finally, the quantity of material of a given typewithin the mobile toolkit generally follows an expo-nential decline with increasing distance fromsource. As an extension of this pattern, materialsfrom the most distant sources are expected to berepresented consistently (i.e., with low variance) insmall quantities and be heavily reduced relative to
P. Jeffrey Brantingham] NEUTRAL MODEL OF STONE RAW MATERIAL PROCUREMENT 501
Figure 11. The quantity of a material (mean +/- 1 standarddeviation) in the mobile toolkit is a negative exponentialfunction of the distance from the raw material source. Thereported equation is a least-squares fit to the mean valuesonly. Data represent approximately a 10 percent sample ofthe total number of raw material occurrences in themobile toolkit from a simulation run lasting 24,294 timesteps, or the time necessary for the simulated forager toencounter 200 unique raw material types. Model parame-ters: world size = 500 x 500; number of unique sources =5,000; mobile toolkit size = 100; consumption rate = 1.
*brantingham 6/26/03 4:19 PM Page 501

mean size of procured raw material packages. Incontrast, materials from the closest sources areexpected to display high variance in both the quan-tities represented and the intensity of reduction. Inlarge part, these patterns may be explained as result-ing from the “zero-sum” behavior of the mobiletoolkit, which gives precedence to materials alreadyprocured over those newly encountered, and thelength of time a material in the mobile toolkit hasbeen exposed to risk of consumption. Neither opti-mization of raw material procurement strategies tominimize time and energy expended in finding andtransporting stone, nor risk reduction strategies formanaging the consumption of stone, play a role inthe generation of these patterns.
Each of these above predictions finds direct par-allels in the archaeological record. Here I return tothe example cases discussed at the beginning of thispaper but emphasize that I do not intend the fol-lowing observations to be restricted to these cases(see below).
The Middle Paleolithic site of Grotte Vaufreyprovides a familiar example of changes in rawmaterial richness through time that are dependenton the sizes of the archaeological samples exam-ined (Geneste 1988, 1989). Rather than indicatingshifts between generalist and specialist raw-mate-rial procurement strategies, the data from GrotteVaufrey suggest a single, remarkably stable set ofprocurement strategies persisting for perhaps130,000 years. The primary question is whether thisrichness–sample size relationship can be distin-guished from the neutral model expectations.
The neutral model anticipates the low observedrichness relative to the environmental density ofsources, as well as the temporal changes in rawmaterial richness and the dependence of thesechanges on sample size (compare Figures 1a, 1b,7, and 8). The model also suggests an alternativeinterpretation of the differences in raw materialprocurement probabilities seen at Grotte Vaufrey(Figure 1c). One may view the distribution in Fig-ure 1c as specifying the probabilities that the mobiletoolkit contains a given raw material type, and noother types, at the time of arrival at Grotte Vaufrey(i.e., richness k = 1). Thus, the mobile toolkit wouldcontain only material type MP2 with probability p= .43, and only MP7 with probability p = .0009.Although the simulated mobile toolkit spends themajority of its time dominated by only one raw
material type (see Figure 6), repeated samplings ofthe toolkit—yielding a large aggregate archaeo-logical sample size—would nevertheless be nec-essary to detect those times the toolkit containedonly MP7. Less-frequent sampling of the mobiletoolkit—leading to a small archaeological samplesize—would most often detect material types MP2and MP1.
The neutral model reinforces the observationthat the differences in raw material procurementprobabilities at Grotte Vaufrey represent a biasintroduced by hominid behavior. The question sur-rounds the nature of this behavioral bias. The neu-tral model indicates that biased procurementprobabilities can arise out of the path dependenceof a random walk. As a consequence, biased rawmaterial representation at Grotte Vaufrey need notimply necessarily specialized procurement strate-gies keyed to raw material quality. More specifi-cally, the neutral model suggests that, to arrive ata site with a single material type “in hand,” the for-ager must traverse the distance between source andsite before the toolkit has “cleared” (see equation[6]). With increasing distance between source andsite, the foraging path must become increasinglylinear to meet this condition. In the base model, forexample, the forager must follow a perfectly linearpath to traverse the distance between a source anda site located 100 grid cells away. Any deviationfrom this path would ensure that the toolkit iscleared of material before arrival at the site. Giventhe mathematical properties of a random walk, theprobability that the path chosen between two pointsis perfectly linear becomes infinitesimally small asthe distance between the points increases.5 In otherwords, the probability of path-dependent biases inraw material representation increases dramaticallywith increasing distance between sources.
The higher expected procurement probabilitiesfor materials MP2 and MP1 at Grotte Vaufrey mayreflect a situation where many different foragingpaths were feasibly executed without danger ofclearing the toolkit (i.e., low-path dependence).Indeed, both material sources are found in relativeclose proximity to the site (Geneste 1988). In con-trast, the lower expected probabilities for procur-ing MP6, MP4, and MP7 may indicate that only alimited number of random walk paths would haveallowed for successful transport of materials to thesite before toolkit clearing (i.e., high-path depen-
502 AMERICAN ANTIQUITY [Vol. 68, No. 3, 2003
*brantingham 6/26/03 4:19 PM Page 502

dence). This argument would appear to hold forMP6 and MP7, which are both >40 km from thesite, but may fail to explain the low expected pro-curement probability for MP4, which is substan-tially closer (Geneste 1988, 1989). As a firstapproximation, the differential representation ofthese materials may simply reflect different prob-abilities of finding viable (i.e., “pre-clearing”) ran-dom walk paths between sources and sites, and notnecessarily raw material selectivity.6
Raw material transfers within the Middle Pale-olithic of Central Europe and the Aquitaine Basinof France display distributions characterized byhigh frequencies of transfers from nearby sources,within the “local” portion of a foraging range, anda dramatic decline in the occurrence of transfersfrom greater distances. In the former region, but lessso in the latter, there are also “internal modes” rep-resenting relatively high frequencies of transfersfrom sources beyond the “local” portion of therange (for individual Middle Paleolithic cases seeGeneste [1989]; for individual Upper Paleolithiccases see Féblot-Augustins [1997a, 1997b, 1997c]and Morala and Turq [1990]). The longest distancetransfers (230–300 km) within the Middle Pale-olithic in Central Europe are between 4.6 and 6times distance represented by the primary internalmode (50 km). The longest distance transfers withinthe Aquitaine Basin would be only twice this modaldistance.
The neutral model generates frequency distrib-utions displaying similar characteristics (compareFigures 2 and 9). In particular, when observationsof the simulated mobile toolkit are spatially biasedtoward procurement points, there is a frequencypeak at very low distances from source. Thereremains, however, an internal mode correspondingto raw material transfers from intermediate dis-tances. The modeled maximum stone transfer dis-tances in this case are between three and four timesthe distance represented by the internal mode. Theneutral interpretation is that the spike in short-dis-tance transfers is primarily a result of a spatial biasin the sample of sites toward those located at or nearraw material sources. The “internal modes” definethe effective foraging radius d around raw mater-ial sources: generally, how far a forager can travelin a random walk with material from a source.These “internal modes” are controlled by the clear-ing rate for the toolkit and need not imply special-
ized logistical or seasonal exploitation of patches.Finally, the archaeologically observed maximumtransport distances in these cases are qualitativelysimilar to those predicted by the neutral model. Itremains to be seen whether the quantitative differ-ences between observed and predicted maximumtransport distances are robust under further testing.As a first approximation, however, the similaritybetween the Middle Paleolithic data and the neu-tral model suggests that raw-material transfer dis-tances of this order need not reflect optimizationof stone procurement and transport. Moreover,there is no necessary reason to invoke socialexchange to explain maximum transport distancesin these instances.7 More generally, it is not clearthat maximum raw material transport distancestranslate in any direct way into geographic terri-tory size.
Lastly, the Central European Middle Paleolithicalso illustrates that materials from nearby sourcesare transferred in relatively large quantities, whilematerials from distant sources are transferred insmall quantities (Féblot-Augustins 1993; Geneste1988, 1989; but see Féblot-Augustins 1997c). Nor-mally this pattern is paralleled by increasing reduc-tion intensity (and/or design formality) withincreasing distance from source. The neutral modelsimilarly anticipates both of these empirical obser-vations (compare Figures 3 and 11). Materials fromnearby sources are usually transferred in largequantities, but with a high degree of variability, andthese materials are usually minimally consumedrelative to the initial quantities procured. In con-trast, materials from distant sources are invariablyfound in small quantities and have been heavilyconsumed relative to initial raw material packagesizes. The modeled relationship is accuratelydescribed by an exponential function of the form y= b*e-ax. The neutral interpretation is that the quan-tity of material transferred is constrained by a fixedtoolkit size, precedence given to materials alreadyin the toolkit and a fixed consumption rate.8 Simi-larly, reduction intensity may simply be a functionof the length of time a material has spent in themobile toolkit and thus degree of exposure to “con-sumption risk” (see Dibble 1995). Quantities ofmaterials transferred and reduction intensity in thiscase are independent of specific raw material typesand, because the mechanism driving toolkit dynam-ics is entirely stochastic, these patterns need not
P. Jeffrey Brantingham] NEUTRAL MODEL OF STONE RAW MATERIAL PROCUREMENT 503
*brantingham 6/26/03 4:19 PM Page 503

imply any depth of planning, optimization, or risk-management strategies.
Discussion
Many an ethnography—and common sense—tellsus that foragers employ complex optimal foragingstrategies (Binford 2001; Kelly 1995; Smith 1991).It is assumed that optimal foraging strategies mustinfluence and, therefore, be diagnosed by stone rawmaterial procurement patterns. The present model,however, is based on assumptions that foragers donot optimize any specific currency associated withmovement, do not depend on any form of planningdepth, and are risk insensitive in all of their move-ment and procurement decisions. Surprisingly,these extreme assumptions lead to patterns in rawmaterial richness and transport that are qualita-tively similar to commonly observed archaeologi-cal patterns. What should we conclude from theseresults?
There are at least two answers to this question.First, it is possible that the processes of archaeo-logical site formation—especially time-averag-ing—may eradicate the fine details of discreteprocurement events leaving a palimpsest of behav-ioral traces indistinguishable from the neutralmodel. In general, time-averaging occurs when-ever events that happened at different points in timeappear synchronous in the geological record(Kowalewski 1996). It influences our understand-ing of behavioral, ecological, or evolutionaryprocesses whenever the sedimentation rate is slowerthan the time scale of the process in question (Bushet al. 2002; Kowalewski et al. 1998; Stern 1994).Stone procurement strategies were implementedon time scales of minutes to perhaps months, if sea-sonal planning was in play, while sedimentation isgenerally a much slower process. Moreover,geochronological controls rarely offer such fine-scale resolution. There is thus little question thattime averaging will be a concern in interpretingmost cases of stone raw material procurement andtransport (but see Close 2000). It may be the casethat discrete stone procurement events were highlyadaptive in all of the ways suggested by currentarchaeological theory, but in some cases it may notbe possible to distinguish the aggregate patterns ofprocurement behavior from the neutral alternative.
Second, it is conceivable—though perhapsunlikely in many environments (but see Branting-
ham et al. 2003; Brantingham et al. 2001; Turchin1998)—that random-walk foraging and a raw-material procurement strategy that is indifferent tostone types could be optimal. The conclusion herewould be that the absence of both planning depthand explicit risk management strategies would yieldhigher fitness than their more complex alternatives.
It is perhaps more likely that other aspects of for-aging behavior were subject to optimization, depthof planning, and risk management in the ways sug-gested by contemporary archaeological theory, butthat stone raw material procurement and transportwere not, at least as reflected in the empirical mea-sures discussed here.9 Foraging strategies optimizedwith respect to mobile prey, or seasonally distrib-uted plant resources, may be entirely stochastic withrespect to raw material source encounters and rawmaterial procurement. Moreover, whether or notstone procurement behaviors were optimized (orsensitive to risk) may have had little or no impacton the optimality of food procurement strategies.The conclusion here would be that a random-walkstone procurement strategy and indifference to stoneraw material type may not entail the fitness penal-ties commonly assumed and, importantly, that themore complex alternatives may not necessarily yieldhigher payoffs. This is a logical extension of argu-ments suggesting that stone raw material procure-ment was completely embedded within otherforaging activities (Binford 1979). Absent any directfitness consequences, stone procurement and trans-port behaviors would be neutral with respect toselection and would be free to vary in a stochasticmanner.
The present model, like many neutral models incommunity ecology (Gotelli and Graves1996:5–6), raises questions about how we inferadaptation from empirical patterns. This said, therewill be temptation for critics to reject the model out-right by claiming that foragers “would” neverengage in a random walk and “would” never makeraw-material procurement decisions without con-sidering raw material type. Similarly, motivatedobjections have been voiced over neutral modelsdiscounting the importance of interspecific com-petition in structuring ecological communities (seeConnell 1980; Conner and Simberloff 1979;Roughgarden 1983; Simberloff 1983). In this lat-ter case, conventional wisdom suggests that com-petition is the critical determinant of whether
504 AMERICAN ANTIQUITY [Vol. 68, No. 3, 2003
*brantingham 6/26/03 4:19 PM Page 504

species can coexist on given a limited resource(MacArthur and Levins 1967). Many researchershave rejected competition-free neutral models incommunity ecology only because they seemed todeny the unique behavioral and morphologicalcharacters considered adaptively important to, if notdefinitive of, biological species. That a neutralmodel contradicts orthodox theory, however, is notsufficient grounds for rejecting the model (Gotelliand Graves 1996:13).
A related criticism might concede that the neu-tral model works for the Middle Paleolithic andbehaviorally archaic hominids, but that behav-iorally modern humans “would” never haveemployed such strategies. The choice of examplesdiscussed here was not motivated by a desire topaint archaic hominids as “acultural” automatonsengaged in random behavioral strategies. Rather,the Western and Central European Middle Pale-olithic archaeological records offer some of thebest (and most explicit) treatments of long-term,regional patterns of stone raw material procure-ment and transport. The models and behavioralinterpretations made explicit in these studies arealso commonly invoked in Lower Paleolithic (e.g.,Féblot-Augustins 1997b, 1997c; Kimura 2002;Martinez 1998; Potts 1994), Upper Paleolithic (e.g.,Blades 1999; Féblot-Augustins 1997a, 1997b,1997c) and even Holocene contexts (see Bamforth2002). The neutral model provides a baseline forcomparison in all of these contexts. It may berejected in some, or perhaps even most empiricaltests (see Féblot-Augustins 1997c:Tables 62 and64). In those cases we will be more confident thatobserved archaeological patterning does reflectsome form of adaptation. However, rejection of theneutral model is not assured a priori simply becauseof an assumption of behavioral modernity.
A more appropriate criticism of the presentmodel would suggest that a forager “could” neverengage in a random-walk foraging strategy and“could” never ignore the differences between stoneraw material types. In this case, the model wouldbe behaviorally irrelevant. I contend, however, thatthe neutral model of stone raw material procure-ment developed here is both behaviorally explicitand behaviorally realistic. Regarding the first point,there are no hidden variables and there should beno confusion about the behavioral mechanicsunderlying the model. Regarding the second point,
the model offers a simplest-case scenario for theform and sequence of behaviors involved in rawmaterial procurement.
Use of the word “realistic” is likely to raise somehackles. Nonetheless, it is critical to recognize thatthe simulation does not intend to capture all fea-tures of Paleolithic foraging adaptations, but ratheronly those behaviors directly involved in raw mate-rial procurement. If anthropologists accept as rea-sonable and realistic that Paleolithic foragers hadthe adaptive capacity to implement patch choicestrategies and even long-term seasonal foragingplans, should it not also be within their capacity tonot implement these behaviors? Similarly, if anthro-pologists accept that foragers are able to distin-guish between raw material types and make furtherchoices about which materials to transport and inwhich forms, should we not also attribute to themthe ability not to make these distinctions and deci-sions? If the answers to these questions are affir-mative, as I believe they are, then a neutral modelingstrategy is appropriate and both a random-walk for-aging strategy and the absence of raw materialselectivity offer simplest-case starting points.
One may also object to the appropriateness ofparsimony as a principal for choosing betweenalternative hypotheses that generate similar, or evenequivalent, results. In truth, there is no guaranteethat the simplest explanation is the correct one. Indefense of parsimony, I would suggest that theprobability of producing a Type II error (i.e., falsepositive) is minimized by favoring the simplestmodel available and also that the opportunity foridentifying and rectifying such an error is greater.
Finally, it is clear that a general neutral modelof stone raw material procurement is only a firststep. Rigorous, quantitative development of theobservations presented herein requires calibrationof the agent-based model to run in simulated“worlds” built around the known geographic dis-tributions of actual raw material sources. Suchintegrated GIS agent-based models are the subjectof current endeavors. Subsequent to this, it will beimportant to begin systematically modifying theneutral assumptions of the model to explore howdifferent assumptions influence results. For exam-ple, it will be important to explore the impact ofpartial- or fully non-random walk-foraging strate-gies on mobile toolkit dynamics, holding theother assumptions about unit raw material neu-
P. Jeffrey Brantingham] NEUTRAL MODEL OF STONE RAW MATERIAL PROCUREMENT 505
*brantingham 6/26/03 4:19 PM Page 505

trality constant. Similarly, it will be instructive tomodify the assumptions concerning raw materialselectivity by, for example, rank ordering stonematerials in the environment according to quality.Ultimately, the goals of these future models willbe to establish whether changes in assumptionslead to quantitatively or qualitatively differentresults from the neutral model. Perhaps moreimportantly, the goal will be to establish whetherthese extended results find empirical support inthe archaeological record.
Conclusions
The richness of raw materials, transport distances,and character of the transported materials foundin archaeological assemblages are often inter-preted in terms of adaptive optimization, depth ofplanning, and risk minimization. In manyinstances, however, these patterns may be qualita-tively indistinguishable from a non-adaptivemodel of Paleolithic foragers engaged in a ran-dom-walk foraging strategy and procuring stoneraw materials without any regard for raw materialtype. The neutral model of stone raw materialprocurement developed here provides the sim-plest-case behavioral interpretations of (1) rich-ness-sample size relationships; (2) a “decay-like”pattern in the frequencies of raw material trans-fers from sources at different distances from site;and (3) the tendency for materials from distantsources to be imported in low quantities and asheavily reduced technological forms. Thoughprovocative in its challenge of conventional the-ory, the model is nonetheless explicit and, moreimportantly, behaviorally realistic. The primaryimplication of the neutral model is that our infer-ences about adaptive variability based on patternsof raw material richness and transport may be dif-ficult to prove. The neutral model provides analternative set of expectations where we can besure that adaptation is not in evidence. In princi-ple, patterns in raw material richness and trans-port that deviate from the neutral baselineexpectations may indicate where optimization,depth of planning, and risk management arepotentially elements of raw material procurementadaptations.
Acknowledgments. This research was supported in part by apostdoctoral fellowship from the Santa Fe Institute. Manythanks to John Pepper, Van Savage, Cosma Shalizi, and Todd
Surovell for guidance along the way. I am grateful to DavidMadsen, David Rhode, J. Féblot-Augustins, and two anony-mous reviewers for comments on earlier drafts of this paper.I thank Alex Borejsza for translating the abstract.
References CitedAbrams, P. A.
2001 A World Without Competition. Nature 412:858–859.Andrefsky, W. J., Jr.
1994 Raw-Material Availability and the Organization ofTechnology. American Antiquity 59:21–34.
Bamforth, D. B.2002 High-Tech Foragers? Folsom and Later Paleoindian
Technology on the Great Plains. Journal of World Prehis-tory 16:55–98.
Beck, C., A. K. Taylor, G. T. Jones, C. M. Fadem, C. R. Cook,and S. A. Millward
2002 Rocks Are Heavy: Transport Costs and PaleoarchaicQuarry Behavior in the Great Basin. Journal of Anthro-pological Archaeology 21:481–507.
Bell, G.2001 Neutral Macroecology. Science 293:2413–2418.
Binford, L. R.1979 Organization and Formation Processes: Looking at
Curated Technologies. Journal of AnthropologicalResearch 35:255–273.
1980 Willow Smoke and Dogs' Tails: Hunter-Gatherer Set-tlement Systems and Archaeological Site Formation.American Antiquity 45:4–20.
2001 Constructing Frames of Reference: An AnalyticalMethod for Archaeological Theory Building Using Ethno-graphic and Environmental Data Sets. Berkeley: Univer-sity of California Press, Berkeley.
Blades, B. S.1999 Aurignacian Lithic Economy and Early Modern
Human Mobility: New Perspectives from Classic Sites inthe Vézère Valley of France. Journal of Human Evolution37:91–120.
Brantingham, P. J., H. Ma, J. W. Olsen, X. Gao, D. B. Madsen,and D. E. Rhode
2003 Speculation on the Timing and Nature of Late Pleis-tocene Hunter-gatherer Colonization of the TibetanPlateau. Chinese Science Bulletin, in press.
Brantingham, P. J., J. W. Olsen, J. A. Rech, and A. I. Krivoshap-kin
2000 Raw Material Quality and Prepared Core Technolo-gies in Northeast Asia. Journal of Archaeological Science27:255–271.
Brantingham, P. J, J. W. Olsen, and G. B. Schaller2001 Lithic Assemblages from the Chang Tang Region,
Northern Tibet. Antiquity 75:319–327.Bush, A. M., M. G. Powell, W. S. Arnold, T. M. Bert, and G.
M. Daley2002 Time-averaging, Evolution and Morphologic Varia-
tion. Paleobiology 28:9–25.Close, A. E.
2000 Reconstructing Movement in Prehistory. Journal ofArchaeological Method and Theory 7:49–77.
Connell, J. H.1980 Diversity and the Coevolution of Competitors, or the
Ghost of Competition Past. Oikos 35:131–138.Conner, E. F., and D. Simberloff
1979 The Assembly of Species Communities: Chance orCompetition? Ecology 60:1132–1140.
Denny, M., and S. Gaines2002 Chance in Biology: Using Probability to Explore
506 AMERICAN ANTIQUITY [Vol. 68, No. 3, 2003
*brantingham 6/26/03 4:19 PM Page 506

Nature. Princeton University Press, Princeton.Dibble, H. L.
1995 Middle Paleolithic Scraper Reduction: Background,Clarification, and Review of the Evidence to Date. Jour-nal of Archaeological Method and Theory 2:299–368.
Féblot-Augustins, J.1993 Mobility Strategies in the Late Middle Palaeolithic of
Central Europe and Western Europe: Elements of Stabil-ity and Variability. Journal of Anthropological Archaeol-ogy 12:211–265.
1997a Middle and Upper Paleolithic Raw Material Trans-fers in Western and Central Europe: Assessing the Pace ofChange. Journal of Middle Atlantic Archaeology 13:57–90.
1997b La Circulation des Matières Premières auPaléolithique: Synthèse des Données Perspectives Com-portementales, vol. 1. ERAUL 75, Liège.
1997c La Circulation des Matières Premières auPaléolithique: Synthèse des Données Perspectives Com-portementales, vol. 2. ERAUL 75, Liège.
Gamble, C.1986 The Palaeolithic Settlement of Europe. Cambridge
University Press, Cambridge.1999 The Palaeolithic Societies of Europe. Cambridge Uni-
versity Press, Cambridge.Geneste, J.-M.
1985 Analyse Lithique d’Industries Moustériennes duPérigord: Une Approche Technologique du Comporte-ment des Groupes Humains au Paléolithique Moyen.Unpublished Doctoral Dissertation, University of Bor-deaux I.
1988 Les Industries de la Grotte Vaufrey: Technologie duDébitage, Économie et Circulation de la Matière Première.In La Grotte Vaufrey: Paléoenvironnement, Chronologie,Activités Humaines, edited by J.-P. Rigaud, pp. 441–517.Mémoires de la SPF, Tome 19. Société PréhistoriqueFrançaise, Paris.
1989 Economie des Resources Lithiques dans Mousteriendu Sud-Ouest de la France. In L'Homme de Néandertal 8,La Subsistance, edited by M. Patou and L. G. Freeman,pp. 75–97. ERAUL, Liège.
Grayson, D. K.1984 Quantitative Zooarchaeology: Topics in the Analysis
of Archaeological Faunas. Academic Press, New York.Grayson, D. K., and F. Delpech
1998 Changing Diet Breadth in the Early Upper Paleolithicof Southwestern France. Journal of Archaeological Sci-ence 25:1119–1129.
2002 Specialized Early Upper Paleolithic Hunters in South-western France? Journal of Archaeological Science29:1439–1449.
Gotelli, N. J., and Graves, G. R. 1996 Null Models in Ecology. Smithsonian Institution Press,
Washington, D.C.Hayek, L.-A. C., and Buzas, M. A.
1997 Surveying Natural Populations. Columbia UniversityPress, New York.
Hubbell, S. P. 2001 The Unified Neutral Theory of Biodiversity and Bio-
geography. Princeton University Press, Princeton.Kelly, R. L.
1995 The Foraging Spectrum: Diversity in Hunter-GathererLifeways. Smithsonian Institution Press, Washington, D.C.
Kimura, M. 1983 The Neutral Theory of Molecular Evolution. Cam-
bridge University Press, Cambridge.Kimura, Y.
2002 Examining Time Trends in the Oldowan Technology
at Beds I and II, Olduvai Gorge. Journal of Human Evo-lution 43:291–321.
Kowalewski, M.1996 Time-Averaging, Overcompleteness, and the Geo-
logical Record. The Geology Journal 104:317–326.Kowalewski, M., G. A. Goodfriend, and K. W. Flessa
1998 High-resolution Estimates of Temporal Mixing withinShell Beds:The Evils and Virtues of Time-averaging. Pale-obiology 24:287–304.
Kuhn, S. L.1994 A Formal Approach to the Design and Assembly of
Mobile Toolkits. American Antiquity 59:426–442.1995 Mousterian Lithic Technology: An Ecological Per-
spective. Princeton University Press, Princeton.MacArthur, R. H.
1960 On the Relative Abundance of Species. The Ameri-can Naturalist 94:25–36.
MacArthur, R. H., and R. Levins1967 The Limiting Similarity, Convergence and Divergence
of Coexisting Species. The American Naturalist101:377–385.
Martinez, M. M.1998 Differential Raw Material Use in the Middle Pleis-
tocene of Spain: Evidence from Sierra Atapuerca, Tor-ralba, Ambrona and Aridos. Cambridge ArchaeologicalJournal 8:15–28.
Mellars, P. A.1996 The Neandertal Legacy: An Archaeological Perspec-
tive from Western Europe. Princeton University Press,Princeton.
Metcalfe, D., and K. R. Barlow1992 A Model for Exploring the Optimal Tradeoff between
Field Processing and Transport. American Anthropologist94:340–356.
Morala, A., and A. Turq1990 Les Stratégies d'Exploitation du Milieu Minéral, du
Riss a l'Holocène en Haut-Agenais (Sud-Ouest de laFrance). In Le Silex de sa Genèse à l'Outil, edited by M.-R. Sérone-Vivien and M. Lenoir, pp. 405–414. CNRS,Paris.
Neiman, F. D.1995 Stylistic Variation in Evolutionary Perspective: Infer-
ences from Decorative Diversity and Interassemblage Dis-tance in Illinois Woodland Ceramic Assemblages.American Antiquity 60:7–36.
Nelson, M. C.1991 The Study of Technological Organization. Archaeo-
logical Method and Theory 3:57–100.Potts, R.
1994 Variables Versus Models of Early PleistoceneHominid Land Use. Journal of Human Evolution 27:7–24.
Rensink, E., J. Kolen, and A. Spieksma1991 Patterns of Raw Material Distribution in the Upper
Pleistocene of Northwestern and Central Europe. In RawMaterial Economies and Prehistoric Hunter-Gatherers,edited by A. Montet-White and S. Holen, pp. 141–159.University of Kansas Publications in Anthropology 19,Lawrence.
Roebroeks, W., J. Kolen, and E. Rensink1988 Planning Depth,Anticipation and the Organization of
Middle Paleolithic Technology: The “Archaic Natives”Meet Eve’s Descendants. Helinium 28:17–34.
Roughgarden, J.1983 Competition Theory in Community Ecology. The
American Naturalist 122:583–601.Schiffer, M. B.
1987 Formation Processes of the Archaeological Record.
P. Jeffrey Brantingham] NEUTRAL MODEL OF STONE RAW MATERIAL PROCUREMENT 507
*brantingham 6/26/03 4:19 PM Page 507

University of New Mexico Press, Albuquerque.Schoener, T. H.
1983 Field Experiments in Interspecific Competition. TheAmerican Naturalist 122:240.
Shennan, S. J., and J. R. Wilkinson2001 Ceramic Style Change and Neutral Evolution:A Case
Study from Neolithic Europe. American Antiquity66:577–593.
Shott, M. J.1989 On Tool-Class Use Lives and the Formation of Archae-
ological Assemblages. American Antiquity 54:9–30.Simberloff, D.
1983 Competition Theory, Hypothesis-Testing, and OtherCommunity Ecological Buzzwords. The American Natu-ralist 122:626–635.
Smith, E. A.1991 Inujjuamiut Foraging Strategies: Evolutionary Ecol-
ogy of an Arctic Hunting Economy. Aldine de Gruyter, NewYork.
Stern, N.1994 The Implications of Time-Averaging for Recon-
structing the Land-Use Patterns of Early Tool-UsingHominids. Journal of Human Evolution 27:89–105.
Torrence, R.1989 Time, Energy and Stone Tools. Cambridge University
Press, Cambridge.Turchin, P.
1998 Quantitative Analysis of Movement: Measuring andModeling Population Redistribution in Animals and Plants.Sinauer Associates, Sunderland.
Varien, M. D., and J. M. Potter1997 Unpacking the Discard Equation: Simulating the
Accumulation of Artifacts in the Archaeological Record.American Antiquity 62:197–213.
Weiher, E., and P. A. Keddy1999 Assembly Rules as Trait-Based Constraints on Com-
munity Composition. In Ecological Assembly Rules, editedby E. Weiher and P. A. Keddy, pp. 251–271. CambridgeUniversity Press, Cambridge.
Notes1. A two-dimensional random walk on a lattice is com-
monly used as a discrete approximation of spatial diffusion.N ≈ (d/l)2 is the mean squared distance of spread (the vari-ance) after N time steps for an ensemble of particles under-going diffusion. Denny and Gaines (2002) provide astraightforward derivation of this formula for the one-dimen-sional case. The derivations for the two- and three-dimen-sional cases yield the same fundamental relationship (Dennyand Gaines 2002:163–167).
2. This analysis is based on the limiting case where rawmaterial sources are encountered only within the 100 timesteps following a first encounter, and not subsequently (i.e., d= 10 using equation [4]). Of course, raw material sources maybe encountered over time intervals greater than N = 100. Theresults are comparable to this limiting case because of a trade-off between time spent at different richness states and theamount of material represented by the most abundant type inthe toolkit (see discussion in text).
3. The discrepancy between the observed and expectedmaximum transport distances reflects the path dependence ofa random walk. The analytical form N ≈ d2 may substantiallyunder- or over-estimate the actual distance traveled on any
given sequence of steps in a random walk. The approximationbecomes more accurate with increasing number of observa-tions.
4. Increasing the density of stone raw materials towardsthe environmental maximum also does not fundamentallyalter the relationship between d and the maximum transportdistance. Consider the situation where every grid cell con-tains a unique stone raw material source and, for simplicity,the forager must move from its current position at each timestep. One unit of raw material is consumed at each time stepand is immediately replaced by another unit of material froma different source located in an adjacent cell. Under theseconditions, the mobile toolkit remains at its maximum capac-ity and very quickly approaches an equilibrium richness nearthe theoretical maximum; each raw material type in thetoolkit is represented by only one unit of material (see equa-tion [1]). The probability that a raw material i is consumed ata given time step is therefore a constant ci = 1/Σvi (see equa-tion [3]). The probability that a unit of raw material enteringthe toolkit is transported a number of time steps N (and dis-tance N ≈ d2) is given by the binomial probability distribution:
where j (the number of successes in N trials) is defined as theconsumption of the one unit of material i present in the toolkit(i.e., j = 1). Given a toolkit size of Σvi = 100, raw material for-aging radius d = 10 and a constant probability of consumptionci = 1/Σvi = .01, there is a probability p = .001 that material iwill be transported 30 grid cells from its source (three timesd) and a probability p = 1.68 x 10⁻⁶ that the material will betransported 40 grid cells from its source (four times d).
5. On a two-dimensional lattice, allowing for the possi-bility of remaining in the same location, a step in any onedirection occurs with probability p = .11. Two and three con-secutive steps in the same direction occur with probabilities p= .012 and p = .0013, respectively. The probability of 100consecutive steps in the same direction is p = 3.7*10–96.
6. Alternatively, the inferred procurement probabilitiesfrom Grotte Vaufrey may be taken to represent the “partitionsizes” for a mobile toolkit that had a standing richness of ninetypes. In this case, material types MP2 and MP1 wouldtogether take up 83 percent of the available space in the fixed-size mobile toolkit, while MP6, MP4 and MP7 combinedwould comprise only 1.4 percent. Such partition sizes couldarise because of the indiscriminant “zero-sum” behavior ofthe mobile toolkit, not necessarily because of raw materialselectivity (see Table 3). Remembering the neutral conditionthat raw materials are consumed and discarded using a sim-ple frequency dependent rule, we may conclude that a largenumber of consumption-discard events—yielding largerarchaeological sample sizes—would be needed to detect thepresence of MP6, MP4 and MP7 within the toolkit.
7. In the absence of a spatial bias towards procurementpoints (see Figure 9a), the modeled frequency distributiondisplays only the single internal mode with a long right skew.This distribution more closely describes the pattern observedfor marine shell transfers within the European UpperPaleolithic where there is primary internal mode at approxi-mately 250 km (Gamble 1999:321, after Floss 1994).
p n NN
j N jc ci
ji
N j( )!
!( )!( )= =
−− −1
508 AMERICAN ANTIQUITY [Vol. 68, No. 3, 2003
*brantingham 6/26/03 4:19 PM Page 508

Maximum transfer distances for marine shells are betweenfive and ten times farther for shell than for stone. The neutralmodel can account for both of these differences. First, it isreasonable to suppose, given the linear geometry of coastalmargins, that the archaeological recovery of marine shellshows less of a bias toward procurement points than is thecase for stone raw materials found in continental interiors;sites can cluster more tightly around continental stone rawmaterial sources than around coastal shell sources. This couldexplain the absence of a frequency spike for short distanceshell transfers. Second, the underlying cause of the greatermaximum transfer distances may simply be that marine shellsare at lower risk for consumption (i.e., destruction) comparedwith stone. This implies that the “clearing rate” for shell islower than for stone and therefore that the effective foragingradius d for marine shell is also substantially greater (seeequations 4–6). It is interesting that the maximum distancefor marine shell transfers (1,500 km) (Gamble 1999: 321) is6 times the primary mode, the same as observed for stonetransfers in the Central and Eastern European MiddlePaleolithic, and not orders of magnitude farther than the inter-nal mode.
8. In the Central European Middle Paleolithic, theobserved relationship between quantity of material trans-ferred and distance from source is better described overall bya power distribution of the form y = b*x-a. However, the bet-ter fit of a power function is the result of the substantial vari-ance in quantities of materials transferred from sourceswithin 15 km of the study sites. High variance in the quanti-ties of materials transferred from nearby sources is antici-pated by the neutral model.
9. Technological design enters into the neutral model onlyas regards the role reduction intensity plays in establishing,maintaining or modifying designs. Clearly, formal core andtool designs may respond to optimization, risk and depth ofplanning in ways not anticipated by the model.
Received June 10, 2002; Revised November 25, 2002;Accepted December 2, 2002.
P. Jeffrey Brantingham] NEUTRAL MODEL OF STONE RAW MATERIAL PROCUREMENT 509
*brantingham 6/26/03 4:19 PM Page 509

Over 60 Years of American Antiquity Are Now Available in JSTOR!
The Society for American Archaeology is pleased to announce the full-text, online version of American Antiquity 1935-1997. To find out whether your library is a JSTOR participant, please email [email protected]. If you are not at a participating institution, as a current member you can now access the American Antiquity archive for just $25 per calendar year. To be able to search over 60 years of American Antiquity in full-text format, print out this form and fax +1 (202) 789-0284 or mail the following information with payment to:
The Society for American Archaeology Manager, Information Services
900 Second Street NE #12 Washington DC 20002-3557
Name:________________________ Member ID #:__________________ Address: __________________________ City:___________________ Zip: ______________ Country: ___________ Phone: ________________ Email: _____________________ Payment Type (Check one):
Check enclosed made out to SAA Credit Card (circle type): AMEX Visa Mastercard Card #: __________________________ Expiration Date: ______________________ Signature:____________________________________ *Upon processing of payment, SAA will send you an email message with your password and instructions of how to access the archive. You will have access only to American Antiquity. *Agreement with SAA:
I agree that I will use the database for my personal use only and will not share my user name,
password, or access with other individuals or institutions. Signature:____________________________________
____________________________________________________________________JSTOR is an independent not-for-profit organization with a mission to create a trusted archive of scholarly journals and to increase access to those journals as widely as possible. The JSTOR database consists of the complete backfiles of over 240 scholarly journals and is available to researchers through libraries.
For additional information on JSTOR, please visit www.jstor.org.
*brantingham 6/26/03 4:19 PM Page 510