a parametric study of combustion system design for a light ...eprints.brighton.ac.uk/13376/1/thesis...
TRANSCRIPT

A Parametric Study of Combustion System
Design for a Light Duty Diesel Engine
Steven Higginson
A thesis submitted in partial fulfilment of the requirements of the University of Brighton for
the degree of Doctor of Philosophy
School of Computing Engineering and Mathematics (SCEM)
In collaboration with
Delphi Diesel Systems (DDS) and Ricardo Consulting Engineers

i
Declaration
I declare that the research contained in this thesis, unless otherwise formally indicated
within the text, was the original work of the author. The thesis has not been previously
submitted to this or any other university for a degree, and does not incorporate any
material already submitted for a degree.
Signed:
Dated:

ii
Abstract
This thesis documents the characterisation of the performance of a range of Diesel
combustion systems derived from two conventional and two unconventional piston bowl
designs used in combination with production and prototype piezoelectric fuel injection
equipment (FIE).
The effect of injector tip protrusion was studied in order to evaluate the importance of
spray targeting on the performance of each piston bowl. All but one bowl, optimised for the
same tip protrusion, resulted in an isFC improvement of up to 2.4 % at part load. At full load,
the isFC for the unconventional bowls deteriorated by up to 7.4 % as the tip protrusion was
increased.
All bowls were tested over a range of part and full load key points and the unconventional
bowls had consistently lower isFC (up to 2.5 % lower) but higher isNOx, particularly at part
load. Both unconventional bowls performed identically at part load, with one of them
performing better at full load.
Both conventional solenoid and prototype piezoelectric injectors were tested on a single
conventional bowl. The combustion rate was shown to be slower for the conventional
injectors, resulting at part load in better fuel consumption due to less heat transfer. The
faster mixture formation and combustion process that the prototype injection system
generated was beneficial at the higher load condition.
The effect of the number of injector holes was studied with the prototype piezoelectric
injection system. An increase in the number of holes showed an improvement at one of the
part load key points, but resulted in reduced performance at the full load points.
A pilot injection study was carried out. Adding a pilot reduced the emission of HC and CO
significantly (more than 10 %) while improving the fuel consumption. Adding a pilot and
retarding the injection timing at part load resulted in a low temperature combustion mode,
which led to a simultaneous reduction in NOx (20 %) and smoke (45 %). This demonstrated
the potential of the unconventional bowl designs for use with low temperature combustion
strategies.

iii
Contents
Declaration .................................................................................................................................. i
Abstract ...................................................................................................................................... ii
Contents .................................................................................................................................... iii
List of Tables ............................................................................................................................ vii
List of Figures ............................................................................................................................ ix
Nomenclature .......................................................................................................................... xv
Acknowledgements ................................................................................................................ xvii
1 Introduction ....................................................................................................................... 1
1.1 Project Context ............................................................................................................ 1
1.2 Thesis Structure ........................................................................................................... 3
2 Diesel Combustion System Development Literature Survey ............................................. 5
2.1 Diesel Combustion Systems ........................................................................................ 5
2.1.1 Indirect Injection .................................................................................................. 5
2.1.2 Direct Injection ..................................................................................................... 9
2.1.3 Diesel Piston Bowl Design .................................................................................. 13
2.2 Diesel Fuel Injector Design ........................................................................................ 19
2.2.1 Fuel Injector Nozzles .......................................................................................... 22
2.3 Diesel Combustion and Emissions ............................................................................. 26
2.3.1 Traditional Diesel Combustion ........................................................................... 26
2.3.2 Alternative Diesel Combustion Strategies ......................................................... 29
2.3.3 Soot Formation .................................................................................................. 33
2.4 Multiple Injections .................................................................................................... 36
2.5 Combustion System Development Conclusions ....................................................... 38
3 Experimental Equipment ................................................................................................. 40

iv
3.1 Hardware Specification ............................................................................................. 40
3.1.1 Single Cylinder Diesel Research Engine ............................................................. 40
3.1.2 Piston Bowl Library ............................................................................................ 43
3.1.3 High Pressure Common Rail Fuel System .......................................................... 46
3.1.4 Injector Nozzle Library ....................................................................................... 48
3.2 Engine Test Bed ......................................................................................................... 49
3.2.1 Air System .......................................................................................................... 49
3.2.2 Fuel System ........................................................................................................ 52
3.2.3 Exhaust System .................................................................................................. 55
3.2.4 Exhaust Gas Recirculation System ..................................................................... 57
3.2.5 Oil and Water System ........................................................................................ 58
3.3 Data Logging .............................................................................................................. 59
3.3.1 Low Speed Logging ............................................................................................. 59
3.3.2 High speed Data ................................................................................................. 59
3.4 Instrumentation ........................................................................................................ 60
3.4.1 Emissions Measurement .................................................................................... 63
3.4.2 Fuel measurement ............................................................................................. 67
3.5 Engine Test Points Drive Cycle Analysis .................................................................... 68
3.6 Measurement Error and Uncertainty Analysis .......................................................... 69
3.6.1 Calculating uncertainty ...................................................................................... 69
3.6.2 Representing Uncertainty .................................................................................. 71
3.7 Daily Check Point Analysis ......................................................................................... 71
3.7.1 Motored Test Points .......................................................................................... 72
3.7.2 Daily Check Point ............................................................................................... 74
4 The Effect of Injector Nozzle Protrusion on Combustion and Emissions ........................ 76
4.1 Experimental Results ................................................................................................. 77

v
4.1.1 Protrusion – KP3 Test ......................................................................................... 81
4.1.2 Protrusion – 4000FL Test ................................................................................... 90
4.1.3 Protrusion – 2000FL Test ................................................................................... 98
4.2 Conclusions of Protrusion Optimisation ................................................................. 103
5 The Effect of Bowl Geometry on Combustion and Emissions ....................................... 106
5.1 Experimental results................................................................................................ 107
5.1.1 KP3 Characterisation Test ................................................................................ 109
5.1.2 KP2 Characterisation Test ................................................................................ 115
5.1.3 KP1 Characterisation Test ................................................................................ 121
5.1.4 Full Load Operation .......................................................................................... 127
5.2 Optimised Bowl Selection ....................................................................................... 132
6 The Effect of Injector Design on Combustion and Emissions ........................................ 136
6.1 Injector Characteristic ............................................................................................. 136
6.2 Experimental Results ............................................................................................... 139
6.2.1 KP3 Test ............................................................................................................ 140
6.2.2 KP2 Test ............................................................................................................ 145
6.2.3 KP1 Test ............................................................................................................ 150
6.2.4 4000FL Test ...................................................................................................... 154
6.3 Conclusions of the Injector Evaluation ................................................................... 157
7 The Effect of Injector Nozzle Hole Size and Number of Holes on Combustion and
Emissions ................................................................................................................................ 159
7.1 Experimental Results ............................................................................................... 159
7.1.1 KP3 Test ............................................................................................................ 160
7.1.2 KP2 Test ............................................................................................................ 167
7.1.3 KP1 Test ............................................................................................................ 173
7.1.4 4000FL Test ...................................................................................................... 178

vi
7.1.5 2000FL Test ...................................................................................................... 182
7.2 Conclusions of the Injector Nozzle Study ................................................................ 186
8 The Effect of Pilot Injection Event on Unconventional Combustion Systems ............... 188
8.1 Method and Definitions .......................................................................................... 189
8.2 Experimental Results ............................................................................................... 192
8.2.1 KP3 Test ............................................................................................................ 193
8.2.2 KP2 Test ............................................................................................................ 200
8.2.3 KP1 Test ............................................................................................................ 206
8.3 Conclusion of the Pilot Injection Study ................................................................... 213
8.4 Low Temperature Combustion with a Retarded Injection ..................................... 214
8.6 Conclusions of Retarded Injection Timing Study .................................................... 220
9 Conclusions .................................................................................................................... 221
10 Future Work ................................................................................................................... 227
References ............................................................................................................................. 228
Appendix A Fuel Specification................................................................................................ 233

vii
List of Tables
Table 1.1 European emission regulations for Diesel powered passenger car vehicles
≤ 3,500kg .................................................................................................................................... 1
Table 2.1 List of different names for alternative LTC modes to HCCI ..................................... 31
Table 3.1 Engine specification ................................................................................................. 41
Table 3.2 Major parameters for each piston bowl .................................................................. 45
Table 3.3 Injector nozzle library ............................................................................................... 48
Table 3.4 Table showing the fuel specification of the reference fuel Carcal 725A (see
Appendix A) .............................................................................................................................. 54
Table 3.5 Sensor identification and description ...................................................................... 61
Table 3.6 Emissions analyser performance ............................................................................. 65
Table 3.7 Test points used in the study ................................................................................... 68
Table 3.8 Calculated and measured uncertainties for the common emissions results
displayed in the results section ............................................................................................... 71
Table 3.9 Motored check point statistics ................................................................................. 72
Table 3.10 Open loop daily check point set up ........................................................................ 75
Table 3.11 Open loop daily check point output and variation ................................................ 75
Table 4.1 The relationship of washer thickness and spray centre height ............................... 78
Table 4.2 Protrusion – KP3 test settings .................................................................................. 81
Table 4.3 Test settings used for 4000FL................................................................................... 90
Table 4.4 Protrusion – 2000FL test settings ............................................................................ 98
Table 4.5 Selected washers for each combustion system based on the protrusion results . 103
Table 5.1 KP3 test settings ..................................................................................................... 109
Table 5.2 KP2 test settings used in the characterisation ....................................................... 115
Table 5.3 KP1 test settings used in the characterisation ....................................................... 121
Table 5.4 4000FL test settings used in the characterisation ................................................. 127
Table 5.5 2000FL test settings used in the characterisation ................................................. 130
Table 5.6 Selection matrix for the best performing bowl across all conditions tested in the
characterisation. .................................................................................................................... 134
Table 6.1 Test settings for the comparison of injector type at KP3 ...................................... 140
Table 6.2 KP2 settings for the comparison of injector type at KP2 ....................................... 145
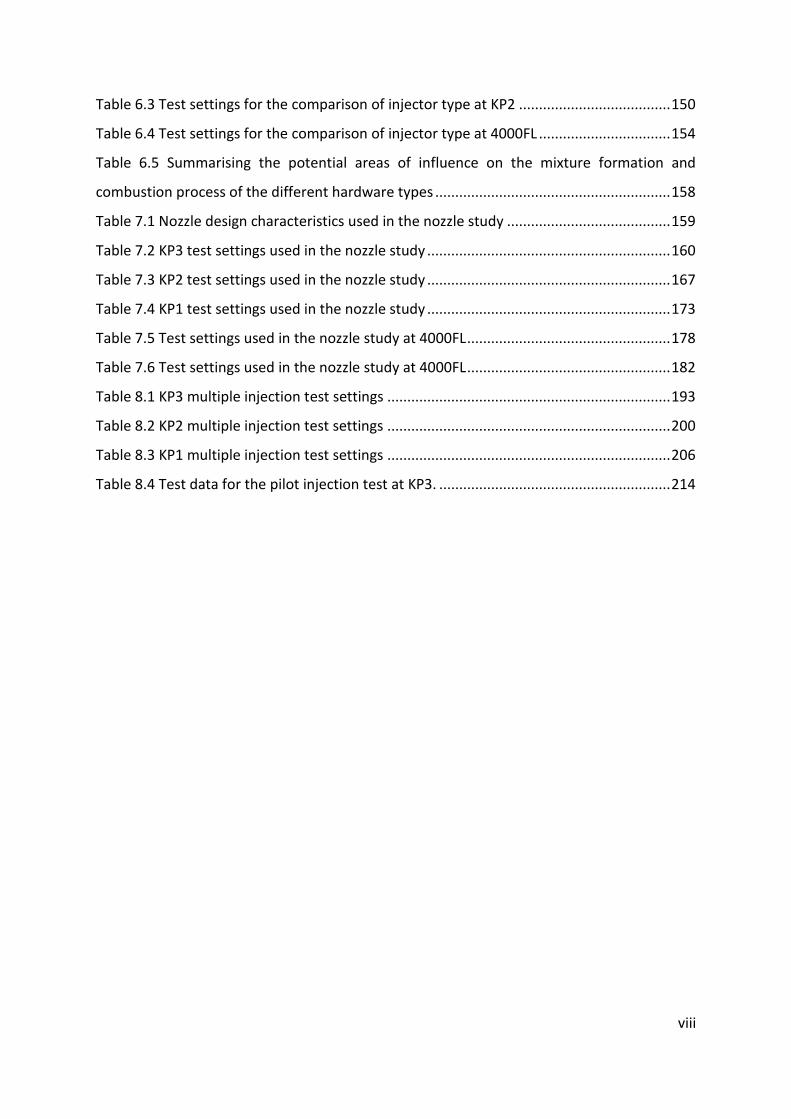
viii
Table 6.3 Test settings for the comparison of injector type at KP2 ...................................... 150
Table 6.4 Test settings for the comparison of injector type at 4000FL ................................. 154
Table 6.5 Summarising the potential areas of influence on the mixture formation and
combustion process of the different hardware types ........................................................... 158
Table 7.1 Nozzle design characteristics used in the nozzle study ......................................... 159
Table 7.2 KP3 test settings used in the nozzle study ............................................................. 160
Table 7.3 KP2 test settings used in the nozzle study ............................................................. 167
Table 7.4 KP1 test settings used in the nozzle study ............................................................. 173
Table 7.5 Test settings used in the nozzle study at 4000FL ................................................... 178
Table 7.6 Test settings used in the nozzle study at 4000FL ................................................... 182
Table 8.1 KP3 multiple injection test settings ....................................................................... 193
Table 8.2 KP2 multiple injection test settings ....................................................................... 200
Table 8.3 KP1 multiple injection test settings ....................................................................... 206
Table 8.4 Test data for the pilot injection test at KP3. .......................................................... 214

ix
List of Figures
Figure 2.1 Ricardo Comet IDI Diesel engine (Carr, 2014) .......................................................... 6
Figure 2.2 Mercedes IDI Diesel engine cross section (Davis, 2011) .......................................... 7
Figure 2.3 DI Diesel engine with a centrally mounted fuel injector (Cleynen, 2011) ................ 9
Figure 2.4 Engine cross section detailing piston design (Doug, 2009) .................................... 11
Figure 2.5 Schematic of the MAN spherical combustion system design concept ................... 12
Figure 2.6 Schematic layout of a DI piston bowl showing some of the parameters used in
(Middlemiss, 1978) study ......................................................................................................... 14
Figure 2.7 Solenoid valve injector design (adapted from (Mollenhauer.K and Tschoeke.H,
2010)) ....................................................................................................................................... 19
Figure 2.8 Bosch piezo inline injector design (adapted from (Mollenhauer.K and Tschoeke.H,
2010)) ....................................................................................................................................... 20
Figure 2.9 Delphi DFI3 direct acting fuel injector (adapted from (Schöppe and Zülch, 2009))
.................................................................................................................................................. 21
Figure 2.10 Multi-hole nozzle types; left sac, right VCO (Martynov, 2005) ............................ 23
Figure 2.11 Traditional diesel combustion schematic ............................................................. 27
Figure 2.12 Equivalence ratio (φ) versus temperature (T) map (Dec, 2009) ........................... 35
Figure 3.1 Port deactivation strategy for enhancing in-cylinder air motion ........................... 41
Figure 3.2 Overlay of piston bowl design ................................................................................ 43
Figure 3.3 Piston bowl major dimensions schematic .............................................................. 44
Figure 3.4 Air system schematic .............................................................................................. 50
Figure 3.5 Low pressure fuel system schematic ...................................................................... 53
Figure 3.6 High pressure fuel system schematic ..................................................................... 54
Figure 3.7 Exhaust system schematic ..................................................................................... 55
Figure 3.8 EGR circuit schematic .............................................................................................. 58
Figure 3.9 Test bed schematic ................................................................................................. 62
Figure 3.10 Motored check point test plots ............................................................................ 73
Figure 4.1 Schematic representation of the displacement of the injector with the change in
protrusion. Arrows represent the positive displacement of the spray centre (b) and the
nozzle tip (c). ............................................................................................................................ 77

x
Figure 4.2 Schematic for heat release from fuel and subsequent identification of losses
based on Heywood .................................................................................................................. 79
Figure 4.3 Effect of protrusion for all bowls at protrusion – KP3. Plots show spray centre
below gas face for the selected SOIm of -9 °ATDC. ................................................................. 83
Figure 4.4 Fuel energy distribution for all bowls. Protrusion – KP3 with SOIm set at -9 °ATDC.
From top left B2, top right B3 bottom left B4, Bottom right B5 .............................................. 84
Figure 4.5 Fuel spray piston bowl relationships for conventional (top) and unconventional
(bottom) piston bowls. SOIm was -9°ATDC, injection duration 0.7 ms. Arrows representing
potential spray distribution as influenced by the piston shape looking at a section of the
engine from the front. Cone angles are based on liquid fuel (Karimi, 2007). ......................... 87
Figure 4.6 The effect of protrusion on isFC at Protrusion – 4000FL. Plots showing the SOIm
swing at a fixed load. ............................................................................................................... 91
Figure 4.7 The effect of protrusion on smoke number at Protrusion – 4000FL. Plots showing
the SOIm swing at a fixed load. ............................................................................................... 93
Figure 4.8 Fuel spray piston bowl relationships for conventional (top) and unconventional
(bottom) piston bowls. SOIm was -19 °ATDC, injection duration 1.4 ms. Arrows representing
potential squish flow velocity differences between each bowl. ............................................. 95
Figure 4.9 Energy balance top left to bottom right B2 to B5 .................................................. 97
Figure 4.10 The effect of protrusion on fuel consumption at 2000FL. Top left bowl B2, top
right B3, bottom left B4 and bottom right B5 ....................................................................... 100
Figure 4.11 The effect of protrusion on smoke number at 2000FL. Top left bowl B2, top right
B3, bottom left B4 and bottom right B5 ................................................................................ 101
Figure 4.12 Energy balance protrusion 2000FL ..................................................................... 102
Figure 5.1 Illustration of the EGR and timing swings carried out at the part load keypoints.
Illustration shows the first and second EGR conditions out of the four tested for illustration
purposes ................................................................................................................................. 107
Figure 5.2 KP3 test EGR swing showing all 4 EGR conditions tested ..................................... 109
Figure 5.3 KP3 test data at 30 % EGR ..................................................................................... 111
Figure 5.4 Fuel energy distribution identifying the areas affected by a change in bowl design.
All bowls optimised washer, SOIm -9 °ATDC ......................................................................... 112
xi
Figure 5.5 Apparent net heat release rate profiles for all of the bowls tested. KP3, 30 % EGR
SOIm -9°ATDC ........................................................................................................................ 113
Figure 5.6 KP2 test EGR swing ............................................................................................... 115
Figure 5.7 KP2 test 33 % EGR ................................................................................................. 116
Figure 5.8 SOIm -10°ATDC, EGR 33 % .................................................................................... 118
Figure 5.9 Apparent net heat release rate at KP2 30 % EGR, SOIm -10°ATDC. ..................... 119
Figure 5.10 KP1 EGR swing..................................................................................................... 121
Figure 5.11 KP1 test results at 40 % EGR ............................................................................... 122
Figure 5.12 Fuel energy distribution identifying the areas affected by a change in bowl
design. All bowls optimised washer, SOIm -10°ATDC ............................................................ 124
Figure 5.13 Apparent net heat release rate for all bowls at KP1. SOIm -10°ATDC ............... 125
Figure 5.14 Full load test results at 4000FL ........................................................................... 128
Figure 5.15 Full load test results at 2000FL ........................................................................... 131
Figure 5.16 Schematics representing the variation in response of two different bowls. (a) is
on the left, (b) is on the right. ................................................................................................ 133
Figure 6.1 Current and voltage trace for the prototype fuel injection system. .................... 137
Figure 6.2 Cylinder (PCYL1) and fuel rail (PLIN1) pressure for the conventional (N1) and
prototype (N0) injection equipment on the conventional bowl B2 at KP3 with 30 % EGR .. 138
Figure 6.3 Illustration of the EGR and SOIm swing used in the comparison of the injector
types ....................................................................................................................................... 139
Figure 6.4 Results of testing of conventional and prototype injection systems at KP3 with
bowl B2 .................................................................................................................................. 141
Figure 6.5 Energy balance at KP3 for the test of the effect of injector design with bowl B2142
Figure 6.6 Apparent net heat release rate for bowl B2 with conventional(N0) and
unconventional (N1) injection systems. The number following the injector type is the SOIm
................................................................................................................................................ 143
Figure 6.7 Test data for the comparison of injector type at KP2........................................... 146
Figure 6.8 Combustion behaviour of each injector type at KP2 ............................................ 147
Figure 6.9 Apparent net heat release rate for comparison of injector types at KP2 ............ 148
Figure 6.10 Apparent net heat release rate for the comparison of injector types at KP2 .... 148
Figure 6.11 Test data for the comparison of injector type at KP1 ........................................ 151

xii
Figure 6.12 Plot of the energy balance for the conventional (N0) and prototype (N1)
injection system at KP1 .......................................................................................................... 153
Figure 6.13 Apparent net heat release rate for the conventional (N0) and prototype (N1)
injection system at KP1 .......................................................................................................... 153
Figure 6.14 Test data for the comparison of injector type at 4000FL numbers indicate SOIm
for both systems .................................................................................................................... 155
Figure 6.15 Energy balance for the conventional (N0) and prototype (N1) injection system at
4000FL .................................................................................................................................... 156
Figure 7.1 Example cylinder pressure data showing the single injection needle lift scheme
................................................................................................................................................ 160
Figure 7.2 Test data for the comparison of nozzle design at KP3 ......................................... 162
Figure 7.3 Cylinder pressure data for the nozzle study at KP3 with 30 % EGR. From top to
bottom, SOIm-7 °ATDC and SOIm -3°ATDC ........................................................................... 164
Figure 7.4 Apparent net heat release rate data for the nozzle study at KP3 with 30 % EGR.
From top to bottom, SOIm -9°ATDC and SOIm -3°ATDC ....................................................... 166
Figure 7.5 Test data for the comparison of nozzle design at KP2 ......................................... 168
Figure 7.6 Cylinder pressure data for the nozzle study at KP2 with 33 % EGR. From top to
bottom, SOIm-6 °ATDC and SOIm -5°ATDC ........................................................................... 170
Figure 7.7 aparent net heat release data for the nozzle study at KP2 with 33 % EGR. From
top to bottomSOIm-6 °ATDC and SOIm -5°ATDC .................................................................. 172
Figure 7.8 Test data for the comparison of nozzle design at KP1 ......................................... 174
Figure 7.9 Cylinder pressure data for the nozzle study at KP1 with 38 % EGR. From top to
bottom, SOIm -10 °ATDC and SOIm -7°ATDC ........................................................................ 176
Figure 7.10 Apparent net heat release rate data for the nozzle study at KP1 with 38 % EGR.
From top to bottom, SOIm SOIm-10 °ATDC and SOIm -7°ATDC ........................................... 177
Figure 7.11 Test data for the comparison of nozzle design at 4000FL .................................. 179
Figure 7.12 Cylinder pressure data for the nozzle study at 4000FL. From top to bottom,
SOIm -19 °ATDC and SOIm -13°ATDC..................................................................................... 181
Figure 7.13 Test data for the comparison of nozzle design at 2000FL .................................. 183
Figure 7.14 Cylinder pressure data for the nozzle study at 2000FL. From top to bottom,
SOIm -8 °ATDC and SOIm -2°ATDC ......................................................................................... 185

xiii
Figure 8.1 Definition of separations that were used in the study. The electrical demand for;
the pilot injection is on the left, the main in the middle and the post on the right. ............ 190
Figure 8.2 Schematic showing the process of retarding the injection event, The blue trace
shows the initial set up and the dotted trace shows the set up as the timing is retarded. .. 191
Figure 8.3 Example cylinder pressure data with pilot injection needle schematic ............... 192
Figure 8.4 Cylinder pressure traces and injection schematics for the single (top) and pilot
(bottom) cases ....................................................................................................................... 194
Figure 8.5 Apparent net heat release rate traces and injection schematics for the single
(blue) and pilot (red) injection cases. Plots show approximately the same phasing (top) and
the same SOIm (bottom) ....................................................................................................... 196
Figure 8.6 Performance and emmissions data for the single and pilot injection case at KP3
................................................................................................................................................ 197
Figure 8.7 Cylinder pressure traces and injection schematics for the single (top) and pilot
(bottom) injection cases ........................................................................................................ 201
Figure 8.8 Apparent net heat release rate traces and injection schematics for the single
(blue) and pilot (red) injection cases. Plots show approximately the same phasing (top) and
the same SOIm (bottom) ....................................................................................................... 203
Figure 8.9 Performance and emmissions data for the single and pilot injection case at KP2
................................................................................................................................................ 204
Figure 8.10 Cylinder pressure traces and injection schematics for the single (top) and pilot
(bottom) injection cases ........................................................................................................ 207
Figure 8.11 Apparent net heat release rate traces and injection schematics for the single
(blue) and pilot (red) injection cases. Plots show approximately the same phasing (top) and
the same SOIm (bottom) ....................................................................................................... 209
Figure 8.12 Energy diagram for the comparison of the effect of pilot injection on combustion
................................................................................................................................................ 210
Figure 8.13 Performance and emmissions data for the single and pilot injection case at KP1
................................................................................................................................................ 212
Figure 8.14 Performance and emissions data for the LTC with retarded injection timings .. 215
Figure 8.15 Apparent net heat release rate traces and injection schematics for the low
temperature combustion case ............................................................................................... 217

xiv
Figure 8.16 Smoke versus pilot injection separation at each SOIm tested ........................... 218
Figure 8.17 Apparent net heat release rate traces and injection schematics for the pilot
injection separation test ........................................................................................................ 219

xv
Nomenclature
Acronyms
AFR Air-to-Fuel Ratio AFRs Stoichiometric Air-to-Fuel Ratio aHRR Apparent Net Heat Release Rate ATDC After Top Dead Centre B1 Baseline Bowl B2 Narrow Bowl B3 Shallow Bowl B4 Ramped Bowl B5 Stepped Bowl CAD Computer Aided Design
CARB California Air Resources Board CFD Computational Fluid Dynamics CO Carbon Monoxide
CO2 Carbon Dioxide CoV Coefficient Of Variance DI Direct Injection DPF Diesel Particulate Filter ECU Engine Control Unit EGR Exhaust Gas Recirculation FIE Fuel Injection Equipment FL Full Load HC Hydrocarbon HCCI Homogenous Charge Compression Ignition
HPV High Pressure Valve HTHR High Temperature Heat Release ICE Internal Combustion Engine IDI Indirect Injection IFP Institut Français du Pétrole IMV Inlet Metering Valve KP Key Point LNT Lean Nox Trap LTC Low Temperature Combustion LTHR Low Temperature Heat Release MK Modulated Kinetics N2 Nitrogen NADI Narrow Angle Direct Injection
NEDC New European Drive Cycle NOx Oxides of Nitrogen O2 Oxygen PCCI Premixed Charge Compression Ignition PCI Premixed Lean Combustion PM Particulate Matter PPCI Partially Premixed Compression Ignition

xvi
PREDIC Premixed Lean Diesel Combustion
PRF Primary Reference Fuel SCR Selective Catalyst Reduction SI Spark Ignition SOIm Start of Main Injection Timing TDC Top Dead Centre UNIBUS Uniform Bulky Combustion VCO Valve Covered Orifice
Greek Symbols
ηfc Fuel Conversion Efficiency [%] φb Piston Bowl Diameter [mm] φ Equivalence Ratio [-] γ Ratio of specific heats
Roman Symbols
BMEP Brake Mean Effective Pressure [bar] BSFC Brake Specific Fuel Consumption [g/kWh] Di Internal Nozzle Hole Diamter [mm] Do External Nozzle Hole Diameter [mm] GIMEP Gross Indicated Mean Effective Pressure [bar] HL,exh Heat Loss to Exhaust [kW] HL,ht,c Heat Loss to Heat Transfer and Crevice [kW] IMEP Indicated Mean Effective Pressure [bar] isCO Gross Indicated Specific Carbon Monoxide [g/kWh] isFC Gross Indicated Specific Fuel Consumption [g/kWh] isHC Gross Indicated Specific Hydrocarbons [g/kWh] isNOx Gross Indicated Specific Oxides Of Nitrogen [g/kWh] K Nozzle Hole K-Factor [-] Ki Critical Flow Nozzle Calibration Coefficient [-] L Nozzle Hole Length [mm] Oi Critical Flow Nozzle Activation Coefficient [-] Pin Critical Flow Nozzle Inlet Pressure [mbar] Tin Critical Flow Nozzle Inlet Temperature [K] W,I,g Gross Indicated work [kW]

xvii
Acknowledgements
From the University of Brighton I would like to thank my supervisors Dr David Mason and Dr
Guillaume De Sercey, Professor Morgan Heikal, the technical staff Brain Maggs, Peter
Rayner and Ken Marris and all of the other staff members that helped me on my way, too
numerous to mention. I would also like to thank Delphi Diesel systems Ricardo consulting
engineers and the EPSRC for their input into this project.
I would like to thank all of my fellow research students; Lars, Lyndon, Benoit, Angad and
Thiago, who suffered and succeeded with me in equal measure.
I would also like to thank my family and friends for supporting me over the last five years. I
must make a special mention of my parents; Sue and Jim. The belief they have in me is
astounding and I am grateful for it.
Katrin Oberin.

1
1 Introduction
1.1 Project Context
The work in this thesis is focused on an experimental study into the influence of piston bowl
geometry and fuel injector type on optimal fuel injection strategies for clean high efficiency
operation. Clean, efficient operation is necessary for the Diesel internal combustion engine
(ICE) to meet future European emission regulations. The work in this thesis is relevant to
Diesel engines used in passenger car applications, referred to as category M1, which is
defined in the European directive (2001/116/EC).
Emission regulations were first applied to new passenger cars in the 1970’s in America by
the California Air Resources Board (CARB) (70/220/EEC) and since then the regulations have
gone through a series of amendments and updates. The driver for the updates and
amendments has come from two distinct external pressures; the availability of the
non-renewable fuel source and the effect of pollutant emissions on the environment. At the
beginning of this research project the European emission standard in force was Euro IV.
Euro V was then introduced, which enforces a limit of 0.180 g/km of Oxides of Nitrogen
(NOx) and 0.005 g/km of Particulate Matter (PM). The legislation proposed for 2014, is Euro
VI which mandates a reduction of NOx by 56 %, whilst maintaining the PM level. These
regulations apply to all new production vehicles. The following Table 1.1 details the
regulated levels.
Tier
Date Tail pipe emission
yyyy-mm CO HC NOx HC+NOx PM
g/km g/km g/km g/km g/km
Euro I 1992-07 2.72 - - 0.97 0.140
Euro II 1996-01 1.00 - - 0.70 0.080
Euro III 2000-01 0.64 - 0.50 0.56 0.050
Euro IV 2005-01 0.50 - 0.25 0.30 0.025
Euro V (current) 2009-09 0.50 - 0.18 0.23 0.005
Euro VI (future) 2014-09 0.50 - 0.08 0.17 0.005
Table 1.1 European emission regulations for Diesel powered passenger car vehicles
≤ 3,500kg

2
The European commission has also proposed a fleet averaged limit on carbon dioxide (CO2)
emissions. The target proposed in 2007 is to meet 120g/km of CO2 by 2012 (2007/0297
(COD)). Emissions of CO2 are intrinsically linked to the fuel consumption of an engine
because the ideal process for oxidising a hydrocarbon leads to the production of CO2, water
vapour (H2O) and nitrogen (N2). Reducing fuel consumption, therefore, reduces the CO2
emission. To this date the CO2 target is not a legal requirement of a vehicle manufacturer,
however if this becomes a law, then this represents an additional challenge to overcome.
Experts within the automotive industry and engine research groups state it will be difficult
to achieve the NOx limits for Euro VI without aftertreatment. Installing NOx aftertreatment
systems such as selective catalyst reduction (SCR) or a lean NOx trap (LNT) represents the
least risk in getting a vehicle into production (Bickerstaffe, 2009). Aftertreatment systems,
whilst effective in removing unwanted emissions from the exhaust gas, typically have added
cost, complexity and fuel consumption penalties, which are unattractive for vehicle
manufactures thus providing a driver for research into the reduction of engine out pollutant
emissions. Engine out pollutant emissions are measured directly as they exit the combustion
chamber, prior to any chemical and thermal influence in the exhaust system. The
production of engine out emissions is influenced by the in-cylinder mixture formation
processes. The mixture formation process is controlled by the rate of fuel addition and
energy in the in-cylinder air motion. The fuel addition is governed by fuel pressure, injector
type and nozzle design and the energy in the airflow is governed by the engine inlet air
pressure, inlet port shape and activation, as well as the piston bowl shape.
For this reason the present study takes two steps with engine hardware to reduce engine
out emission; firstly 4 different piston bowls were designed, two conventional and two
unconventional in shape and secondly a prototype fuel injection system was developed,
with direct needle actuation. The piston bowls were designed and evaluated by Ricardo
Consulting Engineers using Computational Fluid Dynamic (CFD) technology to assess the
in-cylinder flow regimes and fuel spray targeting. The conventional type refers to typical, re-
entrant, toroidal piston bowls, which have become an industry standard. The first
unconventional design was adopted from a heavy duty applications and the second was an
evolution of this design based on CFD evaluation and analysis of the potential fuel spray

3
pattern. The prototype fuel system was developed by Delphi Diesel Systems (DDS) based on
the development of new piezo technologies. The design employs a piezo actuator to move
the needle directly which shows an improvement in Diesel fuel spray formation. The fuels
spray pattern with various nozzles has been studied but the effect on combustion is not fully
understood.
Both elements of the hardware have new concepts for the Diesel combustion system.
Although there has been substantial research into Diesel combustion system configurations,
there is still scope for developing the understanding of the effect of conventional and
unconventional hardware on the combustion process. This thesis shows the results of the
experiments that were carried out with the new hardware, with recommendations for the
use of the hardware designed in this study.
1.2 Thesis Structure
The next chapter, chapter 2, has the literature review of the fundamentals of the
combustion process and emissions formation, of the design of engine hardware and of the
existing knowledge of the effect of this hardware on the combustion process.
Understanding the fundamentals of the combustion process and emission formation is
important because it helps to identify the reasons why one piston bowl behaves differently
to another. Understanding the effects of the design of the hardware also assists in the
understanding of the in-cylinder processes that are occurring. Chapter 3 shows the
experimental equipment used in this study including the hardware and the instrumentation.
Within the chapter there is an assessment of the suitability and limitations of the
experimental facility, hardware and instrumentation. Chapter 4 shows the experimental
process used to optimise the spray targeting and to characterise the piston bowls and fuel
injectors. The experimental procedure ensured experiments were repeatable and that the
comparisons between each piston bowl were made on the same basis. Chapters 5 to 7
present the results and the discussion of the characterisation of the piston bowls. This
chapter includes the results of the spray targeting and the results of the characterisation
process. This chapter is important in identifying why the bowls perform differently and
identifies the characteristic differences between the conventional and unconventional bowl
designs. In this chapter the best performing bowl is selected with justification given for the

4
selection. Chapter 8 shows the results of further testing. This further testing examines the
effect of multiple injection strategies and attempts to further reduce the engine emissions
output based on the knowledge gained from the characterisation process and the
understanding of the mixture formation requirements. The final chapter comprises the
conclusions and recommendations for further work.

5
2 Diesel Combustion System Development Literature Survey
In this chapter the literature related to modern Diesel engine combustion systems is
reviewed. Combustion system design was examined to identify the different design
concepts that have been developed and classify their key features and relevance to future
combustion systems. The evaluation is focused on developments in combustion chamber
design and fuel injection systems. Following this, experimental and computational
investigations into Diesel combustion and emissions are reviewed.
2.1 Diesel Combustion Systems
In this study the combustion chamber geometry and fuel injection equipment and their
configuration are referred to as the combustion system. These two hardware elements
create and support the combustion process. Diesel engines have developed two distinct
types of combustion system, the indirect injection (IDI) and the direct injection (DI)
combustion system.
2.1.1 Indirect Injection
The indirect injection Diesel engine is characterised by the existence of a separate chamber
linked to the main chamber by a gas flow passage. Within this separate chamber, the air and
fuel mix before the combustion process. This causes an increase in local pressure, forcing
the combustion products and un-burnt fuel back into the main combustion chamber.
Various configurations of the IDI Diesel engine have been developed. An early example,
called the Comet, was developed by Ricardo in the 1930’s. The Comet used an almost
spherical combustion chamber integrated into the cylinder head with a pathway running
between it and the main combustion chamber (Heisler, 2002, Bosch, 2000). This chamber is
known as the pre chamber. It generates rotational air motion induced by the tangential
arrangement of the flow path and the injector.

6
Figure 2.1 Ricardo Comet IDI Diesel engine (Carr, 2014)
Figure 2.1 shows the pre chamber (2) contains a pintle type fuel injector (1) and glow plug
(3). The piston (6) in the main chamber is flat, with two small recesses (5). The fuel injector
is a single hole, conical pintle injector, with a tangential orientation. The injector location
and the shape of the pre chamber both encourage air and fuel mixing before the start of the
combustion event. A low pressure injection system of 100 bar was used because the
turbulence of the air is sufficient to assist mixture formation. The fuel spray was targeted at
the hot walls of the pre chamber to enhance vaporisation and entrain the mixture (Heisler,
2002). The glow plug is located to aid heating of the pre chamber under cold start
conditions, so that the air would reach the auto ignition temperature whilst the engine is in
the early stages of warming up (Bosch, 2000).
During the first stage of the combustion process, rich combustion products such as carbon
monoxide (CO) and particulates form due to the poorly atomised fuel spray. As heat is
released the temperature and pressure increases inside the pre chamber and a flow reversal
occurs forcing the gas into the main combustion chamber. At this point the combustion
products and any un-burnt fuel mix with the remaining oxygen due to additional turbulence
caused by the piston recess in the main combustion chamber. The piston recess forces the
gas into a rotary motion with the air leading to further oxidation. The remaining combustion
gases mix and oxidises as the piston expansion process begins.
The oxidation of the combustion gases that occur in the pre chamber can be assisted by
distributing the combustion gases amongst the fresh air within the cylinder. The Mercedes
1. Pintle fuel injector
3. Glow plug
5. Piston recess
2. Pre chamber
4. Transfer passage
6. Piston

7
variant in Figure 2.2 used a different concept for the indirect injection combustion system
(Bosch, 2000, Heisler, 2002).
Figure 2.2 Mercedes IDI Diesel engine cross section (Davis, 2011)
The pathway that links the pre chamber (5) to the main chamber with the piston recess (4)
had distributed nozzle holes (3) at the inlet and exit. This allowed the combustion to be
distributed through the main chamber with a greater probability of locating oxygen in the
fresh charge. This design can be compared to a direct injection configuration with a
multi-hole nozzle injection system. In this case, the pre chamber acts as the combustion
medium regulator, analogous to the fuel pressurising system and the nozzle holes in the
pathway are analogous to a fuel injector with multiple nozzle holes.
The motion of the air induced into the combustion chamber can be controlled to assist the
combustion product and air mixing in addition to using the pre chamber to mix the fuel and
air. The intake arrangement of the Mercedes variant of the indirect injection system was
designed to encourage in-cylinder swirl motion (Heisler, 2002). Swirl is tangential air motion
induced by either incorporating a helical port, which encourages to gas to rotate around the
valve trumpet, or by deactivating a port (in an engine with more than one port) to bias the
airflow tangentially in the cylinder. Generating swirl by shaping the inlet ports has been
shown to have a negative effect on engine breathing and volumetric efficiency. Swirl ratio is
a dimensionless number proportional to engine speed. Deactivating one port on multiple
inlet valve engines reduces the flow area available and also reduces the volumetric
efficiency. Therefore a trade-off exists between a design which allows the fuel and air to mix
1. Nozzle Holder
2. Glow plug
4. Piston recess
5. Pre chamber
3. Nozzle holes

8
more efficiently, with swirl, and a design which negates poor mixing by increasing the
charge density by inducing more air into the cylinder.
The need for a pre chamber, a transfer path and increased combustion gas turbulence on
the indirect injection Diesel engine increases the heat transfer losses. For the same engine
displaced volume, the surface area is greater than direct injection variants. Heat transfer
losses are also exaggerated by the need to induce high turbulence in both the pre chamber
and the main combustion chamber. A special insert made of Nimonic, a material with low
thermal conductivity and a high temperature tolerance, is used as the pre chamber to
reduce these parasitic losses however the concept was fundamentally flawed and could not
achieve low specific fuel consumption.
Indirect injection systems allow the fuel to be injected from the beginning of the
compression stroke, allowing more time for the mixture formation process. The benefit of
this is that the maximum engine speed can increase, which enables the engine to be
operated with power densities suitable for automobiles. The weakness of the indirect
injection engine is poor fuel efficiency (Middlemiss, 1978, Heywood, 1988, Stone, 1999,
Bosch, 2000, Heisler, 2002), whilst the main benefit of this type of combustion system is the
reduction in the kinetic energy required in the fuel spray for good air-fuel mixing. As a result
the fuel injection system could be operated at low pressures thus simplifying the system and
reducing its cost and minimising parasitic losses.
With the Comet engine, turbulence is created within the combustion system, reducing the
dependency on port design to promote air motion. This benefited engine volumetric
efficiency. Finally the rate of oxidation of the combustion products in the main chamber
reduced the rate of pressure rise and the noise associated with Diesel knock is reduced
(Heywood, 1988, Stone, 1999). There are some aspects of the mixture preparation of the
indirect injection system that are similar to a port fuelled gasoline engine; the combustion
system design must ensure sufficient fuel vaporisation and droplet break up.
Both of these IDI combustion systems have high turbulence and a high surface area to
volume ratio, which increase the convective heat transfer losses. The additional surface area
comes from the pre chamber and transfer passages. With the development of electronically

9
controlled common rail fuel systems and improved turbo charging technology, the direct
injection engine has becomes a viable alternative.
2.1.2 Direct Injection
The direct injection (DI) combustion system, shown in Figure 2.3, is made up of a single
combustion volume enclosed within the cylinder head and piston. The fuel injection system
is located to deliver the fuel directly into the enclosed volume. With a modern cylinder head
layout containing four valves per cylinder the injector is generally mounted vertically in the
centre of the combustion chamber. For two valves per cylinder arrangements the injector is
usually mounted at an angle.
Figure 2.3 DI Diesel engine with a centrally mounted fuel injector (Cleynen, 2011)
The design requirements for the DI combustion system vary depending upon the size and
the speed of the engine. These systems are usually classified according to displaced volume
and relative operating speed of the engine (Stone, 1999).
10
Heavy duty Diesel engines have been used in both marine applications and power
generation. They employ both two-stroke and four stroke modes of operation, with speed
ranges from 100 – 1800 revolutions per minute (Heywood, 1988, Stone, 1999). The
application of low speed Diesel for power generation is sensible, as the larger the displaced
volume of the engine results in a significantly lower surface area to volume ratio. This is
hugely beneficial for reducing the thermal losses from the combustion system and
improving fuel efficiency. One of the largest Diesel engines used for container ship
propulsion is the Wartsila-Sulzer RTA96C. It has a displaced volume of 1820 litres per
cylinder and with multi-cylinder configurations producing 84 MW with a fuel efficiency of
171 g/kWhr (Doug). The maximum speed of the engine was determined by mean piston
speed. The RTA96C has a maximum piston speed of 8.5 m/s, which equates to a running
speed of 102 RPM and a stroke of 2.5 m (Doug).
The low engine speed of the RTA96C means that there is more time per cycle for the
mixture formation process to occur. The length of time available and the limited speed
range of the engine simplified the design of the combustion system. The fuel injection
equipment is optimised to provide maximum fuel spray pressure, without the need for
variation over a wide speed range. A mechanical unit injection is ideal for this combustion
system.
The design of the piston bowl shown in Figure 2.4 is kept as wide and shallow as possible to
accommodate the fuel spray formed using high injection pressures. Minimal air motion is
created both internally and externally (Bosch, 2000, Heywood, 1988). In heavy duty Diesel
engines it is more effective to optimise the inlet for maximum air consumption because
adequate time exists for the mixture formation process using the kinetic energy in the fuel
spray.

11
Figure 2.4 Engine cross section detailing piston design (Doug, 2009)
At the other end of the scale is the light duty Diesel engine. Light duty Diesel engines are
usually operated with high swirl rates to assist the mixture formation process. These engines
are required to work over a large speed range, with the maximum speed up to and over
4000 RPM (Stone, 1999, Bosch, 2000). In comparison to the heavy duty Diesel, the mixture
formation and combustion process in a light duty Diesel engine has less time to occur.
Comparing the maximum engine speeds of a light duty application to a heavy duty
application (4000 RPM compared with 100 RPM), the time for one engine cycle is 40 times
shorter. Mixture formation is assisted by using high injection pressures; however this
needed to be available over a wide range of engine speed and loads.
The move towards the use of light duty DI engines began because of the need for improved
fuel consumption versus the IDI variant. The compromise between the DI and IDI systems is

12
having a light weight, high speed system (IDI) and a system with minimal thermal losses and
greater refinement (DI). Smaller combustion systems have inherently high heat transfer
losses associated with the larger surface area to volume ratio. However the benefit of the
smaller system is that it can be easily packaged into a vehicle platform due to its size and
weight.
In comparison to the heavy duty Diesel engine, light duty Diesels utilise narrower and
deeper piston bowl shapes in order to promote more turbulent air motion. This is
demonstrated by the DI MAN combustion system shown in Figure 2.5. The MAN piston bowl
is deep and is combined with a pintle injector which directs the fuel flow on to the bowl wall
to enhance the mixture formation process (Stone, 1999).
Figure 2.5 Schematic of the MAN spherical combustion system design concept
The turbulence generated by a narrow piston bowl design is called squish. This is the flow of
gas forced into the piston bowl at top dead centre and is more pronounced in a narrow
piston design. Internally generated turbulence enhances the mixture formation process, but
leads to greater convective heat transfer losses (Stone, 1999). Internal turbulence creation
is necessary to help the combustion process where the engine operation has to occur over a
broad range of speed and load conditions.

13
Generating the energy for the mixture formation process becomes more challenging over a
wide range of speeds and load conditions. At low speeds there is less air swirl and fuel
pressure available (depending on the fuel system configuration). Swirl is often proportional
to the engine speed, as the engine rotational speed increases, so does the swirl rotational
speed. At low speed low load conditions with low thermal energy in-cylinder, there is a
reduction in the heat transfer temperature gradient and convective heat transfer losses are
reduced.
At low speed, high load, the mixture formation is limited by the lack of air motion. At
medium to high speed the swirl turbulence increases and the available pressure within the
fuel system is greater. Both of these enhance the mixture formation process. There is a limit
to the engine speed because the cycle time reaches a minimum for mixture formation and
combustion to occur. The time available to add the fuel to the combustion system and
control the burning process is too short. This results in the fuel injection event and the
combustion process extending into the expansion stroke therefore reducing the engine
efficiency at higher speeds.
The viability of the DI engine in a vehicle application has come through developments of the
engine sub systems. Improved cylinder head designs, allowing higher in-cylinder pressures,
turbo charging and improved fuel system design have made mixture formation possible
within the short times available. The benefit of reduced heat transfer losses mean that the
DI Diesel engine is a viable alternative to the IDI variant in order to meet fuel economy
targets.
However, further development of the DI Diesel combustion systems are required in order to
meet future, stringent emissions standards. The move towards advanced combustion
modes requires better understanding in terms of the way the mixture formation process
evolves. This includes understanding the best way to accommodate and mix the fuel spray
within the piston bowl design.
2.1.3 Diesel Piston Bowl Design
Piston bowl design has been the subject of several research projects both experimental and
computational, for over forty years (Middlemiss, 1978). The research projects have focused

14
on the shape of the cross section of the piston bowl and the effect of changing the
dimensions of the major features on the combustion process. The effects on the combustion
process are interlinked by the way in which the major features interact with the fuels spray;
through in-cylinder air motion development and by surface interactions with the fuel spray.
The DI Diesel piston bowl has a complex cross section design developed to enhance
impingement the mixture formation process. Research carried out in the past has developed
the design of the piston bowl into a toroidal, re-entrant design that uses squish flow and
swirl flow to enhance the mixture formation. Typically the piston is a flat surface parallel
with the cylinder head fire deck and the bowl is machined out of the piston blank. A
schematic is shown in Figure 2.6
Figure 2.6 Schematic layout of a DI piston bowl showing some of the parameters used in
(Middlemiss, 1978) study
A study conducted by (Middlemiss, 1978) experimentally demonstrated that the re-entrant
combustion chamber with a central pip could sustain rapid combustion at more retarded
combustion timings than open bowls meaning that NOx could be reduced, without a large
penalty on fuel consumption. Improvements in specific fuel consumption of around 11 %
were achieved at equivalent NO outputs with a marginal reduction in smoke number at the
A. Flank angle
B . Throat diameter
D. Lip
C. Bore diameter
E. Pip
15
most retarded injection timing. The role of the pip is to occupy the space where the
velocities are lower and to increase the velocity at the periphery of the chamber to enhance
fuel and air mixing. This central pip encourages more turbulence than an open bowl design.
A design guide for piston bowls was developed by (Middlemiss, 1978). The emissions
outputs and fuel measurements were used to understand the effect of the bowl design on
the combustion process. Although in-cylinder information was available this study
demonstrated that it was possible to draw considered conclusions from careful analysis of
the emissions behaviour without necessity for pressure measurement.
Some of the parameters investigated by Middlemiss are shown in Figure 2.6. Throat
diameter (B) should be around a third of the piston bore (C) for the ideal operation. Larger
re-entrant bowls begin to behave like open chambers and smaller throat diameters suffer
from high NOx levels and poor fuel consumption due to convective heat transfer losses.
Varying the compression ratio affects ignition delay and the NOx and smoke emissions
trade-off. At a high compression ratio a retarded timing has low NOx and high smoke.
Specific fuel consumption was lowest at 17:1 and Middlemiss recommended using the
highest value that could be achieved within the smoke limit. Finally the lip shape (D) and
flank angle (A) were less distinct; sharp lips with a flank angle of 70° resulted in low smoke
without a NOx penalty, but in general in order to reduce smoke, impingement with the lips
and the bowl was to be avoided. Flank angles in the order of 30-50° were recommended,
large flank angles approximated the open chamber behaviour
(Saito et al., 1986) tested a re-entrant chamber and found that, as Middlemiss
recommended, a re-entrant bowl with a throat that was roughly a third of the bore
diameter performed the best compared to the conventional open chambers of the time.
Computational analysis showed that there were high temperature regions found on the lip
section which were identified as helping to reduce the ignition delay. Spray targeting was
such that this high temperature region was used to control the combustion behaviour of the
engine.
The high wall temperatures and high squish velocities allows combustion timing to be
retarded without sacrificing fuel consumption and smoke emissions. Indeed at one test

16
point, the re-entrant bowl has shown an improvement in Brake Specific Fuel Consumption
(BSFC) of 4 % whilst simultaneously reducing NOx and smoke by 10 % and 39 % respectively.
Compared to the deep open bow used, the re-entrant bowl was 6 % better in fuel
consumption and 60 % better in smoke number with only a 14 % penalty on the NOx
emission. The squish flow which assisted the combustion was calculated to be 50 % higher
than the deep open chamber that was tested, which although increased the NOx emission,
meant that the fuel consumption and smoke number were both improved.
(Ikegami et al., 1990) indicated through in-cylinder studies that the role of the lip in the
re-entrant chamber was to suppress the flow of bowl based combustion products and
un-burnt fuel into the squish regions. Back flow that occurred during the combustion event
forced the combustion products and un-burnt fuel into a region that was low in
temperature and turbulence. This led to high specific fuel consumption and smoke number,
although in general NOx is lower. Comparing the deep bowl of the time with the re-entrant
bowl, even though the re-entrant bowl was 14 % worse on NOx, it was 7 % better on BSFC,
60 % better on particulates and 75 % better on smoke number. Combustion with the deep
bowl was more varied across the range of injection timings tested, whereas the re-entrant
bowl could tolerate being retarded with little change in fuel consumption and emissions.
(Kidoguchi et al., 1999) studied the effects of the re-entrant design with experimental
engine testing on an engine instrumented with an endoscope and CFD calculations to
further understand the in-cylinder processes. As with previous work the comparison was
made against a standard open bowl and a selection of re-entrant designs with parametric
variation of features such as compression ratio and throat diameter. The results of this work
indicated that although the NOx levels converged on the same values for all bowls as the
injection timing was retarded, the re-entrant bowls were better in terms of specific fuel
consumption and particulate emissions. A two stage combustion process was identified
where a short ignition delay and diffusive combustion was retained in the piston bowl whilst
being supported by highly turbulent squish and swirl flows. This hypothesis was supported
by endoscopic measurements, which identified yellow emitted light indicative of soot
luminosity within the piston bowl region. The intensity was observed sooner and within the
region of the piston bowl, during the early phase of combustion.
17
Having attempted to understand the effect of combustion chamber geometry on engine
performance, research attention also focussed on the fundamental behaviour in-cylinder.
(Montajir et al., 2000) used an adapted engine with a square combustion chamber that
allowed undistorted photographs to be taken of the fuel spray spreading over the surface of
the combustion chamber. A fuel spray path length and an equivalent fuel spray diameter
were calculated based upon the area that the fuel spray had spread over the bowl wall. The
characteristics were used to demonstrate the effect of lip radius, spray targeting, bowl
diameter and toroidal radius. The study showed that a round lip reduces the energy lost due
to the impact of the fuel spray with the bowl wall leads to a greater spread of fuel spray and
fuel volume at the bottom of the bowl after impingement. The targeting and bowl diameter
has to be such that the fuel distribution is balanced between flow into the squish regions
and flow concentrated at the bottom of the bowl. A radius corner in the bottom of the bowl
helps with fuel distribution; however the authors demonstrated that a radius that was too
large leads to a long spray path length. Overall, the interaction of the fuel spray and the
piston bowl presents a trade-off in the process of mixture formation.
The Narrow angle direct injection NADI piston bowl concept can be seen in the study by
Institut Français du Pétrole (IFP) (Walter and Gatellier, 2002) The piston bowl is narrow and
deep and coupled with a narrow spray angle fuel injector. This allows the fuel to be injected
very early in the cycle to allow time for premixing to occur before the onset of combustion.
This mixture formation strategy with this bowl and injector combination is unusual and is a
move away from the previous studies. It relies less on the turbulence generated in-cylinder
for the mixture formation process by allowing more time for premixing the fuel and air.
With such an unusual arrangement the authors make a comparison of the NADI combustion
system with the baseline engine at full load because the unusual combustion system could
have compromised the engine performance at full load.
The majority of bowl studies have shown that a circular, re-entrant bowl type with a toroidal
piston bowl works the best for stable, retarded combustion, that result in low NOx and
smoke without a large penalty on fuel consumption. The toroidal re-entrant designs are
considered to be of a conventional type of design that has been accepted as an industry
standard for many years. The NADI concept (Walter and Gatellier, 2002), which uses

18
advanced combustion modes, challenges the way that the mixture formation process can be
changed for clean and efficient combustion. The application of advanced combustion modes
means that unconventional piston bowl design may be required for future Diesel engines.

19
2.2 Diesel Fuel Injector Design
Common rail fuel injection systems are designed to supply each injector with the same fuel
pressure over a range of engine conditions. The common rail serves as a high pressure fuel
reservoir replenished by a separate fuel pump operated by the engine crank shaft. This
allows the flexible operation of the injection system over a range of operating conditions
(Bosch, 2000, Mollenhauer.K and Tschoeke.H, 2010).
Typically, each injector within the common rail system is actuated electronically.
Electronically actuated fuel injection systems have revolutionised the Diesel engine design.
This is because the fuel injection event can be controlled without mechanical restrictions
related to engine speed as with a unit injector. There are two types of injector actuator
currently in use; solenoid actuator or piezo electric actuator. In current production vehicles
the actuator is used to control a valve in the body of the injector. This valve controls the
flow of fuel through the injector. Opening the flow valve causes a pressure difference across
the injector needle and forces the needle to lift.
Figure 2.7 Solenoid valve injector design (adapted from (Mollenhauer.K and Tschoeke.H,
2010))
1. Fuel return2. Solenoid coil3. Over lift springs4. Solenoid armatures5. Valve ball6. Valve control chamber7. Nozzle spring8. Nozzle needle pressure shoulder9. Chamber volume10. Spray hole11. Solenoid valve spring12. Outlet throttle13. High pressure port14. Inlet throttle15. Valve piston16. Nozzle needle
1. Fuel return (spill flow) 2. Solenoid coil 3. Over lift springs 4. Solenoid armatures 5. Valve ball 6. Valve control chamber 7. Nozzle spring 8. Nozzle needle pressure shoulder 9. Chamber volume 10. Spray hole 11. Solenoid valve spring 12. Outlet throttle 13. High pressure port 14. Inlet throttle 15. Valve piston 16. Nozzle needle

20
Figure 2.7 shows the solenoid variant of the Bosch system. The flow through the injector is
controlled by the movement of the valve ball, by the activation of the solenoid. This opens
the flow passage from the valve control chamber to the fuel return. The piezo injector seen
in Figure 2.8 uses a piezo electric actuator with an amplifier to operate the control valve.
Fuel still flows through the injector in order to lift the needle, however the system has a
faster response time, having a delay between electrical signal and hydraulic response of 150
microseconds (Mollenhauer.K and Tschoeke.H, 2010). These injectors can be integrated
easily into existing common rail systems.
The above two injection systems work well with a common rail fuel system as there was a
readily available supply of high pressure fuel which can be utilised to lift the needle and
control the injection event. Refining the flow through the injector can improve the injector
response time as seen with the piezo electric actuator and precise metering of the fuel can
be achieved.
Figure 2.8 Bosch piezo inline injector design (adapted from (Mollenhauer.K and Tschoeke.H,
2010))
The disadvantage of the injectors operating with a spill flow with the common rail system is
that the needle lift is indirect and is influenced by the response of the needle to the
1. Fuel return2. High pressure port3. Piezo actuator module4. Hydraulic coupler (amplifier)5. Servo valve (control valve)6. Nozzle module with nozzle needle7. Spray hole
1. Fuel return (spill flow) 2. High pressure port 3. Piezo actuator module 4. Hyraulic coupler (amplifier) 5. Servo valve (control valve) 6. Nozzle module with nozzle needle 7. Spray hole

21
changing forces in the system. Needle lift then becomes a parameter dictated by the
construction of the hardware that cannot be altered dynamically and is limited by the rail
pressure.
Actuating the needle directly reduces the hydraulic effects on the injection event and
therefore improving the response of the injector but it additionally removes the
requirement for the fuel return into the rail.
Figure 2.9 shows a direct acting injector, which has completely eliminated the requirement
for a return flow through the injector. The needle actuation occurs as a result of direct
hydraulic coupling between the needle and the piezo electric actuator. The piezo electric
actuator is sealed from the high pressure fuel, and the stack compensates for the thermal
and hydrostatic loads introduced by the pressurised fuel (Schöppe and Zülch, 2009).
Figure 2.9 Delphi DFI3 direct acting fuel injector (adapted from (Schöppe and Zülch, 2009))
There are several benefits to this system, the first of which is the reduction in the hydraulic
power requirement associated with the return flow through the injector. This also benefits
the thermal loading on the fuel circuit, helping to reduce the fuel temperature in the
system. The design of the body of the injector allows a residual amount of fuel to exist

22
inside the accumulator chamber, thus increasing the pressurised volume available for
injection. The response time was also improved between the electrical demand and the
hydraulic event, and was in the order of 100 microseconds. The result is a fast response with
a ‘square’ injection rate profile, regardless of the fuel pressure used when compared to
conventional solenoid or valve operated piezo systems (Schöppe and Zülch, 2009). A
‘square’ rate profile results in the largest injected mass per second.
The direct acting injector is a step change in the design of the Diesel fuel injector. Systems
have existed in the past that have been capable of delivering high fuel pressures, however,
the operation of the injection equipment is based upon return flow principle and therefore
the hydraulic performance is affected making the system less efficient. The improvement in
spray momentum as a result of the high fuel pressure at the point of needle lift and the
maintenance of this pressure during the injection event improve the fuel spray atomisation
and air entrainment. Also the fast opening and closing times allow precise and repeatable
control of very small injection quantities and multiple injection events allowing for novel
injection strategy development to achieve clean and efficient combustion.
2.2.1 Fuel Injector Nozzles
Figure 2.9 shows the fuel injector nozzle for a common rail system. Nozzles are incorporated
into the nozzle holder assemblies for the common rail system. The nozzle is the boundary
between the fuel system and combustion chamber, and the design of the nozzle heavily
influences the mixture formation process. The function of the nozzle is to direct the fuel
spray to the desired location and to create the shape of the spray plume. The definition of
the nozzle parameters for the piston bowl being used is important as these cannot be
changed and spray targeting can only then be adjusted by changing the injector position.
The last function of the injection needle is to seal the fuel system. This is a vital function as
any of the high pressure and temperature combustion entering the fuel system could cause
damage. The damage could manifest itself either as mechanical fatigue of the components
or by leaving deposits in the system (Mollenhauer.K and Tschoeke.H, 2010).
Nozzle designs vary depending on the design of the combustion system. A combustion
system is developed based on the size and speed of the engine, as a result the mixture
formation requirements change. This means that inherently, the fuel injection nozzle design

23
is part of the combustion system hardware and is as important as the piston bowl design to
the output and emissions of the engine.
Multi-hole nozzles use the needle to restrict the fuel flow to more than one orifice. The
systems can be direct orifice closing as in the valve covered orifice (VCO) whereby the orifice
was covered by the needle itself, or a system which uncovers a volume that feeds the nozzle
orifices as in the sac design. The two types are shown in Figure 2.10.
Figure 2.10 Multi-hole nozzle types; left sac, right VCO (Martynov, 2005)
In a VCO system, during the early stage of needle lift, the flow area will be smaller than the
orifice flow areas. In this circumstance, the pressure distribution around the needle seat can
be uneven. The pressure distribution will have an effect on the needle motion which in turn
changes the distribution of fuel to each orifice. Some systems have double needle guides to
assist the stability of the needle motion (Bae et al., 2002). Other systems force a swirl
motion of the fuel as it begins to flow through the nozzle, to centre the needle as it lifts
(Karimi, 2007).
The restriction in the nozzle orifices means that the fuel volume in the nozzle is minimized
at the end of the injection event. In this respect the VCO is a better nozzle design because
less residual fuel finds its way to the combustion chamber. If the residual fuel at the end of

24
injection, with low momentum, finds its way to the chamber under non combusting
conditions, the fuel will be emitted as un-burnt hydrocarbons.
In a sac nozzle the needle uncovers a volume from which the nozzle orifices are fed. The sac
design can be conical or cylindrical in design. The sac nozzle allows the distance between
two nozzle holes to be reduced, which means more holes can be machined into the nozzle.
The number of holes depends upon the combustion system design and the strategy for the
mixture formation (Mollenhauer.K and Tschoeke.H, 2010).
2.2.1.1 Hole size
The size of a nozzle hole has an influence on the fuel spray formation. The hole size affects
the atomisation and fuel spray cavitation as well as the fuel spray penetration into the
combustion chamber. The size of the hole also influences the rich regions in a fuel spray by
changing the fuel flow area.
For a fixed number of holes, changing the size of the hole results in a change in the fuel flow
rate. Maintaining the volumetric flow rate by adjusting the number of holes is typical when
the discharge coefficient of the nozzle hole can be maintained. This was seen in the study of
Lechner, where the reduction in hole size was used to reduce the flow rate for the same
number of nozzle holes (Lechner et al., 2005). The nozzle was a flow device with a
differential pressure between the in-cylinder conditions and the rail pressure.
Hole sizes can be produced reliably down to diameters of 0.08 mm (Payri et al., 2008). This
was the smallest size that can be drilled as suggested in (Minato et al., 2004) where the
authors applied an 18 hole nozzle to maintain the fuel flow rate and mixing time required in
their combustion investigation. For the same flow rate a smaller hole means the need for
more holes, which increases the probability of spray interactions. Spray interactions have a
negative effect in the mixture formation process by forming rich regions in the fuel spray
(Abraham et al., 1999, Amagai et al., 2003).

25
2.2.1.2 K factor
K factor is defined as the ratio of the difference in internal, di, and external nozzle hole
diameter, do, divided by the length of the nozzle hole, l.
(
)
Equation 2.1: definition of nozzle k factor
K factor gives a measure for the profile of an injector nozzle hole. A number less than 0
means that the hole diverges, equal to 1 is a cylindrical hole and greater than 1 is a
converging hole. Simulations and experiments have shown that converging nozzles can help
reduce cavitation within the nozzle hole (Martynov, 2005, Payri et al., 2008, Payri et al.,
2011). The discharge coefficient of the injector nozzle can be affected by cavitation in the
nozzle, which requires more fuel pressure to maintain the flow. Although nozzle holes with
different k factors were employed in this study the influence of k factor on combustion
system performance was not investigated as part of this work. Typical k factors used in this
study ranged from 1.5 to 2.5.

26
2.3 Diesel Combustion and Emissions
There are two distinct types of combustion applied in Diesel engines; traditional mixing
controlled combustion and low temperature combustion. Traditional Diesel combustion will
be a limiting factor for manufacturers trying to meet future emissions regulations without
expensive aftertreatment systems (Dec, 2009). Due to this, low temperature combustion at
part load operating conditions, can help to reduce engine out emissions without sacrificing
efficiency. There are however issues with the control of the combustion event (Iida et al.,
2004, Zheng and Yao, 2009, Dec, 2009) and the increase in other emitted species such as CO
and HC (Sjöberg and Dec, 2005, Miles, 2007, Kim et al., 2008, Miles, 2010).
Both forms of combustion will be presented to aid the understanding of the combustion
process and the limitations that currently exist for the Diesel engine to operate in these
modes.
2.3.1 Traditional Diesel Combustion
In a traditional direct injection Diesel combustion process, the combustion occurs over four
distinct phases with the majority of the heat release process occurring in two distinct phases
(Heywood, 1988). The four phases of the combustion process shown in Figure 2.11 are
defined to occur no earlier than the start of the injection event (a.) and are as follows;
ignition delay (a. to b.), premixed combustion (b. to c.), diffusion or mixing controlled
combustion (c. to d.) and finally late cycle oxidation or tail combustion (d. to e.).
Ignition delay is defined as the time from the start of the fuel injection process to the
turning point on the cumulative heat release curve. Ignition of the fuel is dependent upon
the temperature and equivalence ratio, thus ignition delay can be influenced by various
parameters such as compression ratio, injection pressure and Exhaust Gas Recirculation
(EGR) rate. Premixed combustion is characterised by a rapid pressure rise, linked to the heat
release from fuel that has reached the temperature to auto-ignite. The ignition delay
directly influences the premixed proportion of the combustion process as it changes the
amount of time available for the fuel and air to mix to ignitable conditions. In traditional
Diesel combustion, a short ignition delay was preferred to limit the pressure rise
rate (Heywood, 1988).

27
Figure 2.11 Traditional diesel combustion schematic
Once the initial portion of the fuel has combusted in a premixed manner, the heat release is
then governed by the diffusion of fuel from the core of the fuel jet, to the jet periphery,
where combustion occurs as the fuel and air mixes (Dec, 1997). The mixing rate is governed
by the following mixture formation strategies; high fuel pressure or high levels of in-cylinder
turbulence such as swirl and squish. The characteristic nature of traditional Diesel
combustion process was the formation of soot or particulate matter. If the temperature was
high enough, greater than 1500 K, and the equivalence ratio higher than one within the fuel
spray then particulate matter will be formed (Frenklach and Wang, 1994, Akihama et al.,
2001, Kitamura et al., 2002).
The tail combustion event occurs relatively late in the combustion cycle and this was where
further heat release occurs due to the oxidation of un-burnt and partially formed species
such as CO, HC and soot. In a Diesel combustion system where it is operated with excess air,
the oxidation occurs as the combustion species react with radicals formed during the
combustion process and the remaining oxygen (CO reaction with OH radicals in the table of
(Zheng and Yao, 2009)).
a. b. c. d. e.
f.
Time after start of injection
Rat
e o
f h
eat
rele
ase
28
Work has been done to build an understanding of the phenomena involved in the
conventional Diesel combustion process. Over a decade ago, in the late 90’s, Dec applied
laser based techniques on a fuel spray in order to build up a schematic representation of the
different zones of the fuel spray during the combustion process (Dec, 1997). As a result a
schematic of the Diesel combustion process was developed, which was used to inform a
phenomenological model of the combustion process.
Later, Dec carried out a review on advanced compression ignition engines and states that
traditional Diesel combustion will not be sufficient to meet the more stringent emissions
regulations (Dec, 2009). A lot of work has been done to enhance the mixture formation
process without harming the performance of the Diesel engine but a move towards low
temperature combustion will be required. This will be achieved by developing Diesel
combustion systems and the understanding of the mixture formation processes.
The limitation for traditional Diesel combustion exists because the formation of NOx and PM
is not limited in the combustion process. Late cycle oxidation is responsible for oxidising the
species of the rich combustion process such as PM, CO and HC. Reducing the formation of
NOx was possible with the use of EGR. The effect of EGR is twofold; the peak temperature
reduces due to the increase in specific heat capacity of the exhaust gas constituents and the
oxygen concentration reduces for the same manifold pressure conditions (Stone, 1999). As a
result of the reduction in oxygen content, less late cycle oxidation can occur. Any further
increase in EGR will suppress the formation of NOx, however a secondary effect was to limit
the oxidation of the rich combustion products. This was where a trade-off between NOx and
PM occurs.
In order to mitigate the side effect of EGR reducing the oxygen content, a necessary
requirement in order to reduce NOx, work must be done to reduce the formation of PM
during the combustion process. This was why the move towards low temperature
combustion modes was required, as the formation of PM was prevented by suppressing the
in-cylinder temperature. Both NOx and PM formation zones can be avoided if the
temperature was suppressed below 1500 K.

29
2.3.2 Alternative Diesel Combustion Strategies
A reduction in Oxides of Nitrogen can be achieved by the use of exhaust gas
recirculation (Heywood, 1988). However, a trade-off is also well established whereby the
reduction of the oxygen content in the cylinder due to the displacement of air leads to an
increase in the output of PM.
In recent years, studies have shown the potential for a simultaneous reduction in PM and
NOx in a Diesel engine, whilst at the same time, maintaining good efficiency (i.e. low
emissions of CO2). Since the turn of the century several authors have referred to Low
Temperature Combustion (LTC) in which the energy was released from the fuel either by
combustion under highly diluted low temperature conditions or under highly premixed lean
conditions. Work has been conducted to develop the understanding of the in-cylinder
processes involved (Thring, 1989, Akagawa et al., 1999, Kimura et al., 1999, Kimura et al.,
2001, Akihama et al., 2001, Walter and Gatellier, 2002, Shimazaki et al., 2003, Hasegawa
and Yanagihara, 2003, Minato et al., 2004, Okude et al., 2004, Iida et al., 2004, Lechner et
al., 2005, Kook et al., 2005, Laguitton et al., 2007, Ryan, 2007, Fang et al., 2008b, Kim et al.,
2008).
2.3.2.1 HCCI – Homogeneous Charge Compression Ignition
Homogeneous Charge Compression Ignition (HCCI) is a combustion technique developed as
an alternative to traditional Diesel combustion. In this mode the charge is highly diluted
with EGR and the fuel is injected in an advanced manner in order to form a Homogeneous
charge. HCCI was first observed over three decades ago and described as a combustion
process differing both from normal Diesel and gasoline processes (Onishi et al., 1979). In
HCCI, the fuel and intake charge (air plus EGR) form an homogenous cloud in which the
equivalence ratio (φ) is uniform and lean throughout. Equivalence ratio is defined as the
ratio of the measured Fuel to Air ratio to the stoichiometric Fuel to Air ratio (FARs). This
value is the inverse of lambda, with rich values being greater than one and lean values being
less than one.

30
The ignition occurs simultaneously at all locations in the mixture provided that the correct
pressure and temperature are achieved towards the end of the compression stroke of the
engine. HCCI with gasoline was investigated by Thring, 1989, which found lower fuel
consumption compared to normal Diesel operation, however the engine has to be modified
to allow the fuel and air to be premixed and autoignite. In a Diesel engine, in order to
provide sufficient time for the air fuel mixture to homogenise, some approaches use very
advanced injection timings (Akagawa et al., 1999) and double injections with high
concentrations of EGR (Hasegawa and Yanagihara, 2003).
The development of HCCI combustion was thought of as being more viable with fuels other
than typical Diesel fuel, such as gasoline, and primary reference fuels (PRF) of different
composition (PRF80 was composed of 80 % of the primary reference fuel iso-octane and
then 20 % of n-heptane). Diesel fuel is prone to auto ignition due to its high cetane number
whereas HCCI relies on longer ignition delays to enable the air and fuel to mix after the
completion of the injection event before the onset of combustion (Ryan et al., 2004). The
emissions characteristics of HCCI is that there was a simultaneous reduction in the amount
of NOx and Particulate matter (PM) produced (Yao et al., 2009), this is due to both a
temperature reduction and a reduction in rich equivalence ratios. The downside was the
increase in HC and CO as a result of incomplete combustion that occurred.
(Lü et al., 2005) reference the initial research into what is now commonly accepted as the
combustion mode HCCI. They identify the factors which limit the full scale production of
engines operating solely in HCCI mode. These factors include; the extension of the operating
range of HCCI to that above the lowest of the part load conditions, improved control of the
combustion event and a reduction in the un-burnt hydrocarbon (UHC) and Carbon
monoxide (CO) emissions.
2.3.2.2 Low Temperature Combustion (LTC)
Applications of the HCCI technique in the Diesel engine and the associated issues with the
application has focussed research into Diesel combustion with a highly premixed charge
(Iida et al., 2004), rather than a fully homogeneous charge. There are various names that
exist for premixed charge combustion systems, some examples are shown in the following
Table 2.1.

31
Name Acronym Authors Mixture formation
Premixed lean Diesel combustion
PREDIC (Akagawa et al., 1999) Early injection low load No EGR Water injection
Modulate Kinetics MK (Kimura et al., 1999) Swirl number 3-5 Retarded timing High EGR rate
Uniform bulky combustion system
UNIBUS (Hasegawa and Yanagihara, 2003)
Early pilot Late main injection
Premixed lean Diesel combustion
PCI (Minato et al., 2004) High injection pressure
Partially premixed compression ignition
PPCI (Lechner et al., 2005)
Narrow spray angle High EGR rates Compression ratio16:1 Double injection
Premixed charge compression ignition
PCCI (Laguitton et al., 2007) Low compression ratio 13.5:1
Table 2.1 List of different names for alternative LTC modes to HCCI
There is a mode of LTC operation known as premixed charge compression ignition (PCCI)
(Laguitton et al., 2007) or partially premixed compression ignition (PPCI) (Lechner et al.,
2005, Kim et al., 2008). This is similar to combustion in a spark ignition (SI) engine in which
heat release occurs through a high proportion of premixed charge. Premixed combustion is
the initial part of typical Diesel combustion which precedes diffusion combustion (Heywood,
1988). Increasing the ratio of premixed combustion can be achieved through a reduction in
compression ratio (Laguitton et al., 2007), increase of cooled EGR (Kimura et al., 1999) and
modified injection timings (Lechner et al., 2005).
Operating an engine in an LTC mode, thus far has focused on controlling the cylinder
conditions externally, by varying the amount and condition of air and EGR supplied to the
engine. Fuel injection strategies have also been investigated as well as the effect of forcing
the air motion in the cylinder through the use of swirl or tumble port designs. There are a
number of techniques with fuel injection strategies that allow LTC modes to be used. The
techniques can be classified as either very early direct-injection LTC or Near Top Dead
Centre (TDC) direct-injection LTC by (Dec, 2009).

32
2.3.2.2.1 Very Early direct-Injection LTC
Injecting into the cylinder earlier has proved an issue in terms of wetting the cylinder liner
as a result of increased penetration. The penetration is due to the lower in-cylinder
pressures experienced when injecting part way along the compression stroke. Injectors with
hole numbers greater than 7 holes employing more disperse sprays produce better early
injection results (Akagawa et al., 1999). Conventional Diesel injectors allow switching to
traditional injection regimes for full load conditions, however when used for early injection
the impingement and wetting as mentioned was a significant problem. Using narrower
spray cone angles can reduce liner wetting, however there was still the issue of the wall
wetting of the piston bowl (Walter and Gatellier, 2002, Fang et al., 2008a, Fang et al.,
2008c).
2.3.2.2.2 Near TDC direct-injection LTC
The premixing required to achieve LTC can also be achieved with this near and post TDC
injection. This result is the ignition is less reliant on the chemical kinetics and more closely
related to the injection event. The technique known as Modulated Kinetics was a method in
which the injection event occurs in the expansion stroke (Kimura et al., 1999). As such, the
expansion of the gas volume leads to slowing of the auto-ignition process. The use of highly
cooled EGR and reduced compression ratio are often applied to increase the ignition delay
(Laguitton et al., 2007). Increased ignition delay is beneficial and leads to an increase in the
premixed phase of combustion, as it allows more of the air and fuel to mix prior to
combustion.
One of the problems is the lack of time for the mixing to occur before the auto-ignition
process and the combustion occurs in a mixing-controlled process. EGR is required to keep
the local peak-combustion temperatures low, thus helping with the NOx formation whilst at
the same time increasing the ignition delay (Kook et al., 2005).
The effect of early and late injection timings was demonstrated by carrying out a sweep of
injection timings at different levels of EGR and at a fixed load point of 3 bar Indicated Mean
Effective Pressure (IMEP). When the injection timing is retarded the NOx level reduces. The
peak temperature was lower, and there was more time for premixing before the
combustion event. The expansion of the in-cylinder gas due to the retarded injection also

33
leads to quenching of the NOx producing reactions after the start of combustion. Soot
production is also suppressed in this operating mode because the in-cylinder temperatures
are low enough for the fuel to combust in fuel rich regions without leading to soot
formation. The oxygen concentration is low and in-cylinder temperatures are reduced is
detrimental to soot oxidation; however the amount of soot produced is significantly less.
This is an important aspect of LTC, the balance between the formation and oxidation of
combustion products such as PM HC and CO.
CO and HC emissions under these operating conditions are noted to increase with the
substantial reduction of soot and NOx (Miles, 2007, Kim et al., 2008, Miles, 2010). These
levels are above that of traditional Diesel combustion, however it has been observed that
these levels are less than the very early direct-injection LTC due to the reduced
homogeneity and reduced penetration.
The main difference in LTC and traditional Diesel combustion does not come from the
premixing phase; indeed the author states that the Diesel jet was much the same as
observed in traditional Diesel combustion (Dec, 1997, Dec, 2009). Moreover the author goes
on to explain that the main reason for the differences in emissions with the combustion
modes was that the combustion event was occurring while the fuel was being injected, due
to the improved ignition delay, meaning the mixture became lean much more quickly.
2.3.3 Soot Formation
Soot formation is reduced in the advanced combustion modes such as LTC and HCCI, even
when the equivalence ratio is low. Soot formation is at a maximum at 1800K and between
1500K and 2300K as suggested in (Kamimoto and Bae, 1988) from experiments carried out
in shock wave tubes. Soot is not formed above temperatures of 2300K regardless of the
oxygen content, as it breaks down into gaseous hydrocarbons faster than it would form
soot. The equivalence ratio effect can be explained in a similar way to that suggested by
(Kamimoto and Bae, 1988) where a limit to the formation of particles exists when a the ratio
of carbon to oxidant is less than one. Stable species such as H20 and CO2 are formed. Low
compression ratio may help the soot formation region because the lower in-cylinder
pressures reduce the width of the soot peaks as suggested in (Kamimoto and Bae, 1988).

34
The move away from conventional Diesel combustion towards the low temperature, clean
combustion, discussed in the previous section has been prompted by the demonstration of
the operation of the combustion engine with low soot and NOx performance without heavy
losses in efficiency or the need for aftertreatment.
In the work of Akihama et al. (Akihama et al., 2001), the mechanisms for the suppression of
soot in the low temperature operating mode were investigated further in order to identify
the factors contributing to this improvement. Based on the work the authors have carried
out to develop the combustion system, their hypothesis was that either; the presence of
EGR causes a reduction in the combustion flame temperature, thus reducing the effects of
rich combustion of the fuel, or that the presence of EGR leads to an improvement in the
mixing process. To investigate this, Akihama et al. (Akihama et al., 2001) used a CFD
package, KIVA 2 code, and a zero dimensional chemical kinetics model developed by
Frenklach and Wang (Frenklach and Wang, 1994). The methodology described was such that
the two processes used were applied independently, to determine equivalence ratio (φ) and
temperature (T) profiles. The chemical kinetics tool was used to define the region of sooting
conditions in terms of a, Equivalent ratio versus Temperature (φ-T) map, and the in-cylinder
conditions were defined by CFD.
The result of the investigation is that the leading mechanism for the suppression of soot is
the suppression of the combustion temperature. The distribution of the φ-T profiles in the
CFD cell volumes was such that they are displaced to the left hand side of the soot peak
when compared to the conventional combustion.
The φ-T map shown in the following Figure 2.12, demonstrates regions of NOx and soot
formation and tries to indicate the conventional Diesel combustion distribution as well as
the regions of operation for advanced low temperature combustion techniques. The map is
based upon previous research and is summarised in (Dec, 2009).

35
Figure 2.12 Equivalence ratio (φ) versus temperature (T) map (Dec, 2009)
36
2.4 Multiple Injections
The advances in the electrically controlled common rail Diesel fuel systems has allowed for
precise metering of fuel over a wide range of injection timings independent of the engine
speed. Multiple injections can be characterised by their relationship to the main injection
event. For example injections that are before the main injection of fuel are known as pilot
injections and injections that occur after the main injection are known as post injections.
Multiple injections are common place for modern direct injection (DI) Diesel engines
operating with a common rail fuel system (Tanaka et al., 2002) for traditional Diesel
combustion and LTC. A multiple injection process can be used to control the heat release
process and therefore has an influence on mixture formation, engine output and emissions.
Additionally, due to the modification of the heat release process (relative to a single
injection) the pressure rise rate can be controlled to reduce combustion noise and make the
Diesel engine more refined. It is now rare for an engine to be operated with a single
injection other than under full load conditions.
Multiple injection strategies are also employed in order to achieve advanced combustion
modes that result in a simultaneous reduction in oxides of Nitrogen (NOx) and smoke as
mentioned in the previous chapter. Usually this is coupled with an increase in the emissions
output of CO and HC (Miles, 2010) due to the overall lower temperature in-cylinder and the
increased lean regions within the fuel spray. The fuel spray becomes leaner due to an
increase in ignition delay and longer fuel spray penetration.
Simultaneous reductions in smoke and NOx were achieved with split injections
demonstrated by (Han et al., 1996). The injection was split with the majority of fuel in the
pilot and meant that the fuel that would have been injected in a rich mixture was separated
from the combustion process. A greater spatial distribution of the fuel during the
combustion process was achieved. The use of a small pilot in leads to an increase in the
smoke produced for the same fuelling conditions. The temperature increase that has
occurred through the use of a pilot injection and the late injection of the greatest quantity
of fuel leads to short ignition delay and long combustion duration without the time or
temperature to oxidise the combustion products. Splitting the injection process can lead to
an increase in the entrainment of air into the fuel spray. This is the case as long as the

37
ignition delay of the main injection is not reduced by the pilot. The interaction of the pilot
and main heat release should be separated for to achieve good air entrainment prior to the
start of combustion.

38
2.5 Combustion System Development Conclusions
The direct injection Diesel engine needs to improve engine out emissions in order to meet
future, stringent emission standards. Currently the direct injection Diesel engine equipped
with a common rail fuel system is the most suitable system. It offers the required fuel
efficiency, has the flexibility to operate at a variety of speeds and loads and has the required
power density for the passenger car market. The need to install expensive aftertreatment
systems to achieve emissions targets means that research must be done into reducing
engine out emissions. The engine hardware that forms the combustion system, discussed
previously, needs to be experimentally investigated with the application of typical and
alternative Diesel combustion modes. The need for the change in thinking for the hardware
is to accommodate combustion in highly pre mixed regions, with EGR rates greater than
50% or AFR tending towards the Stoichiometric Air-to-Fuel Ratio (AFRs), where a
simultaneous reduction of NOx and PM can be achieved. This study aims to discover
whether there is a combination of engine hardware, conventional or unconventional that
can achieve low emission and fuel consumption.
The development of combustion system strategies for a modern clean Diesel engine must
be based upon the flexibility of the system to switch modes. For example, operating in HCCI
mode requires the mixture formation process to begin in such a way that the fuel and air
mix before the onset of the combustion process. This satisfies the requirements of the
regulated emissions levels; however optimising the hardware for part load emissions
performance can compromise performance at the unregulated full load running condition.
The importance of full load is debateable, as the vehicle cannot be put into production if it
does not satisfy the part load regulated emissions criteria. However, the benchmark power
output figure is more marketable to the consumer and specific power outputs are desirable
for engine downsizing. This study also aims to discover whether conventional and
unconventional hardware can be optimised to achieve low engine out emissions without an
impact on high specific power outputs.
Existing investigations of advanced combustion modes use existing hardware both in terms
of fuel injection equipment and piston bowl designs. The important aspect for future
development is having an improved strategy for the design and interaction of the

39
combustion chamber shape and the fuel injection spray. Injection strategies help as the
metering of the fuel into the chamber affects the emission formation and combustion
process; however the chamber interactions are not optimised for the fuel spray. The same
can be said for traditional Diesel combustion; the limitations have been established with
existing hardware designs and the conventional knowledge of the mixture formation
process. This study aims to show whether conventionally and prototype designed Fuel
Injection Equipment (FIE) can be used to control the fuel metering and combustion process.
In particular, this study aims to show whether new injection hardware requires a different
thinking about the design of the injector nozzle.
Understanding the performance of conventional and unconventional combustion system
designs with traditional and advanced Diesel combustion modes will be important to
achieve a reduction in pollutant emissions from the engine, whilst at the same time
maintaining low levels of fuel consumption associated with modern Diesel engines.
Information gathered from testing the hardware in this study will be used to show the
limitations and also the requirements of the mixture formation process for both types of
Diesel combustion.
The piston bowls selected represent industry standard and unconventional designs that will
influence the thermal behaviour of the engine and the mixture formation process. The
piston bowls will be tested at a representative set of engine operating conditions. The
results generated by the conventional designs will serves as a reference for the
unconventional combustion systems. The assessment of suitability of the unconventional
designs will be based upon the delta to the conventional systems. Previous studies show
marginal improvements with the change in bowl characteristic for the same conventional
system. There is the potential for a step change in the efficiency and emission output for the
unconventional systems, this study aims to establish whether this is an useful improvement
or a deterioration not worth pursuing. Without any information on conventional designs it is
difficult to assess the impact of the unconventional combustion systems and whether they
will be suitable in light duty Diesel engines.

40
3 Experimental Equipment
This chapter describes the experimental facility used in this research project. A description
of the experimental engine hardware and fuel system is given along with a description of
the test bed services and systems. The instrumentation used is described along with the
data acquisition systems to build a picture of the capabilities and limitations of the
experimental facility.
3.1 Hardware Specification
This experimental study is based around a single cylinder Diesel engine and fuel injection
equipment (FIE) including fuel injectors with solenoid and piezo electric actuation. Four
different bowl designs and two types of injector were tested. The experimental programme
investigates the relationship between combustion chamber geometry, defined by the piston
bowl and fuel spray shape governed by the injector nozzle design. A description of the
experimental hardware follows.
3.1.1 Single Cylinder Diesel Research Engine
The engine used in this experimental investigation was a light duty four stroke single
cylinder direct injection Diesel engine. The engine was based upon an established Ricardo
Hydra crank case design with an aluminium cylinder head. The peak in-cylinder pressure
limit of this particular design, for safe operation, was 200 bar. The use of an aluminium
cylinder head was a choice that reflects the current practice for production engines. The
specification of the engine is given in the following table, Table 3.1.
The design employs four valves per cylinder, two inlet valves and two exhaust valves with
the fuel injector mounted vertically in the centre of the cylinder. The valves are also
vertically mounted in the cylinder head which avoids the need for cut outs in the piston to
accommodate the valves during the opening process at top dead centre.
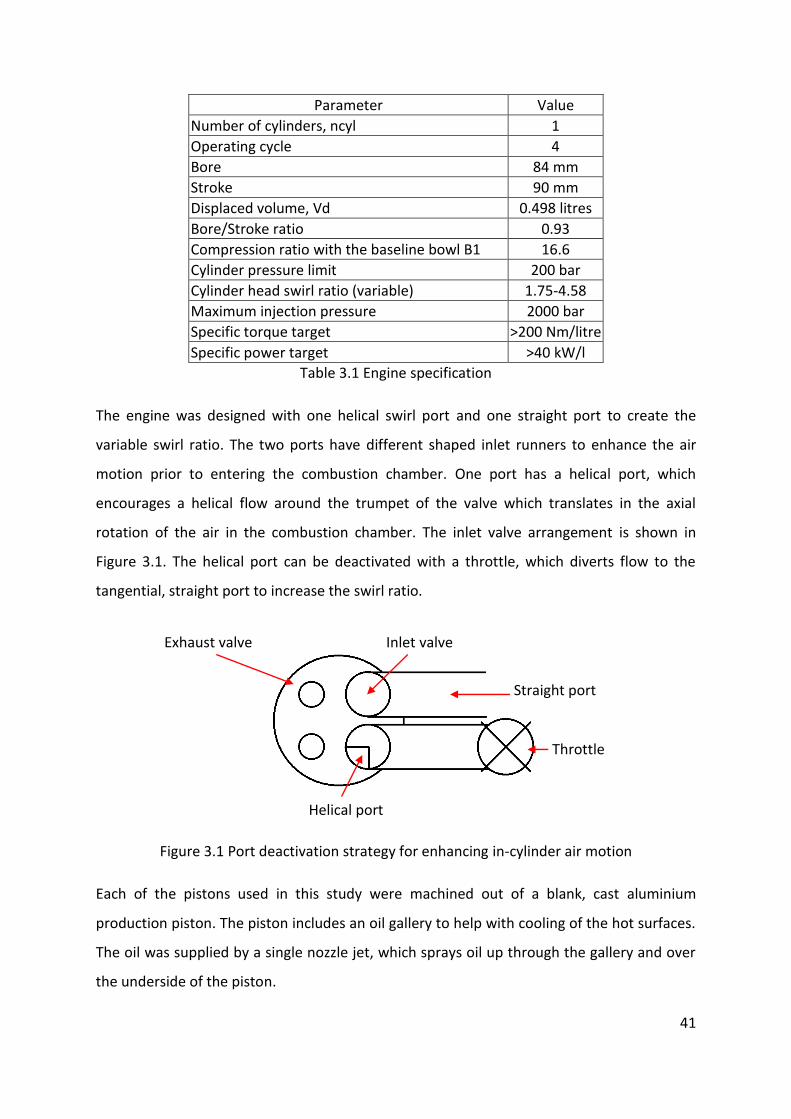
41
Parameter Value
Number of cylinders, ncyl 1
Operating cycle 4
Bore 84 mm
Stroke 90 mm
Displaced volume, Vd 0.498 litres
Bore/Stroke ratio 0.93
Compression ratio with the baseline bowl B1 16.6
Cylinder pressure limit 200 bar
Cylinder head swirl ratio (variable) 1.75-4.58
Maximum injection pressure 2000 bar
Specific torque target >200 Nm/litre
Specific power target >40 kW/l
Table 3.1 Engine specification
The engine was designed with one helical swirl port and one straight port to create the
variable swirl ratio. The two ports have different shaped inlet runners to enhance the air
motion prior to entering the combustion chamber. One port has a helical port, which
encourages a helical flow around the trumpet of the valve which translates in the axial
rotation of the air in the combustion chamber. The inlet valve arrangement is shown in
Figure 3.1. The helical port can be deactivated with a throttle, which diverts flow to the
tangential, straight port to increase the swirl ratio.
Figure 3.1 Port deactivation strategy for enhancing in-cylinder air motion
Each of the pistons used in this study were machined out of a blank, cast aluminium
production piston. The piston includes an oil gallery to help with cooling of the hot surfaces.
The oil was supplied by a single nozzle jet, which sprays oil up through the gallery and over
the underside of the piston.
Helical port
Throttle
Inlet valve Exhaust valve
Straight port

42
The swirl ratios for the individual bowls are not defined. The variation of the swirl ratio
shown in the table is due to the port deactivation throttle and was measured on a steady
state flow rig. The steady state flow rig gives a representation of the potential swirl ratios, at
maximum valve lift. Variation in the bowl geometry will have an influence on the swirl ratio
in cylinder, but without measurement or calculation by CFD, individual bowl swirl ratio is
unknown.
The cylinder head includes recesses for both a glow plug and a pressure transducer. The
glow plug was not fitted on the research engine; however a blank of the shape of the glow
plug was installed. There were two reasons for this; to maintain the combustion volume and
therefore the compression ratio, and to simulate the protrusion and interaction of the glow
plug with the fuel spray. The latter was important, as the dispersion angle of the fuel spray
needs to be such that fuel was not being deposited on to the glow plug surface.
The cut out for the pressure transducer was such that the transducer was mounted as flush
as possible to the combustion chamber. The packaging limitation for the complete cylinder
head means that the transducer was mounted at an angle to the cylinder head surface.
There was a small volume between the face of the transducer and the combustion chamber.
Previous experience suggests that this difference would result in a measurement
uncertainty smaller than that of the sensor itself.

43
3.1.2 Piston Bowl Library
The piston bowl designs used in this study include conventional design concepts as well as
unconventional designs. The piston outlines are shown in the following figure, Figure 3.2.
Figure 3.2 Overlay of piston bowl design
The conventional bowl shapes (B2 and B3) have variations in aspect ratios of bowl width to
bowl depth, whereas the unconventional designs (B4 and B5) move away from the
conventional re-entrant squish lip design towards a ‘stepped’ design. The removal of the
re-entrant squish lip leads to a secondary ‘pip’ within the piston volume. The secondary ‘pip’
refers to the bump that is created by the cutaway lip from the unconventional bowls. Each
piston has been characterised by its major dimensions, best described by the following
schematic, Figure 3.3 and presented in Table 3.2.
B2 - Narrow B3 - Shallow B4 - Ramped B5 - Stepped

44
Figure 3.3 Piston bowl major dimensions schematic
Where B was the diameter of the piston, φb represents the diameter of the piston bowl and
hb was the distance from the top of the piston to the combustion chamber floor. The bowl
diameter was measured in the same way for both conventional piston bowls and stepped
piston bowls. It was measured across the edge of the flat surface of the piston. The
difference in piston diameter B and bowl diameter φb can be used to calculate the squish
area. The dimensions displayed in the following table were generated using CAD packages
and measurements of the piston bowls. Whilst the parameters that define the geometry of
the piston bowl were adjusted, the bowl volume was maintained to ensure that the
compression ratio was maintained the same.
B
φb
hb

45
Bowl Name Compression
ratio Piston
diameter B Description
Bowl diameter
φb
Bowl depth
hb
Aspect ratio
φb/hb
Bowl to bore ratio
φb/B
Bowl surface area SA
Bowl volume V
Bowl SA/V
TDC SA/VTDC
- - - mm mm mm - - mm² mm³ 1/mm 1/mm
B2 Narrow 16 83.074 Toroidal,
re-entrant 47.1 16.2 2.91 0.57 4331 26602 0.163 0.59
B3 Wide 16 83.074 Toroidal,
re-entrant 49.8 14.8 3.36 0.60 4326 26602 0.163 0.59
B4 Ramped 16 83.074 Toroidal, stepped
60.6 15.7 3.86 0.73 4805 26597 0.181 0.57
B5 Stepped 16 83.074 Toroidal, stepped
58.0 14.9 3.89 0.70 4860 26562 0.183 0.58
Table 3.2 Major parameters for each piston bowl

46
The stepped combustion chambers allow an effective increase in the ratio of the piston
bowl diameter, φb. As a result there was a significant increase in the aspect ratio of the
piston bowl as it was possible to maintain a large bowl depth for the same bowl volume.
The, wide and open nature of the unconventional bowls B4 and B5 means there is a
difference in characteristic of the design compared to the conventional designs. The bowl
occupies a greater proportion of the piston bore (10% more), thus reducing the flat portions
of the piston bowl. This means that the surface area to volume ratio is better (in terms of
heat transfer) for the unconventional bowls, than the conventional bowls. Bowl B4 has the
lowest ratio of 0.57. It is not clear at this stage how the characteristic difference in SA/VTDC
will affect the thermal efficiency of the engine because air motion also has an influence on
heat transfer losses.
The effect of increasing the protrusion of the injector nozzle tip was assumed to be
insignificant. Reducing the volume at TDC by the volume of a cylinder with the injector
nozzle diameter (7 mm) and the height of the maximum protrusion change (2 mm), changes
the compression ratio by less than 0.1 making this change insignificant and within the
uncertainty of the combined measurements used to calculate the compression ratio.
3.1.3 High Pressure Common Rail Fuel System
The fuel injection system was based upon a common rail fuel system. The system was
comprised of the standard components of a common rail system taken from a production
system. The system was used up to a maximum of 2000 bar fuel rail pressure.
The baseline configuration of the fuel system used in the study employed a balanced valve
solenoid injector. This was included in the test programme to provide a reference for
comparison with the direct acting fuel injectors. The injector was the only component in the
fuel system that was changed along with the hardware and software necessary to control
the fuel injector.
The high pressure fuel pump that feeds the fuel rail was driven by a dedicated electric motor
rather than the engine crankshaft as it would be in a production vehicle. This arrangement
provided the flexibility to drive the fuel pump independently of the speed of the engine
without imposing constraints on the engine power output. In a typical test the controller

47
governing the speed of the motor driving the fuel pump would act to maintain the pump
speed at a fixed fraction of the engine speed (usually half the engine speed).
The fuel pump itself was a two piston pump, with a low pressure fuel feed, inlet metering
valve (IMV) and injector return flow connection. The inlet metering valve was used to
reduce the volume of flow passed through the pump. This provides one means of regulating
the fuel rail pressure. The return from the solenoid injector to the pump was blocked when
changing between injector types because the direct acting piezo system does not have a
return flow.
The type of fuel pump employed in this study will produce variations in the fuel rail pressure
due to the pulsing nature of the fuel delivery. For a crankshaft driven pump the pulses arrive
in the rail at the same point in the engine cycle. Initial tests with the experimental system
showed a slow change (over a period of 10 minutes) in the phase of the pulses at a steady
engine speed. In order to mitigate this effect an additional fuel rail was installed between
the pump and rail supplying the fuel injectors. This proved capable of damping these
pulsations thus minimising the variation of fuel pressure for successive fuel injection events.
The fuel rail on the experimental facility had no modifications before being installed. As it
was taken from a multi-cylinder production system, the other injector connections are
plugged off with one used as a location to mount an additional rail pressure sensor. The
ends of the rail were plugged with a high pressure valve (HPV) at one end and a pressure
sensor located at the other. The output of the rail pressure sensor was the feedback to the
rail pressure controller, which modified the spill characteristic of the high pressure valve.
An Emtronix injector driver system was used to control the injection events for the tests
with the solenoid fuel injector. A dedicated engine control unit (ECU) was supplied by DDS
and was used to control the injection timing of the direct acting injection system. The
purpose built ECU for the direct acting injector was also used to control the fuel pressure for
the solenoid system, but not the injection timing. This was preferred as the system operates
both the IMV and HPV in a closed loop manner. There were two benefits to this; the
temperature of the fuel in the system was reduced, and the pressure pulsations from the

48
two piston pump were damped out. This was particularly important for precise metering of
fuel when the fuel pump was driven by the dedicated motor.
3.1.4 Injector Nozzle Library
The direct acting injectors were supplied with a range of nozzle geometry variations. Table
3.3 lists the injector nozzle geometries available for the study. As the table shows the
geometry fixes a number of parameters including flow rate and cone angle. In order to
maintain the injector flow rate when changing the injector hole size, the number of holes
was increased. In order to increase the flow rate the hole size was increased without
changing the hole number.
Nozzle
Description
Actuator Post hone vol flow
Hole size Holes Cone angle
k-factor
ID Type (cm3/min) mm - ° -
N0 Solenoid 770 0.131 7 155 2
N1
Piezo
760
0.131 7
155
2.5
N2 0.123 8
N3 0.116 9
N4 0.131 7
145 N5 0.123 8
N6 0.116 9
N15
860
0.141 7
155 N7 0.131 8
N8 0.123 9
N16
860
0.141 7
145 N9 0.131 8
N10 0.123 9
N11 760
0.131 7 155
1.5 N12 0.123 8
N13 760
0.131 7 145
N14 0.123 8
Table 3.3 Injector nozzle library
There were two characteristic cone angles used in this study, which were fixed for each set
of nozzles. The nozzles with a cone angle of 155° were used for the conventional bowls (B2
and B3) and the 145° cone angles were used for the unconventional bowls (B4 and B5).
These cone angles were determined by Ricardo prior to the design of the piston bowls
49
based upon their analysis of the fuel spray pattern and air motion using CFD software. The
angles are the optimum required to target the spray at the lip and secondary ‘pip’ for the
conventional and unconventional systems respectively.
3.2 Engine Test Bed
The engine test bed was comprised of several systems; with a number of the systems being
unique to the experimental facility used in this study. The general layout and operation of
the test bed have been described by earlier studies (Laguitton, 2005, Mason et al., 2008).
The following section focuses on the modifications that were made to some of the systems.
3.2.1 Air System
A diagram of the air supply system can be seen in Figure 3.4. As stated the system was
inherited from a previous study, and was modified to improve the precision and speed of
the testing process. The air supply was provided by two Ingersoll Rand compressors via a 3
m3 pressure vessel. The system was designed to supply ambient temperature compressed
air at gauge pressures up to 10 bar and mass flow rates up to 0.15 kg/s. There was no air
dryer in the system and so variations in humidity of the fresh air supplied to the engine
could occur with changes in the weather conditions. In order to monitor this, the relative
humidity of the intake air was measured.

50
Figure 3.4 Air system schematic
The pressure vessel was used as a damping volume separating the compressors from the
engine. The compressors were setup to maintain the pressure in the vessel within one of
two ranges (9.0 to 10 bar, or 4.0 to 10 bar). For this work the first range was used. The
operation of the compressors was such that the pressure vessel was continuously
replenished to its maximum capacity. This negates the time response characteristic of the
compressor control system in regulating the pressure inside the vessel. This was of
particular importance under high air flow conditions used during full load operation.
As part of this work the system to control and measure the air mass flow rate delivered to
the engine was changed. The compressed air supplied from the pressure vessel was
regulated at location three, Shown in Figure 3.4. The regulator was operated from the
engine test cell and was used to control the pressure supplied to the nozzle bank at location
four in Figure 3.4.
The nozzle bank indicated in the air system schematic contains a set of four critical flow
Venturi nozzles that are designed based upon the British standard for such a device (BS EN
ISO 9300:2005). The nozzle bank consists of two plenums, upstream and downstream of
DPF
12 3
4
56
7
1. Compressors
2. Pressure vessel
3. Air regulator
4. Nozzle bank
5. EGR pump regulator
6. Intake heater
7. Intake runners
1. Compressors 2. Pressure Vessel 3. Intake Air Pressure
Regulator 4. Nozzle bank 5. EGR pump speed
regulator

51
each nozzle, with a pressure and temperature tapping on the upstream plenum. The
plenums are linked by the nozzles and each nozzle has an isolating valve which required
manual operation. Provided that the pressure ratio between the downstream plenum and
upstream plenum was kept below a critical value then the nozzles were choked and the air
mass flow rate only depended the upstream pressure, temperature and the area of the
throat of the nozzle. This prevents pressure waves travelling upstream from the engine
(caused by the pulsating nature of the engine air flow) affecting the control and
measurement of the air flow rate. The air mass flow rate can be computed from:
∑
√
Equation 3.1 mass flow calculation for the critical flow nozzles (BS EN ISO 9300:2005)
Were ki is a coefficient that depends upon the nozzle installation, shape and throat area. If
the nozzle valve was open then oi = 1 otherwise 0. A method for computing ki was given (BS
EN ISO 9300:2005). The set of nozzles were specified with increasing diameters so that
when used individually or in groups they could deliver the required air flow for the engine
over its entire operating map. The British standard was such that a calculation for the mass
flow rate through the orifice can be made based upon the pressure, temperature and
hardware characteristics of the nozzle (discharge coefficient, flow area surface roughness
etc.). In this case however each nozzle and combination of nozzles was calibrated with an
Endress and Hauser, thermal mass flow meter under steady flow conditions. The
coefficients calculated for each nozzle combination from this calibration were then used to
compute the air mass flow rate based upon the pressure and temperature upstream of the
nozzle bank.
After the air passes through the critical flow nozzles, the air passes through an air heater
which could be was used to further condition the air in order to meet the required specified
intake manifold conditions. Previously, the plenum which houses the heating element also
acted as a damping volume to reduce the pulsations observed when the EGR circuit was
used. The use of critical flow nozzles meant that this function was no longer required. The

52
air then passes into the engine through the manifold and intake ports, which were described
in section 3.1.1.
3.2.2 Fuel System
As described in section 3.1.3, new fuel system components were supplied for this study. As
this hardware comes from a fuel system adapted from a production system it was straight
forward to integrate it into the existing fuel system in the engine test cell. The existing fuel
system was based upon a Ricardo design, which allows the conditioning and measurement
of the fuel flow (Laguitton, 2005).
As Figure 3.5 shows, the cooling water on the fuel circuit was conditioned by an external
cooling tower. This allowed the heat generated in the fuel circuit to be dissipated, and the
fuel temperature to be regulated. The regulated fuel temperature applies to the fuel on the
low pressure side, i.e. fuel that was sent along track C to the high pressure fuel pump at the
engine.
The fuel was pumped around the system which was replenished by a tank located on the
external wall of the test bed. The tank was equipped with a float sensor to determine when
the level of the tank was low. This was visually inspected on each test day through a sight
glass on the tank. The system included an AVL 733 fuel meter, which was used to measure
the mass of fuel consumed. When the fuel meter is operated it isolates the supply from the
fuel tank and as a result fuel was circulated by the pump around the rest of the fuel circuit.

53
Figure 3.5 Low pressure fuel system schematic
Figure 3.6 shows the integration of the new hardware into the existing fuel system. The
connections from the fuel rail and the fuel pump manage the spill flow from the high
pressure valve and inlet metering valve respectively. Figure 3.6 also shows the difference in
system configuration for the solenoid and piezo systems, with the removal of the leak back
flow to the pump from the injector and the removal of the depression gauge. The practical
implementation of this system meant that the leak connection was plugged and left
disconnected when using the piezo system. This was possible due to the location of the
connection between the injector and fuel pump on the fuel pump itself. It exposed the
return line to a vacuum meaning there was always a depression in this line. This was
necessary to allow the interchange to take place between each fuel injector type.
Fuel Tank
F
D E
B
C
A
___ Water Circuit___ Fuel Circuit___ Cooling Tower
A – To Fuel Meter
B – From Fuel Meter
C – To Engine
D – Pump Return
E – Rail Return
F – Fuel Meter Return

54
Figure 3.6 High pressure fuel system schematic
The filter indicated in Figure 3.6 was specified for the operation of the piezo system. The
filter was finer than that shown in Figure 3.5. It was necessary to reduce the probability of
any small particles in the fuel or accumulated from the components in the fuel system,
affecting the performance of the piezo electric actuator as this was exposed to the fuel
within the body of the injector.
The fuel used for this study was a primary reference fuel with no biodiesel content (B0)
called Carcal 725A. The specification can be found in the Appendix A. Example data from the
specification is shown in Table 3.4.
Property Units Specification
Result Max Min
Cetane number - 52 54 52.8
Density @ 15 °C g/ml 0.833 0.837 0.8348
Viscosity @ 40 °C cSt 2.3 3.3 2.7
Sulphur Content mg/kg 6 10 9.3
H/C Atomic Ratio - - - 1.88 Gross Calorific Value MJ/kg
- - 45.62
Net Calorific Value MJ/kg
- - 42.75
Table 3.4 Table showing the fuel specification of the reference fuel Carcal 725A (see
Appendix A)
HP Pump
D
E
C
HP Pump
D
E
C
Piezo actuator configurationSolenoid valve configuration

55
3.2.3 Exhaust System
The exhaust system was unique to the engine test cell used in this study. Since previous
studies it has been modified according to the work done in (Mason et al., 2008), with only
minor changes, which will be described here.
The exhaust system was modified and divided into a full load route and a part load route.
The need for discrimination was for two purposes; to help control the thermal energy
radiated from the exhaust pipe and to lower the minimum back pressure under full load
conditions. Each route was joined before passing by the sample point for the emissions
analyser and both routes are connected to the external flue running out of the test cell to
the surroundings. Figure 3.7 shows the exhaust system arrangement, with each route
indicated.
Figure 3.7 Exhaust system schematic
The full load route was fitted with an orifice plate in order to create a flow restriction to
increase the back pressure on the engine as it pumps the gas through the system. The size
of the orifice plate was selected to produce back pressures similar to a high specific power
DPF
3
1
2
1. Full load route
2. Part load route
3. Ambient

56
turbocharged Diesel engine. The full load route had an isolating valve to allow the switch
over to the part load operation.
The part load system was used when the gas flow and temperature was lower than the full
load condition as well as containing the pipe work used in the EGR circuit as will be
described in the following section. The part load route was equipped with two mechanically
operated valves, one of which can be operated solely to change the back pressure level set
on the engine and the other one operated to affect the back pressure and the restriction on
the EGR circuit. These valves are used to isolate the system when switching to the full load
route.

57
3.2.4 Exhaust Gas Recirculation System
The EGR system was integrated into the part load route of the engine exhaust system. This
was the major modification made in previous work (Mason et al., 2008), which was
necessary in order to deliver low temperature EGR with the aim of achieving low NOx. Prior
to that point there was a short circuit system with a cooled stream and an un-cooled stream
that were mixed prior to being added to the intake system. The existing system is shown in
Figure 3.8. As described there are a series of valves which are used to modulate the
pressure and flow rates of the gas in the system.
The valve indicated by number four was an electronically actuated valve, controlled from
the test cell. The valve was a poppet type that reveals a flow curtain for the exhaust gas.
This valve was modified with an insert to reduce the effective flow area and to allow finer
regulation of the exhaust gas. The length of the EGR system causes a significant heat loss
from the exhaust gas by the time it was returned to the intake manifold, particularly at the
low load conditions. The heat exchangers shown could be used to heat up the exhaust gas
under these conditions.

58
Figure 3.8 EGR circuit schematic
3.2.5 Oil and Water System
The oil and water supplies for the engine were both managed independently by the test cell
controller. The oil was contained in the crankcase and circulated around the engine to
provide lubrication to the valve system, the crankshaft and the piston. The oil circuit had its
own pump and heat exchanger configuration to regulate its temperature and it was
equipped with a pressure level switch. The switch was linked to a test bed controller, which
if tripped would turn off the fuel, air and dynamometer systems as a safety measure. The oil
temperature was regulated at a temperature of 85°C.
The water system carries the coolant through the engine. The coolant was stored in a tank
in the engine test cell and the circuit has a pump and heat exchanger to regulate the
temperature of the coolant. The coolant was also controlled to a temperature of 85°C.
1. Full load isolator
2. Back pressure valve
3. EGR restriction valve
4. EGR rate valve
5. EGR pump 1
2
3
4
5

59
3.3 Data Logging
The data recorded at each test point in this study was an averaged value made over the
acquisition period. The acquisition period was dependent upon the type of data logged.
Sensors were logged by either the low speed or high speed data acquisition system. Low
speed data logging was made over a fixed time period and sampled at 1 Hz. The high speed
data was acquired over 300 consecutive engine cycles.
3.3.1 Low Speed Logging
The instruments which make up the low speed log file are indicated in Table 3.5. The
measuring duration was linked to the fuel meter sampling time, in normal operation this
was set to 100 seconds. Therefore the instruments logged at 1 Hz will include 100 values for
each channel in the low speed log file. Some instruments recorded in the low speed log
operated in a command mode. For example the smoke meter which requested three
samples, which were recorded and averaged. The fuel meter was requested to make one
measurement for the measurement duration. The fuel mass consumed was used to
compute the average fuel mass flow rate and average injected mass.
Once acquired, analysis was performed on the low speed data file, with the average and
standard deviation computed for each of the channels. The average value was used in the
summary file for a data set. In most cases two test logs were made for each test condition.
3.3.2 High speed Data
High speed data was distinguished from the low speed data by the time response of the
transducer. The fast time response of these instruments allows them to be logged at crank
angle resolution. High speed data refers to the channels indicated in Table 3.5 and they are
logged over 300 engine cycles.
The data was synchronised with the crank angle encoder with has a resolution of half a
degree crank angle. The software used to log the high speed data was used to interpolate
between these crank angle marks, over a specified window around TDC, to give a finer
resolution for the combustion process. The result was a data file, with both raw outputs and
calculated values based on the signals measured. The majority of the calculated values used
are combustion calculations were based on the measured in-cylinder pressure.

60
3.4 Instrumentation
The instrumentation used in this study has been specified based upon the best response
characteristic and accuracy for the application. The locations of the sensors used on the
engine test bed are shown in Figure 3.9 and Table 3.5 has the corresponding key.
The pressure and temperature sensors for the gas flow in and out of the engine were kept
as close as possible to the engine. In the case of item 5, the intake high speed Kistler, this
had to be located up stream of the separate intake runners, as indicated in Figure 3.9. The
instrument was also located after the EGR connection, to take a measurement of the mixed
intake stream.
A crank shaft encoder was used to synchronise the measurement of the fast responding
sensors with the motion of the engine crank shaft. It has marks of half degree increments,
which can be interpolated between using the high speed software.
All of the thermocouples used on the test bed were k-type thermocouple. They were used
for two purposes; to monitor the performance of the engine and the gas exchange process
and to monitor the condition of the oil and coolant supplies to the engine. In each flow
location they are inserted so that the tip of the thermocouple was aligned to the central axis
of the pipe. This was to ensure the thermocouples are away from the walls and that the
measurement was of the gas temperatures and not influenced by any conduction from the
pipe walls.
The load cell was used to measure the brake torque of the engine and hence compute the
brake mean effective pressure (BMEP).The load on a single cylinder engine was specified in
terms of the gross indicated mean effective pressure (GIMEP), since the friction
characteristic was not representative of a multi cylinder engine due to the specific number
of bearings per cylinder. The load cell measurement was used as an indicator to determine
whether the GIMEP measurement varied greatly.

61
No. Type Description Make Model Range Unit Accuracy Log speed
1 Pressure Air supply pressure Druck PMP-317 0-10 barA 0.15% Low
2 Temperature Air supply temperature K-type
0-100 °C 1° Low
3 Humidity Relative humidity Rotronic i4000 0-100 %
Low
4 Temperature Pre EGR temperature K-type
0-200 °C 1° Low
5 Pressure Intake pressure Kistler 4045A5 0-5 barA 0.30% High
6 Temperature Swirl temperature K-type
0-100 °C 1° Low
7 Pressure Straight port intake pressure Druck PMP-317 0-4 barA 0.15% Low
8 Temperature Straight port intake temperature K-type
0-100 °C 1° Low
9 Encoder Crank angle encoder Leine and Linde
0-360 ° 0.5° High
10 Pressure Fuel pressure Kistler 4067A3000 0-3000 barA
High
11 Pressure In-cylinder pressure Kistler 6125C 0-300 bar 0.40% High
12 Current Current trace
0-50 A
High
13 Pressure Exhaust pressure Kistler 4045A5 0-5 barA 0.30% High
14 Temperature Exhaust temperature K-type
0-1400 °C 1° Low
15 Pressure Exhaust pressure Druck PMP-317 0-4 barA 0.15% Low
16 Temperature EGR coolant in K-type
0-200 °C 1° Low
17 Temperature EGR pump temperature K-type
0-200 °C 1° Low
18 Temperature EGR coolant out K-type
0-200 °C 1° Low
19 Temperature EGR temperature K-type
0-200 °C 1° Low
20 Emissions Raw emissions (various) Horiba MEXA 7170DEGR - Ppm
Low
21 Temperature Sample point temperature K-type
0-1400 °C 1° Low
22 Emissions Smoke AVL 415s 0-10 FSN 0.05FSN Low
23 Load Torque
-30-110 Nm
Low
24 Mass flow Fuel measurement AVL 733 0-54 kg/h 0.01 kg/h Low
Table 3.5 Sensor identification and description

62
Figure 3.9 Test bed schematic
DPFE D
C
E DC
A
8
13
14
16
19
T7
21
3
15
5
21
20
4
6
2211
12
910
1718
23
20

63
3.4.1 Emissions Measurement
The emissions measurements made on the test bed are both gaseous and particulate. The
European legislation for a Diesel vehicle requires the regulation of particulate matter from
the exhaust pipe. The system on the test bed has been inherited from previous studies with
only minor modifications to the sampling point locations (Laguitton, 2005).
3.4.1.1 Gaseous
The emissions analyser has several measuring devices and two sampling lines used to
measure the individual species in the exhaust gas and intake gas. The outputs of the
individual measuring devices are collated and displayed by the main control unit. The
species that are measured in the exhaust system are not only regulated emissions, but they
are also to establish the operating condition of the engine. From these measured values
operating parameters such as air to fuel ratio and the EGR rate were computed.
EGR rate is defined as the ratio of the concentration of CO2 in the exhaust stream, to the
concentration of CO2 in the intake manifold, after the air and the EGR have mixed. In the
calculation the presence of CO2 in the air is accounted for.
( )
( )
Once the EGR rate has been calculated, it is possible to calculate the mass flow rate of EGR
from the air flow. Rearranging the above equation leads to:
( )
The total flow into the engine can then be calculated:
( )
The accuracy of the measurement of the CO2 will affect the uncertainty of the calculation of
the EGR rate. When a calculation is a quotient, the relative uncertainty of the measured
values can be summed to give the uncertainty of the calculation. As a result based on the
worst case quoted uncertainty of the sensors the error in the EGR rate calculation is 4 %.

64
The following table shows the typical uncertainty of the calculated EGR rate based on the
accuracy of the CO2 measurement, at typical engine operating conditions.
Key
point
Absolute
Uncertainty Min Nominal Max
KP1 2% 43% 45% 47%
KP2 2% 36% 38% 40%
KP3 1% 28% 29% 30%

65
Table 3.6 Emissions analyser performance
No. Type Description Measurement Model Range Unit Accuracy Repeatability
Time
response
(T90)
Condition
Temperature
Condition
humidity
1Carbon
Dioxide
Non dispers ive
infrred detectorDirect AIA-723 0-20 %
smal lest: 1% FS or
2% reading0.50% 1.5s Room temp Cooler dried
2Carbon
Monoxide
Non dispers ive
infrred detectorDirect AIA-723 0-3 %
smal lest: 1% FS or
2% reading0.50% 1.5s Room temp Cooler dried
3Oxides of
Nitrogen
Chemiluminescence
DetectorDirect CLA-720M
0-500, 0-
10000ppm
smal lest: 1% FS or
2% reading0.50% 2s
Heated
sampleCooler dried
4 Oxygen Magneto-pneumatic Direct MPA-720 0-25 %smal lest: 1% FS or
2% reading0.50%
1.5s
(O2>5% ),
2s
(O2<5%)
Room temp Cooler dried
5Total
Hydrocarbon
Flame ionisation
detectorDirect FIA-725A
0-500, 0-
50000ppm
smal lest: 1% FS or
2% reading0.50% 1.5s
Heated
sampleWet

66
The above Table 3.6 shows the type of analyser and its performance. The measurements
made by the analyser are direct measurements of the exhaust stream. Each analyser
conditions the gas depending upon its requirements. Where the analyser was a heated
sample it was maintained to 191°C, as dictated by the configuration of the Horiba emissions
hardware. This was regulated by the heated line and the analyser itself. There was an
additional heated oven in line between the exhaust pipe and heated sample line, which was
maintained at 191°C. This oven was inherited from previous studies and serves to maintain
the temperature of the sample gas and to remove the particulate matter from the sample.
The cooler used to dry the sample gas was located in the control unit of the analyser rack.
The sample gas in these analysers was at room temperature.
As the study was carried out at steady state conditions the response time of the sensors was
sufficient to cope with changes in the output of the engine. Following the selection of a new
test point the gaseous emissions were monitored and test points were only logged once
fluctuations in readings have fallen below a predetermined threshold.
3.4.1.2 Particulate Matter
The means for determining the mass of particulate matter flowing out of the engine was a
calculation based on a correlation between particulate concentration and filter smoke
number (FSN). The measurement of smoke number was based on the principle of drawing a
sample of the exhaust gas through filter paper. The deposits of particulate matter discolour
the filter paper and the opacity of the discolouration was measured. The conversion from
the paper blackening to a filter smoke number was based upon the opacity of the paper and
the amount of time or volume of the sample gas.
There was an optimum paper blackening that the opacity sensor can operate at for the best
measurement accuracy. This involves sampling a different amount of gas depending upon
the concentration of particulates in the exhaust. The smoke meter can be operated in this
way in automatic mode, and it was capable of determining the sample volume required for
the optimum paper blackening. It was found that taking an average of three samples
minimised measurement uncertainty and produced repeatable results.

67
3.4.2 Fuel measurement
The fuel measurement made on the engine test bed was a direct measurement of the mass
of fuel consumed. The fuel meter weighs the mass lost from the system over a specified
period. The specified time period can be adjusted between fifteen and 100 seconds. This
measurement of mass consumed was then used for the calculation of fuel consumption as a
mass flow rate.
The Device has a weighing bucket with a 900 g capacity and was capable of measuring up to
50 kg/h (approximately 900 g of fuel consumed over 60 seconds). The maximum fuel flow
expected on the single cylinder engine at the highest fuel flow conditions was around 7 kg/h
(depending upon engine speed). At this order of fuel mass flow rate the most fuel mass lost
from the system was around 195 g, which was approximately 22 % of the total mass of the
measuring bucket. Under the part load conditions with an expected fuel mass flow rate of
0.6 kg/h this equates to less than 2 % of the total bucket mass.
With that in mind the sampling time was kept to its maximum of 100 seconds to allow the
largest mass of fuel under any test condition, to be consumed. This was done to minimise
the effect of the uncertainty in the measurement of fuel mass on the computed fuel mass
flow rate.

68
3.5 Engine Test Points Drive Cycle Analysis
The engine test points used in this study were based upon key points selected from an
analysis of engine load variations for a vehicle driven over the New European Drive Cycle
(NEDC). Additionally, there were two tests points for full load operation, one at maximum
torque (2000FL) and one at maximum speed (4000FL) as an assessment of peak torque and
peak power. Table 3.7 summarises the key points identified, the names of each key point
and the key points used in the tests to determine nozzle protrusion. The test process will be
described in more detail in the following chapter.
Test point
Speed GIMEP Used in
Protrusion test
- RPM bar - KP1 1500 3
KP2 1500 6
KP3 2000 9 P
2000FL 2000 24 P
4000FL 4000 21.4 P
Table 3.7 Test points used in the study
The table shows that there are 3 key points for the protrusion test. Nozzle protrusion was
altered by adding washers of varying thicknesses to the injector. The points tested have
different requirements for the mixture formation process which may result in a different
optimisation for the protrusion test. The full load key points are not regulated by the
emissions legislation; however they still remain important in terms of achieving high specific
power outputs. The test carried out at 4000FL, where peak power occurred, was an
additional check for the optimisation at the part load condition. The washer selection at KP3
should not affect the engine performance at the other operating conditions, so it was
important to understand how the engine responded at other test points. Protrusion –
2000FL, where peak torque occurred, is at the same speed as Protrusion – KP3 but at an
increased boost pressure and load target. The combustion process changes compared to
KP3, because of the increase in the fuel required to meet the load target. Combustion is
generally more diffusive at this point when compared to KP3.

69
3.6 Measurement Error and Uncertainty Analysis
In the presentation of experimental results, consideration was given to the measurement
uncertainty of the calculated values. Appropriate sensors were selected to reduce error and
therefore the resulting uncertainty of the calculated values used in the analysis. Where the
error of a measurement was unknown, analysis based on the deviation of the measurement
was used.
The parameters that required a calculation of the uncertainty were the indicated specific
emissions values, and the fuel consumption. Other variables such as rate of heat release and
combustion burn angles were either taken as the sensor value or the deviation of the
experimental measurement. The deviation of the measurement was taken because the
uncertainty calculation was too complicated, or involved a numerical integration, which in
theory results in large uncertainty. The experimental deviation approach was a practical
solution, without which it would be difficult to draw useful conclusions.
3.6.1 Calculating uncertainty
When a calculated value is a sum, then the absolute uncertainty of the measured values are
summed together to give the overall uncertainty. When the calculated value is a product,
then the relative uncertainty of the measured values are summed together. This method
can be summarised in the following equations:
When a calculation is as follows;
The absolute uncertainty is;
Where a is the sum calculated from the measured values b and c. is the uncertainty of
the calculated vale a, is the error in the measurement b and is the error in
measurement c. An example of this application is the calculation of exhaust flow from the
fuel flow and air flow as follows:
Where is the calculated mass flow of exhaust gas, is the calculated mass flow of
air and is the measured mass flow rate of fuel. At an operating condition typical of
KP3 with EGR flowing the error in the fuel measurement is 0.004 kg/h, the uncertainty in the

70
airflow calculation is 0.63 kg/h therefore the uncertainty in the flow of exhaust is the sum of
these two values, 0.634 kg/h or 0.63 kg/h to 2 significant figures. The relative uncertainty
for the mass flow of exhaust (used in the emissions calculations later) at KP3 is as follows:
( )
When the calculation is as follows;
The relative uncertainty is;
Where a is the product calculated from the measured values b and c. is uncertainty of
the calculated vale a, is the error in the measurement b and is the error in
measurement c as for the previous case. The calculation of air flow is a product of the two
measured values, fuel flow and AFR as follows:
Where is the calculated mass flow of air, is the measured mass flow rate of fuel
and AFR is the air to fuel ratio. At KP3 the relative error in the fuel measurement is 0.3%,
and the relative error of the AFR calculation from the emissions analyser is 2%. As a result
the relative uncertainty of the air flow calculation is 2.3% (0.63 kg/h).
For other measurements such as the burn angles the standard deviation of the measured or
calculated value was used to represent the spread of data. This takes account of the
variability of each test point on a specific day but does not consider the effects of the sensor
error. As a means to validate this approach, measurements were taken for a daily check
point to build up a picture of certainty about the sensors being used. An example of the
cross check process can be given using the performance of the cylinder pressure sensor,
which was used for all of the combustion calculations that fed the analysis. When the daily
check point was tested, a motored curve was analysed for the variation of cyclinder
pressure over the course of the testing. This accounts for the long term effect of sensor
error.

71
3.6.2 Representing Uncertainty
In order to simplify the application the worst case error was taken to represent the
maximum difference observed for each point shown in the test data. This was a
conservative approach and a means for a quick reference for the performance of each
combustion system configuration tested. The following Table 3.8 shows the uncertainties
for the commonly occurring parameters used in the analysis.
Test point Calculation Uncertainty KP1 KP2 KP3 4000FL 2000FL
isCO % 8.8% 7.4% 6.9% 6.3% 6.4%
isHC % 8.8% 7.4% 6.9% 6.3% 6.4%
isNOx % 8.8% 7.4% 6.9% 6.3% 6.4%
isFC % 2.9% 1.5% 1.0% 0.4% 0.5%
50% angle % 3.0% 2.0% 2.0% 2.0% 2.0%
90% angle % 3.0% 3.0% 3.0% 3.0% 2.0%
Smoke FSN 0.05 Table 3.8 Calculated and measured uncertainties for the common emissions results
displayed in the results section
3.7 Daily Check Point Analysis
In order to verify the experimental equipment was working normally and to diagnose any
issues after a piston change, a daily check point was tested prior to testing each day. The
daily check point was based on an open loop engine condition that generated an expected
output. The engine was also motored at each part load key point because an injector change
could influence the engine output for an open loop condition making it impossible to
compare check point conditions.

72
3.7.1 Motored Test Points
The engine oil and coolant was heated up before the engine started. The target
temperature prior to starting the engine was 85 °C. Once up to temperature the engine was
motored at each of the three key point conditions this was used to check the variation in
maximum cylinder pressure and other test set up conditions. The inlet and exhaust
conditions were set and the motored pressure curve and the torque measurement were
taken to check for variation.
Average Standard Deviation CoV %
Parameter Units KP1 KP2 KP3 KP1 KP2 KP3 KP1 KP2 KP3
Speed RPM 1501 1501 2000 5 4 4 0.3% 0.3% 0.2%
Intake pressure barA
1.028 1.161 1.428 0.005 0.005 0.012 0.4% 0.4% 0.8%
Intake temp °C
30.4 30.6 30.0 1.4 1.2 0.9 4.7% 4.0% 3.2%
Pmax Bar 37.3 42.2 56.0 0.6 0.6 0.6 1.5% 1.5% 1.1% Pmax angle ATDC
-0.9 -0.9 -0.7 0.1 0.1 0.1 -11.1% -11.7% -14.9%
Exhaust pressure barA
1.304 1.385 1.984 0.017 0.022 0.043 1.3% 1.6% 2.1%
Air flow kg/h 21.1 24.4 40.7 0.5 0.4 0.4 2.6% 1.5% 1.0%
Table 3.9 Motored check point statistics
The table shows the average, standard deviation and coefficient of variance for each of the
measured values for the duration of the testing programme. Figure 3.10 shows the
parameters for each test where the x-axis was the number of test points. There were more
than 200 test logs for each motored key point that contribute to the calculation for each
measurement (some were discounted due to mistakes in the set up).

73
Figure 3.10 Motored check point test plots
1400
1500
1600
1700
1800
1900
2000
2100
0 100 200 300
Spe
ed
RP
M
Test points
KP1 KP2 KP3
0.9
1
1.1
1.2
1.3
1.4
1.5
1.6
0 100 200 300
Inta
ke p
ress
ure
bar
A
Test points
KP1 KP2 KP3
0
5
10
15
20
25
30
35
40
0 100 200 300
Inta
ke t
em
p °
C
Test points
KP1 KP2 KP3
30
35
40
45
50
55
60
0 100 200 300
Pm
ax B
ar
Test points
KP1 KP2 KP3
1.2
1.4
1.6
1.8
2
2.2
0 100 200 300
Exh
aust
pre
ssu
re b
arA
Test points
KP1 KP2 KP3
15
20
25
30
35
40
45
0 100 200 300
Air
flo
w k
g/h
Test points
KP1 KP2 KP3

74
Taking the cylinder pressure PMax measurement as an example; when the test was set up in
the same way the measured parameters varied no more than 0.6 bar in all cases for one
standard deviation The maximum CoV on this value was 1.5 % due to the relatively low
maximum cylinder pressure at KP1.
The cylinder pressure measurement was an important parameter for the combustion
calculations so ensuring that experimental error and variation was reduced was important.
When the experimental variation was reduced it was possible to say that any variation in
engine performance was due to hardware changes rather than error in the measurements.
The figure shows that there were no step changes in any of the parameters tested, when
bowls or injectors were changed. There is random scatter with no discernable long term
trend indicating that data taken later in the programme could be compared with data
acquired in the early stages.
3.7.2 Daily Check Point
Once each of the motored tests was completed, the engine was set into the ‘open loop’
condition. The following tables show the set up parameters and expected outputs.
As Table 3.10 and Table 3.11 show, the variation in the daily check point outputs for each
bowl was minimal. The largest CoV observed in the set up was the intake temperature. The
variation was a maximum of 4.3% for bowl B3 although this only represented 1.3 °C and in
absolute temperature terms (°K) the variation was less than 0.5 %. GIMEP varied with a
change in piston bowl (due to efficiency changes). As a result the fuel system set up was
differently. The daily check point formed part of the zero EGR testing conditions
The results of the daily check point test gave confidence that the piston changes didn’t
affect the engine operation above and beyond the changes to the combustion process. It
allowed the conclusions about the hardware design changes to be drawn with confidence in
the variation of the results. Throughout the testing phase of the project this condition was
successfully used to diagnose faults with the emissions measuring equipment, a cylinder
head failure and issues with sensors and measuring equipment.

75
Test set up Parameter Setting Units Speed 2000 RPM Intake P 1.47 barA Intake T 30 °C Rail pressure 1050 bar SOIm -9 °C Inj Dur (bowl dependent) ≈ 700 µs
Table 3.10 Open loop daily check point set up
Average Standard Deviation CoV %
Parameter Units B2 B3 B4 B5 B2 B3 B4 B5 B2 B3 B4 B5
Speed RPM 2003 2001 2001 1997 4 4 8 6 0.2% 0.2% 0.4% 0.3%
Intake pressure barA 1.469 1.470 1.471 1.467 0.004 0.003 0.007 0.004 0.3% 0.2% 0.5% 0.3%
Intake temp °C 32.7 31.2 32.3 31.6 0.7 1.3 0.4 0.6 2.3% 4.3% 1.1% 1.8%
Rail pressure Bar 1040.2 1043.5 1036.5 1044.1 2.5 5.6 3.0 2.4 0.2% 0.5% 0.3% 0.2%
Inj Dur µs 694.1 699.7 681.5 677.1 1.9 1.9 6.6 3.0 0.3% 0.3% 1.0% 0.4%
SOIm ATDC -7.0 -9.0 -9.0 -9.0 0.0 0.0 0.0 0.0 -0.1% 0.0% -0.2% 0.0%
Fresh air mass flow barA 40.6 41.1 41.0 41.1 0.3 0.2 0.4 0.1 0.7% 0.6% 0.9% 0.1%
Fuel flow kg/h 1.44 1.45 1.42 1.41 0.01 0.01 0.01 0.02 0.7% 0.7% 0.7% 1.4% GIMEP bar 9.06 9.01 8.98 9.06 0.07 0.04 0.07 0.04 0.8% 0.4% 0.7% 0.4%
Table 3.11 Open loop daily check point output and variation

76
4 The Effect of Injector Nozzle Protrusion on Combustion and
Emissions
This chapter presents the initial testing to determine the injector tip protrusion. The injector
tip protrusion is an important parameter in a Diesel engine for the relationship of the fuel
spray with the piston bowl. The injector tip protrusion will be optimised for each bowl and
fixed for the characterisation of each piston bowl.
The tip protrusion modifies the relationship of the fuel spray with the combustion chamber.
This is known as spray targeting as it uses the combustion chamber geometry to influence
the mixture formation process. This is similar in concept to a ‘wall guided’ Gasoline Direct
Injection (GDI) in which the combustion chamber walls are used to disperse the fuel to a
more a favourable location (Bosch, 2000). The interaction with the combustion chamber
modifies the spray penetration (Pickett and Lopez, 2005, Pickett et al., 2005), the
atomisation process (Amagai et al., 2003, Fang et al., 2008a), the jet interactions (Abraham
et al., 1999, Amagai et al., 2003, Pickett and Lopez, 2005), the flame lift off length (Pickett et
al., 2005, Som et al., 2011), heat transfer losses due to surface evaporation and ultimately
has an influence on the mixture formation process and fuel efficiency. Therefore, being able
to understand and optimise the surface, which can be modified further by changing the
injector protrusion. Assumptions have to be made about the in-cylinder conditions relating
to the engine operation that influence the liquid and vapour spray penetration. This makes
the optimisation of protrusion necessary, first to check the assumptions about the fuel spray
behaviour, but also to accommodate the wide range of in-cylinder conditions the engine is
spray targeting is of particular interest and importance.
The main hardware parameters that influence the spray targeting are: the injector tip
protrusion, the injector spray angle, and the geometry of the piston bowl. Once the shape of
the piston bowl is defined, the spray angle of the injector nozzle can be selected to interact
with a region on the bowl.

77
4.1 Experimental Results
When the engine was first assembled, the nozzle tip protrusion of fuel injector N0 was
measured without a washer (Moukaideche, 2009), dimension c in Figure 4.1. This was used
as a reference point for establishing the fuel spray path with the injector in the engine. The
relative displacement of the injector, from having no washer fitted to the point where the
injector was clamped into the engine, was measured with a dial gauge when the engine was
cold. The position of the injector nozzle when the clamping torque was applied could now
be established allowing a close approximation to the real spray targeting compared to the
assumed value based on CAD geometry. The data presented in the results section uses the
displacement of the fuel injector spray centre relative to the cylinder head gas face as a
reference, dimension b in Figure 4.1.
Figure 4.1 Schematic representation of the displacement of the injector with the change in
protrusion. Arrows represent the positive displacement of the spray centre (b) and the
nozzle tip (c).

78
The addition of a washer to the fuel injector reduces the displacement of the spray centre
from the gas face. Thus the thinnest washer represents the furthest distance for the spray
centre below the gas face. Protrusion was changed from least to most protrusion in 3 steps.
The relationship between the spray centre height and washer thickness, with the clamping
torque (26 Nm) applied is given in Table 4.1.
Washer Spray centre
height
mm mm
3.1 mm 0.18
2.6 mm 0.61
2.1 mm 1.18
1.6 mm 1.60
Table 4.1 The relationship of washer thickness and spray centre height
Some of the analysis in this section includes an energy balance. Based upon the assumption
that the heat input, the fuel conversion efficiency, heat transfer and crevice losses can be
lumped together, then it was possible to calculate an energy balance based on heat release
data and other measured parameters. The following description can best be illustrated in
the following Figure 4.2. The maximum fuel energy per cycle, defined by the fuel
consumption and the lower heating value (qlhv,f) of the fuel gives a maximum amount of
energy that can be extracted from the fuel (Qfuel). The fuel conversion efficiency (ηfc)
accounts for the fuel that has not contributed to the heat release process completely and
was calculated from the emissions output, air flow and fuel consumption (Heywood, 1988).
The maximum gross heat release (HRgross) then becomes the product of the maximum fuel
energy and the fuel conversion efficiency. The difference between the gross and net heat
release (HRnet) accounts for the heat transfer and crevice losses (HLht,C) (Heywood, 1988).
The difference between the indicated work (Wi) and the net heat release was the heat
rejected through the exhaust (HLexh).

79
Figure 4.2 Schematic for heat release from fuel and subsequent identification of losses
based on Heywood
The above explanation can be quantified with simple analysis. The maximum heat input was
equal to the maximum fuel energy supplied, where:
Equation 4.1
Where; N was the engine speed expressed in rev.s-1, was the mass flow rate of fuel in
kg.s-1. The fuel conversion efficiency can be calculated from the combustion losses by taking
into account the enthalpy of formation of various emitted species that do not contribute to
the heat release process and can be quantified in the following equation.
∑
[ ( )⁄ ]
Equation 4.2
Where; represents the mass fractions of the individual constituents, the enthalpy of
formation of the individual constituents, was the lower heating value of the fuel,
-0.2
0
0.2
0.4
0.6
0.8
1
1.2
-20 30 80 130 180
Ener
gy d
istr
ibu
tio
n [
% Q
fuel
]
CAD [degATDC]
SOC
Wi
HR net
HR gross
Q fuel
HR
Wi
HL exh
HL ht,C
η fc

80
was the air mass flow rate and was the fuel mass flow rate. The final two parameters
should be expressed in equivalent units of mass flow rate, kg.s-1 or g.h.-1 for example.
Based on the schematic in Figure 4.2, the maximum gross heat release, can be
calculated as the product of the maximum heat input of the fuel, and the fuel
conversion efficiency, .
Equation 4.3
The maximum net heat release value ( ) can be calculated from the magnitude of the
heat release from the start of combustion (SOC) to the value of heat release at the crank
angle of exhaust valve opening ( ). SOC was defined at the minima of the heat release
profile that indicates a turning point from fuel evaporation into heat rise due to combustion.
Equation 4.4
Therefore the heat losses through heat transfer and crevice losses, lumped together in this
analysis can be taken as the difference between the maximum values for and net
heat release, respectively.
Equation 4.5
The difference between and the indicated work output ( ) results in the heat that
was lost through the exhaust.
Equation 4.6
As a result an energy balance can be produced, which helped to identify where the fuel
energy was being lost and what effect bowl geometry had on this distribution.
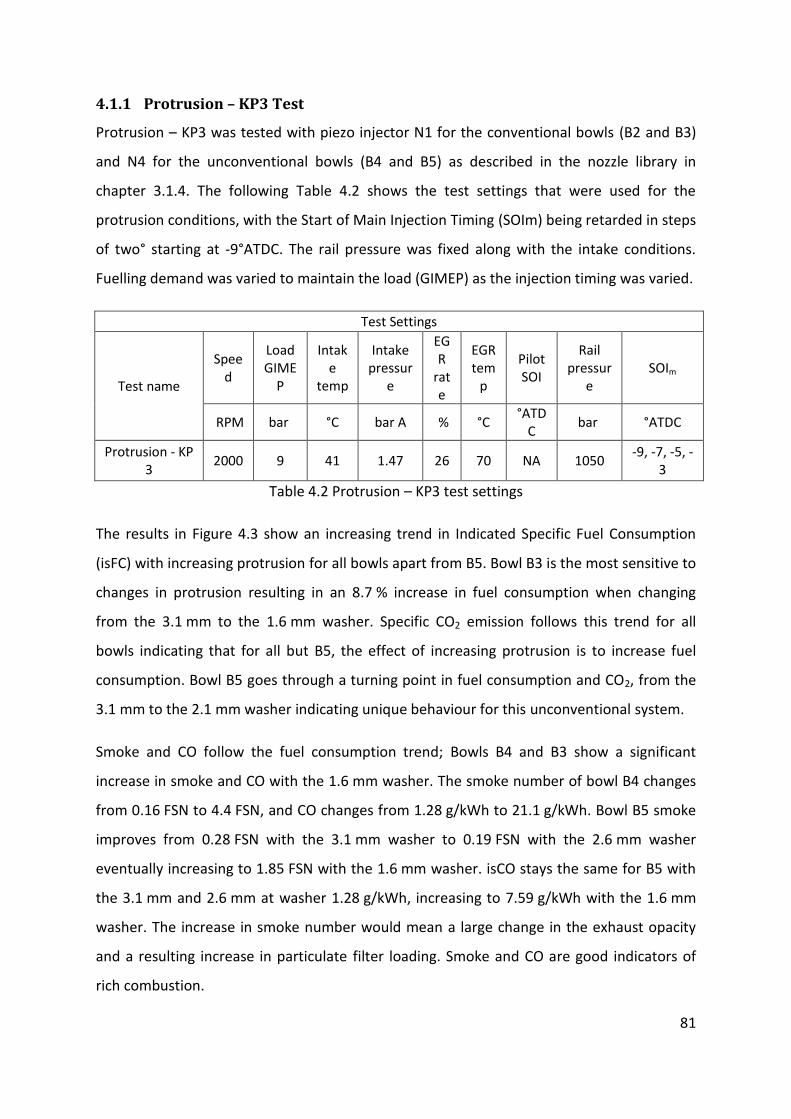
81
4.1.1 Protrusion – KP3 Test
Protrusion – KP3 was tested with piezo injector N1 for the conventional bowls (B2 and B3)
and N4 for the unconventional bowls (B4 and B5) as described in the nozzle library in
chapter 3.1.4. The following Table 4.2 shows the test settings that were used for the
protrusion conditions, with the Start of Main Injection Timing (SOIm) being retarded in steps
of two° starting at -9°ATDC. The rail pressure was fixed along with the intake conditions.
Fuelling demand was varied to maintain the load (GIMEP) as the injection timing was varied.
Test Settings
Test name
Speed
Load GIME
P
Intake
temp
Intake pressur
e
EGR
rate
EGR tem
p
Pilot SOI
Rail pressur
e SOIm
RPM bar °C bar A % °C °ATD
C bar °ATDC
Protrusion - KP3
2000 9 41 1.47 26 70 NA 1050 -9, -7, -5, -
3
Table 4.2 Protrusion – KP3 test settings
The results in Figure 4.3 show an increasing trend in Indicated Specific Fuel Consumption
(isFC) with increasing protrusion for all bowls apart from B5. Bowl B3 is the most sensitive to
changes in protrusion resulting in an 8.7 % increase in fuel consumption when changing
from the 3.1 mm to the 1.6 mm washer. Specific CO2 emission follows this trend for all
bowls indicating that for all but B5, the effect of increasing protrusion is to increase fuel
consumption. Bowl B5 goes through a turning point in fuel consumption and CO2, from the
3.1 mm to the 2.1 mm washer indicating unique behaviour for this unconventional system.
Smoke and CO follow the fuel consumption trend; Bowls B4 and B3 show a significant
increase in smoke and CO with the 1.6 mm washer. The smoke number of bowl B4 changes
from 0.16 FSN to 4.4 FSN, and CO changes from 1.28 g/kWh to 21.1 g/kWh. Bowl B5 smoke
improves from 0.28 FSN with the 3.1 mm washer to 0.19 FSN with the 2.6 mm washer
eventually increasing to 1.85 FSN with the 1.6 mm washer. isCO stays the same for B5 with
the 3.1 mm and 2.6 mm at washer 1.28 g/kWh, increasing to 7.59 g/kWh with the 1.6 mm
washer. The increase in smoke number would mean a large change in the exhaust opacity
and a resulting increase in particulate filter loading. Smoke and CO are good indicators of
rich combustion.

82
isNOx reduces with increasing protrusion. This effect is consistent across all bowls. At the
smallest protrusions conventional bowls have lower isNOx levels than the unconventional
bowls. As with CO and smoke, the isNOx emission indicated that the combustion becomes
rich as the protrusion increases.
The results indicate that the biggest effect of protrusion is to reduce air entrainment into
the fuel spray prior to combustion. The combustion process is sensitive to the spray
targeting towards a particular point on the combustion chamber surface. As a result, the
combustion duration increases with protrusion, as shown by the 90 % angle in Figure 4.3.
Bowl B3 and B4 are affected the most, with the 90 % angle changing from approximately
40°ATDC to 57°ATDC. 17° change represents a significant increase in burn duration,
increasing heat rejection into the exhaust and reducing efficiency.
The combustion process at Protrusion – KP3 was premixed, with the fuel injection demand
completed before the onset of the combustion process. In order to avoid both slow
combustion duration and rich product formation the fuel must be well distributed. When
the isFC and indicators of rich combustion deteriorate with protrusion changes, one can
assume that poor mixing of the air and fuel has occurred before combustion.

83
Figure 4.3 Effect of protrusion for all bowls at protrusion – KP3. Plots show spray centre
below gas face for the selected SOIm of -9 °ATDC.
185
190
195
200
205
210
-0.5 0 0.5 1 1.5 2
isFC
[g/
(kW
.h)]
Spray centre [mm]
0
0.2
0.4
0.6
0.8
1
1.2
1.4
1.6
-0.5 0 0.5 1 1.5 2
isN
Ox
[g/(
kW.h
)]
Spray centre [mm]
0
1
2
3
4
5
-0.5 0 0.5 1 1.5 2
Smo
ke [
FSN
]
Spray centre [mm]
0
5
10
15
20
25
-0.5 0 0.5 1 1.5 2
isC
O [
g/(k
W.h
)]
Spray centre [mm]
500
550
600
650
700
750
800
-0.5 0 0.5 1 1.5 2
isC
O2
[g/
(kW
.h)]
Spray centre [mm]
30
35
40
45
50
55
60
65
70
-0.5 0 0.5 1 1.5 2
90
% a
ngl
e [d
eg]
Spray centre [mm]

84
Figure 4.4 Fuel energy distribution for all bowls. Protrusion – KP3 with SOIm set at -9 °ATDC. From top left B2, top right B3 bottom left B4,
Bottom right B5
7.48 7.47 7.51 7.49
6.24 6.33 6.52 6.70
3.05 3.47 3.57 3.56 0.11 0.09 0.11 0.20
0.00
5.00
10.00
15.00
20.00
3.1 mm 2.6 mm 2.1 mm 1.6 mm
Po
we
r [k
W]
7.46 7.48 7.49 7.50
6.28 6.46 6.74 6.97
3.10 3.11 3.42 3.47 0.05 0.07 0.18 0.48
0.00
5.00
10.00
15.00
20.00
3.1 mm 2.6 mm 2.1 mm 1.6 mm
Po
we
r [k
W] η fc
HL ht,C
HL exh
W,i,g
7.50 7.44 7.46 7.41
6.26 6.29 6.64 6.81
2.95 2.98 2.71 3.02 0.05 0.05 0.19 0.58
0.00
5.00
10.00
15.00
20.00
3.1 mm 2.6 mm 2.1 mm 1.6 mm
Po
wer
[kW
]
Washer [mm]
7.47 7.50 7.52 7.47
6.11 6.18 6.34 6.38
3.25 2.91 3.04 3.05 0.05 0.05 0.10 0.22
0.00
5.00
10.00
15.00
20.00
3.1 mm 2.6 mm 2.1 mm 1.6 mm
Po
wer
[kW
]
Washer [mm]
η fc
HL ht,C
HL exh
W,i,g

85
An energy balance was performed in order to gain more insight into the mechanisms
affecting the thermal efficiency of each bowl. Figure 4.4 shows an energy balance for each
bowl and washer at -9°ATDC (for a description of the calculation see Appendix B Energy
balance). The indicated work (W,I,g) was maintained approximately constant by changing
the fuelling to meet the load target. What this demonstrates is that as protrusion increased,
the heat rejection (HL,exh) to the exhaust increased. This is consistent for all bowls, with
bowl B3 having the largest change (11 %) from the 3.1 mm to the 1.6 mm washer. Bowls B2
and B5 have the smallest change in heat rejection at 7 % and 4 % respectively.
A difference in heat transfer and crevice losses (HL,ht,C) is visible between the conventional
and unconventional bowls. For the conventional bowls as the protrusion increases the heat
transfer and crevice losses increases. The increase overall is 17 % for B2 and 12 % for B3.
This may be due to an increase in turbulence that results from the combustion being
contained in the bowl region.
The unconventional bowls do not show this trend. The results show that there is some
variation as the protrusion increases. Apart from the 2.1 mm washer, the losses for B4 are
consistent, averaging 2.98 kW with a CoV of less than 1 %. For bowl B5 the highest heat
transfer and crevice loss is with the 3.1 mm washer. The remaining losses average 3 kW with
a CoV of 2 % .This may indicate the influence of the secondary pip on the behaviour of the
combustion system heat losses.
The heat loss differences between combustion systems may be a result of the fact the air
supported conventional systems encourage swirl and squish. Combustion may be contained
within the bowl region by the re-entrant lip (Kidoguch et al, 1999) and thus increase
turbulent air motion resulting in higher heat transfer losses. The wider unconventional
bowls, which have reduced squish regions, may be relatively stagnant and heat losses may
be insensitive to protrusion changes.
The overall fuel efficiency is related to the work conversion efficiency. At this key point the
influence of protrusion strongly affects the mixture formation process, which then affects
the heat release process. In the case of the 3.1 mm washer, the heat release process is
completed sooner (refer to the 90 % burn angle plot, Figure 4.3) leading to better work

86
conversion efficiency. This results in the minimum heat rejection through the exhaust and
the highest fuel conversion efficiency assuming the heat lost in heat transfer is not
significant.
Looking at the fuel spray targeting of the piston bowl features for the protrusions used at
protrusion – KP3 helps to explain some of the behaviour observed from the experimental
results. Figure 4.5 shows the piston at the start of injection and the two liquid spray plumes
show the spray targeting with the thickest (3.1 mm) and thinnest (1.6 mm) washers.
The spray angles are different for the conventional (155°) and unconventional bowls (145°)
and this is reflected in the figure by the direction of the fuel spray. The figure itself
represents a section of half of a piston with a centre line on the right hand side of the figure.
The lines that form the fuel spray include a centre line and a diverging line that represents a
13° cone angle based on observations of liquid fuel spray by (Karimi, 2007).

87
Figure 4.5 Fuel spray piston bowl relationships for conventional (top) and unconventional
(bottom) piston bowls. SOIm was -9°ATDC, injection duration 0.7 ms. Arrows representing
potential spray distribution as influenced by the piston shape looking at a section of the
engine from the front. Cone angles are based on liquid fuel (Karimi, 2007).
At 2000 RPM the piston displacement for the injection durations typical of the operating
condition is approximately 8° or 0.7 mm. At this test condition, the assumption is that these
Conventional bowls - Cone angle 155°
B2 - Narrow SOI
B3 - Shallow SOI
Cylinder Head
3.1mm
1.6mm
Unconventional bowls - Cone angle 145°
B4 - Ramped SOI
B5 - Stepped SOI
Cylinder Head
3.1mm
1.6mm

88
figures represent the effective bowls and spray relationships prior to the onset of
combustion and therefore allow a judgement to be made about how the fuel is distributed.
Because the majority of the mixing occurs with 0.7 mm piston displacement before the
onset of combustion, the mixture formation relies on the distribution of fuel by the
combustion chamber walls. For the conventional systems an increase in protrusion reduces
the impact angle with the lip and can cause a downward flow of the fuel into the bowl
region, therefore reducing the amount of air that can be entrained into the fuel spray.
In previous research by Middlemiss (1978), this was a positive effect because the result of
creating rich regions of fuel and air was that combustion became more diffusive, resulting in
a reduction in Indicated Specific Oxides of Nitrogen (isNOx). High swirl and squish flows
helped to oxidise the products formed by rich combustion. Rich fuel regions were apparent
in the measured emissions in the experiments and the longer combustion durations were
reflected in the fuel consumption and the increase in HLexh with protrusion, indicating that
this was the behaviour of the conventional bowls.
The fuel consumption and emissions differences observed between the conventional bowls
can be attributed to the location of fuel spray interaction with the piston bowl wall. Because
bowl B3 is wider, the fuel spray effectively interacts with the lip lower down the face of the
lip, changing the effective protrusion required to target the same place on the bowl lip.
Because the protrusion has been shown to be an important parameter in terms of mixture
formation and combustion efficiency, bowl B3 would be expected to show a marginal
improvement in the output emissions with a slightly thicker washer.
The spray targeting effect is different for the unconventional systems. As the protrusion
increases for these bowls, the spray targeting moves to a different region on the secondary
pip. As this occurs, fuel distribution changes from being split between the upper and lower
portions to being concentrated within the bowl region in a similar way to the conventional
systems. Because the lower bowl region is smaller in volume for the unconventional bowls
(necessary to maintain the compression ratio), there is less volume for the fuel and air to
mix. This could lead to richer regions being formed, which may explain the significant
deterioration of the combustion with the last step of protrusion, particularly with bowl B4.

89
The volume of the upper portion of the bowl and the radius of the upper portion curvature
influences the fuel spray distribution and mixing. The difference between these
unconventional bowls could be the way that the fuel spray is forced into a more intense
vortex with the tighter curvature of the upper region of bowl B5. Additionally, the lower
region in bowl B5 encourages a more intense swirling motion relative to bowl B4 enhancing
fuel mixing and further product oxidation.
There is an upper limit observed for the protrusion of the unconventional systems which
could be a result of the fuel making its way into the squish regions. Figure 4.5 shows that
with the thickest washer, the fuel could have penetrated into the squish regions before and
during combustion. The squish region is typically cooler than the main chamber region,
which could lead to poor combustion and oxidation of combustion products.

90
4.1.2 Protrusion – 4000FL Test
At this higher engine speed, the cycle time is reduced as well as the time for mixture
formation and formed product oxidation. This test point was used to ensure that the
optimisation of the protrusion at Protrusion – KP3 did not compromise full load in terms of
cylinder pressure, exhaust temperature and smoke number.
Test Settings
Test name Speed Load
Intake temp
Intake pressure
EGR rate
EGR temp
Pilot SOIm
Rail pressure
SOIm range
RPM GIMEP °C barA % °C - bar °ATDC
Protrusion – 4000FL
4000 21.4
(approx 35 kW)
45 2.4 NA NA NA 2000 -19, -17, -15, -13
Table 4.3 Test settings used for 4000FL
The test setting used can be seen in Table 4.3 above. For each bowl, the protrusion was set
and the test condition was run. Once the load target was achieved a timing swing was
carried out from the most advanced to the most retarded SOIm timing. The limiting factors
at this condition were the maximum cylinder pressure, the maximum exhaust temperature
and the smoke number. In some tests the limits were reached before the load target was
achieved so no meaningful data could be logged for comparison with other bowls.
Prior to testing the load target was reduced for bowl B4 because there was some
uncertainty as to whether the load target of 21.4 bar GIMEP would be met with the
unconventional bowls. In order to gather comprehensive data for the response to timing
and protrusion the load target was set at 19.4 bar GIMEP. This has to be considered when
looking at the following plots. Once the characterisation had been run for B4 at the higher
load target it was clear that the load target was achievable so bowl B5 was tested at the
higher load level at protrusion – 4000FL.

91
Figure 4.6 The effect of protrusion on isFC at Protrusion – 4000FL. Plots showing the SOIm swing at a fixed load.
180
190
200
210
-20 -18 -16 -14 -12 -10
isfc
[g/
(kW
.h)]
B2 - Narrow
180
190
200
210
-20 -18 -16 -14 -12 -10
isfc
[g/
(kW
.h)]
B3 - Shallow
3.1 mm
2.6 mm
2.1 mm
1.6 mm
180
190
200
210
-20 -18 -16 -14 -12 -10
isfc
[g/
(kW
.h)]
SOIm [°ATDC]
B4 - Ramped
180
190
200
210
-20 -18 -16 -14 -12 -10is
fc [
g/(k
W.h
)]
SOIm [°ATDC]
B5 - Stepped
3.1 mm
2.6 mm
2.1 mm
1.6 mm

92
As Figure 4.6 shows, the trend for the response to protrusion at this test point differs
between the conventional and unconventional designs. For the unconventional designs the
response is similar to that observed at Protrusion – KP3, in that the isFC deteriorates with an
increase in protrusion. For bowl B4 the difference between the 3.1 mm washer and the
1.6 mm washer is approximately 6 % across the range of SOIm used. For bowl B5, at the
most advanced SOIm timing the difference is 7.7 %. For the conventional bowls the effect of
protrusion on isFC is not as significant as it is with the unconventional bowls. B3 shows the
biggest difference, around 3 %, with the 1.6 mm washer.
With Protrusion – KP3 the response to a change in protrusion has the same trend for each
SOIm tested for each of the conventional and unconventional bowls. With Protrusion –
4000FL however the trends with a protrusion change are different for the conventional
bowls.
The limiting parameters were reached before it was possible to log any test data for bowl
B5. Hence, as the protrusion increased and the SOIm retarded for bowl B5, the exhaust
temperature limit was reached and therefore test points were not logged. The trend
however at the most advanced SOIm is for the deterioration of the combustion process with
an increase in protrusion as observed for bowl B4. This shows a consistent response for the
unconventional bowls.

93
Figure 4.7 The effect of protrusion on smoke number at Protrusion – 4000FL. Plots showing the SOIm swing at a fixed load.
0.00
1.00
2.00
3.00
4.00
5.00
-20.00 -18.00 -16.00 -14.00 -12.00 -10.00
Smo
ke [
FSN
] B2 - Narrow
0.00
1.00
2.00
3.00
4.00
5.00
-20.00 -18.00 -16.00 -14.00 -12.00 -10.00
Smo
ke [
FSN
]
B3 - Shallow
3.1 mm
2.6 mm
2.1 mm
1.6 mm
0.00
1.00
2.00
3.00
4.00
5.00
-20.00 -18.00 -16.00 -14.00 -12.00 -10.00
Smo
ke [
FSN
]
SOIm [°ATDC]
B4 - Ramped
0.00
1.00
2.00
3.00
4.00
5.00
-20.00 -18.00 -16.00 -14.00 -12.00 -10.00Sm
oke
[FS
N]
SOIm [°ATDC]I
B5 - Stepped
3.1 mm
2.6 mm
2.1 mm
1.6 mm

94
The smoke number shown in Figure 4.7 follows the isFC trend for all bowls. The biggest
differences with a change in protrusion are observed for the unconventional bowls. Bowl B5
increases from 1.5 FSN with a 3.1 mm washer to 4.53 FSN with a 1.6 mm washer. The
differences for the conventional bowls are less severe, with the biggest difference for B2
occurring at the most retarded timing (3.1 mm - 1.74 FSN and 1.6 mm - 0.57 FSN).
Swirl and squish velocities are proportional to engine speed. The air supported conventional
systems potentially vary less when the protrusion is changed because the turbulence in the
air has a stronger influence on the air fuel mixing than the spray targeting. Conversely, the
unconventional systems, where one would assume the squish flow is less intense, rely more
on the targeting of the spray at a particular region of the piston bowl.
Examining the spray targeting at this key point helps interpret these results. At this engine
speed (4000 RPM) and injection duration (max 1400 μs) the piston moves through 33°. The
piston displacement at this speed (5 mm) is approximately 7 times larger than the
displacement at protrusion – KP3 (0.7 mm) because of the increased speed and increased
injection duration required to meet the increased load. As the piston displacement is
relatively large, the interaction of the fuel spray and bowl wall evolves relative to the SOIm,
however some assumptions can be made about the distribution of the fuel.

95
Figure 4.8 Fuel spray piston bowl relationships for conventional (top) and unconventional
(bottom) piston bowls. SOIm was -19 °ATDC, injection duration 1.4 ms. Arrows representing
potential squish flow velocity differences between each bowl.
Figure 4.8 shows the spray targeting for 3.1 mm and 1.6 mm washers with a SOIm
of -19 °ATDC. As with KP3 – Protrusion, the assumption is that these figures represent the
effective bowls and spray relationships prior to the onset of combustion and therefore allow
a judgement to be made about how the fuel is distributed. As the protrusion increases for
Conventional bowls - 155° cone angle
B2 - Narrow SOI
B3 - Shallow SOI
Cylinder Head
3.1mm
1.6mm
Unconventional bowls - 145° cone angle
B4 - Ramped SOI
B5 - Stepped SOI
Cylinder Head
3.1mm
1.6mm

96
the conventional bowls the spray targeting moves down the face of the lip and into the bowl
region. Unlike protrusion – KP3, the strong squish flow encouraged by the relatively narrow
bowl throat makes the conventional bowls less sensitive to the precise location of the spray
targeting.
The unconventional bowls are more reliant on the interaction with the bowl wall. With the
3.1 mm washer, less fuel is focussed into the bowl region during the injection process. This
indicates that there is potential to encourage better air entrainment by distributing the fuel
between the upper and lower portions of the bowl.
Considering the energy balance in Figure 4.9, the differences between the conventional
bowls appears to be the magnitude of the heat transfer and crevice losses (HLht,C). The
difference between B2 and B3 with the 3.1 mm washer is more than 10 % for each washer
selected. This is with comparable exhaust heat rejection values. For bowl B3 with the
1.6 mm washer, the load target was not met (34.6 kW) however the maximum fuel input
(82.1 kW) was more than with the 3.1 mm washer (81.1 kW). The load target was exhaust
temperature limited. For B3, when the 1.6 mm washer was used more of the heat energy
was being rejected through heat transfer instead of contributing to work output.
The behaviour of B5 is similar to B3; when the load target was not met for the equivalent
heat input, an increase in HLht,C is observed. The poor combustion associated with the
1.6 mm washer means that the exhaust temperature limit was achieved before the load
target could be met. Bowl B4 seems to indicate that the heat losses through the exhaust and
heat transfer increases with protrusion. This is in line with the fuel consumption response.
The smoke indicates that the mixture formation was poor as the protrusion increased,
indicating the importance of spray targeting for the unconventional bowls compared to the
conventional bowls.

97
Figure 4.9 Energy balance top left to bottom right B2 to B5
35.63 35.64 35.55 35.44
30.02 29.90 30.18 30.65
14.31 14.07 13.70 13.88 0.09 0.09 0.14 0.30
0.00
20.00
40.00
60.00
80.00
100.00
3.1 mm 2.6 mm 2.1 mm 1.6 mm
Po
we
r [k
W]
B2 Narrow
35.47 35.45 35.50 34.61
29.91 30.88 30.89 30.65
15.57 15.67 15.44 16.36 0.15 0.16 0.22 0.43
0.00
20.00
40.00
60.00
80.00
100.00
3.1 mm 2.6 mm 2.1 mm 1.6 mm
Po
we
r [k
W]
B3 Shallow
η fc
HL ht,C
HL exh
W,i,g
32.26 32.30 32.30 32.13
25.54 26.08 26.57 26.65
11.61 11.92 12.36 13.35 0.12 0.29 0.90 1.65
0.00
20.00
40.00
60.00
80.00
100.00
3.1 mm 2.6 mm 2.1 mm 1.6 mm
Po
wer
[kW
]
Washer [mm]
B4 Ramped
35.63 35.28 34.36 33.60
29.91 30.08 29.29 28.47
14.90 15.60 16.89 18.96 0.54 0.97 1.27 1.49
0.00
20.00
40.00
60.00
80.00
100.00
3.1 mm 2.6 mm 2.1 mm 1.6 mm
Po
wer
[kW
]
Washer [mm]
B5 Stepped
η fc
HL ht,C
HL exh
W,i,g

98
4.1.3 Protrusion – 2000FL Test
Because protrusion – 2000FL was a full load condition the emissions are not regulated and
hence the only important aspect was that the load target could be achieved within the
boundaries of exhaust temperature, cylinder pressure and smoke number without a
significant penalty on fuel consumption.
Test Settings
Test name Speed Load
Intake temp
Intake pressure
EGR rate
EGR temp
Pilot SOIm
Rail pressure
SOIm range
RPM GIMEP °C barA % °C - bar °ATDC
Protrusion – 2000FL
2000 24 50 2.4 NA NA NA 2000 -8, -6, -4, -2
Table 4.4 Protrusion – 2000FL test settings
The test setting used can be seen in Table 4.4. For each bowl, the protrusion was set and the
test condition was run. The procedure was the same as with protrusion – 4000FL. Once the
load target was set, at this condition a timing swing was carried out from the most advanced
to the most retarded SOIm timing.
As seen in Figure 4.10, for all combustion chamber configurations, isFC deteriorates with
increasing protrusion at each SOIm tested. Bowl B3 seems to show the smallest
deterioration (approx. 4 % across all SOIm timings) from the 3.1 mm to the 1.6 mm washer,
however the isFC is higher than all other bowls with the 3.1 mm washer (above 200 g/kWh
for all SOIm tested).
The unconventional bowls are insensitive to the first step change in protrusion; however as
with the conventional bowls further changes of protrusion lead to an increase in fuel
consumption. What is observed immediately is that the thinnest washer is consistently poor
for all of the combustion systems tested. This was also observed at protrusion – KP3. For the
conventional bowls this indicates that, when the engine speed is reduced and the
turbulence is lower, the sensitivity of the spray targeting increases compared to protrusion
4000FL. For the unconventional bowls, where squish is potentially lower, the spray targeting
remains the governing parameter for the combustion quality.
Figure 4.11 shows that the smoke number increases for all bowls using the thinnest washer.
This is the strongest indicator of a deterioration of the combustion due to poor fuel air

99
mixing. Bowls B2 and B4 seem to suffer with the highest smoke number when the thinnest
washer is used achieving 1.5 FSN and 2.37 FSN respectively.
The energy balance is shown in Figure 4.12. With an increase in protrusion, in general, there
is an increase in both HLth,C and HLexh as well as fuel conversion efficiency losses. Bowl B4
has the biggest change from the 3.1 mm washer to the 1.6 mm washer of around 27 %. With
the thinnest washer the combustion process breaks down and released heat is lost without
contributing to the work output.
The bowl and spray relationship is similar to protrusion – KP3 at the start of injection event.
The initial spray formation is affected by the fuel being biased more into the piston bowl
with the thinnest washer. The piston displaces further than at protrusion – KP3 due to the
longer injection event, however this is not sufficient to help entrain the available air into the
fuel spray and combustion gasses. The initial spray formation and therefore spray targeting
is the dominant parameter for the combustion process.

100
Figure 4.10 The effect of protrusion on fuel consumption at 2000FL. Top left bowl B2, top right B3, bottom left B4 and bottom right B5
195
200
205
210
215
220
-10 -8 -6 -4 -2 0
isfc
[g/
(kW
.h)]
B2 - Narrow
195
200
205
210
215
220
-10 -8 -6 -4 -2 0
isfc
[g/
(kW
.h)]
B3 - Shallow
3.1 mm
2.6 mm
2.1 mm
1.6 mm
195
200
205
210
215
220
225
-10 -8 -6 -4 -2 0
isfc
[g/
(kW
.h)]
SOI [°ATDC]
B4 - Ramped
195
200
205
210
215
220
-10 -8 -6 -4 -2 0
isfc
[g/
(kW
.h)]
SOI [°ATDC]
B5 - Stepped
3.1 mm
2.6 mm
2.1 mm
1.6 mm

101
Figure 4.11 The effect of protrusion on smoke number at 2000FL. Top left bowl B2, top right B3, bottom left B4 and bottom right B5
0
0.5
1
1.5
2
2.5
-10 -8 -6 -4 -2 0
Smo
ke [
FSN
] B2 - Narrow
0
0.5
1
1.5
2
2.5
-10 -8 -6 -4 -2 0
Smo
ke [
FSN
]
B3 - Shallow
3.1 mm
2.6 mm
2.1 mm
1.6 mm
0
0.5
1
1.5
2
2.5
-10 -8 -6 -4 -2 0
Smo
ke [
FSN
]
SOIm [°ATDC]
B4 - Ramped
0
0.5
1
1.5
2
2.5
-10 -8 -6 -4 -2 0
Smo
ke [
FSN
]
SOIm [°ATDC]
B5 - Stepped
3.1 mm
2.6 mm
2.1 mm
1.6 mm

102
Figure 4.12 Energy balance protrusion 2000FL
19.94 19.94 19.92 19.59
15.49 15.89 16.38 16.79
12.55 12.53 13.10 13.98 0.25 0.53 0.92 1.14
0.00
10.00
20.00
30.00
40.00
50.00
60.00
3.1 mm 2.6 mm 2.1 mm 1.6 mm
Po
we
r [k
W]
B2 Narrow
19.97 19.88 19.52 18.85
15.71 15.93 16.04 16.33
13.41 13.64 13.89 13.64
0.45 0.70 1.00 1.20
0.00
10.00
20.00
30.00
40.00
50.00
60.00
3.1 mm 2.6 mm 2.1 mm 1.6 mm
Po
we
r [k
W]
B3 Shallow
η fc
HL ht,C
HL exh
W,i,g
19.20 19.23 19.13 19.10
15.09 15.26 15.65 16.33
11.82 11.74 12.45 15.04 0.09 0.11 0.63
0.84
0.00
10.00
20.00
30.00
40.00
50.00
60.00
3.1 mm 2.6 mm 2.1 mm 1.6 mm
Po
wer
[kW
]
Washer [mm]
B4 Ramped
19.97 19.96 19.96 19.62
15.73 16.06 16.36 16.78
12.57 12.44 12.76 14.20 0.11 0.25 0.59 1.03
0.00
10.00
20.00
30.00
40.00
50.00
60.00
3.1 mm 2.6 mm 2.1 mm 1.6 mm
Po
wer
[kW
]
Washer [mm]
B5 Stepped
η fc
HL ht,C
HL exh
W,i,g

103
4.2 Conclusions of Protrusion Optimisation
Based upon the above analysis and discussion a washer was selected for each combustion
chamber. As demonstrated previously, there are trends and behaviours that occur with a
change in protrusion that are consistent across all of the bowls and some that are unique to
either the conventional or unconventional systems. A comparison of the sensitivity of each
bowl to injector protrusion has identified trends and behaviours that explain the behaviour
of each combustion system. The protrusion selections are summarised and presented in the
following Table 4.5.
Bowl Injector Selected washer
B2 - Narrow N1
3.1 mm
B3 - Shallow 3.1 mm
B4 - Ramped N4
3.1 mm
B5 - Stepped 2.6 mm
Table 4.5 Selected washers for each combustion system based on the protrusion results
The majority of the combustion systems are optimised with the 3.1 mm washer. That
includes conventional and unconventional combustion systems. The exception to this is
bowl B5, which optimises with the 2.6 mm washer. Optimising with the 3.1 mm washer to
benefit of Protrusion – 4000FL would have sacrificed a fuel consumption improvement of
approximately 1.6 % at Protrusion – KP3.
Discriminating between the first two protrusions is straight forward for the conventional
systems. The optimisation focuses on low isFC and smoke adding emphasis to the
distribution of the fuel spray that reduces the locally rich concentration of air to fuel ratio. It
appears that concentrating the fuel away from the piston bowl is beneficial for the
combustion process for Bowl B2 and B3.
Discriminating between the first protrusion step is harder for the unconventional bowls. At
protrusion – KP3 bowl B5 could optimise with the 2.1 mm washer with no discernible isFC
penalty. This is a change from the characteristic behaviour of the conventional bowls. The
response at Protrusion – 4000FL shows the isFC and smoke deteriorate with increasing
protrusion. Even though this is not a regulated emissions point, combustion performance
and engine integrity limits are a secondary requirement that have to be respected. The

104
selection of the 2.6 mm washer limited the range of SOIm timings that could be used before
the engine integrity limits were met.
One response that is consistent across all combustion systems at Protrusion – KP3 and
2000FL is that the injector can be ‘over protruded’; i.e. the thinnest washer performs the
worst regardless of piston bowl, test point and SOIm timing. However a difference in
behaviour between conventional and unconventional combustion systems can be seen at
Protrusion – 4000FL; fuel consumption deteriorates with an increase in protrusion for both
of the unconventional bowls whereas the relationship is more complicated for the
conventional combustion systems, showing no real trend across the range of SOIm timings
used. In general, when the spray targeting is at the lowest point of the interacting feature,
(piston bowl lip for the conventional bowl and mid-ramp pip for the unconventional system)
then the mixing process is sufficiently poor for this washer to be disregarded.
Spray targeting is essential for the ideal preparation of the air and fuel before the onset of
combustion at 2000 RPM. All of the bowls ‘guide’ the fuel changing its distribution and air
entrainment prior to the onset of combustion. This is to be expected from the literature
however the effect on combustion could not have been predicted, particularly as there is no
reference for the unconventional systems. Targeting the bowl lip and avoiding a downward
flow of the fuel into the bowl region is vital for the conventional systems. The impact of fuel
on the lip aids the fuel mixing process.
Spraying the fuel into the bowl region is also detrimental to the performance of the
unconventional systems bowls; additionally with these unconventional bowls an upper limit
can be observed. It is important to spray fuel onto the secondary pip in the right location.
The turnover in the response observed with B5 could be due to the negative effect of
spraying fuel into the squish regions, where temperatures and turbulence may be too low
for production oxidation and rapid combustion.
There is an additional geometric limit to the nozzle extraction; the spray impingement onto
the cylinder head for all bowls, which can lead to poor air entrainment. Cylinder head spray
impingement limits oxidation of any the combustion products (Park and Reitz, 2009). Spray
impingement with the cylinder head occurs as a result of the divergence of the fuel spray
cone.

105
Finally, the unconventional systems achieve the performance requirements at the higher
load conditions. As these combustion systems are experimental, there may have been a
point where the mixture formation process could have been compromised by a lack of
in-cylinder turbulence encouraged by the traditional re-entrant design suggested by
Middlemiss (1978). This is not the case, and even though the mixture formation strategy is
different between the conventional and unconventional systems, they both work
successfully over the range of engine conditions tested in the protrusion experiments.
Protrusion – KP3 is a medium load point where combustion temperatures are high enough
to enable the formation of particulate matter if the fuel and air are poorly mixed. Fuel needs
to be well distributed to avoid rich air-to-fuel ratios and thus avoid forming particulates. The
remaining points tested in the characterisation include two key points at lower load
(reduced fuelling), which are leaner overall compared to protrusion – KP3. This may have a
bearing on the protrusion optimisation. With increasing protrusion at protrusion - KP3 the
mixture became overly rich as the fuel was concentrated in the piston bowl region. If the
mixture were leaner (due to reduced fuelling), then it is possible that optimising the
protrusion with a thinner washer (increased protrusion) is optimal. This would help to avoid
poor combustion associated with overly lean combustion.
It is important to try and understand the impact of the protrusion optimisation at the
remaining key points. The optimisation has been carried out to achieve the greatest fuel
distribution at a medium load point. Selection of a relevant key point for protrusion
optimisation requires careful thought as to the available strategies for emissions reduction
in-cylinder (pilot injection, cooled EGR).

106
5 The Effect of Bowl Geometry on Combustion and Emissions
Once the protrusion testing was completed, the washer selection was fixed and the
characterisation of each bowl commenced. The characterisation process was used to
evaluate how the mixture formation demands were affected by bowl geometry at each test
condition. This chapter demonstrates the effect of bowl geometry on engine performance.
The comprehensive testing of each bowl in the characterisation consisted of carrying out
combined EGR and SOIm swings at part load and SOIm swings at full load. This testing was
carried out with standard flow (760 cm3/min) and high flow (860 cm3/min) injectors. Each
injector required a combined 56 test points (three part load and two full load conditions)
per bowl and each bowl was tested with 4 different injectors in order to comprehensively
test the response of the hardware. The conventional bowls were tested with N1-N3 and N8
and the unconventional bowls were tested with N4-N6 and N10.
Nozzle
Description
Actuator Post hone vol flow
Hole size
Holes Cone angle
k-factor
ID Type (cm3/min) mm - ° -
N0 Solenoid 770 0.131 7 155 2
N1
Piezo
760
0.131 7
155
2.5
N2 0.123 8
N3 0.116 9
N4 0.131 7
145 N5 0.123 8
N6 0.116 9
N15
860
0.141 7
155 N7 0.131 8
N8 0.123 9
N16 0.141 7
145 N9 0.131 8
N10 0.123 9
N11 760
0.131 7 155
1.5 N12 0.123 8
N13 760
0.131 7 145
N14 0.123 8

107
5.1 Experimental results
All of the following results were generated with the piezo injectors, for the conventional
bowls the 7 holes nozzle N1, was used and for the unconventional bowls nozzle the 7 holes
nozzle, N4 was used. The part load tests were EGR swings, with four EGR conditions, which
started at zero and went to a lower limit of isNOx. At each EGR level a timing swing was
tested as an additional measure of the engine response. Figure 5.1 illustrates the timing
swing and EGR swing; the points show the timing swing, the furthest right being the most
advanced SOIm. The different sets of points show the different EGR rates tested. The part
load tests show the complete EGR swing with emphasis at the lower end of the isNOx
emissions.
Figure 5.1 Illustration of the EGR and timing swings carried out at the part load keypoints.
Illustration shows the first and second EGR conditions out of the four tested for illustration
purposes
As a comparison, data from a Euro VI (Eu6) calibration of a vehicle using a 0.5 litre/cylinder
(provided by Ricardo) is plotted on the zoomed in charts as a pale blue star (*). This is used
to compare the performance of the unconventional systems to current production
combustion system configurations.
180
185
190
195
200
2 4 6 8 10 12 14 16 18 20
isFC
[g/
(kW
.h)]
isNOx [g/(kW.h)]
B2 - Narrow N1 B3 - Shallow N1 B4 - Ramped N4 B5 - Stepped N4
EGR increases
Zero EGR
Timing retards

108
Additionally this section includes a heat release calculation from the measured cylinder
pressure data. The calculation itself was carried out as follows:
( ( ) ( ))
( )
Where is the ratio of specific heats at constant pressure and volume, is the cylinder
pressure, is the cylinder volume and is the crank angle. The subscript attached to each
value is the value at the current crank angle. The value of used was 1.37 and the crank
angle difference was 0.5 °.

109
5.1.1 KP3 Characterisation Test
Table 5.1 shows the test settings that were used for the KP3 test. Intake pressure, load
(GIMEP), speed and fuel pressure were maintained at constant values in these tests in order
to determine the performance of each bowl to EGR and SOIm. As the fuelling was adjusted
to meet the load target the Air—to-Fuel Ratio (AFR) varied so nominal values are indicated
in the table.
Test point
Speed GIMEP Intake
pressure
EGR tem
p
Intake temp
Exhaust pressure
EGR % AFR Rail
pressure SOIm
- RPM bar barA °C °C barA % - bar °ATDC
KP3 test 2000 9.00 1.47
31 33 2.57 0 28.8
1050 -9,-7,-5,-3
63 37 2.15 18 23.4
70 42 1.92 26 20.0
72 44 1.85 30 18.8
Table 5.1 KP3 test settings
Intake temperature varied due to the mixing of EGR with the air in the inlet. The Exhaust
pressure dropped because the EGR back pressure valve was fixed for all tests whilst the EGR
was regulated with a throttle located near the inlet plenum. AFR varied because EGR was
effectively a thermal throttle that displaced air in the inlet when the manifold pressure
remained constant.
Figure 5.2 KP3 test EGR swing showing all 4 EGR conditions tested
180
185
190
195
200
205
210
0 2 4 6 8 10 12 14 16 18
isFC
[g/
(kW
.h)]
isNOx [g/(kW.h)]
B2 - Narrow N1 B3 - Shallow N1 B4 - Ramped N4 B5 - Stepped N4

110
Figure 5.2 shows that the unconventional bowls have lower isFC than the conventional
bowls. B5 has the lowest overall isFC values for the EGR swing. At zero EGR (furthest right
lines) and the most advanced SOIm timing (furthest right point), B5 is better than B2, B3 and
B4 by 2.2 %, 4.3 % and 1.6 % respectively. At the same SOIm timing, isNOx levels are higher
in general for the unconventional bowls.
This trend is the same at the higher levels of EGR as shown in Figure 5.3, although the isNOx
emission is higher for the unconventional bowls. When retarding the combustion for the
unconventional bowl to achieve equivalent isNOx (0.5 g/kWh), there is little difference
between the fuel consumption values. B5 has the lowest value (192 g/kWh) and B2, B3 and
B4 are 1.3 %, 2.5 % and 0.5 % higher. A retarded injection event results in lower efficiency,
which reduces the fuel consumption benefit of the unconventional bowls. Alternative
strategies would be required to reduce isNOx without penalising the fuel consumption. All
bowls tested have better isFC than the Eu6 reference data (pale blue * on the graphs).
Bowl B5 has the best smoke performance. Even when the SOIm was retarded to the same
leve of isNOx (0.5 g/kWh) the smoke number (0.54 FSN) is still better than all other bowls
and the Eu6 comparison. Bowls B3 and B5 are comparable with a value of around 0.77 FSN,
however bowl B4 deteriorates with a timing retard to 1.58 FSN at an isNOx value of
0.27 g/kWh. The smoke emission for bowl B2 is less sensitive to a timing retard, only
increasing from 1.05 FSN to 1.22 FSN, however the initial smoke emission is higher.

111
Figure 5.3 KP3 test data at 30 % EGR
180
185
190
195
200
205
210
215
0 0.5 1
isFC
[g/
(kW
.h)]
isNOx [g/kWh]
0
0.2
0.4
0.6
0.8
1
1.2
1.4
1.6
1.8
0 0.5 1
Smo
ke [
FSN
]
isNOx [g/kWh]
0
0.2
0.4
0.6
0.8
1
1.2
1.4
1.6
0 0.5 1
isH
C [
g/(k
W.h
)]
isNOx [g/kWh]
0.0
1.0
2.0
3.0
4.0
5.0
6.0
7.0
8.0
0 0.5 1
isC
O [
g/(k
W.h
)]
isNOx [g/kWh]
35
40
45
50
55
60
0 0.5 1
90
% a
ngl
e [d
eg]
isNOx [g/(kW.h)]

112
isCO and isHC are generally comparable for all bowls however with the increase in isNOx
emission associated with the unconventional bowls the emissions curves are better for the
conventional designs. Comparing the bowls at the equivalent isNOx emission (0.5 g/kWh)
bowl B2 has isHC emissions of 0.25 g/kWh and B3, B4 and B5 are 0.26 g/kWh, 0.33 g/kWh
and 0.3 g/kWh respectively. In terms of isHC all bowls are better than the Eu6 reference.
The energy balance analysis helps to identify factors contributing to the bowl differences in
performance. As Figure 5.4 shows, the indicated work is comparable for all bowls
(7.48±0.06 kW and 9±0.05 bar GIMEP). Apart from B5 all of the exhaust heat rejection
results are in the same range. This is due to the exhaust temperature being the lowest
(434 °C) for bowl B5. The different heat rejection rates between the unconventional designs
may be due to the differences in the in-cylinder flow regimes created due to the pip design
and different toroidal radius.
Figure 5.4 Fuel energy distribution identifying the areas affected by a change in bowl design.
All bowls optimised washer, SOIm -9 °ATDC
The lower exhaust heat rejection shown in Figure 5.4 indicates a more rapid combustion
process for B5. Looking at the apparent net heat release rate in Figure 5.5 shows that
ignition for the unconventional bowls occurs sooner (0.8 °) after the end of the injection
event than the conventional bowls. The highly premixed combustion has a long tail, which is
similar for all bowls. The shorter ignition delay advances the combustion without making it
more diffusive, which allows the combustion event to complete sooner.
7.52 7.48 7.49 7.46
6.24 6.27 6.26 6.03
3.30 3.32 2.95 2.98
0.05 0.06 0.05 0.05
0.00
2.00
4.00
6.00
8.00
10.00
12.00
14.00
16.00
18.00
B2 - Narrow B3 - Shallow B4 - Ramped B5 - Stepped
Po
we
r [k
W]
Bowl
W,i,g HL exh HL ht,C η fc

113
Figure 5.5 Apparent net heat release rate profiles for all of the bowls tested. KP3, 30 % EGR
SOIm -9°ATDC
There is another difference between the conventional and the unconventional bowls at the
most advanced SOIm timing. Looking again at Figure 5.4 the heat transfer and crevice losses
are 10 % lower for the unconventional bowls. This is consistent with the behaviour observed
in the protrusion experiments. This could be due to the lower surface area to volume ratio
of the unconventional bowls as well as the differences in the in-cylinder turbulence, which
both affect convective heat transfer losses.
Although the isNOx is higher for the unconventional bowls at this combustion phasing
(-9°ATDC), as the EGR is increased the unconventional bowls achieve lower values of isFC,
demonstrating an improved tolerance to EGR and indicating better pre-combustion mixing
than the conventional bowls.
-0.05
0
0.05
0.1
0.15
0.2
0.25
-10 0 10 20 30 40
aHR
R [
kJ/C
AD
]
CAD [°ATDC]
B2 B3 B4 B5 Injection schematic

114
The difference in isNOx level indicates that the fuel air mixture is closer to a stoichiometric
value in the unconventional designs before the onset of combustion. For the conventional
toroidal designs the fuel is sprayed into the bowl and mixed to a rich equivalence ratio
before combustion, resulting in less isNOx. Rich emissions formation is offset by oxidation
due to the highly turbulent flow in the piston bowl. This approach relies on available oxygen
concentration, temperature and turbulence for product oxidation. When increasing EGR to
the levels required to meet proposed isNOx emissions standards, peak combustion
temperature and oxygen concentration can be relatively low, which hinders the oxidation
process.
The unconventional bowls are different because the turbulence created within the fuel
spray interaction with the secondary pip entrains more air into the fuel spray. Even though
there may be less turbulence induced in the bowl from squish flow, and toroidal supported
swirl, it is not essential to achieve clean combustion because fewer products of incomplete
combustion are formed. This is the strategy that the advanced combustion modes seemed
to achieve; reducing particulates by balancing the trade-off between emissions formation
and oxidation.

115
5.1.2 KP2 Characterisation Test
Table 5.2 shows the test settings used at KP2. Only the EGR rate and the SOIm were varied.
Fuelling was adjusted to meet the load (GIMEP) target as the SOIm and EGR were varied.
This key point differed from KP3 in both speed and load. The combustion phasing changed,
requiring different SOIm to be used. The Rail pressure selected was lower than KP3 and this
was chosen to be representative of current production engines operating at this key point.
Test point
Speed GIMEP Intake
pressure EGR
temp Intake temp
Exhaust pressure
EGR % AFR Rail
pressure SOIm
RPM bar barA °C °C barA % - bar °ATDC
KP2 test
1500 6.00 1.16
30 32 1.55 0 30.3
800 -10,-8, -6,-4
58 37 1.33 22 22.7
64 40 1.26 30 19.5
66 41 1.24 33 18.8
Table 5.2 KP2 test settings used in the characterisation
Figure 5.6 shows the complete EGR swing for KP2. As with KP3, the unconventional bowls
perform the best in terms of isFC. This trend diminishes as the EGR level increases for all
bowls. Looking in more detail at isNOx<1.5 g/kWh in Figure 5.7 shows how all of the bowls
compare against each other and the reference bowl at 33 % EGR.
Figure 5.6 KP2 test EGR swing
190
195
200
205
210
215
220
225
230
0 5 10 15 20 25
isFC
[g/
kWh
]
isNOx [g/kWh]
B2 - Narrow N1 B3 - Shallow N1 B4 - Ramped N4 B5 - Stepped N4

116
Figure 5.7 KP2 test 33 % EGR
200
205
210
215
220
225
230
0 0.5 1 1.5
isFC
[g/
(kW
.h)]
isNOx [g/(kW.h)]
15
17
19
21
23
25
0 0.5 1 1.5
AFR
[kg
/kg]
isNOx [g/(kW.h)]
0
0.1
0.2
0.3
0.4
0.5
0 0.5 1 1.5
Smo
ke [
FSN
]
isNOx [g/(kW.h)]
0
1
2
3
4
5
0 0.5 1 1.5
isH
C [
g/(k
W.h
)]
isNOx [g/(kW.h)]
0
2
4
6
8
10
12
14
0 0.5 1 1.5
isC
O [
g/(k
W.h
)]
isNOx [g/(kW.h)]
0
5
10
15
20
0 0.5 1 1.5
50
% a
ngl
e [d
eg]
isNOx [g/(kW.h)]

117
Figure 5.7 shows the results of testing with the highest EGR rate (For all bowls: Average
EGR=33 %, CoV on average EGR rate=0.6 %). There is little difference between bowls in
terms of isFC. Bowl B3 has the highest initial isFC of 212 g/kWh at the most advanced
timing. The response of B3 to a timing retard is relatively flat, varying less than 0.5 % up
until the most retarded SOIm of -4°ATDC where isNOx is as low as 0.2 g/kWh and isFC
increases by 5 % to 223 g/kWh. In comparison B5 is least sensitive to a retard in timing, only
increasing by 2 g/kWh, which is around 1 % of the initial value. As with KP3, the isNOx is
higher for the unconventional bowls. Bowl B5 has to be at the most retarded setting to
achieve an isNOx of 0.46 g/kWh. Bowl B2 was not able to sustain combustion at the most
retarded timing (-4°ATDC) hence only three points were logged. At this high EGR and low
AFR condition bowl B2 is able to achieve the lowest isNOx level at the advanced SOIm
of -10°ATDC.
At this condition few particulates are formed (the smoke number was below 0.05 FSN for all
test points) and so only the isCO and isHC can be used as indicators of poor combustion.
Even at an AFR of around 19; the highest particulate measured is 0.04 FSN for bowl B2 at
isNOx 0.32 g/kWh. Smoke number improves for all bowls versus Eu6 data but there is a
penalty on isCO, the Eu6 reference point having 2.67 g/kWh and the best performing bowls,
B3 and B4, having around 6.2 g/kWh. Eu6 has higher AFR than all of the bowls tested, which
would result in better fuel consumption and isCO. As a result of the higher AFR, a higher
EGR rate (36 %) had to be used to achieve the same isNOx levels.
Due to the similarity in isFC at 33 % EGR, there is little difference in the energy distribution
between conventional and unconventional systems. The energy balance in Figure 5.8 shows
that there is no real trend for the behaviour between each piston bowl. The load target was
met in each case and the best performing bowl in terms of heat rejection through the
exhaust is bowl B5. The fuel conversion efficiency is comparable for all of the bowl designs
(0.16 kW loss for B2 and 0.14 kW for B4/B5).

118
Figure 5.8 SOIm -10°ATDC, EGR 33 %
In order to understand why the smoke emission was so low at this key the combustion heat
release rate for all bowls was examined. Figure 5.9 shows the aHRRnet for all bowls at KP2.
The injection schematic is based upon a typical injection duration (550-580 μs) required to
meet the load condition in these tests.
3.76 3.75 3.77 3.75
3.25 3.23 3.30 3.14
1.99 2.22 1.95 1.99
0.16 0.15 0.14 0.14
0.00
2.00
4.00
6.00
8.00
10.00
B2 - Narrow B3 - Shallow B4 - Ramped B5 - Stepped
Po
wer
[kW
]
Configuration
W,i,g HL exh HL ht,C η fc

119
Figure 5.9 Apparent net heat release rate at KP2 30 % EGR, SOIm -10°ATDC.
Two lines are added to the figure to represent the approximate location of the low
temperature heat release (LTHR) and high temperature heat release (HTHR). The LTHR is a
small combustion rise prior to combustion of the majority of the fuel. The HTHR is the
combustion of the remainder of the injected fuel. These regions are typical of premixed low
temperature combustion (Dec, 2009), which can explain the low smoke output, even at this
relatively high load of 6 bar GIMEP.
The ignition delay before the LTHR was approximately 4°, which at this speed represented
approximately 444 μs. This is about 80 % of the injection duration, which is a significant
period of time for the fuel spray to penetrate through the combustion chamber, evaporate
and entrain air. A long period of time for the fuel and air to mix after the end of injection is
beneficial to limiting the formation of particulates.
-0.05
0
0.05
0.1
0.15
0.2
0.25
-15 -10 -5 0 5 10 15 20
aHR
R [
kJ/°
]
CAD [°ATDC]
B2 B3 B4 B5 Inj dur
Fuel evaporation
HTHR
LTHR

120
The unconventional bowls have a shorter ignition delay for the HTHR of around 8° (≈890 μs).
B5 has the shortest delay between the end of injection and the peak of the heat release
rate. The combustion of the conventional bowls is 1° more retarded than the
unconventional bowls. A more retarded combustion event, due to the ignition delay,
explains the differences between the isNOx levels seen in Figure 5.7. The ignition delay
differences are greater than observed at KP3.
The protrusion optimisation demonstrated that fuel consumption and smoke improved by
reducing the proportion of fuel entering the piston bowl at KP3. KP2 has benefitted from
this optimisation because fuel rich regions that would have formed particulates have been
avoided. The load is still high enough at this key point to avoid the fuel spray becoming too
lean and producing high isCO and isHC emissions.

121
5.1.3 KP1 Characterisation Test
Table 5.3 shows the test conditions used at KP1. As with the previous test conditions the
fuelling was adjusted to maintain the load target as the SOIm varied. All the other
parameters were fixed for these tests and the AFR shown was the nominal value at each
EGR level. This was the lowest load key point in the characterisation test programme. The
rail pressure used was lower than the previous tests and was based upon representative
pressures used in current production engines.
Test point
Speed GIMEP Intake
pressure Intake temp
Exhaust pressure
EGR % AFR Rail
pressure SOIm
RPM bar barA °C barA % - bar °ATDC
KP1 test
1500 3.00 1.03
32 1.41 0 50.1
600 -10,-9, -8,-7 50 1.22 22 34.6
63 1.19 28 30.8
70 1.14 39 24.5
Table 5.3 KP1 test settings used in the characterisation
Figure 5.10 shows the complete EGR swing from the testing at KP1. This is where the largest
differences are seen between the conventional and unconventional combustion systems.
Figure 5.10 KP1 EGR swing
200
210
220
230
240
250
260
270
0 2 4 6 8 10 12 14 16
isFC
[g/
kWh
]
isNOx [g/kWh]
B2 - Narrow N1 B3 - Shallow N1 B4 - Ramped N4 B5 - Stepped N4

122
Figure 5.11 KP1 test results at 40 % EGR
200
210
220
230
240
250
260
270
280
0 0.5 1 1.5 2
isFC
[g/
(kW
.h)]
isNOx [g/(kW.h)]
0
0.1
0.2
0.3
0.4
0.5
0.6
0.7
0.8
0 0.5 1 1.5 2
Smo
ke [
FSN
]
isNOx [g/(kW.h)]
0
5
10
15
20
25
0 0.5 1 1.5 2
isH
C [
g/(k
W.h
)]
isNOx [g/(kW.h)]
0
5
10
15
20
25
30
35
40
0 0.5 1 1.5 2
isC
O [
g/(k
W.h
)]
isNOx [g/(kW.h)]
14
16
18
20
22
24
26
28
30
0 0.5 1 1.5 2
AFR
[kg
/kg]
isNOx [g/(kW.h)]
0
2
4
6
8
10
12
14
0 1 2
50
% a
ngl
e [d
eg]
isNOx [g/(kW.h)]

123
Figure 5.11 shows the test results for this key point. The isNOx level is higher for the
unconventional designs compared to the conventional designs for the same SOIm. When
the same SOIm is used (-10°ATDC) the isFC for the unconventional bowls is approximately
10 % better than the conventional designs. With the same manifold conditions (hence
similar air mass flow rates into the engine), less fuel is required to meet the load target thus
the AFR is higher for the unconventional designs (27-28 AFR compared to 22-24 AFR). The
Eu6 reference data has a higher AFR than the conventional designs but still achieves lower
isNOx (0.38 g/kWh) than that measured by any bowl. The Eu6 data uses different test
settings; importantly it uses a higher manifold pressure, which allows more charge flow
(air+EGR) through the engine. The airflow is higher to maintain the AFR (26 AFR) and the
EGR rate is higher (45 %) to reduce the isNOx. Overall the charge mass flow (air flow plus
EGR flow) is higher for the Eu6 data (25.17 kg/h) compared to the test settings used in the
characterisation (average flow 19.48 kg/h ±0.36 kg/h). Maintaining the AFR is key to good
isFC, but detrimental to the isNOx output. The EU6 data suggests that an alternative inlet
manifold condition could enable a simultaneous reduction in isNOx and isFC.
The emissions output for all of the bowls tested show similar tendencies to those observed
at KP2. It is not possible to detect any smoke for either of the conventional or
unconventional designs. From observation of the exhaust flow out of the exhaust pipe, the
exhaust gas appearance was white, indicating moisture content and unburned fuel
constituents. The Eu6 reference data has a smoke number of 0.7 FSN, showing a significant
difference in the combustion behaviour from the bowls tested. This different combustion
behaviour is reflected in the emission of isHC and isCO, which are significantly higher than
the reference data. At the most advanced SOIm of -10°ATDC the unconventional bowls have
the best isHC output of all bowls, of around 4.7 g/kWh, which deteriorates as the SOIm is
retarded. This is 73 % higher than the reference data which has an isHC output of
1.27 g/kWh. Additionally, the isCO emissions are higher than the reference data for all
bowls. Bowl B5 has the best output of 17.5 g/kWh which is 68 % higher than the reference
data (5.48 g/kWh).
When the emissions of isCO and isHC are high relative to the smoke output at part load
conditions, an assumption can be made that the fuel spray has typically become lean before
combustion initiates (Ochoterena and Andersson, 2008). The load target in this test

124
condition is the lowest of the three part load conditions tested. The cylinder gas density is
also low as a result of the low intake manifold pressure (1.03 barA). Cylinder gas density
affects fuel spray penetration, the lower the cylinder gas density, the greater the fuel
penetration (Karimi, 2007). The protrusion optimisation helps with fuel distribution at the
key points when the load is high. However, when the load reduces this is detrimental to the
combustion performance as can be seen in the energy balance in Figure 5.12.
Figure 5.12 Fuel energy distribution identifying the areas affected by a change in bowl
design. All bowls optimised washer, SOIm -10°ATDC
The differences between the conventional and unconventional bowls are significant at this
test point. The biggest difference is with the heat transfer and crevice losses and the
combustion loss. The combined loss of these two areas is highest for bowl B3 (1.76 kW),
which is only just higher than bowl B2 by 0.1 kW. Bowl B5 is the best performing bowl with
the lowest loss of 1.26 kW. This shows that the unconventional bowls are able to convert
the fuel into heat more efficiently than the conventional bowls and lose less energy through
heat transfer and crevice losses.
The maximum EGR used was highest at KP1, compared to the other test points. As a result
ignition delay was the longest. The gas temperature calculated at TDC is within the same
range as observed at KP2 (920-970 °K), although lower than that observed at KP3 (1000 °K).
1.90 1.87 1.86 1.86
1.89 1.91 1.83 1.83
1.33 1.39 1.14 1.05
0.42 0.37 0.25 0.21
0.00
1.00
2.00
3.00
4.00
5.00
6.00
B2 - Narrow B3 - Shallow B4 - Ramped B5 - Stepped
Po
wer
[kW
]
Bowl
W,i,g HL exh HL ht,C η fc

125
Figure 5.13 Apparent net heat release rate for all bowls at KP1. SOIm -10°ATDC
As observed at KP2, the unconventional bowls have the shortest ignition delay for the HTHR
as shown in Figure 5.13. Bowl B5 has an ignition delay of 7.8° compared to bowl B2 and B3
of 9.8°. This 2° difference at the same SOIm helps to explain why the isNOx is higher for the
unconventional designs. The long ignition delay also allows more time for fuel and air mixing
before combustion begins. As a result the formation of particulates may be negated, by
reducing the rich regions of fuel and air. Additionally, the lower load results in lower peak
temperatures, which also helps to avoid the formation of particulates. The downside to this
is that the products of lean and low temperature combustion, isCO and isHC, increase.
The difference in the conventional and unconventional bowls could be due to the fact that
the wider unconventional bowls contains more of the fuel and air mixture than the
conventional bowls. The presence of more rich regions in the unconventional bowl is
beneficial for combustion by ensuring the mixture is not too lean, when the overall AFR is
high at low load. If the protrusion washer increased the protrusion (say with a 2.1mm
-0.02
0
0.02
0.04
0.06
0.08
0.1
-20 -15 -10 -5 0 5 10 15 20
aHR
R [
kJ/C
AD
]
CAD [°ATDC]
B2 B3 B4 B5 Inj dur
HTHR

126
washer) for the conventional bowls, thus focussing fuel spray into the bowl, this may have
improved the combustion speed (reduced ignition delay) by concentrating an ignitable
mixture in the bowl region.
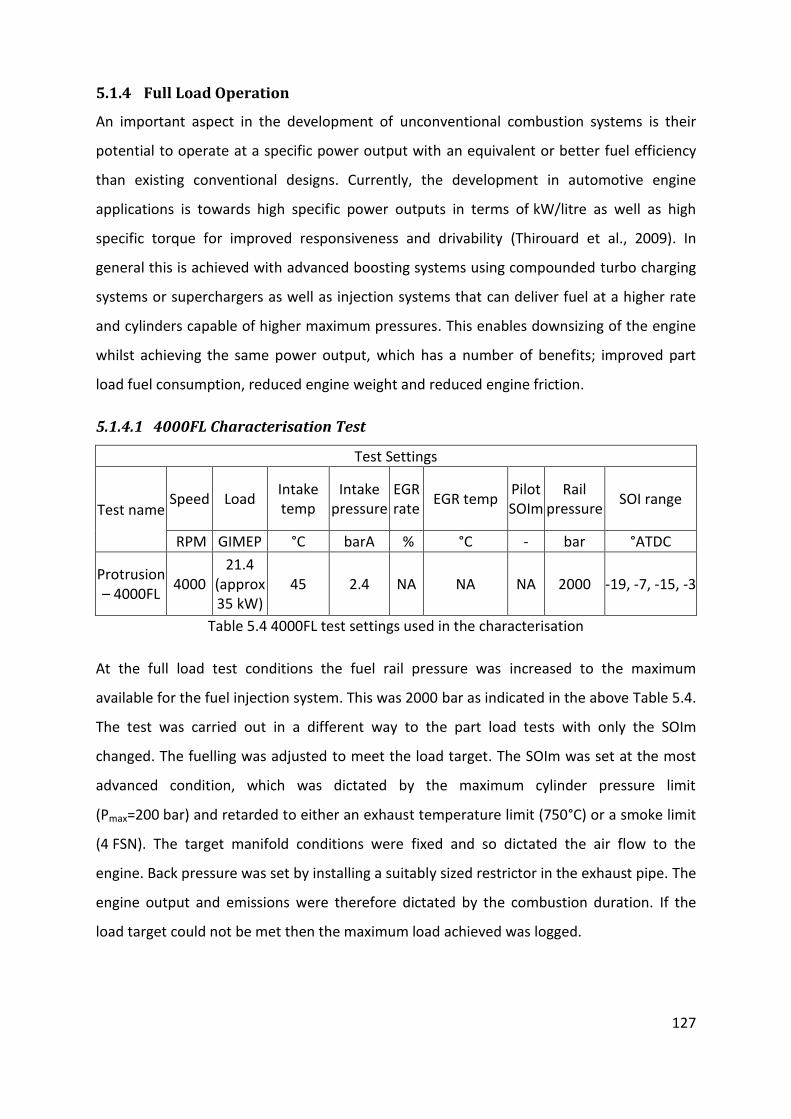
127
5.1.4 Full Load Operation
An important aspect in the development of unconventional combustion systems is their
potential to operate at a specific power output with an equivalent or better fuel efficiency
than existing conventional designs. Currently, the development in automotive engine
applications is towards high specific power outputs in terms of kW/litre as well as high
specific torque for improved responsiveness and drivability (Thirouard et al., 2009). In
general this is achieved with advanced boosting systems using compounded turbo charging
systems or superchargers as well as injection systems that can deliver fuel at a higher rate
and cylinders capable of higher maximum pressures. This enables downsizing of the engine
whilst achieving the same power output, which has a number of benefits; improved part
load fuel consumption, reduced engine weight and reduced engine friction.
5.1.4.1 4000FL Characterisation Test
Test Settings
Test name Speed Load
Intake temp
Intake pressure
EGR rate
EGR temp Pilot SOIm
Rail pressure
SOI range
RPM GIMEP °C barA % °C - bar °ATDC
Protrusion – 4000FL
4000 21.4
(approx 35 kW)
45 2.4 NA NA NA 2000 -19, -7, -15, -3
Table 5.4 4000FL test settings used in the characterisation
At the full load test conditions the fuel rail pressure was increased to the maximum
available for the fuel injection system. This was 2000 bar as indicated in the above Table 5.4.
The test was carried out in a different way to the part load tests with only the SOIm
changed. The fuelling was adjusted to meet the load target. The SOIm was set at the most
advanced condition, which was dictated by the maximum cylinder pressure limit
(Pmax=200 bar) and retarded to either an exhaust temperature limit (750°C) or a smoke limit
(4 FSN). The target manifold conditions were fixed and so dictated the air flow to the
engine. Back pressure was set by installing a suitably sized restrictor in the exhaust pipe. The
engine output and emissions were therefore dictated by the combustion duration. If the
load target could not be met then the maximum load achieved was logged.

128
Figure 5.14 Full load test results at 4000FL
185
190
195
200
205
-20 -15 -10
ISFC
[g/
(kW
.h)]
SOIm [°ATDC]
0
0.5
1
1.5
2
2.5
3
-20 -15 -10
Smo
ke [
FSN
]
SOIm [°ATDC]
0
2
4
6
8
10
-20 -15 -10
isC
O [
g/(k
W.h
)]
SOIm [°ATDC]
18
18.5
19
19.5
20
20.5
21
-20 -15 -10
AFR
[kg
/kg]
SOIm [°ATDC]
120
125
130
135
140
145
150
-20 -15 -10
Air
flo
w [
kg/h
]
SOIm [°ATDC]
21.1
21.3
21.5
21.7
-20 -15 -10
GIM
EP [
bar
]
SOIm [°ATDC]
45
50
55
60
65
-20 -15 -10
90
% a
ngl
e [d
eg]
SOIm [°ATDC]

129
Figure 5.14 shows bowl B5 performed poorly at this condition and as a result the target load
could only be achieved at 2 SOIm points. It was only possible to achieve an average load of
21.25 bar for the two points logged. The AFR differences observed between the bowls are a
result of the different fuelling required to meet the load target for all but bowl B4. Airflow
for bowl B4 (136.6 kg/h) is marginally higher than the other bowls tested (all bowls average
134.22 kg/h). The difference in air flow means that for the same fuel flow at the most
advanced SOIm for B4 (6.67 kg/h) the AFR differs by 0.36 (AFR 20.5 with 136.6 kg/h, AFR
20.14 with 134.2 kg/h). This moderate difference may have an influence on the combustion
behaviour of the bowl. The higher airflow may affect the isFC, smoke and isCO, bringing
bowl B4 closer to the conventional bowls.
Smoke and isCO indicate that bowl B5 is the worst in terms of mixing the air and fuel prior
to and during combustion. At the most advanced SOIm bowl B5 has the highest smoke
output (2.46 FSN) and bowl B4 the lowest (0.44 FSN) which represents a significant
difference in combustion behaviour. The combustion behaviour can be characterised by the
plot of 90 % burn angle which shows that for both B2 and B4 combustion terminates sooner
than bowl B3 and B5. This also explains the differences observed in isFC between both sets
of bowls because combustion occurs more rapidly for bowls B2 and B4.
At this full load key point the unconventional bowl B4 performs well in terms of achieving
the load target with a low isFC and low smoke and number. It performs as well as
conventional bowl B2 and outperforms bowl B5 making it the best performing bowl at this
condition.

130
5.1.4.2 2000FL Characterisation Test
Test Settings
Test name Speed Load
Intake temp
Intake pressure
EGR rate
EGR temp
Pilot SOIm
Rail pressure
SOI range
RPM GIMEP °C barA % °C - bar °ATDC
Protrusion – 2000FL
2000 24 50 2.4 NA NA NA 2000 -8, -6, -4, -2
Table 5.5 2000FL test settings used in the characterisation
As with 4000FL, the fuel rail pressure was increased to the maximum available for the fuel
injection system. This was 2000 bar as indicated in the above Table 5.5. The SOIm was set at
the most advanced condition, which was dictated by the maximum cylinder pressure limit
(Pmax=200 bar) and retarded to either an exhaust temperature limit (750 °C) or a smoke limit
(4 FSN). If the load target could not be met then the maximum load achieved was logged.
The load target was met for all bowls as indicated in Figure 5.15. The resulting isFC shows
that all bowls performed in a similar manner. Bowl B5 achieves the lowest isFC at a SOIm
of -6°ATDC of 197.9 g/kWh, B4 is 197.7 g/kWh. At the same SOIm the isFC for bowl B3 is
1.2 % worse. With the most retarded SOIm the isFC for all bowls deteriorates, with bowl B5
having the worst isFC (203.8 g/kWh). The smoke emission follows this behaviour when the
SOIm is retarded for all bowls but B4, which improves from 0.53 FSN at the most advanced
timing to 0.4 FSN at the most retarded timing. Both of the conventional bowls have lower
smoke emission than the unconventional bowls for all SOIm timings used.
Bowl B4 at this test condition has the lowest isFC across the range of SOIm timings used,
lower than both conventional designs. The smoke number is highest at all but the most
retarded timings, where the conventional bowls outperform the unconventional bowls.

131
Figure 5.15 Full load test results at 2000FL
196
197
198
199
200
201
202
203
204
205
206
-10 -5 0
isFC
[g/
(kW
.h)]
SOIm [°ATDC]
0
0.1
0.2
0.3
0.4
0.5
0.6
0.7
-10 -5 0
Smo
ke [
FSN
]
SOIm [°ATDC]
0
1
2
3
4
5
6
7
-10 -5 0
isC
O [
g/(k
W.h
)]
SOIm [°ATDC]
23.8
23.9
24.0
24.1
24.2
-10 -5 0
GIM
EP [
bar
]
SOIm [°ATDC]

132
5.2 Optimised Bowl Selection
Based upon the characterisation of all bowls at the part load and full load conditions the
best bowl was selected for further testing. The objective of this further testing was to
investigate the response of the selected bowl to multiple injections. In addition it was hoped
that an improved understanding of the fundamental factors affecting the combustion
process in this system would assist in the development of strategies to simultaneously
reduce fuel consumption and emissions.
Each bowl was scored for suitability from 1 to 4 at each one of the key points and a decision
matrix was formed for the selection. The highest scoring bowl was selected. At the part load
condition the criteria for the selection of the best bowl was based on of fuel consumption
and regulated emissions. At the full load condition it was based upon whether the load
target was achieved and the absolute value of fuel consumption.
Scoring each bowl for each parameter at each test point proved a challenge. Due to the
complex nature of the response to a change of injection timing each parameter had to be
judged by more than one consideration. When examining the response of each bowl for
each of the regulated emissions the order of consideration used was first by the lowest
absolute value and then the response to the change in SOIm of each bowl.
The following schematics in Figure 5.16 represent two examples of different responses that
occurred and had to be judged in the bowl selection process. The y axis is the parameter
being assessed.
Example (a) shows that the triangle series has the lowest absolute value and that the trend
is for the value to increase with a retard in SOIm. The circle series improves its absolute
value with a retard in SOIm however the overall result is that the triangle series is lower at
all conditions. Therefore the triangle scores the highest.
Example (b) shows the circle series has the lowest absolute value. This is marginally lower
than the triangle series, but none the less lower. The response to a retard in SOIm is a rapid
increase of the parameter, beyond that of the triangle series. The triangle series is less
sensitive to a retard in SOIm and is the same or lower than the second circle point for all

133
timings. In this case the triangle series would score the highest due to the lower sensitivity
of the bowl to a variation in SOIm.
Figure 5.16 Schematics representing the variation in response of two different bowls. (a) is
on the left, (b) is on the right.
Additionally, in cases where all of the bowls performed similarly or the difference was close
to the uncertainty of the parameter (achieving the load target at the full load condition for
example), all bowls were scored the same. When no smoke was detected at KP1 and KP2 all
bowls were scored 4. The part load conditions were weighted in terms of importance by
doubling the score. A 2 times factor was selected because it adequately represented the
importance (in terms of normal vehicle use) of the regulated emissions without
overemphasising them. The results can be seen in Table 5.6.
The first thing to note is that bowl B5 has the best performance at part load scoring 92 out
of a possible 120 points. B4 is second with 84 and then the conventional bowl B2 with 76
and B3 last with 72. Bowl B5’s strength is the fuel consumption performance; however this
is achieved with consistently the highest isNOx output at all test points. The trend for the
conventional bowls is that although the fuel consumption was consistently the worst across
all bowls, the isNOx level measured was lower than the unconventional bowls. At KP1 and
KP2 the conventional bowls are consistently the worst with CO and THC, which offsets the
performance of the low isNOx output.
Lowest absolute value
Significant deterioration with SOI
m retard
SOIm
retard
Lowest absolute value
Improvement with SOIm
retard,
highest absolute value
SOIm
retard x
y
x
y

134
KP1 KP2 KP3 2000FL 4000FL Results
Bo
wl
NO
x
isFC
CO
THC
Smo
ke
NO
x
isFC
CO
THC
Smo
ke
NO
x
isFC
CO
THC
Smo
ke
GIM
EP
isFC
Smo
ke
CO
GIM
EP
isFC
Smo
ke
CO
PL
wei
ghte
d x
2
FL w
eigh
ted
x1
Wei
ghte
d t
ota
l
B2 4 1 1 1 4 4 2 1 2 4 3 2 4 4 1 4 2 3 3 2 3 3 4 76 24 100
B3 3 2 2 2 4 3 1 2 1 4 4 1 2 3 2 4 1 4 2 3 2 2 3 72 21 93
B4 2 3 3 4 4 2 3 4 3 4 2 3 1 1 3 4 4 1 4 4 4 4 2 84 27 111
B5 1 4 4 3 4 1 4 3 4 4 1 4 3 2 4 4 3 2 1 1 1 1 1 92 14 106
Table 5.6 Selection matrix for the best performing bowl across all conditions tested in the characterisation.

135
The full load testing is where B5 struggles for performance scoring 14 out of 32. 4000FL is
particularly bad as B5 struggles to meet the load target and performs the worst with the
indicators of poor combustion (smoke and CO). B4 on the other hand scores the highest for
the full load operation with 27 out of 32. The two conventional bowls perform well, which is
to be expected with proven designs.
Overall, bowl B4 performs the best scoring 111 out of a possible 152. Bowls B5 is second, B2
third and bowl B3 is the worst bowl overall. If bowl B5 were to be optimised with the
3.1 mm washer to improve performance at the full load conditions (performance at full load
improved with the 3.1 mm washer), the part load fuel consumption benefit would be lost
and the isNOx emission would increase (refer to the protrusion test response in Chapter
3.7). Since KP1 and KP2 were not part of the protrusion evaluation tests, it is not possible to
state whether the behaviour at KP3 would extend to these conditions. The bowl’s
performance may deteriorate at KP1 to a similar level as the conventional bowls, which
when optimised with the 3.1 mm washer for low smoke and fuel consumption at KP3, suffer
with excessive CO and HC and high fuel consumption at KP1. The only certainty is that
making a change to the 3.1 mm washer would improve the performance at full load.
Judging the piston bowls solely on the part load response would have resulted in the
selection of B5. This however would have compromised the operation at full load, which
although unregulated nevertheless is still important. Further development of the design
concept for bowl B5 would need to investigate how injector protrusion could be optimised
so that the part load performance could be maintained whilst improving that at full load.
The unconventional design B4 worked well in the light duty Diesel engine, performing as
well as and better than conventional designs. With the use of common rail fuel injection
technology this bowl is able to operate at ever reducing isNOx emissions whilst maintaining
good fuel economy. The next step to prove this design would be to evaluate its response to
multiple injection strategies.

136
6 The Effect of Injector Design on Combustion and Emissions
The fuel injection equipment (FIE) available for the project allowed a comparison to be
made between the design and operation of a conventional solenoid injector and a
prototype, unconventional, direct acting injector. The comparison was made between the
conventional injector N0 and prototype injector N1. These were closely matched in terms of
nozzle characteristics having the same number and size of holes and a similar cone angle.
The comparison between the operation of the conventional and the prototype injection
system was only made with the conventional piston bowls because the spray angle of the
conventional injector’s nozzle (154°included angle) was matched to that design.
Due to the availability of hardware, the spray angle of the prototype design (155° included
angle) differs from the conventional design by 1°. The k-factor of the prototype injector
(k=2.5) was also different to the conventional design (k=2). This means that a direct
comparison of the behaviour of the injector type cannot be made without taking into
account the influence of these parameters.
6.1 Injector Characteristic
The operation of the prototype injector was fundamentally different to the operation of the
conventional injector. As a result, being able to compare the operation of each injector
required an understanding of the response of the injector to the injector demand signal. The
prototype injector lifts the needle directly by a mechanical link to the piezo stack, whereas
the conventional injector electronics lifts the needle by spilling fuel through a path in the
injector. As a result, there is a difference in the delivery rate so the electrical demand for
start of injection is different between each system.
Figure 6.1 shows the voltage and current traces measured for the prototype injection
system during an injection event. The data shown in the trace was recorded at 0.1°
resolution, using a combination of a current and voltage clamp. The numbers represent the
3 distinct phases of the injection event; 1) needle lift, 2) hold and 3) closing. The voltage
relates to the voltage of the piezo stack with the trace being proportional to the needle lift.
The current trace differs during the 3 phases; as the needle lifts the current becomes
negative. As the needle approaches the maximum opening the current reduces to slow the
rate of rise of the needle. Phase 2 is then reached where the current is zero. As the demand

137
to end the injection is sent in phase three, the current increases to a positive value to drive
the needle closed, settling to zero again as the needle closes.
Figure 6.1 Current and voltage trace for the prototype fuel injection system.
Figure 6.2 shows the response of the engine to the different injectors with different demand
signals sent to them. Flow rate characterisation of the injectors was not available for use
during the project. They could have been characterised but time ran out before this could
have been done. The first point of note is the difference in control of the fuel rail pressure.
The positive spike on the fuel pressure trace for B2N1-9 is a result of the control strategy for
the injection equipment as set by Delphi in the VISU control system supplied with the ECU
(The fuel pressure for the conventional injector was controlled by the separate controller
and injector driver Emtronix). The spike phases with the SOIm and occurs just as the needle
begins to ascend. The delay from the demand means that a small increase in fuel pressure
occurs as the bottom surface of the needle lifts from the nozzle body. The negative spike on
this trace occurs just as the needle is in the closing phase.
-300
-250
-200
-150
-100
-50
0
50
100
150
200
-15
-10
-5
0
5
10
15
20
25
30
35
-20 -15 -10 -5 0 5 10 15 20
Vo
ltag
e [
V]
Cu
rre
nt
[A]
CAD [°ATDC]
Current Voltage
1
2 3

138
Figure 6.2 Cylinder (PCYL1) and fuel rail (PLIN1) pressure for the conventional (N1) and
prototype (N0) injection equipment on the conventional bowl B2 at KP3 with 30 % EGR
The cylinder pressure traces indicate the differences in the injection rate of the injectors and
the resulting effect on combustion. When the SOIm is timed the same at -9°ATDC, the start
of combustion differs by 4°, with combustion initiating -2°ATDC for the prototype system
and 2°ATDC for the conventional system. The combustion phasing requires the SOIm to be
advanced for the conventional system. When set to 4° more advanced at -13°ATDC, the
combustion start angle is comparable at -2°ATDC as shown in the figure. As a result, the
electrical demand for the testing was set so that combustion was phased the same for each
injection system.
920
940
960
980
1000
1020
1040
1060
1080
20
40
60
80
100
120
140
160
180
-20 -15 -10 -5 0 5 10 15 20
PLI
N1
[b
ar]
PC
YL1
[b
ar]
CAD [degATDC]
PCYL N1 SOIm -9 PCYL N0 SOIm -13 PCYL N0 SOIm -9
Rail P N1 SOIm -9 Rail P N0 SOIm -13 Rail P N0 SOIm -9
Current N1 SOIm -9 Current N0 SOIm -13 Current N0 SOIm -9

139
6.2 Experimental Results
The comparison data that follows is based on the characterisation work for bowl B2, the
best performing conventional bowl. The test process was exactly the same as described in
the characterisation testing, with only the SOIm being varied for a constant load target at
each EGR condition. Each plot that follows has 2 separate curves for each series; they
represent the two different EGR rates used and each curve is made up of 4 points tested in
the SOIm swing as shown in Figure 6.3. N0 is the conventional solenoid injector, with 7 holes
and N1 is the prototype injector with 7 holes and matching flow rate.
Figure 6.3 Illustration of the EGR and SOIm swing used in the comparison of the injector
types
The fuel flow and exhaust flow were calculated from the value of airflow and AFR. This
choice was made after observing the fluctuations in the fuel system that affected the fuel
meter measurements for the conventional system. The calculated values are indicated with
the suffix “_c” on the end of each parameter derived from these parameters.
180
185
190
195
200
0 0.2 0.4 0.6 0.8 1
isFC
_c [
g/kW
.h]
isNOx_c [g/kW.h]
N1 N0
Increasing EGR
Retarding SOIm

140
6.2.1 KP3 Test
The following Table 6.1 shows the test settings that were used for the comparison of the
injector type. The results are taken from the low isNOx end of the EGR swing at 27 % and
30 % EGR respectively and are plotted together.
Test name
Speed Load Intake temp
Intake pressure
EGR rate
EGR temp
Pilot SOIm
Rail pressure SOI range
RPM GIMEP °C barA % °C - bar °ATDC
KP3 test 2000 9 41 1.47 27 69 NA 1050
N0(-13, -11, -9, -7)
N1(-9, -7, -5, -3)
Table 6.1 Test settings for the comparison of injector type at KP3
At 30 % EGR, the results indicate that the conventional injector N0 has the best efficiency
with an isFC_c of 187.3 g/kWh at an isNOx_c of 0.43 g/kWh. At isNOx_c of 0.41 g/kWh, N1
has an isFC_c of 190.2 g/kWh which is a difference of 1.5 %. In terms of emissions output N0
is the best performing injector, consistently outperforming the prototype injection system.
At the same test point (30 % EGR, isNOx_c 0.43 g/kWh) the smoke is 0.8 FSN for N0 and
1.08 FSN for N1. Each injector also demonstrates a different response to a change in SOIm;
N1 consistently deteriorates with a retard in SOIm whereas the trend with N0 is an
improvement at the most retarded timing. This is also demonstrated at 27 % EGR.
N0 has the best isCO_c output at 30 % EGR achieving 2 g/kWh compared to 2.4 g/kWh for
N1. The two injectors match their responses across the SOIm used, at 27 % EGR. N0 has the
lowest value of 1.23 g/kWh, by 0.04 g/kWh. The emission of isHC_c at 0.43 g/kWh isNOx_c,
is lowest for N0, outputting 0.2 g/kWh. N1 was worse ati.25 g/kWh.

141
Figure 6.4 Results of testing of conventional and prototype injection systems at KP3 with bowl B2
180
185
190
195
200
205
0 0.5 1 1.5
isFC
_c [
g/kW
.h]
isNOx_c [g/kW.h]
N1 N0
0.0
0.2
0.4
0.6
0.8
1.0
1.2
1.4
1.6
0 0.5 1 1.5
Smo
ke [
FSN
]
isNOx_c [g/kW.h]
N1 N0
0
0.5
1
1.5
2
2.5
3
3.5
4
0 0.5 1 1.5
isC
O_c
[g/
kW.h
]
isNOx_c [g/kW.h]
N1 N0
0
0.05
0.1
0.15
0.2
0.25
0.3
0.35
0 0.5 1 1.5
isH
C_c
[g/
kW.h
]
isNOx_c [g/kW.h]
N1 N0
99.1%
99.2%
99.3%
99.4%
99.5%
99.6%
99.7%
99.8%
99.9%
0 0.5 1 1.5
Co
mb
ust
ion
eff
icie
ncy
[%
]
isNOx_c [g/kW.h]
N1 N0
0
5
10
15
20
25
0 0.5 1 1.5
AFR
[kg
/kg]
isNOx_c [g/kW.h]
N1 N0

142
The differences observed in the emissions outputs indicate a change in the fuel conversion
efficiency between injector N0 and N1. This is not sufficient to completely explain the
differences in isFC. The fuel conversion efficiency is different between N0 and N1, however
in terms of fuel energy this is a small amount (0.02 kW) and the difference in performance is
more significant. An examination of the in-cylinder behaviour in the following figure shows
that the majority of the difference in isFC can be attributed to the differences in heat
transfer and crevice losses. At the same start of combustion timing, N0 rejects 2.51 kW of
heat through the combustion chamber during the working stroke up to EVO, compared to
2.82 kW with injector N1.
Figure 6.5 Energy balance at KP3 for the test of the effect of injector design with bowl B2
N1 rejects 6.43 kW of heat into the exhaust when the start of combustion occurs at the
same time as N0. N0 rejects 6.5 kW of heat into the exhaust. When the start of combustion
is retarded for injector N1, the heat transfer and crevice losses reduces to 2.65 kW and the
heat rejection through the exhaust increases to 6.65 kW. These figures suggest that the
duration of the combustion and the rate of heat release are affecting the efficiency of the
engine in an unexpected manner; the slower combustion is beneficial to fuel consumption
because the energy lost to the coolant is reduced without the penalty of increased heat
losses to the exhaust. The change in fuel consumption is small (1.4 %); however it is above
the uncertainty of the calculation of isFC using the air system (approx. 0.5 %).
7.52 7.51 7.51
6.50 6.43 6.65
2.51 2.82 2.65 0.07 0.09 0.09
0
5
10
15
20
N0 SOIm -13 N1 SOIm -9 N1 SOIm -7
Po
wer
[kW
]
Configuration
W,i,g HL exh HL ht,C η fc

143
The reduction of the smoke number with the conventional injector compared to the
prototype system is unexpected. It is not possible to identify exactly why this effect occurs.
It is possible that the reduced rate of rise of temperature due to the lower peak of heat
release rate (0.05 kJ/deg) shown in Figure 6.6 potentially reduces the temperature during
combustion resulting in a reduction in soot formation. This is speculative, however it was
well established that lower combustion and flame temperatures reduce the formation of
soot even in regions of rich air to fuel ratios (refer to the equivalence ratio versus
temperature plots in Chapter 2.3.3 (Dec, 2009)).
Figure 6.6 Apparent net heat release rate for bowl B2 with conventional(N0) and
unconventional (N1) injection systems. The number following the injector type is the SOIm
Due to the efficiency difference, a lower mass of fuel was injected for N0. This may have
reduced the regions of rich mixtures locally to the combustion. This may account for the
-0.05
0
0.05
0.1
0.15
0.2
0.25
-10 -5 0 5 10 15 20
aHR
R [
kJ/d
eg]
CAD [°ATDC]
N0 SOIm -13 -13 N1 SOIm -9 -9 N1 SOIm -7 -7

144
differences in the emissions output as either fewer pollutants were formed or there would
be more oxygen available to oxidise the formed pollutants.

145
6.2.2 KP2 Test
The following Table 6.2 shows the test setting used at KP2 for the comparison of the injector
type.
Test name
Speed Load Intake temp
Intake pressure
EGR rate
EGR temp
Pilot SOIm
Rail pressure SOI range
RPM GIMEP °C barA % °C - bar °ATDC
KP2 test 1500 6
41
1.16
30.5 65
NA 800
N0(-12, -10, -8, -7)
N1(-10, -8, -6, -4)
43 34 67
Table 6.2 KP2 settings for the comparison of injector type at KP2
Observing Figure 6.7, at 30.5 % EGR, the conventional injector appears to have the lowest
curve of isNOx_c against isFC_c. At 0.6 g/kWh isNOx_c the conventional injector has an
isFC_c of 202.6 g/kWh. The prototype injection system has an isFC_c of 206.6 g/kWh at an
isNOx_c of 0.48 g/kWh. This is a difference in isFC_c of 1.9 %.
The emissions of smoke are sufficiently low enough to be within the uncertainty of the
measurement device (0.05 FSN). This indicates that the combustion was sufficiently
premixed, the fuel spray was lean enough or that the rich regions were at sufficiently low
enough temperature to avoid forming soot. The length of premixing time can be seen in the
following combustion plot Figure 6.10.
The emissions of isCO_c and isHC_c are relatively similar for both injector types. The
conventional injection system seems to have the best trade off curve at both EGR rates. This
is reflected in the combustion efficiency plot.

146
Figure 6.7 Test data for the comparison of injector type at KP2
190
200
210
220
230
240
250
0 0.5 1
isFC
_c [
g/kW
.h]
isNOX_c [g/kW.h]
N1 N0
0
0.05
0.1
0.15
0.2
0 0.5 1
Smo
ke [
FSN
]
isNOX_c [g/kW.h]
N1 N0
0
5
10
15
20
0 0.5 1
isC
O_c
[g/
kW.h
]
isNOX_c [g/kW.h]
N1 N0
0
1
2
3
4
5
6
7
0 0.5 1
isH
C_c
[g/
kW.h
]
isNOX_c [g/kW.h]
N1 N0
94%
95%
96%
97%
98%
99%
100%
0 0.5 1
Co
mb
ust
ion
eff
icie
ncy
[%
]
isNOX_c [g/kW.h]
N1 N0
15
16
17
18
19
20
21
22
23
0 0.5 1
AFR
[kg
/kg]
isNOX_c [g/kW.h]
N1 N0

147
The energy balance analysis shown in Figure 6.8 highlights the differences in the behaviour
of each injector. At 30.5 % EGR, when the combustion phasing is the most advanced for
each injector, the heat transfer and crevice losses are lower for the conventional injector
(1.88 kW) compared to the prototype system (2.23 kW). This is the same combustion
behaviour that was observed at KP3. The heat rejection through the exhaust is higher for
the conventional system (3.23 kW) compared to the prototype system (3.15 kW), which
indicates that a lower rate of heat release has the benefit of reducing heat transfer losses
without a penalty on heat rejection to the exhaust.
Figure 6.8 Combustion behaviour of each injector type at KP2
The points for comparison seen in Figure 6.8 are at the most advanced SOIm used. The
apparent heat release rate for these points can be seen in Figure 6.9, where the peak of
heat release occurs sooner for the prototype system (4.5°ATDC) compared to the
conventional system (6°ATDC). At this point the combustion phasing differed by 1° i.e. the
conventional system should have been set to SOIm =-13°ATDC. With the 1° compensation
applied the peak of heat release for the conventional system lagged the prototype system
by 0.5°. The peak of heat release is lowest for the conventional system and more retarded,
which suggests a bias towards heat lost through the exhaust rather than heat lost through
heat transfer and crevice losses.
3.77 3.75
3.15 3.23
2.23 1.88
0.13 0.12
0
1
2
3
4
5
6
7
8
9
10
N1 N0
Po
wer
[kW
]
Configuration
η fc
HL ht,C
HL exh
W,i,g

148
Figure 6.9 Apparent net heat release rate for comparison of injector types at KP2
Figure 6.10 Apparent net heat release rate for the comparison of injector types at KP2
-0.05
0
0.05
0.1
0.15
0.2
0.25
0.3
-10 -5 0 5 10 15 20 25 30
aHR
R [
kJ/d
eg]
CAD [°ATDC]
N1 -10 N0 -12
-0.05
0
0.05
0.1
0.15
0.2
0.25
0.3
-10 -5 0 5 10 15 20 25 30
aHR
R [
kJ/d
eg]
CAD [°ATDC]
N1 -4 N0 -7

149
The variation in SOIm causes the isFC_c of the conventional injection system to change
more rapidly than the prototype system. As the SOIm retards the main heat release retards
more for the conventional system than the prototype system as shown in Figure 6.10. This
figure shows that under the same conditions, the onset of the main high temperature heat
release for the conventional injection system lags that of the prototype system after the
initial low temperature heat release. The peak of high temperature heat release occurs at
17.5°ATDC for the prototype system compared to 21.5°ATDC for the conventional system.
This difference of 4 degrees equates to 0.44 ms, which is similar in magnitude to the
injection duration of the prototype system.
The combustion is longer and less efficient for the conventional system, requiring more fuel
to meet the load target. There is a benefit to reducing the heat transfer losses with the
conventional system at the advanced timing which is lost as the timing retards because the
rate of mixture formation and combustion is significantly slower than the prototype system.
As a result, the prototype system is able to maintain a lower isFC_c (218 g/kWh) than the
conventional system (232.3 g/kWh) at the most retarded timing.
This demonstrates that at KP2, the conventional system benefits from an advanced timing
combined with a slower combustion rate to maintain low isFC_c. The improved mixture
formation of the prototype system allows the combustion timing to be retarded without a
large fuel consumption penalty; however the rate of heat release needs to be reduced at
the advanced timings to yield the isFC_c figures equivalent to the conventional system.

150
6.2.3 KP1 Test
The following Table 6.3 shows the test settings that were used for the comparison of the
injector type at KP1.
Test name
Speed Load Intake temp
Intake pressure
EGR rate Pilot SOIm
Rail pressure
SOI range
RPM GIMEP °C barA % - bar °ATDC
KP1 test 1500 3
64
1.03
33
NA 600
N0(-12, -11, -10, -9)
N1(-10, -9, -8, -7)
70 38.5
Table 6.3 Test settings for the comparison of injector type at KP2
Figure 6.11 shows that at 33 % EGR the prototype nozzle has the lowest isFC_c (225 g/kWh)
at the most advanced SOIm, however the curve of isNOx against isFC is better than the
prototype system. At isNOx_c of 1 g/kWh the prototype system has an isFC_c of
239.8 g/kWh, whereas the conventional system has an isFC_c of 236.3 g/kWh at an isNOx of
0.92 g/kWh, which is a difference of 1.46 %.
When the EGR level is increased (38.5 %) the isNOx against isFC_c for both systems is
similar. The prototype system has the lowest isFC_c (229.3 g/kWh) for an isNOx of
0.67 g/kWh, at the most advanced SOIm, compared to 234 g/kWh isFC at 0.68 g/kWh isNOx.
As SOIm retards, the two injection systems follow the same curve. However, at the most
retarded SOIm, combustion is more retarded for the conventional system, the isFC is higher
and the isNOx is lower.
Smoke emissions are lower than the uncertainty of the measuring device (0.05 FSN) as
observed at KP2, indicating that combustion was sufficiently premixed. This is also shown by
the increase in CO and HC emissions which result from the fuel spray becoming overly lean
before combustion occurs.

151
Figure 6.11 Test data for the comparison of injector type at KP1
210
220
230
240
250
260
270
0 0.5 1 1.5 2
isFC
_c [
g/kW
.h]
isNOX_c [g/kW.h]
N1 N0
0
0.02
0.04
0.06
0.08
0.1
0 0.5 1 1.5 2
Smo
ke [
FSN
]
isNOX_c [g/kW.h]
N1 N0
20
25
30
35
40
0 0.5 1 1.5 2
isC
O_c
[g/
kW.h
]
isNOX_c [g/kW.h]
N1 N0
0
5
10
15
20
25
0 0.5 1 1.5 2
isH
C_c
[g/
kW.h
]
isNOX_c [g/kW.h]
N1 N0
88.0%
89.0%
90.0%
91.0%
92.0%
93.0%
94.0%
95.0%
96.0%
0 0.5 1 1.5 2
Co
mb
ust
ion
eff
icie
ncy
[%
]
isNOX_c [g/kW.h]
N1 N0
20
22
24
26
28
30
0 0.5 1 1.5 2
AFR
[kg
/kg]
isNOX_c [g/kW.h]
N1 N0

152
The energy balance shown in Figure 6.12 has a similar trend trend to that observed at KP3
and KP2. The conventional system rejects more heat through the exhaust and less through
in-cylinder heat transfer than the prototype system. The difference in the heat transfer loss
at KP1 is 0.07 kW, the prototype system rejecting 0.93 kW compared to 0.86 kW for the
conventional injection system. The major difference at this key point is how much energy
was lost through incomplete combustion of the fuel, 0.48 kW compared to 0.44 kW for the
prototype and conventional systems respectively. In terms of relative energy loss 9.3 % was
lost by the prototype system and 8.5 % by the conventional system
The combustion aHRR trace for the 33 % EGR is shown in Figure 6.13. The combustion
phasing for these points is the same. The peak of high temperature heat release is lower for
the conventional injector (0.058 kJ/deg) compared to the prototype system (0.069 kJ/deg).
Qualitatively the curves are very similar at the start and after the peak of heat release. As
with the other key points tested the lower rate of heat is associated with lower heat
transfer losses in general. For the best isFC, a balance has to be met between the reductions
in rejected heat through heat transfer and the heat lost through the exhaust.
The most effective way of reducing isNOx_c is to increase EGR without incurring a fuel
consumption penalty associated with a retard in SOIm. As a result, the speed of the mixture
formation and combustion with the prototype system is the best way to achieve the lowest
fuel consumption at this conditions; however as shown, this is only the case at the most
advanced SOIm.

153
Figure 6.12 Plot of the energy balance for the conventional (N0) and prototype (N1)
injection system at KP1
Figure 6.13 Apparent net heat release rate for the conventional (N0) and prototype (N1)
injection system at KP1
1.83 1.84
1.95 2.00
0.93 0.86 0.48 0.44
0
1
2
3
4
5
6
N1 N0
Po
wer
[kW
]
Configuration
W,i,g HL exh HL ht,C η fc
-0.01
0
0.01
0.02
0.03
0.04
0.05
0.06
0.07
0.08
-10 -5 0 5 10 15 20 25 30
aHR
R [
kJ/d
eg]
CAD [°ATDC]
N1 -7 N0 -10

154
6.2.4 4000FL Test
The following Table 6.4 shows the test settings that were used for the comparison of the
injector types at 4000FL. The data was produced in the same way as in the previous full load
testing. The test was a SOIm swing with fixed inlet manifold conditions and load target.
Test name
Speed Load Intake temp
Intake pressure
EGR rate
Pilot SOIm
Rail pressure SOI range
RPM GIMEP °C barA % - bar °ATDC
4000FL 4000 21.4 50 2.4 NA NA 2000
N0(-26, -25, -24, -22)
N1(-19, -17, -15, -13)
Table 6.4 Test settings for the comparison of injector type at 4000FL
The first point to notice in Figure 6.14 is that the AFR against isFC_c curve is the best for the
prototype system. The AFR is higher for the prototype system because for the same air flow
(dictated by the intake manifold conditions) the fuel required to meet the load target is
lower than for the conventional system. As a result, the isFC_c is lower for the prototype
system (186 g/kWh) than the best point for the conventional system (193 g/kWh), for the
same load target.
The smoke output of the engine reflects the combustion behaviour. The prototype system
has the best curve of AFR versus smoke and the lowest smoke number of 0.73 FSN
compared to a smoke number of 1.43 FSN at -26 °ATDC for the conventional system. The
smoke number increases as the SOIm retards for both injector types. This could be a result
of the increase in fuel required to meet the load target reducing the AFR, as well as a
reduced amount of cycle time for any oxidation to take place.

155
Figure 6.14 Test data for the comparison of injector type at 4000FL numbers indicate SOIm
for both systems
The exhaust temperature follows the isFC_c curve well and indicates that the additional fuel
being added to meet the load target is rejected into the exhaust. This suggests that for all
SOIm used for the conventional system, the mixture formation and combustion process is
slower. Even when the combustion phasing is the same between the injection systems
(SOIm=-22°ATDC N0, SOIm =-17°ATDC N1) the rejected heat to the exhaust is higher for N0.
This is illustrated in Figure 6.15, where the heat rejected to the exhaust is 33.8 kW for the
conventional system and 30.9 kW for the prototype system. This is a difference of 8.8 %
(2.97 kW). With the overall heat input increasing to meet the load target, a higher
185
190
195
200
205
18.5 19 19.5 20 20.5
isFC
_c [
g/kW
.h]
AFR [kg/kg]
N1 N0
-22 -24
-25
-26
-19
-17
-15
-13
0
0.5
1
1.5
2
2.5
3
18.5 19 19.5 20 20.5
Smo
ke [
FSN
]
AFR [kg/kg]
N1 N0
-22 -24
-25
-26 -19
-17 -15
-13
680
700
720
740
760
780
18.5 19 19.5 20 20.5
Exh
aust
tem
per
atu
re [
C]
AFR [kg/kg]
N1 N0
-22 -24
-25
-26
-19 -17
-15 -13
150
155
160
165
170
175
180
185
18.5 19 19.5 20 20.5
Pm
ax [
bar
]
AFR [kg/kg]
N1 N0
-22
-24
-25
-26 -19
-17
-15
-13

156
proportion of heat is rejected in-cylinder through heat transfer losses. This is different to the
effect observed at part load, primarily due to the fuel system being setup to achieve rapid
mixture formation and hence a fast combustion process.
Figure 6.15 Energy balance for the conventional (N0) and prototype (N1) injection system at
4000FL
35.45 35.74 35.51 35.55
30.06 31.79 30.87 33.84
12.42 13.64 12.30 14.32 0.12 0.26 0.12 0.26
0
20
40
60
80
100
N1 N0 N1 N0
-19 -26 -17 -22
Po
wer
[kW
]
Configuration
W,i,g HL exh HL ht,C η fc

157
6.3 Conclusions of the Injector Evaluation
The results of the tests of the conventional and prototype injection systems on bowl B2
have shown how the injector type affects combustion and emissions. This has shown that
the rate of fuel addition during the injection process with the conventional injector, can be
beneficial to the fuel consumption and emissions of the engine at certain operating
conditions.
At all of the part load conditions the conventional injection system is able to reduce isFC_c
by reducing the peak of heat release rate without sacrificing overall efficiency due to the
slower burn rate. The slower burn rate consistently results in higher heat rejection through
the exhaust. This effect is consistent at all EGR levels for KP3 but was only observed at one
EGR condition tested out of 4 at KP2 and KP1. When the EGR rate is increased to the point
where the isNOx is around 0.5 g/kWh the difference between the conventional and
prototype system was not significant. A low AFR has a larger influence on the engine
emissions and efficiency than the design of the injection system.
At the full load condition, 4000FL, the higher injection rate of the prototype hardware
results in the best smoke and isFC output for bowl B2. At the higher engine speed, the rate
of mixture formation and combustion improves the engine efficiency. As a result fuelling is
lower, which allows a higher AFR and lower smoke number.
The injection rate of the prototype system should be controlled at KP3 to yield low isNOx
and isFC. The benefit of the high injection rate can be utilised under full load operation
whilst the advanced features of the prototype system can be used to optimise the engine
operation at the part load conditions.
Exactly why the operation of the conventional system reduces emissions and fuel
consumption when compared to the prototype system is not clear from these tests.
Certainly, the mixture formation process is not well understood in terms of the differences
in spray structure that lead to a better trade-off on the emissions output particularly at KP3.
The following Table 6.5 summarises the areas of the fuel spray formation that would need
to be investigated to prove or disprove the hypotheses derived from these tests.

158
Factor Effect Test
Penetration The conventional system has lower overall penetration of liquid and vapour
Reduce the distribution of combustion products into quench regions avoiding product formation
Measure the penetration length of each injector type with the same test conditions in-cylinder i.e. Same gas pressure, temperature, composition (density), injection pressure, injection duration.
Atomisation Assumed to be better for the unconventional system with rapid needle motion
Reduction of liquid droplets and improved air entrainment reducing rich regions in the fuel spray
Assess the liquid to vapour ratio in the spray under the same conditions mentioned above as well as assessing the difference in spray equivalence ratio.
Fuelling rate Fuel addition rate diagrams showing when the fuel injection event is complete
indicates where liquid fuel addition ends relative to the combustion heat release
Measure the injection rate of each system with the same test conditions in-cylinder. Test the prototype injection equipment with variable fuelling rates.
Injection timing/Bowl interaction
Match the spray and bowl interaction with both injection systems
This may have inadvertently enhanced the mixing for the conventional system
Measure the injection rate differences of each injector and along with the penetration and atomisation information estimate the differences in fuel distribution
Table 6.5 Summarising the potential areas of influence on the mixture formation and
combustion process of the different hardware types
From all of the factors listed in the above table, the fuelling rate is the one that could be
investigated with the experimental equipment. Variations in the rate of injection could be
achieved simply with multiple injections. The effect of multiple injections is interesting to
investigate on this unconventional design, particularly as the majority of testing so far was
carried out with a single injection strategy.

159
7 The Effect of Injector Nozzle Hole Size and Number of Holes on
Combustion and Emissions
For the investigation of injector nozzle geometry the prototype peizo injection system was
equipped with three different nozzle designs. The three different designs are shown in the
following Table 7.1.
Nozzle Actuator Post hone vol flow
Hole size
Holes Cone angle
k factor
ID Type (cm3/min) mm # ° - N4
Piezo 760 0.131 7
145 2.5 N5 0.123 8 N6 0.116 9
Table 7.1 Nozzle design characteristics used in the nozzle study
The only variation was the size of the holes and the number of the holes on the nozzle. The
volume flow rate was maintained at 760 cm3/min for each injector nozzle tested, and the
spray angle was appropriate for bowl B4. The testing was carried out over similar conditions
used in the characterisation testing, including part load, NEDC conditions as well as full load
conditions.
7.1 Experimental Results
The cylinder pressure data in the following section (aHRR and PCYL) is shown with a
non-dimensional trace that represents the needle lift profile of the prototype FIE. The traces
are based on the measured voltage from the piezo stack. With a direct acting injector the
needle lift is proportional to stack voltage. The traces are shown in Figure 7.1.

160
Figure 7.1 Example cylinder pressure data showing the single injection needle lift scheme
7.1.1 KP3 Test
The test conditions for the injector nozzle study are shown in the following Table 7.2. The
two test points were part of an EGR swing at the highest EGR rates tested. The test was
carried out using the same procedure as the characterisation process.
Test name
Speed Load Intake temp
Intake pressure
EGR rate
Exhaust pressure
Pilot SOI
Rail pressure
SOIm range
RPM GIME
P °C barA % barA °ATDC bar °ATDC
KP3 test 2000 9 41.3
1.47 26.7 1.96
N/A 1050 -9,-7,-5,
-3 43.1 29.9 1.89
Table 7.2 KP3 test settings used in the nozzle study
The following Figure 7.2 shows that there are some differences between the designs of the
injector nozzles at this key point. The isFC curves appear to overlay each other with the 9
hole nozzle, N6 having a higher isFC at the most advanced timing for 26.7 % EGR. The isFC
0
20
40
60
80
100
120
140
-20 -10 0 10 20 30 40
PC
YL1
[b
ar]
CAD [degATDC]
N4 N5 N6
Needle lift scheme
Cylinder pressure trace

161
for N6 at the most advanced timing is 189.7 g/kWh compared to 187.2 g/kWh for N4. This is
a difference of 2.5 g/kWh or 1.34 %. The response to the variation in SOIm shows a smaller
change for N6 than N4 and N5. Although the initial value of isFC is higher for nozzle N6, as
combustion timing is retarded, isFC for all nozzles reaches a similar level with N6 being the
lowest at 198.9 g/kWh (around 0.6 % less).
When the EGR level is higher at 29.9 %, the isFC is comparable for all injector nozzles. At an
isNOx of 0.5 g/kWh, the isFC is around 190 g/kWh for all nozzles. As the SOIm retards
to -3°ATDC the isFC is the lowest for nozzle N6 at 195.9 g/kWh. This is 2.8 % lower than N4,
showing that the isFC of nozzle N6 is less sensitive to a retard in SOIm than nozzle N4.
The smoke emission a difference due to the injector nozzle designs. At 26.7 % EGR, there is
a small difference between nozzle N4 compared to nozzles N5 and N6. N5 and N6 overlay
each other and increase from 0.09 FSN to 0.14 FSN as the SOIm retards from -9°ATDC
to -3°ATDC. N4 has a higher initial value of 0.17 FSN and is more sensitive to the SOIm
retarding, resulting in a smoke number of 0.44 FSN.

162
Figure 7.2 Test data for the comparison of nozzle design at KP3
180
185
190
195
200
205
210
0 0.5 1 1.5
isFC
_c [
g/kW
.h]
isNOx_c [g/kW.h]
N4 N5 N6
0
0.5
1
1.5
2
0 0.5 1 1.5
Smo
ke [
FSN
]
isNOx_c [g/kW.h]
N4 N5 N6
0
1
2
3
4
5
6
7
8
0 0.5 1 1.5
isC
O_c
[g/
kW.h
]
isNOx_c [g/kW.h]
N4 N5 N6
0
0.1
0.2
0.3
0.4
0.5
0.6
0 0.5 1 1.5
isH
C_c
[g/
kW.h
]
isNOx_c [g/kW.h]
N4 N5 N6
430
440
450
460
470
480
490
500
510
0 0.5 1 1.5
Exh
aust
tem
per
atu
re [
C]
isNOx_c [g/kW.h]
N4 N5 N6

163
When the EGR rate increases to 29.9 %, the difference between nozzles is more significant
when the SOIm is retarded. Initially, at the most advanced timing, the best nozzle N6 has a
smoke number of 0.32 FSN compared to 0.38 FSN for N5 and 0.56 FSN for N4. When the
SOIm retards, the smoke number for both N4 and N5 increases relatively linearly, ending up
at 1.58 FSN for N4 and 0.93 FSN for N5. N6 however increases from the initial smoke value
to 0.51 FSN. As the SOIm timing retards further, the smoke number changes to 0.52 FSN
(-5°ATDC) and then to 0.5 FSN (-3°ATDC). The response to a retard in SOIm indicates that the
mixture formation process is different for each nozzle.
The emission of isCO is higher for N4 than both N5 and N6 across the range of SOIm timings
used at both EGR conditions. At 0.5 g/kWh isNOx the emission of isCO for N6 is 1.98 g/kWh,
this is lower than N5 by 0.18 g/kWh and lower than N6 by 0.69 g/kWh. The emission of isHC
is best for N6 across the range of SOIm timings. This indicates that overall the mixture
formation process is improved with the 9 holes nozzle compared to the 7 or 8 holes nozzle.
The exhaust temperature at 29.9 % EGR and the most retarded timing shows that less heat
is rejected through the exhaust for N6. This indicates that for the same SOIm, the heat
release is occurring sooner and results in lower exhaust temperatures.

164
Figure 7.3 Cylinder pressure data for the nozzle study at KP3 with 30 % EGR. From top to
bottom, SOIm-7 °ATDC and SOIm -3°ATDC
0
20
40
60
80
100
120
140
-20 -10 0 10 20 30 40
PC
YL1
[b
ar]
CAD [degATDC]
N4 N5 N6
0
20
40
60
80
100
120
140
-20 -10 0 10 20 30 40
PC
YL1
[b
ar]
CAD [degATDC]
N4 N5 N6

165
Figure 7.3 shows the in-cylinder pressure data for SOIm timings of -7°ATDC and -3°ATDC.
The combustion at this key point is highly premixed, which is shown in the heat release plots
(Figure 7.4) by the characteristic premixed spike, minimal diffusion phase and small tail
phase. In each case the start of the cylinder pressure rise occurs earliest for the 9 holes
injector, N6. This is most obvious when the SOIm is -3°ATDC. This shows that when the start
of injection is the same for each injector, the 9 holes nozzle can form an ignitable mixture
sooner under a single injection condition. This is the main reason why the exhaust
temperature was lower when injector N6 was used. The trend is similar for each nozzle
however with N6 appearing to promote more advanced combustion.
Figure 7.4 shows the heat release rate at the most advanced and the most retarded SOIm.
At the most advanced SOIm the peak of the heat release rate is highest for N6. For all of the
injector nozzles, the heat release occurs just as the needle begins to descend at the end of
the injection event. The peak of heat release occurs 0.8° after the needle closes at the end
of injection for N6, 1° for N5 and 1.3° for nozzle N4. When the SOIm retards to -3°ATDC, the
heat release occurs later after the end of injection. For N6 this is 3.5° and 4.5 ° for N5 and
N4. At the retarded SOIm, the longer ignition delay means there is more time for the fuel
and air to mix before the high temperature heat release occurs.
At the most retarded SOIm, the 9 holes injector produced less smoke that the 7 holes
injector. With more smaller holes, the fuel distribution around the cylinder is improved and
the amount of liquid fuel or fuel that is heterogeneous is reduced. This has little effect on
efficiency at the highest EGR rate used here, however overall emissions outputs of smoke
isCO and isHC are improved.

166
Figure 7.4 Apparent net heat release rate data for the nozzle study at KP3 with 30 % EGR.
From top to bottom, SOIm -9°ATDC and SOIm -3°ATDC
-0.05
0
0.05
0.1
0.15
0.2
0.25
0.3
-10 -5 0 5 10 15 20
aHR
R [
kJ/d
eg]
CAD [degATDC]
N4 N5 N6
-0.05
0
0.05
0.1
0.15
0.2
0.25
0.3
-10 -5 0 5 10 15 20
aHR
R [
kJ/d
eg]
CAD [degATDC]
N4 N5 N6

167
7.1.2 KP2 Test
The testing was carried out in the same way as the characterisation process, the main
variable changed was the injector nozzle number of holes and the hole diameter. At 33 %
EGR, the most retarded timing that could be tested without misfiring was -5°ATDC. Details
of the test point are shown in Table 7.3.
Test name Speed Load
Intake temp
Intake pressure
EGR rate
Exhaust pressure
Pilot SOI
Rail pressure
SOIm range
RPM GIMEP °C barA % barA °ATDC bar °ATDC
KP2 test 1500 6 39.5
1.16 30 1.25
N/A 800 -10,-8,-6,
(-5),-4 40.7 33 1.23
Table 7.3 KP2 test settings used in the nozzle study
Figure 7.5 shows the engine outputs for this test. At both EGR rates there is less than 0.5 %
difference in isFC between the nozzles at the advanced injection timings of -10°ATDC,
and -8°ATDC. Nozzle N6 has the lowest isFC of 203.8 g/kWh at 30 % EGR for the most
retarded injection timing of -4°ATDC. N5 is 1.2 % higher and N4 is 2 % higher at this timing.
At 33 % EGR N5 and N6 are within 0.5 % of each other across the entire range of SOIm, N5
has the lowest isFC at 204.8 g/kWh. Comparing nozzle N4 and N6 at the most retarded
SOIm, the difference in isFC is as high as 3.3 %.
The smoke emission is low for all injector nozzles. The 0.05 FSN resolution of the smoke
meter means that no discernible difference can be inferred from this testing. The smoke
emission was low in the characterisation testing for all bowls because combustion at this
key point was highly premixed. The long ignition delays and rapid pressure rise once the fuel
ignites are ideal conditions to minimise the formation of particulates.
Figure 7.5 shows that there is no significant difference in isCO for the 8 holes and 9 holes
injector nozzle until the most retarded SOIm at 33 % EGR. N6 has the lowest value of
8.5 g/kWh compared to 9.9 g/kWh for N5. N5 and N6 do sit on the same curve of isNOx
against isCO possibly indicating a difference in combustion phasing at the same injection
timing. N4 is worse than both of the 8 holes and 9 holes injectors for all SOIm timings. At the
most retarded SOIm the isCO output is 11.9 g/kWh. N4 is around 20 % higher than N6 with
30 % EGR and 30 %-40 % higher at 33 % EGR.

168
Figure 7.5 Test data for the comparison of nozzle design at KP2
195
200
205
210
215
220
225
0 0.5 1 1.5
isFC
_c [
g/kW
.h]
isNOx_c [g/kW.h]
N4 N5 N6
0.00
0.05
0.10
0.15
0.20
0 0.5 1 1.5
Smo
ke [
FSN
]
isNOx_c [g/kW.h]
N4 N5 N6
0
2
4
6
8
10
12
14
0 0.5 1 1.5
isC
O_c
[g/
kW.h
]
isNOx_c [g/kW.h]
N4 N5 N6
0
0.5
1
1.5
2
2.5
3
3.5
4
0 0.5 1 1.5
isH
C_c
[g/
kW.h
]
isNOx_c [g/kW.h]
N4 N5 N6
86
88
90
92
94
96
98
100
0 0.5 1 1.5
No
ise
[d
B]
isNOx_c [g/kW.h]
N4 N5 N6
330
340
350
360
370
380
390
400
410
0 0.5 1 1.5
Exh
aust
tem
per
atu
re [
C]
isNOx_c [g/kW.h]
N4 N5 N6

169
The emission of isHC is the lowest for nozzle N6 at all conditions. The trend at 33 % EGR is
that the curves begin to overlay at the most retarded SOIm. At 30 % EGR the lowest isHC is
1.3 g/kWh for 1.25 g/kWh isNOx. When the timing is retarded this increases to 2 g/kWh for
0.58 g/kWh isNOx. Nozzle N5 is 15 % higher and nozzle N4 is 25 %-30 % higher than N6
across the entire range of SOIm. This trend is also observed as the EGR rate increases.
The combustion noise output follows the same trend curves for all injector nozzles, at both
EGR rates and nearly all SOIm timings. The exception occurs at the most retarded timing
used at 33 % EGR. At this timing, N4 has the lowest noise output at 88 dB. N5 is 2.1 % higher
and N6 is the highest at 91 dB (3.4 % higher than N4). Besides that test point, all of the
nozzles follow the same curve varying less than 0.4 % across the entire range of SOIm
timings.
The exhaust temperature is lowest for N6 for all conditions tested. This may explain why the
isFC is marginally better for N6, with a reduction in heat rejected through the exhaust.
When the EGR rate is at 33 % the curves for all nozzles are close together, N6 having lower
exhaust temperature but slightly higher isNOx outputs as if the SOIm is slightly more
advanced.
Figure 7.6 shows the cylinder pressure data with 33 % EGR, at a range of SOIm timings. The
combustion is highly pre mixed indicated in the heat release plots (Figure 7.7) by the
characteristic premixed spike, minimal diffusion phase and small tail phase.

170
Figure 7.6 Cylinder pressure data for the nozzle study at KP2 with 33 % EGR. From top to
bottom, SOIm-6 °ATDC and SOIm -5°ATDC
0
10
20
30
40
50
60
70
80
90
100
-20 -10 0 10 20 30 40
PC
YL1
[b
ar]
CAD [°ATDC]
N4 N5 N6
0
10
20
30
40
50
60
70
80
90
100
-20 -10 0 10 20 30 40
PC
YL1
[b
ar]
CAD [°ATDC]
N4 N5 N6

171
In each of the plots in Figure 7.6 the pressure trace for the 9 holes nozzle N6, has the most
advanced phasing at each SOIm. The difference in phasing is present at KP3 and indicates
that the 9 holes injector is forming an ignitable mixture sooner than the other injector
nozzles. The effect is most exaggerated at -5°ATDC. The maximum pressure observed for the
9 holes injector occurs at 15.6°ATDC, whereas the 8 holes injector is 1.2° later and the 7
holes nozzle 3° later than N6. As a result, the heat rejected from the exhaust is lower and
the exhaust temperature is lower.
The heat release analysis in Figure 7.7 shows that for the 9 holes injector at the most
advanced timing, the start of combustion occurs 5° after the needle has closed. The
remaining two injectors are 1° more retarded. This difference is more exaggerated at the
most retarded timing; combustion for nozzle N6 initiates at 7° after the end of injection, N5
is 1° later and N4, 2° later.
At this key point, the injector nozzle design affects the mixture formation process. Smaller
and more numerous holes result in a reduction in isCO and isHC as well as a small gain in
efficiency up to a maximum of 2 % improvement at 33 % EGR from N4 to N6. The reduction
in exhaust temperature, the emissions data and the cylinder pressure data suggests that for
the same SOIm, the more holes the nozzle has, the earlier an ignitable mixture can be
formed. The combustion phasing becomes more advanced, which explains why the 9 holes
nozzle is less sensitive to a timing retard than the 7 hole injector.
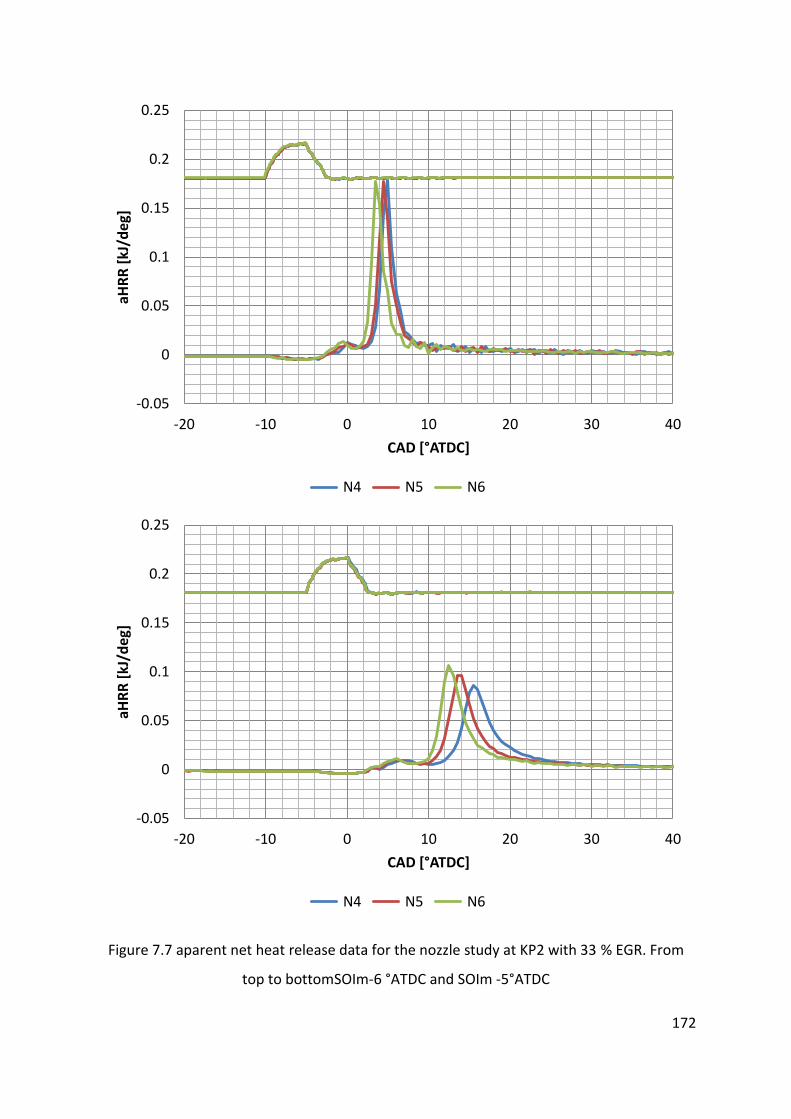
172
Figure 7.7 aparent net heat release data for the nozzle study at KP2 with 33 % EGR. From
top to bottomSOIm-6 °ATDC and SOIm -5°ATDC
-0.05
0
0.05
0.1
0.15
0.2
0.25
-20 -10 0 10 20 30 40
aHR
R [
kJ/d
eg]
CAD [°ATDC]
N4 N5 N6
-0.05
0
0.05
0.1
0.15
0.2
0.25
-20 -10 0 10 20 30 40
aHR
R [
kJ/d
eg]
CAD [°ATDC]
N4 N5 N6

173
7.1.3 KP1 Test
The following table shows the test conditions used in the testing of the injector nozzles at
KP1. The testing process was the same process used in the characterisation of the bowl
designs. At this key point the SOIm was changed in increments of 1°.
Test name Speed Load
Intake temp
Intake pressure
EGR rate
Exhaust Pressure
Pilot SOI
Rail pressure
SOIm range
RPM GIMEP °C barA % °C °ATDC bar °ATDC
KP1 test 1500 3 62.7
1.03 33.5 1.16
N/A 600 -10,-9,-8,-7 70.2 38.2 1.14
Table 7.4 KP1 test settings used in the nozzle study
The trend observed, at the other key points, for an improvement in either emissions output
or isFC when the nozzle hole number increases from 7 holes change at KP1. The isFC was the
lowest for nozzle N4 at both EGR rates apart from the most advanced timing for nozzle N6
at 33.5 % EGR. Across the entire range of SOIm at 38.2 % EGR, nozzle N6 isFC is 2.9 % to
3.5 % higher than nozzle N4, whilst at the most advanced timing, the isFC for nozzle N4 is
218 g/kWh compared to 224.5 g/kWh for nozzle N6. isNOx levels are comparable at
1.22 g/kWh for N6 and 1.25 g/kWh for N4. The trend is the same for the comparison of
nozzle N4 with N5, but the magnitude of the difference is smaller, 2 % to 1.7 %. At the most
advanced timing nozzle N5 has an isFC of 219.9 g/kWh, a difference of 0.8 %.
The smoke emission is low for all injector nozzles tested. The 0.05 FSN resolution of the
smoke meter means that no discernible difference can be inferred from this testing. As with
KP2, conditions are ideal to avoid forming particulates.
A result of the highly premixed combustion is that the emission of isCO and isHC increase. At
KP1, isCO is the lowest for N4 across the range of SOIm timings at both EGR rates. At the
highest EGR level, the emission of isCO for N6 is 15 % higher for all SOIm timings compared
to N4. At the most retarded SOIm, where the difference is the largest, N4 has an isCO
emission of 24.3 g/kWh compared to 27.9 g/kWh for N5 and 29.5 g/kWh for N6.
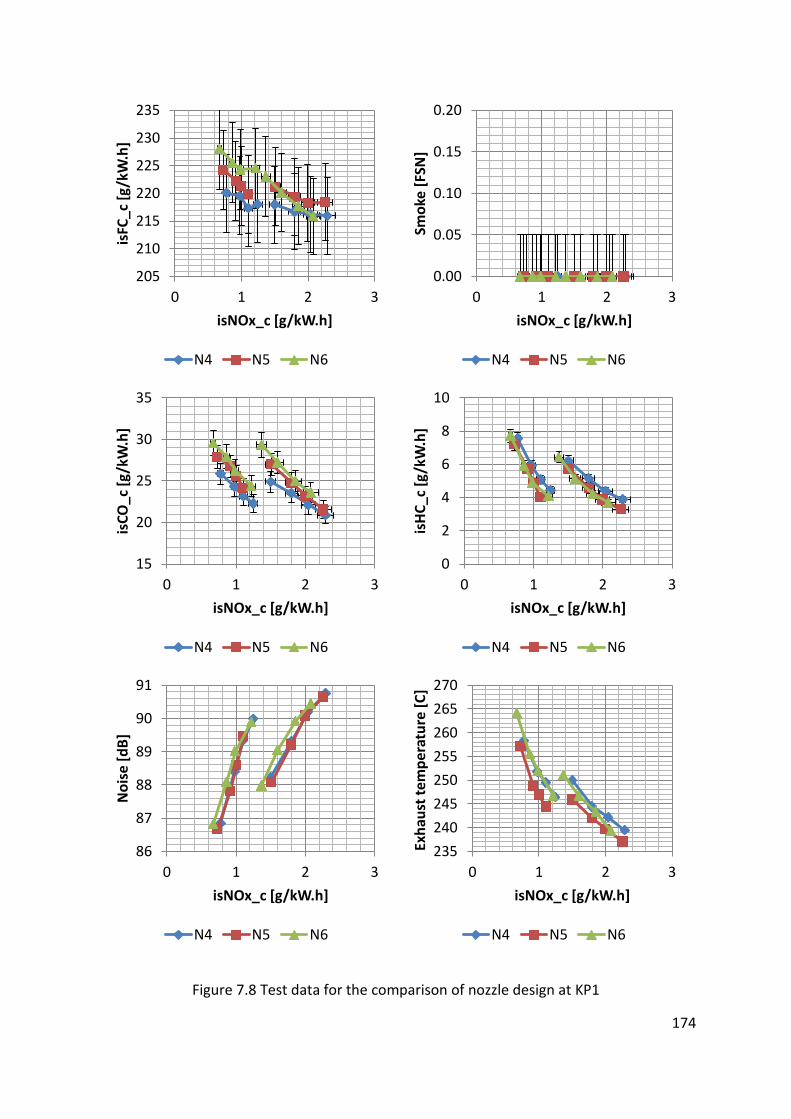
174
Figure 7.8 Test data for the comparison of nozzle design at KP1
205
210
215
220
225
230
235
0 1 2 3
isFC
_c [
g/kW
.h]
isNOx_c [g/kW.h]
N4 N5 N6
0.00
0.05
0.10
0.15
0.20
0 1 2 3
Smo
ke [
FSN
]
isNOx_c [g/kW.h]
N4 N5 N6
15
20
25
30
35
0 1 2 3
isC
O_c
[g/
kW.h
]
isNOx_c [g/kW.h]
N4 N5 N6
0
2
4
6
8
10
0 1 2 3
isH
C_c
[g/
kW.h
]
isNOx_c [g/kW.h]
N4 N5 N6
86
87
88
89
90
91
0 1 2 3
No
ise
[d
B]
isNOx_c [g/kW.h]
N4 N5 N6
235
240
245
250
255
260
265
270
0 1 2 3
Exh
aust
tem
per
atu
re [
C]
isNOx_c [g/kW.h]
N4 N5 N6

175
The emission of isHC at this test point is the lowest for nozzle N5 at the most advanced
SOIm, at 38 % EGR. The isHC is 4 g/kWh for N5 and 4.1 g/kWh for N6. This is a difference
of 2 %. N4 isHC emission is 4.44 g/kWh which is 10.9 % higher than nozzle N5. The curve of
isNOx against isHC with the variation in SOIm is similar for N5 and N6 whereas N4 is higher.
The noise emissions for all nozzles at the highest EGR rate are similar for all SOIm. At 33 %
EGR N6 appears to be on a different curve of lower noise and isNOx for the same SOIm. The
differences in the values are small indicating that combustion noise is not affected by nozzle
geometry as significantly as the other parameters.
Figure 7.9 shows the in-cylinder pressure data for SOIm timings of -10 °ATDC and -7 °ATDC.
At this key point the needle is not fully ascending during the injection event because the fuel
injection period is short (around 550 μs to raise and lower the needle).
The pressure traces for both SOIm timings show only small differences between them
compared to the previous key points. The delay between the needle closing and the peak
pressure is larger at this key point, occurring 12° after the end of the injection event for the
most advanced timing. At the most retarded timing the delay increases moderately to
12.5°ATDC.
Figure 7.10 shows the calculated rate of heat release data for all of the nozzles tested. At
the most advanced timing, N4 and N6 has a peak value of 0.077 kJ/deg and N5 is lower at
0.074 kJ/deg. There is little difference in the traces at the most retarded SOIm, with the
traces overlaying and achieving the same peak value 0.06 kJ/deg. Combustion at this key
point is similar at all conditions, which makes the difference in emissions outputs of the
engine difficult to interpret. Nozzle N4 is the best performing in terms of isFC, but it is not
possible to identify the reasons why this is the case from this data.
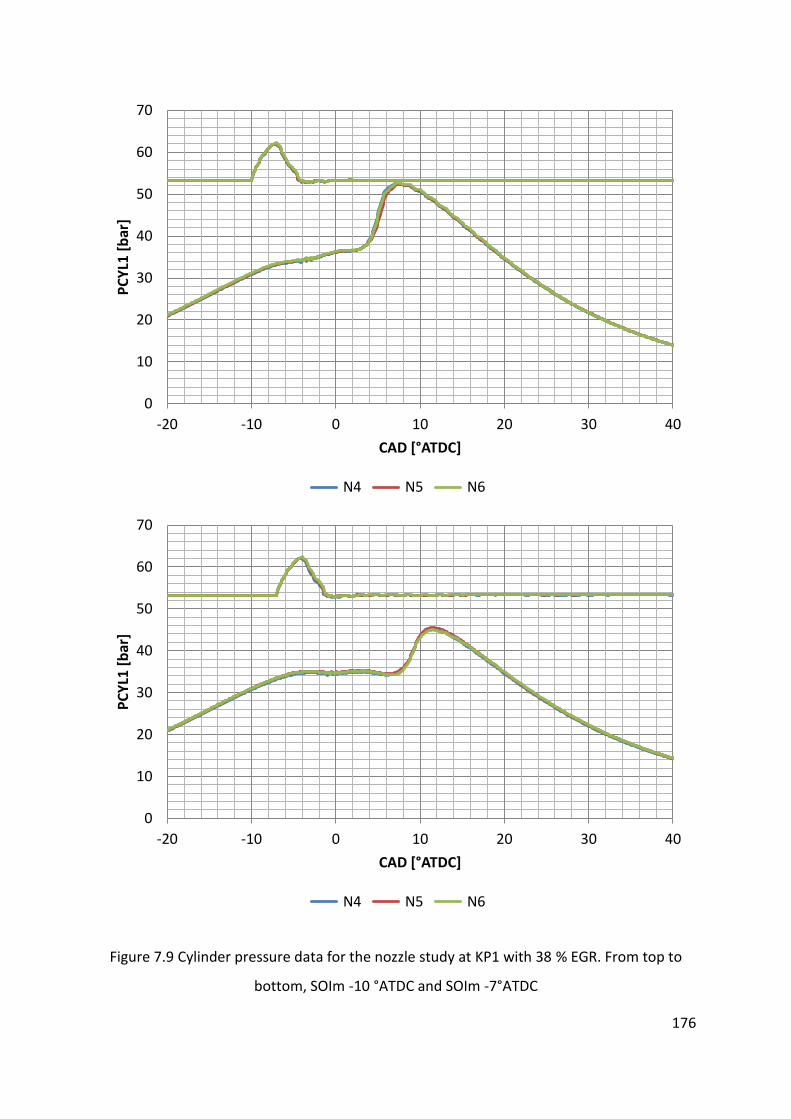
176
Figure 7.9 Cylinder pressure data for the nozzle study at KP1 with 38 % EGR. From top to
bottom, SOIm -10 °ATDC and SOIm -7°ATDC
0
10
20
30
40
50
60
70
-20 -10 0 10 20 30 40
PC
YL1
[b
ar]
CAD [°ATDC]
N4 N5 N6
0
10
20
30
40
50
60
70
-20 -10 0 10 20 30 40
PC
YL1
[b
ar]
CAD [°ATDC]
N4 N5 N6
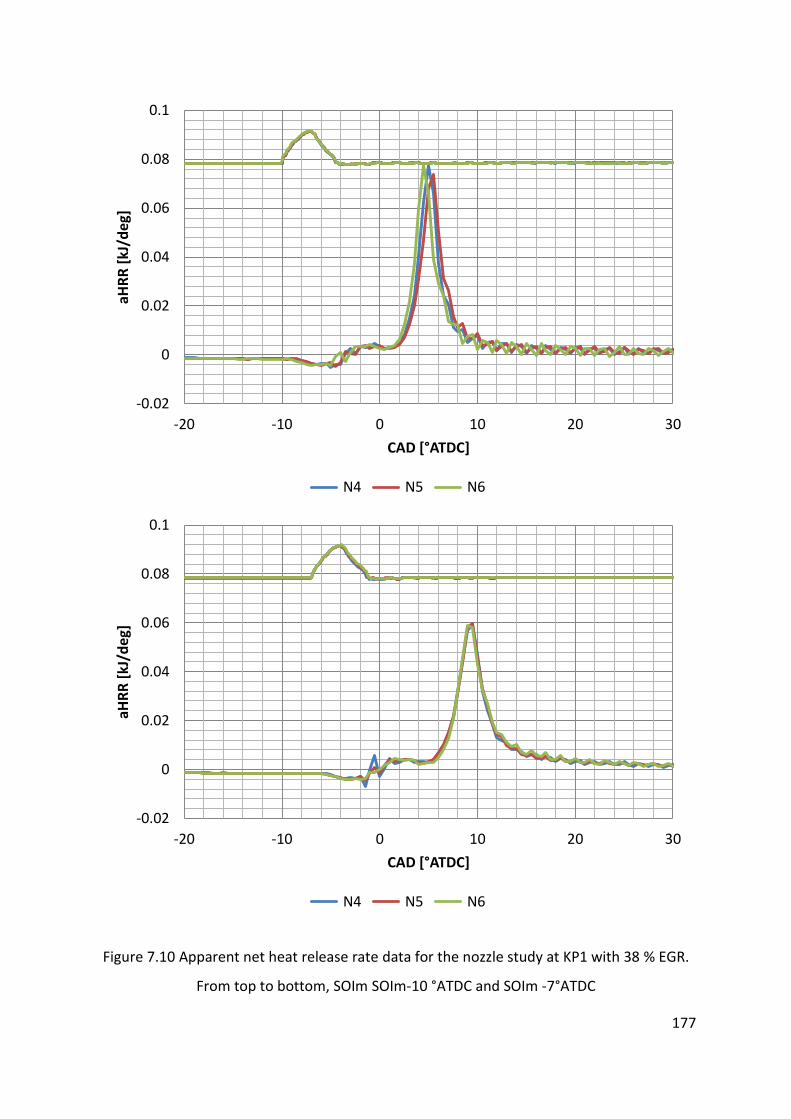
177
Figure 7.10 Apparent net heat release rate data for the nozzle study at KP1 with 38 % EGR.
From top to bottom, SOIm SOIm-10 °ATDC and SOIm -7°ATDC
-0.02
0
0.02
0.04
0.06
0.08
0.1
-20 -10 0 10 20 30
aHR
R [
kJ/d
eg]
CAD [°ATDC]
N4 N5 N6
-0.02
0
0.02
0.04
0.06
0.08
0.1
-20 -10 0 10 20 30
aHR
R [
kJ/d
eg]
CAD [°ATDC]
N4 N5 N6

178
7.1.4 4000FL Test
The following Table 7.5 shows the test conditions at 400FL. The testing process was the
same process used in the characterisation for the full load testing. At this key point the inlet
manifold conditions were fixed and the SOIm was changed by increments of 2° at a time.
Test name
Speed Load Intake temp
Intake pressure
EGR rate
Exhaust Pressure
Pilot SOI
Rail pressure
SOIm range
RPM GIMEP °C barA % °C °ATDC bar °ATDC
4000 FL 4000 21.4 46.5 2.38 N/A 2.58 N/A 2000 -19,-17, -15,-13
Table 7.5 Test settings used in the nozzle study at 4000FL
Figure 7.11 shows the engine data from the nozzle study at 4000FL. There is little difference
in isFC at this test point, nozzle N6 has a fractionally higher output across the range of SOIm
timings. N4 has the lowest isFC of 188.5 g/kWh at the most advanced SOIm increasing to
191.8 g/kWh at the most retarded timing. N6 is 0.6 % to 0.8 % higher for all but the most
retarded SOIm where the difference increases to 1.7 %. N5 follows the curve of N4 within
±0.1 % until the most retarded timing where it is 0.48 % higher than N4.
The smoke response shows that for all but the most advanced SOIm N6 has the worst
smoke output. At the most retarded timing the smoke number is 1.62 FSN compared to the
best nozzle N4, which is 0.77 FSN. The response at the most advanced timing for N4 and N5
shows that N5 has the lowest overall smoke output of 0.35 FSN, but it is the most sensitive
to the timing retard increasing to 1.54 FSN. N4 is more consistent in terms of smoke output,
only increasing at -15°ATDC (0.51 FSN) and -13°ATDC (0.77 FSN).
N6 has the worst curve for isCO at all but the most advanced SOIm where the isCO is
1.37 g/kWh. At the advanced timing, the best isCO is N5 at 1.21 g/kWh and N4 is higher at
1.43 g/kWh. For nozzle N4, the isCO improves from the advanced timing for all but the most
retarded timing even as the AFR was reducing. Nozzle N5 is similar but only improves as the
timing is retarded by 2°.

179
Figure 7.11 Test data for the comparison of nozzle design at 4000FL
180
185
190
195
200
-20 -15 -10
isfc
_c
[g/k
W.h
]
SOIm [°ATDC]
N4 N5 N6
0
0.5
1
1.5
2
-20 -15 -10
Smo
ke [
FSN
]
SOIm [°ATDC]
N4 N5 N6
0
0.5
1
1.5
2
2.5
-20 -15 -10
isC
O [
g/(k
W.h
)]
SOIm [°ATDC]
N4 N5 N6
18
19
20
21
22
-20 -15 -10
AFR
[kg
/kg]
SOIm [°ATDC]
N4 N5 N6
48
50
52
54
56
58
60
-20 -15 -10
90
% a
ngl
e [d
eg]
SOIm [°ATDC]
N4 N5 N6
700
710
720
730
740
750
-20 -15 -10
Exh
aust
tem
per
atu
re [
C]
SOIm [°ATDC]
N4 N5 N6

180
The trend for exhaust temperature shows that as the nozzle hole number increases and the
hole size reduces the exhaust temperature increases. More heat is rejected through the
exhaust due to an increase in burn duration. The 90 % burn angle plot shows that
combustion duration increases by 2° for N6 compared to N4.
Figure 7.12 shows the cylinder pressure data and the needle lift schematic for the most
advanced and retarded SOIm timings at 4000FL. The injector is open for a significant period
at this test point (1400 μs), which means that liquid fuel was being injected during the
majority of the combustion event. The end of the injection event was at 25°ATDC for the
most retarded SOIm tested. Combustion is highly diffusive, differing from the part load
combustion behaviour.
In terms of the pressure traces seen in Figure 7.12, it appears that there is little difference
between the nozzles at either operating condition. The combustion duration was marginally
longer for the 9 holes injector (see Figure 7.11) leading to higher exhaust temperatures
observed.

181
Figure 7.12 Cylinder pressure data for the nozzle study at 4000FL. From top to bottom,
SOIm -19 °ATDC and SOIm -13°ATDC
50
70
90
110
130
150
170
190
210
230
250
-20 -10 0 10 20 30 40
PC
YL1
[b
ar]
CAD [°ATDC]
N4 N4 N4
50
70
90
110
130
150
170
190
210
230
250
-20 -10 0 10 20 30 40
PC
YL1
[b
ar]
CAD [°ATDC]
N4 N4 N4

182
7.1.5 2000FL Test
The following Table 7.6 shows the test conditions at 400FL. The testing process was the
same process used in the characterisation for the full load testing. At this key point the inlet
manifold conditions were fixed and the SOIm was changed by 2° at a time.
Test name
Speed Load Intake temp
Intake pressure
EGR rate
Exhaust Pressure
Pilot SOI
Rail pressure
SOIm range
RPM GIMEP °C barA % °C °ATDC bar °ATDC
2000 FL 2000 24.0 52.4 2.41 N/A 1.45 N/A 2000 -8,-6,-4,-2
Table 7.6 Test settings used in the nozzle study at 4000FL
Figure 7.13 shows that nozzle N6 has the best isFC for all but the most advanced timing. N4
and N5 have similar curves with N5 having the highest isFC at all but the most retarded
timing. N6 has the lowest isFC of 206 g/kWh at -6°ATDC, N4 is 0.4 % higher at 206.8 g/kWh
and N5 is 0.7% higher than N6. There is no real trend for isFC with nozzle hole number and
the differences in isFC are all less than 1 % at this key point.
The smoke plot at this key point shows that increasing the number of nozzle holes results in
a reduction in smoke. Nozzle N4 has the highest smoke number of 0.5 FSN at the most
advanced SOIm. For nozzles N4 and N5, the smoke number reduces up to the most retarded
timing where it stays the same. For nozzle N6 the smoke number does not vary more than
0.02 FSN for all SOIm timing, indicating that SOIm has little effect on the smoke emission.
isCO reduces for nozzle N5 and N6 as the SOIm retards, nozzle N4 reduces and then
increases again at the most retarded timing. Nozzle N6 has the highest isCO of 4.26 g/kWh
at the most advanced timing but this reduces by 65 % as the SOIm retards.
At the most retarded timing for all injectors there is an increase in isFC and exhaust
temperature, with a decrease in isCO and smoke. This indicates that as the SOIm retards the
efficiency deteriorates as expected but the mixture formation process improves, reducing
the fuel conversion efficiency losses. The exhaust temperature differences between each
nozzle are small, less than ±1 % in all cases. Nozzle N4 has the highest exhaust temperature
for all SOIm timings.

183
Figure 7.13 Test data for the comparison of nozzle design at 2000FL
200
202
204
206
208
210
212
214
-10 -8 -6 -4 -2 0
isFC
_c [
g/kW
.h]
SOIm [°ATDC]
N4 N5 N6
0
0.1
0.2
0.3
0.4
0.5
0.6
0.7
-10 -8 -6 -4 -2 0
Smo
ke [
FSN
]
SOIm [°ATDC]
N4 N5 N6
0
1
2
3
4
5
-10 -8 -6 -4 -2 0
isC
O [
g/(k
W.h
)]
SOIm [°ATDC]
N4 N5 N6
15
16
17
18
19
-10 -8 -6 -4 -2 0
AFR
[kg
/kg]
SOIm [°ATDC]
N4 N5 N6
42434445464748495051
-10 -8 -6 -4 -2 0
90
% a
ngl
e [d
eg]
SOIm [°ATDC]
N4 N5 N6
620
625
630
635
640
645
650
655
-10 -8 -6 -4 -2 0
Exh
aust
tem
per
atu
re [
C]
SOIm [°ATDC]
N4 N5 N6

184
The cylinder pressure data in Figure 7.14 shows the most advanced and most retarded SOIm
timings. The injection duration at this key point is long (1500 μs) and liquid fuel is injected
during the combustion event.
There are small differences in the pressure traces between each of the nozzles, with N4
having the lowest maximum cylinder pressure of 154.3 bar. Nozzle N6 has the highest
cylinder pressure of 159.4 bar. Maximum cylinder pressure at all SOIm timings is around
2.8 % - 3.3 % higher for N6 than N4. Typically this indicates that combustion is more
diffusive for nozzle N4, which could explain the difference in smoke output observed
between both injectors.

185
Figure 7.14 Cylinder pressure data for the nozzle study at 2000FL. From top to bottom,
SOIm -8 °ATDC and SOIm -2°ATDC
50
70
90
110
130
150
170
190
210
230
250
-20 -10 0 10 20 30 40
PC
YL1
[b
ar]
CAD [°ATDC]
N4 N5 N6
50
70
90
110
130
150
170
190
210
230
250
-20 -10 0 10 20 30 40
PC
YL1
[b
ar]
CAD [°ATDC]
N4 N5 N6

186
7.2 Conclusions of the Injector Nozzle Study
In the nozzle study at part load, the data shows that generally there is little or no difference
in the thermal behaviour of the engine, within the limits of accuracy, when the number and
size of the holes in the injector nozzle of the prototype system are changed. For key points
KP2 and KP3 the SOIm curves of isNOx versus isFC at each EGR conditions are similar for all
nozzles.
At KP3, the isFC for the nozzle with 9 holes is higher by 1.34% at the lowest EGR rate, but as
the EGR rate increases the isFC for all nozzles is similar until the timing is retarded. The isFC
is better for the nozzle with 9 holes as it forms an ignitable mixture sooner than the other
nozzles. This means that combustion is more stable with the 9 hole injector upon a timing
retard. When the number of holes increases, the combustion mode appears to change to
LTC, where isNOx and Smoke simultaneously reduce as the SOIm retards.
At KP2, the isFC for the 9 hole nozzle improves relative to the nozzles with 7 and 8 holes and
in general as the number of holes increases then the isFC improves. The smoke number is
small for all injectors at this key point meaning that there is no effect on smoke when the
number of nozzle holes is reduced. The other pollutants, such as isCO and isHC reduce when
the number of nozzle holes increases at this key point. For the same SOIm for each nozzle,
the number of nozzle holes advances the combustion phasing, meaning that the combustion
remains stable when the SOIm retards.
At the lowest load key point KP1 the trend is different to KP2, the isFC is highest for the
nozzle with 9 holes at the highest EGR rate. When the EGR rate is 33.5 % the nozzle with 9
holes has the lowest isFC but as the timing retards the isFC is the highest. It is not clear as to
why this occurs with the nozzle with 9 holes. The isFC at the highest EGR rate increases as
the number of nozzle holes increases.
At 4000FL the isFC, smoke and isCO are highest for the 9 holes nozzle. There is no
observable trend with increased hole numbers for the nozzles at this key point. Combustion
is slower as the number of nozzle holes increases, which is reflected in the 90 % burn angle
and the exhaust temperature. When the speed is the highest, the smaller droplets and
increased number spray plumes is detrimental to the distribution of fuel and to the

187
combustion. This is not the case at 2000FL, even when the AFR is low due to the increased
load, there is enough time for combustion to complete when the hole number increases.
Overall at part load, the increased number of holes results in the lowest pollutants but there
is a compromise in isFC. When the load is lowest at KP1 there is no smoke production, which
means there is no benefit having the 9 hole injector. As the load increases however the
smoke number reduces at the most retarded SOIm for an equivalent isFC. Testing at higher
part load speeds that are still NEDC relevant would indicate whether using the injector is
suitable. At full load when the speed is 4000 RPM there is a marginal increase in isFC and
smoke with the injector with 9 holes. This indicates an increase in the number of holes is
detrimental at higher speeds and loads. As with the bowl selection there has to be a
compromise between full load and part load operation. The priority for vehicle certification
has to be with the performance of the injector nozzle holes at the part load condition, which
means that for lower engine output emissions the nozzle with more holes is better.

188
8 The Effect of Pilot Injection Event on Unconventional Combustion
Systems
The following section presents the results of the investigation into the performance of the
optimum combustion system bowl B4, with a pilot injection added. The objective of the
characterisation process, reported in chapter 5, was to identify the combustion chamber
design which had the best combination of efficiency and emissions over the range of speed
and load conditions tested. In this investigation a single injection event was used with the
start of injection SOIm and fuel quantity varied, and all other engine variables fixed. In this
chapter results from an investigation into the effects of pilot timing, pilot size and
separation on the response of the unconventional combustion system are reported.
The characterisation study identified the control of the fuel penetration and ignition delay
as the keys to clean and efficient operation. The optimisation of the combustion system
spray targeting at KP3 (in the protrusion tests) meant that the resulting response at KP1 and
KP2 had higher than normal CO and HC emissions with a resulting fuel consumption penalty
(due mostly to the low fuel conversion efficiency). This was more pronounced with the
conventional bowl designs. This could be a consequence of the in-cylinder conditions at KP1
and KP2 resulting in the fuel penetration being high. When coupled with poorly matched
spray targeting this would cause the fuel to be distributed away from the main bowl region.
This phenomenon would have the effect of increasing the ignition delay and in turn allowing
the fuel to penetrate further into the quench region.
In this chapter methods for controlling the ignition delay were investigated so that when
employing the idealised fuel spray targeting for KP3 the engine outputs at the lower load
conditions could be improved. It was expected that this would lead to an improvement in
the fuel distribution of the main injection process. Additionally, the response at KP3 was
examined to establish whether any further gains in performance could be made at this
condition.

189
8.1 Method and Definitions
Pilot size and separation were tested, with a fixed main SOIm timing. For each size and
separation, a timing swing of the pilot and main was carried out to assess their interaction.
Three sizes of pilot were selected; one conventional small size pilot used for noise reduction
and two larger pulses used in advanced combustion modes (Tanaka et al., 2002, Carlucci et
al., 2005, Choi et al., 2005, Mancaruso et al., 2008, Benajes et al., 2008, Anselmi et al.,
2010). The pilot separation was selected from zero separation so that the interaction of the
pilot combustion with the main injection varied.
The size of the injection can either be defined in terms of injected mass or the total duration
of the injection event, which includes the opening and closing of the needle. The latter
method was used in this work to define all injection events as no flow data was available for
the injector. The size of the smallest pilot was selected by increasing the injection duration
until the minimum opening that has an influence on the combustion process that could be
achieved. The pilot size was established by measuring the fuel consumption with and
without a pilot using a fixed injection duration. The in-cylinder conditions matched the key
points tested for injector nozzle back pressure purposes. The pilot injected mass was
calculated by taking the mass difference between a pilot and single injection. The separation
for each injection was defined as the time between the end of the pilot injection event and
the demand for the main injection event and is shown in the following Figure 8.1.
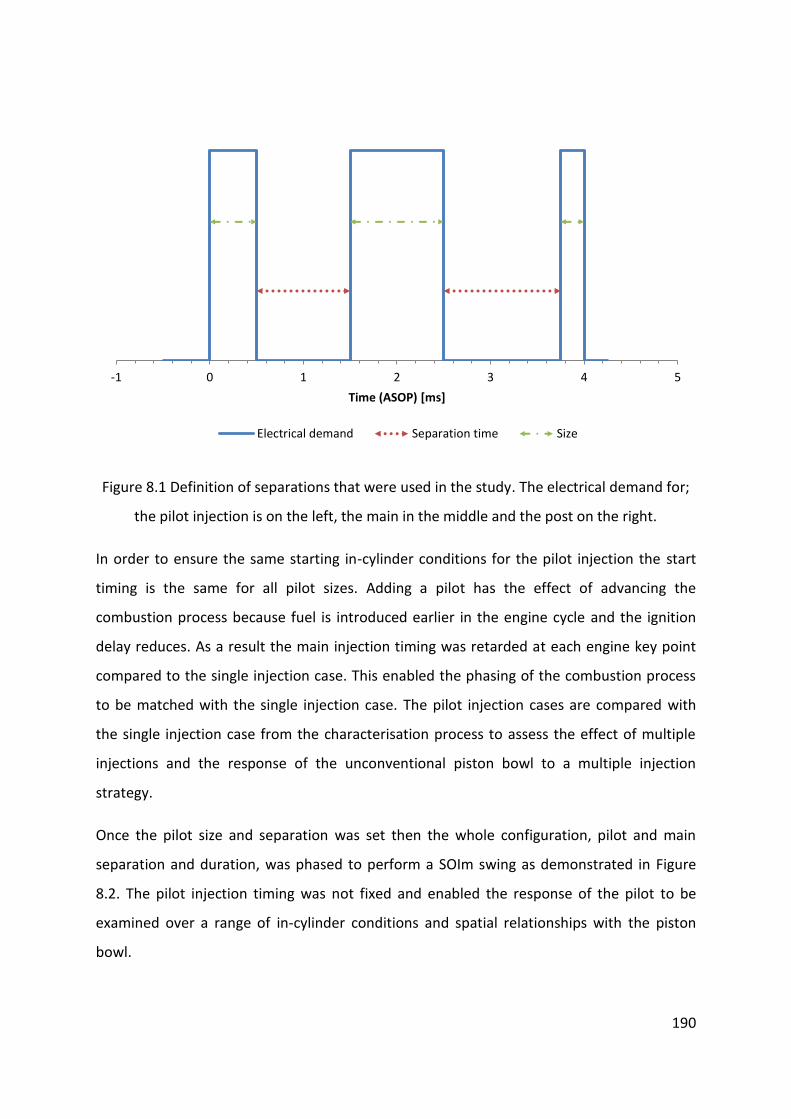
190
Figure 8.1 Definition of separations that were used in the study. The electrical demand for;
the pilot injection is on the left, the main in the middle and the post on the right.
In order to ensure the same starting in-cylinder conditions for the pilot injection the start
timing is the same for all pilot sizes. Adding a pilot has the effect of advancing the
combustion process because fuel is introduced earlier in the engine cycle and the ignition
delay reduces. As a result the main injection timing was retarded at each engine key point
compared to the single injection case. This enabled the phasing of the combustion process
to be matched with the single injection case. The pilot injection cases are compared with
the single injection case from the characterisation process to assess the effect of multiple
injections and the response of the unconventional piston bowl to a multiple injection
strategy.
Once the pilot size and separation was set then the whole configuration, pilot and main
separation and duration, was phased to perform a SOIm swing as demonstrated in Figure
8.2. The pilot injection timing was not fixed and enabled the response of the pilot to be
examined over a range of in-cylinder conditions and spatial relationships with the piston
bowl.
-1 0 1 2 3 4 5
Time (ASOP) [ms]
Electrical demand Separation time Size

191
Figure 8.2 Schematic showing the process of retarding the injection event, The blue trace
shows the initial set up and the dotted trace shows the set up as the timing is retarded.
-40 -30 -20 -10 0 10 20 30 40
CAD [°ATDC]
Electrical demand Electrical demand Injection retard

192
8.2 Experimental Results
The cylinder pressure data in the following section is shown with a schematic of the needle
lift trace for the injection event. The trace is intended to show the needle lift during the
pilot injection event. An example is shown in Figure 8.3.
Figure 8.3 Example cylinder pressure data with pilot injection needle schematic
0
20
40
60
80
100
120
140
-20 -10 0 10 20 30 40
PC
YL1
[b
ar]
CAD [°ATDC]
SOIm -5.6 SOIm -3.6 SOIm -1.6 SOIm 0.4

193
8.2.1 KP3 Test
The comparison points at KP3 were taken when the separation to the main injection was
800 μs and the pilot was 1.3 mg/injection. The test point data was logged and is presented
in the following Table 8.1.
Test name
Speed Load Intake temp
Intake pressure
EGR rate
Pilot size
PiIot sep
Rail pressure
SOIm range
RPM GIMEP °C barA % mg μs bar °ATDC
KP3 test 2000 9
41.7 1.47 26.9 N/A N/A 1050
-9,-7, -5,-3
KP3 test-a3
42.2 1.47 27 1.3 800 -5.6,-3.6, -1.6,0.4
Table 8.1 KP3 multiple injection test settings
The pressure traces in Figure 8.4 show the differences between a single injection event and
a pilot injection event. As with the protrusion and characterisation tests, the single injection
event pressure trace shows that the majority of the injection event is complete before start
of the pressure rise. The delay between the end of the injection event and the start of
combustion increases as the injection event is retarded.
When a pilot is added and the main injection is retarded, a small proportion of heat release
occurs around TDC. This causes a pressure rise and a temperature rise. The temperature rise
reduces the ignition delay of the main injection event leading to more diffusive combustion.
The peak of the pressure rise for the single injection event at the most advanced injection
timing occurs at 5.5°ATDC with a magnitude of 101 bar compared to a peak of pressure that
occurs at 8.1°ATDC with a magnitude of 89.4 bar for the most advanced multiple injection
test. The gradient of the main combustion pressure rise is shallower for the pilot injection
event, which is due to diffusive combustion.

194
Figure 8.4 Cylinder pressure traces and injection schematics for the single (top) and pilot
(bottom) cases
0
20
40
60
80
100
120
140
-20 -10 0 10 20 30 40
PC
YL1
[b
ar]
CAD [°ATDC]
SOIm -9 SOIm -7 SOIm -5 SOIm -3
0
20
40
60
80
100
120
140
-20 -10 0 10 20 30 40
PC
YL1
[b
ar]
CAD [°ATDC]
SOIm -5.6 SOIm -3.6 SOIm -1.6 SOIm 0.4

195
Figure 8.5 shows the combustion analysis for the single and the pilot injection at two SOIm
conditions. The first shows the high temperature heat release starting at the same time
(-2°ATDC). In the second case the SOIm was similar (-5°ATDC for the single event
and -5.6°ATDC for the pilot and main event).
The first comparison shows that a small heat release occurs at -5°ATDC for the pilot
injection. It also shows that the peak of heat release rate is lower for the pilot injection
event. The peak is fractionally later and the tail proportion appeared larger for the pilot
injection event.
When compared at a similar SOIm, the shorter ignition delay caused by the pilot injection
event is apparent. The combustion of the single injection event initiates at 2°ATDC, which is
a delay of 4° compared to the pilot injection event. The emissions results from the testing
can be seen in the following Figure 8.6.

196
Figure 8.5 Apparent net heat release rate traces and injection schematics for the single
(blue) and pilot (red) injection cases. Plots show approximately the same phasing (top) and
the same SOIm (bottom)
-0.05
0
0.05
0.1
0.15
0.2
0.25
0.3
-20 -10 0 10 20 30
aHR
R [
kJ/d
eg]
CAD [°ATDC]
SOIm -9 SOIm -5.6
-0.05
0
0.05
0.1
0.15
0.2
0.25
0.3
-20 -10 0 10 20 30
aHR
R [
kJ/d
eg]
CAD [°ATDC]
SOIm -5 SOIm -5.6

197
Figure 8.6 Performance and emmissions data for the single and pilot injection case at KP3
184
186
188
190
192
194
196
198
0 0.5 1 1.5
isFC
[g/
kW.h
]
isNOx [g/(kW.h)]
KP3 single KP3 Sep: 800
0
0.5
1
1.5
2
2.5
0 0.5 1 1.5
Smo
ke [
FSN
]
isNOx [g/(kW.h)]
KP3 single KP3 Sep: 800
0
0.5
1
1.5
2
2.5
3
3.5
0 0.5 1 1.5
isC
O [
g/(k
W.h
)]
isNOx [g/(kW.h)]
KP3 single KP3 Sep: 800
0
0.1
0.2
0.3
0.4
0.5
0 0.5 1 1.5
isH
C [
g/(k
W.h
)]
isNOx [g/(kW.h)]
KP3 single KP3 Sep: 800
92
94
96
98
100
102
0 0.5 1 1.5
No
ise
[d
B]
isNOx [g/(kW.h)]
KP3 single KP3 Sep: 800
0
5
10
15
20
25
0 0.5 1 1.5
dp
/dθ
[b
ar/d
eg]
isNOx [g/(kW.h)]
KP3 single KP3 Sep: 800

198
The pilot injection changes the characteristic of the emissions output compared to the single
injection case. The indicators of premixed combustion for the single injection case are the
low smoke number and the high HC and CO.
Figure 8.6 shows that the addition of the pilot improves the isFC by 1.5 % to 2 % over the
SOIm range. When the combustion rate of heat release is reduced the heat rejection in heat
transfer losses in-cylinder (HLht,C) is reduced thus increasing engine efficiency. At the same
time, because the combustion rate is reduced, the pilot injection case is more sensitive to
the timing retard meaning more heat is rejected through the exhaust. This is the same
observation as the injector type test, where the lower rate of injection of the conventional
system results in an improvement in isFC because heat transfer and crevice losses were
reduced.
Figure 8.6 shows that the pilot injection results in rich combustion leading to the formation
of particulates. At all combinations of SOIm the smoke emissions are greater than the single
injection event, the largest value, 1.93 FSN occurs at 0.49 g/kWh isNOx. This is significantly
higher than the single injection event which reached a maximum of 0.44 FSN at 0.55 g/kWh
isNOx (SOIm=-3°ATDC). The smoke number appears to plateau as the injection timing is
retarded; the last two smoke numbers are 1.92 FSN and 1.93 FSN at 0.52 g/kWh and
0.49 g/kWh respectively.
isCO and isHC are lower than the single injection event which suggests that the combustion
mode has become diffusive. Long ignition delays lead to the fuel spray becoming too lean
and products of incomplete combustion such as CO and HC are formed. The isCO of the pilot
injection case is 0.65 g/kWh to 1.6 g/kWh lower than the single injection case for all SOIm.
The emission of isHC did not change significantly for the pilot injection case for the range of
SOIm. The value varies from 0.17 g/kWh to 0.19 g/kWh, which is lower than the single
injection case.
The observed reductions in pressure rise rate results in a noise reduction which is observed
for all SOIm timings. At the most retarded timings for the pilot injection, the noise value is
92.8dB compared to 98.8dB for the single injection event. The reduction in combustion

199
noise is due to the reduction in the premixed peak, which reduces the pressure rise rate
during combustion.

200
8.2.2 KP2 Test
The comparison points at KP2 were taken when the separation to the main injection was
1200 μs and the pilot was 6.8 mg/injection. The test points that were logged are presented
in the following Table 8.2.
Test name
Speed Load Intake temp
Intake pressure
EGR rate
Pilot size
PiIot sep
Rail pressure
SOIm range
RPM GIMEP °C barA % mg μs bar °ATDC
KP2 test 1500 6
41 1.16 33 0 0 800
-10,-8,-6,-5
KP2 test - a4
42.7 1.16 33.9 6.8 1200 -4.7,-2.7, -0.7,1.3
Table 8.2 KP2 multiple injection test settings
The pressure traces in Figure 8.7 show the single and pilot injection case with EGR at KP2.
For the single injection case, the combustion process is highly premixed and the injection
event completes before combustion starts. At the most retarded SOIm the main pressure
rise does not occur until 10° after the needle has closed. At the most advanced SOIm
(-4.7°ATDC) for the pilot injection case, combustion of the main proportion of fuel initiates
closer to the end of the main injection event compared to the single injection case. With the
pilot, the first observed pressure rise occurs around -2°ATDC. The pressure and temperature
rise reduces the ignition delay of the main injection event. The pilot injection is 41 % of the
total fuel injected which makes the heat release of the pilot injection significant.
The pressure rise rate is suppressed by the pilot injection when compared to the single
injection case. At the most retarded single injection condition, combustion is significantly
retarded initiating at 12°ATDC. The pressure rise is suppressed at this condition because the
piston expansion is significant. This is the only condition where the suppression of the
pressure rise rate is less for the single injection case but this is an extreme case with a
significant ignition delay for the single injection case due to the high EGR rate and retarded
injection timing.

201
Figure 8.7 Cylinder pressure traces and injection schematics for the single (top) and pilot
(bottom) injection cases
20
30
40
50
60
70
80
90
100
110
-20 -10 0 10 20 30 40
PC
YL1
[b
ar]
CAD [°ATDC]
SOIm -10 SOIm -8 SOIm -6 SOIm -5
20
30
40
50
60
70
80
90
100
110
-20 -10 0 10 20 30 40
PC
YL1
[b
ar]
CAD [°ATDC]
SOIm -4.7 SOIm -2.7 SOIm -0.7 SOIm 1.3

202
Combustion analysis shows the effect of the pilot injection. The comparison at this key point
is made at two different single injection conditions. The first is the most advanced SOIm for
the single injection and the pilot injection with an SOIm of -2.7°ATDC. These test points
were closest in terms of combustion initiation. Figure 8.8 shows that the pilot combustion
actually occurs at the beginning of the main injection event. The main injection ignites due
to the combustion of the pilot, which reduces the amount of time for the mixture formation
process. As a result, the peak of heat release rate is reduced, which explains the slower
pressure rise rate of the pilot injection case.
The second comparison shows when the main injection of both the pilot and single injection
case is approximately the same (-5°ATDC for the single case and -4.7°ATDC for the pilot
case). The single injection case has an extremely long ignition delay relative to the pilot
injection event. This is due to a combination of the fuel spray being lean, the lower
temperature as the cylinder expands and the effect of the low oxygen concentration due to
the EGR. The peak of the heat release rate is lower than the pilot injection case as the heat
release rate is suppressed by the lower temperature after TDC. The effect of this change in
the combustion characteristic can be seen in the emissions results that follow.

203
Figure 8.8 Apparent net heat release rate traces and injection schematics for the single
(blue) and pilot (red) injection cases. Plots show approximately the same phasing (top) and
the same SOIm (bottom)
-0.05
0
0.05
0.1
0.15
0.2
0.25
0.3
-20 -10 0 10 20 30 40
aHR
R [
kJ/d
eg]
CAD [°ATDC]
SOIm -10 SOIm -2.7
-0.05
0
0.05
0.1
0.15
0.2
0.25
0.3
-20 -10 0 10 20 30 40
aHR
R [
kJ/d
eg]
CAD [°ATDC]
SOIm -5 SOIm -4.7
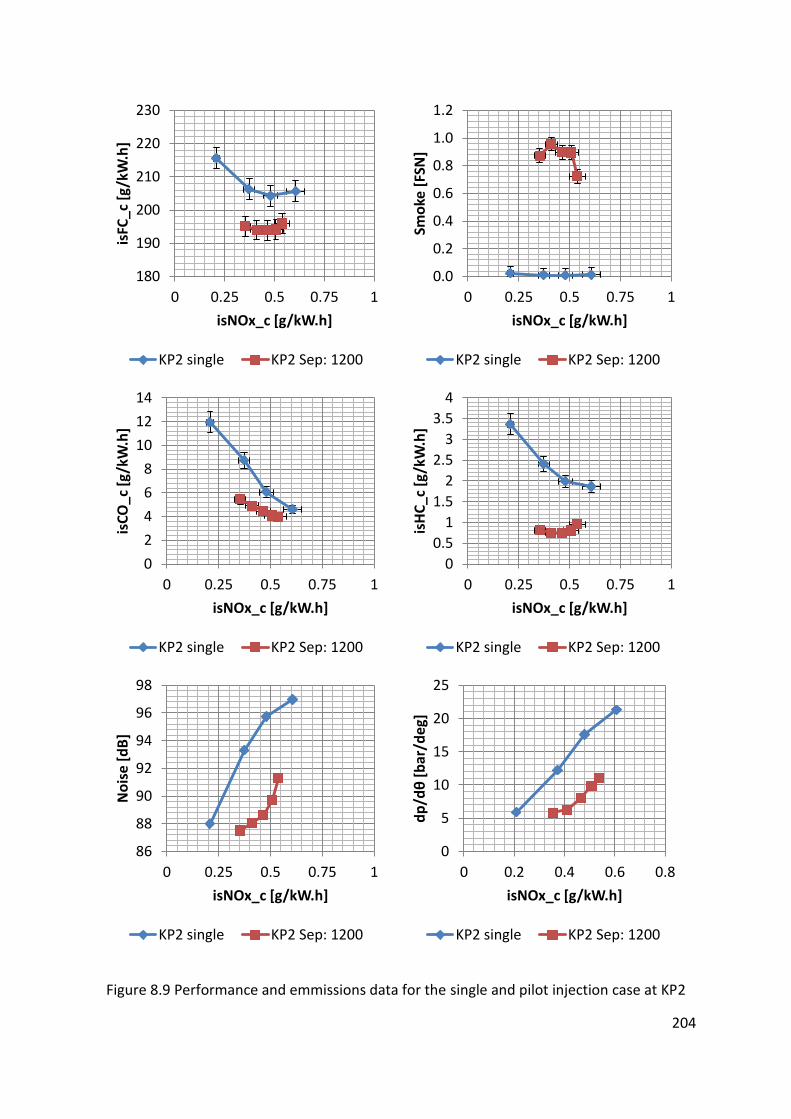
204
Figure 8.9 Performance and emmissions data for the single and pilot injection case at KP2
180
190
200
210
220
230
0 0.25 0.5 0.75 1
isFC
_c [
g/kW
.h]
isNOx_c [g/kW.h]
KP2 single KP2 Sep: 1200
0.0
0.2
0.4
0.6
0.8
1.0
1.2
0 0.25 0.5 0.75 1
Smo
ke [
FSN
]
isNOx_c [g/kW.h]
KP2 single KP2 Sep: 1200
0
2
4
6
8
10
12
14
0 0.25 0.5 0.75 1
isC
O_c
[g/
kW.h
]
isNOx_c [g/kW.h]
KP2 single KP2 Sep: 1200
0
0.5
1
1.5
2
2.5
3
3.5
4
0 0.25 0.5 0.75 1
isH
C_c
[g/
kW.h
]
isNOx_c [g/kW.h]
KP2 single KP2 Sep: 1200
86
88
90
92
94
96
98
0 0.25 0.5 0.75 1
No
ise
[d
B]
isNOx_c [g/kW.h]
KP2 single KP2 Sep: 1200
0
5
10
15
20
25
0 0.2 0.4 0.6 0.8
dp
/dθ
[b
ar/d
eg]
isNOx_c [g/kW.h]
KP2 single KP2 Sep: 1200

205
Adding a large pilot (6.8mg/injection) to the injection set up results in a significant benefit to
the fuel consumption. At around 0.48 g/kWh isNOx for the single injection event, the isFC is
reduced by 5.1 % by adding a pilot. The response to a retard in SOIm of the main injection
(with a fixed pilot separation) is flat, varying less than 0.5 % from the most advanced to the
most retarded injection.
The cylinder pressure trace indicates that this is due to the fact that combustion does not
phase in the same way with the SOIm. For the single injection case, when the SOIm is
retarded from -10°ATDC to -8°ATDC, -8°ATDC to -6°ATDC and -6°ATDC to -5°ATDC, the angle
that the maximum pressure occurrs at (apMax) phases 2.5°, 3.7° and 4.9° respectively with
each step in SOIm. For the pilot injection case, when the SOIm is retarded by 2°, apMax
phases at 0.9°, 1.6° and 1.8° respectively. Combustion does not retard significantly in the
pilot injection case meaning that more heat is available for conversion into work rather than
being rejected into the exhaust.
For the single injection case the emission of carbon was mainly CO and HC with little smoke
emission. Indeed the level of smoke measured was within the uncertainty of the smoke
meter. The combustion data reflects this as the ignition delay was long and the combustion
highly premixed. When adding a large pilot the effect on the smoke was significant. At
0.48 g/kWh isNOx the smoke number was 0.9 FSN for the pilot injection compared to
0.01 FSN for the single injection. The smoke number increases up to the point that the SOIm
is the most retarded, when the smoke number again begins to fall.
The pilot reduces CO and HC simultaneously. The CO emission at 0.48 g/kWh isNOx falls
from 6.1 g/kWh to 4.4 g/kWh. HC reduces from 2 g/kWh to 0.75 g/kWh. This was expected
as the ignition delay was reduced, limiting the fuel spray penetration and over mixing before
combustion initiates.
Finally, the pressure rise rate and the noise output were reduced with a pilot injection. This
effect diminished as the combustion of the single injection case retarded and the pressure
rise was suppressed by the gas expansion after TDC.

206
8.2.3 KP1 Test
The comparison points at KP1 were taken when the separation to the main injection was
1200 μs and the pilot was 1 mg/injection. The logged test points are in the following Table
8.3.
Test name
Speed
Load Intake temp
Intake pressur
e
EGR rate
Pilot size
PiIot sep
Rail pressure
SOIm range
RPM GIMEP °C barA % mg μs bar °ATDC
KP1 test 1500 3
71.4 1.03 38.2 0 0 600
-10,-9, -8,-7
KP1 test - a4
73.3 1.03 38.7 1 1200 -5.6,-4.6, -3.6,-2.6
Table 8.3 KP1 multiple injection test settings
The pressure traces in Figure 8.10 show the effect of adding a pilot injection to a single
injection at KP1. The single injection cylinder pressure trace indicates that the combustion is
highly premixed with a long delay between the needle closure and the main rise of the
cylinder pressure. The delay is 6° for the most advanced SOIm and 8° for the most retarded
SOIm.
With the pilot injection there is a shorter delay between the end of the main injection and
the start of the cylinder pressure rise due to pilot combustion. The delay between the end
of the injection and the start of the main heat release for the most advanced SOIm is 0.5°. It
is the same delay at all SOIm. The pressure rise rate and maximum cylinder pressure are
both reduced by adding a pilot injection when the combustion is phased identically. For the
single injection case, at an SOIm of -10°ATDC the maximum cylinder pressure of 52.7 bar
occurs at 7.4°ATDC, for the pilot injection, the maximum cylinder pressure is 49.7 bar and
occurs at 8.2°ATDC.

207
Figure 8.10 Cylinder pressure traces and injection schematics for the single (top) and pilot
(bottom) injection cases
20
30
40
50
60
70
80
-20 -10 0 10 20 30 40
PC
YL1
[b
ar]
CAD [degATDC]
SOIm -10 SOIm -9 SOIm -8 SOIm -7
20
30
40
50
60
70
80
-20 -10 0 10 20 30 40
PC
YL1
[b
ar]
CAD [degATDC]
SOIm -5.6 SOIm -4.6 SOIm -3.6 SOIm -2.6

208
Combustion analysis shows the effect of adding a small pilot to KP1. Figure 8.11 shows that
when combustion is phased the same the peak of heat release is lower for the pilot
injection. The pilot injection appears to release heat just before TDC around the time of the
main injection event. The reduced ignition delay of the main injection reduces the time
available for fuel spray penetration and over mixing.
When the SOIm of the single and the pilot injection are approximately the same (-7°ATDC
for the single injection and -5.6° ATDC for the pilot injection was the best available
comparison) the combustion is significantly retarded for the single injection. The peak of the
heat release rate occurs at 9.5°ATDC for the single injection case compared to 4°ATDC for
the pilot case. This is 10° and 4.5° after the end of injection for the single and pilot case
respectively.

209
Figure 8.11 Apparent net heat release rate traces and injection schematics for the single
(blue) and pilot (red) injection cases. Plots show approximately the same phasing (top) and
the same SOIm (bottom)
-0.02
0
0.02
0.04
0.06
0.08
0.1
0.12
-20 -10 0 10 20 30 40
aHR
R [
kJ/d
eg]
CAD [°ATDC]
SOIm -10 SOIm -3.6
-0.02
0
0.02
0.04
0.06
0.08
0.1
0.12
-20 -10 0 10 20 30 40
aHR
R [
kJ/d
eg]
CAD [°ATDC]
SOIm -7 SOIm -5.6

210
The effect of the change in combustion on emission and fuel consumption can be seen in
the following Figure 8.13. The addition of the pilot at all of the SOIm, results in improvement
of isFC_c. The most retarded SOIm for the pilot injection is the lowest isFC_c at 203 g/kWh
for an isNOx of 0.95 g/kWh. The single injection case is 8.2 % higher at 219.6 g/kWh at an
isNOx of 0.98 g/kWh. The pilot injection case isFC_c continues to improve as the SOIm
retards. This could be due to the more advanced combustion initiated by the pilot injection.
Based on the cylinder analysis the reason for the improvement in isFC_c can be identified.
When combustion is phased the same (SOIm -10°ATDC for the single injection and
SOIm -3.6°ATDC for the pilot injection case), the biggest improvement in the efficiency is
from the increase in the conversion of fuel into heat. The pilot injection case fuel conversion
efficiency improves by 0.13 kW (2.7 %) for the pilot injection. This is due to the fuel
penetration being reduced by the shorter ignition delay, localising combustion and reducing
the amount of fuel in the main injection that is too lean to ignite. The rate of heat release is
suppressed with the pilot combustion and the heat lost through heat transfer is reduced by
0.11 kW (2.3 %) from the single to the pilot injection case when combustion is phased the
same.
Figure 8.12 Energy diagram for the comparison of the effect of pilot injection on combustion
When the start of the main injection is phased similarly (SOIm at -7°ATDC for the single
injection, SOIm at -5.6°ATDC for the pilot injection case), there is a reduction of 4.3 % in fuel
1.86 1.87 1.87 1.85
1.83 1.82 2.00 1.75
0.88 0.77 0.66 0.91
0.23 0.10 0.31 0.10
0
1
2
3
4
5
-10.00 -3.60 -7.00 -5.60
Fuel
po
wer
Configuration
W,i,g HL exh HL ht,C η fc

211
conversion losses from the single injection event. The rejected heat for both cases is the
same (2.66 kW) however the distribution changes between the single and the pilot case. For
the single injection case 2 kW is rejected through the exhaust compared to 1.75 kW for the
pilot case. The retarded combustion timing seen with the single injection case explains why
more heat is rejected through the exhaust.
The difference in heat transfer and crevice loss is 0.24 kW between the two cases. The
combustion characteristic of the pilot injection case means the temperature is higher and
increases closer to TDC. Generally the heat transfer and crevice losses are higher when
combustion occurrs closer to TDC in an SOIm swing.
As observed with the addition of a pilot injection at KP3 and KP2, the smoke emission
increases due to the heat release of the pilot whilst fuel is injected in the main event. Time
for adequate evaporation and mixing is not available leading to the formation of
particulates and a reduction in CO and HC. The smoke number increases to 0.1 FSN from
being undetectable with a single injection. The increase in smoke number is less significant
than the previous test points, possibly due to the higher AFR at the reduced load and
smaller quantity of fuel injected.
The pilot injection reduces the ignition delay and fuel spray penetration before combustion
inititates. Over penetration of the fuel prior to combustion is thought to be the cause of the
excessive HC and CO emissions due to the fuel spray becoming overly lean and the
temperature being too low (Miles, 2010). Figure 8.13 shows that the CO emission is reduced
by 65 % from 25.7 g/kWh 9 g/kWh at 0.98 g/kWh. HC is reduced by 71.5 % from
6.27 g/gkWh to 1.79 g/kWh.

212
Figure 8.13 Performance and emmissions data for the single and pilot injection case at KP1
195
200
205
210
215
220
225
230
0 0.5 1 1.5
isFC
_c [
g/kW
.h]
isNOx_c [g/kW.h]
KP1 single KP1 Sep: 1200
0
0.05
0.1
0.15
0.2
0 0.5 1 1.5
Smo
ke [
FSN
]
isNOx_c [g/kW.h]
KP1 single KP1 Sep: 1200
0
5
10
15
20
25
30
35
0 0.5 1 1.5
isC
O_c
[g/
kW.h
]
isNOx_c [g/kW.h]
KP1 single KP1 Sep: 1200
0
2
4
6
8
10
0 0.5 1 1.5
isH
C_c
[g/
kW.h
]
isNOx_c [g/kW.h]
KP1 single KP1 Sep: 1200
84
85
86
87
88
89
90
91
0 0.5 1 1.5
No
ise
[d
B]
isNOx_c [g/kW.h]
KP1 single KP1 Sep: 1200
0
2
4
6
8
10
0 0.5 1 1.5
dp
/dθ
[b
ar/d
eg]
isNOx_c [g/kW.h]
KP1 single KP1 Sep: 1200

213
8.3 Conclusion of the Pilot Injection Study
The characterisation results demonstrated that at the part load key points selected the
single injection strategy leads to highly premixed combustion, with a high rate of heat
release and rapid pressure rise rates. This resulted in emissions of CO and HC at KP1 and KP2
but no measureable emission of smoke at these key points. Testing with a pilot injection has
shown that the isFC and emissions of CO and HC can be reduced but at the expense of the
smoke output.
The reason for this is that the pilot injection causes some heat release to occur around the
main injection event. This reduces the time for the fuel and air to mix before combustion
initiates, causing the fuel to break down in a high temperature fuel rich environment. The
fuel spray penetration is reduced by the shortened ignition delay, which reduces the
distribution of fuel further into the combustion chamber. At KP1 and KP2 this is important
because the load is low enough that the fuel spray can become overly lean.
At all key points the fuel consumption was improved by the addition of a pilot injection. This
was either due to a smaller amount of energy being lost through the exhaust or through
heat transfer to the coolant. The heat transfer to the coolant was reduced in some cases
because the rapid pressure and temperature rise was suppressed by the combustion
becoming diffusive due to the heat release of the pilot injection.
Testing at KP3 and KP2 demonstrated that when a pilot is added and the SOIm retards, the
Smoke numbers either reduce or stay the same. This is an indicator that combustion is
switching to a low temperature mode where NOx and smoke are reduced simultaneously.
Further tests have shown that low temperature combustion is possible on the
unconventional bowl design and this is presented in the following section.

214
8.4 Low Temperature Combustion with a Retarded Injection
At KP3 there is an interesting response observed as the start of injection timing is retarded
beyond the normal window used for testing. Figure 8.6 shows that as the SOIm is retarded
the smoke response reaches a maximum value. There is potential for further retarding
without an increase in smoke number. Therefore a test was conducted where the SOIm was
retarded further to observe whether there would be a reduction in smoke by running in a
late injection low temperature Diesel combustion mode.
Test name Speed Load
Intake temp
Intake pressure
EGR rate
Exhaust pressure
Rail pressure
Pilot size Pilot
separation SOIm range
RPM GIMEP °C barA % barA bar mg/inj μs °ATDC
KP3 test 2000 9 42.4 1.47 27.1 2.05 1050 1.3 0, 400,
800, 1200
-9,-7,-5,-3 -5.7,-3.7, -1.7,0.3,
2.3 Table 8.4 Test data for the pilot injection test at KP3.
Table 8.4 contains the test data used when retarding the SOIm beyond the normal window.
The smallest pilot (1.3 mg/injection) was used, the SOIm and the separation of the main
injection and the pilot were fixed and a timing retard was carried out using the same
procedure as the characterisation tests. These tests were defined by the separation of the
pilot to the main injection. The pilot tests were compared to the single injection case. Figure
8.14 shows the experimental data from these tests.
All of the pilot injection cases result in an improvement in isFC. This was previously observed
with the single pilot test seen in 8.2.1. When the timing was retarded, the isFC deteriorates
in the same way for all pilot cases with little difference observed between the individual
curves. At the most retarded condition the isFC is the highest (197.5 g/kWh) when the
separation is fixed at 400 μs, but the isNOx is the lowest at 0.42 g/kWh.

215
Figure 8.14 Performance and emissions data for the LTC with retarded injection timings
When the separation to the main injection is set at 0 μs, the smoke output is the lowest of
all the pilot cases, 0.52 FSN with 0.89 g/kWh isNOx at the most advanced timing. The trend
curve is lower than the other pilot injection cases when the timing retards. When the SOIm
timing is set to the most retarded timing of 2.3°ATDC, the smoke number reduces to
0.27 FSN at 0.45 g/kWh isNOx. The prototype fuel injection hardware means the pilot
180
185
190
195
200
205
0 0.5 1 1.5
isFC
_c [
g/kW
.h]
isNOx_c [g/kW.h]
KP3 test SEP: 0
SEP: 400 SEP: 800
SEP: 1200
0
0.5
1
1.5
2
2.5
0 0.5 1 1.5
Smo
ke [
FSN
]
isNOx_c [g/kW.h]
KP3 test SEP: 0
SEP: 400 SEP: 800
SEP: 1200
0.0%
0.2%
0.4%
0.6%
0.8%
1.0%
0 0.5 1 1.5
CO
V G
IMEP
[%
]
isNOx_c [g/kW.h]
KP3 test SEP: 0
SEP: 400 SEP: 800
SEP: 1200
430
440
450
460
470
480
490
500
510
520
0 0.5 1 1.5
Exh
aust
tem
pe
ratu
re [
C]
isNOx_c [g/kW.h]
KP3 test SEP: 0
SEP: 400 SEP: 800
SEP: 1200

216
spacing is set without a delay between the end of the pilot and the start of the main
injection. The pilot injection does not release heat during the main injection event. The pilot
injection cases have similar efficiency as the timing was retarded, but there is an
improvement over the single injection case.
Combustion with a 400 μs separation between the pilot and the main injection results in the
largest reduction in smoke as the timing is retarded. The peak smoke number is 1.82 FSN
which occurs at 0.54 g/kWh when the SOIm is -1.7°ATDC. As the timing is retarded by 2° the
smoke number reduces to 1.2 FSN at 0.47 g/kWh isNOx. A further retard of 2° results in a
reduction of smoke to 0.32 FSN at 0.42 g/kWh. This is lower than the highly premixed single
injection case, in which smoke begins to increase as the SOIm is retarded. The single
injection case has an output of 0.44 FSN at 0.55 g/kWh isNOx.
The apparent heat release rate shown in Figure 8.15 is for the 400 μs separation of the pilot
to the main injection event. The figure shows that asthe injection timing is retarded the
peak of the main injection heat release occurs later after the end of the injection. At the two
most advanced timings the peak of heat release rate occurs at 0.7° before the end of the
main injection event (EOIm). This reduces to 0.3° before EOIm for an SOIm of -1.7°ATDC,
increases to 1.1° after EOIm for SOIm of 0.3°ATDC and eventually increases to 3.5° after
EOIm for an SOIm of 2.3°ATDC.

217
Figure 8.15 Apparent net heat release rate traces and injection schematics for the low
temperature combustion case
The process of retarding the main injection event with a fixed separation results in a
reduction in the rate of combustion of the main injection heat release as well as a reduction
in the peak of the pilot combustion. A reduction in the combustion rate as well as the delay
after the end of the main injection event correlates well with the reduction in the smoke
number observed. It appears that retarding the injection in this way results in the
combustion of the main injection of fuel happening after the pilot combustion, allowing
more time for the fuel and air to mix. The expansion of the gases after top dead centre
results in a temperature reduction during combustion, helping to reduce the smoke number
through low temperature combustion (Dec, 2009).
The smoke response shows that as the pilot separation increases from 0 μs to 1200 μs the
smoke number increases and then reduces for all but the most retarded SOIm. This trend is
shown in Figure 8.16. The most retarded SOIm, 2.3°ATDC, has the lowest emission of smoke
relative to all of the advanced timings used for each separation, but has a different
-0.05
0
0.05
0.1
0.15
0.2
0.25
-20 -10 0 10 20 30
aHR
R [
kJ/d
eg]
CAD [°ATDC]
5.7°ATDC -3.7°ATDC -1.7°ATDC 0.3°ATDC 2.3°ATDC

218
relationship between smoke and separation. The phasing of the combustion of the pilot fuel
quantity influences the mixture formation process.
Figure 8.16 Smoke versus pilot injection separation at each SOIm tested
The apparent net rate of heat release shown in Figure 8.17 shows that as the pilot
separation increases from the 0 μs there is a small amount of pilot releasing heat during the
main injection event. For the 400 μs separation the pilot heat release starts at -2°ATDC, just
as the needle reaches maximum lift. As the separation increases to 800 μs the pilot
combustion advances to -5°ATDC, just after the SOIm (-5.7°ATDC). Additionally, the peak of
the rate of heat release was lower than the 400 μs case.
0
0.5
1
1.5
2
2.5
0 200 400 600 800 1000 1200 1400
Smo
ke [
FSN
]
Pilot injection separation [μs]
-5.70 -3.70 -1.70 -0.30 2.30

219
Figure 8.17 Apparent net heat release rate traces and injection schematics for the pilot
injection separation test
As the pilot injection separation increases to 1200 μs, the peak of the heat release of the
pilot is lower than the 400 μs and 800 μs pilot separations. A smaller proportion of the pilot
injection releases heat which reduces the temperature at the start of the main injection
event compared to the other cases. When the separation is either 0 μs or 1200 μs there is
little or no combustion for the pilot injection compared with the other two pilot separations.
The smoke number was lower here because there was no heat release from the pilot
injection during the combustion of the main injection event.
-0.05
0
0.05
0.1
0.15
0.2
0.25
-30 -20 -10 0 10 20 30
aHR
R [
kJ/d
eg]
CAD [degATDC]
0μsec 400μsec 800μsec 1200μsec

220
8.6 Conclusions of Retarded Injection Timing Study
In carrying out the tests where the timing of the pilot injection cases were retarded further
after top dead centre, it was possible to achieve late injection low temperature combustion
on the unconventional piston bowl. The addition of the pilot meant that the combustion
could be retarded further compared to the single injection event where lower combustion
temperatures could be achieved avoiding the formation of smoke through temperature
suppression.
The prototype fuel injection hardware allowed the pilot spacing to be set without a delay
between the end of the pilot and the start of the main injection. This resulted in the lowest
smoke number for the range of SOIm timings tested because the pilot injection did not
release heat during the main injection event. The pilot injection cases showed similar
efficiency as the timing was retarded, but there was an improvement over the single
injection case.
The single injection case was highly premixed and it was found that the curve of isNOx
versus smoke increased as the timing was retarded. The only occasion the single injection
case achieved a reduction in smoke with a retard of the SOIm timing was when the hole size
was reduced and the hole number increased.

221
9 Conclusions
This thesis documents the research carried out on a light duty Diesel engine, using
conventional and unconventional piston bowl designs and conventional and prototype fuel
injection equipment. The research has shown that unconventional Diesel piston bowl
designs were more thermally efficient than the conventional designs, whilst still achieving
low levels of engine out emissions. The research has also shown that the prototype fuel
injection equipment could be used to achieve late injection low temperature combustion,
with no separation between the pilot and the main injection. Finally the research has added
further insight into the process of Diesel combustion through the analysis of engine gas
flows and in-cylinder pressure data from protrusion testing and characterisation testing.
The first step in this investigation was to examine the influence of the position of the fuel
spray centre on combustion system performance. Each of the piston bowls was tested over
a range of engine operating points with combustion system performance evaluated in terms
of regulated emissions (NOx, CO, HC and smoke) as well as fuel conversion efficiency. Based
upon the performance of the combustion system (combination of piston bowl shape and
position of the fuel spray centre) over all test conditions, an injector nozzle protrusion was
selected. For three of the bowls tested (B2, B3 and B4) a small protrusion (determined by
the use of a 3.1 mm washer installed on the injector) achieved the best overall performance.
The testing has shown that the benefit of using the 3.1 mm washer compared to the next
best washer for each bowl was; 2.4 %, 1.6 % and 0.5 %, for bowls B2, B3 and B4 respectively.
The exception was bowl B5 which required greater protrusion (using a 2.6 mm washer).
Optimising bowl B5 with the 3.1 mm washer to benefit Protrusion – 4000FL would have
sacrificed the fuel consumption improvement of approximately 1.6 % that was observed at
Protrusion – KP3. Increasing protrusion led to the deterioration of the combustion process.
For bowls B2, B3 and B4, the data suggested that the fuel spray entrained less air as the
protrusion was increased. This was indicated by the increase in smoke and CO as well as a
reduction in NOx. An analysis of the fuel spray impingement over the range of fuel injection
timings suggests that this was due to the fuel spray being concentrated in the bowl region,
without interacting with either the lip feature for the conventional bowls (B2 and B3) or the
pip feature for the unconventional bowl (B4). This analysis supports the conclusions of the
222
performance assessment that identified a small protrusion (using the 3.1 mm washer) as
optimal for these combustion systems.
Spray analysis for bowl B5 suggests that the location of the secondary pip was such that the
combustion system performed poorly when the fuel spray was too far above the pip region.
This indicates that bowl B5 would require a larger protrusion than the other bowls as was
determined from the evaluation of the combustion system performance.
At higher engine outputs, the protrusion test has shown a definite separation in behaviour
between the conventional and unconventional piston bowls. There was an increase in
emissions and fuel consumption as the protrusion was increased for the unconventional
piston bowls (B4 and B5). Fuel consumption was the lowest for the 3.1 mm washer for both
bowls; 1 % better than the 2.6 mm washer for B4 and 2 % better than the 2.6 mm washer
for bowl B5. The two conventional bowls (B2 and B3) were insensitive to protrusion at high
loads; the fuel consumption for bowl B2 did not differ by more than 0.5 % between all
washers. Bowl B3 has the same trend apart from the 1.6 mm washer, which resulted in a
3 % difference.
Once the location of the fuel spray centre had been determined for each combustion
chamber shape (piston bowl) an extended set of tests was conducted. In this
characterisation, it was found that the selected protrusion resulted in the fuel spray
becoming overly lean at the lower part load conditions used in the protrusion study. This
suggests that an extended protrusion test programme including a wider range of
combustion modes should be used to identify an appropriate injector protrusion.
With the selection of the washer established, the characterisation testing was carried out.
This testing has shown a separation between the engine outputs of the conventional and
unconventional designs. The unconventional bowls had the characteristic that the emission
of NOx was higher for the same injection setting. Analysis has shown that combustion was
slightly more advanced (0.5 ° to 2 ° in some cases) for the same start of injection timing,
indicating that the unconventional bowls had a different mixture formation process. It was
thought that the unconventional bowls worked with a fuel spray closer to stoichiometric
than the conventional designs. Conventional design mixture formation resulted in a richer

223
fuel spray, leading to lower NOx emissions. Any formed particulates were oxidised by the
turbulent flows in-cylinder.
The unconventional designs were more thermally efficient than the conventional designs.
The biggest differences in isFC at part load were observed at KP3 and KP1. At KP3 for the
same isNOx of 0.5 g/kWh, B5 had the lowest isFC and B2, B3 and B4 were 1.3 %, 2.5 % and
0.5 % higher. Combustion had to be retarded for the unconventional bowls (B5 by 4 ° and B4
by 2 °) to achieve this isNOx point. A retarded injection event resulted in reduced efficiency
which disguised the fuel consumption benefit of the unconventional bowls. Alternative
strategies would be required to reduce isNOx without penalising the fuel consumption. At
KP1, the isNOx was not comparable for conventional and unconventional bowls, however at
the most retarded timing the unconventional bowls B4 and B5 were better than the
conventional bowls in terms of isFC by 4 % and 6 % respectively.
The improvement in fuel consumption that was observed with the unconventional designs
was as a result of a reduction in the heat transfer energy losses in-cylinder. When the
combustion phasing was compared at the same time, the heat transfer losses were
generally lower for the unconventional designs for all test conditions. The biggest difference
was observed at KP1 where the heat transfer loss percentage was around 1.5 % lower. This
effect could be attributed to the difference in the surface area to volume ratio of the piston
bowls being favourable for the unconventional designs. Additionally this may also have been
due to a reduction in turbulence associated with open chamber piston bowl designs.
Without in cylinder flow studies it was not possible to say this with any certainty. Following
this, the unconventional bowl, B4, was selected for further testing because it performed
better at the full load condition than bowl B5. At 4000FL the fuel consumption was 5 %
better for bowl B4 and the smoke output was lower by 2 FSN.
The prototype injector hardware was used in both the protrusion and the characterisation
process. A conventional injector type with a similar nozzle specification to one of the
prototype injectors was also available. This conventional injector was used in a set of tests
with the conventional bowl B2 which matched the injector spray angle. In these tests it was
found that at part load the fuel consumption and emissions output was better than with the
prototype injector with a similar nozzle. The isFC was 1.34 % lower and the smoke was

224
0.2 FSN lower. From an analysis of the combustion process it was shown that the
combustion rate was slower for the conventional injector type, when compared to the
prototype system. The rate of heat release peak was 0.2 kJ/°CA for the prototype injector
and 0.05 kJ/°CA less for the conventional injector. This was due to the fact that for the same
fuel pressure setting, the fuelling rate was higher for the prototype system due to the ability
of the injector to lift the needle directly and without having to spill pressurised fuel.
With a higher fuelling rate, the mixture formation process occurred more rapidly and led to
faster combustion. In this case, at part load, the fuel consumption was worse for the
prototype injector, because the faster combustion process resulted in more heat being
rejected through heat transfer in cylinder. This difference varied in magnitude at each key
point; 1.6 % at KP3, 3.1 % at KP2 and 1.2 % at KP1.
The faster mixture formation and combustion process that the prototype injection system
generated was beneficial at the higher load condition resulting in an improvement in fuel
consumption by 3 % and a reduction in smoke by 0.3 FSN. In particular, the lower emissions
of particulates would be an advantage at the higher loads as this would result in a reduction
in particle filter loading in vehicle applications. While the shape of the injection rate of the
prototype injectors can be modified by controlling the needle velocity, this function was not
available in this study. It could enable this injector to match the performance of the
conventional injector at part load conditions by reproducing the same needle lift profile.
The nozzle testing carried out during in the characterisation process compared the effect of
a prototype injector nozzle with 7 holes, 8 holes and 9 holes on each bowl. The results were
only shown for bowl B4 as it was selected in the characterisation process. The results have
shown that at part load condition KP3, there was a reduction in smoke output with the
9 hole injector, without any penalty on fuel consumption. The smoke number was 0.5 FSN
lower for the 9 hole injector at the most retarded SOIm. The smoke reduction was a result
of the fuel spray reducing in size when the size of the hole decreased, thus reducing the rich
regions in the fuel spray. The 9 holes injector was comparable to the other injectors in terms
of fuel consumption and emission at the remaining part load key points. The assessment of
the smoke benefit of the 9 holes nozzle was difficult at the remaining key points because
combustion was highly premixed due to the lower loads and longer ignition delay. Premixed

225
combustion tended to result in either no smoke forming or complete oxidation of the
formed particulates. The 9 holes injector suffered as the engine speed increased beyond
2000 RPM to 4000 RPM and the load increased to the maximum tested. The isFC was 0.8%
worse than a 7 holes injector and the smoke number was 0.6 FSN worse at the most
retarded timing. Before saying definitively that the 9 holes injector should be selected for a
reduction in engine out smoke it is recommended that testing at higher load NEDC points
should be carried out.
Multiple injection strategies are common in production Diesel engines. In order to contain
the time required to complete the characterisation tests only single injection events were
employed in this phase of the study. Following the selection of the best performing bowl
from the characterisation tests, bowl B4, the effect of pilot injection strategies on this
combustion system were investigated.
The results of the pilot injection study show that the unconventional bowl can operate using
this type of injection strategy. The unconventional bowl B4 does not react unusually to pilot
injection timing. The effect of the pilot injection on the unconventional bowl at the part load
condition was a reduction in HC and CO emission at the expense of the smoke output for
conventional injection timings. At KP3 HC and CO were reduced by 0.2 g/kWh and
0.5 g/kWh respectively but this was where the largest increase in the smoke emission was
observed (from 0.7 to 1.5 FSN). The smoke output increased at the part load conditions
when the pilot injection timing resulted in combustion of the fuel added by the pilot during
the main injection. The emissions of HC and CO were reduced because of a decrease in the
ignition delay caused by the combustion of the fuel added by the pilot. This minimised the
lean regions in the fuel spray thus improving the emissions. It was also observed that the
fuel consumption improved when a pilot injection was added. The improvements were as
much as 2.1 %, 5.4 % and 7.4 % at KP3, KP2 and KP1 respectively. The speed of the mixture
formation slowed and thus the combustion process, which reduced the heat losses due to
heat transfer in-cylinder. At KP1, when combustion of the main portion of fuel was phased
the same as the single injection the heat losses due to heat transfer were reduced by 1.4 %.
This improvement was observed up to the point where the fuel consumption deteriorated

226
because the slower combustion led to heat being rejected through the exhaust when
combustion retarded.
When the injection timing was retarded further at KP3 the combustion mode switched to a
late low-temperature type resulting in a simultaneous reduction in NOx and smoke,
achieving 0.27 FSN at isNOx 0.45 g/kWh compared to the single injection case that had
0.44 FSN at isNOx of 0.55 g/kWh. This demonstrates the potential of the unconventional
bowl designs for use with low temperature combustion strategies.
In conclusion, this research has shown that unconventional bowl designs, operated with a
prototype injection system and using a mixture of combustion strategies can produce
improvements in fuel consumption and emission when compared to conventional piston
bowl designs. The combination of an open combustion chamber with a secondary pip to aid
the mixture formation process and high flow rate fuel injectors produced the best
combustion system. This combination was suitable for all round performance at both part
load and high load. The injector nozzle could be selected with more holes of a smaller size
for an emission benefit at the medium load conditions.

227
10 Future Work
The protrusion optimisation should be tested at both higher and lower key points to create
a map of the effects of protrusion over a wider range of conditions. This study has shown
that the optimisation at one part load key point can lead to poor performance at lower load
conditions. It would be useful to test protrusion at higher loads seen on the NEDC as well as
lower loads, such as KP1.
Work should be carried out to understand the mixture formation effect of the
unconventional designs. It was postulated that the secondary pip aided the entrainment of
air into the fuel spray leading to combustion that resulted in a reduction in particulate
formation at part load. The in-cylinder behaviour understanding needs to improve as there
was not enough information available from the engine testing to establish why
unconventional piston bows were different at the full load protrusion test.
The testing of the unconventional bowl could only be carried out with the prototype piezo
injectors and should be tested with the conventional solenoid design to examine the effect
of that combination. The prototype injectors were probably the most suitable due to the
process of mixture formation relying on fuel spray energy rather than turbulence in cylinder
to enhance combustion. The prototype fuelling rate could be investigated to demonstrate
the impact on emissions and fuel consumption for the unconventional bowls.
Further work should be carried out with the fuelling rate of the prototype injectors to assess
whether the performance of the conventional injector can be replicated in terms of the
smoke and fuel consumption output. This could be both multiple injection testing and rate
shaping. Testing at higher part load points should be carried out to examine the limit of the
effect of rate control because there was a limit to the benefit a full load.

228
References
ABRAHAM, J., KHAN, A. & MAGI, V. (1999) Jet-jet and jet-wall interactions of transient jets from multi-hole injectors. SAE Technical Paper 1999-01-0513.
AKAGAWA, H., MIYAMOTO, T., HARADA, A., SASAKI, S., SHIMAZAKI, N., HASHIZUME, T. & TSUJIMURA, K. (1999) Approaches to solve problems of the premixed lean diesel combustion. SAE TRANSACTIONS, 108, 120-132.
AKIHAMA, K., TAKATORI, Y., INAGAKI, K., SASAKI, S. & DEAN, A. M. (2001) Mechanism of the smokeless rich diesel combustion by reducing temperature. SAE TRANSACTIONS, 110, 648-662.
AMAGAI, K., MARUYAMA, Y., SAITO, M. & ARAI, M. (2003) Spray-to-Spray Interactions after Wall Impingement. SAE Technical Paper 2003-01-1835.
ANSELMI, P., KASHDAN, J., BRESSION, G., FERRERO-LESUR, E., THIROUARD, B. & WALTER, B. (2010) Improving Emissions, Noise and Fuel Economy Trade-Off by using Multiple Injection Strategies in Diesel Low Temperature Combustion (LTC) Mode. SAE Technical Paper 2010-01-2162.
BAE, C., YU, J., KANG, J., KONG, J. & LEE, K. O. (2002) Effect of nozzle geometry on the common-rail diesel spray. SAE Technical Paper 2002-01-1625.
BENAJES, J., MOLINA, S., NOVELLA, R. & DERUDDER, K. (2008) Influence of injection conditions and exhaust gas recirculation in a high-speed direct-injection diesel engine operating with a late split injection. Proceedings of the Institution of Mechanical Engineers, Part D: Journal of Automobile Engineering, 222, 629-641.
BICKERSTAFFE, S. (2009) No one ideal solution. Automotive Engineer. Caspian Media. BOSCH, R. (2000) Automotive Handbook, Stuttgart, Bentley Publishers. CARLUCCI, P., FICARELLA, A. & LAFORGIA, D. (2005) Effects on combustion and emissions of
early and pilot fuel injections in diesel engines. International Journal of Engine Research, 6, 43-60.
CARR, R. (2014) Paxman Diesel Engines since 1934. http://www.paxmanhistory.org.uk/images/comethd.gif.
CHOI, D., MILES, P. C., YUN, H. & REITZ, R. D. (2005) A Parametric Study of Low-Temperature, Late-Injection Combustion in a HSDI Diesel Engine. JSME International Journal Series B, 48, 656-664.
CLEYNEN, O. (2011) Cutaway of a MAN V8 Diesel engine. http://en.wikipedia.org/wiki/File:Cutaway_of_a_MAN_V8_Diesel_engine.jpg.
DAVIS, N. (2011) Diesel-Emission-Control. http://autorepair.about.com/library/graphics/42003930.gif.
DEC, J. (1997) A Conceptual Model of DI Diesel Combustion Based on Laser-Sheet Imaging. SAE Technical Paper 970873.
DEC, J. (2009) Advanced compression-ignition engines--understanding the in-cylinder processes. Proceedings of the Combustion Institute, 32, 2727-2742.
DOUG, W. (2009) Wärtsilä (Sulzer) Low-Speed Engines. Pounder's Marine Diesel Engines and Gas Turbines (Ninth edition). Oxford, Butterworth-Heinemann.

229
FANG, T., COVERDILL, R. E., LEE, C. F. & WHITE, R. A. (2008a) Effects of injection angles on combustion processes using multiple injection strategies in an HSDI diesel engine. Fuel, 87, 3232-3239.
FANG, T., COVERDILL, R. E., LEE, C. F. F. & WHITE, R. A. (2008b) Low temperature premixed combustion within a small bore high speed direct injection (HSDI) optically accessible diesel engine using a retarded single injection. International Journal of Automotive Technology, 9, 551-561.
FANG, T. G., COVERDILL, R. E., LEE, C. F. F. & WHITE, R. A. (2008c) Low-sooting combustion in a small-bore high-speed direct-injection diesel engine using narrow-angle injectors. Proceedings of the Institution of Mechanical Engineers, Part D: Journal of Automobile Engineering, 222, 1927-1937.
FRENKLACH, M. & WANG, H. (1994) Soot Formation in Combustion: Mechanisms and Models. Ed. Bockhorn, H. Kazakov, A. and Frenklach M.(1998) Combustion and Flame, 114, 484-510.
HAN, Z., ULUDOGAN, A., HAMPSON, G. J. & REITZ, R. D. (1996) Mechanism of soot and NOx emission reduction using multiple-injection in a diesel engine. SAE TRANSACTIONS, 105, 837-852.
HASEGAWA, R. & YANAGIHARA, H. (2003) HCCI Combustion in DI Diesel Engine. SAE Technical Paper 2003-01-0745.
HEISLER, H. (2002) Advanced vehicle technology, Butterworth-Heinemann. HEYWOOD, J. B. (1988) Internal combustion engine fundamentals, New York, McGraw-Hill. IIDA, N., YAMASAKI, Y. & SATO, S. (2004) The Key Points of HCCI Combustion Controls.
Editions TECHNIP. IKEGAMI, M., FUKUDA, M., YOSHIHARA, Y. & KANEKO, J. (1990) Combustion chamber shape
and pressurized injection in high-speed direct-injection diesel engines. SAE Technical Paper 900440.
KAMIMOTO, T. & BAE, M. H. (1988) High combustion temperature for the reduction of particulate in diesel engines. SAE Technical Paper 880423.
KARIMI, K. (2007) Characterisation of multiple-injection diesel sprays at elevated pressures and temperatures. School of Engineering, University of Brighton.
KIDOGUCHI, Y., YANG, C. & MIWA, K. (1999) Effect of high squish combustion chamber on simultaneous reduction of NOx and particulate from a direct-injection diesel engine. SAE Technical Paper 1999-01-1502.
KIM, D., EKOTO, I., COLBAN, W. F. & MILES, P. C. (2008) In-cylinder CO and UHC Imaging in a Light-Duty Diesel Engine during PPCI Low-Temperature Combustion. SAE Int. J. Fuels Lubr., 1, 933-956.
KIMURA, S., AOKI, O., KITAHARA, Y. & AIYOSHIZAWA, E. (2001) Ultra-clean combustion technology combining a low-temperature and premixed combustion concept for meeting future emission standards. SAE Technical Paper 2001-01-0200.
KIMURA, S., AOKI, O., OGAWA, H., MURANAKA, S. & ENOMOTO, Y. (1999) New combustion concept for ultra-clean and high-efficiency small DI diesel engines. SAE Technical Paper 1999-01-3681.
KITAMURA, T., ITO, T., SENDA, J. & FUJIMOTO, H. (2002) Mechanism of smokeless diesel combustion with oxygenated fuels based on the dependence of the equivalence ration and temperature on soot particle formation. International Journal of Engine Research, 3, 223-248.

230
KOOK, S., BAE, C., MILES, P. C., CHOI, D. & PICKETT, L. M. (2005) The Influence of Charge Dilution and Injection Timing on Low-Temperature Diesel Combustion and Emissions. SAE Technical Paper 2005-01-3837.
LAGUITTON, O. (2005) Advanced Diesel Combustion Strategies for Ultra-Low Emissions. Brighton, University of Brighton.
LAGUITTON, O., CRUA, C., COWELL, T., HEIKAL, M. R. & GOLD, M. R. (2007) The effect of compression ratio on exhaust emissions from a PCCI diesel engine. Energy Conversion and Management, 48, 2918-2924.
LECHNER, G. A., JACOBS, T. J., CHRYSSAKIS, C. A., ASSANIS, D. N. & SIEWERT, R. M. (2005) Evaluation of a narrow spray cone angle, advanced injection timing strategy to achieve partially premixed compression ignition combustion in a diesel engine. SAE Technical Paper 2005-01-0167.
LÜ, X.-C., CHEN, W. & HUANG, Z. (2005) A fundamental study on the control of the HCCI combustion and emissions by fuel design concept combined with controllable EGR. Part 1. The basic characteristics of HCCI combustion. Fuel, 84, 1074-1083.
MANCARUSO, E., MEROLA, S. S. & VAGLIECO, B. M. (2008) Study of the multi-injection combustion process in a transparent direct injection common rail diesel engine by means of optical techniques. International Journal of Engine Research, 9, 483-498.
MARTYNOV, S. (2005) Numerical simulation of the cavitation process in diesel fuel injectors. Brighton, The University of Brighton.
MASON, D., BEGG, S., COOPER, B. & JACKSON, N. (2008) A low compression ratio low NOx diesel combustion system. DIESEL ENGINES: The Low CO2 and Emissions Reduction Challenge. Rouen, France.
MIDDLEMISS, I. D. (1978) Characteristics of the Perkins 'Squish Lip' Direct Injection Combustion System. SAE Technical Paper 780113.
MILES, P. (2007) Sources and mitigation of CO and UHC emissions in low-temperature diesel combustion regimes: Insights obtained via homogeneous reactor modeling. Diesel Engine Efficiency and Emissions Research (DEER). Detroit, Michigan.
MILES, P. (2010) Sources of UHC and CO in Low Temperture Automotive Diesel Combustion Systems. Directions in Engine-Efficiency and Emissions Research (DEER) Detroit, Michigan.
MINATO, A., TANAKA, T. & NISHIMURA, T. (2004) Investigation of premixed lean diesel combustion with ultra high pressure injection. Isuzu Technical Journal, 112, 57-63.
MOLLENHAUER.K & TSCHOEKE.H (2010) Handbook of Diesel Engines, Berlin Heidelberg, Springer-Verlag.
MONTAJIR, R. M., TSUNEMOTO, H., ISHITANI, H. & MINAMI, T. (2000) Fuel spray behavior in a small DI diesel engine: effect of combustion chamber geometry. SAE Technical Paper 2000-01-0946.
MOUKAIDECHE, F. (2009) Oracle Hydra Build Book, Ricardo Consulting Engineers. OCHOTERENA, R. L. & ANDERSSON, S. (2008) Time and Spatially Resolved Temperature
Measurements of a Combusting Diesel Spray Impinging on a Wall. SAE Int. J. Fuels Lubr., 1, 970-983.
OKUDE, K., MORI, K., SHIINO, S. & MORIYA, T. (2004) Premixed compression ignition (PCI) combustion for simultaneous reduction of NOx and soot in diesel engine. SAE Technical Paper 2004-01-1907.

231
ONISHI, S., JO, S. H., SHODA, K., DO JO, P. & KATO, S. (1979) Active Thermo-Atmosphere Combustion (ATAC) - A New Combustion Process for Internal Combustion Engines. SAE Technical Paper 790501.
PARK, S. W. & REITZ, R. D. (2009) Optimization of fuel/air mixture formation for stoichiometric diesel combustion using a 2-spray-angle group-hole nozzle. Fuel, 88, 843-852.
PAYRI, R., SALVADOR, F. J., GIMENO, J. & DE LA MORENA, J. (2011) Influence of injector technology on injection and combustion development - Part 1: Hydraulic characterization. Applied Energy, 88, 1068-1074.
PAYRI, R., SALVADOR, F. J., GIMENO, J. & ZAPATA, L. D. (2008) Diesel nozzle geometry influence on spray liquid-phase fuel penetration in evaporative conditions. Fuel, 87, 1165-1176.
PICKETT, L. M. & LOPEZ, J. J. (2005) Jet-wall interaction effects on diesel combustion and soot formation. SAE TRANSACTIONS, 114, 803-817.
PICKETT, L. M., SIEBERS, D. L. & IDICHERIA, C. A. (2005) Relationship between ignition processes and the lift-off length of diesel fuel jets. SAE Technical Paper 2005-01-3843.
RYAN, T. (2007) HCCI – A Technical Review and Progress Report 2006. RYAN, T. W., CALLAHAN, T. J. & MEHTA, D. (2004) HCCI in a variable compression ratio
engine-effects of engine variables. SAE Technical Paper 2004-01-1971. SAITO, T., DAISHO, Y., UCHIDA, N. & IKEYA, N. (1986) Effects of combustion chamber
geometry on diesel combustion. SAE Technical Paper 861186. SCHÖPPE, D. & ZÜLCH, S. (2009) Future Trends in Light Duty Diesel Fuel Injection Systems.
18. Aachener Kolloquium Fahrzeug- und Motorentechnik 2009. Aachen. SHIMAZAKI, N., TSURUSHIMA, T. & NISHIMURA, T. (2003) Dual mode combustion concept
with premixed diesel combustion by direct injection near top dead center. SAE TRANSACTIONS, 112, 1060-1069.
SJÖBERG, M. & DEC, J. E. (2005) An investigation into lowest acceptable combustion temperatures for hydrocarbon fuels in HCCI engines. Proceedings of the Combustion Institute, 30, 2719-2726.
SOM, S., RAMIREZ, A. I., LONGMAN, D. E. & AGGARWAL, S. K. (2011) Effect of nozzle orifice geometry on spray, combustion, and emission characteristics under diesel engine conditions. Fuel, 90, 1267-1276.
STONE, R. (1999) Introduction to internal combustion engines, Palgrave Macmillan. TANAKA, T., ANDO, A. & ISHIZAKA, K. (2002) Study on pilot injection of DI diesel engine using
common-rail injection system. JSAE Review, 23, 297-302. THIROUARD, M., MENDEZ, S., PACAUD, P., CHMIELARCZYK, V., AMBRAZAS, D., GARSI, C.,
LAVOISIER, F. & BARBEAU, B. (2009) Potential to improve specific power using very high injection pressure in HSDI Diesel engines. SAE Technical Paper 2009-01-1524.
THRING, R. H. (1989) Homogeneous charge compression ignition engine. SAE 890268. WALTER, B. & GATELLIER, B. (2002) Development of the High Power NADITM Concept Using
Dual Mode Diesel Combustion to Achieve Zero NOx and Particulate Emissions. SAE technical Paper 2002-01-1744.
YAO, M., ZHENG, Z. & LIU, H. (2009) Progress and recent trends in homogeneous charge compression ignition (HCCI) engines. Progress in Energy and Combustion Science, 35, 398-437.

232
ZHENG, Z. & YAO, M. (2009) Charge stratification to control HCCI: Experiments and CFD modeling with n-heptane as fuel. Fuel, 88, 354-365.

233
Appendix A Fuel Specification