advanced features of qualtrics - kansas state university · “advanced features of qualtrics ......
TRANSCRIPT

1
“Advanced Features of Qualtrics”
K-State Surveys (powered by Qualtrics): http://surveys.ksu.edu Demo Survey: https://kstate.qualtrics.com/SE/?SID=SV_5gTuBG8ZWa94tMx Training Handout: http://www.k-state.edu/ID/ExploringAdvancedQualtricsHandout.pdf
Some New Features 1. Some Changes with the Qualtrics Innovation Suite / Qualtrics Research Suite: At K-State:
Not a Survey Limit in the Active Area (at K-State): There is not the 33 survey limit in the active area of a person’s K-State Survey account.
Power Users: K-Staters who need to invite (through contacts) higher numbers of users than 5,000 (including email reminders) will need to get power user status from [email protected] (Dr. Rebecca Gould, Qualtrics “Brand Ambassador”).
New Data Storage Features:
Libraries: The Library contains Surveys, Graphics, Files, and Messages. Files is new. New Research Features:
New Text Analysis Feature: Qualtrics has a new text analysis feature. This enables extracting some observed “themes” and some manual coding of related observed themes or topics, but this seems to be an elementary tool currently.
Online Dashboards: Online reports / dashboards now come with richer data visualization options.
Adding Notes to Survey Questions: It is possible to add Discussions to surveys through “Add a Note” feature. (To add a note, hover over a question, and right-click. There is a dropdown, and at the bottom is “Add Note.” This option is also available in the Actions pane at the right just below where the Question Editing Pane is.) This is a social media element to enable commenting on particular parts of a survey, but this appears to be invisible in Preview.
Integration with NVivo 11 Plus (on Windows): Ability to download any survey data from any survey in one’s account with authentication (Head Icon at the Top Right of the Page -> Account Settings -> Qualtrics IDs -> API / Generate Token -> Copy Token -> Open NVivo 11 Plus -> Data Tab -> Survey Dropdown -> From Qualtrics -> Select “Project” / “Survey” to download…

2
Qualtrics Offline App: Qualtrics has apps that work on both iOS and Android devices that enable the collection of information while a person is offline…and the collected information may be uploaded to Qualtrics once the device is within range of Internet connectivity. This means that information may be collected in areas without Internet connectivity. (https://www.qualtrics.com/support/survey-platform/distributions-module/mobile-distributions/offline-app/setting-up-the-offline-app/) This feature requires the use of the Qualtrics API token. In this latter situation, the token should not be changed…or else data collected using that token will be lost.
2. New Navigation: The new navigation has the four top-level areas:
Survey: Look & Feel, Survey Flow, Survey Options, and Tools
Distributions: Distribution Summary, and New Methods (Anonymous Link, Emails, Personal Links, Social Media, Offline App, QR Code, Purchase Respondents)
Data & Analysis: Data, Text, Cross-Tabs
Reports: Results (Initial Report, Add Filter) and Printed Reports (Survey Statistics, Email Reports)
At Top Right: Projects, Contacts, Library, Help & Feedback, and User Identity 3. Capturing Survey Statistics (on the New Insight Platform):
There are workarounds to capture autocreated Survey Statistics
Survey Statistics To get to the same “Survey Statistics” data through the new UI (user interface), …
1. Go to My Projects (on the Qualtrics Insight Platform). 2. Select a survey. 3. Go to Reports tab in this survey in the top menu bar (at the far right). 4. Click “Printed Reports” (at the secondary top menu bar). 5. Click “Create a New Report.” Finalize that report.
3
6. At the top right, a green and white “Survey Statistics” button will appear. All the former “Survey Statistics” information will be available. However, this data will not be exportable as a .PDF format report.
For a video of this process, please go to the following link: http://www.screencast.com/t/veAf9ZhK (per Marc C. at Qualtrics Helpdesk). (As of November 2016, this sequence does not work. Some of the same prior information may be accessed as follows: Go to the Distribution tab. Click on Distribution Summary. The former “item analysis” does not seem to be available currently but may be available as the new insight platform evolves.) 4. Data and Databases:
It is possible to put in invisible questions as placeholders in a survey, so that all data from that survey may be automatically sent to a database (without disturbing data that is already in particular columns).
Or, such placeholder columns may be added manually afterwards with null data. Viewing (Raw) Row Data: To view row data,
1. Go to the Data & Analysis tab. 2. Select Data. 3. Your view is the raw row data that you had access to in the former Qualtrics. 4. Then Export if you want a data table.
5. Text Analysis on Qualtrics: One of the new features of Qualtrics involves auto-generated text analysis (topic modeling). This may only be done for questions for which an open-ended text option is available. (This is not for closed answer questions.)
1. To access this feature, click into the target survey. 2. Go to “Data & Analysis” tab. 3. Select “Text.” A message will be shown that reads “Analyzing text responses, this could
take a few minutes…” 4. When the analysis is done, another message will show: “to start creating topics, start a
search in the box below or click on the + (plus) next to any response”. The text queries may use some text frequency counts and such. Eventually, it may include topic modeling algorithms (combinations of frequency counts, text clustering, text proximity, and other features). Right now, it is not very sophisticated.
5. There is a dropdown next to the question, which enables a focus on particular questions at a time. If a question is selected, then there is some processing online before that textual data is available for further exploration.
4
6. A general text search may be done based on a seeding term to start the search. Words may be connected with “and,” and exclusions may be set up with “not,” and ( ) parentheses may be used to help define order of operations for logic statements that include multiple exemplars, and filters may also be applied. Text counts may be shown in bar charts in descending order (from most-frequent to least-frequent mentions). After search terms of interest are found, click “Create Topic,” and it will be added to the count at the top. This is a kind of supervised machine learning, which is human-led (human-informed) and machine-supported.
7. The plus sign enables annotation to a particular topic for value-added insights by the researcher. Only alphanumeric characters and spaces may be used, and no special characters (#, @, +, etc.) may be used.
6. Online Reports (or Dashboard) in Qualtrics: Another feature in Qualtrics enables the creation of online reports (or dashboards) with summary data. These reports are hosted on Qualtrics servers, and the links to them may be hosted behind an eID and password-protected space. Reports update automatically as new data is collected. To create such reports…
1. Click into the target survey. 2. Click on the “Reports” tab. 3. Custom Pages may be added to the report with different information from the survey (usually
by question). The data is reported out usually as bar charts and also as tables with count data. Options for visualizations include data tables, bar charts, line charts, pie charts, “breakdown bars,” statistics tables, and gauge charts.
4. Data elements may be dragged within a page from one location to the other with the dots at the right of each part of the data page.
5. When reports are complete, they may be exported as PDF, Word, PowerPoint, and .csv files. 6. Reports may also be offered publicly through a URL on the Web (an access code may be set to
protect the data further). (To set Report Options, go to the dropdown by the gear button at the top right.) The online reports are not interactive to reach the underlying data per se, but it is possible to paginate through any multi-page reports.
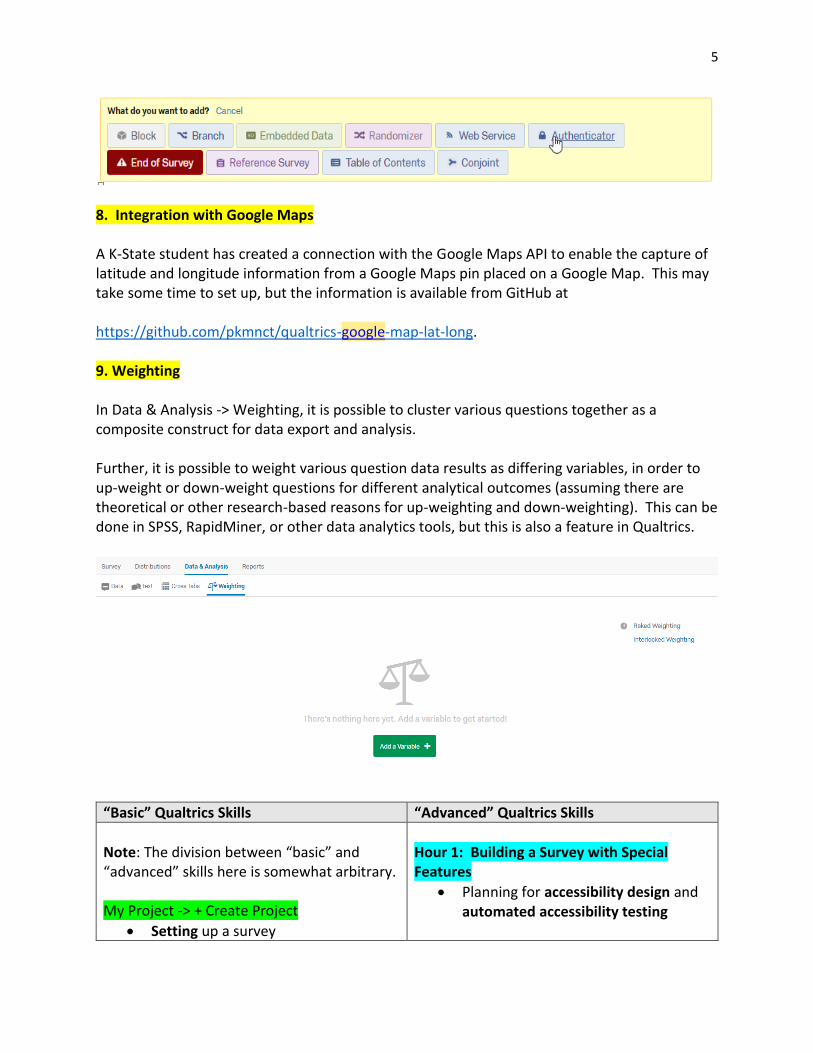
Below, new information is highlighted in Green. 7. Authenticator The Authenticator feature enables survey designers to have survey respondents verify their identities against a Contact List. The Contact List may be pre-created by the survey designer…may be populated through the “Request Survey Panel” feature (once the research has been approved through the IRB process)…may be populated by survey responses, and so on. The Authenticator is set up through the “Survey Flow” area.
5
8. Integration with Google Maps A K-State student has created a connection with the Google Maps API to enable the capture of latitude and longitude information from a Google Maps pin placed on a Google Map. This may take some time to set up, but the information is available from GitHub at https://github.com/pkmnct/qualtrics-google-map-lat-long. 9. Weighting In Data & Analysis -> Weighting, it is possible to cluster various questions together as a composite construct for data export and analysis. Further, it is possible to weight various question data results as differing variables, in order to up-weight or down-weight questions for different analytical outcomes (assuming there are theoretical or other research-based reasons for up-weighting and down-weighting). This can be done in SPSS, RapidMiner, or other data analytics tools, but this is also a feature in Qualtrics.
“Basic” Qualtrics Skills “Advanced” Qualtrics Skills
Note: The division between “basic” and “advanced” skills here is somewhat arbitrary. My Project -> + Create Project
Setting up a survey
Hour 1: Building a Survey with Special Features
Planning for accessibility design and automated accessibility testing
6
o Informed consent (and IRB) o Integrating multimedia (16 MB
limit) o Forcing responses o Aligning questions and
response types o Using a broad range of
question types o Using automatic choices for
close-ended measure-type questions (including Likert scale types)
Sharing survey access via (verified) email accounts (and controlling for levels of access)
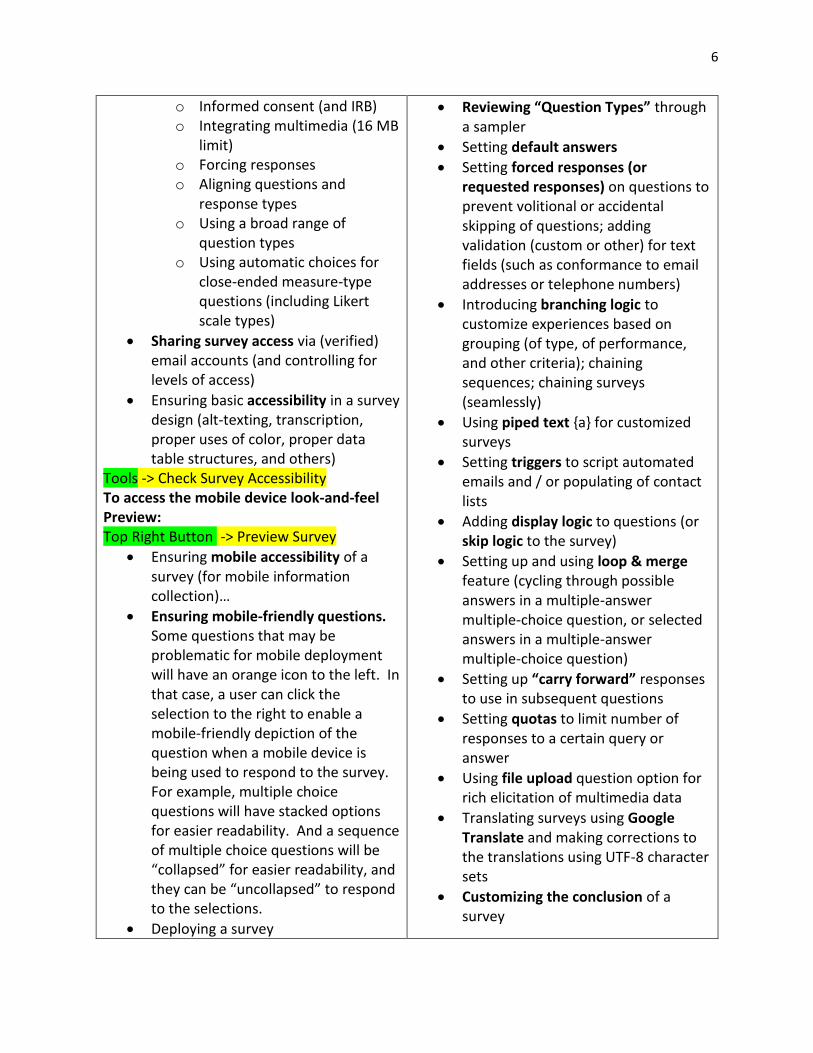
Ensuring basic accessibility in a survey design (alt-texting, transcription, proper uses of color, proper data table structures, and others)
Tools -> Check Survey Accessibility To access the mobile device look-and-feel Preview: Top Right Button -> Preview Survey
Ensuring mobile accessibility of a survey (for mobile information collection)…
Ensuring mobile-friendly questions. Some questions that may be problematic for mobile deployment will have an orange icon to the left. In that case, a user can click the selection to the right to enable a mobile-friendly depiction of the question when a mobile device is being used to respond to the survey. For example, multiple choice questions will have stacked options for easier readability. And a sequence of multiple choice questions will be “collapsed” for easier readability, and they can be “uncollapsed” to respond to the selections.
Deploying a survey
Reviewing “Question Types” through a sampler
Setting default answers
Setting forced responses (or requested responses) on questions to prevent volitional or accidental skipping of questions; adding validation (custom or other) for text fields (such as conformance to email addresses or telephone numbers)
Introducing branching logic to customize experiences based on grouping (of type, of performance, and other criteria); chaining sequences; chaining surveys (seamlessly)
Using piped text {a} for customized surveys
Setting triggers to script automated emails and / or populating of contact lists
Adding display logic to questions (or skip logic to the survey)
Setting up and using loop & merge feature (cycling through possible answers in a multiple-answer multiple-choice question, or selected answers in a multiple-answer multiple-choice question)
Setting up “carry forward” responses to use in subsequent questions
Setting quotas to limit number of responses to a certain query or answer
Using file upload question option for rich elicitation of multimedia data
Translating surveys using Google Translate and making corrections to the translations using UTF-8 character sets
Customizing the conclusion of a survey

7
o Sending out a survey in an open way; sending out a survey in a closed way (by invitation, by anonymous link)
o Turning off IP address collection for anonymized response collection (geolocational information, PII) through “Survey Options”
o Anonymizing email-related responses through “Survey Flow”
Changing the look-and-feel of a survey
Creating and launching a poll (with embed code on a website)
Tamper-proofing responses
Setting up a paid contacts list of respondents
Generating test responses to a draft survey (In Survey – Tools – Test Survey – Number of Desired Responses - dummy data) (This feature is not available once a survey has gone live and has been used to collect actual data. This will protect users against accidentally integrating faux data into real and actual data.)
Creating folders for organized survey access (and archival)
Making an auto-created report public
Accessing the Qualtrics library of templated surveys
Contacting Qualtrics staff for support and help
Protecting a survey from manipulation
Using Qualtrics for Online Trainings and Data Recording:
o HRIS and KSIS o Using scoring feature to treat
surveys as assessments o Using thresholds and contacts
Hour 2: Extracting Data for Analysis
Viewing contacts
Sending results to pre-made contacts lists and setting up email notifications to survey owners
Using the Authenticator to limit access to a survey (based on a pre-defined contact list)
Going to social media platforms for respondents and tracking their points-of-origin
Extracting data from a survey for analysis
o Analyzing a survey through “item analysis” using the “Survey Statistics” feature
o Downloading data properly (comprehensiveness) for analysis
o Subgroup analysis
Creating a cross-tabulation analysis (contingency table) using responses to particular questions (as variables) / chi-square analysis (empirically observed counts of a phenomenon vs. a purely random expected count)
Archiving a survey offline as a .qsf file and the related data as a .csv file in the same directory (to enable the recreation of both the survey and its linked data within Qualtrics)
8
Hour 1: Building a Survey with Special Features
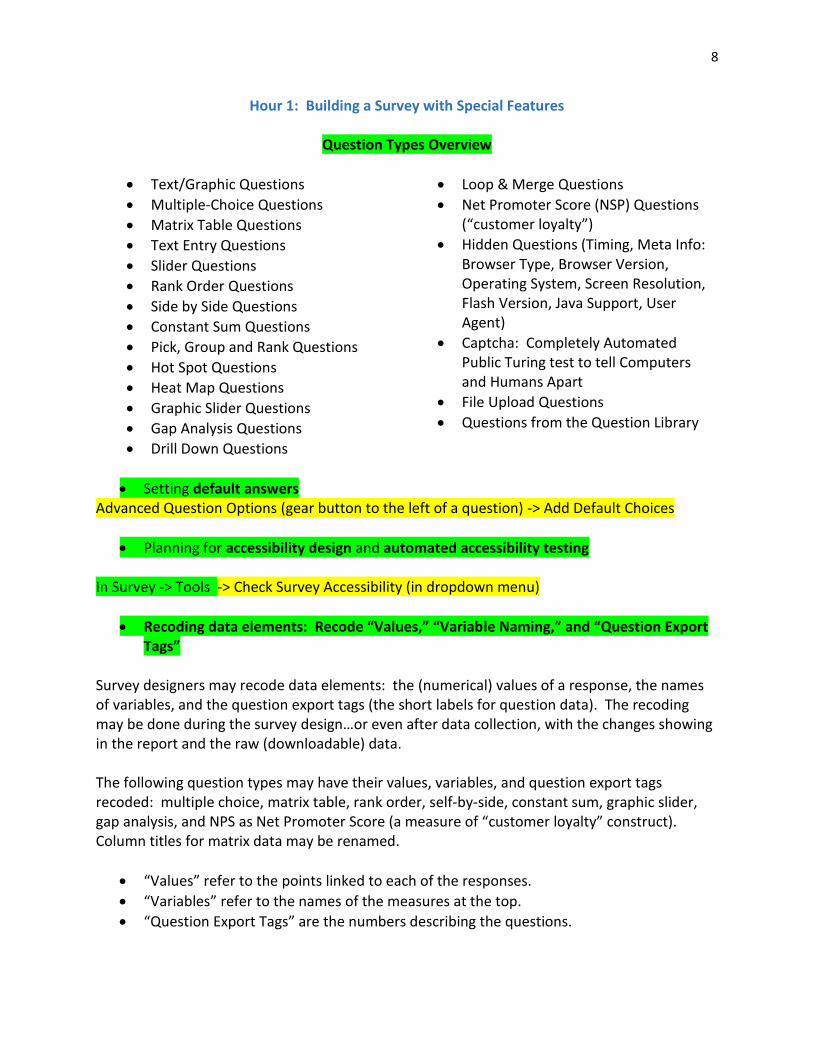
Question Types Overview
Text/Graphic Questions
Multiple-Choice Questions
Matrix Table Questions
Text Entry Questions
Slider Questions
Rank Order Questions
Side by Side Questions
Constant Sum Questions
Pick, Group and Rank Questions
Hot Spot Questions
Heat Map Questions
Graphic Slider Questions
Gap Analysis Questions
Drill Down Questions
Loop & Merge Questions
Net Promoter Score (NSP) Questions (“customer loyalty”)
Hidden Questions (Timing, Meta Info: Browser Type, Browser Version, Operating System, Screen Resolution, Flash Version, Java Support, User Agent)
Captcha: Completely Automated Public Turing test to tell Computers and Humans Apart
File Upload Questions
Questions from the Question Library
Setting default answers Advanced Question Options (gear button to the left of a question) -> Add Default Choices
Planning for accessibility design and automated accessibility testing In Survey -> Tools -> Check Survey Accessibility (in dropdown menu)
Recoding data elements: Recode “Values,” “Variable Naming,” and “Question Export Tags”
Survey designers may recode data elements: the (numerical) values of a response, the names of variables, and the question export tags (the short labels for question data). The recoding may be done during the survey design…or even after data collection, with the changes showing in the report and the raw (downloadable) data. The following question types may have their values, variables, and question export tags recoded: multiple choice, matrix table, rank order, self-by-side, constant sum, graphic slider, gap analysis, and NPS as Net Promoter Score (a measure of “customer loyalty” construct). Column titles for matrix data may be renamed.
“Values” refer to the points linked to each of the responses.
“Variables” refer to the names of the measures at the top.
“Question Export Tags” are the numbers describing the questions.

9
Click selected question -> Click advanced question options gear box (to the left of the question) -> Editable elements will show (“Recode Values,” “Variable Naming,” and “Question Export Tags”) -> Check the ones to change
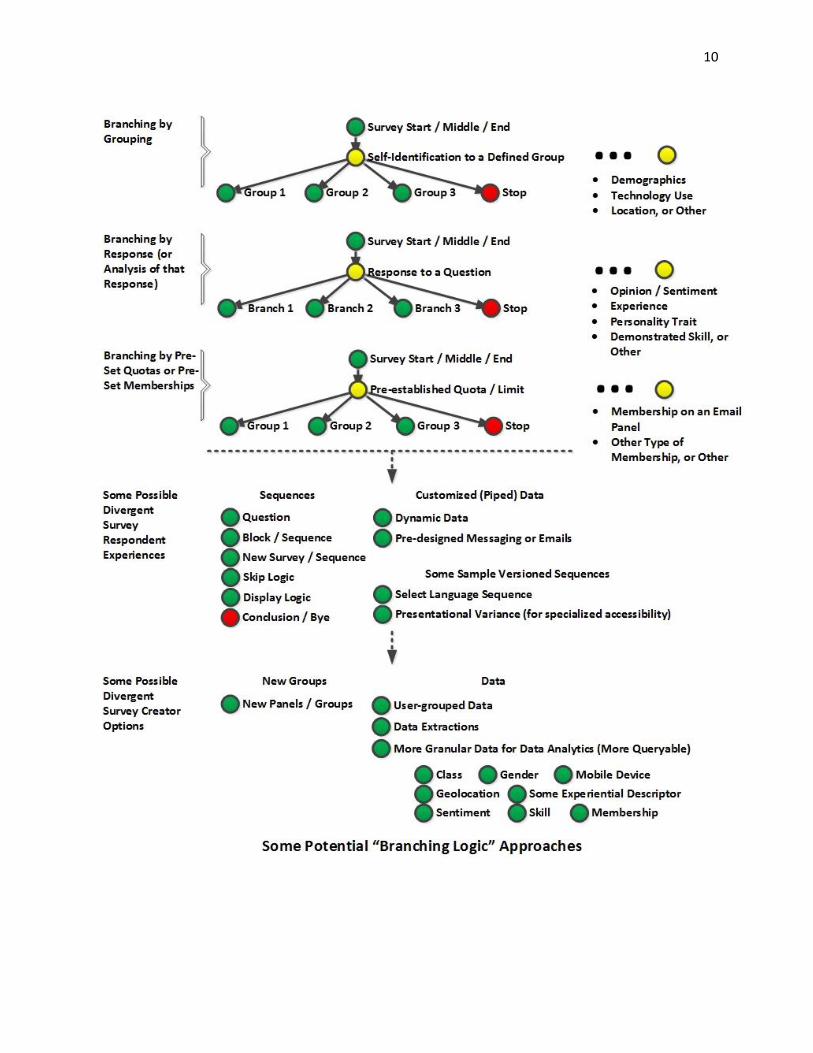
Setting up branching logic to customize experiences based on grouping (of type, of performance, and other criteria); chaining sequences; chaining blocks and separate surveys (seamlessly)
Log into survey -> Edit Survey (tab) -> Survey Flow -> Add a branch -> Define the condition to trigger the branch -> Drag and drop the block that should be the next segment in the flow. Survey Flow -> Add Below -> Branch Feature -> Drag and drop the block that should be the next segment in the flow. The branching logic may depend on any of the following (or combination of the following):
the respondent’s response to a question;
embedded data;
specified device type;
defined quota;
or GeoIP location [(postal code, city, state/region, area code, country name, and country code; location from map), which may be transcoded to polygons or .shp / shape data].
If the survey is changed and the logic no longer applies, the system will reflect that there is “invalid logic,” and the flow will revert based on the changes to the survey. There are a variety of ways to set up conditionals. For example, there can be an overall “and if” or “or if” to indicate multiple conditionals. Remember that “and if” combines the two, and the “or if” allows going forward if either case (on either side of the operator) in the expression is true. (The system is set up as simple scripting.) The “Skip Logic” enables moving survey takers to another question based on their responses to a particular question / embedded data / quotas (numbers of respondents to a particular question or answer) / panel (contacts list) / GeoIP location / Loop & Merge [returning back to a prior question in a prior or different block in order to re-use the general question and answers (such as for repeating questions) / and device type; Loop & Merge also enables going through repeated question sequences based on prior responses, such as enabling respondents to describe their experiences with multiple products or multiple services].
10
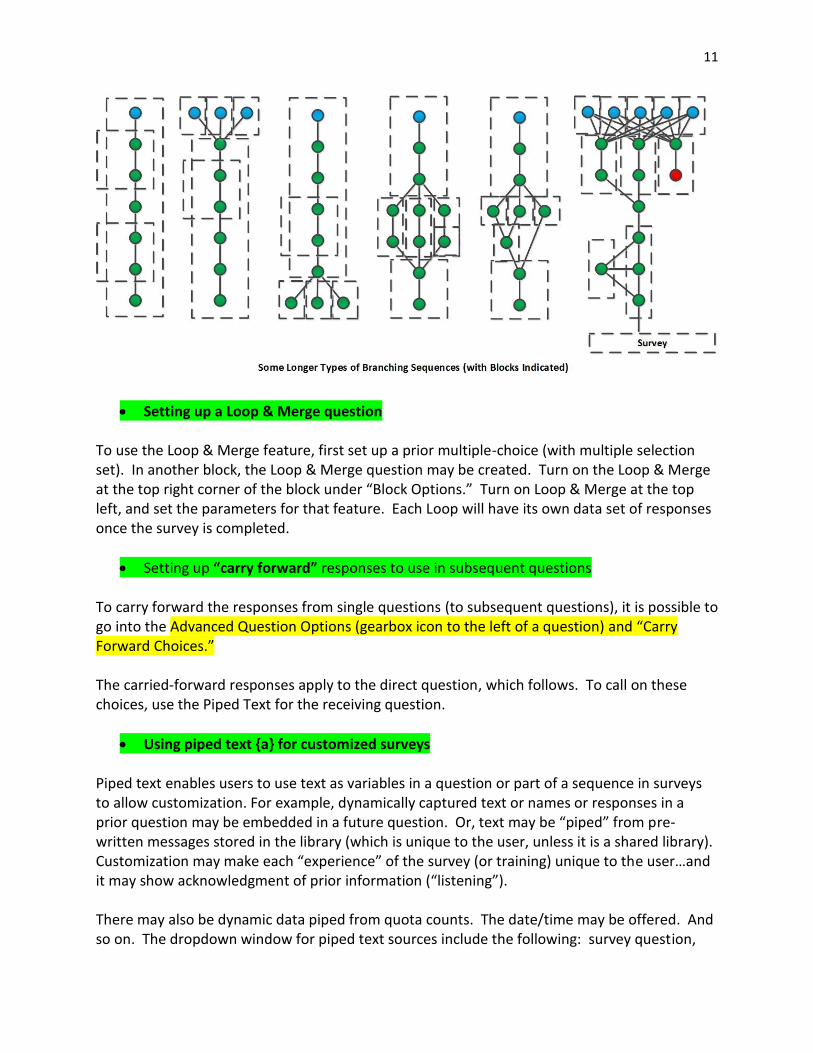
11
Setting up a Loop & Merge question To use the Loop & Merge feature, first set up a prior multiple-choice (with multiple selection set). In another block, the Loop & Merge question may be created. Turn on the Loop & Merge at the top right corner of the block under “Block Options.” Turn on Loop & Merge at the top left, and set the parameters for that feature. Each Loop will have its own data set of responses once the survey is completed.
Setting up “carry forward” responses to use in subsequent questions To carry forward the responses from single questions (to subsequent questions), it is possible to go into the Advanced Question Options (gearbox icon to the left of a question) and “Carry Forward Choices.” The carried-forward responses apply to the direct question, which follows. To call on these choices, use the Piped Text for the receiving question.
Using piped text {a} for customized surveys Piped text enables users to use text as variables in a question or part of a sequence in surveys to allow customization. For example, dynamically captured text or names or responses in a prior question may be embedded in a future question. Or, text may be “piped” from pre-written messages stored in the library (which is unique to the user, unless it is a shared library). Customization may make each “experience” of the survey (or training) unique to the user…and it may show acknowledgment of prior information (“listening”). There may also be dynamic data piped from quota counts. The date/time may be offered. And so on. The dropdown window for piped text sources include the following: survey question,

12
embedded data field, web service, GeoIP location, date/time, opt out link, panel (contact list) field, loop & merge, and quota. (Piped text enables the inclusion of dynamism by including variables—information, texts, and elements that will vary.)
Setting triggers to script automated survey responses There are two types of triggers in Qualtrics: “Email Triggers” and “Contact List (panel) Triggers”. In a Survey, go to the Survey Module and go to Tools.
An "email trigger" results in the sending of an email to a recipient or to multiple recipients based on the fulfilling of a certain condition. A "contact list (panel) trigger" results in the sending of respondent information to a particular pre-defined "contact" on the fulfilling of a certain condition. Note that the Contact List requires valid email addresses for those who respond. (By “valid,” I only mean that the syntactic structure of the email address has to be recognizable as such, not that the email address has to be necessarily live nor correct.) If there is no valid email in the email field, that data will still be collected in the general data area…but will not populate in the assigned Contact List. From inside the Survey -> Tools -> Triggers (dropdown) -> Select “Email Triggers” or “Contact List Triggers”
Adding display logic to questions (including skip logic) Between questions and within blocks (and surveys), questions may be sequenced based on “Display Logic” and “Skip Logic.” Highlight question -> Advanced Question Options gearbox -> Add Display Logic -> A range of conditionals will follow… If -> Question / Embedded Data / Quota / Contact List / GeoIP Location / Loop & Merge / Device Type
13
“Display Logic” affects whether certain answers to multiple-choice questions are visible (displayed) or not. For example, an answer may be displayed so long as the quota for the question has not been met… (If Quota -> IDed Question -> Has Not Been Met…Display…) To add more display logic, just click the plus sign to the right. (Additional requirements may be additive or either-or…and other sorts of logic relationships.) The “Skip Logic” enables users to skip a particular part of the survey or training and land right into another part. (The assumption is that there is a sequence of questions that everyone takes unless there is selecting out of answers with display logic or skip logic.)
Setting quotas to limit number of responses to a certain query or answer A “quota” is a limit that may be set to a particular question, at which time, a certain action may take place. Quotas enable those sending out surveys to automatically control when the survey ends or other experiential aspects of the survey. In Survey -> Tools -> Quotas -> “Add a Quota” -> Set Count -> Define Conditional Logic -> Set Action (once quota count is met) -> Save The types of possible actions once a quota has been met include the following: End Current Survey Prevent All New Survey Sessions Do Not Display a Question… Do Not Display a Block… Trigger Web Service None (For Skip Logic or Survey Flow) * If testing a survey, make sure to decrement counts when deleting the test data, or else the quotas will show all test data and omit space for actual responses. If the test data was not decremented, a user can go to the Quotas and reset them, but they only reset to 0. If other authenticated data has already been collected, then the quota denominator can be manually changed to a lesser number, so that there is not over-capture of data.
Using file upload question option (16 MB limit) The file upload question option can be used to invite participants to upload images, audio files, PDFs, text files, or short video files as part of their responses. Consider this feature linked to mobile devices with image capture capabilities (as one approach). From within the draft survey, insert a new question, and specify that it is a “File Upload” question type. A further feature involves the ability to designate the “Content Type” through the Content Validation feature: PDF, document, spreadsheet, graphic, (or) by various file extensions (only .pptx files, for example)
14
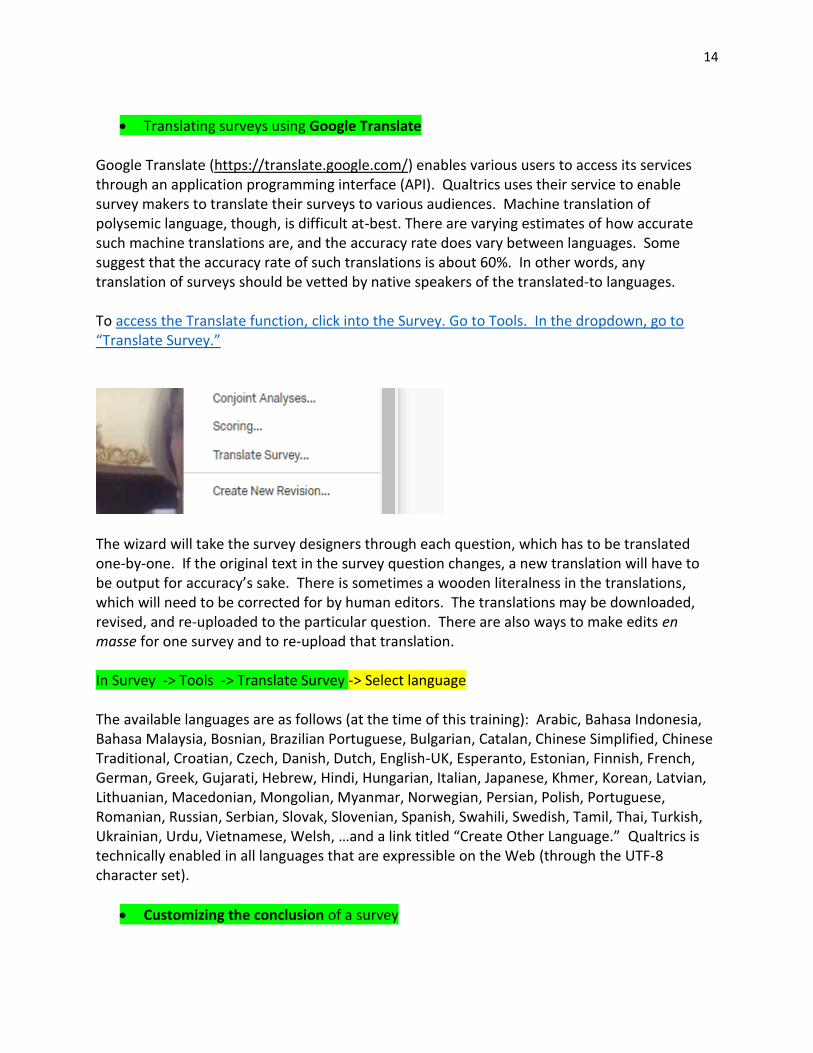
Translating surveys using Google Translate Google Translate (https://translate.google.com/) enables various users to access its services through an application programming interface (API). Qualtrics uses their service to enable survey makers to translate their surveys to various audiences. Machine translation of polysemic language, though, is difficult at-best. There are varying estimates of how accurate such machine translations are, and the accuracy rate does vary between languages. Some suggest that the accuracy rate of such translations is about 60%. In other words, any translation of surveys should be vetted by native speakers of the translated-to languages. To access the Translate function, click into the Survey. Go to Tools. In the dropdown, go to “Translate Survey.”
The wizard will take the survey designers through each question, which has to be translated one-by-one. If the original text in the survey question changes, a new translation will have to be output for accuracy’s sake. There is sometimes a wooden literalness in the translations, which will need to be corrected for by human editors. The translations may be downloaded, revised, and re-uploaded to the particular question. There are also ways to make edits en masse for one survey and to re-upload that translation. In Survey -> Tools -> Translate Survey -> Select language The available languages are as follows (at the time of this training): Arabic, Bahasa Indonesia, Bahasa Malaysia, Bosnian, Brazilian Portuguese, Bulgarian, Catalan, Chinese Simplified, Chinese Traditional, Croatian, Czech, Danish, Dutch, English-UK, Esperanto, Estonian, Finnish, French, German, Greek, Gujarati, Hebrew, Hindi, Hungarian, Italian, Japanese, Khmer, Korean, Latvian, Lithuanian, Macedonian, Mongolian, Myanmar, Norwegian, Persian, Polish, Portuguese, Romanian, Russian, Serbian, Slovak, Slovenian, Spanish, Swahili, Swedish, Tamil, Thai, Turkish, Ukrainian, Urdu, Vietnamese, Welsh, …and a link titled “Create Other Language.” Qualtrics is technically enabled in all languages that are expressible on the Web (through the UTF-8 character set).
Customizing the conclusion of a survey

15
Edit Survey -> Survey Options -> “Survey Termination” section -> Selection (by clicking radio buttons) Use the
Default end of survey message
Custom end of survey message
Redirect to single response report
Redirect to a full URL
Send an additional thank you email from the Qualtrics library
Anonymize response
Protecting a survey from manipulation There are a number of protections that may be implemented for surveys. One is to control who has access to the survey, by using the “By Invitation Only” feature. Password protections may be emplaced. There are ways to control against multiple submissions from one IP address ("ballot box stuffing"). There are ways to limit access to a survey only coming from a particular URL (uniform resource locator) or http address. There are other protections, too, such as disabling web spiders from indexing the survey and reporting back on its presence to web search engines. Also, survey expiration dates may be placed on a survey. Edit Survey -> Survey Options
Using Qualtrics for Policy Compliance or Mass Scale Trainings and Data Recording (new) Application Programming Interface (API) in Qualtrics Ties to HRIS and KSIS In Survey -> Tools -> Scoring -> Setting Score Values for Questions -> Survey Flow -> Embedded Field -> Name the Embedded Field “Score” -> Value Piped from “Scoring” Category -> Create Branch with Condition for Desired Score
A Contact List Option Or Create a Contact List (formerly Panel) that will be Populated with those that “Pass” AND Create a Contact List (formerly Panel) that will be Populated with those that “Do Not Pass” (Capture first and last names, email addresses, and such, in order to use the collected data as contact lists. This information may be captured at any time in the survey.)
Hour 2: Extracting Data for Analysis
Viewing contact lists (formerly “panels”)

16
There are two general types of email contact lists (panels):
1) An email contact list (“panel”) is a pre-defined group of those invited to participate in a survey (through verified emails). Emailing particular groups at K-State will require permissions, and survey makers will not have access to the actual email lists (because of privacy rights). The contact lists are set up by people in IT once permissions have been verified.
2) Another contact list (panel) type is an extracted sub-group or sub-population of those who respond to a particular survey or who choose a particular answer to a multiple-choice survey question. They may be groups who are self-defined by how they respond to particular questions. They may be filtered into yet other contact lists based on demographic details (M/F, age group, class, race / ethnicity, background details, and so on). They may also be filtered by IP address or geographical locations of origin. It is not uncommon to have a contact list created on completion of a survey. Email lists may be exported from contact lists…
Contact lists are OWNED by particular users. These lists are not generally shareable but may be downloaded and sent as a .csv file (in Excel). To view existing contact lists: Contacts (button at the top right) -> Lists (in All folders)-> Click on selected list There is also a search box that enables searching for Contact Lists. Once the Contact Lists have been accessed, a user may do any of the following:
Note: While survey ownership may be transferred or shared, contact list (panel) ownership cannot; that remains with whoever was logged in when creating the contact lists / panels. (The workaround is to be logged in as the individual and to create contact lists for them if they

17
cannot do it themselves. Qualtrics administrators can able such “masquerading” log-ins as others.)
Sending results to pre-made contact lists (panels) and setting up email notifications to survey owners
In Survey -> Tools -> Panel Triggers (dropdown) -> Either: “Add Respondent to Panel on Survey Complete” or “Add a Condition” A new “+ Create Sample” (at the top right) enables the creation of conditionals to populate a Contact List…
Creating new contact lists (panels) There are several ways to create new contact lists (panels). At the top right, go to Contacts. Click “+ Create Contact List”. In the pop-up window, fill in the Name text field. Select a Folder in which this Contact List will reside (or the contact list will just be Uncategorized).
Then, members may be added in from the survey creator’s mailing list (of contacts), three ways:
Import From a File
Add Manually
Import from a Survey Contacts -> + Create Contact List -> … Import From a File (basic data structure)
A B C D E F G
1 FirstName
LastName
PrimaryEmail
ExternalDataReference
EmbeddedDataA
EmbeddedDataB
2
3
18
Note the use of “camel code” (with capitalized elements), no blank spaces, and no special characters. This is a .csv (comma separated values) type of file. (The data should be in the cells below.) The second option is to add individuals manually. The third option is to “Import From a Survey.” Identify the survey, and the desired elements (usually First Name, Last Name, and Email). To bring in members in an automated way using Contact List Triggers: In Survey -> Tools -> Triggers -> Contact List Triggers ->
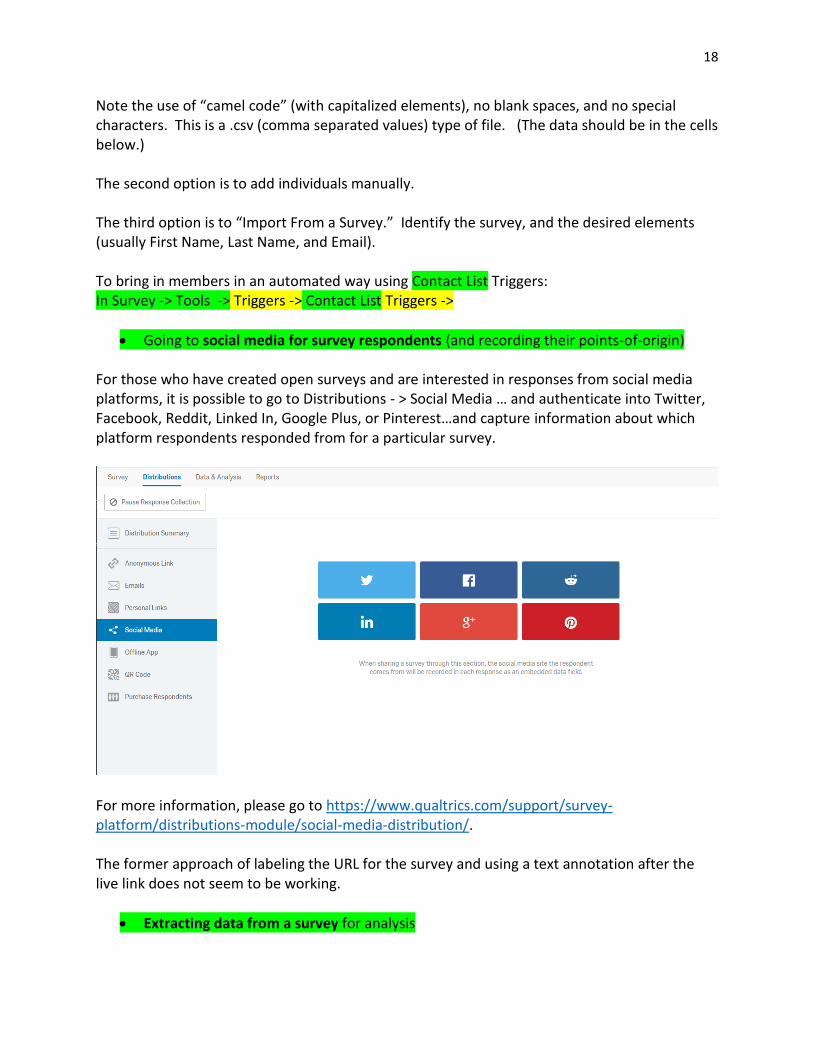
Going to social media for survey respondents (and recording their points-of-origin) For those who have created open surveys and are interested in responses from social media platforms, it is possible to go to Distributions - > Social Media … and authenticate into Twitter, Facebook, Reddit, Linked In, Google Plus, or Pinterest…and capture information about which platform respondents responded from for a particular survey.
For more information, please go to https://www.qualtrics.com/support/survey-platform/distributions-module/social-media-distribution/. The former approach of labeling the URL for the survey and using a text annotation after the live link does not seem to be working.
Extracting data from a survey for analysis
19
In Qualtrics, there are some nuances in extracting data. Every time a person goes in to view reports, he or she has to “Create a New Report” in order to have updated report contents. If older reports are selected, those will only reflect the data captured at that point in time. (Merely going to the reports area the first time will create an Initial Report.) It may help to capture reports sequentially…at various points when data is being collected…to get a sense of the changes over time (time-based sequencing). Also, it is possible to filter the data based on responses to questions in order to create subgroup analyses (analyzing responses by segmenting respondents into subgroups).
Some Cautions Avoiding accidental renumbering and re-sequencing of questions: In the report view, it is not a good idea to click on the questions listed to the left because sometimes the mouse click is enough to move the question, and the question and results automatically re-number, making it hard to access the data in its original ordering. It is preferable to use the Next Page arrows to page through a survey…(without changing any of its ordering). Downloading the full data set. Also, if there are more than 100 respondents to any questions, it is important to not directly download the table with the download at the top left of the table. Rather, it is important to first click on the “Click here to view all responses” and then download the table, to ensure that all responses are captured. There are limits to output cumulative reports because much of the data are summary data. Also, the form of the data is not in an easily query-able raw data form. To extract data about the survey (and the item analysis): Reporting (tab) -> Survey Statistics To extract data about the survey, first, download a report...and then cycle through the web pages of the "Initial Report" (or other) in order to download the various tables of data. View Results -> View Reports -> Download ….
Creating a cross-tabulation analysis (contingency table) using responses to particular questions (as variables), and then running a chi-square analysis
To create a cross-tabulation analysis, the data has to be captured correctly (correct data type / format) in the survey. For example, it helps to have multiple-choice questions with pre-defined answers (vs. open-ended text questions), matrix questions, and embedded data. No other type of data may be used in a cross-tabulation analysis within Qualtrics. Or at the very least, the data that is collected should be easy to transcode, so the analysis may be done outside of Qualtrics (if needed).

20
The wizard will not only offer a table of complex counts, but it will also calculate the chi-square statistic, the degrees of freedom, and the p-value. (There is also a “note” to remind people of whether the p-value indicates statistical significance.) View Results (tab) -> Cross Tabulation (button) -> Create a new Cross Tabulation -> Select Banner items (column headers) -> Select stubs (row headers) For more on this, please visit the following link: http://scalar.usc.edu/works/c2c-digital-magazine-fall-2016--winter-2017/conducting-a-cross-tabulation-analysis-qualtrics-research-suite A downloadable version is available in SlideShare. https://www.slideshare.net/ShalinHaiJew/conducting-a-cross-tabulation-analysis-in-the-qualtrics-research-suite
Archiving a survey offline as a .qsf file and the related data as a .csv file in the same directory (to enable the recreation of both the survey and its linked data within Qualtrics)
Sometimes, researchers may want to archive a survey and its related data offline--since there are a limited number of surveys an individual may have on the Qualtrics survey system. (Those who need greater access may contact a Qualtrics administrator in order to acquire expanded access.) To download the survey: Open the survey -> Tools dropdown -> Export Survey (.qsf file) -> Select location for the file save To download the related data: View Results (tab) -> Download Data -> Set parameters -> Click .csv format (.csv file) -> Select location for the save To reconstitute the survey and data (import responses) from offline sources: My Projects (tab) -> + Create Project -> From a File -> Import Survey -> Choose File -> Open -> Import (AND) Data & Analysis (tab) -> Data -> Export & Import -> Import Data

21
* Incomplete data (for example, a non-response) is not reimported. “.qsf” stands for “Qualtrics survey format”. “.csv” stands for “comma-separated values” format.
Addendums Auto-Numbering of Questions: There is a feature to enable renumbering of all questions once a finalized sequence is done. Start with Survey -> Tools -> Auto-Number Questions… A screenshot of the pop-up window appears below.
22
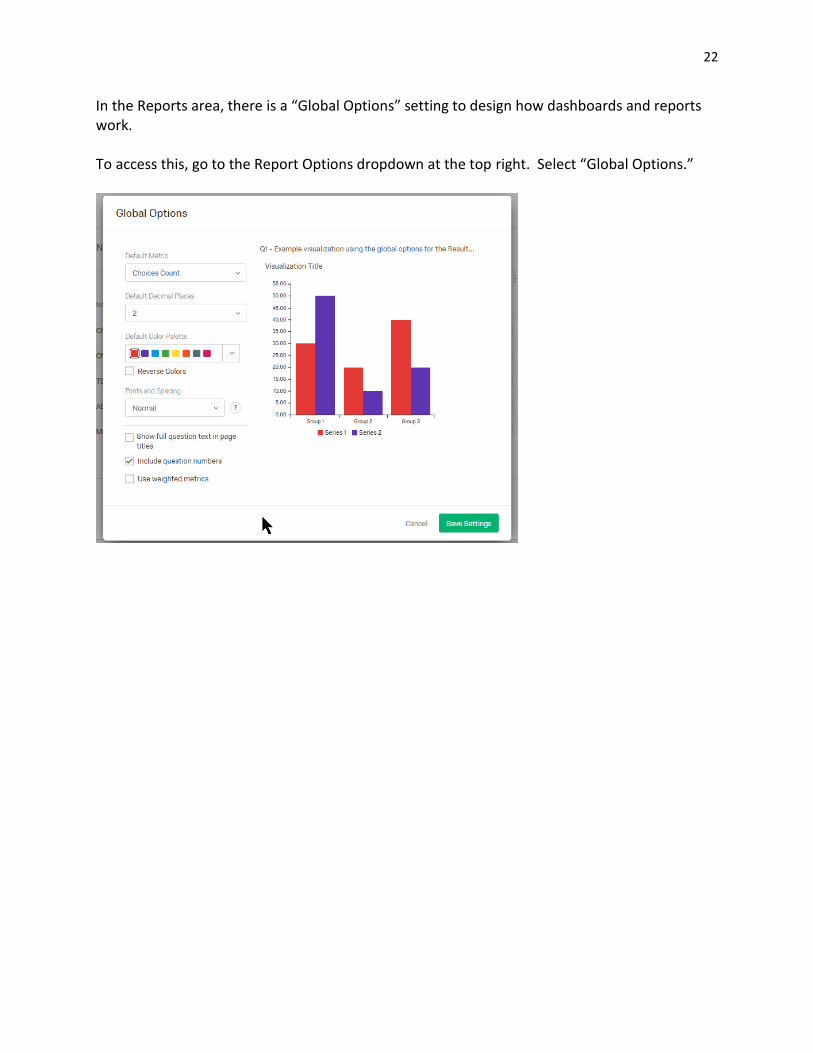
In the Reports area, there is a “Global Options” setting to design how dashboards and reports work. To access this, go to the Report Options dropdown at the top right. Select “Global Options.”

23
Brief Summary Wrap-up
Caveat: What is shown here are some of the capabilities of Qualtrics...and in very limited "use cases." With a little creativity, these various functionalities may be deployed in much more complex and useful ways.
IRB Oversight: All human-related research has to go through Institutional Review Board (IRB) review at Kansas State University (and virtually all other professional organizations). Surveys also have to provide “informed consent” to the participants. (K-Staters have to go through IRB training to even access the tool. Research partners who collaborate with K-Staters have to abide by IRB rules as well.)
Accessibility: Surveys should be as accessible and inclusive as possible. Please see Section 508 (particularly 1194.22 Web-based intranet and internet information and applications).
Data Management: Qualtrics is a cloud-based tool, and its survey is offered as software as a service (SAAS). All data is stored stateside and does not get moved between server farms abroad. These features may be critical for research that is sensitive and protected (generally anything that goes through IRB approval). As a cloud tool, some aspects of survey design are auto-saved while others (like sequencing) require specific saving to be recorded.
Creating Text Contents: When creating text contents, it is a good idea to clean all text of formatting by using a simple text editor (like Notepad) and then formatting using the Rich Content Editor view (unless individuals prefer to put in their own HTML tags in the HTML View). Once contents have been integrated, be careful how new text is added because a straight paste-in can ruin the whole Text/Graphic page. And since there is automatic updating, there is no Ctrl + Z feature to undo the last update and to revert to the prior state. (This is why it is good to have an external file version of the survey that is created as a survey is being created—if people are building their surveys straight to Qualtrics).
Professional Trust: The company behind the Qualtrics Research Suite has a sophisticated handle on surveys, statistical analysis, quantitative and qualitative analysis, and technology. The platform itself is used in a variety of ways. (http://www.qualtrics.com/)
Controlling Access: Those who “own” the surveys should control for role-based access to their surveys and not by default enable people to have access into perpetuity. Likewise, they should not leave surveys open into perpetuity.

24
Judicious Use of Multimedia: This online survey enables the uses of most of the extant multimedia file types in the world today. If multimedia may enhance responsiveness and understanding (without being distracting or encouraging certain types of answers), then these file types should be used. However, multimedia has to be accessible (per Section 508 guidelines).
Rich Data Analytics: Qualtrics enables sophisticated types of data analytics, including special insights on the survey instrument itself and cross-tabulation analysis, among others. These may provide some useful insights. (Those who are engaged in marketing and product feature research may be interested in the Conjoint analysis feature. K-State has access only to the “self-explicated model” in which respondents provide feedback to direct questions about the desirability of particular features of a product or service package. The Conjoint Analysis is set up in the Tools dropdown in the survey…and then is emplaced within the Survey Flow. The data has to be accessed through a Data Export instead of through the Reports feature.)

25

26
Note that the conjoint analysis is a stepwise and partially iterative process. Given a situation of constraints, people prefer particular attributes or levels. K-State does not enable the full conjoint analysis suite capabilities of Qualtrics. (This added feature costs a lot more to the university’s annual site license.) However, if a survey is built properly, it is possible to conduct a conjoint analysis and use SPSS to run the proper calculations. (One K-Stater said that it was fractional factorial analyses. There is an online resource that may be helpful: http://statmath.wu-wien.ac.at/courses/as_spss/Conjoint. )
Pilot Testing Surveys: It is critical to dry-run all surveys and all paths through branching surveys (and not through Preview, which does not show a live deployment and which does not capture data). This may be done by releasing the survey in an anonymous link and having individuals access that link from different locations and with different “test” roles. The testing should cover the entire sequence through to the data analytics, to ensure that the data format is correct. Ensure that scoring is correct in terms of data weighting (particularly for those using Likert and Likert-like measures. If the scoring was not done prior to deployment, responses to a completed survey may have scoring applied afterwards.) Researchers will not want to "make work" by having incorrect question structures.
Saving a Pristine Master Copy: It is a good idea to save a master copy of a survey in the survey owner’s library. This way, parts or the whole may be copied out for usage. It is also a good idea to save a copy out offline (as a .qsf format and as a Word format). Recovering a Prior Version of a Survey: Qualtrics also enables the recovery of a prior version of a survey. If an accidental change was made, a user may go to Tools and select

27
Versions…and revert to the desired prior version by selecting the desired one at the left and clicking “Restore.”.
Qualtrics Contact Lists (formerly Panels): Some may want to use the Qualtrics commercial "Purchase Responses" feature. The base cost is $5 per response, with a minimum of 100 responses. Additional targeting requirements will cost more. This may be accessed through the "Distributions" tab -> Purchase Respondents (in the left menu)
Help Desk Support: Qualtrics provides superb Help Desk support. Their support will call users directly; they will create short videos on Jing to share insights. Before contacting them, though, do review the Help documentation thoroughly as well as their FAQs (frequently asked questions).
Note: Those who know Javascript may use that high-level language to program the presentation and behaviors of questions in Qualtrics. Contact: Dr. Shalin Hai-Jew Instructional Designer iTAC K-State [email protected] 785-532-5262

28
Updated February 2018