air quality report - rhdhv.co.za metals/air quality report.pdf · air quality impact assessment for...
TRANSCRIPT

Air Quality Impact Assessment for the Scaw Metals Group High Chrome Ball Plant
A Report For: Scaw South Africa Pty Ltd
Date: April 2014
DOCUMENT DESCRIPTION
Client:
Scaw South Africa Pty Ltd
Report Name:
Air Quality Impact Assessment for the Scaw Metals Group High Chrome Ball Plant
Royal HaskoningDHV Reference Number:
E02.JNB.000810
Compiled by:
Stuart Thompson
Reviewer and Approver:
© Royal HaskoningDHV All rights reserved No part of this publication may be reproduced or transmitted in any form or by any means, electronic or mechanical, without the written permission from Royal Haskoning.DHV

TABLE OF CONTENTS
1 PROJECT DESCRIPTION 1
1.1 Project Description 1
1.2 Terms of Reference 2
1.3 Methodology 2
1.3.1 Baseline Assessment 2
1.3.2 Impact Assessment 3
1.4 Report Structure 3
2 BASELINE DESCRIPTION OF THE AREA 3
2.1 Meso-Scale Meteorology 3
2.2 Site Specific Dispersion Potential 4
2.3 Temperature and Humidity 8
2.4 Applicable Air Quality Legislation 8
2.4.1 National Environmental Management Act: Air Quality Act 39 of 2004 8
2.4.2 Listed Activities and Atmospheric Emission Licensing 9
2.4.3 Health Risk Evaluation Criteria 10
2.4.3.1 Particulate Matter 10
2.4.3.2 Oxides of Nitrogen 11
2.4.3.3 Sulphur Dioxide 13
2.5 Identified Sensitive Receptors 14
2.6 Existing Sources of Air Pollution 15
2.6.1 Domestic Fuel Burning 15
2.6.2 Industrial Activities 16
3 IMPACT ASSESSMENT 16
3.1 Operational Phase 16
3.1.1 Model Overview 16
3.1.2 Model Requirements 17
3.2 Emissions Inventory 17
3.2.1 Union Junction High Chrome Ball Processes 17
3.3 Impact Assessment 20
3.3.1 Installation of additional Electric Heat Treatment Furnace 20
3.3.2 Installation of Gas Fired Furnace 22
3.4. Assumptions and Limitations 24
4 CONCLUSION AND RECOMMENDATIONS 25

4.1 Recommendations 25
5 REFERENCES 26
6 GLOSSARY 27
LIST OF TABLES
TABLE 1: ATMOSPHERIC STABILITY CLASSES. 7
TABLE 2: MINIMUM EMISSION STANDARDS FOR SUBCATEGORY 4.2: COMBUSION INSTALLATIONS. 9
TABLE 3: AMBIENT AIR QUALITY GUIDELINES AND STANDARDS FOR PARTICULATE MATTER. 11
TABLE 4: AMBIENT AIR QUALITY GUIDELINES AND STANDARDS FOR NITROGEN DIOXIDE. 11
TABLE 5: AMBIENT AIR QUALITY GUIDELINES AND STANDARDS FOR SULPHUR DIOXIDE. 14
TABLE 6: IDENTIFIED RECEPTORS SURROUNDING THE SITE. 15
TABLE 7: EMISSION FACTORS FOR STEEL 20
TABLE 8: CALCULATED EMISSION RATES FOR THE IDENTIFIED SOURCES. 20
TABLE 9: MAXIMUM PREDICTED FENCE LINE CONCENTRATIONS. 20
TABLE 10: MAXIMUM PREDICTED FENCE LINE CONCENTRATIONS. 22
LIST OF FIGURES
FIGURE 1: LOCATION OF UNION JUNCTION IN GERMISTON. 1
FIGURE 2: PERIOD WIND ROSE FOR OR TAMBO FOR THE PERIOD JAN 2005 – DEC 2010 5
FIGURE 3: DIURNAL WIND ROSES FOR OR TAMBO FOR THE PERIOD JAN 2005 – DEC 2010. 6
FIGURE 4: SEASONAL WIND ROSES FOR OR TAMBO FOR THE PERIOD JAN 2005 – DEC 2010. 6
FIGURE 5: STABILITY CLASS FREQUENCY DISTRIBUTION FOR OR TAMBO FOR THE PERIOD JAN 2005 – DEC 2010. 7
FIGURE 6: AVERAGE MONTHLY TEMPERATURE AND HUMIDITY FOR OR TAMBO FOR THE PERIOD JAN 2005 – DEC 2010. 8
FIGURE 7: PROCESS DIAGRAM INDICATING STEPS UNDERTAKEN FOR THE CREATION OF THE HIGH CHROME BALLS 19
FIGURE 8: DAILY GROUND LEVEL PM10 CONCENTRATIONS (µG/M3) PLANT BOUNDARY (RED POLYGON). 21
FIGURE 9: ANNUAL GROUND LEVEL PM10 CONCENTRATIONS (µG/M3) PLANT BOUNDARY (THE RED POLYGON). 21
FIGURE 10: DAILY GROUND LEVEL PM10 CONCENTRATIONS (µG/M3). PLANT BOUNDARY (RED POLYGON) 22
FIGURE 11: ANNUAL GROUND LEVEL PM10 CONCENTRATIONS (µG/M3). PLANT BOUNDARY (RED POLYGON) 23

Page | 1
1 PROJECT DESCRIPTION
FIGURE 1: LOCATION OF UNION JUNCTION IN GERMISTON.
1.1 Project Description
Scaw Metals manufactures a diverse range of steel products. The Grinding Media division at Union Junction is
the largest producer of cast high chrome grinding media in the southern hemisphere and has an opportunity to
increase its production volume as a result of increased market demand. As such an additional heat treatment
furnace will be required to meet this demand.
Two alternative options have been considered for this furnace
1. An electric heat treatment furnace similar in design to the existing heat treatment furnaces at the High
Chrome Ball Plant
2. Gas-fired heat treatment furnace.
The preferred alternative for Scaw Metals it to install a gas fired furnace, due to the Union Junction Plant
currently having excess capacity of natural gas. Gas-fired furnace energy consumption is expected to be 70%
higher than an equivalent electric furnace. The current cost of electricity is R0.57/kWhr. As a direct comparison
the current cost of natural gas is R63.42/GJ which translates into R0.23/kWhr. Therefore the increased energy
consumption of a gas-fired furnace is more than offset by the reduced unit price of natural gas. At current
energy prices, the energy cost of operating a gas-fired furnace is expected to be 30% lower than an electric
furnace. Electrical supply is limited both at Scaw and the country as a whole. From a strategic point of view,
installing a gas-fired furnace utilising the excess installed natural gas supply capacity will reduce Scaw’s
demand on its own and the country’s strained electrical grid.

Page | 2
The maintenance cost of an electric heat treatment furnace is relatively high due to the large number of heating
element replacements required. By comparison, a gas-fired heat treatment furnace requires very little
maintenance to its combustion system throughout the year. The refractory costs of each furnace can be
considered to be the same. The control system for a gas-fired furnace is considerably less complicated than
that required for an electric furnace. Electrical furnaces have a lower inherent safety risk compared to a gas-
fired furnace due to the fact that hazardous gasses can accumulate in the furnace chamber and combustion
system of a gas-fired furnace. These gases can increase the risk of asphyxiation and explosion. However,
Scaw already operates a number of gas-fired furnaces, most notably in the rolling mills, and these risks can be
managed down to an acceptable level through appropriate combustion system designs, confined space entry
procedures and operating procedures.
As part of the air quality assessment both electric and gas fired furnaces will be considered.
1.2 Terms of Reference
The terms of reference for the Air Quality Impact Assessment for the project can briefly be summarised as
follows:
• Baseline Assessment
o Review of applicable legislation and policies related to air quality management which are applicable to
the High Chrome Ball Plant operations;
o Review of potential health effects associated with emissions from the High Chrome Ball Plant;
o Identify and quantify priority pollutants which need to be managed at the High Chrome Ball Plant;
o Identify priority sources in the area which may require management and can contribute to cumulative
air quality impacts;
o Outline existing air quality management practices at the High Chrome Ball Plant;
o Provide an overview of the prevailing meteorological conditions in the area.
• Impact Assessment
o Dispersion modelling simulations undertaken using AERMOD to determine the potential air quality
impacts of High Chrome Ball Plant on the surrounding area;
o Comparison of the modelled results to the National ambient air quality standards to determine
compliance;
o An Air Quality Management Plan will be developed and will include recommendations for the
implementation of appropriate mitigation measures and a monitoring programme (if required);
o Compilation of an Air Quality Impact Assessment Report.
1.3 Methodology
An overview of the methodological approach to be followed during this Air Quality Impact Assessment is
outlined in the section which follows.
1.3.1 Baseline Assessment
During the baseline assessment, a qualitative approach was used to assess the baseline conditions in the
project area. Local meteorological data was obtained from the South African Weather Services for the period
Jan 2005 – Dec 2010 (OR Tambo International Airport, 0476399 0) to determine the atmospheric dispersion
potential of the area. Applicable air quality legislation such as the National Environmental Management: Air

Page | 3
Quality Act 39 of 2004 and the Listed Activities and Associated Minimum Emission Standards were reviewed.
Criteria pollutants and their potential human health effects are also discussed. Existing sources of air pollution
surrounding the High Chrome Ball Plant were qualitatively assessed. Sensitive receptors, such as local
communities, in close proximity to the High Chrome Ball Plant were identified using satellite imagery.
1.3.2 Impact Assessment
During this phase, an emissions inventory was compiled to estimate emissions from the identified emission
sources associated with the current High Chrome Ball Plant activities. Where information was not available,
use was made of available United States Environmental Protection Agency (USEPA) emission factors.
Dispersion modelling simulations were undertaken using the AERMOD dispersion model and presented
graphically as isopleths plots. Comparison with the National ambient air quality standards was made to
determine compliance. Based on the predicted results, recommendations for appropriate mitigation measures
and/or ambient air quality monitoring were provided.
1.4 Report Structure
Section 1 of the report provides the background to the project. Section 2 includes a meteorological overview
of the region as well as a review of applicable air quality legislation, pollutants and their potential health effects.
The emissions inventory and impact assessment are presented in Section 3. Section 4 gives a summary of
the general conclusions and recommendations presented in the report. The references and glossary are
provided in Section 5 and Section 6, respectively.
2 BASELINE DESCRIPTION OF THE AREA
2.1 Meso-Scale Meteorology
The nature of local climate will determine what will happen to pollution when it is released into the atmosphere
(Tyson and Preston-Whyte, 2000). Pollution levels fluctuate daily and hourly, in response to changes in
atmospheric stability and variations in mixing depth. Similarly, atmospheric circulation patterns will have an
effect on the rate of transport and dispersion of pollution.
The release of atmospheric pollutants into a large volume of air results in the dilution of those pollutants. This is
best achieved during conditions of free convection and when the mixing layer is deep (unstable atmospheric
conditions). These conditions occur most frequently in summer during the daytime. This dilution effect can
however be inhibited under stable atmospheric conditions in the boundary layer (shallow mixing layer). Most
surface pollution is thus trapped under a surface inversion (Tyson and Preston-Whyte, 2000).
Inversion occurs under conditions of stability when a layer of warm air lies directly above a layer of cool air.
This layer prevents a pollutant from diffusing freely upward, resulting in an increased pollutant concentration at
or close to the earth’s surface. Surface inversions develop under conditions of clear, calm and dry conditions
and often occur at night and during winter (Tyson and Preston-Whyte, 2000). Radiative loss during the night
results in the development of a cold layer of air close to the earth’s surface. These surface inversions are
however, usually destroyed as soon as the sun rises and warm the earth’s surface. With the absence of
surface inversions, the pollutants are able to diffuse freely upward; this upward motion may however be
prevented by the presence of an elevated inversion (Tyson and Preston-Whyte, 2000).

Page | 4
Elevated inversions occur commonly in high pressure areas. Sinking air warms adiabatically to temperatures in
excess of those in the mixed boundary layer. The interface between the upper, gently subsiding air is marked
by an absolutely stable layer or an elevated subsidence inversion. This type of elevated inversions is most
common over Southern Africa (Tyson and Preston-Whyte, 2000).
The climate and atmospheric dispersion potential of the interior of South Africa is determined by atmospheric
conditions associated with the continental high pressure cell located over the interior. The continental high
pressure present over the region in the winter months results in fine conditions with little rainfall and light winds
with a northerly flow. Elevated inversions are common in such high pressure areas due to the subsidence of
air. This reduces the mixing depth and suppresses the vertical dispersion of pollutants, causing increased
pollutant concentrations (Tyson and Preston-Whyte, 2000).
Seasonal variations in the positions of the high pressure cells have an effect on atmospheric conditions over
the region. For most of the year the tropical easterlies cause an air flow with a north-easterly to north-westerly
component. In the winter months the high pressure cells move northward, displacing the tropical easterlies
northward resulting in disruptions to the westerly circulation. The disruptions result in a succession of cold
fronts over the area in winter with pronounced variations in wind direction, wind speeds, temperature, humidity,
and surface pressure. Airflow ahead of a cold front passing over the area has a strong north-north-westerly to
north-easterly component, with stable and generally cloud-free conditions. Once the front has passed, the
airflow is reflected as having a dominant southerly component (Tyson and Preston-Whyte, 2000).
Easterly and westerly wave disturbances cause a southerly wind flow and tend to hinder the persistence of
inversions by destroying them or increasing their altitude, thereby facilitating the dilution and dispersion of
pollutants. Pre-frontal conditions tend to reduce the mixing depth. The potential for the accumulation of
pollutants during pre-frontal conditions is therefore enhanced over the plateau (Tyson and Preston-Whyte,
2000).
2.2 Site Specific Dispersion Potential
Local surface meteorological data was obtained from a weather station operated by the South African Weather
Services at O.R Tambo International Airport (0476399 0)for the period Jan 2005 – Dec 2010. Meteorological
parameters recorded at this station include wind speed, wind direction, temperature, pressure, humidity and
rainfall. This station is located approximately 18 km from Union Junction and is therefore considered to be
representative of the prevailing meteorological conditions in the area.
Wind roses comprise of 16 spokes which represent the directions from which winds blew during the period.
The colours reflect the different categories of wind speeds. The dotted circles provide information regarding the
frequency of occurrence of wind speed and direction categories.
Based on an evaluation of the meteorological data provided, winds originate predominantly from the north-west
(12% of the time), north-north-west (10% of the time) and north (11% of the time) (Figure 2). Moderate to fast
winds are generally recorded over the monitoring period. Calm wind speeds, which are designated as wind
speeds less than 0.5 m/s, occur infrequently (3.94% of the time).

Page | 5
FIGURE 2: PERIOD WIND ROSE FOR OR TAMBO FOR THE PERIOD JAN 2005 – DEC 2010
A diurnal trend in the wind field is recorded near the High Chrome Ball Plant (Figure 3). A similar wind field is
recorded between 00:00 – 06:00 and 06:00 – 12:00 with winds originating predominantly from the north.
Between 12:00 – 24:00, winds originate predominantly from the north-west. As would be expected, an increase
in wind speeds is recorded during the day-time compared to the night-time.
00:00 – 06:00
06:00 – 12:00

Page | 6
12:00 – 18:00
18:00 – 24:00
FIGURE 3: DIURNAL WIND ROSES FOR OR TAMBO FOR THE PERIOD JAN 2005 – DEC 2010.
The seasonal variability in the wind field at the site is shown in Figure 4. During the summer months (Dec, Jan
and Feb), winds originate predominantly from the north-west, north-north-west and northerly directions. A
similar wind field is recorded during the autumn (Mar, Apr and May) and winter (Jun, Jul and Aug) months, with
winds originating predominantly from the north-west. During spring (Sep, Oct and Nov), winds shift back to a
northerly direction.
Summer
Autumn
Winter
Spring
FIGURE 4: SEASONAL WIND ROSES FOR OR TAMBO FOR THE PERIOD JAN 2005 – DEC 2010.

Page | 7
Based on the prevailing meteorological conditions for the area, emissions released from the High Chrome Ball
Plant activities will be transported predominantly in south-easterly, south-south-easterly and southerly direction
from the site. The prevalence of moderate to fast winds will transport emissions several kilometres from the site.
The tendency of the atmosphere to resist or enhance vertical motion and thus turbulence is termed
atmospheric stability. Stability is related to both the change of temperature with height and wind speed. A
neutral atmosphere neither enhances nor inhibits mechanical turbulence. An unstable atmosphere enhances
turbulence, whereas a stable atmosphere inhibits mechanical turbulence. The turbulence of the atmosphere is
the most important parameter affecting dilution of air pollution as the more unstable the atmosphere, the
greater the dilution of air pollution.
Atmospheric stability is commonly categorised into six stability classes (Table 1). The atmospheric boundary
layer is usually unstable during the day due to turbulence caused by the sun's heating effect on the earth's
surface. The depth of this mixing layer depends mainly on the amount of solar radiation, increasing in size
gradually from sunrise to reach a maximum at about 5 - 6 hours after sunrise. The degree of thermal turbulence
is increased on clear warm days with light winds. During the night-time a stable layer, with limited vertical
mixing, exists. During windy and/or cloudy conditions, the atmosphere is normally neutral.
TABLE 1: ATMOSPHERIC STABILITY CLASSES.
A Very unstable calm wind, clear skies, hot daytime conditions
B Moderately unstable clear skies, daytime conditions
C Unstable moderate wind, slightly overcast daytime conditions
D Neutral high winds or cloudy days and nights
E Stable moderate wind, slightly overcast night-time conditions
F Very stable low winds, clear skies, cold night-time conditions
In general, the site experiences neutral (Class D) to stable (Class E) atmospheric conditions (Figure 5). This is
expected given the predominance of a high-pressure anticyclone over South Africa which produces stable,
clear conditions.
FIGURE 5: STABILITY CLASS FREQUENCY DISTRIBUTION FOR OR TAMBO FOR THE PERIOD JAN 2005 – DEC 2010.

Page | 8
2.3 Temperature and Humidity
Temperature affects the formation, action, and interactions of pollutants in various ways (Kupchella and
Hyland, 1993). Chemical reaction rates tend to increase with temperature and the warmer the air, the more
water it can hold and hence the higher the humidity. When relative humidity exceeds 70%, light scattering by
suspended particles begins to increase, as a function of increased water uptake by the particles (CEPA/FPAC
Working Group, 1999). This results in decreased visibility due to the resultant haze. Many pollutants may also
dissolve in water to form acids. Temperature also provides an indication of the rate of development and
dissipation of the mixing layer.
Average monthly temperature and humidity at the site for the period Jan 2005 – Dec 2010 is given in Figure 6.
Daily average summer temperatures range between ~19 °C and ~20 °C while winter temperatures range
between ~11 °C and ~13 °C. Relative humidity is lowest during autumn and winter and highest in summer and
spring.
FIGURE 6: AVERAGE MONTHLY TEMPERATURE AND HUMIDITY FOR OR TAMBO FOR THE PERIOD JAN 2005 – DEC 2010.
2.4 Applicable Air Quality Legislation
2.4.1 National Environmental Management Act: Air Quality Act 39 of 2004
The National Environmental Management: Air Quality Act 39 of 2004 (AQA) has shifted the approach of air
quality management from source-based control to receptor-based control. The main objectives of the Act are
to:
• Give effect to everyone’s right ‘to an environment that is not harmful to their health and well-being’

Page | 9
• Protect the environment by providing reasonable legislative and other measures that (i) prevent pollution
and ecological degradation, (ii) promote conservation and (iii) secure ecologically sustainable development
and use of natural resources while promoting justifiable economic and social development
The Act makes provision for the setting and formulation of national ambient air quality standards for
‘substances or mixtures of substances which present a threat to health, well-being or the environment’. More
stringent standards can be established at the provincial and local levels.
The control and management of emissions in the AQA relates to the listing of activities that are sources of
emission and the issuing of emission licences. Listed activities are defined as activities which ‘result in
atmospheric emissions and are regarded as having a significant detrimental effect on the environment,
including human health’. Listed activities have been identified by the Minister of the Department of
Environmental Affairs and atmospheric emission standards have been established for each of these activities.
These listed activities now require an atmospheric emission licence to operate. The issuing of emission
licences for Listed Activities is the responsibility of the Metropolitan and District Municipalities.
In addition, the Minister may declare any substance contributing to air pollution as a priority pollutant. Any
industries or industrial sectors that emit these priority pollutants will be required to implement a Pollution
Prevention Plan. Municipalities are required to ‘designate an air quality officer to be responsible for co-
ordinating matters pertaining to air quality management in the Municipality’. The appointed Air Quality Officer is
responsible for the issuing of atmospheric emission licences. The designated authority responsible for the
management of listed activities undertaken at Union Junction is noted to be Ekurhuleni Metropolitan
Municipality.
2.4.2 Listed Activities and Atmospheric Emission Licensing
The Air Quality Act requires all persons undertaking listed activities in terms of Section 21 of the Act to obtain
an Atmospheric Emission Licence. The Listed Activities and Associated Minimum Emission Standards was
issued by the Department of Environmental Affairs on 24 July 2009 (Government Gazette No 32434).
Scaw Metals is categorised as a Category 4 (Metallurgical Industry) listed activity and therefore requires an
Atmospheric Emission Licence to operate. The following activity in relation to this application is applicable to
the Scaw Metals processes undertaken at Union Junction:
• Subcategory 4.2: Combustion Installation (excluding any solid material that is regarded as waste in terms
of the Waste Act, 2008)
The emission limits for the above listed activity is given below in Table 2.
TABLE 2: MINIMUM EMISSION STANDARDS FOR SUBCATEGORY 4.2: COMBUSION INSTALLATIONS.
Description Combustion installations not used for primarily for steam raising and electricity generation
(except drying)
Application All installations (except test or experimental)
Substance or mixture of substances Plant status
mg/m3 under normal conditions of 6% O2, 273 Kelvin
and 101.3 kPa Common name Chemical symbol
Particulate matter N/A New 50

Page | 10
Existing 100
Sulphur dioxide SO2 New 500
Existing 500
Oxides of nitrogen NOx expressed as NO2 New 500
Existing 2000
(a) The following special arrangements shall apply:
(i) Reference oxygen content appropriate to fuel type must be used
New plants must comply with the new facilities minimum emission standards on the date of publication of the
Notice (i.e. 1 April 2010). Existing plants must comply with the minimum emission standards for existing plants
within 5 years of the date of publication of the Notice (i.e. 31 March 2015). Existing plants must comply with
minimum emission standards for new plants as within 10 years of the date of publication of the Notice (i.e. 31
March 2020). In terms of regulation 6, an application can be submitted for the postponement of the compliance
timeframes as set out above and the procedure to follow should a person wish to submit a postponement
application.
2.4.3 Health Risk Evaluation Criteria
South African ambient air quality standards have been issued by the Department of Environmental Affairs and
will be used as a basis for comparison for this assessment. However, reference will be made to international
guidelines/standards to ensure comparison is made to international best practice principles. The human health
effects associated with particulate matter (PM), sulphur dioxide (SO2), nitrogen dioxide (NO2) and are described
in the sub-sections below.
2.4.3.1 Particulate Matter
Particulate matter is the collective name for fine solid or liquid particles added to the atmosphere by processes
at the earth's surface. Particulate matter includes dust, smoke, soot, pollen and soil particles (Kemp, 1998).
Particulate matter has been linked to a range of serious respiratory and cardiovascular health problems. The
key effects associated with exposure to ambient particulate matter include: premature mortality, aggravation of
respiratory and cardiovascular disease, aggravated asthma, acute respiratory symptoms, chronic bronchitis,
decreased lung function, and an increased risk of myocardial infarction (USEPA, 1996).
Particulate matter represents a broad class of chemically and physically diverse substances. Particles can be
described by size, formation mechanism, origin, chemical composition, atmospheric behaviour and method of
measurement. The concentration of particles in the air varies across space and time, and is related to the
source of the particles and the transformations that occur in the atmosphere (USEPA, 1996).
Particulate Matter can be principally characterised as discrete particles spanning several orders of magnitude
in size, with inhalable particles falling into the following general size fractions (USEPA, 1996):
• PM10 (generally defined as all particles equal to and less than 10 microns in aerodynamic diameter;
particles larger than this are not generally deposited in the lung);
• PM2.5, also known as fine fraction particles (generally defined as those particles with an aerodynamic
diameter of 2.5 microns or less)
• PM10-2.5, also known as coarse fraction particles (generally defined as those particles with an
aerodynamic diameter greater than 2.5 microns, but equal to or less than a nominal 10 microns); and
• Ultra fine particles generally defined as those less than 0.1 microns.

Page | 11
Fine and coarse particles are distinct in terms of the emission sources, formation processes, chemical
composition, atmospheric residence times, transport distances and other parameters. Fine particles are directly
emitted from combustion sources and are also formed secondarily from gaseous precursors such as sulphur
dioxide, nitrogen oxides, or organic compounds. Fine particles are generally composed of sulphate, nitrate,
chloride and ammonium compounds, organic and elemental carbon, and metals.
Table 3 outlines the various international health risk criteria used for the assessment of inhalable particulate
matter (PM10). Guidelines and standards are provided for a 24-hour exposure and annual average exposure
period respectively.
TABLE 3: AMBIENT AIR QUALITY GUIDELINES AND STANDARDS FOR PARTICULATE MATTER.
Origin 24-Hour Exposure (µg/m3) Annual Average
Exposure (µg/m3)
Number of Exceedances Allowed
Per Year
South Africa 120
75(1)
50
40(1) 4 daily exceedance
World Bank(2) 500 100 NA
EU(3) 50 20 7 daily exceedance
US-EPA(4) 150 50(5) 1 daily exceedance
UK(6) 50 40 35 daily exceedance
WHO(7) (8) (9) 50 20 NA
Notes: (1) Standard laid out in the National Environment Management: Air Quality Act. No 39 of 2004. Compliance required by 2015. (2) World Bank Air Quality Standards summary obtainable at URL
http://www.worldbank.org/html/fpd/em/power/standards/airqstd.stm#paq. (3) European Union Air Quality Standards summary obtainable at URL
http://europa.eu.int/smartapi/cgi/sga_doc?smartapi!celexplus!prod!DocNumber&lg=en&type_doc=Directive&an_doc=1999
&nu_doc=30. (4) United States Environmental Protection Agencies National Air quality Standards obtainable at URL
http://www.epa.gov/air/criteria.html (5) To attain this standard, the 3-year average of the weighted annual mean PM10 concentration at each monitor within an
area must not exceed 50 ug/m3. (6) United Kingdom Air Quality Standards and objectives obtainable at URL http://www.airquality.co.uk/archive/standards.php (7) WHO = World Health Organisation. (8) Guidance on the concentrations at which increasing, and specified mortality responses due to PM are expected based on
current scientific insights (WHO, 2005). (9) Air quality guideline.
2.4.3.2 Oxides of Nitrogen
Air quality guidelines and standards issued by most other countries and organisations tend to be given
exclusively for NO2 concentrations as NO2 is the most important species from a human health point of view.
International and South African standards for NO2 are presented in Table 4.
TABLE 4: AMBIENT AIR QUALITY GUIDELINES AND STANDARDS FOR NITROGEN DIOXIDE.
Averaging Period South Africa WHO EC Australia
µg/m3 ppm µg/m3 ppm µg/m3 ppm µg/m3 ppm

Page | 12
Annual Ave 40 0.021 40 0.021 40(1) 0.021(1) 57(3) 0.03(3)
Max. 1-hr 200 0.10 200 0.10 200(2) 0.10(2) 240(4) 0.12(4)
Notes: (1) Annual limit value for the protection of human health, to be complied with by 1 January 2010. (2) Averaging times represent 98th percentile of averaging periods; calculated from mean values per hour or per period of less than an hour
taken through out year; not to be exceeded more than 8 times per year. This limit is to be complied with by 1 January 2010. (3) Standard set in June 1998. Goal within 10 years given as being no exceedances. (4) Standard set in June 1998. Goal within 10 years given as maximum allowable exceedances of 1 day a year.
Nitrogen Oxide (NO) is one of the primary pollutants emitted by aircraft and motor vehicle exhausts. As
discussed previously, NO2 is formed through oxidation of these oxides once released in the air. NO2 is an
irritating gas that is absorbed into the mucous membrane of the respiratory tract. The most adverse health
effect occurs at the junction of the conducting airway and the gas exchange region of the lungs. The upper
airways are less affected because NO2 is not very soluble in aqueous surfaces. Exposure to NO2 is linked with
increased susceptibility to respiratory infection, increased airway resistance in asthmatics and decreased
pulmonary function.
Available data from animal toxicology experiments indicate that acute exposure to NO2 concentrations of less
than 1 880 µg/m3 (1 ppm) rarely produces observable effects (WHO 2000). Normal healthy humans, exposed
at rest or with light exercise for less than two hours to concentrations above 4 700 µg/m3 (2.5 ppm), experience
pronounced decreases in pulmonary function; generally, normal subjects are not affected by concentrations
less than 1 880 µg/m3 (1.0 ppm). One study showed that the lung function of subjects with chronic obstructive
pulmonary disease is slightly affected by a 3.75-hour exposure to 560 µg/m3 (0.3 ppm) (WHO 2000).
Asthmatics are likely to be the most sensitive subjects, although uncertainties exist in the health database. The
lowest concentration causing effects on pulmonary function was reported from two laboratories that exposed
mild asthmatics for 30 to 110 minutes to 565 µg/m3 (0.3 ppm) NO2 during intermittent exercise. However,
neither of these laboratories was able to replicate these responses with a larger group of asthmatic subjects.
NO2 increases bronchial reactivity, as measured by the response of normal and asthmatic subjects following
exposure to pharmacological bronchoconstrictor agents, even at levels that do not affect pulmonary function
directly in the absence of a bronchoconstrictor. Some, but not all, studies show increased responsiveness to
bronchoconstrictors at NO2 levels as low as 376-565 µg/m3 (0.2 to 0.3 ppm); in other studies, higher levels had
no such effect. Because the actual mechanisms of effect are not fully defined and NO2 studies with allergen
challenges showed no effects at the lowest concentration tested (188 µg/m3; 0.1 ppm), full evaluation of the
health consequences of the increased responsiveness to bronchoconstrictors is not yet possible.
Studies with animals have clearly shown that several weeks to months of exposure to NO2 concentrations of
less than 1 880 µg/ m3 (1ppm) causes a range of effects, primarily in the lung, but also in other organs such as
the spleen and liver, and in blood. Both reversible and irreversible lung effects have been observed. Structural
changes range from a change in cell type in the tracheobronchial and pulmonary regions (at a lowest reported
level of 640 µg/m3), to emphysema-like effects. Biochemical changes often reflect cellular alterations, with the
lowest effective NO2 concentrations in several studies ranging from 380-750µg/m3. NO2 levels of about 940
µg/m3 (0.5ppm) also increase susceptibility to bacterial and viral infection of the lung. Children of between 5-12
years old are estimated to have a 20% increased risk for respiratory symptoms and disease for each increase
of 28 µg/m3 NO2 (2-week average), where the weekly average concentrations are in the range of 15-128 µg/m
3
or possibly higher. However, the observed effects cannot clearly be attributed to either the repeated short-term
high-level peak, or to long-term exposures in the range of the stated weekly averages (or possibly both). The
Page | 13
results of outdoor studies consistently indicate that children with long-term ambient NO2 exposures exhibit
increased respiratory symptoms that are of longer duration, and show a decrease in lung function.
2.4.3.3 Sulphur Dioxide
SO2 is an irritant that is absorbed in the nose and aqueous surfaces of the upper respiratory tract, and is
associated with reduced lung function and increased risk of mortality and morbidity. Adverse health effects of
SO2 include coughing, phlegm, chest discomfort and bronchitis.
Short-period exposures (less than 24 hours)
Most information on the acute effects of SO2 comes from controlled chamber experiments on volunteers
exposed to SO2 for periods ranging from a few minutes up to one hour (WHO 2000). Acute responses occur
within the first few minutes after commencement of inhalation. Further exposure does not increase effects.
Effects include reductions in the mean forced expiratory volume over one second (FEV1), increases in specific
airway resistance, and symptoms such as wheezing or shortness of breath. These effects are enhanced by
exercise that increases the volume of air inspired, as it allows SO2 to penetrate further into the respiratory tract.
A wide range of sensitivity has been demonstrated, both among normal subjects and among those with asthma.
People with asthma are the most sensitive group in the community. Continuous exposure-response
relationships, without any clearly defined threshold, are evident.
Sub-chronic exposure over a 24-hour period
Information on the effects of exposure averaged over a 24-hour period is derived mainly from epidemiological
studies in which the effects of SO2, suspended particulate matter and other associated pollutants are
considered. Exacerbation of symptoms among panels of selected sensitive patients seems to arise in a
consistent manner when the concentration of SO2 exceeds 250 µg/m3 in the presence of suspended particulate
matter. Several more recent studies in Europe have involved mixed industrial and vehicular emissions now
common in ambient air. At low levels of exposure (mean annual levels below 50 µg/m3; daily levels usually not
exceeding 125 µg/m3) effects on mortality (total, cardiovascular and respiratory) and on hospital emergency
admissions for total respiratory causes and chronic obstructive pulmonary disease (COPD), have been
consistently demonstrated. These results have been shown, in some instances, to persist when black smoke
and suspended particulate matter levels were controlled for, while in others no attempts have been made to
separate the pollutant effects. In these studies no obvious threshold levels for SO2 has been identified.
Long-term exposure
Earlier assessments, using data from the coal-burning era in Europe judged the lowest-observed-adverse-
effect level of SO2 to be at an annual average of 100 µg/m3, when present with suspended particulate matter.
More recent studies related to industrial sources of SO2, or to the changed urban mixture of air pollutants, have
shown adverse effects below this level. There is, however, some difficulty in finding this value.
Based upon controlled studies with asthmatics exposed to SO2 for short periods, the WHO (WHO 2000)
recommends that a value of 500 µg/m3 (0.175 ppm) should not be exceeded over averaging periods of 10
minutes. Because exposure to sharp peaks depends on the nature of local sources, no single factor can be
applied to estimate corresponding guideline values over longer periods, such as an hour. Day-to-day changes
in mortality, morbidity, or lung function related to 24-hour average concentrations of SO2 are necessarily based
on epidemiological studies, in which people are in general exposed to a mixture of pollutants; and guideline
values for SO2 have previously been linked with corresponding values for suspended particulate matter. This
approach led to a previous guideline 24-hour average value of 125 µg/m3 (0.04 ppm) for SO2, after applying an
uncertainty factor of two to the lowest-observed-adverse-effect level. In more recent studies, adverse effects

Page | 14
with significant public health importance have been observed at much lower levels of exposure. However,
there is still a large uncertainty with this and hence no concrete basis for numerical changes of the 1987-
guideline values for SO2.
The EC’s air quality criteria represent standards to be achieved by the year 2005, and would supersede the EU
standards. The ambient air quality standards of the US-EPA are based on clinical and epidemiological
evidence. These standards were established by determining concentrations with the lowest-observed-adverse
effect, adjusted by an arbitrary margin of safety factor to allow for uncertainties in extrapolating from animals to
humans and from small groups of humans to larger populations. The standards of the US-EPA also reflect the
technological feasibility of attainment.
Ambient air quality guidelines and standards issued for various countries and organisations for SO2 are given in
Table 5.
TABLE 5: AMBIENT AIR QUALITY GUIDELINES AND STANDARDS FOR SULPHUR DIOXIDE.
Origin Annual Average
Maximum (µg/m3)
24-Hour Maximum
(µg/m3)
1-Hour Maximum
(µg/m3)
<1-Hour Maximum
(µg/m3)
RSA 50
125
350
500 (10 min average)
WHO 50(1)
10-30(2) 125(1) -
500(1)
(10 min average)
EC 20(3) 125(4) 350(5)
UK 20(6) 125(7) 350(8) 266(9)
(15 min mean)
World Bank 50(10) 125(10) - -
US-EPA 80 365 - -
Australia 53(11) 209(12) 520(13) -
Notes: (1) Air quality guidelines (issued by the WHO for Europe) for the protection of human health (WHO, 2000). (2) Represents the critical level for ecotoxic effects (issued by the WHO for Europe); a range is given to account for different
sensitivities of vegetation types. (3) Limit value to protect ecosystems. Applicable two years from entry into force of the Air Quality Framework Directive 96/62/EC. (4) Limit to protect health, to be complied with by 1 January 2005. (Not to be exceeded more than 3 times per calendar year) (5) Limit to protect health, to be complied with by 1 January 2005. (Not to be exceeded more than 4 times per calendar year.) (6) Given as annual and winter (1 Oct to 31 March) mean, to be complied with by 31 December 2000. (7) 24-hour mean, not to be exceeded more than 24 times a year. Compliance required by 31 December 2004. (8) 1-hour mean, not to be exceeded more than 24 times a year. Compliance required by 31 December 2004 (9) 15-minute mean, not to be exceeded more than 35 times a year. Compliance required by 31 December 2005. (10) Ambient air concentration permissible at property boundary. (11) Standard set in June 1998 as 0.02 ppm. Goal within 10 years is to have no exceedances. (12) Standard set in June 1998 as 0.08 ppm. Goal within 10 years is to have maximum allowable exceedances of 1 day per year. (13) Standard set in June 1998 as 0.20 ppm. Goal within 10 years is to have maximum allowable exceedances of 1 day per year.
2.5 Identified Sensitive Receptors
A sensitive receptor for the purposes of the current investigation is defined as a person or place where
involuntary exposure to pollutants released by the project could take place. Receptors surrounding Union
Junction were identified from satellite images and through a site visit to the area (Table 6).

Page | 15
TABLE 6: IDENTIFIED RECEPTORS SURROUNDING THE SITE.
Receptor Name Distance from HCBP Direction from HCBP
Wadeville 3.2km NE
Albemarie 1.7km N
Verwoerdpark 2.0km NW
Newmarket Park 3.4km W
Tshongweni 3.1km SW
Roodekop 2.5km SE
2.6 Existing Sources of Air Pollution
Based on satellite imagery and a site description of the area, the following surrounding sources of air pollution
have been identified in the area:
• Domestic fuel burning;
• Industrial activities
A qualitative discussion of each identified source is provided in the subsections below. The aim is to highlight
the potential contribution of surrounding sources to the overall ambient air quality situation in the area. These
sources have not been quantified as part of this assessment, rather a qualitative assessment of impacts is
provided.
2.6.1 Domestic Fuel Burning
Due to the close proximity of residential developments, it is anticipated that low income households in the area
are likely to combust domestic fuels for space heating and/ or cooking purposes. Exposure to indoor air
pollution (IAP) from the combustion of solid fuels is an important cause of morbidity and mortality in developing
countries. Biomass and coal smoke contain a large number of pollutants and known health hazards, including
particulate matter, carbon monoxide, nitrogen dioxide, sulphur oxides (mainly from coal), formaldehyde, and
polycyclic organic matter, including carcinogens such as benzo[a]pyrene (Ezzati and Kammen, 2002).
Exposure to indoor air pollution (IAP) from the combustion of solid fuels has been implicated, with varying
degrees of evidence, as a causal agent of several diseases in developing countries, including acute respiratory
infections (ARI) and otitis media (middle ear infection), chronic obstructive pulmonary disease (COPD), lung
cancer (from coal smoke), asthma, cancer of the nasopharynx and larynx, tuberculosis, perinatal conditions
and low birth weight, and diseases of the eye such as cataract and blindness (Ezzati and Kammen, 2002).
Monitoring of pollution and personal exposures in biomass-burning households has shown concentrations are
many times higher than those in industrialized countries. The latest International Ambient Air Quality Standards,
for instance, required the daily average concentration of PM10 to be < 180 µg/m3 (annual average < 60 µg/m
3).
In contrast, a typical 24-hr average concentration of PM10 in homes using bio fuels may range from 200 to 5
000 µg/m3 or more throughout the year, depending on the type of fuel, stove, and housing. Concentration levels,
of course, depend on where and when monitoring takes place, because significant temporal and spatial
variations may occur within a house. Field measurements, for example, recorded peak concentrations of > 50
000 µg/m3
in the immediate vicinity of the fire, with concentrations falling significantly with increasing distance
from the fire. Overall, it has been estimated that approximately 80% of total global exposure to airborne

Page | 16
particulate matter occurs indoors in developing nations. Levels of CO and other pollutants also often exceed
international guidelines (Ezzati and Kammen, 2002).
Although a high percentage of households in the area are electrified, the burning of domestic fuels for heating
and cooking purposes is likely to occur in informal areas surrounding the High Chrome Ball Plant. Even in
electrified areas, households make use of domestic fuels due to high electricity costs and the traditional use of
such fuels. Based on the Census 2001, coal and paraffin are predominantly also used in the nearby informal
area of Wattville which is located to the south of the Benoni South Industrial Area.
2.6.2 Industrial Activities
Industrial areas surrounding Union Junction include Wadeville and Roodekop. Industrial sources in these areas
will contribute to elevated gaseous and particulate emissions in the area. Emissions released from these
processes include sulphur dioxide, carbon monoxide, carbon dioxide, oxides of nitrogen, and particulate matter.
Through the combustion of various fuels such as coal, paraffin, and diesel, various levels of volatile organic
compounds or heavy metals are also expected to be released to the atmosphere.
3 IMPACT ASSESSMENT
This section of the report outlines the potential ambient air quality impacts associated with current activities at
the High Chrome Ball Plant. A detailed emissions inventory was compiled as part of this assessment to
determine emissions released from the High Chrome Ball Plant. Dispersion modelling simulations were
undertaken using the AERMOD dispersion model with the impacts provided presented graphically as isopleths
plots.
3.1 Operational Phase
3.1.1 Model Overview
AERMOD, a state-of-the-art Planetary Boundary Layer (PBL) air dispersion model, was developed by the
American Meteorological Society and USEPA Regulatory Model Improvement Committee (AERMIC). AERMOD
utilizes a similar input and output structure to ISCST3 and shares many of the same features, as well as
offering additional features. AERMOD fully incorporates the PRIME building downwash algorithms, advanced
depositional parameters, local terrain effects, and advanced meteorological turbulence calculations.
The AERMOD atmospheric dispersion modelling system is an integrated system that includes three modules:
• A steady-state dispersion model designed for short-range (up to 50 km) dispersion of air pollutant
emissions from stationary industrial sources.
• A meteorological data pre-processor (AERMET) for surface meteorological data, upper air soundings, and
optionally, data from on-site instrument towers. It then calculates atmospheric parameters needed by the
dispersion model, such as atmospheric turbulence characteristics, mixing heights, friction velocity, Monin-
Obukov length and surface heat flux.
• A terrain pre-processor (AERMAP) which provides a physical relationship between terrain features and the
behaviour of air pollution plumes. It generates location and height data for each receptor location. It also

Page | 17
provides information that allows the dispersion model to simulate the effects of air flowing over hills or
splitting to flow around hills.
3.1.2 Model Requirements
Input data requirements for AERMOD include meteorological and geophysical (terrain) data, model grid
specifications as well as emissions source data. Local meteorological data was obtained from the South African
Weather Services for the period Jan 2005 – Dec 2010 and includes hourly observations of wind speed, wind
direction, temperature and humidity from O.R Tambo International Airport (0476399 0). Terrain data
(GTOPO30) was included in the dispersion modelling simulations. Given the close proximity of the emission
sources to the High Chrome Ball Plant building, the effects of building downwash was also accounted for in the
modelling simulations. Source and emission parameters for the model are detailed in the section below.
3.2 Emissions Inventory
Particulates and gaseous pollutants are released from High Chrome Ball Plant operations. Gaseous emissions
are emitted from the electric heat treatment furnaces and gas treatment ovens.
Sources of emissions identified as occurring due to current operations at Union Junction and which need to be
addressed from an air quality perspective are summarized as follows:
• Electric heat treatment furnaces Annealing and
• Gas heat treatment (annealing).
3.2.1 Union Junction High Chrome Ball Processes
A brief process description of the High Chrome Ball Plant is listed below.
1. Trucks from Rolled Products deliver shredded scrap to a storage area;
2. Scrap is loaded into charge buckets using magnet cranes;
3. Ferrochrome and reverted high chromium product is conveyed into the charge bucket in the charge
preparation area;
4. Each of the three casting lines is supported by an electric heat treatment furnace for the melting process;
5. Once scrap has been melted, temperature and chemical sampling takes place;
6. When temperature and chemistry are correct, the furnace is tilted and the molten steel is tapped into a pre-
heated ladle;
7. The ladle is tipped into the holding furnace where an electric induction heater maintains the liquid metal at
the correct temperature for casting;
8. Chemical analysis at the beginning and end of each heat;
9. Moulds for sand casting are prepared using a Disamatic process;
10. Sand analysis conducted to ensure quality control;
11. A precise amount of molten metal exits the holding furnace through an outlet nozzle into a sand mould;
12. After casting, moulds are moved along a conveyor to ensure the metal solidifies before entering the shaker
drum;
13. The slow rotation of the shaker drum allows the cast metal and sand to separate;
14. The high rotational speed of the breaker drum separates the balls from the risers and other balls in the ‘ball
spray;
15. Individual balls are sorted from risers and double balls that have not separated;

Page | 18
16. Visual inspection and sorting screens aid quality control;
17. Balls are heat treated in one of five heat treatment furnaces each with individually controlled heating zones;
18. Quality control is conducted through process parameter control, visual inspections, radiography tests,
hardness tests, microscopic analysis and mini-mill impact testing;
19. Visual sorting of balls into classes after the balls have been milled for 16 hours;
20. Dispatch is mainly in the form of bulk, drums and bags; and
21. Trucks are weighed at a weigh bridge inside the plant before departing the facility.

Page | 19
13
Production Process Overview - HCBP
Shaker Drum Disamatic
High Chrome Casting Line (x3) Process Overview
Electric Arc
FurnaceLadle Holding Furnace Sand Plant
Scrap /
Ferrochrome Delivery
Breaker Drum Moulding
Storage / Delivery
Sand, Bentonite
and Coal Dust
Sorting Heat Treatment Quality Control
Scrap Charge Bucket
FIGURE 7: PROCESS DIAGRAM INDICATING STEPS UNDERTAKEN FOR THE CREATION OF THE HIGH CHROME BALLS

Page | 20
TABLE 7: EMISSION FACTORS FOR STEEL
Process PM10 SO2 NOx
Melting Operation
Electric Heat Treatment Furnace (kg/Mg) 6.5 0.009 0.1
Gas Fired Heat Treatment Furnace (kg/106m3) 121.6 9.6 2240
TABLE 8: CALCULATED EMISSION RATES FOR THE IDENTIFIED SOURCES.
Source Emission rate (g/s)
PM 10 SO2 NOx
Electric Heat Treatment Furnace 4.2307 0.0705 0.1506
Gas firing Heat Treatment Furnace 0.0009 0.002 9.0e-6
3.3 Impact Assessment
Dispersion modelling simulations were undertaken to determine the potential air quality impacts associated with
emissions from the High Chrome Ball Plant. Results are presented graphically as isopleth plots in the figures
below. Isopleth plots reflect gridded contours which represent zones of impact at various distances from the
contributing sources. The patterns generated by the contours are representative of the maximum predicted
ground level concentrations for the averaging period being represented. Where applicable, maximum hourly,
daily and annual average predicted ground level concentrations for PM10, SO2 and NO2, respectively, are
provided. Comparison with the relevant National ambient air quality standards is made to determine
compliance.
Two modelling scenarios were undertaken for this project to evaluate concentrations based on a) Electric heat
treatment Furnace to provide for current conditions per furnace and b) Gas fired heat treatment Furnace to
indicate the addition of the emissions
3.3.1 Installation of additional Electric Heat Treatment Furnace
The predicted emissions expected from Scenario A (Electric Heat Treatment Furnace) are provided in Table 9.
These results provide an indication of the maximum ground level concentrations, as a result of the addition of
an electric heat treatment furnace. The isopleths plots in Figure 8 and Figure 9 provide a graphic overview and
example for daily and annual average concentrations of Particulate Matter emissions dispersion expected from
the stack. South African Air Quality Standards are based on a fence line concentration, and not a maximum
concentration. Therefore Table 10 provides for the maximum fence line concentration, and is therefore directly
comparable to the Standards. Based on these result, no exceedances are noted at the site boundary.
TABLE 9: MAXIMUM PREDICTED FENCE LINE CONCENTRATIONS.
Pollutant Maximum Predicted Ground Level Concentration (µg/m3)
National Standard (µg/m3) Hourly Average Daily Average Annual Average
PM10 - 37.31 3.84 120 (24-hr)
50 (Annual)
SO2 245.30 62.78 6.44 350 (1-hr)
125 (24-hr)

Page | 21
Pollutant Maximum Predicted Ground Level Concentration (µg/m3)
National Standard (µg/m3) Hourly Average Daily Average Annual Average
50 (Annual)
NO2 51.16 - 1.37 200 (1-hr)
40 (Annual)
FIGURE 8: DAILY GROUND LEVEL PM10 CONCENTRATIONS (µG/M3) PLANT BOUNDARY (RED POLYGON).
FIGURE 9: ANNUAL GROUND LEVEL PM10 CONCENTRATIONS (µG/M3) PLANT BOUNDARY (THE RED POLYGON).
Page | 22
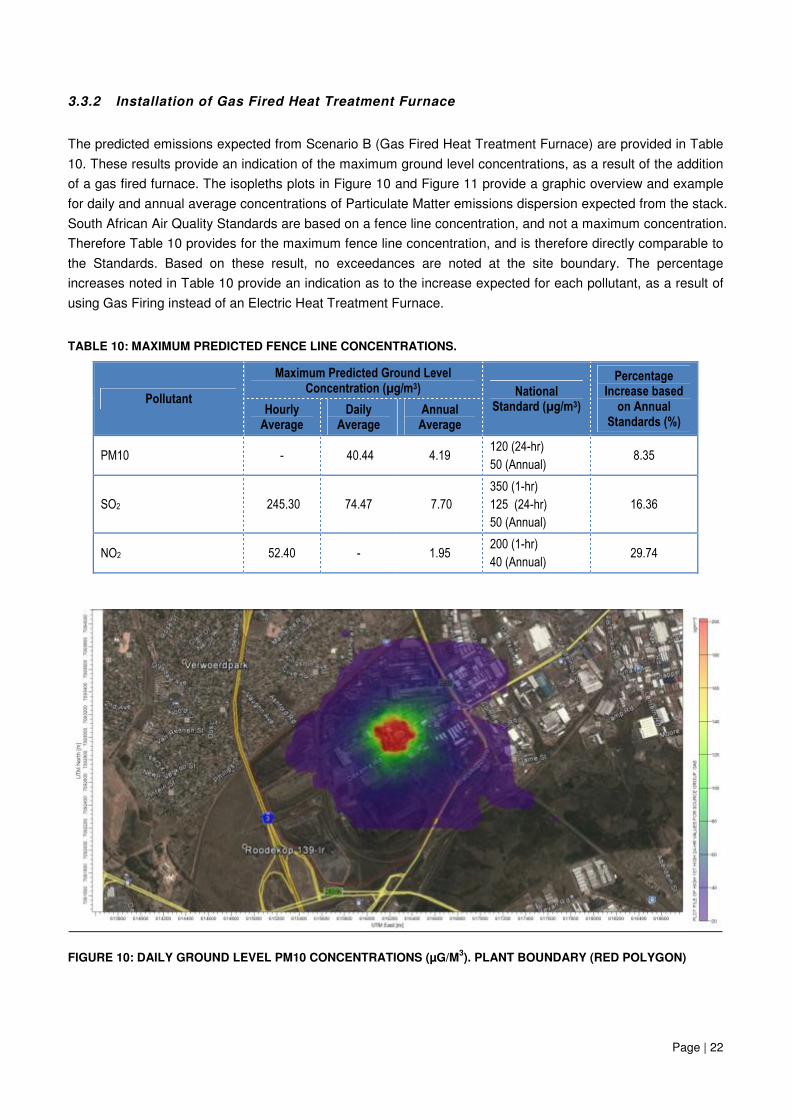
3.3.2 Installation of Gas Fired Heat Treatment Furnace
The predicted emissions expected from Scenario B (Gas Fired Heat Treatment Furnace) are provided in Table
10. These results provide an indication of the maximum ground level concentrations, as a result of the addition
of a gas fired furnace. The isopleths plots in Figure 10 and Figure 11 provide a graphic overview and example
for daily and annual average concentrations of Particulate Matter emissions dispersion expected from the stack.
South African Air Quality Standards are based on a fence line concentration, and not a maximum concentration.
Therefore Table 10 provides for the maximum fence line concentration, and is therefore directly comparable to
the Standards. Based on these result, no exceedances are noted at the site boundary. The percentage
increases noted in Table 10 provide an indication as to the increase expected for each pollutant, as a result of
using Gas Firing instead of an Electric Heat Treatment Furnace.
TABLE 10: MAXIMUM PREDICTED FENCE LINE CONCENTRATIONS.
Pollutant
Maximum Predicted Ground Level Concentration (µg/m3) National
Standard (µg/m3)
Percentage Increase based on Annual
Standards (%) Hourly Average
Daily Average
Annual Average
PM10 - 40.44 4.19 120 (24-hr)
50 (Annual) 8.35
SO2 245.30 74.47 7.70
350 (1-hr)
125 (24-hr)
50 (Annual)
16.36
NO2 52.40 - 1.95 200 (1-hr)
40 (Annual) 29.74
FIGURE 10: DAILY GROUND LEVEL PM10 CONCENTRATIONS (µG/M3). PLANT BOUNDARY (RED POLYGON)

Page | 23
FIGURE 11: ANNUAL GROUND LEVEL PM10 CONCENTRATIONS (µG/M3). PLANT BOUNDARY (RED POLYGON)

Page | 24
3.4 Assumptions and Limitations
Due to the unavailability of information required for the modelling studies, the following assumptions were made
as part of this assessment:
• Use was made of the USEPA AP-42 emission factors for Steel Plants and the FIRE Data System to
estimate emissions from the bag filters and wet scrubber due to the unavailability of isokinetic sampling
results;
• All NOx emissions were assumed to be NO2 and were modelled as NO2;
• Routine emissions were estimated and modelled. Atmospheric releases due to upset or abnormal
conditions were not accounted for;
• The impact of vehicle emissions was not included in the assessment as this was not identified to be a
major source at the High Chrome Ball Plant;
• The baseline air quality situation in the Germiston area was not assessed as part of this study. Generally,
the baseline air quality can be determined through available ambient air quality monitoring data and/or the
simulation of dispersion of air pollutants from surrounding sources. As this did not form part of the scope of
this investigation and no ambient air quality monitoring data was available, the predicted concentrations
were limited to incremental impacts from Union Junction. Given the location of Union Junction within an
industrial area, the baseline ambient air quality is likely to already be elevated;
• The cumulative impacts due to emissions from the current High Chrome Ball Plant operations and
surrounding sources were not included in this assessment. A detailed emissions inventory of all
surrounding emission sources would be required for this purpose. Given the complexity of such a study, the
financial implications and the limited availability of this information, only individual impacts from the High
Chrome Ball Plant were evaluated. Overall compliance would need to be assessed in terms of cumulative
impacts.

Page | 25
4 CONCLUSION AND RECOMMENDATIONS
The Air Quality Impact Assessment undertaken for Union Junction includes a meteorological overview of the
area. Local meteorological data was obtained from the South African Weather Services from O.R Tambo
International Airport. An emissions inventory of sources was undertaken with the aim of quantifying emissions
associated with the current plant activities. Use was made of the emission factors from the USEPA Compilation
of Air Pollution Factors (AP-42). Dispersion modelling simulations were then undertaken using AERMOD to
evaluate PM10, SO2 and NO2 concentrations for quantifiable sources.
Based on the dispersion modelling simulations, the main conclusions can be summarised as follows:
PM10: Predicted ground level concentrations fall well below the average standards.
SO2: Predicted ground level concentrations fall well below the average standards.
NO2: Predicted ground level concentrations fall well below average standards.
Based on the increased emissions generated as a result of the inclusion of gas firing, these additions do not
increase the cumulative impacts from the site, to the point where exceedances are noted. Scaw Metals have
indicated that they have a preference for gas firing, to reduce demand on the national electricity grid, and
based on this study, the increased emission noted are not such that the gas firing needs to be ruled out.
4.1 Recommendations
• HCBP will need to comply with the conditions that will be set by the Municipal Council for Air Emissions and
conditions of the AEL/APPA certificate applicable at the time.

Page | 26
5 REFERENCES
1. Cachier, H., Liousse, C., Buat-Menard, P. and Gaudichet, A. 1995. Particulate content of savanna fire
emissions. J. Atmos. Chem., 22(1-2), 123-148.
2. CEPA/FPAC Working Group, 1999. National Ambient Air Quality Objectives For Particulate Matter. Part
1: Science Assessment Document. Minister, Public Works and Government Services, Ontario. Available
at URL: http://www.hc-sc.gc.ca/bch.
3. Ezzati, M. and D.M. Kammen, 2002. Environmental Health Perspective. The health impacts of exposure
to indoor air pollution from solid fuels in developing countries: Knowledge, Gaps and data needs. Risk
Resource and Environmental Management Divisions, Resources for the future, Washington DC, USA,
Energy and Resources Group and Goldman School of Public Policy, University of California, Berkley
California, USA.
4. Kupchella, C.E. and M.C. Hyland, 1993. Environmental Science. Living Within the System of Nature.
Prentice Hall, New Jersey.
5. Tyson, P.D. and R.A. Preston-Whyte, 2000. The Weather and Climate of Southern Africa. Oxford
University Press, Cape Town.
6. U.S Environmental Protection Agency, (1996). Compilation of Air Pollution Emission Factors (AP-42),
6th Edition, Volume 1, as contained in the AirCHIEF (AIR Clearinghouse for Inventories and Emission
Factors) CD-ROM (compact disk read only memory), US Environmental Protection Agency, Research
Triangle Park, North Carolina. Also available at URL: http://www.epa.gov/ttn/chief/ap42/.

Page | 27
6 GLOSSARY
Air quality A measure of exposure to air which is not harmful to
your health. Air quality is measured against health
risk thresholds (levels) which are designed to protect
ambient air quality. Various countries including South
Africa have Air Quality Standards (legally binding
health risk thresholds) which aim to protect human
health due to exposure to pollutants within the living
space.
Ambient air The air of the surrounding environment.
Baseline The current and existing condition before any
development or action.
Boundary layer The layer directly influenced by a surface.
Climatology The study of the long term effect of weather over a
certain area during a certain period.
Concentration When a pollutant is measured in ambient air it is
referred to as the concentration of that pollutant in air.
Pollutant concentrations are measured in ambient air
for various reasons, i.e. to determine whether
concentrations are exceeding available health risk
thresholds (air quality standards); to determine how
different sources of pollution contribute to ambient air
concentrations in an area; to validate dispersion
modelling conducted for an area; to determine how
pollutant concentrations fluctuate over time in an area;
and to determine the areas with the highest pollution
concentrations.
Dispersion model A mathematical model which can be used to assess
pollutant concentrations and deposition rates from a
wide variety of sources. Various dispersion modelling
computer programs have been developed.
Dispersion potential The potential a pollutant has of being transported from
the source of emission by wind or upward diffusion.
Dispersion potential is determined by wind velocity,
wind direction, height of the mixing layer, atmospheric
stability, presence of inversion layers and various
other meteorological conditions.
Emission The rate at which a pollutant is emitted from a source
of pollution.
Emission factor A representative value, relating the quantity of a
pollutant to a specific activity resulting in the release
of the pollutant to atmosphere.
Evaporation The opposite of condensation.
Front A synoptic-scale swath of cloud and precipitation
associated with a significant horizontal zonal
temperature gradient. A front is warm when warm air

Page | 28
replaces cold on the passage of the front; with a cold
front cold air replaces warm air.
Fugitive dust Dust generated from an open source and is not
discharged to the atmosphere in a confined flow
stream.
High pressure cells Regions of raised atmospheric pressure.
Inversion An increase of atmospheric temperature with an
increase in height.
Mixing layer The layer of air within which pollutants are mixed by
turbulence. Mixing depth is the height of this layer
from the earth’s surface.
Particulate matter (PM) The collective name for fine solid or liquid particles
added to the atmosphere by processes at the earth's
surface and includes dust, smoke, soot, pollen and
soil particles. Particulate matter is classified as a
criteria pollutant, thus national air quality standards
have been developed in order to protect the public
from exposure to the inhalable fractions. PM can be
principally characterised as discrete particles
spanning several orders of magnitude in size, with
inhalable particles falling into the following general
size fractions:
• PM10 (generally defined as all particles equal to
and less than 10 microns in aerodynamic
diameter; particles larger than this are not
generally deposited in the lung);
• PM2.5, also known as fine fraction particles
(generally defined as those particles with an
aerodynamic diameter of 2.5 microns or less) ;
• PM10-2.5, also known as coarse fraction particles
(generally defined as those particles with an
aerodynamic diameter greater than 2.5 microns,
but equal to or less than a nominal 10 microns);
and
• Ultra fine particles generally defined as those less
than 0.1 microns.
PM10 Refers to particulate matter that is 10µm or less in
diameter. PM10 is generally subdivided into a fine
fraction of particles 2.5µm or less (PM2.5), and a
coarse fraction of particles larger than 2.5µm.
Particles less than 10µm in diameter are also termed
inhalable particulates.
Precipitation Ice particles or water droplets large enough to fall at
least 100 m below the cloud base before evaporating.
Relative Humidity - The vapour content of the air as a percentage of the
vapour content needed to saturate air at the same
temperature.

Page | 29
Total suspended particulates (TSP) All particulates which can become suspended and
generally noted to be less than 75µm in diameter
(TSP).