analysis of faculty salaries at historically black ... · historically black colleges and...
TRANSCRIPT

Analysis of Faculty Salaries at Analysis of Faculty Salaries at Historically Black Colleges and Historically Black Colleges and
UniversitiesUniversities
Sri SitharamanSri SitharamanSri SitharamanSri SitharamanClaflin UniversityClaflin University
AIR 2009AIR 2009

AcknowledgementAcknowledgement
This material is based upon work supported This material is based upon work supported by the Association for Institutional by the Association for Institutional Research, the Institute of Education Research, the Institute of Education Research, the Institute of Education Research, the Institute of Education SciencesSciences--National Center for Education National Center for Education Statistics, and the National Science Statistics, and the National Science Foundation under Association for Foundation under Association for Institutional Research Grant Number: DFInstitutional Research Grant Number: DF--0808--407.407.

AgendaAgenda
�� BackgroundBackground�� SignificanceSignificance�� Research QuestionsResearch QuestionsMethodologyMethodology�� MethodologyMethodology
�� ResultsResults�� ImplicationsImplications�� Questions?Questions?

BackgroundBackground
�� Personal experiencePersonal experience
�� LiteratureLiterature�� LiteratureLiteratureEvans, Evans, and Evans (2002)Evans, Evans, and Evans (2002)Vital Signs (2002)Vital Signs (2002)NCES (2004)NCES (2004)BlinderBlinder--Oaxaca (1973)Oaxaca (1973)

SignificanceSignificance1) National Opinion Research Center (2006) 1) National Opinion Research Center (2006)
3.6% or 1,659 received a doctorate degree3.6% or 1,659 received a doctorate degree606 earned doctorate in education606 earned doctorate in educationMany work for KMany work for K--1212
2) Betsey (2007)2) Betsey (2007)HBCU faculty are olderHBCU faculty are olderHBCU faculty are olderHBCU faculty are olderIf faculty interested in teaching at HBCUs are If faculty interested in teaching at HBCUs are not produced, or if such faculty are not not produced, or if such faculty are not retained, a shortage of African American retained, a shortage of African American faculty was imminent. This could affect the faculty was imminent. This could affect the fate of HBCUs and the students interested in fate of HBCUs and the students interested in attending such institutions. attending such institutions.

Research questionsResearch questions
�� R1R1-- To what extent do characteristics of faculty To what extent do characteristics of faculty at HBCUs differ from characteristics of faculty at at HBCUs differ from characteristics of faculty at nonnon--HBCUsHBCUs
�� R2 R2 -- To what extent do the salaries of faculty at To what extent do the salaries of faculty at HBCUs and nonHBCUs and non--HBCUs differ with respect to the HBCUs differ with respect to the HBCUs and nonHBCUs and non--HBCUs differ with respect to the HBCUs differ with respect to the education, employment, demographics, education, employment, demographics, productivity, and institution variables? productivity, and institution variables?
�� R3 R3 -- To what extent does the BlinderTo what extent does the Blinder--Oaxaca Oaxaca wage decomposition model explain thewage decomposition model explain the salary salary differential between faculty at HBCUs and nondifferential between faculty at HBCUs and non--HBCUs?HBCUs?

Data sources and variablesData sources and variables
�� National Study Of Postsecondary Faculty National Study Of Postsecondary Faculty (NSOPF: 2004)(NSOPF: 2004)
�� Integrated Postsecondary Education Data Integrated Postsecondary Education Data System (IPEDS)System (IPEDS)Integrated Postsecondary Education Data Integrated Postsecondary Education Data System (IPEDS)System (IPEDS)
�� Dependent variable Dependent variable –– natural log salarynatural log salary�� Independent variables Independent variables –– education, education, employment, demographics, productivity, employment, demographics, productivity, and institutionand institution

Education variablesEducation variables
�� highest degree earned highest degree earned �� Carnegie classification of the institution Carnegie classification of the institution where highest degree was earned where highest degree was earned where highest degree was earned where highest degree was earned
�� years since receiving highest degree years since receiving highest degree

Employment variablesEmployment variables
�� years since began first faculty or years since began first faculty or instructional staff jobinstructional staff job
�� first postsecondary job first postsecondary job �� first postsecondary job first postsecondary job �� principal activity principal activity �� years held current job years held current job �� job rank job rank

Employment variables (continued)Employment variables (continued)
�� years since rank achieved years since rank achieved �� union status union status �� tenure status tenure status �� tenure status tenure status �� contract length contract length �� teaching or research fieldteaching or research field

Demographics variablesDemographics variables
�� gender gender �� ethnicityethnicity�� citizenship statuscitizenship status�� citizenship statuscitizenship status�� age age

Productivity variablesProductivity variables
�� percent time spent on undergraduate percent time spent on undergraduate instruction instruction
�� percent time spent on graduate/first percent time spent on graduate/first professional instruction professional instruction professional instruction professional instruction
�� percent time spent on research activitiespercent time spent on research activities�� funded scholarly activity funded scholarly activity

Productivity variables (continued)Productivity variables (continued)
�� career articles in refereed journals career articles in refereed journals �� career articles in non refereed journals career articles in non refereed journals �� career book reviews/chapter/creative career book reviews/chapter/creative works works works works
�� career books/textbooks/reports career books/textbooks/reports �� career presentations career presentations �� career exhibitions/performances career exhibitions/performances �� career patents/computer software career patents/computer software

Productivity variables (continued)Productivity variables (continued)
�� recent articles in refereed journals recent articles in refereed journals �� recent articles in non refereed journals recent articles in non refereed journals �� recent book reviews/chapter/creative recent book reviews/chapter/creative works works
�� recent book reviews/chapter/creative recent book reviews/chapter/creative works works
�� recent books/textbooks/reports recent books/textbooks/reports �� recent presentations recent presentations �� recent exhibitions/performances recent exhibitions/performances �� recent patents/computer softwarerecent patents/computer software

Institution variablesInstitution variables
�� Carnegie classification Carnegie classification �� region where located region where located �� institution control institution control �� endowment per student endowment per student percentage of students receiving any financial percentage of students receiving any financial �� percentage of students receiving any financial percentage of students receiving any financial aid aid
�� percentage of students receiving institutional percentage of students receiving institutional grant grant
�� average amount of institutional grantaverage amount of institutional grant�� debt ratio. debt ratio.

DelimitationsDelimitations�� Institution was a four year institutionInstitution was a four year institution�� Faculty with instructional dutiesFaculty with instructional duties�� Faculty had faculty statusFaculty had faculty status�� Faculty were employed full timeFaculty were employed full time�� Principal activity was teaching, research, or Principal activity was teaching, research, or
administrationadministrationContract length was 9/10 month contract or 11/12 Contract length was 9/10 month contract or 11/12 �� Contract length was 9/10 month contract or 11/12 Contract length was 9/10 month contract or 11/12 monthmonth
�� Rank was Professor, Associate Professor, or Assistant Rank was Professor, Associate Professor, or Assistant ProfessorProfessor
�� Highest degree earned was doctorate, first Highest degree earned was doctorate, first professional, or mastersprofessional, or masters
�� Minimum and maximum salary was $10,000 and Minimum and maximum salary was $10,000 and $200,000 to eliminate outliers.$200,000 to eliminate outliers.

Sample sizeSample size
�� 30 HBCUs (rounded to nearest tenth)30 HBCUs (rounded to nearest tenth)
�� 12,050 HBCU faculty (weighted)12,050 HBCU faculty (weighted)
�� 580 non580 non--HBCUs (rounded to nearest HBCUs (rounded to nearest tenth)tenth)
�� 351,250 non351,250 non--HBCU faculty (weighted)HBCU faculty (weighted)

Regression equationRegression equation
Ln (Ŵ) = βLn (Ŵ) = β00 + β+ β11 X1 + βX1 + β22 X2 + …+ βX2 + …+ βj j XjXj
where (Ŵ) is wages, βwhere (Ŵ) is wages, β00 is the intercept, βis the intercept, βjj isiswhere (Ŵ) is wages, βwhere (Ŵ) is wages, β00 is the intercept, βis the intercept, βjj isisthe coefficient of the jthe coefficient of the jthth variable, and Xvariable, and Xjj is is the mean of the jthe mean of the jthth variable variable

Dummy variable codingDummy variable coding
Highest degreeHighest degree�� First Professional degreeFirst Professional degree
A dummy variable indicating First A dummy variable indicating First Professional degree (1=yes, 0= no)Professional degree (1=yes, 0= no)Professional degree (1=yes, 0= no)Professional degree (1=yes, 0= no)
�� Masters degree Masters degree A dummy variable indicating Masters A dummy variable indicating Masters degree (1=yes, 0= no)degree (1=yes, 0= no)
�� Doctorate degree is the reference Doctorate degree is the reference categorycategory

Decomposition with nonDecomposition with non--HBCU HBCU faculty salary structure as standardfaculty salary structure as standard
Ln (ŴLn (Ŵnonnon--HBCUHBCU) ) –– Ln (ŴLn (ŴHBCUHBCU) =) =[(X[(Xijij nonnon--HBCUHBCU -- XXijij HBCUHBCU) β) βijij nonnon--HBCUHBCU] + ] + [(β[(β nonnon--HBCUHBCU -- ββ HBCUHBCU) + ) + [(β[(β00nonnon--HBCUHBCU -- ββ00HBCUHBCU) + ) + (β(βijijnonnon--HBCUHBCU -- ββijij HBCUHBCU) X) Xijij HBCUHBCU] ]
XXij ij –– mean of the characteristicsmean of the characteristicsββij ij –– regression coefficientsregression coefficients

Average Salaries Average Salaries
The average salary of faculty at HBCUs wasThe average salary of faculty at HBCUs was$62,982 and the average salary of faculty $62,982 and the average salary of faculty at nonat non--HBCUs was $73,705, a difference of HBCUs was $73,705, a difference of at nonat non--HBCUs was $73,705, a difference of HBCUs was $73,705, a difference of about 17%. about 17%.

Table 1: Highest degree earnedTable 1: Highest degree earned
Highest Highest degree earneddegree earned
Percent Percent HBCUHBCU
Percent Percent nonnon--HBCUHBCU
DoctorateDoctorate 85.685.6 84.684.6
First First ProfessionalProfessional
2.02.0 5.55.5
MastersMasters 12.412.4 9.99.9

Table 2: Highest degree earned Table 2: Highest degree earned institutioninstitution
Highest degree Highest degree earned earned institutioninstitution
Percent Percent HBCUHBCU
Percent Percent nonnon--HBCUHBCU
Research I Research I 51.951.9 65.165.1Research I Research I institutioninstitution
51.951.9 65.165.1
Research II Research II institutioninstitution
10.710.7 10.110.1
Other institutionOther institution 29.429.4 17.717.7

Table 3: Principal activityTable 3: Principal activity
Principal Principal activityactivity
Percent Percent HBCUHBCU
Percent Percent nonnon--HBCUHBCU
TeachingTeaching 82.782.7 67.967.9TeachingTeaching 82.782.7 67.967.9
ResearchResearch 3.13.1 21.021.0
AdministrationAdministration 14.214.2 11.111.1

Table 4: Rank statusTable 4: Rank status
Rank statusRank status Percent Percent HBCUHBCU
Percent Percent nonnon--HBCUHBCU
ProfessorProfessor 25.525.5 39.239.2
Associate Associate ProfessorProfessor
43.343.3 29.029.0
Assistant Assistant ProfessorProfessor
31.231.2 31.831.8

Table 5: Tenure statusTable 5: Tenure status
Tenure statusTenure status Percent Percent HBCUHBCU
Percent Percent nonnon--HBCUHBCU
TenuredTenured 56.056.0 60.860.8
On tenure trackOn tenure track 33.433.4 27.227.2
Not on tenure trackNot on tenure track 7.67.6 9.59.5
Not tenured/No Not tenured/No tenure systemtenure system
3.03.0 2.52.5

Table 6: GenderTable 6: Gender
GenderGender Percent Percent HBCUHBCU
Percent Percent nonnon--HBCUHBCU
MaleMale 64.564.5 68.368.3MaleMale 64.564.5 68.368.3
FemaleFemale 35.535.5 31.731.7
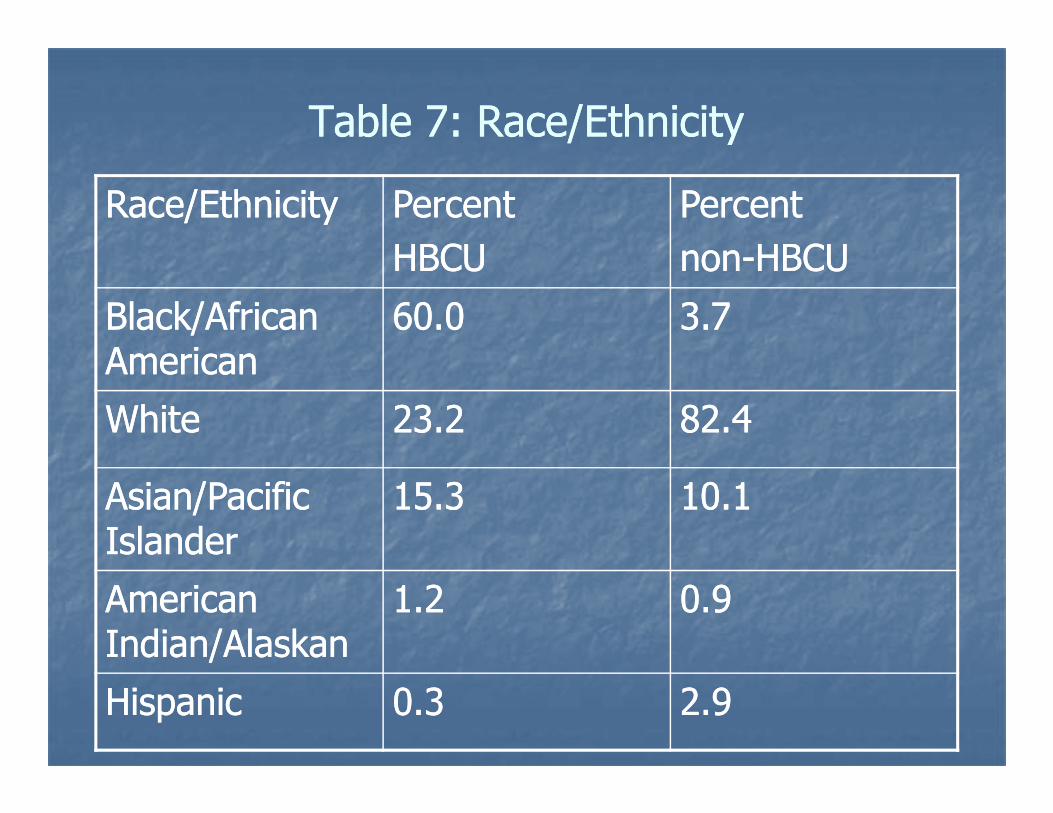
Table 7: Race/EthnicityTable 7: Race/Ethnicity
Race/EthnicityRace/Ethnicity Percent Percent HBCUHBCU
Percent Percent nonnon--HBCUHBCU
Black/African Black/African AmericanAmerican
60.060.0 3.73.7
WhiteWhite 23.223.2 82.482.4WhiteWhite 23.223.2 82.482.4
Asian/Pacific Asian/Pacific IslanderIslander
15.315.3 10.110.1
American American Indian/AlaskanIndian/Alaskan
1.21.2 0.90.9
HispanicHispanic 0.30.3 2.92.9
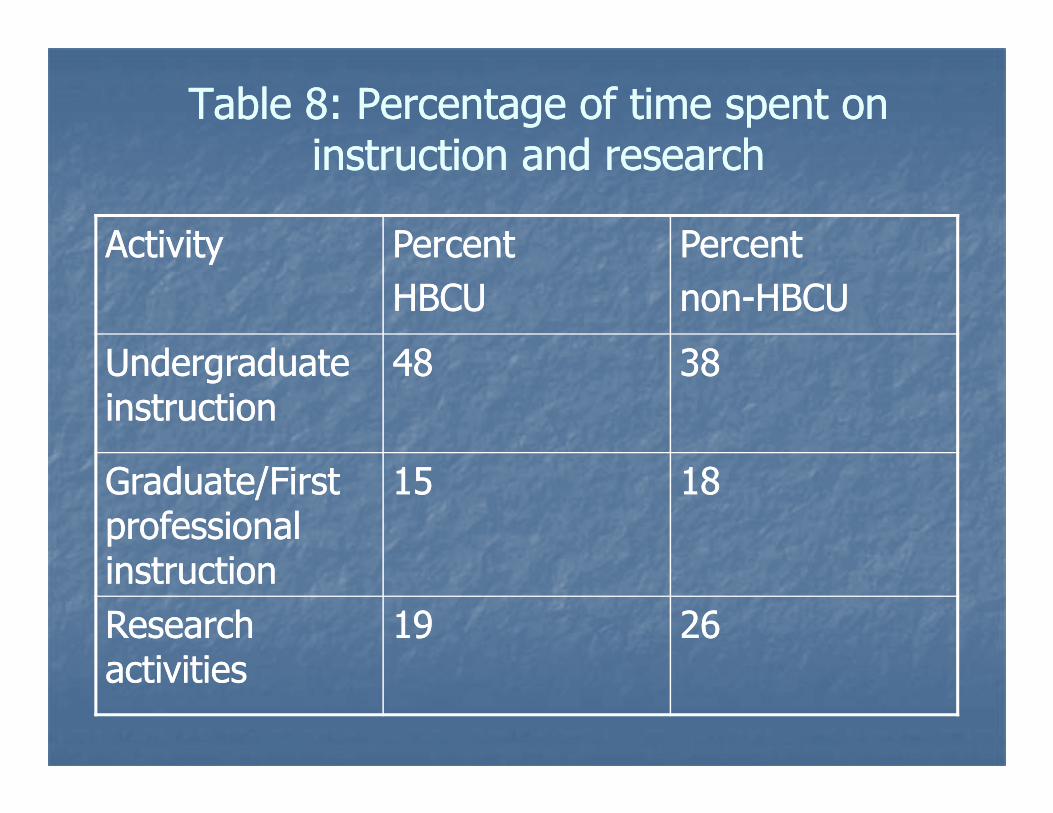
Table 8: Percentage of time spent on Table 8: Percentage of time spent on instruction and researchinstruction and research
ActivityActivity Percent Percent HBCUHBCU
Percent Percent nonnon--HBCUHBCU
Undergraduate Undergraduate instructioninstruction
4848 3838instructioninstruction
Graduate/First Graduate/First professional professional instructioninstruction
1515 1818
Research Research activitiesactivities
1919 2626

Table 9: Scholarly activities Table 9: Scholarly activities --CareerCareer
Scholarly Scholarly activitiesactivities
HBCU HBCU meanmean
nonnon--HBCUHBCUmeanmean
Career articles in Career articles in refereed journalsrefereed journals
1111 2424refereed journalsrefereed journals
Career book Career book reviews/chaptersreviews/chapters/creative works/creative works
33 66
Career Career presentationspresentations
2525 4343

Table 10: Scholarly activities Table 10: Scholarly activities -- RecentRecent
Scholarly activitiesScholarly activities HBCU HBCU meanmean
nonnon--HBCUHBCUmeanmean
Recent articles in Recent articles in 22 33Recent articles in Recent articles in refereed journalsrefereed journals
22 33
Recent book Recent book reviews/chapters/creatireviews/chapters/creative worksve works
0.60.6 11
Recent presentationsRecent presentations 44 55

Table 11: Carnegie classificationTable 11: Carnegie classification
Carnegie Carnegie classificationclassification
Percent Percent HBCUHBCU
Percent Percent nonnon--HBCUHBCU
Doctoral Doctoral institutioninstitution
22.722.7 61.261.2institutioninstitution
Masters Masters institutioninstitution
50.850.8 28.328.3
Baccalaureate Baccalaureate institutioninstitution
26.526.5 10.510.5

Table 12: Finance dataTable 12: Finance data
VariableVariable HBCUHBCU nonnon--HBCUHBCU
Debt ratioDebt ratio 0.350.35 0.340.34
Endowment/student Endowment/student ($)($)
7,1747,174 46,25946,259($)($)
Pct. With financial aid Pct. With financial aid (%)(%)
8484 7777
Avg. amt. of Avg. amt. of institutional grant ($)institutional grant ($)
3,8773,877 6,1046,104

Table 13: Regression coefficients Table 13: Regression coefficients -- Highest degree Highest degree earned and Highest degree earned from institutionearned and Highest degree earned from institution
VariableVariable HBCUHBCU nonnon--HBCUHBCUHighest degree Highest degree --First professional First professional aa 0.4240.424 0.1730.173
Highest degree Highest degree institution institution –– Research II Research II bb 0.1150.115 --0.0190.019
Reference categoryReference categorya a –– Doctorate degreeDoctorate degreeb b –– Research I institution Research I institution

Table 14: Regression coefficients Table 14: Regression coefficients ––
First postsecondary job, Principal activityFirst postsecondary job, Principal activity
VariableVariable HBCUHBCU nonnon--HBCUHBCU
First postsecondary job First postsecondary job c c 0.1090.109 0.00220.0022
Principal activity Principal activity –– Research Research d d 0.1110.111 0.0340.034
Reference categoryReference category
c c -- Not first postsecondary jobNot first postsecondary job
d d -- TeachingTeaching

Table 15: Regression coefficients Table 15: Regression coefficients –– Rank, Rank, Union status, Tenure statusUnion status, Tenure status
VariableVariable HBCUHBCU nonnon--HBCUHBCUProfessor Professor e e 0.1930.193 0.1480.148
Union member Union member f f --0.0580.058 0.0130.013
On tenure track On tenure track g g 0.0820.082 --0.0270.027
Reference categoryReference categoryee-- Associate ProfessorAssociate Professorf f –– Not a union memberNot a union memberg g -- TenuredTenured

Table 16: Regression coefficients Table 16: Regression coefficients ––
Teaching load, Scholarly activityTeaching load, Scholarly activity
VariableVariable HBCUHBCU nonnon--HBCUHBCUPercent time spent onPercent time spent onundergraduate educationundergraduate education --0.00200.0020 --0.00280.0028
Percent time spent onPercent time spent onPercent time spent onPercent time spent onresearch activitiesresearch activities --0.00600.0060 --0.00080.0008
Funded scholarly activity Funded scholarly activity h h 0.0590.059 0.041 0.041
Reference categoryReference categoryScholarly activity not fundedScholarly activity not funded
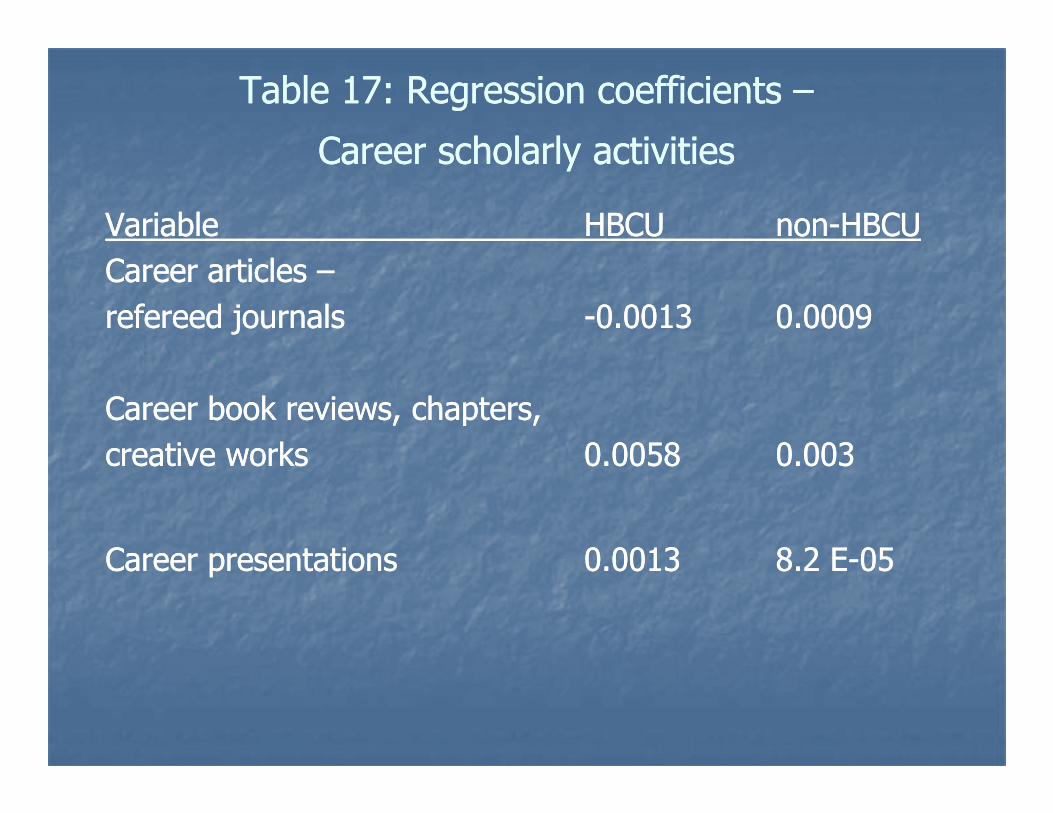
Table 17: Regression coefficients Table 17: Regression coefficients ––
Career scholarly activitiesCareer scholarly activities
VariableVariable HBCUHBCU nonnon--HBCUHBCUCareer articles Career articles ––refereed journalsrefereed journals --0.00130.0013 0.00090.0009
Career book reviews, chapters,Career book reviews, chapters,Career book reviews, chapters,Career book reviews, chapters,creative works creative works 0.00580.0058 0.0030.003
Career presentationsCareer presentations 0.00130.0013 8.2 E8.2 E--0505

Table 18: Regression coefficients Table 18: Regression coefficients ––Recent scholarly activitiesRecent scholarly activities
VariableVariable HBCUHBCU nonnon--HBCUHBCURecent articles Recent articles ––refereed journalsrefereed journals 0.0160.016 0.00010.0001
Recent book reviews, chapters,Recent book reviews, chapters,creative works creative works --0.0540.054 --0.0090.009
Recent presentationsRecent presentations 2.2 E2.2 E--0505 0.0020.002

Table 19: Regression coefficients Table 19: Regression coefficients ––Carnegie classification, Institution controlCarnegie classification, Institution control
VariableVariable HBCUHBCU nonnon--HBCUHBCU
Carnegie doctoral Carnegie doctoral ii --0.1390.139 0.0460.046
Private notPrivate not--forfor--profit profit j j --0.1220.122 --0.0420.042
Reference categoryReference categoryi i –– Carnegie mastersCarnegie mastersj j –– Public institutionPublic institution

Table 20: Regression coefficients Table 20: Regression coefficients ––Finance variablesFinance variables
VariableVariable HBCUHBCU nonnon--HBCUHBCU
Endowment/studentEndowment/student 2.0 E2.0 E--0606 1.0 E1.0 E--0707
Percent with any financial aidPercent with any financial aid 0.0020.002 --0.00080.0008Percent with any financial aidPercent with any financial aid 0.0020.002 --0.00080.0008
Average amount of Average amount of institutional grantinstitutional grant 2.1 E2.1 E--0505 1.0 E1.0 E--0505

Decomposition with nonDecomposition with non--HBCU HBCU faculty salary structure as standardfaculty salary structure as standard
�� Percentage of time spent on Percentage of time spent on undergraduate instruction undergraduate instruction 22%22%�� Carnegie classificationCarnegie classification 21%21%�� Carnegie classificationCarnegie classification 21%21%�� Average amount of institutionalAverage amount of institutionalgrant aidgrant aid 18%18%�� Faculty rankFaculty rank 16%16%

Decomposition with nonDecomposition with non--HBCU HBCU faculty salary structure as standardfaculty salary structure as standard
Education, employment, productivity, and Education, employment, productivity, and institution variables explained 8%, 15%, institution variables explained 8%, 15%, 29%, and 35% of the salary gap. The 29%, and 35% of the salary gap. The 29%, and 35% of the salary gap. The 29%, and 35% of the salary gap. The demographics variables worked to lower thedemographics variables worked to lower thesalary gap by 6%. salary gap by 6%.

Decomposition with HBCU faculty Decomposition with HBCU faculty salary structure as standardsalary structure as standard
�� Endowment/studentEndowment/student 64%64%�� Faculty rankFaculty rank 21%21%�� Percentage of time spent on Percentage of time spent on �� Percentage of time spent on Percentage of time spent on undergraduate instruction undergraduate instruction 16%16%�� Principal activityPrincipal activity 15%15%

Decomposition with HBCU faculty Decomposition with HBCU faculty salary structure as standardsalary structure as standard
Education, employment, and institution Education, employment, and institution variables explained 14%, 31%, and 54% ofvariables explained 14%, 31%, and 54% ofthe salary gap. The demographic and the salary gap. The demographic and the salary gap. The demographic and the salary gap. The demographic and productivity variables worked to lower the productivity variables worked to lower the salary gap by 18% and 7%. salary gap by 18% and 7%.

ImplicationsImplications
�� Mission creepMission creep�� Impact on student learningImpact on student learning�� Value added modelValue added model�� Tenure rate & turnover rateTenure rate & turnover rate�� Tenure rate & turnover rateTenure rate & turnover rate�� With only masters and baccalaureate With only masters and baccalaureate institutions, the average faculty salary of institutions, the average faculty salary of $62,187 at HBCUs was about 5% higher $62,187 at HBCUs was about 5% higher than the average faculty salary of $59,428 than the average faculty salary of $59,428 at nonat non--HBCUs. HBCUs.
