analysis of relative humidity sensors at the wmo...
TRANSCRIPT

664 JOURNAL OF ATMOSPHERIC AND OCEANIC TECHNOLOGY VOLUME22
Analysis of Relative Humidity Sensors at the WMO Radiosonde IntercomparisonExperiment in Brazil
Luiz F. SAPUCCI
Departamento de Cartografia da Faculdade de Ciencias e Tecnologia da Universidade Estadual Paulista, Presidente Prudente,Sdo Paolo, Brazil
Luiz A. T. MACHADO
Divisdo de SatWlites e Sistemas Ambientais, Centro de Previsdo de Tempo e Estudos Climciticos, Instituto Nacional de PesquisasEspaciais, Cachoeira Paulista, Sdlo Paolo, Brazil
REINALDO B. DA SILVEIRA
Coordenaqdo-Geral de Modelagem Num6rica de Tempo, Instituto Nacional de Meteorologia, Brasilia, Distrito Federal, Brazil
GILBERTO FISCH
Divisao de Ciencias Atmosf6ricas, Instituto de Aeroniutica e Espaqo, Centro T&nico Aeroespacial, Sdlo Jose dos Campos,Sdo Paolo, Brazil
JoAo F. G. MONICO
Departamento de Cartografia da Faculdade de Ci6ncias e Tecnologia da Universidade Estadual Paulista, Presidente Prudente,Sdo Paolo, Brazil
(Manuscript received 17 April 2004, in final form 28 December 2004)
ABSTRACT
The quality of the vertical distribution measurements of humidity in the atmosphere is very important inmeteorology due to the crucial role that water vapor plays in the earth's energy budget. The radiosonde isthe humidity measurement device that provides the best vertical resolution. Also, radiosondes are theoperational devices that are used to measure the vertical profile of atmospheric water vapor. The WorldMeteorological Organization (WMO) has carried out several intercomparison experiments at differentclimatic zones in order to identify the differences between the available commercial sensors. This articlepresents the results of an experiment that was carried out in Brazil in 2001 in which major commercialradiosonde manufacturers [e.g., Graw Radiosondes GmbH & Co., KG (Germany); MODEM (France);InterMet Systems (United States): Sippican, Inc. (United States); and Vaisala (Finland)] were involved.One of the main goals of this experiment was to evaluate the performance of the different humidity sensorsin a tropical region. This evaluation was performed for different atmospheric layers and distinct periods ofthe day. It also considers the computation of the integrated water vapor (IWV). The results showed that thehumidity measurements achieved by the different sensors were quite similar in the low troposphere (thebias median value regarding the RS80 was around 1.8%) and were quite dispersed in the superior layers (themedian rms regarding the RS80 was around 14.9%).
Corresponding author address: Dr. Luiz Fernando Sapucci, Universidade Estadual Pavlista, Departamento de Cartografia da Fac-uldade de Ciýncias e Tecnologia da Universidade, Estadual Paulista, Presidente Prudente, CEP 19060-900, SP Brazil.E-mail: [email protected]
© 2005 American Meteorological Society

SAPUCCI ET AL.
1. Introduction
Outside the Tropics the primary source of energy forsynoptic disturbance is associated with the large latitu-dinal temperature gradient. In the Tropics, as a result ofa very small temperature gradient, the primary sourceof energy is the latent heat released in association withconvective clouds that are organized in mesoscale sys-tems (Holton 1992), as a result of intense convectiveprocesses causing considerable space-time variability inthe humidity fields. The high concentration and vari-ability of water vapor in the tropical atmosphere makethe quality of the humidity measurement of special im-portance to climatic change studies and weather fore-casts. The atmospheric water vapor plays an importantrole in the atmosphere's general circulation, the hydro-logic cycle, and the formation of clouds.
Although there are several techniques for measuringthe profile of atmospheric humidity, the radiosonde isone that gets the measurements directly, unlike otherremote sensing-based techniques. The intercomparisonexperiments among several radiosondes from differentmanufacturers have allowed the potential of this instru-ment to be verified. On a worldwide level, radiosondesare operational devices that are used to measure theatmospheric water vapor's vertical profile. Globallythere are 900 operational radiosonde stations, and ap-proximately 51% use a radiosonde manufactured byVaisala Oyj, 10% by Sippican/VIZ, 10% by Shang,19% by Mars/MRZ, and 10% by other manufacturers(Wang et al. 2003b). Several intercomparison experi-ments on different radiosonde manufacturers were car-ried out to evaluate the humidity measurement qualityof the different sensors in temperate regions (Ivanov etal. 1991; Yagi et al. 1996; Schimidlin 2005).
During September 1995, a radiosonde intercompari-son experiment was performed in Virginia, where themain radiosonde manufacturers were involved (Schim-idlin 2005). To ensure improvements in the productionand better performance in the usage, recommendationswere suggested to the manufacturers and users. Theresults showed the importance of intercomparison ex-periments to the improvement of that humidity mea-surement technique. Experiments with intensive watervapor observation periods in 1996 and 1997, and involv-ing several relative humidity (RH) measurement tech-niques, were carried out as part of the AtmosphericRadiation Measurement (ARM) Program (Revercombet al. 2003). The main goal of these experiments was tocharacterize and improve the accuracy of the water va-por measurements. The ARM Program's experimentsused radiosondes together with an operational Ramanlidar, a dual-channel microwave radiometer, multiple
surface-based and tower-based in situ measurements,solar and infrared radiometers and spectrometers, anda two-frequency global positioning system (GPS) re-ceiver to provide absolute water vapor measurements.The results showed a significant variability in theVaisala RS80H radiosonde measurements of the samecalibration batches. An altitude-independent scale fac-tor in the low troposphere can be used to reduce thisvariability by a factor of approximately 2 (Turner et al.2003). The RS80 radiosonde data were the object ofseveral studies, aiming to evaluate the need for correc-tions in their results because of the contamination ofthe capacitive-element humidity sensor by chemicalsubstances (Miller et al. 1999; Guichard et al. 2000;Miloshevich et al. 2001; Wang et al. 2002). Other re-searches sought to evaluate the humidity sensor perfor-mance of RS80, after applying corrections in their re-sults, as well as the accuracy and performance of theVaisala RS90 radiosonde during operational use (Pauk-kunen et al. 2001; Wang et al. 2001). Moreover, theRS80 was compared against the "Snow White" (here-after "SW") sensor, which is a hygrometer provided byMeteolabor of Switzerland, in an intercomparison ex-periment that was accomplished at five tropical stationsduring different seasons in 2000-01 (Fujiwara et al.2003). The SW and RS80 sensors showed reasonable
agreement only in the middle troposphere. In the wet,lower troposphere, the RS80 sensor showed a dry biaserror (RS80 values are approximately 10% less thanthose of SW) due to the humidity sensor contamina-tion, among other reasons. The SW sensor generallyprovides good performance in the troposphere (Fuji-wara et al. 2003), but it does not operate appropriatelyin extremely dry conditions (stratosphere), because ofthe large frost-point depression and the significant po-tential for the out gassing of water from the instrumentbox and the sensor housing (V6mel et al. 2003). In 2002,a large experiment entitled the International H20 Proj-ect (IHOP 2002) was carried out in North America(Weckwerth et al. 2004). The aim was to obtain animproved characterization of the time-varying 3D wa-ter vapor field and evaluate its utility in improving theunderstanding and prediction of the convective pro-cesses. During this experiment 16 sondes werelaunched with the RS80, Sippican VIZ-B2, and SW sen-sors on the same balloons to evaluate the performanceof humidity sensors in two widely used operational ra-diosondes (Wang et al. 2003a). This study showed thatthe SW can detect cirrus clouds near the tropopauseand possibly estimate their ice water content.
A radiosonde intercomparison experiment, pro-moted by the World Meteorological Organization(WMO) and the Instituto Nacional de Meteorologia,
665JUNE 2005
JOURNAL OF ATMOSPHERIC AND OCEANIC TECHNOLOGY
TABLE 1. Launching times and radiosondes combination for theflights.
Launching times (UTC)
0000 0600 1200 1800
RS80 RS80 RS80 RS80MKII MKII MKII MKIISW SWDFM-97 GL-98 DFM-97 GL-98RS90 - - RS90
and supported by many other Brazilian and interna-tional organizations, was carried out in Brazil in 2001(Silveira et al. 2003), with the aim of studying the hu-midity sensor's performance in tropical areas. Thisexperiment was named the WMO Radiosonde Inter-comparison (RSO). The radiosonde manufacturersparticipating in the experiment were Graw Radio-sondes GmbH & Co., KG, from Germany (DFM-97);MODEM, from France, with InterMet Systems, fromthe United States (GL-98); Sippican, Inc., from theUnited States (MKI); and Vaisala Oyj, from Finland(RS80 and RS90). The Meteolabor SW humidity sensorfrom Switzerland was also used. This sensor has a newchilled-mirror technique to measure water vapor. Thelaunching procedure established during the campaignmade the vendors responsible for the radiosondepreparation and data processing; the processed dataused in our analysis were those delivered to the sitemanager up to 60 min after the end of the flight. Theonly exceptions were the SW data that were postpro-cessed by the Met Office, the United Kingdom weatherservice, using the RS90 temperature, and the exclusionof some punctual null values that were clearly related totechnical problems, like data transmission interrup-tions. Considering that the main goal was to analyzeoperational aspects, no other data preprocesses likethose suggested by Wang et al. (2002), Miloshevich etal. (2001), and Turner et al. (2003) were performed.The aim of this work is to evaluate the performance ofthe different humidity sensors in a tropical region usingthe data recorded at the RSO experiment, consideringaspects of operational usage. This evaluation was per-formed for different atmospheric layers and in differentperiods of the day.
2. The RSO experiment
The RSO humidity sensor intercomparison was car-ried out under the WMO experiment at the BrazilianAir Force Satellite/Rocket Launch Center (CLA), inthe city of AlcAntara, in the coastal area of MaranhaoState, Brazil. The experiment was performed at the
CLA meteorological station, which is located at 2'18'Slatitude and 44°22'W longitude, and 49 MSL.
The experiment lasted 18 days, beginning on 21 Mayand finishing on 7 June 2001. The flights occurred 4times a day, at 0000, 0600, 1200, and 1800 UTC, asindicated in Table 1. This table shows radiosonde com-binations that were accomplished in each of the 43flights made during the experiment. The arrangementsfor launching three or four radiosondes were done totest the RH sensors that were from available opera-tional radiosondes. However, it was decided that otherless worldwide operational manufacturers would alsoparticipate in the intercomparison experiment, andthey should be tested against those that are most avail-able operationally. Thus, the flights were arranged insuch a way that GL-98 and DFM-97 were placed withMKII, RS80, or RS90. The SW humidity sensor waslaunched attached to the MKII radiosonde.
A rig structure consisting of one or two polyvinyl-chloride (PVC) pipes was used to hold up the balloon,the unwinder mechanism, the parachute, and three orfour radiosondes, which flew all together attached toone balloon in order to compare the measurementsfrom different sensors (Fig. 1). The rig varies accordingto the launchings with the three or four radiosondes.Additional details of this experiment can be obtainedfrom Silveira et al. (2003).
Humidity sensor details
A brief description of each RH sensor participatingin this experiment is given below, in which is presentedthe most important details of the radiosondes involved.
1) RS80 RADIOSONDE (VAISALA OyJ, FINLAND)
The RH sensor is the Vaisala H-Humicap. This is athin-film capacitive sensor, using a highly porous poly-mer electrode, whose capacitance depends on theamount of water vapor and the air temperature. Itsaccuracy is better than 3% RH, and the humidity mea-surement range is from 0% to 100%, according to themanufacturer's notes. Typically, the RS80 samples ofRH data are given at intervals of approximately 1-2 s,and during the experiment a time interval of 2 s waschosen.
2) RS90 RADIOSONDE (VAISALA OyJ, FINLAND)
The RS90 RH sensor is the Vaisala H-Humicap, thesame as the RS80 sensor, but the measurement methodis different. The RS90 humidity sensor consists of twosensor elements containing heating devices, which arealternately turned on and turned off during the flight.This sensor is heated to eliminate moisture that mayform on the polymer surface when the radiosonde pen-
666 VOLUME 22

SAPUCCI ET AL.
FIG. 1. The rig structure used for supporting (a) three and (b) four radiosondes.
etrates clouds. While one element is heated, the othermeasures the RH, alternating this procedure during theflight. The measurement range is from 0% to 100%,with a resolution of 1%. The humidity sensor accuracyis of the order of 2% RH, and the sounding uncertaintyis of 5% RH with a 95% confidence level, according tothe manufacturer's notes. The sample rate was 2 s.
3) MKII RADIOSONDE (SIPPICAN, INC.,UNITED STATES)
The RH sensor is a polymer strip that is coated witha carbon slurry called "hygristor." The MKII sensoroperates on the resistance principle whereby it in-creases as atmospheric moisture decreases. The spacebetween the carbon molecules increases or decreases asthe RH changes, leading to a change in resistance. Thehygristor measures RH between 5% and 100% for val-ues of temperature ranging from +40' to -50'C, with aresolution of 1% and an accuracy of 2%. The humiditydata are available with the sample rate of 1 Hz and thedata were converted to 2 s (postprocessing phase).
4) GL-98 RADIOSONDE (MODEM, FRANCE)
The RH sensor is a capacitor type with measure-ments ranging from 0% to 100%. The measurementhumidity GL-98 resolution and absolute accuracy are0.1% and 5%, respectively. The response time of thissensor is less than 2 s. The sample rate that was usedwas 1 s.
5) DFM-97 RADIOSONDE (GRAw RADIOSONDESGMBH & Co., KG, GERMANY)
The DFM-97 RH sensor is a capacitive polymer chipsensor that is protected against heating and water in-gress by a mirrored capsule. This sensor presents a hu-midity measurement error that is lower than 5%, with aresolution of 1% for values from 5% to 100%. Thesample rate was 2 s.
6) SW RH SENSOR (METEOLABOR,
SWITZERLAND)
This sensor is a hydrometer named Snow White,based on the physically chilled mirror principle to mea-sure water vapor concentrations. There is an electricsystem to maintain the mirror temperature at the dew-point temperature of the environment. The SW RHmaximum values are 100%, and the minimum is givenby the limited temperature depression of the electricalheat pump under the mirror (Peltier element). This de-pression is at air temperatures from 200 to -60 0C.Therefore, the lowest possible value is about 2%-3%RH (P. Ruppert 2004, personal communication). How-ever, this sensor has limitations in extremely dry con-ditions (lower than 6%) (Vomel et al. 2003). Its accu-racy is of the order of 2% at saturation under the tropi-cal tropospheric conditions, if the accuracy for airtemperature is of about -±0.2 K (Fujiwara et al. 2003)The SW flew connected to the MKII radiosonde toshare the data transmitter and temperature measure-ments at a sample rate of 1 s.
3. Data processing and method
This section describes the procedures used in the ex-periment at the postprocessing phase. The first step wasto set up a dataset sampling at a 2-s rate for all of theflights. The second postprocessing step was the timeadjustment of all observations (offset-time adjustment).Because the radiosondes were launched all together,time is the common parameter to all of the equipmentparticipating in the same flight. Therefore, the inter-comparison analyses are realized as functions of time.However, due to the specific system of each radio-sonde, the start of the flight is not the same for allsensors. Thus, a small offset adjustment time was nec-essary. An objective technique was used to adjust the*time setup of all, the sets of radiosondes that flew on thesame balloon. This technique considers the followingpoints.
JUNE 2005 667

JOURNAL OF ATMOSPHERIC AND OCEANIC TECHNOLOGY
EP
600 0 00-
40 40-
20- 20-
2. 22 23 24 25 2' 27 21 22 23 24 25 20
Temperature (C) Temperature (C)
FiG. 2. Example of temperature profile (left) without time offset adjustment and (right) after time offsetadjustment.
"* Temperature was the radiosonde measurement thatbest agreed among them. Thus, it was decided to usetemperature as the parameter to guide the offset-time adjustment.
"• The Vaisala RS80 was the radiosonde that partici-pated in all of the flights. Then, the RS80 tempera-ture profile was used as a reference to adjust the timeoffset of the remaining radiosondes. Considering thatthis procedure only adjusts the time offset, there is noimplication for the results of the radiosonde compari-son due to the consideration of the RS80 as a refer-ence.
"* A mean-squared error algorithm was applied to thetemperature profile for each flight between the RS80and each of the other radiosondes that were launchedon the same balloon, considering a possible lag up toa maximum time offset. The minimum time lag ab-solute error was considered as the time offset of eachsonde in relation to the time of the RS80.
"* The maximum time offset was considered in the timeinterval of about 20 s. To ensure the best adjustment,this time step value was defined to be larger than thelargest time offset occurring during the radiosondetrial.
"• The time offset was adjusted by considering only theaverage time that it took for the radiosonde to crossa layer that is slightly larger than the mixed layer, thatis, 160 s. The layer that included the mixed layer anda few meters higher has larger temperature changeswith height. The use of this layer ensures having agood adjustment without including all of the radio-sonde patches that probably add time offset due tothe specific radiosonde system. An example of thisapproach applied to one of the flights is shown inFig. 2.
Although there are differences among the tempera-ture values that are measured by the different radio-sondes that might influence the RH values, these dif-ferences are quite small. Silveira et al. (2003) did adetailed analysis of the temperature sensors and con-cluded that bias among the radiosondes is less than0.05'C for the heights lower than 3 km, is 0.15°C for theheights between 3 and 8 km, and is between 0.40 and0.7°C for the layer above 8 km. Considering that mostof the water vapor is in the first and second layers, thisdifference does not have a substantial influence on theRH analysis.
The RH measurements from SW were postprocessedusing the RS90 temperature. Moreover, a quality-control process was applied to exclude spurious values.The Met Office carried out this postprocessing in theSW data.
The comparisons among different radiosondes thatwere launched in the same flight were accomplishedusing the ascension time as reference. However, thatreference is not appropriate for use in describing thevertical statistics of humidity values from differentflights, because the ascension rates of the balloons arenot exactly the same for each flight. Therefore, thetime-altitude relation is not the same among the differ-ent flights. To tackle this problem, the humidity valuedifferences gathered from different sensors for eachflight, then computed as a function of time, were re-ferred to in the pressure values to be analyzed, togetherwith the other flights. The pressure vertical resolutionwas of 1 hPa.
Available data
Only two flights were cancelled from those 43 radio-sondes flights. Flight 33 with the RS80, RS90, MKII,
668 VOLUME 22

SAPUCCI ET AL.
TABLE 2. The comparisons available between the RS80 andother humidity sensors.
Accomplished IntercomparisonHumidity sensor flight numbers number with RS80
RS80 40 ...RS90 25 18MKII 43 33SW 23 16GL-98 23 20DFM-97 19 16
DFM-97, and SW sensors was cancelled because 2 minprior to the launch there was a heavy storm and theballoon was not able to ascend with the radiosondes.During flight 37, which was also cancelled, the ballooncarrying the RS80, RS90, MKII, DFM-97, and SW sen-sors did not ascend properly, and it remained between200 and 400 m for a 20-min period because of a strongrainfall prior to launching. Some of the RS80, RS90,MKII, and SW humidity data presented clear technicalproblems, and they were excluded in order not committhe statistical analyses (see Silveira et al. 2003 for spe-cific details).
Due to the absence of reference humidity data, thesensor's performances are presented as a function ofthe RS80 values. The RS80 was chosen because it iscurrently the most used radiosonde for operational pur-poses (Wang et al. 2001), and much research has beendone to reduce and, eventually, remove errors thatwere present in this sensor (Wang et al. 2003a,b). Inaddition, it participated in all flights accomplished inthe experiment. Table 2 describes the number of avail-able flights during this experiment for each radiosondesystem, and the number of flights available for the in-tercomparison with the RS80. Whereas the other radio-sondes continually measured the humidity during mostof the soundings, the MKII had a large amount of in-terruptions, and it registered null values while the otherradiosondes did not. This happened in the three flights.These values were taken out of the analyses.
Tendency and dispersion analyses were applied toverify the consistency of the radiosonde measurements.We have used the root-mean-square (rms) as the dis-persion and the bias measurement to account for pos-sible tendencies. These statistical quantities were com-puted on a level-to-level basis for a combination of theavailable radiosondes, for the same flight and time, andwere further converted to the RS80 pressure. Theanalysis was carried out as a function of height (con-verted from pressure using the average relationship).Also, three layers were defined: the first layer includesthe lower levels of the troposphere (from the surface to3 km); the second layer includes the medium levels of
the troposphere, between 3 and 8 km; and the thirdlayer includes the highest levels of the troposphere andthe beginning of the stratosphere, starting at 8 km up tothe end of the vertical profile.
4. Analysis of the results
We began by presenting the general features of thehumidity profile for each radiosonde. The average pro-files were divided into four groups to assure simulta-neous measurements and the same amount of flightsamong the different sensors. It can be noted that DFM-97 and GL-98 never flew together. The four groups arecomposed of the flights at 0000, 0600, 1200, and 1800UTC. The average profiles were computed using onlythose flights that were successful in collecting data fromall of the sensors. These average profiles present a pre-liminary analysis of the main behavior of the differenthumidity sensors that are involved in the experiment.Figure 3 shows the mean profiles of the RH measuredfrom different sensors launched in the four groups as afunction of the altitude.
In Fig. 3 a low dispersion at the low and mediumlevels of the troposphere (up to around 8 km) can beseen, where the humidity concentration is relativelylarge. This fact is not observed at high levels of thetroposphere, where the measurements are more dis-persed. Also, at low levels the MKII radiosonde pre-sents higher RH values than the other radiosondes.Conversely, the DFM-97 radiosonde, at low levels, pre-sents values lower than the others. These results sug-gest that at conditions of a high concentration of watervapor, MKII and DFM-97, respectively, overestimateand underestimate the humidity with relation to theother radiosondes. The point that draws attention inFig. 3 is the high dispersion at high levels, where it isclearly seen that there is no agreement among the ra-diosondes. In this layer, daytime SW RH values have alarger dispersion with relation to the other radiosondeRH values than during the nighttime period. Solarheating reduces the cooling efficiency of the Peltier hotside, explaining the slightly higher limited temperaturedepression under the mirror for the daytime period(V6mel et al. 2003).
Figure 4 gives the bias and rms values of the RHsensors as a function of the RS80 sensor values. Thenumber of samples considered in each comparison ispresented in the Table 3.
* In the first layer the RS80 RH mean value is smallerthan those from other sensors (Figs. 4a, 4b, 4c, and4e), with the exception of the DFM-97 sensor values(Fig. 4d). In this layer GL-98 has nearly no bias (Fig.4c).
669JUNE 2005

670 JOURNAL OF ATMOSPHERIC AND OCEANIC TECHNOLOGY VOLUME22
* Average Relative Humidity (n=7) Average Relative Humidity (n=9)
25 - * Launching time: 00:00 (UTC) 25 Launching time: 06:00 (UTC)x RS80
AMKII*+ . i. x RS80 GLMKI e GL-98A MKIISI ZX DFM-97 ®
20 c x 4 SW 20- ex
015 c c:
x +cc:
x i x : 44x 4, c cc
Sk- s , !x: . 0
qc +
x =+; "10- x• obto t- o. ,•× : e
5~ -
4c~
0 to 20 30 40 50 60 70 a0 ao 100 0 10 20 30 40 50 60 70 80 80 t00Relative Humidity (%) Relative Humidity (/c
*Average Relative Humidity (n=7) .Average Relative Humidity (n=7)
25 - cLucigtme 20 UC 25 -Launching time: 18:00 (UTC)x RS80 + RS90
A MKII x RS80ccx D FM-97 AMKII
cc~ cc x(Dc GL-98*SW
20 .- x 4x 20 cc
cc cczc
xc .•..x .
015 -ct xScx ccx .= ° cc,
5-
0 10 20 30 40 50 60 70 80 00 t00 0 t0 20 30 40 50 80 70 80 90 too
Relative Humidity (%) Relative Humidity (%)
FiG. 3. Mean profiles of RH computed from the radiosonde measurements for the flights launched at (a) 0000(b) 0600, (c) 1200, and (d) 1800 uTc.

SAPUCCI ET AL.
s0 80
Bias
0 10 20 W0 40 50 OD -0 -W0 -40 .30 .20 -10 0 10 20 30 40 50 80Bias Bias
RMS0 20 40 60 soI. . . . . ... . . . .... . . -,. . . . ..I
30-
tf Intercobpanison Snow - RSSO
25 -= : + BIA
.20
4 s- °S0-
-00 -50 -40 -30 -20 -10 0 10 20 30 40 50 soBias
FIG. 4. Bias and rms values as a function of altitude and as a function of the comparison with the RS80 RHvalues.
• In the second layer, the low bias values indicate thelack of tendency among the different radiosondes.An exception is observed between RS80 and MKII,where the latter presents smaller values than RS80 inthat layer. However, a large dispersion is observedbetween such radiosondes (Fig. 4b). Despite theseradiosondes that have generated values with low ten-
dencies the rms values in this layer indicate a largerdispersion than those observed in the first layer.The largest dispersion of the RH is noticed in thethird layer. In this layer, the RS80 RH mean valuepresents a tendency to underestimate the RH. It pre-sents smaller values than those generated by theother sensors.
JUNE 2005
RMS20 40
30
25
15.
10.
671
II IIIIIIII .... I .... IIIIII ... ... IIIIIIIIIII ...............
JOURNAL OF ATMOSPHERIC AND OCEANIC TECHNOLOGY
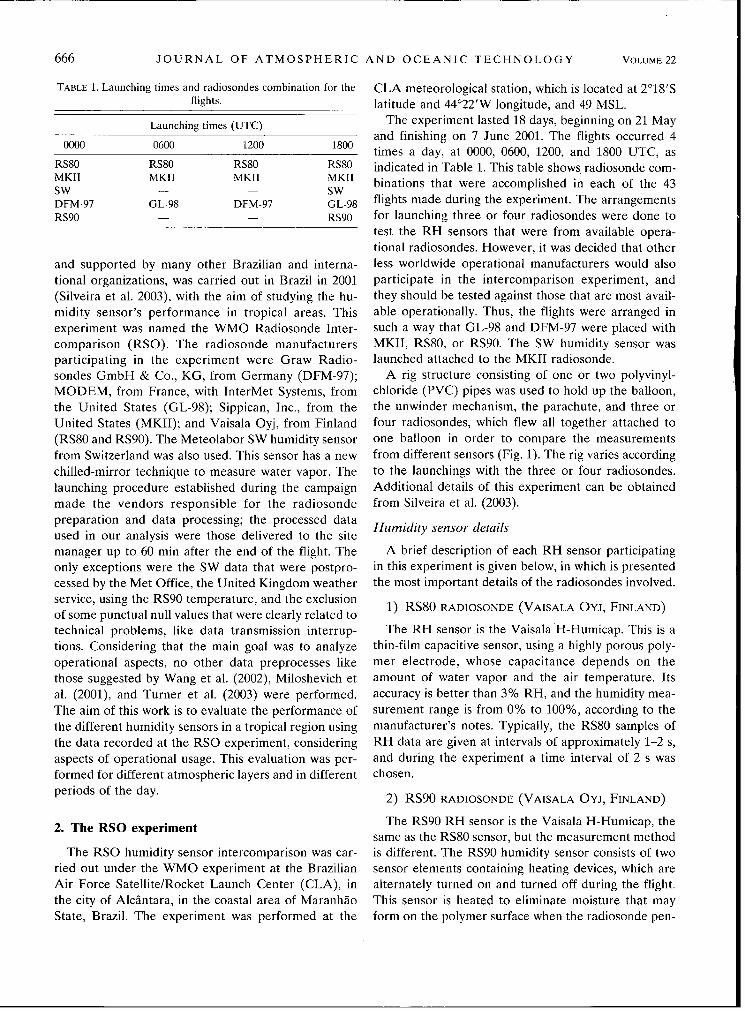
TABLE 3. Bias and rms (% RH) for the vertical profile of radiosonde measurements at the three selected layers.
Bias (% RH) Rms (% RH)
Comparison Flight no. First layer Second layer Third layer First layer Second layer Third layer
RS90-RS80 18 +1.47 -1.12 +5.57 3.49 4.37 8.01
MKII-RS80 33 +7.44 -2.47 +0.33 10.18 14.03 15.29GL-98-RS80 20 +0.82 +1.89 +5.27 4.12 7.23 9.96
DFM-97-RS80 16 -3.95 -1.34 +8.10 5.89 6.23 12.95SW-RS80 16 +3.57 -1.11 +22.24 5.05 5.30 28.32
MKII-RS90 19 +7.26 -2.52 -4.37 9.89 14.09 14.54
GL-98-RS90 13 -1.49 +1.32 -2.58 3.82 5.34 8.61
DFM-97-RS90 8 -4.06 +0.19 +3.15 6.96 7.33 12.01
SW-RS90 18 + 1.98 -0.08 + 14.97 4.63 7.77 22.63
GL-98-MKII 19 -7.43 +3.86 -5.31 10.09 12.53 17.73
DFM-97-MKII 15 -9.56 +2.15 +5.37 12.91 16.88 15.67SW-MKII 16 -5.32 +2.58 +20.82 8.39 16.79 29.16SW-GL-98 10 +5.58 -0.30 +22.75 7.44 9.98 30.36
SW-DFM-97 7 +4.59 -2.59 +7.97 6.05 7.93 19.78
Table 3 shows a quantitative analysis of the bias andrms values (given in percent RH) concerning RS80, andin comparison to the other sensors, as well as of all the
possible combinations of the radiosonde sensors. Thereare not statistics comparing GL-98 and DFM-97 be-cause they were not launched together in any of theflights. The values presented in Table 3 show the fol-
lowing.
" RS90 has closer measurements to the other radio-
sondes than does RS80. The bias and rms values fromRS90 were better for the three analyzed layers, ex-
cept for the comparison with the DFM-97 sensor,which presented a smaller tendency in the first layer
and a smaller dispersion in the first and second layer,regarding RS80.
"* The MKII sensor presented a positive bias and thelargest dispersion in the first two layers.
"* In the third layer, the SW sensor presented the larg-
est tendency and the largest dispersion in the groupcomparison.
"* In the three layers, the comparisons among the RS80,RS90, and GL-98 sensors presented a smaller ten-
dency and dispersion than the other groups."* Despite the largest bias and dispersion of SW in the
third layer, the bias and rms values that were gener-ated in the first and second layer, considering RS80,
RS90, and GL-98, were relatively low.
In summary, the values presented in Fig. 4 and Table3 suggest the following: 1) the RS80 RH sensor presentsa tendency to underestimate the humidity in the lowand high troposphere and the layer above the latter
[Some residues of correction for the RS80 dry bias, asdescribed by Wang et al. (2002), can be present in these
results.], 2) RS90 presents RH values that are more
similar to most sensors available than does RS80; 3)MKII overestimates RH in the low troposphere andpresents quite dispersive RH values in the low and me-dium troposphere; 4) RS80, RS90, and GL-98 pre-sented RH values with good agreement in the threelayers; and 5) the SW sensor values presented goodagreement with these radiosondes below 10 km and thelargest tendency and dispersion above this layer.
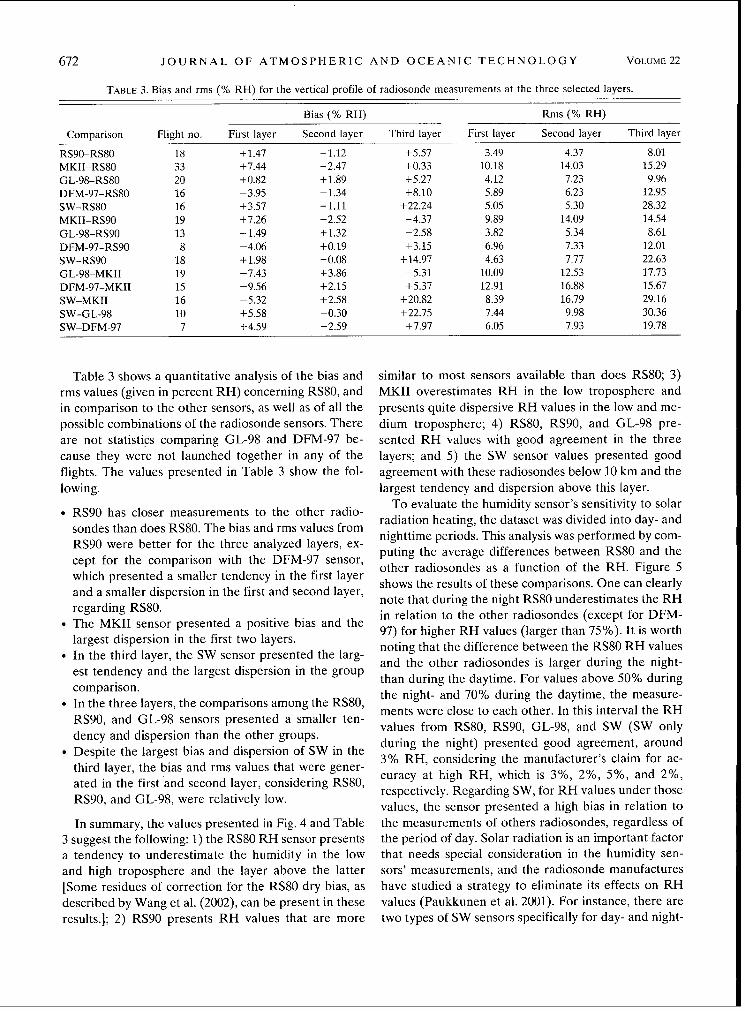
To evaluate the humidity sensor's sensitivity to solarradiation heating, the dataset was divided into day- andnighttime periods. This analysis was performed by com-puting the average differences between RS80 and theother radiosondes as a function of the RH. Figure 5shows the results of these comparisons. One can clearlynote that during the night RS80 underestimates the RHin relation to the other radiosondes (except for DFM-97) for higher RH values (larger than 75%). It is worthnoting that the difference between the RS80 RH valuesand the other radiosondes is larger during the night-than during the daytime. For values above 50% duringthe night- and 70% during the daytime, the measure-ments were close to each other. In this interval the RHvalues from RS80, RS90, GL-98, and SW (SW onlyduring the night) presented good agreement, around3% RH, considering the manufacturer's claim for ac-curacy at high RH, which is 3%, 2%, 5%, and 2%,respectively. Regarding SW, for RH values under thosevalues, the sensor presented a high bias in relation tothe measurements of others radiosondes, regardless ofthe period of day. Solar radiation is an important factorthat needs special consideration in the humidity sen-sors' measurements, and the radiosonde manufactureshave studied a strategy to eliminate its effects on RHvalues (Paukkunen et al. 2001). For instance, there aretwo types of SW sensors specifically for day- and night-
672 VOLUME 22
SAPUCCI ET AL.
442
.1
<.3
4
•2
•.0
-4
I ... ...... 10 .... 0.... I0 10 20
00 s0 70 80 90 100
30 40 50 60 70 80 90 100Relatve Humidity (%)
FIG. 5. Average difference of RH for day- and nighttime periods as a function of the RS80values.
time periods (Fujiwara et al. 2003). The solar radiationeffects are clearly seen in the day- and nighttime analy-sis, and they are probably responsible for most of thisbehavior. However, the evaluation of these effects onthe RH sensors results requires measurements fromother techniques that employ different forms of mea-surement, such as a microwave radiometer (Turner etal. 2003), which were not performed during the experi-ment.
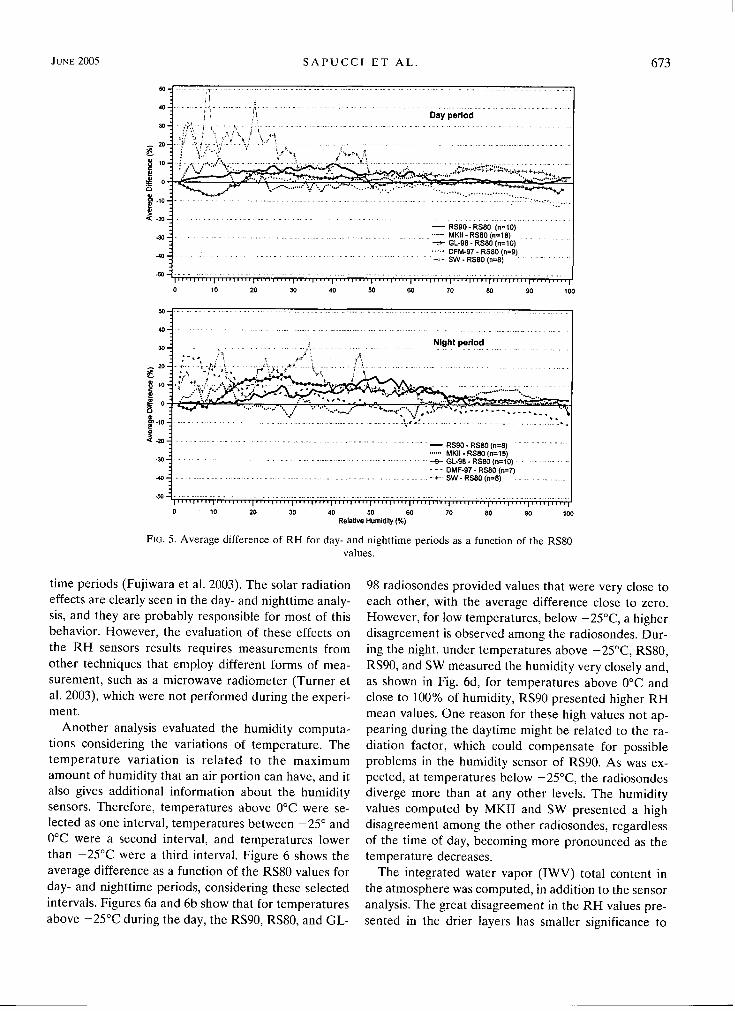
Another analysis evaluated the humidity computa-tions considering the variations of temperature. Thetemperature variation is related to the maximumamount of humidity that an air portion can have, and italso gives additional information about the humiditysensors. Therefore, temperatures above 0C were se-lected as one interval, temperatures between -250 and0°C were a second interval, and temperatures lowerthan -25°C were a third interval. Figure 6 shows theaverage difference as a function of the RS80 values forday- and nighttime periods, considering these selectedintervals. Figures 6a and 6b show that for temperaturesabove -25'C during the day, the RS90, RS80, and GL-
98 radiosondes provided values that were very close toeach other, with the average difference close to zero.However, for low temperatures, below -25°C, a higherdisagreement is observed among the radiosondes. Dur-ing the night, under temperatures above -25°C, RS80,RS90, and SW measured the humidity very closely and,as shown in Fig. 6d, for temperatures above 0C andclose to 100% of humidity, RS90 presented higher RHmean values. One reason for these high values not ap-pearing during the daytime might be related to the ra-diation factor, which could compensate for possibleproblems in the humidity sensor of RS90. As was ex-pected, at temperatures below -25°C, the radiosondesdiverge more than at any other levels. The humidityvalues computed by MKII and SW presented a highdisagreement among the other radiosondes, regardlessof the time of day, becoming more pronounced as thetemperature decreases.
The integrated water vapor (IWV) total content inthe atmosphere was computed, in addition to the sensoranalysis. The great disagreement in the RH values pre-sented in the drier layers has smaller significance to
0-_
40-Day period
a .. .....;�..., ,
-RS90O- RS80 (n=10)... ... .......MKII - RS80 (n=18)-- GL-98 - RS80 (n=10)
DFM-97 - RSS (n=9)"4o - .... rrrrrr .. rSW - R. 80 (n=8) .......... .
S 102I " I " 00 10 20 30 40
0-
40-
0-
0-
0-
0-
0-
30-
40-
JUNE 2005 673
F

JOURNAL OF ATMOSPHERIC AND OCEANIC TECHNOLOGY
50
:0
0
0
0
:00
10
s0
0 1
5
.-2>-3
-4
-54
0:F
5
i5
0-2
<-
30
10
50
50
40
30
20
10
0
-10
20
30
40
50i . . .i; . .; . .. . . .I.. . . I.. . . I.. . . i.. . . i . . . . . . I
0 10 20 30 40 50 60 70 80 90 100Relative Humidity (%)
0 10 20 30 40 50 60 70 80 90 100Relative Humidity (%)
FIG. 6. Average difference of RH for day- and nighttime periods as a function of the RS80 humidity values
considering temperatures (top) above 0'C, (middle) from -250 to 0°C, and (bottom) below -25'C.
IWV values, because it is an integrated measurementand most of the water vapor is concentrated at lowerlevels. Consequently, the IWV values of different sen-sors are close to each other. The IWV values were cal-culated from a numeric integration of radiosondes' RHvalues measured during the experiment for differentlayers. This analysis was carried out for different atmo-spheric layers. The third layer was subdivided into twolayers, one between 8 and 15 km and another above 15km, which added to the evidence of the dispersion athigher levels.
Figure 7 shows the dispersion diagram among theIWV values from different radiosondes as a function ofthe RS80 IWV values for the different appraised layers.The IWV values dispersion is gradually larger in thehighest layers, as discussed previously. The scales of thedifferent plots of Fig. 7 were variable to facilitate theinterpretations of results. Table 4 shows the bias andrms values of the IWV between the humidity sensor of
the evaluated radiosonde and the RS80 humidity sensorfor the four appraised layers. Table 5 presents the cor-
relation coefficients (R2) of the IWV from other sen-
sors regarding the RS80 IWV values, and their respec-tive slope and interception.
The R2 values indicate that the correlations among
the IWV values are significantly high, mainly in the first
three layers. The R2 values are above 0.9 in those firstthree layers, with the exception of the MKII radio-
sonde, which presents slightly lower correlation values.In the fourth layer the R2 values indicate a low corre-
lation between the MKII, GL-98, and SW sensors. Only
RS90 and DFM-97 present a relatively good correlationin this layer, of approximately 0.9.
The tendency and dispersion measurements show
that the RS90 and RS80 humidity sensors present the
most similar values, mainly in the first two layers, where
the humidity concentration is larger. In those layers the
correlation factor is quite high, above 0.9 (Table 5),
674
Day period: Temperature greater than 00.
4 _ N.. .•. " ./ . ,.... .. { "•'...... .... '" " ..........
VOLUME 22
Night period: Temperature greater than 0 c0-
0 --. ... ... .
0 10 20 30 40 50 60 70 80 90 100
5.4C
3cg2c
-2
-5
50
40
3040
10
0
-1 a
-20
-30
`40
-50
Day period: Temperature between -25 C and 0 C40 -
0 - A•.•2",
20-- ...............to i
0 ,''1- I IP . 10 2 3 4 5. 61 0 71 0 80 10 1.. 00.1111 - .0 10 20 30 40 50 60 70 80 90 100
Night period: Temperature between -25 C and 0 C
.. . .. .. .. ...... .. ... ... ... ... ... ... . . ..
I' " I,' .l . 1.l ' " 1l " 'Il' . .l ' ' I l " ' ' l ". I I ". . l0 10 20 30 40 50 60 70 80 90 100
0-
0-
0-
50-
0 10 20 30 40 50 60 70 80 90 100
Day period: Temperature smaller -25 C
- RS90 - RS80 (n=10)..... MKII-RS80(n=18)-.-• GL-98 - RS80 (n=10)- - DFM-97 - RS0 (in=9)-- SW - RS80 (n=8)
S. . . . . . . . . . . . . . . . . . . . . . . . . . . . . . . . . . . . . . . . . . . I i . . . .
... . . .. .
0-
0-
0-
0-
0-
0-
0-
0-
0-
O-
^

SAPUCCI ET AL.
50-
40-
48 -
44-
427
40-
38-
367
347
32.
30-
28-
20-
26 28 30 32 34 36 38 40 42 44 46 48 50Integrated Water Vapor RSBO ( kg nn" )
0.0 0.5 1.0Integrated Water Vapor RS80 (kg m"2)
0 2 4 6 8 10 12 14 16 18 20 22 24Integrated Water Vapor RS80 ( kg m"n )
0.15 -
"0.10-
0.00-
1.5 2.0 0.00 0.05 0.10Integrated Water Vapor RSOO (kg mt )2
0.15
FiG. 7. Correlation and scattering diagram of the 1WV values in the different layers of the radiosonde profile asa function of the RS80 1WV value.
and the bias and rms values are relatively low, around-0.8 and 1.1 kg m-2 in the first layer, respectively(Table 4). The MKII sensor presented the smallest cor-relation values with relation to the RS80 sensor. Wecan note a large tendency and great dispersion, mainlyin the first two layers. Considering the whole profile,the rms between the RS80 and MKII IWV values was4.6 kg m-2. This value is 3 times larger than the disper-sion resulting from the comparison between RS80 andRS90.
The GL-98, DFM-97, and SW sensors, in comparisonto the RS80 values, had an intermediate performancecompared with those extreme cases. Such sensors pre-sented values with a high correlation and relativelysmall rms values of 2.2, 2.4 and 2.6 kg m-2 for theGL-98, SW, and DFM-97 sensors, respectively. TheGL-97 sensor generated a low bias, in the first layer,when compared with RS80.
The slope values in Table 5 show that MKII, SW, andGL-98 present a similar sensitivity to water vapor re-
garding the RS80 IWV total content. The slope valuesfor these sensors were closer to one (1.003, 0.988, and0.981, respectively) than were those of RS90 and DFM-97. The slowest interception values were obtained be-tween DFM-97 and RS80, considering the IWV totalcontent.
IWV value analysis during the day- and nighttimeperiods that were carried out in the ARM experiment,using a microwave radiometer and the RS80 radio-sonde, suggested that daytime radiosondes are typically3%-4% drier than nighttime radiosondes (Turner et al.2003). Considering that the RSO experiment did nothave an independent humidity measurement using mi-crowave or GPS, this comparison cannot be performed.However, if we consider differences between the tradi-tional radiosonde measurements and SW, which mea-sures humidity in a completely different way (it usesmirrors), and the good performance of SW in the low-ers layers where most humidity is concentrated, we ob-serve a diurnal drier behavior of the order of 5.9% for
JUNE 2005
First Layer: 0 sec. to 3000 m.
* RS90 (n=18)* MKII (n=33)* GL-98 (n=20)I DFM-97(n=16)* SW (n=16)
I D
Sale .
"C
S
675
2.0
1.5
1.0.
S
o's- 0,5-
0.0 -
Fourth Layer (Last): 15000 rn. to 30000 m.
* U RS90 (n=18)* MKII (n=33)* GL-98 (n=20)I DFM-97 (n=16)8 SW (n=16)
4=
ýE

JOURNAL OF ATMOSPHERIC AND OCEANIC TECHNOLOGY
TABLE 4. Bias and rms values of the IWV regarding the RS80 radiosonde in the different layers.*
Layers*
First layer Second layer Third layer Fourth layer Total content
Flight Statistical (38.458 (8.741 (0.254 (0.008 (47.461
Radiosonde No. measurements kg m-2)** kg m-2)** kg m -2)** kg m -2)** kg m-2)**
RS90 18 Bias (kg m-2) +0.787 -0.186 -0.012 +0.003 +0.591
Bias (%) +2.05 -2.13 -4.72 +37.50 +1.25
Rms (kg m- 2) 1.124 0.387 0.041 0.005 1.271
Rms (%) 2.92 4.43 16.14 62.50 2.68
MKII 33 Bias (kg m-2) +3.497 -0.159 -0.1 13 0 +3.229
Bias (%) +9.09 -1.82 -44.49 0 +6.80
Rms (kg m-2) 4.158 1.972 0.218 0.007 4.605
Rms (%) 10.81 22.56 85.83 87.50 9.70
GL-98 20 Bias (kg m-2) +0.578 +0.187 +0.064 -0.004 +0.822
Bias (%) +1.50 +2.14 +25.20 -50.00 +1.73
Rms (kg m-2) 1.696 0.542 0.073 0.006 2.202
Rms (%) 4.41 6.20 28.74 75.00 4.64
DFM-97 16 Bias (kg m-2) -1.979 -0.279 +0.006 +0.057 -2.194
Bias (%) -5.15 -3.19 +2.36 +712.50 -4.62
Rms (kg m-2) 2.198 0.547 0.029 0.112 2.565
Rms (%) 5.72 6.26 11.42 1400.00 5.40
SW 16 Bias (kg m-2) +1.725 -0.197 +0.062 +0.025 +1.607
Bias (%) +4.49 -2.25 +24.41 +312.50 +3.39
Rms (kg m-2) 2.186 0.594 0.08 0.047 2.413
Rms (%) 5.68 6.80 31.50 587.50 5.08
* First layer is defined as the layer between surface and 3 km, second layer is from 3 to 8 km, third layer is from 8 to 15 km, and fourth
layer is above 15 km.** RH mean value in each layer.
RS80, 4.5% for RS90, 1.4% for MKII, and 7.1% for
GL-98. Because the DFM-97 and SW sensors not were
launched together during the daytime period these sta-
tistics were not calculated.The largest feature emerging in this RH sensor inter-
comparison is the large disagreement between the RH
sensors above 8 km. The largest dispersion was foundfor the SW. The probable reason for this disagreementis the loss of frost coverage of the SW sensor when
crossing the dry layer at higher altitudes, which may
generate erroneous measurements in parts of or all of
the profile above this layer as discussed by Vomel et al.
TABLE 5. Correlation coefficients of the IWV regarding the RS80 IWV values and their respective slope and interception.
Layers*
Radiosonde Flight No. Coefficients First layer Second layer Third layer Fourth layer Total content
RS90 18 Correlation 0.973 0.994 0.993 0.879 0.976
Slope 0.976 0.973 0.932 1.425 0.939
Intercept 1.663 0.089 0.019 -0.001 3.431
MKII 33 Correlation 0.823 0.896 0.791 0.487 0.867
Slope 1.00t 1.104 0.646 0.751 1.003
Intercept 3.455 -1.081 0.016 0.002 3.105
GL-98 20 Correlation 0.947 0.990 0.995 0.461 0.907
Slope 1.249 0.965 1.042 0.270 0.981
Intercept -8.108 0.522 0.043 0.001 1.690
DFM-97 16 Correlation 0.966 0.991 0.990 0.937 0.972
Slope 0.911 0.887 0.949 13.473 0.934
Intercept 1.237 0.704 0.020 -0.072 0.919
SW 16 Correlation 0.942 0.984 0.992 0.581 0.940
Slope 0.926 1.112 1.081 6.582 0.988
Intercept 4.351 -1.246 0.023 0.003 2.169
* The layers are the same ones defined in Table 4.
676 VOLUME 22

SAPUCCI ET AL.
25
20
15
10
5
0
0 20 40 60 80 100 120
Relative Humidity (%)
FIG. 8. An RH profile from the RS80, RS90, MKII, GL-98, andSW sensors for flight 36.
(2003). These events were quite frequent in the RSOexperiment. This happened in almost all the SW flights,causing short disturbances in the RH profile or large
dispersion at high altitudes. Figure 8 shows an RH pro-file to illustrate such a problem. This figure evidencesthe good agreement of the SW RH values below 11 kmand larger dispersion above this layer, probably due tothe loss of frost-point control.
5. Conclusions
This paper presents a comparison of moisture mea-surements obtained from different sensors launched to-gether on the same balloon. The aim is to evaluate, in atropical region, the RH measurement performance ofradiosondes from different manufacturers, consideringaspects of operational usage. The results of this experi-ment show the RH sensors presenting similar results
with a small tendency and low dispersion where humid-ity concentration is larger (up to 3 km). In intermediatelayers, from 3 to 8 km, the humidity sensors present asmall bias, but a larger dispersion than in the first layer.However, in the layer above 8 km the largest disagree-ment among the humidity measurements is observed,as a result of dispersion and a tendency of the measure-ments to be very high. Although this last layer presentsa low-humidity concentration, the radiative effects turnout to have great relevance, because the small mass ofwater vapor present in those layers has a great impacton infrared radiation absorption. Considering this fact,more sophisticated mechanisms should be used toevaluate the humidity measurement qualities in the at-mosphere's high layers, such as employing differenttypes of instruments to measure humidity. Experimentsusing such procedures should be carried out in the fu-ture with the objective of providing improvements inthe sensors' sensitivity to the small masses of watervapor and low temperatures that are typical of the hightroposphere.
In the lower troposphere the different RH sensorshave shown good agreement. The good performance ofthe SW chilled-mirror hygrometer sensor in the tropo-sphere was demonstrated by Fujiwara et al. (2003) andWang et al. (2003a). Similarly, the RS90 RH sensor
presents new measurement technology, which employstwo heated humidity elements, and it has improvedsounding accuracy (Paukkunen et al. 2001). The moresophisticated mechanisms employed by these sensorsmay explain the low dispersion and tendency found be-tween the SW and the RS90 RH sensors in the firstlayers. If one considers those measurements as a refer-ence, it can be verified that the MKII sensor overesti-mates the humidity values in the first layer, while theDFM-97, RS80, and GL-98 sensors tend to underesti-mate the humidity. Among these, the DFM-97 radio-sonde is the one that presents the largest tendency tounderestimate the measurements, while RS80 and GL-98 present quite close values to the RS90 in that layer.
In the analysis for the day- and nighttime periods, itwas observed that the sensors yielded more similarmeasurements during the daytime period and smallerbias values when the RH was high. The largest tenden-cies, in both day- and nighttime periods, were gener-ated when the temperature was below -25°C.
The integrated water vapor (IWV) values presentedsmall dispersion and small tendency, with the exceptionjust of the MKII sensor. The RS80 and RS90 sensorspresented more similar results, with an rms of only 1.3kg m-2. The SW sensor presented low dispersion in theIWV values because the largest dispersion in the hu-midity values found for this sensor occurred in the high
677JUNE 2005

JOURNAL OF ATMOSPHERIC AND OCEANIC TECHNOLOGY
levels, where the atmospheric water vapor amount issmall.
Acknowledgments. Many Institutions supported thisexperiment. The Word Meteorological Organization(WMO) and the Brazilian National Meteorological In-stitute (INMET) were the main institutions to supportthis RSO intercomparison. The Fundaq5o de Amparo isPesquisa do Estado de Siao Paulo (FAPESP) also con-tributed with financial support, through grants 2000/15124-7 and 2001/12761-9; as did the Brazilian AirForce, with CLA representatives, the Aerospace Tech-nical Center (CTA), and the Diretoria de Eletr6nica eProteýio ao V6o (DECEA); the National Weather Ser-vice from the United States; MeteoFrance; NASA; andthe Met Office. Technical contributions were providedfrom Frank Schmidlin from NASA Wallops, who pro-vided very useful suggestions for the experiment: JohnNash, who provided the Snow White-processed data;and, finally, the radiosonde manufactures: Graw Radio-sondes GmbH & Co., KG, from Germany, MODEMfrom France, Sippican, Inc., from the United States,Vaisala Oyj from Finland, and Meteolabor from Swit-zerland. We wish to thank all these organizations andindividuals very much, as well as their representatives,for collaborating with this very successful joint effort.
REFERENCES
Fujiwara, M., M. Shiotani, F. Hasebe, H. V6mel, S. J. Oltmans,P. W. Ruppert, T. Horinouchi, and T. Tsuda. 2003: Perfor-mance of the Meteolabor "Snow White" chilled-mirror hy-grometer in the tropical troposphere: Comparisons with theVaisala RS80 A/H-Humicap sensors. J. Atmos. OceanicTechnol., 20, 1534-1542.
Guichard, F., D. Parsons, and E. Miller, 2000: Thermodynamicand radiative impact of the correction of sounding humiditybias in the Tropics. J. Climate, 13, 3611-3624.
Holton, I. R., 1992: An Introduction to Dynamic Meteorology. 3ded. Academic Press, 507 pp.
Ivanov, A., A. Kats, S. Kurnosenko, J. Nash, and N. Zeitseva,1991: WMO international radiosonde comparison, Phase 3.WMO Instruments and Observing Methods Rep. 40, 135 pp.
Miller, E. R., J. Wang, and H. L. Cole, 1999: Correction for drybias in Vaisala radiosonde RH data. Proc. Ninth AtmosphericRadiation Measurement (ARM) Science Team Meeting, SanAntonio, TX, U.S. Department of Energy, 99. [Available on-line at http:/lwww.arm.gov/publications/proceedingslconf09/abstracts/miller-er-99.pdf.]
Miloshevich, L. M., H. V6mel, A. Paukkunen, A. J. Heymsfield,and S. J. Oltmans, 2001: Characterization and correction ofrelative humidity measurements from Vaisala RS80-A radio-
sondes at cold temperatures. J. Atmos. Oceanic Technol., 18,135-156.
Paukkunen, A., V. Antikainen, and H. Jauhiainen, 2001: Accu-racy and performance of the new Vaisala RS90 radiosonde inoperational use. Preprints, llth Symp. on Meteorological Ob-servations and Instrumentation, Albuquerque, NM, Amer.Meteor. Soc., 98-103.
Revercomb, H. E., and Coauthors, 2003: The ARM program'swater vapor intensive observation periods: Overview, initialaccomplishments, and future challenges. Bull. Amer. Meteor.Soc., 84, 217-236.
Schmidlin, F. J.7 2005: Report of the WMO radiosonde relativehumidity sensor intercomparison: Phase II, 8-26 September1995. Instruments and Observing Methods, WMO, in press.
Silveira, R., G. Fisch, L. A. T. Machado, A. M. J. Dall'Antonia,L. F. Sapucci, D. Fernandes, and J. Nash, 2003: Intercompari-son of GPS radiosondes-Executive summary. WMO Rep.IOM-76, TD 1153, 15 pp. [Available online at http://www.wmo.ch/web/www/I MOP/publications/IOM-76-G PS-RSO/Intercomp-RSO-Brazil200l-ExecSummary.pdf.]
Turner, D. D., B. M. Lesht, S. A. Clough, J. C. Liljegren, H. E.Revercomb, and D. C. Tobin, 2003: Dry bias and variabilityin Vaisala RS80-H radiosondes: The ARM experience. J. At-mos. Oceanic Technol., 20, 117-132.
VOmel, H., M. Fujiwara, M. Shiotani, E. Hasebe, S. J. Oltmans,and J. E. Barnes, 2003: The behavior of the Snow Whitechilled-mirror hygrometer in extremely dry conditions. J. At-mos. Oceanic Technol., 20, 1560-1567.
Wang, J., H. L. Cole, D. J. Carlson, and A. Paukkunen, 2001:Performance of Vaisala RS80 radiosonde on measuring up-per-tropospheric humidity after corrections. Preprints, l1thSymp. on Meteorological Observations and Instrumentation,Albuquerque, NM, Amer. Meteor. Soc., 94-97.
, E.R. Miller, K. Beierle, A. Paukkunen, andT. K. Laine, 2002: Corrections of humidity measurement er-rors from the Vaisala RS80 radiosonde-Application toTOGA COARE data. J. Atmos. Oceanic Technol., 19, 981-1002., _- D. B. Parsons, T. F. Hock, D. Lauritsen, H. L. Cole, K.Beierle, and E. Chamberlain, 2003a: Performance of opera-tional radiosonde humidity sensors in direct comparison witha chilled mirror dew-point hygrometer and its climate impli-cation. Geophys. Res. Lett., 30, 1860, doi:10.1029/2003GL016985.I T. F. Hock, D. Lauritsen, H. L. Cole, K. Beierle, N. Cham-berlain, D. B. Parsons, and D. J. Carlson, 2003b: A referenceradiosonde system for improving water vapor measurementin IHOP_2002. Preprints, Observing and Understanding theVariability of Water in Weather and Climate, Long Beach,CA, Amer. Meteor. Soc., CD-ROM, J3.5.
Weckwerth, 1'. M., and Coauthors, 2004: An overview of the In-ternational H 20 Project (IHOP-2002) and some preliminaryhighlights. Bull. Amer. Meteor. Soc., 85, 253-277.
Yagi, S., A. M/lita, and N. lnoue, 1996: WMO international radio-sonde comparison-Phase IV-Tsukuba, Japan, 15 Febru-ary-12 March 1993, final report. WMO Instruments and Ob-serving Methods Rep. 59, 130 pp.
678 VOLUME 22

COPYRIGHT INFORMATION
TITLE: Analysis of Relative Humidity Sensors at the WMORadiosonde Intercomparison Experiment in Brazil
SOURCE: J Atmos Ocean Tech 22 no6 Je 2005WN: 0515207129004
The magazine publisher is the copyright holder of this article and itis reproduced with permission. Further reproduction of the article inviolation of the copyright is prohibited.
Copyright 1982-2005 The H.W. Wilson Company. All rights reserved.