annual report - 2012-13 annual report 2012-13.pdfpradeep mallick pradeep v bhide s sandilya n...
TRANSCRIPT


10 YEAR FINANCIALS` in Crores
12-13 11-12 10-11 09-10 08-09 07-08 06-07 05-06 04-05 03-04
OPERATING RESULTS
Sales (Including excise duty) 3642.25 3664.77 3126.40 2453.65 2212.22 1908.23 1761.84 1584.18 1562.58 1257.34
Pro t before Deprecia on, Interest & Tax (PBDIT) 334.95 397.74 376.32 225.07 170.33 157.88 256.99 307.09 178.50 147.39
Pro t before Interest & Tax (PBIT) 255.18 321.66 307.22 158.26 111.21 104.73 206.60 258.53 140.69 117.79
Pro t before Tax (PBT) 147.21 245.10 241.30 129.50 83.02 83.44 195.31 245.63 126.18 105.30
Pro t a er Tax (PAT) 103.96 180.09 169.66 81.21 72.18 56.50 155.78 182.93 98.55 82.49
Earnings Per Share (`)* 5.58 9.69 9.16 4.39 3.91 3.06 8.43 49.50 26.67 22.32
Dividend Per Share (`)* 2.00 3.00 3.00 1.50 1.00 1.00 1.50 23.50 7.00 10.00
Book Value Per Share (`)* 63.28 59.84 53.40 44.21 39.88 38.86 35.49 143.98 121.28 202.39
SOURCES AND APPLICATION OF FUNDS
SOURCES OF FUNDS
Share Capital 37.33 37.26 37.13 36.95 36.95 36.95 36.95 36.95 36.95 18.47
Reserves and Surplus 1144.01 1077.70 954.27 779.95 700.00 681.02 618.90 495.15 411.24 376.83
Net Worth 1181.34 1114.96 991.40 816.90 736.95 717.97 655.85 532.10 448.19 395.30
Share Applica on Money Pending Allotment 0.00 0.03 0.00 0.00 0.00 0.00 0.00 0.00 0.00 0.00
Debt 1301.88 832.41 723.80 705.82 399.76 327.50 206.45 244.30 228.12 215.64
Deferred Tax Liability (Net) 52.29 48.08 51.76 41.31 45.77 42.64 41.83 41.50 32.71 31.79
Total 2535.51 1995.48 1766.96 1564.03 1182.48 1088.11 904.13 817.90 709.02 642.73
APPLICATION OF FUNDS
Gross Fixed Assets 1299.75 1218.32 1105.75 1028.09 964.02 861.91 734.06 626.01 566.43 432.30
Accumulated Deprecia on 668.14 611.81 544.91 500.46 449.87 400.43 369.82 324.44 282.96 206.65
Net Fixed Assets 631.61 606.51 560.84 527.63 514.15 461.48 364.24 301.57 283.47 225.65
Capital Work-In-Progress 159.73 38.42 27.39 42.93 29.68 57.31 105.54 80.49 21.42 13.66
Investments 1444.01 930.15 910.55 749.44 454.35 316.95 190.55 235.86 189.71 204.17
Net Working Capital 300.16 420.40 268.18 244.03 184.30 252.37 243.80 199.98 214.42 177.82
Deferred Revenue Expenditure - - - - - - - - - 21.43
Total 2535.51 1995.48 1766.96 1564.03 1182.48 1088.11 904.13 817.90 709.02 642.73
RATIOS
PBDIT To Sales (%) 9.20 10.85 12.04 9.17 7.70 8.27 14.59 19.38 11.42 11.72
PBIT To Sales (%) 7.01 8.78 9.83 6.45 5.03 5.49 11.73 16.32 9.00 9.37
PBT To Sales (%) 4.04 6.69 7.72 5.28 3.75 4.37 11.09 15.51 8.08 8.37
PAT To Sales (%) 2.85 4.91 5.43 3.31 3.26 2.96 8.84 11.55 6.31 6.56
Interest Cover ( mes) 3.22 5.20 5.71 7.83 6.04 7.42 22.76 23.81 12.30 11.80
ROCE (%) # 10.06 16.12 17.39 10.12 9.40 9.62 22.85 31.61 19.84 18.33
Return on Networth (%) (+) 8.80 16.15 17.11 9.94 9.79 7.87 23.75 34.38 21.99 22.06
Total Debt Equity Ra o (+) 1.10 0.75 0.73 0.86 0.54 0.46 0.31 0.46 0.51 0.58
Long Term Debt Equity Ra o (+) 0.85 0.48 0.47 0.61 0.32 0.24 0.13 0.25 0.29 0.32
Sales/Fixed Assets ( mes) 5.77 6.04 5.57 4.65 4.30 4.14 4.84 5.25 5.51 5.57
Net Working Capital Turnover ( mes) 12.13 8.72 11.66 10.05 12.00 7.56 7.23 7.92 7.29 7.07
# Return on Capital Employed (ROCE) is Pro t before Interest and Tax divided by the Capital Employed as at the end of the year.(+) Ra os have been computed a er adjus ng for Revalua on Reserve & Deferred Revenue Expenditure.* Based on Face Value per Share of `10 each upto 2005-06 and `2 each from 2006-07 (consequent to split of one Equity Share of `10
each into ve Equity Shares of `2 each in 2006-07).

Tube Investments of India Limited | 1
CORPORATE INFORMATION
BOARD OF DIRECTORS M M Murugappan, Chairman
L Ramkumar, Managing Director
C K Sharma
Pradeep Mallick
Pradeep V Bhide
S Sandilya
N Srinivasan
S B Mathur
COMPANY SECRETARY S Suresh
REGISTERED OFFICE ‘Dare House’234 N S C Bose Road, Chennai 600 001
PLANTS Bicycles & E-Scooters:
TI Cycles of India, Amba ur, Chennai
TI Cycles of India, Nashik
TI Cycles of India, NOIDA
Engineering:
Tube Products of India, Avadi, Chennai
Tube Products of India, Shirwal, Satara
Tube Products of India, Mohali
Metal Formed Products:
TIDC India, Amba ur, Chennai
TIDC India, Kazipally, Medak
TIDC India, U arakhand
TI Metal Forming, Nemilicherry, Chennai
TI Metal Forming, Kakkalur, Chennai
TI Metal Forming, Bawal
TI Metal Forming, Halol
TI Metal Forming, Pune
TI Metal Forming, U arakhand
TI Metal Forming, Sanand
AUDITORS Deloi e Haskins & SellsChartered Accountants
BANKERS Bank of America
Standard Chartered Bank
State Bank of India
The Hongkong & Shanghai Banking Corpora on Limited

2 | Tube Investments of India Limited
DIRECTORS’ PROFILE
Mr. M M Murugappan, Chairman
Mr. M M Murugappan (57 years) holds a Masters degree in Chemical Engineering from the University of Michigan, USA. He joined the Board in March, 2002. He is currently the Chairman of Carborundum Universal Limited. He is also on the Board of various companies including Mahindra & Mahindra Limited and Wendt (India) Limited.
Mr. L Ramkumar, Managing Director
Mr. L Ramkumar (57 years) is a Cost Accountant and has a Post Graduate Diploma in Management from Indian Ins tute of Management, Ahmedabad. He joined the Board in February, 2008. He has over 33 years of rich and varied experience in management including 21 years in the Company itself in various capaci es.
Mr. C K Sharma, Non-Execu ve Director
Mr. C K Sharma (65 years) is a Graduate in Chemical Engineering from Indian Ins tute of Technology, Madras and has a Post Graduate diploma in Management from Indian Ins tute of Management, Ahmedabad. Mr. Sharma joined the Board in April, 2012. He has a mix of industry, academic, entrepreneurial and consul ng exposure in India and abroad.
Mr. Pradeep Mallick, Non-Execu ve Director
Mr. Pradeep Mallick (70 years) holds a Bachelors degree in Engineering from Indian Ins tute of Technology, Madras and a diploma in Business Management (UK). He is a fellow of the Ins tu on of Engineering & Technology, London. He joined the Board in June, 2003. He was formerly Managing Director of Wartsila India Limited. He is on the Board of various companies including Blue Star Limited and ESAB India Limited.
Mr. Pradeep V Bhide, Non-Execu ve Director
Mr. Pradeep V Bhide, I.A.S. (Retd.) (63 years) is a Graduate in Science and Law. He also holds a Masters degree in Business Administra on with specialisa on in Financial Management. He joined the Board in October, 2010. In a career spanning 37 years in the Indian Administra ve Service, Mr. Bhide has held senior posi ons at the State and Central levels. He is on the Board of various companies including GlaxoSmithKline Pharmaceu cals Limited, Heidelberg Cement India Limited, NOCIL Limited and L&T Finance Limited.
Mr. S Sandilya, Non-Execu ve Director
Mr. S Sandilya (65 years) is a Commerce Graduate and has a Post Graduate Diploma in Management from Indian Ins tute of Management, Ahmedabad. He joined the Board in January, 2005. He is the Group Chairman, Eicher Group. He is on the Board of various companies including Rane Brake Lining Limited and Parry Sugar Industries Limited.
Mr. N Srinivasan, Non-Execu ve Director
Mr. N Srinivasan (55 years) is a Chartered Accountant and Company Secretary. He joined the Board in January, 2007. He is currently the Vice Chairman of Cholamandalam Investment and Finance Company Limited. He is also on the Board of various companies including Cholamandalam MS General Insurance Company Limited.
Mr. S B Mathur, Non-Execu ve Director
Mr. S B Mathur (68 years) is a Chartered Accountant. He joined the Board in May, 2013. He was formerly the Chairman of the Life Insurance Corpora on of India and the ex-Administrator of the Speci ed Undertaking of the Unit Trust of India. He is currently the Chairman of Na onal Stock Exchange of India Limited. He is also on the Board of various companies including Axis Bank Limited, ITC Limited, UltraTech Cement Limited and Cholamandalam MS General Insurance Company Limited.

Tube Investments of India Limited | 3
MANAGEMENT DISCUSSION AND ANALYSIS
OVERVIEWThe year 2012-13 witnessed uncertainty in the domes c and global economies. Economic condi ons in the US showed signs of improvement early on, but did not sustain in the later part of the year; Europe con nued to be dogged by one crisis a er the other in one or more economies in the European Union; ques ons on the con nued existence of the Euro surfaced and had markets on the edge for a while. With the passage of the crisis and green shoots in some large economies, the prospects of improvement look be er.
India, no longer being insulated from global developments, was impacted by these factors. In addi on, the high rate of in a on, deprecia on of the Rupee, increasing fuel prices, high interest rates, weak monsoons, infrastructure bo lenecks and the lack of any concrete policy moves to address these issues led to a correc on in the growth rate for the country. It is es mated that the economy grew at the rate of 5% in 2012-13. Di ering sectors of the economy performed di erently, with agriculture growing at 1.8%, manufacturing by 1.9% and services by 6.6%. The growth rate in the rst half of the year was be er at 5.4%, but the same could not be sustained in the second half (4.6%).
The Company achieved a turnover of `3,642 Cr., slightly less than the previous year, but its Pro t before Tax and Excep onal Item dropped to `151 Cr., a decline of 38% over the previous year. The performance has to be seen in the backdrop of the economic environment and the key user segment of the Company’s products – the automo ve industry, which saw its toughest year in recent years.
BUSINESS REVIEW
Cycles/Components/Electric ScootersTI’s Presence
The Cycles/Components/Electric Scooters segment of the Company comprises bicycles of the Standard and Special variety including the alloy bikes & specialty performance bikes, bicycle components sold as spares, tness equipment such as motorised tread mills, ellip cal, recumbent bikes etc., and electric scooters.
Industry Scenario
The organised bicycle industry in India is es mated to have dropped by 10% during the year. The bicycles fall under two dis nct categories – Standard and Special. The bicycle is today viewed as a product for fun, tness and leisure ac vi es instead of just being transporta on medium. This has resulted in the product a aining a new and upgraded image. Consequently, the Special segment has registered higher growth rates over the last few years, while the Standard segment has been declining. It is es mated
that the market for Mountain Terrain Bikes, the Sport Light Roadsters and Kids, which cons tute the Special segment also declined, but at half the rate of the overall industry decline.
Higher a uence levels, greater exposure to interna onal usage pa erns and concern for tness have opened up new avenues for high-end bicycles and this segment con nues to grow steadily, year a er year.
The Indian bicycle needs are met by three large players including the Company. Between the three players, close to 85% of the requirements are met and smaller regional players and imports cons tute the balance. The Company enjoys a share of close to one-third of the total market, with a much higher share of the Special and premium segment.
The tness equipment business can be broadly classi ed under two segments; home and commercial. The tness business of the Company is restricted to the home segment. With a high compounded annual growth rate of 18%, the tness equipment industry con nues to be a rac ve. There are four na onal players apart from a slew of importers and regional players.
The electric scooters industry in India is s ll in its infancy. The customer expecta ons of speed and power are not fully met by the current products in the industry, while e orts are being made by all to upgrade performance. The lack of infrastructure support like special lanes, charging sta ons etc., as available in China, as well as withdrawal of subsidies have had a dampening e ect on the prospects for the industry. The industry has seen the exit of all players in the unorganised sector and the lack of enthusiasm is now resul ng in organised players reducing their presence.
Review of Performance
The performance during the year was a ected by the adverse condi ons prevailing in the market. Imposi on of higher excise duty, increase in customs duty and the deprecia on of the Rupee a ected the Company’s compe veness in certain key segments in the Special category. Poor monsoons a ected rural incomes resul ng in a drop in the segments catering to these markets, predominantly the Standard and juvenile segments. The ins tu onal segment, which has been pre y strong over the years, has also been muted this year, with some State Governments reducing their purchase. As a result of all this, the segment recorded a decline of 9.3% in the volume of bicycles sold. The segment con nues to maintain its focus on Special and premium products and enhancing its retail footprint with the addi on of another 192 exclusive outlets during the year. The total number of such outlets today is 637. As a result of this e ort, the Company has been awarded with two interna onal awards for retail excellence.

4 | Tube Investments of India Limited
Aggressive cost reduc on and lower dependence on imports for certain segments have been carried out and it is expected that this will help the Company in the medium to long-term. A ra onalisa on of models, based on consumer interest, was carried out and with a view to elimina ng certain models, a write down in their value has been considered. The overseas subsidiary in China, established with a view to sourcing components, has been shut down and the process of comple ng the formali es rela ng to its liquida on are presently on. Consequently, the Pro t before Interest and Tax declined by 36% over the previous year, and stood at `49 Cr., a er providing for `3.81 Cr. towards diminu on in the value of investment.
During the year, the business has commissioned an aluminum frame manufacturing facility and state-of-the-art bicycle assembly line to cater to requirement of European customers.
Higher income and a greater desire to be healthy and t, drive the growth of the tness industry in India.
Newer models and be er availability of tness products across the exclusive BSA Workout outlets and other outlets helped the Company maintain its turnover from these products.
The electric scooters segment registered lower sales during the year due to the lack of government support to these products, leading to lower consumer interest. Despite the various ini a ves undertaken to improve the product and enhance the a rac veness of the category, me is not yet ripe for these products in India and with a view to conserve resources for other growth areas, the Company has decided not to focus on this product line aggressively.
The measures taken to improve the pro tability are expected to bear fruit in the years to come.
Engineering TI’s Presence
The Engineering segment of the Company consists of cold rolled steel strips and precision steel tubes viz., Cold Drawn Welded tubes (CDW), Electric Resistance Welded tubes (ERW) and Stainless Steel tubes. These products primarily cater to the requirements of the automo ve, boiler, bicycles, general engineering and process industries such as pharmaceu cals and food processing.
Industry Scenario
The automo ve industry in India witnessed a year of slow decline, with the last quarter of the nancial year, tradi onally the strongest, declining the most. High interest rates as a consequence of high in a on, ever increasing fuel prices and higher product price impacted demand across all segments of the industry. The lack of adequate nancing, a key driver for this industry, due to high interest rates
and delinquencies in the por olio, saw volumes dropping despite manufacturers stepping in with o ers. Depressed global markets also meant lower exports, accentua ng the problem. Though the two wheeler and passenger car segments posted low growth rates on an overall basis, the growth came from u lity vehicles and scooters/scootere es, which were on a low base. The commercial vehicle segment declined signi cantly by 17% in the last quarter and 10% over the year. With the increase in excise duty for certain types of vehicles and increase in custom duty on luxury cars, it is expected that demand will be adversely impacted in the current year as well.
The uncertain economic environment in Europe due to the con nuing problems in one or another country and withdrawal of the program for replacement of old cars and high unemployment in many countries impacted business from overseas markets.
The cold rolled steel strips segment is dominated by the integrated steel manufacturers. In this business, the Company con nues to be a “niche player” focusing on the special grades catering to diverse applica ons in various sizes and grades.
Review of Performance
Sale of steel tubes in the domes c market declined by 2% over the previous year and cold rolled steel strips declined by 3% over the previous year. This performance is to be viewed against the background of auto industry performance. In the value added tubes segment, the market share in key products improved during the year. Tubular components con nued to enjoy good patronage from its customers and grew by 6%. The segment focused on improving its e ciencies in a di cult market and reduced the resources used in the business. The newly commissioned stainless steel tubes business contributed `7 Cr. to the top line. This is expected to improve in the current nancial year. Despite the slowdown in the European and American markets, export of tubes remained at the same level as in the previous year. The pro tability of this segment was impacted by increases in power, fuel and freight costs, which could not be passed on to customers in en rety, given the market situa on. The opera ng pro t before interest and tax stood at ̀ 110 Cr., a decline of 16% over the last year. The business con nued to maintain its focus on cost management and modernising its facility, which helped minimise the impact.
As a measure of increasing its product range, the segment is in the process of establishing a facility for manufacture of large diameter tubes. All statutory clearances have been received and construc on is likely to commence shortly.
Predic ons of a good monsoon, reduc on in interest rates and a favourable economic environment are expected to help the business grow in the coming year.

Tube Investments of India Limited | 5
Metal Formed ProductsTI’s Presence
Automo ve and industrial chains, ne blanked products, roll-formed car doorframes and cold rolled formed sec ons for railway wagons & passenger coaches cons tute the Metal Formed Products of the Company.
Industry Scenario
In contrast to the high growth witnessed in the two wheeler segment in the earlier years, the year under review posted only a small growth of 2%. The revival seen in the scooter segment seems to have gained further momentum leading to a growth in this area. The scooter and scootere e segments grew signi cantly at around 14%, but the motorcycle segment, which cons tutes a large chunk of the market, remained sta c. There seems to be a preference for motorcycles with higher power and performance and this segment has seen steady growth. Your Company is one of the three major players manufacturing automo ve chains in India. Lower earnings in rural markets, high in a on leading to high interest cost and the increase in excise duty leading to higher product price led to a dampening of demand for these chains. The replacement market for automo ve chains cons tutes a fair size of the market and con nues to grow. Despite these nega ves, the segment performed creditably. With industrial growth in India declining almost throughout the year, the demand for industrial chains was lower. Di cult condi ons in Europe, the main export market for industrial chains, also did not help. Demand from the overseas subsidiary too was lower due to the same reasons. The Fine Blanking segment which supplies components to the automo ve industry has grown by 12%.
There are currently three established roll-formed car doorframe manufacturers in India. The domes c passenger car segment declined by 7% during the year. Export of passenger cars too declined leading to a lower o -take of doorframes. However, all car manufacturers are con nuing to invest in India, with a view to its use as a sourcing base and hence, opportunity exists to cater to the demand for other metal formed products as well. The business has also been awarded the contract for supplies of doorframes to a leading car manufacturer for a model to be introduced soon. With in a on declining and hopes of interest rates coming down, the sector could see a revival in the near future.
Despite unful lled demand for railway wagons for freight carrying, policy uncertain es and delays have resulted in the ow of orders being erra c, pu ng pressure on the manufacturers. High inventory and low capacity u lisa on plague the industry.
Review of Performance
The sale of automo ve chains to Original Equipment Manufacturers (OEMs) was maintained at the previous
year’s level, despite the adverse market condi ons. The sale of kits, comprising of chain and sprockets, to the replacement market grew by 30% and helped compensate the lower demand from the OEMs. The ne blanked components business grew in volume terms by 33%. This growth came largely from share gain and extension of the product range. The sale of industrial chains, both in the domes c and interna onal markets, was lower due to the fall in demand. The volume of car doorframes sold was lower by 12% due to the muted growth of the industry and the presence of many players in the market o ering customers a variety of cars to choose from. High inventory coupled with lower realisa on due to capacity underu lisa on in the Railway business and lower o -take of doorframes impacted the opera ng pro t of the segment. The net opera ng Pro t Before Interest and Tax stood at `80 Cr., a drop of 29% over the previous year.
FINANCIAL REVIEWPro ts and Pro tability
Declining demand in key user segments, escala on in costs due to low availability of power, increasing fuel prices, higher transporta on costs, a deprecia ng currency, higher borrowing to meet expansion projects and acquisi ons and high interest rates impacted the pro t for the year. Given the depressed economic sen ment, the recovery of input cost increases could not happen fully leading to greater focus on opera ng e ciencies, which helped reduce the impact. As a consequence, the opera ng pro t margin declined.
In di cult mes, all the business segments of the Company maintained their focus on servicing customers, improving e ciencies and reducing resources employed in the business. The opera ng cash generated by the Company amounted to `297 Cr.
Capital Expenditure
With an eye on the future and with the convic on that the downturn is temporary, the expansion plans of the various businesses con nued as planned, purchase of land has been completed and statutory clearances obtained. The project for expansion of capacity for welded tubes has been commissioned, while other expansion projects are in various stages of progress. Apart from the expansion projects, the Company con nues to invest in facili es with a view to servicing its customers in a more mely and e cient manner, modernising its assets and aims to be the best in class. The Company con nues to assess the trends emerging in the industry and the changing requirements of its customers and invest appropriately for the long-term. The Company provides for accelerated deprecia on with respect to some of its assets to re ect the remaining es mated useful life given the dynamic market condi ons.

6 | Tube Investments of India Limited
Interest Cost
In a year when interest rates con nued to remain high, the Company was able to maintain its cost of borrowing at an average rate of 9.4% through a judicious mix of long and short-term funds, both in foreign currency and Indian Rupees. The interest cost for the year was higher due to the higher quantum of borrowings carried out to meet the expansion needs of the Company.
Internal Control Systems
Internal control systems in the organisa on are looked at as the key to its e ec ve func oning. The Internal Audit team periodically evaluates the adequacy and e ec veness of these internal controls, recommends improvements and also reviews adherence to policies, based on which correc ve ac on is taken to address gaps, if any. The Company has a
risk management policy and its internal control systems are an integral part of this policy. The Company has extensive internal control systems to mi gate risks inherent in day-to-day func oning and covers all areas of opera ons. Revenue and capital expenditures are governed by approved budgets and the levels are de ned by the delega on of authority mechanism. Review of capital expenditure is undertaken with reference to bene ts expected in line with the policy for the same. Investment decisions are subject to formal detailed evalua on and approved by the relevant authority as de ned in the delega on of authority mechanism. The Audit Commi ee reviews the plan for internal audit, signi cant internal audit observa ons and func oning of the Company’s Internal Audit department on a periodic basis.
By Order of the Board
L RamkumarChennai Managing Director2nd May, 2013

Tube Investments of India Limited | 7
ENTERPRISE RISK ANALYSIS AND MANAGEMENT
Risk management refers to the formal processes whereby risks associated with the “enterprise”, as a whole, are managed. Risk management encompasses the following sequence:
Iden ca on of risks and risk owners
Evalua on of the risks as to likelihood and consequences
Assessment of op ons for mi ga ng the risks
Priori sing the risk management e orts
Development of risk management plans
Authorisa on for the implementa on of the risk management plans
Implementa on and review of the risk management e orts
Risk management strengthens the robustness of the business. The Company has an established risk assessment and minimisa on procedure. There are normal constraints of me, e ciency and cost.
Some of the risks associated with the business and the related mi ga on plans are discussed hereunder. The risks given below are not exhaus ve and the evalua on of risk is based on management’s percep on.
The Risk Management Commi ee of the Board of Directors, cons tuted speci cally to iden fy/monitor key risks of the Company and evaluate the management of such risks for e ec ve mi ga on, met twice during 2012-13. The Commi ee reviewed the risks and related mi ga on plans across the various Strategic Business Units of the Company.
A. Bicycles
Risk Why considered as Risk Mi ga on Plan/Counter Measure
Product Obsolescence Risk
Availability of alterna vesIncreased a ordability for motorised vehiclesShrinking road space for cycling
Higher variety, especially of premium bikes
Products based on customer need
“Cycling” as a concept – leisure, tness, fun and recrea on
Price Risk High compe on leading to reduc on in prices
Cost compe veness
Development of lower cost models
Consumer insight based new product development and improving quality of aesthe c
Sourcing Risk Dependence on vendor baseConsistent quality and supplies 25% of vendors located in residen al area
Con nuous upgrading of vendor capability
Rela onship building
Imports from quality sources
Relocate vendor base through vendor park at new loca on

8 | Tube Investments of India Limited
B. Engineering
Risk Why considered as Risk Mi ga on Plan/Counter Measure
User Industry Concentra on Risk
Signi cant exposure to auto sectorLag in pass through of input cost changesDemand declining in global markets
Introduc on of new products catering to non-auto users
New products/applica ons to exis ng new customers
Leverage applica on engineering skills for tubular solu ons
Drive opera onal e ciencies vigorously
Cost reduc on through opera onal excellence ini a ves
Technology Obsolescence Risk
Cheaper alterna ves for auto applica ons a ec ng revenue streams
Strategic alliance with educa onal/research ins tu ons
Technology e-up with global major
Imbibing new and relevant technologies
Raw Material Risk
Vola lity in steel priceInconsistency in qualityHigh inventory holding
Alliance with steel producers
Global sourcing
Strategic sourcing
Ra onalisa on and standardisa on of grades
Move to products with higher value addi on
Compe on Risk
Compe on from integrated steel millsNew entrants with nancial strengthImports
Consistent quality and mely delivery
Project range of o ering leveraging all businesses of the Company
Innovate on products, process and applica ons
Leveraging metallurgy skills
Enhancing compe veness
Lock-in with customers

Tube Investments of India Limited | 9
C. Metal Formed Products
Risk Why considered as Risk Mi ga on Plan/Counter Measure
Product Risk Revenues are model speci c Increase in customer base and models
Indigenisa on of equipment
Pursue op ons for other business using the same facili es
Model speci c investments to be made by OEMs
User Industry Concentra on Risk
Dependence on auto sectorImpact of slow down
Diversi ca on into non-auto business
Focus on industrial applica ons
Develop range of power transmission products
Customer Reten on Risk
Availability of alterna ve sourceDisrup on in supplies
Cost compe veness through Opera onal Excellence ini a ves
Leverage design strength
Leverage proximity to customer
Build technology superiority
Product - plant ra onalisa on
Entry of compe on
Low technology barrierImpact on pro t
Leverage posi on with customer as technology leader
Con nuous upgrading of technical speci ca ons
Cost reduc on
Concentra on in focus markets
Entry of interna onally established players in domes c market
Be er product rangeTie-up with local player/end user‘High quality’ image
Enhance product por olio leveraging acquisi on
Leverage leadership and compe ve posi on in industry
Strengthen collabora on with R&D team of customers
Pursue opportuni es in systems/components
Pursue op ons for collabora ng with other mul -na onal player(s) of repute
Sourcing Risk Dependence on few vendors for certain components
Vendor rela onship building
Enhancing vendor base, both locally as well as overseas
Leveraging strength of combined en ty

10 | Tube Investments of India Limited
D. General
Risk Why considered as Risk Mi ga on Plan/Counter Measure
HR Risk Ability to a ract talent, especially people with domain knowledge for new projectsReten on of talent
Corporate Brand Building
Robust recruitment process
Structured induc on and on the job training
Coaching and team building
Individual career and development plan
E ec ve communica on exercises
Con nuous engagement with iden ed talent pool
Deskill opera ons
Internal Control Risk
Mul ple loca ons Review of controls in a structured manner, at de ned frequency
Risk based audit of controls
Currency Risk Foreign currency exposure on exports, imports and borrowings
Early iden ca on and monitoring of exposures
Hedging of exposures based on risk pro le
IT Related Risk Con den ality, integrity and availability Access controls
Secure Network Architecture
Infrastructure Redundancies & Disaster recovery mechanism
Audit of controls
On behalf of the Board
L RamkumarChennai Managing Director2nd May, 2013
Tube Investments of India Limited | 11
Registered O ce‘Dare House’, 234 N S C Bose Road,
Chennai 600 001
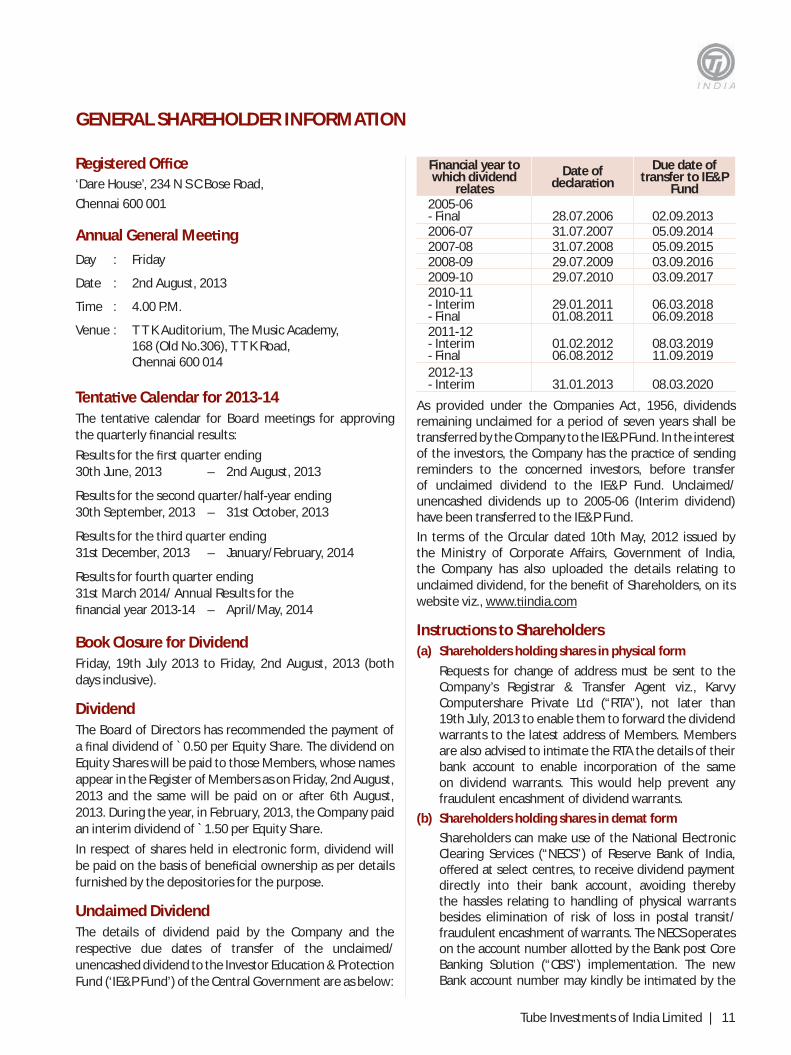
Annual General Mee ng
Day : Friday
Date : 2nd August, 2013
Time : 4.00 P.M.
Venue : T T K Auditorium, The Music Academy, 168 (Old No.306), T T K Road, Chennai 600 014
Tenta ve Calendar for 2013-14The tenta ve calendar for Board mee ngs for approving the quarterly nancial results:
Results for the rst quarter ending 30th June, 2013 – 2nd August, 2013
Results for the second quarter/half-year ending 30th September, 2013 – 31st October, 2013
Results for the third quarter ending 31st December, 2013 – January/February, 2014
Results for fourth quarter ending 31st March 2014/ Annual Results for the nancial year 2013-14 – April/May, 2014
Book Closure for DividendFriday, 19th July 2013 to Friday, 2nd August, 2013 (both days inclusive).
DividendThe Board of Directors has recommended the payment of a nal dividend of `0.50 per Equity Share. The dividend on Equity Shares will be paid to those Members, whose names appear in the Register of Members as on Friday, 2nd August, 2013 and the same will be paid on or a er 6th August, 2013. During the year, in February, 2013, the Company paid an interim dividend of `1.50 per Equity Share.
In respect of shares held in electronic form, dividend will be paid on the basis of bene cial ownership as per details furnished by the depositories for the purpose.
Unclaimed DividendThe details of dividend paid by the Company and the respec ve due dates of transfer of the unclaimed/unencashed dividend to the Investor Educa on & Protec on Fund (‘IE&P Fund’) of the Central Government are as below:
Financial year to which dividend
relatesDate of
declara onDue date of
transfer to IE&P Fund
2005-06 - Final 28.07.2006 02.09.20132006-07 31.07.2007 05.09.20142007-08 31.07.2008 05.09.20152008-09 29.07.2009 03.09.20162009-10 29.07.2010 03.09.20172010-11- Interim- Final
29.01.201101.08.2011
06.03.201806.09.2018
2011-12 - Interim - Final
01.02.201206.08.2012
08.03.201911.09.2019
2012-13- Interim 31.01.2013 08.03.2020
As provided under the Companies Act, 1956, dividends remaining unclaimed for a period of seven years shall be transferred by the Company to the IE&P Fund. In the interest of the investors, the Company has the prac ce of sending reminders to the concerned investors, before transfer of unclaimed dividend to the IE&P Fund. Unclaimed/unencashed dividends up to 2005-06 (Interim dividend) have been transferred to the IE&P Fund.
In terms of the Circular dated 10th May, 2012 issued by the Ministry of Corporate A airs, Government of India, the Company has also uploaded the details rela ng to unclaimed dividend, for the bene t of Shareholders, on its website viz., www. india.com
Instruc ons to Shareholders(a) Shareholders holding shares in physical form
Requests for change of address must be sent to the Company’s Registrar & Transfer Agent viz., Karvy Computershare Private Ltd (“RTA”), not later than 19th July, 2013 to enable them to forward the dividend warrants to the latest address of Members. Members are also advised to in mate the RTA the details of their bank account to enable incorpora on of the same on dividend warrants. This would help prevent any fraudulent encashment of dividend warrants.
(b) Shareholders holding shares in demat form
Shareholders can make use of the Na onal Electronic Clearing Services (“NECS”) of Reserve Bank of India, o ered at select centres, to receive dividend payment directly into their bank account, avoiding thereby the hassles rela ng to handling of physical warrants besides elimina on of risk of loss in postal transit/fraudulent encashment of warrants. The NECS operates on the account number allo ed by the Bank post Core Banking Solu on (“CBS”) implementa on. The new Bank account number may kindly be in mated by the
GENERAL SHAREHOLDER INFORMATION

12 | Tube Investments of India Limited
Shareholder to the Depository Par cipant (in case the shares are held in demat mode) or to the Company’s RTA viz., Karvy Computershare Private Ltd., (in case the shares are held in physical mode) by sending a request le er along with a cancelled cheque, if not already done.
If there is any change in bank account details, Shareholders are requested to advise their Depository Par cipant(s)/Company’s RTA, as the case may be, immediately about the change.
Further, if in case of any change in address, Shareholders are requested to advise their Depository Par cipant(s) immediately about their new address.
Lis ng on Stock Exchanges and Stock CodeEquity SharesNa onal Stock Exchange – TUBEINVEST
Bombay Stock Exchange – 504973
Lis ng fee for the year ended 31st March, 2013 has been paid to the above Stock Exchanges in me.
Market Price Data and ComparisonMonthly high and low price of the Equity Shares of the Company during 2012-13 are as follows:
MonthNa onal Stock Exchange BSE Ltd
High`
Low`
High`
Low`
Apr-12 148.40 130.10 145.05 136.00May-12 156.20 130.10 152.90 130.50Jun-12 148.80 133.90 148.10 134.00Jul-12 171.00 143.65 171.30 141.00Aug-12 164.50 149.60 164.90 148.00Sep-12 174.80 152.20 174.90 152.25Oct-12 183.00 167.60 183.20 167.00Nov-12 176.00 164.00 176.00 162.05Dec-12 221.65 168.00 221.60 166.55Jan-13 209.70 190.00 210.00 192.25Feb-13 201.90 153.60 201.80 154.00Mar-13 191.35 144.15 191.25 145.25
0
50
100
150
200
250
0
5000
10000
15000
20000
25000
Apr-12 May-12 Jun-12 Jul-12 Aug-12 Sep-12 Oct-12 Nov-12 Dec-12 Jan-13 Feb-13 Mar-13
TI S
hare
Pric
e (in
`̀)
BSE
Sen
sex
Apr-12 May-12 Jun-12 Jul-12 Aug-12 Sep-12 Oct-12 Nov-12 Dec-12 Jan-13 Feb-13 Mar-13
BSE Sensex 17319 16219 17430 17236 17430 18763 18505 19340 19427 19895 18862 18836
TI Share Price 139.95 140.4 145.1 163.05 155.6 172.9 173.5 167 198.1 196.4 154.75 163.95
TI Share Price Movement Vs. BSE Sensex
BSE Sensex TI Share Price
Note: Closing BSE Sensex and TI share price on BSE are as on the last trading day of each month during 2012-13

Tube Investments of India Limited | 13
Registrar and Share Transfer AgentKarvy Computershare Private LtdPlot No. 17-24 Vi al Rao NagarMadhapur, Hyderabad 500 081 [email protected] : 040 - 23420818Fax: 040 - 23420814
Share Transfer and Investor Service SystemThe Board has authorised Chairman/Managing Director to approve transfers/transmissions in addi on to the Commi ee of the Board cons tuted for the purpose.
Shareholding Pa ern as on 31st March, 2013Category No. of shares held % of shareholding
A Promoter Group 9,00,85,740 48.26B Non-Promoter Holding 1 Ins tu onal Investors a) Mutual Funds and UTI 1,60,31,183 8.59 b) Banks, Financial Ins tu ons,
Insurance Companies69,51,601 3.72
c) Foreign Ins tu onal Investors 2,46,78,120 13.22 2 Others a) Private Corporate Bodies 1,16,09,836 6.22 b) Indian Public 3,15,05,098 16.87 c) NRI 5,94,270 0.32 d) Bank of New York Mellon
(Depository for GDR holders)52,23,460 2.80
Grand Total 18,66,79,308 100.00
Distribu on of Shareholding as on 31st March, 2013
Category No. of holders % to Total No. of shares % to Total1 - 5000 20,011 90.90 86,29,862 4.62
5001 - 10000 1,113 5.06 39,18,009 2.1010001 - 20000 366 1.66 26,36,255 1.4120001 - 30000 130 0.59 16,07,977 0.8630001 - 40000 75 0.34 13,32,595 0.7140001 - 50000 40 0.18 9,01,792 0.4850001 - 100000 99 0.45 35,06,464 1.88
Above 100000 180 0.82 16,41,46,354 87.94Total 22,014 100.00 18,66,79,308 100.00
Nomina on FacilityThe Shareholders holding shares in physical form may avail of the nomina on facility under Sec on 109A of the Companies Act, 1956. The nomina on form (Form 2B), along with instruc ons, will be provided to the Members on request. In case the Members wish to avail of this facility, they are requested to write to the Company’s RTA viz., Karvy Computershare Pvt Ltd.
Dematerialisa on of SharesThe Equity Shares of the Company are compulsorily traded in dematerialised form. The code number allo ed by the
Na onal Securi es Depository Ltd (NSDL) and Central Depository Services (India) Ltd (CDSL) to Tube Investments of India Ltd is ISIN INE149A01025.
GDR DetailsAs at 31st March, 2013, 52,23,460 Global Depositary Receipts (GDRs) were outstanding represen ng an equal number of underlying Equity Shares. The GDRs stand delisted/withdrawn for trading from Luxembourg Stock Exchange, e ec ve 18th May, 2011.

14 | Tube Investments of India Limited
Means of Communica onThe quarterly/annual results are being published in the leading na onal English newspapers (“The New Indian Express” and “Business Line”) and in one vernacular (Tamil) newspaper (“Dinamani”). The quarterly/annual results are also available on the Company’s website, www. india.com
The Company’s website also displays o cial press releases, shareholding pa ern, compliance report on corporate governance and presenta ons made to analysts and brokers.
Resolu ons passed by Postal BallotIn August, 2012, a Special Resolu on under Sec on 372A of the Companies Act, 1956 for the investment of a sum
not exceeding ̀ 500 Cr. in the Equity Shares of Shanthi Gears Limited, was passed by Postal Ballot. The Shareholders approved the said Special Resolu on with requisite majority.
The vo ng details of the above Postal Ballot were as follows:Number of valid votes 11,31,35,240 votesNumber of votes in favour 11,30,72,110 votesNumber of votes against 63,130 votes
The aforemen oned vo ng under Postal Ballot was conducted by Mr. R Sridharan of Messrs. R Sridharan & Associates, Company Secretaries, as Scru niser, as per the procedure laid down in Sec on 192A of the Companies Act, 1956 read with the Companies (Passing of the Resolu on by Postal Ballot) Rules, 2011.
Details of Special Resolu ons passed during the last three Annual General Mee ngs
Date of AGM
Whether any Special Resolu on
was passedPar culars
29.07.2010 No Not applicable01.08.2011 No Not applicable06.08.2012 Yes (a) Varia on in the terms of the “Tube Investments of India - Employee Stock Op on
Scheme 2007” (ESOP 2007): The Exercise Period of the Op ons under ESOP 2007 was extended to 6 years from the date of vest (from the earlier 3 years) for all ves ng for the original grant made on 24th March, 2008, for which the Exercise Period has not lapsed. For Op ons granted to new joinees and promotees, in respect of the 2nd, 3rd and 4th vests, the Extension Period has been extended to 6 years. Exercise Period of 1st vest will remain at 3 years.
(b) Introduc on of a new Employee Stock Op on Plan 2012 (ESOP 2012) for the bene t of eligible employees of the Company and its subsidiaries through an Employee Welfare Trust to be formed for the purpose.
The Shareholders approved the said Special Resolu ons with requisite majority.
General Body Mee ngThe date, me and venue of the last three Annual General Mee ngs are given below:
Year Date Time Venue2009-10 29.07.2010 4.00 P.M. T T K Auditorium, The Music Academy
T T K Road, Chennai 600 0142010-11 01.08.2011 4.00 P.M. Same as above2011-12 06.08.2012 4.00 P.M. Same as above
Unclaimed Physical SharesIn accordance with Clause 5A of the Lis ng Agreement with the Stock Exchanges, Shareholders under 2,750 folios comprising 27,76,770 Equity Shares were iden ed as not having claimed the new sub-divided share cer cates of the face value of `2 each a er surrender of the old share cer cates of the face value of `10 each. A er four reminders, Shareholders under 386 folios, comprising 5,28,859 shares, have claimed their share cer cates. Shareholders under 2,364 folios, comprising 22,47,911 shares, are s ll in possession of the old share cer cates. Considering the numbers involved, in the interest of the
Shareholders concerned, the Company proposes to send reminder(s), besides exploring the possibility of taking other proac ve measures, as may be appropriate in this regard, before ini a ng transfer of the remaining unclaimed shares to the suspense account. It is clari ed that the shares which may get transferred to this account will be held by the Company purely on behalf of the Shareholders concerned ll such me a claim is made to the Company by the
Shareholder(s), when the shares will be transferred back to the Shareholder(s) concerned from the said account.

Tube Investments of India Limited | 15
Plant Loca onsTI Cycles of India Post Bag No.5Amba ur, Chennai 600 053Tel : (044) - 42093434Fax : (044) - 42093345
TI Cycles of IndiaPlot No. E - 8, MIDCMalegaon, SinnarNashik Dist 422 103Tel : (02551) - 230472Fax : (02551) - 230183
TI Cycles of IndiaA-32, Phase II ExtnHoisery ComplexGautam Budh NagarNOIDA 201 305 Tel : (0120) - 2462201/203Fax : (0120) - 2462397
BSA MotorsPost Bag No.5, Amba urChennai 600 053Tel : (044) - 42093434Fax : (044) - 42292900
Tube Products of IndiaAvadi, Chennai 600 054Tel : (044) - 42291999Fax : (044) - 42291990
Tube Products of IndiaA-16 & 17, Industrial Focal PointPhase VI, SAS NagarMohali (PB) 160 051Tel : (0172) - 4009318Fax : (0172) - 2271375
Tube Products of IndiaShirwal Post, Khandala TalukSatara Dist 412 801Tel : (02169) - 244080-85Fax : (02169) - 244087
TI Metal FormingPlot No.245, Sector 3, Growth CentreBawal, Rewari Dist, Haryana 123 501Tel : (01284) -260707, 264106 09812038561Fax : (01284) - 264426
TI Metal FormingChennai - Tiruvallur High RoadTiruninravur RS PO 602 024Tel : (044) 26390194, 26390437 Fax : (044) 26390634
TI Metal Forming80/81, SIDCO Industrial EstateKakkalur, Thiruvallur 602 003Tel : (044) - 27667104Fax : (044) - 26390634
TI Metal FormingGat No.312, Sablewadi Bahul PostChakan-Shikrapur Road, Khed Taluk Pune 410 501Tel : 09272237117/8
TI Metal FormingKhasra No.222, Gangnouli VillageTehsil - Laksar, HaridwarU arakhand 247 663Tel : 09219401388Fax : (01332) - 259100
TI Metal FormingTata Motors Ltd. Vendors ParkPlot No.C11, Survey No.1North Kotpura, SanandViroch Nagar PostAhmedabad, Gujarat 382 170Tel : 09228021343/09228021179
TI Metal FormingPlot No.501 - B & C,Halol Industrial EstateBlock No. 32 & 34, Village DuniaTk Halol, Dist Pachmahals,Baroda 389 350Tel : (02676) - 224647Fax : (02676) - 224035
TI Metal FormingKhasra No.227, Gangnouli VillageTehsil - Laksar, HaridwarU arakhand 247 663Tel : 09219403539
TIDC IndiaAmba ur, Chennai 600 053Tel : (040) - 42235555Fax : (044) - 42235406
TIDC India Kazipally Village, Plot No.1Jinnaram Mandal,Medak Dist 502 319Tel : (08458) - 277240Fax : (08458) - 277241
TIDC IndiaGanganouli, Laskar 247 663U arakhandTel : (01332) - 271295
CONTACT ADDRESS
COMPLIANCE OFFICER
Mr. S SureshCompany SecretaryTube Investments of India Limited‘Dare House’, 234 N S C Bose Road Chennai 600 001e-mail: sureshs@ i.murugappa.com Tel : (044) – 42286711Fax : (044) – 42110404
For all ma ers rela ng to investor services:
Karvy Computershare Private LimitedPlot No.17-24 Vi al Rao NagarMadhapurHyderabad 500 081 e-mail : [email protected] : (040) – 23420818Fax: (040) – 23420814

16 | Tube Investments of India Limited
Your Company believes that the fundamental objec ve of corporate governance is to enhance the interests of all stakeholders. The Company’s corporate governance prac ces emanate from its commitment towards discipline, accountability, transparency and fairness. Key elements in corporate governance are mely and adequate disclosure, establishment of internal controls and high standards of accoun ng delity, product and service quality.
Your Company also believes that good corporate governance prac ces help to enhance performance and valua on of the Company.
Board of DirectorsThe Board provides leadership, strategic guidance and objec ve judgement on the a airs of the Company. The Board comprises of persons of eminence with excellent professional achievements in their respec ve elds. The independent Directors provide their independent judgement, external perspec ve and objec vity on the issues which are placed before them.
The Board consisted of 7 members, as at 31st March, 2013, with knowledge and experience in di erent elds viz., engineering, manufacturing, nance and business management. Mr. M M Murugappan, Chairman (Promoter, non-execu ve), Mr. L Ramkumar, Managing Director (execu ve), Mr. N Srinivasan, Director (non-execu ve), and Mr. Pradeep V Bhide, Director (non-execu ve) were non-independent Directors; Mr. Pradeep Mallick, Mr. S Sandilya and Mr. C K Sharma were independent Directors. Further, the Board has appointed Mr. S B Mathur as Addi onal Director (independent Director) e ec ve 2nd May, 2013. None of the said Directors are related to each other.
The Commi ees of the Board viz., Audit Commi ee, Compensa on & Nomina on Commi ee, Shareholders’/Investors’ Grievance Commi ee and Risk Management Commi ee have speci c scope and responsibili es.
Your Company has a well-established prac ce with regard to deciding the dates of mee ngs. The annual calendar for the mee ngs of the Board is nalised early on in consulta on with all the Directors. A minimum of 5 Board mee ngs are held each year. Evolving strategy, annual business plans, review of actual performance and course correc on, as deemed t, cons tute the primary business of the Board. The role of the Board also includes de-risking, investment, divestment and business reorganisa on. Ma ers such as capital expenditure, recruitment of senior level personnel, safety & environment, HR related developments, compliance with statutes and foreign exchange exposures are also reviewed by the Board from me to me.
The Company’s commitment to good governance prac ces allows the Board to e ec vely perform these func ons.
The Company ensures that mely and relevant informa on is made available to all the Directors in order to facilitate their e ec ve par cipa on and contribu on during mee ngs and discussions.
There were six mee ngs of the Board during the nancial year 2012–13. The dates of the Board mee ngs, a endance and the number of Directorships/Commi ee memberships held by the Directors as on 31st March, 2013 are given in Table 1 of the annexure to this Report.
Audit Commi eeThe role of the Audit Commi ee, in brief, is to review nancial statements, internal controls, accoun ng policies
and internal audit reports.
The Company has an independent Audit Commi ee with Mr. S Sandilya as the Chairman. All the members of the Commi ee have excellent nancial and accoun ng knowledge. The Chairman, Managing Director and the Heads of Strategic Business Units are invitees to the mee ngs of the Audit Commi ee.
The quarterly nancial results are placed before the Audit Commi ee for its review, sugges ons and recommenda ons, before taking the same to the Board. The statutory audit plans and progress are shared with the Commi ee for its review. The internal audit plans are drawn up in consulta on with the Managing Director, Chief Financial O cer, Heads of Strategic Business Units and the Audit Commi ee. The Commi ee reviews the observa ons of the internal auditors periodically. The Commi ee also provides guidance on compliance with the Accoun ng Standards and accoun ng policies. The statutory and internal auditors a end the Audit Commi ee mee ngs. The Commi ee also tracks the implementa on of its guidelines/sugges ons through review of ac on taken reports.
The Commi ee met four mes during the year ended 31st March, 2013. The composi on of the Audit Commi ee and the a endance of each member at these mee ngs are given in Table 2 of the annexure to this Report.
Remunera on to DirectorsThe success of the organisa on in achieving good performance and governance depends on its ability to a ract quality individuals as execu ve and independent Directors.
The compensa on to the Managing Director comprises a xed component and a performance incen ve. The compensa on is determined based on the level of responsibility and scales prevailing in the industry. The Managing Director is not paid si ng fees for any Board/Commi ee mee ngs a ended by him.
The compensa on to the non-execu ve Directors takes the form of commission on pro ts. Though the shareholders have
REPORT ON CORPORATE GOVERNANCE

Tube Investments of India Limited | 17
approved payment of commission up to one percent of the net pro ts of the Company for each year calculated as per the provisions of Companies Act, 1956, the actual commission paid to the Directors is restricted to a xed sum. The sum is reviewed periodically taking into considera on various factors such as performance of the Company, me devoted by the Directors in a ending to the a airs and business of the Company and the extent of responsibili es cast on the Directors under various laws and other relevant factors. Considering the me and e orts put in by the Chairman towards the a airs of the Company, the Chairman of the Company is being paid a di eren al remunera on from the nancial year 2011-12. The non-execu ve Directors are also
paid si ng fees as permi ed by government regula ons for all Board and Commi ee mee ngs a ended by them.
Compensa on & Nomina on Commi eeThe role of the Compensa on & Nomina on Commi ee is to recommend to the Board the appointment/re-appointment of the execu ve and non-execu ve Directors. The Commi ee has further been vested with the authority to determine the periodic increments in salary and annual incen ve of the Execu ve Directors. The increments and incen ve of the Managing Director are determined on the basis of a balanced score card with its three components viz., Company nancials, Company score card and strategic business unit scores being given appropriate weightage.
In addi on to the above, the Commi ee is also vested with the powers and authority for implementa on, administra on and superintendence of the Employees’ Stock Op on Plan (ESOP)/Scheme(s) and also to formulate the detailed terms and condi ons of the ESOP Schemes.
The members elect one amongst themselves as the Chairman for each mee ng. The Commi ee met four mes during the year ended 31st March, 2013. The composi on of the Commi ee and the a endance of each member at these mee ngs are given in Table 3 of the annexure to this Report.
The details of remunera on paid/payable to the Managing Director and to the non-execu ve Directors, for the nancial year ended 31st March, 2013, are given in Table 4
and Table 5 of the annexure to this Report.
Subsidiary CompaniesCholamandalam MS General Insurance Company Ltd (CMSGICL) is a ‘material non-listed Indian subsidiary company’ in terms of the Lis ng Agreement. Mr. S B Mathur, an independent Director of the Company, is also on the Board of CMSGICL.
The Audit Commi ee reviews the nancial statements and in par cular, the investments made by the unlisted
subsidiary companies. Further, the Board of Directors is apprised of the Business Plan and the half-yearly/annual performance of the unlisted subsidiary companies.
The Minutes of the Board mee ngs as well as the statements of all signi cant transac ons and arrangements of the unlisted subsidiary companies are placed before the Board periodically for its review.
Dissemina on of Informa onYour Company is conscious of the importance of mely and proper dissemina on of adequate informa on. A press release is given along with the publica on of the quarterly/annual results, explaining the business environment and performance. This is being provided to enable the inves ng community to understand the nancial results be er and in a more meaningful manner. The press release includes non- nancial aspects such as development of new products, change in market share, price movement of raw materials and in general, the business condi ons. The quarterly and annual audited nancial results are normally published in the “Business Line” and “The New Indian Express” (English) and in “Dinamani” (Tamil). Press releases are given to all the important dailies. The nancial results, press releases, shareholding pa ern and the presenta ons made to Analysts and Brokers are posted on the Company’s website viz., www. india.com. The Company’s commitment to transparency is re ected in the informa on-rich Annual Report, investors’ meets, periodic press releases and con nuous upda ng of its website.
Investors’ ServiceYour Company promptly a ends to investors’ queries/grievances. In order to provide mely services, the power to approve transfer of shares has been delegated by the Board to the Shares and Debentures Commi ee. The Board has also authorised the Chairman/Managing Director to approve transfers/transmissions. Share transfer requests are processed within 15 days from the date of receipt. Karvy Computershare Private Limited, Hyderabad, is the Company’s share transfer agent and depository registrar.
The Shareholders’/Investors’ Grievance Commi ee was cons tuted to speci cally focus on investor service levels. This Commi ee has prescribed norms for a ending to the investors’ services and the Commi ee periodically reviews the service standard achieved by the Company and its Registrar and Transfer Agent as against the prescribed norms.
Mr. M M Murugappan, a non-execu ve Director, is the Chairman of the Shareholders’/Investors’ Grievance Commi ee. The Commi ee met twice during the year ended 31st March, 2013. The composi on of the Commi ee and

18 | Tube Investments of India Limited
a endance of its members at the mee ngs are given in Table 6 of the annexure to this Report.
No investor complaints were received during the year ended 31st March, 2013. No complaints were pending as at 31st March, 2013.
In order to expedite the redressal of complaints, if any, investors are requested to register their complaints and also to take follow up ac on, as necessary, to the exclusive e-mail id i.e. investorservices@ i.murugappa.com. Mr. S Suresh, Company Secretary is the Compliance O cer.
Members are further welcome to u lise the facility extended by the Registrar & Transfer Agent for quick redressal of investor queries. Kindly visit h p://karisma.karvy.com and click on the ‘Investors’ op on for query registra on through free iden ty registra on process. Investors can submit their query in the ‘Queries’ op on provided in the above website, which would give the grievance registra on number. For accessing the status/response to your query, the same number can be used at the op on “View Reply” a er 24 hours. The investor can con nue to put an addi onal query rela ng to the case ll a sa sfactory reply is received.
Statutory ComplianceThe Company a aches the highest importance to compliance with statutes. Every func on/department of the business is aware of the requirements of various statutes relevant to them. The Company has systems in place to remain updated with the changes in statutes and the means of compliance. An a rma on regarding compliance with the statutes by the Heads of businesses and func ons is placed before the Board on a quarterly basis for its review.
Internal ControlThe Company is conscious of the importance of the internal processes and controls. The Company has a robust business planning & review mechanism and has adequate internal control systems commensurate with the nature of its business, size and geographical spread. These systems are regularly reviewed and improved upon. The Managing Director and the Chief Financial O cer have cer ed to the Board on ma ers rela ng to nancial repor ng and related disclosures, compliance with the relevant statutes, Accoun ng Standards and the adequacy of internal control systems.
Whistle Blower PolicyPursuant to the non-mandatory requirements of the Lis ng Agreement, the Company has established a whistle blower mechanism to provide an avenue to raise concerns. The mechanism also provides for adequate safeguards against any vic misa on of employees who avail of the
mechanism and also for appointment of an Ombudsperson who will deal with the complaints received. The Policy further lays down the process to be followed for dealing with complaints and in excep onal cases, also provides for direct appeal to the Chairman of the Audit Commi ee. It is con rmed that during the year, no employee was denied access to the Audit Commi ee.
Compliance of Corporate Governance NormsThe Company has complied with all the mandatory requirements of corporate governance norms during the nancial year save to the extent that on the re rement
of Mr. R Srinivasan, an independent Director, at the Annual General Mee ng held on 6th August, 2012, the number of independent Directors was reduced to less than y percent of the Board. A er following the process of iden fying and short-lis ng suitable candidates for appointment as Addi onal Director and ascertaining their availability and willingness for the posi on, the Compensa on & Nomina on Commi ee of the Board recommended Mr. S B Mathur, former Chairman of Life Insurance Corpora on of India and ex-Administrator of the Speci ed Undertaking of the Unit Trust of India for co-op on as independent Director. Accordingly, the Board of Directors, at its mee ng held on 2nd May, 2013, on securing his consent, appointed Mr. S B Mathur as Addi onal Director (Independent Director) e ec ve from the said date. In the process, the number of independent directors remained less than y percent for the period between 7th August, 2012 and 1st May, 2013, which is beyond the period of 180 days permi ed for lling the vacancy of independent directors under Clause 49.I.(C).iv of the Lis ng Agreement.
Quarterly nancial results of the Company are published in leading newspapers, uploaded on the Company’s website and any major developments are covered in the press releases issued by the Company and also posted on its website. In view of the same, the nancial results for the half-year ended 30th September, 2012 were not separately sent by post to the shareholders.
In line with its stated policy of being commi ed to the principles and prac ces of good corporate governance, the Company is in compliance with most of the requirements forming part of the voluntary guidelines on Corporate Governance issued by the Ministry of Corporate A airs, Government of India, as reported in the earlier paragraphs. As regards the remaining guidelines, the Company, a er careful evalua on, would strive to implement the same progressively, as appropriate.
The Board of Directors has laid down a Code of Conduct for all the Board members and the senior management of the Company. The Code of Conduct has been posted on the website of the Company. A declara on of a rma on in this regard cer ed by the Managing Director is annexed to this Report.

Tube Investments of India Limited | 19
As stated under the Report on Enterprise Risk Analysis and Management, a Risk Management Commi ee was cons tuted by the Board of Directors in the year 2011 to speci cally iden fy/monitor key risks of the Company and evaluate the management of such risks for e ec ve mi ga on. The Commi ee provides periodical updates to the Board and provides support in the discharge of the Board’s overall responsibility in overseeing the risk management process.
Mr. Pradeep V Bhide, a non-execu ve Director, is the Chairman of the Risk Management Commi ee. The Chairman of the Board and the Heads of Strategic Business Units are invitees to the mee ngs of the Commi ee. The Commi ee met twice during the year ended 31st March, 2013. The composi on of the Commi ee and a endance of its members at the mee ngs are given in Table 7 of the annexure to this Report.
Other DisclosuresA Management Discussion and Analysis Report highligh ng the performance of individual businesses has been included in the Annual Report.
A write up on the risks associated with the business and mi ga on plans therefor is included in the Management Discussion and Analysis, annexed to the Annual Report.
Related party transac ons during the year have been disclosed as a part of the nancial statements as required under the Accoun ng Standard 18 issued by the Ins tute of Chartered Accountants of India.
There have been no instances of non-compliance by the Company or have any penalty or strictures been imposed on the Company by the Stock Exchanges or the Securi es and Exchange Board of India or by any statutory authority on any ma er related to the capital markets during the last three years.
General Shareholder Informa onA separate sec on has been annexed to the Annual Report furnishing various details viz., last three Annual General Mee ngs, its me and venue, share price movement, distribu on of shareholding, loca on of factories, means of communica on etc., for shareholders’ reference.
On behalf of the Board
M M Murugappan Chennai Chairman2nd May, 2013
Declara on on Code of ConductTo
The Members of Tube Investments of India Limited
This is to con rm that the Board has laid down a Code of Conduct for all Board members and Senior Management of the Company. The Code of Conduct has also been posted on the website of the Company.
It is further con rmed that all Directors and Senior Management personnel of the Company have a rmed compliance with the Code of Conduct of the Company for the year ended 31st March, 2013, as envisaged in Clause 49 of the Lis ng Agreement with the Stock Exchanges.
L RamkumarChennai Managing Director2nd May, 2013

20 | Tube Investments of India Limited
ANNEXURE TO THE CORPORATE GOVERNANCE REPORT
(A) Board Mee ng Dates and A endance The Board of Directors met six mes during the nancial year 2012-13. The dates of the Board mee ngs were 30th April,
2012, 13th July, 2012, 6th August, 2012, 2nd November, 2012, 31st January, 2013 and 26th March, 2013.
The a endance of each Director at the mee ngs, the last Annual General Mee ng and number of other Directorships/Commi ee memberships held by them as on 31st March, 2013 are as follows:
TABLE 1
Sl. No.
Name of the Director Board mee ngs a ended (no. of mee ngs
held)
Number of Directorships(a)
- excluding TI (out of which as Chairman)
Number of Commi ee
memberships(b) - excluding TI
(out of which as Chairman)
A endance at last AGM
No. of shares held as on 31st
March, 2013
1. Mr. M M Murugappan 6(6) 11(8) 5(3) Present 13,07,275
2. Mr. L Ramkumar 6(6) 3(1) 1(1) Present 1,80,650
3. Mr. Pradeep Mallick 5(6) 7(2) 9(2) Present -
4. Mr. Pradeep V Bhide 5(6) 7 5(2) Present -
5. Mr. S Sandilya 6(6) 5(2) 6(3) Present -
6. Mr. C K Sharma 4(6) - - Present -
7. Mr. N Srinivasan 6(6) 5 3 Present 64,516
8. Mr. R Srinivasan(c) 2(3) Not applicable Not applicable Present -
9. Mr. S B Mathur(d) Not applicable 13(2) 9(2) Not applicable -
(a) Excludes foreign companies, private limited companies simpliciter, alternate Directorships and companies registered under Sec on 25 of the Companies Act, 1956.
(b) Includes only membership in Audit and Shareholders’/Investors’ Grievance Commi ee.
(c) Mr. R Srinivasan re red at the Annual General Mee ng held on 6th August, 2012.
(d) Mr. S B Mathur was co-opted as an Addi onal Director w.e.f. 2nd May, 2013.
(B) Composi on of Audit Commi ee and A endance The Commi ee met four mes during the nancial year 2012-13. The composi on of the Audit Commi ee and the
a endance of each member at these mee ngs are as follows:
TABLE 2
Name of the Member Number of mee ngs a ended (Number of mee ngs held)
Mr. S Sandilya 4(4)
Mr. Pradeep Mallick 3(4)
Mr. Pradeep V Bhide(a) 2(2)
Mr. R Srinivasan(b) 2(2)
Mr. S B Mathur(c) Not applicable
(a) Mr. Pradeep V Bhide was appointed as a Member with e ect from 7th August, 2012. (b) Mr. R Srinivasan re red on 6th August, 2012. (c) Mr. S B Mathur was appointed as a Member with e ect from 2nd May, 2013.

Tube Investments of India Limited | 21
(C) Composi on of Compensa on & Nomina on Commi ee and A endance The Commi ee met four mes during the nancial year 2012-13. The composi on of the Compensa on & Nomina on
Commi ee and the a endance of each member at these mee ngs are as follows:
TABLE 3
Name of the Member Number of mee ngs a ended (Number of mee ngs held)Mr. S Sandilya 4(4)Mr. M M Murugappan 4(4)Mr. C K Sharma(a) 1(2)Mr. R Srinivasan(b) 2(2)
(a) Mr. C K Sharma was appointed as a Member with e ect from 7th August, 2012. (b) Mr. R Srinivasan re red on 6th August, 2012.
(D) Remunera on of Managing DirectorThe details of remunera on paid/provision made for payment to the Managing Director are as follows:
TABLE 4 (Amount in `)
Name of the Managing Director
Salary Incen ve(a) AllowancePerquisites &
Contribu ons(b) Total
Mr. L Ramkumar 58,73,985 58,89,660 1,05,78,268 25,36,898 2,48,78,811 (a) Provisional and subject to determina on by the Compensa on & Nomina on Commi ee and the same will be paid
a er the adop on of accounts by the Shareholders at the Annual General Mee ng. (b) Managing Director’s remunera on excludes provision for Gratuity since the amount cannot be ascertained
individually.
(E) Remunera on of Non-Execu ve DirectorsThe details of commission provided for/si ng fees paid to non-execu ve Directors for the year ended 31st March, 2013 are as follows:
TABLE 5 (Amount in `)
Name of the Director Commission(a) Si ng fees TotalMr. M M Murugappan 1,00,00,000 1,50,000 1,01,50,000
Mr. Pradeep Mallick 5,00,000 1,20,000 6,20,000Mr. Pradeep V Bhide 5,00,000 1,25,000 6,25,000Mr. S Sandilya 5,00,000 1,90,000 6,90,000Mr. N Srinivasan 5,00,000 1,10,000 6,10,000Mr. C K Sharma (pro rata)(b) 4,60,274 70,000 5,30,274Mr. R Srinivasan (pro rata)(c) 1,75,342 80,000 2,55,342
(a) Provisional and will be paid a er the adop on of accounts by the Shareholders at the Annual General Mee ng. (b) Mr. C K Sharma was appointed as a Director with e ect from 30th April, 2012. (c) Mr. R. Srinivasan re red on 6th August, 2012.
(F) Composi on of Shareholders’/Investors’ Grievance Commi ee and A endance The Commi ee met twice during the nancial year 2012-13. The composi on of the Shareholders’/Investors’ Grievance
Commi ee and the a endance of each member at these mee ngs are as follows:
TABLE 6Name of the Member Number of mee ngs a ended (Number of mee ngs held)
Mr. M M Murugappan 2(2)Mr. L Ramkumar 2(2)Mr. N Srinivasan 2(2)

22 | Tube Investments of India Limited
(G) Composi on of Risk Management Commi ee and A endance The Commi ee met twice during the nancial year 2012-13. The composi on of the Risk Management Commi ee and
the a endance of each member at these mee ngs are as follows:
TABLE 7
Name of the Member Number of mee ngs a ended (Number of mee ngs held)
Mr. Pradeep V Bhide 2(2)
Mr. L Ramkumar 2(2)
On behalf of the Board
M M Murugappan Chennai Chairman2nd May, 2013
CERTIFICATE ON COMPLIANCE OF CORPORATE GOVERNANCEUNDER CLAUSE 49 OF THE LISTING AGREEMENT S
To the Members of Tube Investments of India Limited
1. We have examined the compliance of condi ons of Corporate Governance by Tube Investments of India Limited (the “Company”) for the year ended 31st March, 2013 as s pulated in Clause 49 of the Lis ng Agreement of the said Company with Stock Exchanges.
2. The compliance of condi ons of Corporate Governance is the responsibility of the Management. Our examina on was limited to procedures and implementa on thereof, adopted by the Company for ensuring the compliance of the condi ons of Corporate Governance. It is neither an audit nor an expression of opinion on the nancial statements of the Company.
3. On re rement of an independent Director on 6th August 2012 from the Company’s Board of Directors (“the Board”), the number of independent directors out of the total of 7 Directors in the Board got reduced to less than 50% of the Board. The Board of Directors has appointed another Director as independent Director with e ect from 2nd May 2013. Hence, the number of independent Directors remained less than 50% for the period from 7th August 2012 to 1st May 2013, which is beyond the period of 180 days permi ed for lling up vacancies in the o ce of independent Directors under Clause 49.I.(C).iv of the Lis ng Agreement.
4. In our opinion and to the best of our informa on and according to the explana ons given to us, and subject to our observa on in paragraph 3 above, we cer fy that the Company has complied with the condi ons of Corporate Governance as s pulated in the above men oned Lis ng Agreement.
5. We further state that such compliance is neither an assurance as to the future viability of the Company nor the e ciency or e ec veness with which the Management has conducted the a airs of the Company.
For Deloi e Haskins & Sells Chartered Accountants (Firm Registra on No:008072S)
M K Ananthanarayanan PartnerChennai (Membership No.19521)2nd May, 2013

Tube Investments of India Limited | 23
DIRECTORS’ REPORT
Dear Sha hold s,The Board of Directors is pleased to present the performance of your Company for the year ended 31st March, 2013.
Financial Highlights ` in Crores2012-13 2011-12
Sale of Products - Gross 3642.25 3664.77
Less: Excise duty on sales 251.88 200.35
Sales of Products - Net 3390.37 3464.42
Earnings Before Finance Costs, Tax, Deprecia on and Amor sa on Expense
334.95 397.74
Less: Finance Costs 104.16 76.56
Deprecia on and Amor sa on Expense 79.77 76.08
Earnings Before Tax and Excep onal Item 151.02 245.10
Less: Provision for Diminu on in value of Investments 3.81 -
Pro t Before Tax 147.21 245.10
Less: Tax Expense 43.25 65.01
Pro t A er Tax 103.96 180.09
Add: Surplus at the beginning of the year 279.70 392.70
Less: Final dividend including tax on dividend 0.00 0.02
Add: Earlier year’s provision for dividend tax no longer required 1.17 1.76
Pro t Available for Appropria on 384.83 574.53
Less: Transfer to General Reserve 100.00 200.00
Transfer to Debenture Redemp on Reserve 84.27 31.66
Interim Dividend @ `1.50 (previous year `2) per Equity Share of `2 each 27.99 37.24
Final Dividend Proposed @ `0.50 (previous year `1) per Equity Share of `2 each 9.33 18.63
Dividend Distribu on Tax - Current year 3.20 7.30
Balance carried to Balance Sheet 160.04 279.70
Review of PerformanceYour Company achieved a turnover of `3,642 Cr. during 2012-13 (previous year `3,665 Cr.). This performance has to be viewed in the context of the current economic environment. Your Company is largely dependent on the auto industry, with the excep on of the Bicycle segment. In view of the economic slowdown, the auto industry as well as the bicycles industry did not fare well during the year, which impacted your Company’s performance. Earnings before Finance Costs, Tax, Deprecia on and Amor sa on Expenses were at `335 Cr. during the year as against `398 Cr. in 2011-12, a decline of 16%. Finance costs was high at `104 Cr. as against `77 Cr. in 2011-12 due to the increased borrowings resorted to meet the Company’s expansion programmes. Pro t Before Tax was `147 Cr. for the year 2012-13 as against `245 Cr. in the previous year.
The Bicycle division recorded a turnover of `1,255 Cr. in 2012-13 as against `1,285 Cr. in the previous year. This segment witnessed steep increase in the customs and excise levies. Lower disposable income in the rural areas
a ected the demand for Standard bicycles. Higher input costs, together with the increase in the statutory levies, resulted in the higher price of bicycles for the end consumer, a ec ng the demand in Specials segment as well. As part of its growth strategy, your Company con nues to invest in the expansion of retail outlets to improve its reach and the buying experience. The business has established a manufacturing and assembly line for high-end bicycles, to cater to the export market. The division con nues to focus on promo ng cycling. Your Company has reduced its dependence on imports in select product lines and has plans to introduce many new models in the coming years to meet customer aspira ons.
As regards electric scooters, lack of infrastructure support and the withdrawal of subsidies by the Government have a ected the consumer’s preference for this product. In this scenario, prospects for the growth of this product are not expected to improve in the near term.
The division has reported a pro t before interest and tax of `49 Cr. in 2012-13 as against `76 Cr. in the previous year, registering a decline of 36%.

24 | Tube Investments of India Limited
The Engineering division recorded a turnover of `1,467 Cr. in 2012-13 as against `1,449 Cr. in the previous year. With the bulk of its revenue coming from the auto sector, the performance of this business was impacted during the year due to decline in demand for motor cycles and commercial vehicles. Margin was a ected due to the increase in power & fuel cost and the inability to pass on the same in en rety. The tubular component business con nued to enjoy good patronage from its user segments and grew by 6%. Your Company commissioned a stainless steel tube manufacturing facility in the previous year and is working with user industries for product acceptance. Export turnover of the division was at previous year’s levels despite the market slowdown witnessed in Europe and the United States of America. E orts are underway to enhance the product por olio of the division through the manufacture of large diameter Cold Drawn Welded tubes (CDW), which nds applica on in non-auto industries. Towards this, a green eld facility is under establishment and it is expected to start commercial produc on in the rst quarter of 2014-15.
The division has reported a net opera ng pro t before interest and tax of ̀ 110 Cr. as against ̀ 131 Cr. in the previous year. Improving internal e ciencies and aggressive cost management helped to limit the impact of the drop in volume and steep increase in costs.
The Metal Formed Products segment of the Company registered a turnover of `795 Cr. in 2012-13, as against `860 Cr. in the previous year. Stagna on in demand from the motorcycle segment a ected the sale of drive chains to OEMs. To counter this, your Company focussed on the replacement market, which facilitated good growth in volumes for the division. Consistent with the decline in the key industry user segments like cement, material handling and infrastructure, o -take of industrial chains was not encouraging. Uncertain condi ons and low economic ac vity in the European markets further impacted the export of industrial chains. Your Company con nues to invest in equipment to manufacture ne blanked products as there is a good opportunity for growth in the domes c and export markets. Sale of ne blanked products grew by 33% in 2012-13 over the previous year. Passenger cars designed with roll-formed doorframes did not grow during the year, resul ng in a drop in the volume of doorframes sold. The existence of a large underu lised capacity in cold rolled sec ons for railway wagons a ected the top line and margin.
Net opera ng pro t before interest and tax for this segment was at `80 Cr., represen ng a decline of 29%.
Management Discussion and AnalysisThe Management Discussion and Analysis Report, which forms part of this Annual Report, sets out an analysis of the individual businesses including the industry scenario, performance, nancial analysis, investments and risk mi ga on.
DividendThe Board of Directors has recommended a nal dividend of `0.50 per share, on Equity Share of face value of `2 each, for the nancial year ended 31st March, 2013. Together with the interim dividend of `1.50 per share, paid on 22nd February, 2013, the total dividend for the year works out to `2 per share on Equity Share of face value of `2 each. Final dividend, if approved by shareholders, will be paid on or a er 6th August, 2013.
Subsidiary CompaniesCholamandalam Investment and Finance Co Ltd (CIFCL)It was another year of good performance for CIFCL. Riding on the back of sustained performance by its vehicle nance and home equity ver cals, aggregate disbursements of CIFCL improved to `12,118 Cr. in 2012-13 (previous year: `8,889 Cr.), pro t before tax grew 56%, at ̀ 451 Cr. (`290 Cr.) and pro t a er tax increased by 77% to `307 Cr., (`173 Cr.). In order to meet the projected growth in its loan disbursements and to augment the capital adequacy ra o, CIFCL came out with a Quali ed Ins tu onal Placement of Equity Shares to Quali ed Ins tu onal Buyers (QIBs). CIFCL issued 1.05 Cr. Equity Shares of face value of `10 each, on private placement, at a premium of `275 per share, aggrega ng `300 Cr. to QIBs. The Company’s present shareholding in CIFCL is 50.47%.
Cholamandalam MS General Insurance Co Ltd (CMSGICL)CMSGICL, a joint venture with Mitsui Sumitomo Insurance Company Ltd, Japan, achieved a Gross Wri en Premium (including reinsurance acceptance) of `1,652 Cr. during 2012-13 (previous year `1,506 Cr.), registering a growth of 10%. Comple ng its rst decade of business opera ons, CMSGICL registered a pro t before tax of `88 Cr. in 2012-13 (previous year `16 Cr.). During 2012-13, to augment its solvency posi on and support the business plan, CMSGICL came out with a rights issue of shares of `50 Cr. Your Company’s subscrip on was `37 Cr.
Shanthi Gears Ltd (SGL)Pursuant to the Share Purchase Agreement dated 13th July, 2012 with the erstwhile promoters of SGL and the consequent mandatory Open O er made to the public shareholders of SGL under the SEBI Takeover Regula ons, your Company acquired 5,72,96,413 Equity Shares (70.12%) of SGL, during 2012-13, for an aggregate considera on of about `464 Cr. SGL became a subsidiary of the Company e ec ve 19th November, 2012.SGL designs, manufactures and supplies various kinds of industrial gears and gearboxes catering to a wide variety of applica ons across industries. Over the last four decades, SGL has built a very strong brand through the supply of high

Tube Investments of India Limited | 25
quality products, e cient service and mee ng customer expecta ons, both in India and overseas. Your Company considers the acquisi on of SGL as a strategic t, which will yield immense bene ts in the years to come.SGL recorded a turnover of `161 Cr. in 2012-13 against `187 Cr. in the previous year. Pro t before tax was `22 Cr. (previous year `42 Cr.)
Financière C10 SAS (FC10)FC10, in which the Company earlier held 77.13% of the share capital, became a wholly-owned subsidiary e ec ve 17th December, 2012, consequent to the Company acquiring the balance 22.87% of the share capital from the remaining shareholders, at an investment of `16.55 Cr. FC10, the holding company of Sedis SAS, France, Societe De Commercialisa on De Composants Industriels, France and Sedis Company Ltd., UK recorded a consolidated turnover of ¤33.3 M in 2012 (previous year ¤33.3 M). Its pro t before tax was ¤0.31 M (¤1.05 M).
TICI Motors (Wuxi) Co Ltd (TICI Motors)Considering the accumulated losses and the prevailing business condi ons, your Company has decided to voluntarily liquidate TICI Motors, the wholly-owned Chinese subsidiary, established for manufacturing electric scooter CKD kits for sale in the Indian market. A sum of `3.81 Cr. has been provided in the books of account for the year towards diminu on in value of the investment.
The Statement pursuant to Sec on 212 of the Companies Act, 1956 containing details of the Company’s subsidiaries is a ached.The Consolidated Financial Statements of the Company and its subsidiaries, prepared in accordance with the Accoun ng Standard (AS) 21, form part of the Annual Report.
DirectorsMr. N Srinivasan will re re by rota on at the ensuing Annual General Mee ng and is eligible for re-appointment.Mr. S B Mathur was appointed as an Addi onal Director with e ect from 2nd May, 2013 and a resolu on under Sec on 257 of the Companies Act, 1956 for his appointment is being placed before the shareholders at the ensuing Annual General Mee ng for approval.Mr. L Ramkumar was re-appointed by the Board of Directors, at the mee ng held on 31st January, 2013, as Managing Director of the Company, for a fresh term, from 1st February, 2013 to 8th April, 2016 (both days inclusive). Necessary resolu on for the re-appointment of Mr. L Ramkumar, payment of remunera on and other terms thereof form part of the No ce of the ensuing Annual General Mee ng for shareholders’ approval.
Corporate GovernanceYour Company is commi ed to maintaining high standards of corporate governance. A report on corporate governance, along with a cer cate from the Statutory Auditors on
compliance with corporate governance norms forms part of this Annual Report.
Human ResourcesThe HR strategy of your Company is to support and drive business deliverables by leveraging the people resources in the organisa on. To this end, HR programs of the Company focus on both strategic and opera onal priori es of the business.
A comprehensive study of shop oor opera ons was taken up at some of the units to facilitate produc vity improvements through a desirable manpower mix, elimina on of non-value added ac vi es, layout changes etc. Also, a pilot study on organisa on design & structure was conducted at one of the businesses to iden fy and recommend op mal manning and levels required for various func ons. With the objec ve of building the capabili es of sales workforce across all its businesses, a new program was ini ated in associa on with an interna onal rm. This ini a ve is expected to help in improving the sales force produc vity and also in retaining customers. Special e orts are being taken to improve the technical capabili es of shop oor operators through customised training programs by reputed ins tu ons and technical experts. Focus is also being laid on a Career Development Program wherein competency gaps of individual employees are being iden ed and based on these gaps, Individual Development Plans (IDPs) are being drawn up and development inputs provided based on the IDPs.
Long-term se lements were concluded with the labour unions at four manufacturing units during 2012-13. Your Company also took various ini a ves to strengthen the safety, statutory compliance and security related areas.
The Company had 3,443 permanent employees on its rolls, as on 31st March, 2013.
Employees’ Stock Op on SchemeDetails of the Employees’ Stock Op on Scheme as required under the relevant SEBI Guidelines are annexed to this Report.
The introduc on of a new ESOP Scheme (ESOP 2012), which was approved by the Members at the last Annual General Mee ng held on 6th August, 2012, stands withdrawn, without implementa on, as the market regulator pronounced its view that such schemes providing for acquisi on of securi es from secondary market are outside the purview of the relevant regula ons.
Social CommitmentAs a corporate ci zen, your Company is commi ed to the conduct of its business with a strong sense of social responsibility. Every year, the Company has been contribu ng a small por on of its pro ts for the promo on of worthy causes like educa on, healthcare, scien c research etc. This year too, a sum of `1.26 Cr. was contributed to various organisa ons engaged in the aforesaid elds and to others.

26 | Tube Investments of India Limited
AuditorsMessrs. Deloi e Haskins & Sells, Chartered Accountants and Statutory Auditors of the Company re re at the conclusion of the ensuing Annual General Mee ng and being eligible, o er themselves for re-appointment.
Mr. V Kalyanaraman has been appointed as the Cost Auditor for audi ng the cost accoun ng records maintained by the Company of E-Scooters, Pedelec (ba ery powered bicycles), Steel Products and Metal Formed Products for the nancial year ending 31st March, 2013. The Cost Audit Reports rela ng to the above products will be led within the s pulated period of 180 days from the close of the nancial year.
In respect of the previous year, 2011-12, the Cost Audit and Compilance Reports rela ng to Cycles, Steel Products and Metal Formed Products, audited by Mr. V. Kalyanaraman, Cost Auditor, were led electronically in XBRL mode, on
7th January, 2013 viz., well within the limit of 28th February, 2013 s pulated by the Cost Audit Branch, Ministry of Corporate A airs, Government of India.
The other informa on required to be furnished in the Directors’ Report under the provisions of Sec on 217 of the Companies Act, 1956 rela ng to conserva on of energy, technology absorp on, foreign exchange earnings and outgo, par culars of employees and Directors’ Responsibility Statement are annexed and form part of this Report.
The Directors thank all Customers, Vendors, Financial Ins tu ons, Banks, State Governments and Investors for their con nued support to your Company’s performance and growth. The Directors also wish to place on record their apprecia on of the contribu on made by all the employees of the Company resul ng in the good performance during the year under review.
On behalf of the Board
M M Murugappan Chennai Chairman2nd May, 2013
ANNEXURE TO THE DIRECTORS’ REPORT
Directors’ Responsibility Statement(Pursuant to Sec on 217(2AA) of the Companies Act, 1956)
Pursuant to Sec on 217(2AA) of the Companies Act, 1956, the Directors to the best of their knowledge and belief con rm that:
in the prepara on of the Statement of Pro t and Loss for the nancial year ended 31st March, 2013 and the Balance Sheet as at that date (“ nancial statements”), applicable Accoun ng Standards have been followed.
appropriate accoun ng policies have been selected and applied consistently and such judgments and es mates that are reasonable and prudent have been made so as to give a true and fair view of the state of a airs of the Company as at the end of the nancial year and of the pro t of the Company for that period.
proper and su cient care has been taken for the maintenance of adequate accoun ng records in accordance with the provisions of the Companies Act, 1956 for safeguarding the assets of the Company and for preven ng and detec ng fraud and other irregulari es. To ensure this, the Company has established internal control systems consistent with its size and nature of opera ons. In weighing the assurance provided by any such system of internal controls, its inherent limita ons should be recognised. These systems are reviewed and updated on an ongoing basis. Periodic internal audits are conducted to provide reasonable assurance of compliance with these systems. The Audit Commi ee meets at regular intervals to review the internal audit func on.
the nancial statements have been prepared on a going concern basis.
the nancial statements have been audited by Messrs. Deloi e Haskins & Sells, Statutory Auditors and their report is appended thereto.
On behalf of the Board
M M Murugappan Chennai Chairman2nd May, 2013

Tube Investments of India Limited | 27
ANNEXURE TO THE DIRECTORS’ REPORT
Informa on under Sec on 217(1)(e) of the Companies Act, 1956 read with Companies (Disclosure of Par culars in the Report of Board of Directors) Rules, 1988 and forming part of the Directors’ Report:
Power & Fuel Consump on
2012-13 2011-12
1 Electricity
(a) Purchased
Units (kWh) 4,61,20,794 3,89,98,679
Total amount (` Cr.) 38.25 29.64
Rate/unit (`) 8.29 7.60
(b) Own Genera on through Diesel Generator
Unit (kWh) 30,27,342 32,41,207
Units per Litre of Diesel Oil (kWh) 2.93 2.91
Cost per unit (`) 15.69 14.50
(c) Own Genera on through Furnace Oil Generator
Units (kWh) 1,91,37,784 1,89,18,094
Units per litre of Furnace Oil (kWh) 3.89 3.91
Cost per unit (`) 9.91 9.04
(d) Own genera on through Windmills (units) 3,35,565 3,61,022
2 Furnace Oil
Quan ty (kilo litres) 4,924 4,836
Total amount (` Cr.) 18.96 17.09
Average rate/kilo litre (`) 38,512 35,350
Consump on per unit of produc on (kWh per ton)
A. Strips & Tubes 237 203
B. Metal Form 240 273
Conserva on of EnergyYour Company is commi ed to the conserva on of energy and pursues various measures in this regard. Some of these measures have been highlighted hereunder.
In the Bicycles business, the energy saving measures include installa on of fuel e cient and heat-retaining ovens, modi ca on to electrical line feeders to increase load factor and improving the e ciency of the Diesel Generator set by installing re-condi oned engines.
In Metal Formed Products business, measures undertaken include installa on of auto switch-o arrangement in equipment motors to save on energy when the work is not performed and modi ca ons to equipment motors to improve e ciency. The other measures include brick lining of furnaces to improve insula on level thereby reducing skin temperature and heat radia on loss. Steps were also taken to op mise the u lisa on of furnaces and vacuum grease tanks to reduce idle me.
In Engineering business, tube annealed furnaces were changed to operate with either kerosene or diesel, providing exibility of usage of either fuel, based on cost. Some of
the other signi cant ini a ves include reduc on of motor capacity in LDC hot water circula on pump, op misa on of fuel and air ow by installing ori ce to save on fuel consump on and doing away with the conven onal way of adjus ng air-fuel ra o. The business also saved on energy by interlocking the auxiliaries with the opera on whereby the motors are switched o automa cally when not in use.
Research and Development (R&D)Being a sponsor-member of the Nano Func onal Materials Research Center at Indian Ins tute of Technology, Madras, your Company has iden ed opportuni es for process and product improvement in areas related to tool and product wear life. Related performance tes ng is in progress to assess the impact. Further research work on nano technology will con nue for iden fying other opportuni es.

28 | Tube Investments of India Limited
Leveraging membership with the Advanced Steel Processing & Products Research Center at Colorado School of Mines, USA, a research team from your Company has developed a new family of ne grained high strength steels for structural-automo ve applica ons. Your Company has also leveraged its newly acquired knowledge of stainless steels in securing the rst product approvals for its stainless steel tubes from reputed customers.
Your Company con nues to enjoy the con dence of OEM customers. Several Value Analysis and Value Engineering projects have been successfully converted into business with leading equipment manufacturers.
Expenditure on R & D ` in Crores
Capital expenditure 3.63
Recurring 11.98
Total 15.61
Total R&D expenditure as a % of total turnover
0.46%
Technology Absorp on, Adapta on and Innova on A prototype laboratory has been set up at the Corporate Technology Center of your Company to incubate and develop new products and processes. This facility aims at leveraging the ability to develop new products/processes o ine un l they are mature enough to be commercially deployed. It also showcases new technologies to poten al customers. Advanced thermal processing for high performance sheet metal components and robo c heat treatment of tubular sec ons are among some of the projects being pursued.
A Special Purpose Machinery team has been created at the Corporate Technology Center of your Company. In the long run, customised designs and in-house machine building capabili es are expected to lower capital investment costs besides aid in retaining competencies related to core technologies.
Foreign Exchange Earnings and Outgo` in Crores
i) Foreign exchange earnings (CIF Value) 200.17ii) Foreign exchange outgo 464.13
On behalf of the Board
M M Murugappan Chennai Chairman2nd May, 2013

Tube Investments of India Limited | 29
ANNEXURE TO THE DIRECTORS’ REPORT
Employees’ Stock Op on Scheme
Nature of Disclosure Par culars(a) Op ons granted 46,76,940 Op ons have been granted so far in ten tranches
i.e. on 31st October, 2007, 31st January, 2008, 24th March, 2008, 31st July, 2008, 31st October, 2008, 30th January, 2009, 29th January, 2011, 2nd May, 2011, 1st August, 2011 and 2nd November, 2011. Each Op on would be exercisable for one Equity Share of a face value of `2 each, fully paid up, on payment of the requisite exercise price to the Company.
(b) Pricing formula The Op ons were granted at an exercise price equal to the latest available closing price of the Equity Shares on the stock exchange where there was highest trading volume prior to the date of grant of Op ons by the Compensa on and Nomina on Commi ee.
(c) Op ons vested 26,89,734
(d) Op ons exercised 18,99,308
(e) Total number of shares arising as a result of exercise of Op on 18,99,308
(f) Op ons lapsed/cancelled 15,93,416
(g) Varia on of terms of Op on Exercise Period of the Op ons extended to 6 years from the date of vest (from the earlier 3 years) for all ves ng for the original grant made on 24th March, 2008, for which the Exercise Period has not lapsed. For Op ons granted to new joinees and promotees, in respect of the 2nd, 3rd and 4th vests, the Extension Period has been extended to 6 years. Exercise Period of 1st vest will remain at 3 years. The aforemen oned varia on was approved by the Shareholders at the Annual General Mee ng held on 6th August, 2012.
(h) Money realised by exercise of Op ons `10,87,72,130
(i) Total number of Op ons in force 11,84,216
(j) i. Details of Op ons granted to Senior Management Personnel
Name and Designa on Messrs.
No. of Op ons granted
L RamkumarManaging Director 3,10,260
D RaghuramPresident – TICI 1,27,760
P RamachandranPresident – TIDC 71,800
R NatarajanSr. Vice President – CTC 89,760
N PrasadSr. Vice President – HR 69,000
K R SrinivasanSr. Vice President – TIMF 53,280

30 | Tube Investments of India Limited
Nature of Disclosure Par cularsii. Any other employee who received a grant in
any one year of Op ons amoun ng to 5% or more of Op ons granted during the year
Name of the Employees Messrs.
No. of Op ons granted during 2008-09
Shanmugam N 30,600
Sairam S 30,600
Babu G 30,600
Senthilvel K 38,200
Mohan Kalyanaraman 30,600
Krishnamurthy 30,600
Ravikumar D 30,600
Subrahmanya U 38,200
Jayaraman B 30,600
Manoj Kotwani 30,600
Augus ne Jus ne 27,000
Sharad K Sharda 27,000
Ravichannthar S R 28,100
Name of the Employees Messrs.
No. of Op ons granted during 2010-11
K K Paul 86,200
Siladitya Chaudhuri 38,000
Name of the Employees Messrs.
No. of Op ons granted during 2011-12
Subratasen Sarma 30,400
Krishna Srinivas 24,600
Pandian P M 33,600
Deo a K Tembhekar 30,800
U Rajagopal 24,900
P Ramachandran 40,300
iii. Employees who were granted Op ons, during any one year, equal to or exceeding 1% of the issued capital of the Company at the me of grant
None
(k) Diluted Earnings Per Share (EPS) pursuant to issue of shares on exercise of Op on calculated in accordance with Accoun ng Standard AS-20
`5.56
(l) i. Di erence between the compensa on cost using the intrinsic value of the Stock Op ons (which is the method of accoun ng used by the Company) and the compensa on cost that would have been recognised in the accounts if the fair value of Op ons had been used as the method of accoun ng
The employee compensa on cost for the year would have been higher by `5.17 Cr. had the Company used the fair value of Op ons as the method of accoun ng instead of the intrinsic value.
ii. Impact of the di erence men oned in (i) above on the pro ts of the Company
The pro t before tax for the year would have been lower by `5.17 Cr. had the Company used the fair value of Op ons as the method of accoun ng instead of the intrinsic value.

Tube Investments of India Limited | 31
Nature of Disclosure Par cularsiii. Impact of the di erence men oned in (i)
above on the EPS of the CompanyThe basic and diluted EPS would have been lower by `0.19
(m) i. Weighted Average exercise price of Op ons granted
`71.54
ii. Weighted average fair value of Op ons Granted
`87.92
(n) i. Method used to es mate the fair value of Op ons
ii. Signi cant assump ons used (weighted average informa on rela ng to all grants):-
(a) Risk-free interest rate(b) Expected life of the Op on
(c) Expected vola lity (d) Expected dividend yields (e) Price of the underlying share in market at
the me of Op on grant
Black-Scholes Op ons Pricing Model
8.01%2.51 years35.88%2.10%
`71.54
On behalf of the Board
M M Murugappan Chennai Chairman2nd May, 2013

32 | Tube Investments of India Limited
AN
NEX
URE
TO
TH
E D
IREC
TOR
S’ R
EPO
RT
Info
rma
on
unde
r Se
c o
n 21
7(2A
) of t
he C
ompa
nies
Act
, 195
6 re
ad w
ith t
he C
ompa
nies
(Par
cul
ars
of E
mpl
oyee
s) R
ules
, 197
5 an
d fo
rmin
g pa
rt o
f the
Dire
ctor
s’
Repo
rt fo
r th
e ye
ar e
nded
31s
t Mar
ch, 2
013:
Nam
eD
esig
na o
nG
ross
Re
mun
era
on
(`)
Qua
li c
a o
n &
Ex
peri
ence
(yea
rs in
br
acke
ts)
Dat
e of
Co
mm
ence
men
t of
Empl
oym
ent
Age
Last
Em
ploy
erLa
st D
esig
na o
n
Paul
K K
Pres
iden
t - T
ube
Prod
ucts
of
Indi
a85
,20,
681
B.Sc
. (H
ons)
, M
BA-M
arke
ng
(33)
0
7.12
.200
9 56
Nitc
o Lt
d Ch
ief O
pera
ng
O c
er
Ram
acha
ndra
n P
Pres
iden
t - T
IDC
Indi
a87
,35,
841
B.Te
ch, P
GD
M (3
0)23
.11.
1989
54As
ian
Pain
ts L
tdBr
anch
Man
ager
Ragh
uram
DPr
esid
ent -
TI C
ycle
s &
BS
A M
otor
s96
,70,
451
B.Te
ch, M
S &
Ph
.D. i
n M
ech
Engg
(24)
12.0
2.20
0445
EMEA
i2
Tech
nolo
gies
D
irect
or (C
usto
mer
Su
ppor
t & S
ervi
ces)
Nat
araj
an R
Sr. V
ice
Pres
iden
t (C
orpo
rate
Tec
hnol
ogy
Cent
re)
65,6
0,19
4 B.
Tech
(32)
01.0
7.19
8154
--
Srin
ivas
an K
RSr
. Vic
e Pr
esid
ent -
TIM
F61
,54,
204
B.E
(Hon
s.),
MBA
, Fu
lbrig
ht F
ello
w (2
9)26
.02.
1993
50As
hok
Leyl
and
Ltd
Seni
or S
ales
Exe
cu v
e
Shya
m C
Ram
anEx
ecu
ve
on D
eput
a o
n74
,34,
053
B.E.
, PG
DM
(IIM
) (25
)01
.02.
2008
50Ch
olam
anda
lam
D
BS F
inan
ce L
tdVi
ce P
resi
dent
- H
R
Kaus
hik
S V
Sr. V
ice
Pres
iden
t - IT
&
Inte
rnal
Aud
it61
,90,
113
B.Co
m, P
GD
BM (3
0)10
.03.
1986
57E.
I.D -
Parr
y (In
dia)
Lt
dFi
nanc
e M
anag
er
Empl
oyed
for p
art o
f the
yea
r
Bala
subr
aman
ian
K Sr
. Vic
e Pr
esid
ent &
Chi
ef
Fina
ncia
l O c
er63
,32,
365
B.Sc
., AC
A (3
5)02
.09.
1991
58Pr
ice
Wat
erho
use
Libe
ria &
Gha
naSe
nior
Con
sulta
nt
Raje
swar
a Ra
o A
Pres
iden
t - T
ube
Prod
ucts
of
Indi
a53
,11,
494
B.Sc
., M
.A. (
PM &
IR) (
40)
16.0
1.19
8561
Asho
k Le
ylan
d Lt
dAs
st. M
anag
er
(Em
ploy
men
t)N
otes
1.
Rem
uner
a o
n in
clud
es S
alar
y, A
llow
ance
s an
d Ta
xabl
e Va
lue
of P
erqu
isite
s an
d Co
mpa
ny’s
cont
ribu
on
to P
rovi
dent
, Gra
tuity
& S
uper
Ann
ua o
n Fu
nds.
2.
Nat
ure
of e
mpl
oym
ent
: The
abo
ve e
mpl
oyee
s w
ere
who
le-
me
empl
oyee
s of
the
Com
pany
dur
ing
the
year
end
ed 3
1st
Mar
ch, 2
013
and
the
natu
re o
f the
ir
empl
oym
ent w
as c
ontr
actu
al.
3.
Cond
i on
s of
em
ploy
men
t pro
vide
for
term
ina
on
of s
ervi
ce b
y ei
ther
par
ty u
pon
givi
ng 3
mon
ths’
no
ce.
4.
Non
e of
the
abov
e em
ploy
ees
is re
late
d to
the
Dire
ctor
s of
the
Com
pany
.
5.
No
empl
oyee
of t
he C
ompa
ny is
cov
ered
by
the
prov
isio
ns o
f Sec
on
217(
2A)(
a)(ii
i) of
the
Com
pani
es A
ct, 1
956.
On
beha
lf of
the
Boar
d
M
M M
urug
appa
n Ch
enna
i Ch
airm
an2n
d M
ay, 2
013

Tube Investments of India Limited | 33
Report on the Financial Statements
We have audited the accompanying nancial statements of TUBE INVESTMENTS OF INDIA LIMITED (“the Company”), which comprise the Balance Sheet as at 31 March 2013, the Statement of Pro t and Loss, and the Cash Flow Statement for the year then ended, and a summary of the signi cant accoun ng policies and other explanatory informa on.
Management’s Responsibility for the Financial Statements
The Company’s Management is responsible for the prepara on of these nancial statements that give a true and fair view of the nancial posi on, nancial performance and cash ows of the Company in accordance with the Accoun ng Standards referred to in Sec on 211(3C) of the Companies Act, 1956 (“the Act”) and in accordance with the accoun ng principles generally accepted in India. This responsibility includes the design, implementa on and maintenance of internal control relevant to the prepara on and presenta on of the nancial statements that give a true and fair view and are free from material misstatement, whether due to fraud or error.
Auditors’ Responsibility
Our responsibility is to express an opinion on these nancial statements based on our audit. We conducted our audit in accordance with the Standards on Audi ng issued by the Ins tute of Chartered Accountants of India. Those Standards require that we comply with ethical requirements and plan and perform the audit to obtain reasonable assurance about whether the nancial statements are free from material misstatement.
An audit involves performing procedures to obtain audit evidence about the amounts and the disclosures in the nancial statements. The procedures selected depend on
the auditor’s judgment, including the assessment of the risks of material misstatement of the nancial statements, whether due to fraud or error. In making those risk assessments, the auditor considers internal control relevant to the Company’s prepara on and fair presenta on of the nancial statements in order to design audit procedures
that are appropriate in the circumstances, but not for the purpose of expressing an opinion on the e ec veness of the Company’s internal control. An audit also includes evalua ng the appropriateness of the accoun ng policies used and the reasonableness of the accoun ng es mates made by the Management, as well as evalua ng the overall presenta on of the nancial statements.
We believe that the audit evidence we have obtained is su cient and appropriate to provide a basis for our audit opinion.
Opinion
In our opinion and to the best of our informa on and according to the explana ons given to us, the aforesaid
nancial statements give the informa on required by the Act in the manner so required and give a true and fair view in conformity with the accoun ng principles generally accepted in India:
(a) in the case of the Balance Sheet, of the state of a airs of the Company as at 31 March 2013;
(b) in the case of the Statement of Pro t and Loss, of the pro t of the Company for the year ended on that date; and
(c) in the case of the Cash Flow Statement, of the cash ows of the Company for the year ended on that date.
Report on Other Legal and Regulatory Requirements
1. As required by the Companies (Auditor’s Report) Order, 2003 (“the Order”) issued by the Central Government in terms of Sec on 227(4A) of the Act, we give in the Annexure a statement on the ma ers speci ed in paragraphs 4 and 5 of the Order.
2. As required by Sec on 227(3) of the Act, we report that:
(a) We have obtained all the informa on and explana ons which to the best of our knowledge and belief were necessary for the purposes of our audit.
(b) In our opinion, proper books of account as required by law have been kept by the Company so far as it appears from our examina on of those books.
(c) The Balance Sheet, the Statement of Pro t and Loss, and the Cash Flow Statement dealt with by this Report are in agreement with the books of account.
(d) In our opinion, the Balance Sheet, the Statement of Pro t and Loss, and the Cash Flow Statement comply with the Accoun ng Standards referred to in Sec on 211(3C) of the Act.
(e) On the basis of the wri en representa ons received from the directors as on 31 March 2013, taken on record by the Board of Directors, none of the directors is disquali ed as on 31 March 2013 from being appointed as a director in terms of Sec on 274(1)(g) of the Act.
For DELOITTE HASKINS & SELLSChartered Accountants
(Firm Registra on No. 008072S)
M.K.AnanthanarayananPartner
CHENNAI, 2 May 2013 (Membership No. 19521)
INDEPENDENT AUDITORS’ REPORT
TO THE MEMBERS OF TUBE INVESTMENTS OF INDIA LIMITED

34 | Tube Investments of India Limited
(Referred to in paragraph 1 under ‘Report on Other Legal and Regulatory Requirements’ sec on of our report of even date)
(i) Having regard to the nature of the Company’s business/ac vi es/results during the year, clauses vi, x, xii, xiii, xiv, xv, xviii and xx of Paragraph 4 of the Order are not applicable to the Company.
(ii) In respect of its xed assets:
a. The Company has maintained proper records showing full par culars, including quan ta ve details and situa on of the xed assets.
b. Some of the xed assets were physically veri ed during the year by the Management in accordance with a programme of veri ca on, which in our opinion provides for physical veri ca on of all the xed assets at reasonable intervals. According
to the informa on and explana ons given to us, no material discrepancies were no ced on such veri ca on.
c. The xed assets disposed o during the year, in our opinion, do not cons tute a substan al part of the xed assets of the Company and such disposal has,
in our opinion, not a ected the going concern status of the Company.
(iii) In respect of its inventory:
a. As explained to us, the inventories held by the Company have been physically veri ed during the year by the Management at reasonable intervals.
b. In our opinion and according to the informa on and explana ons given to us, the procedures of physical veri ca on of inventories followed by the Management were reasonable and adequate in rela on to the size of the Company and the nature of its business.
c. In our opinion and according to the informa on and explana ons given to us, the Company has maintained proper records of its inventories and no material discrepancies were no ced on physical veri ca on.
(iv) The Company has neither granted nor taken any loans, secured or unsecured, to/from companies, rms or other par es listed in the Register maintained under Sec on 301 of the Companies Act, 1956.
(v) In our opinion and according to the informa on and explana ons given to us, having regard to the explana ons that some of the items purchased are of special nature and suitable alterna ve sources are not readily available for obtaining comparable quota ons, there is an adequate internal control system commensurate with the size of the Company and the nature of its business with regard to purchases of inventory and xed assets
and the sale of goods and services. During the course of our audit, we have not observed any major weakness in such internal control system.
(vi) In respect of contracts or arrangements entered in the Register maintained in pursuance of Sec on 301 of the Companies Act, 1956, to the best of our knowledge and belief and according to the informa on and explana ons given to us:
a. The par culars of contracts or arrangements referred to Sec on 301 that needed to be entered in the Register maintained under the said Sec on have been so entered.
b. Where each of such transac on is in excess of `5 lakhs in respect of any party, the transac ons have been made at prices which are prima facie reasonable having regard to the prevailing market prices at the relevant me.
(vii) In our opinion, the internal audit func ons carried out during the year by the Internal Audit Department of the Company as well as some external agencies appointed by the Management have been commensurate with the size of the Company and the nature of its business.
(viii) We have broadly reviewed the cost records maintained by the Company pursuant to the Companies (Cost Accoun ng Records) Rules, 2011 prescribed by the Central Government under Sec on 209(1)(d) of the Companies Act, 1956 and are of the opinion that, prima facie, the prescribed cost records have been maintained. We have, however, not made a detailed examina on of the cost records with a view to determining whether they are accurate or complete.
(ix) According to the informa on and explana ons given to us, in respect of statutory dues:
a. The Company has generally been regular in deposi ng undisputed dues, including Provident Fund, Investor Educa on and Protec on Fund, Employees’ State Insurance, Income-tax, Sales Tax, Wealth Tax, Service Tax, Custom Duty, Excise Duty, Cess and other material statutory dues applicable to it with the appropriate authori es.
b. There were no undisputed amounts payable in respect of Provident Fund, Investor Educa on and Protec on Fund, Employees’ State Insurance, Income-tax, Sales Tax, Wealth Tax, Service Tax, Custom Duty, Excise Duty, Cess and other material statutory dues in arrears as at 31 March 2013 for a period of more than six months from the date they became payable.
c. Details of dues of Income-tax, Sales Tax, Service Tax, Customs Duty, Excise Duty and Cess which have not been deposited as on 31 March 2013 on account of disputes are given below:
ANNEXURE TO THE INDEPENDENT AUDITORS’ REPORT

Tube Investments of India Limited | 35
StatuteNature of
DuesForum where Dispute is pending
Period to which the amount relates
Amount involved (` in Crores)
Income tax Act, 1961Income tax Commissioner (Appeals) 2005-06 0.31Interest Commissioner (Appeals) 2005-06 0.24
Central Sales Tax Act, 1956 – Various States
Sales TaxAssessing O cer-On Remand pursuant to appellate proceedings
1990-91, 1991-92, 2002-03, 2004-05 & 2010-11
0.69
Interest# Assessing O cer-On Remand pursuant to appellate proceedings
2010-11 0.00
Sales Tax Deputy Commissioner (Appeals) 1999-00, 2007-08 0.08Sales Tax High Court 2001-02 0.29Sales Tax Joint Commissioner (Appeals) 2004-05, 2006-07 to 2010-11 0.23Interest Joint Commissioner (Appeals) 2006-07 to 2010-11 0.09Sales Tax Revisional Board 2005-06, 2006-07 0.11Sales Tax Sales Tax Appellate Tribunal 2005-06 0.06
Local Sales Tax Laws - Various States
Sales TaxAssessing O cer-On Remand pursuant to appellate proceedings
2000-01, 2002-03 to 2006-07 0.19
Sales Tax Deputy Commissioner (Appeals) 2010-11 0.13Interest Deputy Commissioner (Appeals) 2010-11 0.03Sales Tax High Court 1999-00 0.02Sales Tax Joint Commissioner (Appeals) 2002-03 to 2004-05 0.13Sales Tax Revisional Board 2005-06, 2006-07 0.01Sales Tax Sales Tax Appellate Tribunal 1988-89 to 1995-96 & 2004-05 0.05Interest Sales Tax Appellate Tribunal 2004-05 0.04
Central Excise Act, 1944
Interest Commissioner of Central Excise (Appeals) 2009-10 to 2011-12 0.11Excise Duty Joint Secretary, Government of India 2001-02 and 2002-03 0.11Excise Duty Customs, Excise and Service Tax Appellate Tribunal 2000-01 to 2005-06 1.17Penalty Customs, Excise and Service Tax Appellate Tribunal 2000-01 to 2005-06 1.17Interest Customs, Excise and Service Tax Appellate Tribunal 2002-03 to 2005-06 0.04Excise Duty Madras High Court 2000-01 0.09Excise Duty Customs, Excise and Service Tax Appellate Tribunal 2002-03 to 2006-07 0.69Excise Duty Bombay High Court 1994-95 0.02Excise Duty Customs, Excise and Service Tax Appellate Tribunal 2006-07 to 2010-11 1.34Excise Duty Commissioner of Central Excise (Appeals) 2004-05 and 2005-06 0.01Interest* Commissioner of Central Excise (Appeals) 2006-07 0.00
Service Tax (Chapter V of the Finance Act, 1994)
Service Tax Customs, Excise and Service Tax Appellate Tribunal 1999-00 to 2011-12 0.34
#Amount involved is `3,830*Amount involved is `6,860
(x) In our opinion and according to the informa on and explana ons given to us, the Company has not defaulted in the repayment of dues to banks and debenture holders. The Company has not borrowed from nancial ins tu ons during the current year.
(xi) In our opinion and according to the informa on and explana ons given to us, the term loans have been applied by the Company during the year for the purposes for which they were obtained, other than temporary deployment pending applica on.
(xii) In our opinion and according to the informa on and explana ons given to us and on an overall examina on of the Balance Sheet of the Company, we report that funds raised on short-term basis have, prima facie, not been used during the year for long - term investment.
(xiii) According to the informa on and explana ons given to us, during the period covered by our audit report,
the Company has issued 500 units of Non-conver ble debentures having a face value of `1 Crore each. The Company has created security in respect of the secured debentures issued.
(xiv) To the best of our knowledge and according to the informa on and explana ons given to us, no fraud by the Company and no material fraud on the Company has been no ced or reported during the year.
For DELOITTE HASKINS & SELLSChartered Accountants
(Firm Registra on No. 008072S)
M.K.Ananthanarayanan PartnerCHENNAI, 2 May 2013 (Membership No. 19521)

36 | Tube Investments of India Limited
BALANCE SHEET` in Crores
Par cularsNote No.
As at31.03.2013
As at31.03.2012
EQUITY AND LIABILITIES
Shareholders’ Funds
(a) Share Capital 2 37.33 37.26
(b) Reserves and Surplus 3 1144.01 1077.701181.34 1114.96
Share Applica on Money Pending Allotment 4 - 0.03
Non-Current Liabili es
(a) Long Term Borrowings 5 630.36 418.71
(b) Deferred Tax Liabili es (Net) 6 52.29 48.08682.65 466.79
Current Liabili es (a) Short Term Borrowings 7 303.17 296.23 (b) Trade Payables 8 485.41 550.40 (c) Other Current Liabili es 9 441.42 165.41 (d) Short Term Provisions 10 43.93 54.33
1273.93 1066.37TOTAL 3137.92 2648.15ASSETS
Non-Current Assets (a) Fixed Assets (i) Tangible Assets 11 631.61 606.51 (ii) Capital Work-in-Progress 159.73 38.42 (b Non-Current Investments 12 1444.01 930.15 (c) Long Term Loans and Advances 13 78.69 94.80
2314.04 1669.88Current Assets (a) Current Investments 14 0.02 - (b) Inventories 15 356.77 410.00 (c) Trade Receivables 16 394.40 435.85 (d) Cash and Cash Equivalents 17 33.27 85.92 (e) Short Term Loans and Advances 18 39.42 46.50
823.88 978.27TOTAL 3137.92 2648.15Signi cant Accoun ng Policies 1See accompanying Notes forming part of the Financial Statements.
In terms of our report a ached For Deloi e Haskins & SellsChartered Accountants
On behalf of the Board
M M MurugappanChairman
M.K.AnanthanarayananPartner
Chennai2 May 2013
S SureshCompany Secretary
K BalasubramanianChief Financial O cer
L RamkumarManaging Director

Tube Investments of India Limited | 37
STATEMENT OF PROFIT AND LOSS` in Crores
Par cularsNoteNo.
Year Ended31.03.2013
Year Ended31.03.2012
Revenue From Opera ons Sale of Products - Gross 19 3642.25 3664.77 Excise Duty on Sales (251.88) (200.35) Sale of Products - Net 3390.37 3464.42Other Opera ng Revenue 20 17.06 25.35
3407.43 3489.77Other Income 21 40.25 30.97Total Revenue 3447.68 3520.74Expenses Cost of Materials Consumed 22 1945.24 2013.41 Purchase of Stock-in-Trade - Cycles/Components and
Metal Formed Products 134.07 185.82 Changes in Inventories of Finished Goods, Work-in-Progress
and Stock-in-Trade 23 20.88 (37.47) Employee Bene ts Expense 24 277.35 259.23 Other Expenses 25 735.19 702.01
3112.73 3123.00Earnings Before Finance Costs, Tax, Deprecia on and Amor sa on Expense 334.95 397.74Deprecia on and Amor sa on Expense 11 79.77 76.08Finance Costs 26 104.16 76.56Pro t Before Tax and Excep onal Item 151.02 245.10Excep onal Item - Provision for diminu on in value of investment in Subsidiary 12(c) (3.81) -Pro t Before Tax 147.21 245.10Tax Expense Income Tax - Current Year 36.00 64.50 - Prior Years 3.04 4.19 Deferred Tax (Net) 4.21 (3.68)
43.25 65.01Pro t for the Year 103.96 180.09Earnings per Equity Share of `2 each 38 Basic 5.58 9.69 Diluted 5.56 9.66Signi cant Accoun ng Policies 1See accompanying Notes forming part of the Financial Statements.
In terms of our report a ached For Deloi e Haskins & SellsChartered Accountants
On behalf of the Board
M M MurugappanChairman
M.K.AnanthanarayananPartner
Chennai2 May 2013
S SureshCompany Secretary
K BalasubramanianChief Financial O cer
L RamkumarManaging Director
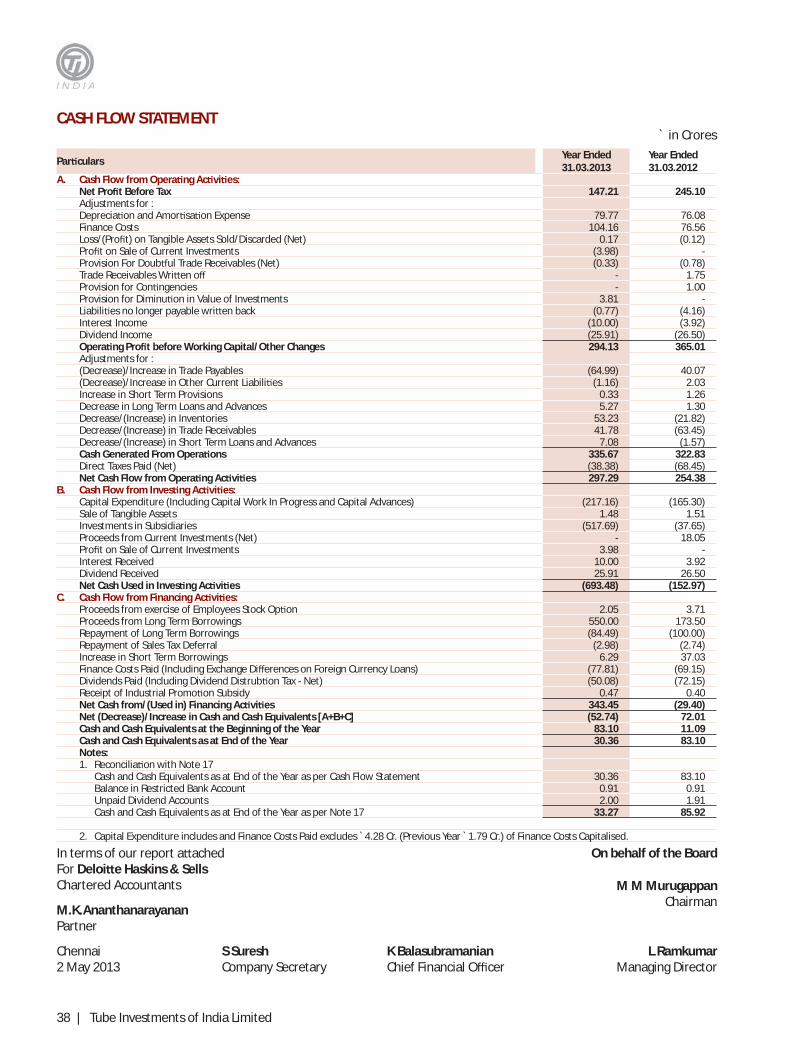
38 | Tube Investments of India Limited
CASH FLOW STATEMENT ` in Crores
Par cularsYear Ended 31.03.2013
Year Ended 31.03.2012
A. Cash Flow from Opera ng Ac vi es: Net Pro t Before Tax 147.21 245.10 Adjustments for : Deprecia on and Amor sa on Expense 79.77 76.08 Finance Costs 104.16 76.56 Loss/(Pro t) on Tangible Assets Sold/Discarded (Net) 0.17 (0.12) Pro t on Sale of Current Investments (3.98) - Provision For Doub ul Trade Receivables (Net) (0.33) (0.78) Trade Receivables Wri en o - 1.75
Provision for Con ngencies - 1.00 Provision for Diminu on in Value of Investments 3.81 - Liabili es no longer payable wri en back (0.77) (4.16)Interest Income (10.00) (3.92)Dividend Income (25.91) (26.50)Opera ng Pro t before Working Capital/Other Changes 294.13 365.01 Adjustments for :(Decrease)/Increase in Trade Payables (64.99) 40.07 (Decrease)/Increase in Other Current Liabili es (1.16) 2.03 Increase in Short Term Provisions 0.33 1.26 Decrease in Long Term Loans and Advances 5.27 1.30 Decrease/(Increase) in Inventories 53.23 (21.82)Decrease/(Increase) in Trade Receivables 41.78 (63.45)Decrease/(Increase) in Short Term Loans and Advances 7.08 (1.57)Cash Generated From Opera ons 335.67 322.83 Direct Taxes Paid (Net) (38.38) (68.45)Net Cash Flow from Opera ng Ac vi es 297.29 254.38
B. Cash Flow from Inves ng Ac vi es:Capital Expenditure (Including Capital Work In Progress and Capital Advances) (217.16) (165.30)Sale of Tangible Assets 1.48 1.51 Investments in Subsidiaries (517.69) (37.65)Proceeds from Current Investments (Net) - 18.05 Pro t on Sale of Current Investments 3.98 - Interest Received 10.00 3.92 Dividend Received 25.91 26.50 Net Cash Used in Inves ng Ac vi es (693.48) (152.97)
C. Cash Flow from Financing Ac vi es:Proceeds from exercise of Employees Stock Op on 2.05 3.71 Proceeds from Long Term Borrowings 550.00 173.50 Repayment of Long Term Borrowings (84.49) (100.00)Repayment of Sales Tax Deferral (2.98) (2.74)Increase in Short Term Borrowings 6.29 37.03 Finance Costs Paid (Including Exchange Di erences on Foreign Currency Loans) (77.81) (69.15)Dividends Paid (Including Dividend Distrub on Tax - Net) (50.08) (72.15)Receipt of Industrial Promo on Subsidy 0.47 0.40 Net Cash from/(Used in) Financing Ac vi es 343.45 (29.40)Net (Decrease)/Increase in Cash and Cash Equivalents [A+B+C] (52.74) 72.01 Cash and Cash Equivalents at the Beginning of the Year 83.10 11.09 Cash and Cash Equivalents as at End of the Year 30.36 83.10 Notes:1. Reconcilia on with Note 17 Cash and Cash Equivalents as at End of the Year as per Cash Flow Statement 30.36 83.10 Balance in Restricted Bank Account 0.91 0.91 Unpaid Dividend Accounts 2.00 1.91 Cash and Cash Equivalents as at End of the Year as per Note 17 33.27 85.92
2. Capital Expenditure includes and Finance Costs Paid excludes `4.28 Cr. (Previous Year `1.79 Cr.) of Finance Costs Capitalised.
In terms of our report a ached For Deloi e Haskins & SellsChartered Accountants
On behalf of the Board
M M MurugappanChairman
M.K.AnanthanarayananPartner
Chennai2 May 2013
S SureshCompany Secretary
K BalasubramanianChief Financial O cer
L RamkumarManaging Director

Tube Investments of India Limited | 39
1.1 Accoun ng Conven on
The nancial statements of the Company are prepared under the historical cost conven on, on an accrual basis, in accordance with the Generally Accepted Accoun ng Principles in India (Indian GAAP) to comply with the Accoun ng Standards no ed by the Government of India/ issued by the Ins tute of Chartered Accountants of India (ICAI), as applicable, and the relevant provisions of the Companies Act, 1956. The accoun ng policies adopted in the prepara on of the nancial statements are consistent with those followed in the previous year.
1.2 Presenta on and disclosure of nancial statements
An asset has been classi ed as current when it sa s es any of the following criteria;
a) It is expected to be realised in, or is intended for sale or consump on in, the Company’s normal opera ng cycle;
b) It is held primarily for the purpose of being traded;
c) It is expected to be realised within twelve months a er the repor ng date; or
d) It is cash or cash equivalent unless it is restricted from being exchanged or used to se le a liability for at least twelve months a er the repor ng date.
A liability has been classi ed as current when it sa s es any of the following criteria;
a) It is expected to be se led in the Company’s normal opera ng cycle;
b) It is held primarily for the purpose of being traded;
c) It is due to be se led within twelve months a er the repor ng date; or
d) The Company does not have an uncondi onal right to defer se lements of the liability for at least twelve months a er the repor ng date. Terms of a liability that could, at the op on of the counterparty, result in its se lement by the issue of equity instruments do not a ect its classi ca on.
All other assets and liabili es have been classi ed as non-current.
Based on the nature of products/ac vi es, the Company has determined its opera ng cycle
as twelve months for the above purpose of classi ca on as current and non-current.
1.3 Use of Es mates
The prepara on of the nancial statements in conformity with Indian GAAP requires the Management to make es mates and assump ons considered in the reported amounts of assets and liabili es (including con ngent liabili es) as of the date of the nancial statements and the reported income and expenses like provision for employee bene ts, provision for doub ul trade receivables/advances/con ngencies, provision for warran es, allowance for slow/non-moving inventories, useful life of xed assets, provision for retrospec ve price increases on purchases, provision for taxa on, etc., during the repor ng year. The Management believes that the es mates used in the prepara on of the nancial statements are prudent and reasonable.
Future results may vary from these es mates and the di erences between the actual results and the es mates are recognised in the periods in which the results are known/materialise.
1.4 Tangible Fixed Assets
Fixed Assets are stated at historical cost less accumulated deprecia on and impairment losses, if any. Cost includes related taxes, du es, freight, insurance, etc., a ributable to the acquisi on and installa on of the xed assets but excludes du es and taxes that are recoverable from tax authori es. Borrowing costs are capitalised as part of qualifying xed assets.
Machinery spares which can be used only in connec on with an item of xed asset and whose use is expected to be irregular are capitalised and depreciated over the useful life of the principal item of the relevant assets. Subsequent expenditure rela ng to xed assets is capitalised only if such expenditure results in an increase in the future bene ts from such asset beyond its previously assessed standard of performance.
Fixed assets re red from ac ve use and held for sale are stated at the lower of their net book value and net realisable value and are disclosed separately in the Balance Sheet.
Capital Work-in-Progress: Projects under which assets are not ready for their intended use and other capital work-in-progress are carried at cost, comprising direct cost and a ributable interest.
NOTES TO FINANCIAL STATEMENTS
1. Signi cant Accoun ng Policies

40 | Tube Investments of India Limited
1.5 Impairment of Assets
The carrying values of assets/cash genera ng units are reviewed at each Balance Sheet date to determine whether there is any indica on of impairment of the carrying amount of the Company’s assets. If any indica on exists, an asset’s recoverable amount is es mated. An impairment loss is recognised whenever the carrying amount of the asset exceeds the recoverable amount. The recoverable amount is the greater of the net selling price and their value in use. Value in use is arrived at by discoun ng the future cash ows to their present value based on an appropriate discount factor. When there is indica on that an impairment loss recognised for an asset in earlier accoun ng periods no longer exists or may have decreased such reversal of impairment loss is recognised in the Statement of Pro t and Loss.
1.6 Investments
a) Current investments are carried at lower of cost and fair value.
b) Non-Current investments are carried at cost. Diminu on in the value of such investments, other than temporary, is provided for.
1.7 Inventories
a) Raw materials, stores & spare parts and stock-in-trade are valued at lower of weighted average cost and es mated net realisable value (net of allowances). Cost includes freight, taxes and du es and is net of credit under VAT and CENVAT scheme, where applicable.
b) Work-in-progress and nished goods are valued at lower of weighted average cost and es mated net realisable value (net of allowances). Cost includes all direct costs and appropriate propor on of overheads to bring the goods to the present loca on and condi on.
c) Due allowance is made for slow/non-moving items.
1.8 Revenue and Other Income
a) Sales are recognised on shipment or on uncondi onal appropria on of goods and comprise amounts invoiced for the goods, including Excise Duty, but excluding Sales Tax/Value Added Tax, Quan ty Discounts and Sale Returns.
b) Service revenues are recognised when services are rendered.
c) Dividend income is accounted for when the right to receive it is established.
d) Interest income is recognised on me propor on basis.
1.9 Government grants, subsidies and export bene ts
Government grants and subsidies are recognised when there is reasonable assurance that the Company will comply with the condi ons a ached to them and the grants/subsidy will be received.
When the grant or subsidy from the Government relates to revenue, it is recognised as income on a systema c basis in the Statement of Pro t and loss over the period necessary to match them with the related costs, which they are intended to compensate.
When the grant or subsidy from the Government is in the nature of promoters’ contribu on, where no repayment is ordinarily expected in respect thereof, it is credited to Capital Reserve and treated as a part of the Shareholders’ Funds on receipt basis.
Export bene ts are accounted for in the year of exports based on eligibility and when there is no uncertainty in receiving the same.
1.10 Employee Bene ts
I. De ned Contribu on Plan
a. Superannua on
The Company contributes a sum equivalent to 15% of the eligible employees salary to a Superannua on Fund administered by trustees and managed by Life Insurance Corpora on of India (LIC). The Company has no liability for future Superannua on Fund bene ts other than its annual contribu on and recognises such contribu ons as an expense in the year incurred.
b. Provident Fund
Contribu ons in respect of Employees who are not covered by Company’s Employees Provident Fund Trust are made to the Regional Provident Fund. These Contribu ons are recognised as expense in the year in which they are incurred.
NOTES TO FINANCIAL STATEMENTS
1. Signi cant Accoun ng Policies (Contd.)

Tube Investments of India Limited | 41
II. De ned Bene t Plan
a. Gratuity
The Company makes annual contribu on to a Gratuity Fund administered by trustees and managed by LIC. The Company accounts its liability for future gratuity bene ts based on actuarial valua on, as at the Balance Sheet date, determined every year using the Projected Unit Credit method less the Fair Value of Plan Assets out of which the obliga ons are expected to be se led. Actuarial gains/losses are immediately recognised in the Statement of Pro t and Loss.
b. Provident Fund
In respect of the employees not covered in Point I.b above, contribu ons to the Company’s Employees Provident Fund Trust are made in accordance with the Fund rules. The interest rate payable to the bene ciaries every year is being no ed by the Government.
In the case of contribu on to the Trust, the Company has an obliga on to make good the shor all, if any, between the return from the investments of the Trust and the no ed interest rate and recognises such obliga on, determined based on an actuarial valua on, as an expense.
III. Long Term Compensated Absences
The liability for long term compensated absences carried forward on the Balance Sheet date is provided for based on an actuarial valua on using the Projected Unit Credit method less the Fair Value of Plan Assets out of which the obliga ons are expected to be se led, as at the Balance Sheet date.
IV. Short Term Employee Bene ts
Short term employee bene ts includes short term compensated absences which is recognised based on the eligible leave at credit on the Balance Sheet date, and the es mated cost is based on the terms of the employment contract.
V. Voluntary Re rement Scheme
Compensa on to employees under Voluntary Re rement Schemes is expensed in the period in which the liability arises.
1.11 Opera ng Leases
Leases where the lessor e ec vely retains substan ally all the risks and bene ts of ownership of the leased assets are classi ed as opera ng leases. Opera ng lease payments are recognised as an expense in the Statement of Pro t and Loss as per the lease terms.
1.12 Foreign Currency Transac ons
Ini al recogni on
Transac ons in foreign currencies entered into by the Company are accounted at the exchange rates prevailing on the date of the transac on or at rates that closely approximate the rate at the date of the transac on.
Measurement
Foreign currency monetary items (other than Deriva ve Contracts) of the Company outstanding at the Balance Sheet date are restated at year end exchange rates.
Non-monetary items are carried at historical cost.
Treatment of Exchange Di erences
Exchange di erences arising on se lement/restatement of foreign currency monetary assets and liabili es of the Company are recognised as income or expense in the Statement of Pro t and Loss.
Accoun ng of forward contracts
The Company enters into forward exchange contracts and other instruments that are in substance a forward exchange contract to hedge its risks associated with foreign currency uctua ons. The premium or discount arising at the incep on of a forward exchange contract (other than for a rm commitment or a highly probable forecast
transac on) or similar instrument is amor sed as expense or income over the life of the contract. Exchange di erences on such a contract are recognised in the Statement of Pro t and Loss in the year in which the exchange rates change. Any pro t or loss arising on cancella on of such a contract is recognised as income or expense for the year.
1.13 Deriva ve Instruments and Hedge Accoun ng
The Company uses forward contracts and currency swaps (Deriva ve Contracts) to hedge its risks associated with foreign currency
NOTES TO FINANCIAL STATEMENTS
1. Signi cant Accoun ng Policies (Contd.)

42 | Tube Investments of India Limited
uctua ons rela ng to highly probable forecast transac ons. The Company designates these as cash ow hedges.
The use of Deriva ve Contracts is governed by the Company’s policies on the use of such nancial deriva ves consistent with the Company’s risk management strategy. The Company does not use deriva ve nancial instruments for specula ve purposes.
Deriva ve Contracts are ini ally measured at fair value, and are re-measured at subsequent repor ng dates. Changes in the fair value of these Deriva ve Contracts that are designated and e ec ve as hedges of future cash ows are recognised directly in “Hedge Reserve Account” under Shareholders’ Funds and the ine ec ve por on is recognised immediately in the Statement of Pro t and Loss.
Changes in the fair value of Deriva ve Contracts that do not qualify for hedge accoun ng are recognised in the Statement of Pro t and Loss as they arise.
Hedge accoun ng is discon nued when the hedging instrument expires or is sold, terminated, or exercised, or no longer quali es for hedge accoun ng. If any of these events occur or if a hedged transac on is no longer expected to occur, the net cumula ve gain or loss recognised under Shareholders’ Funds is transferred to the Statement of Pro t and Loss for the year.
1.14 Deprecia on and Amor sa on
Deprecia on has been provided on the straight-line method as per the rates prescribed in Schedule XIV to the Companies Act, 1956 except in respect of the following categories of assets, where deprecia on is provided based on useful life of the assets assessed as under:
Descrip on of Assets Useful life and Basis of Deprecia on/Amor sa on
Special tools and special purpose machines used in door frame products
4 Years
Furniture and Fixtures 5 YearsMotor Vehicles 4 YearsO ce Equipment (including Data Processing Equipment)
3 Years
Leasehold Land/Improvements Over the primary lease period
Individual Fixed Assets whose actual cost does not exceed `5000 are fully depreciated in the year of acquisi on.
Deprecia on is provided pro-rata from the month of Capitalisa on.
Certain xed assets are treated as Con nuous Process Plants based on technical evalua on done by the Management and are depreciated as per rates prescribed in Schedule XIV to the Companies Act, 1956. The Company also has a system of providing addi onal deprecia on, where, in the opinion of the Management, the recovery of the xed asset is likely to be a ected by the varia on in demand and/or its condi on/usability.
1.15 Research and Development
Revenue expenditure on research and development is expensed when incurred. Capital expenditure on research and development is capitalised under xed assets and depreciated in accordance with Note 1.14 above.
1.16 Taxes on Income
Current tax is the amount of tax payable on the taxable income for the year and is determined in accordance with the provisions of the Income Tax Act, 1961.
Deferred tax is recognised on ming di erences; being the di erences between taxable income and accoun ng income that originate in one period and are capable of reversal in one or more subsequent periods. Deferred tax is measured using the tax rates and tax laws enacted or substan vely enacted as at the repor ng date.
Deferred tax assets in respect of unabsorbed deprecia on and carry forward of losses are recognised only if there is virtual certainty that there will be su cient future taxable income available to realise such assets. Other deferred tax assets are recognised if there is reasonable certainty that there will be su cient future taxable income available to realise such assets.
1.17 Provisions and Con ngencies
Provisions are recognised when there is a present obliga on as a result of past events and when a reliable es mate of the amount of obliga on can be made. Con ngent liability is disclosed for (i) Possible obliga on which will be con rmed only by future events not wholly
NOTES TO FINANCIAL STATEMENTS
1. Signi cant Accoun ng Policies (Contd.)
Tube Investments of India Limited | 43
within the control of the Company or (ii) Present obliga ons arising from past events where it is not probable that an ou low of resources will be required to se le the obliga on or a reliable es mate of the amount of the obliga on cannot be made. Con ngent assets are not recognised in the nancial statements.
1.18 Segment Accoun ng
a. The Generally Accepted Accoun ng Principles used in the prepara on of the nancial statements are applied to record revenue and expenditure in individual segments.
b. Segment revenue and segment results include transfers between business segments. Such transfers are accounted for at a compe ve market price and are eliminated in the consolida on of the segments.
c. Expenses that are directly iden able to segments are considered for determining the segment results. Expenses which relate to the Company as a whole and are not allocable to segments are included under unallocated corporate expenses.
d. Segment assets and liabili es include those directly iden able with the respec ve segments. Unallocated corporate assets and liabili es represent the assets and liabili es that relate to the Company as a whole and are not allocable to any segment.
1.19 Borrowing Costs
Borrowing Costs include interest, amor sa on of ancillary costs incurred and exchange di erences arising from foreign currency borrowings to the extent they are regarded as an adjustment to the borrowing costs. Borrowing Costs, allocated to and u lised for qualifying assets, pertaining to the period from commencement of ac vi es rela ng to construc on/development of the qualifying asset upto the date the asset is
ready for its intended use is added to the cost of the assets. Capitalisa on of Borrowing Costs is suspended and charged to the Statement of Pro t and Loss during extended periods when ac ve development ac vity on the qualifying assets is interrupted.
1.20 Earnings Per Share
Basic earnings per share is calculated by dividing the net pro t for the period a ributable to equity shareholders by the weighted average number of Equity Shares outstanding during the period.
The weighted average number of Equity Shares outstanding during the period and for all periods presented is adjusted for events, such as bonus shares, other than the conversion of poten al Equity Shares, that have changed the number of Equity Shares outstanding, without a corresponding change in resources. For the purpose of calcula ng diluted earnings per share, the net pro t for the period a ributable to equity share holders and the weighted average number of shares outstanding during the period is adjusted for the e ects of all dilu ve poten al Equity Shares.
1.21 Employees Stock Op on
Stock Op ons granted to the employees under the Stock Op on Scheme are evaluated as per the accoun ng treatment prescribed by the Employee Stock Op on Scheme and Employee Stock Purchase Scheme Guidelines, 1999 issued by the Securi es and Exchange Board of India. The Company follows the intrinsic value method of accoun ng for the Op ons and accordingly, the excess of market value of the Stock Op ons as on date of grant, if any, over the exercise price of the Op ons is recognised as deferred employee compensa on and is charged to the Statement of Pro t and Loss on graded ves ng basis over the ves ng period of the Op ons.
NOTES TO FINANCIAL STATEMENTS
1. Signi cant Accoun ng Policies (Contd.)

44 | Tube Investments of India Limited
NOTES TO FINANCIAL STATEMENTS
2. Share Capital
` in Crores
Par cularsAs at
31.03.2013As at
31.03.2012
Authorised Capital
21,50,00,000 Equity Shares of `2 each 43.00 43.00
Issued, Subscribed and Paid-up Capital
18,66,79,308 Equity Shares of `2 each fully paid up (Previous Year 18,63,15,317 Equity Shares of `2 each fully paid up) 37.33 37.26
37.33 37.26
a) The Reconcilia on of Share Capital is given below:
Par culars As at 31.03.2013 As at 31.03.2012
No. of Shares ` in Crores No. of Shares ` in Crores
At the beginning of the year 18,63,15,317 37.26 18,56,66,931 37.13
Shares allo ed on exercise of Employee Stock Op ons (Refer Note e below)
3,63,991 0.07 6,48,386 0.13
At the end of the year 18,66,79,308 37.33 18,63,15,317 37.26
b) Terms/Rights a ached to class of shares:
The Company has only one class of shares referred to as Equity Shares having a par value of `2. The holders of Equity Shares are en tled to one vote per share. Dividend proposed by the Board of Directors, if any, is subject to the approval of the shareholders in the ensuing Annual General Mee ng, except in case of interim dividend. Repayment of capital will be in propor on to the number of Equity Shares held.
c) Details of Shareholder(s) holding more than 5% of Equity Shares in the Company as on 31 March 2013
Name of the Shareholder
As at 31.03.2013 As at 31.03.2012
No. of Shares% against total
number of shares
No. of Shares% against total
number of shares
Murugappa Holdings Limited(Associate - Inves ng Company)
6,40,54,680 34.31% 6,40,54,680 34.38%
d) Status on Global Depository Receipts:
The aggregate number of Global Depository Receipts (GDRs) outstanding as at 31 March 2013 is 52,23,460 (Previous Year 64,23,460) each represen ng one Equity Share of `2 face value. GDR % against total number of shares is 2.80% (Previous Year 3.45%). The GDRs carry the same terms/rights a ached to Equity Shares of the Company.

Tube Investments of India Limited | 45
e) Stock Op ons
The Company has granted Stock Op ons to certain employees in accordance with the Employees Stock Op on Scheme as follows:
Par culars Date of Grant
Exercise Price (`)
Op ons Granted
Op ons Vested
Op ons Cancelled/
lapsed
Op ons Exercised &
allo ed
Op ons Exercised, pending
allotment
Op ons Outstanding at the End of
the Year
Ves ng (subject to con nuous associa on with the Company and
performance ra ng parameters)
Grant 1 31-Oct-07 62.85 6,00,120 3,80,874 2,36,496 3,63,624 - - 31.10.08 – 100%Grant 2 31-Jan-08 66.10 1,05,460 81,324 24,136 81,324 - - 31.01.09 – 100%Grant 3 24-Mar-08 56.80 26,55,260 16,13,270 10,41,990 12,06,252 - 4,07,018 31.10.09 – 25%
31.10.10 – 37.5%31.10.11 – 37.5%
Grant 4 31-Jul-08 44.45 3,86,900 2,94,305 92,595 1,74,433 - 1,19,872 31.07.09 – 20%31.07.10 – 20%31.07.11 – 30%31.07.12 – 30%
Grant 5 31-Oct-08 24.25 54,000 30,240 23,760 30,240 - - 31.10.09 – 20%31.10.10 – 20%31.10.11 – 30%31.10.12 – 30%
Grant 6 30-Jan-09 31.05 28,100 23,323 4,777 23,323 - - 30.01.10 – 20%30.01.11 – 20%30.01.12 – 30%30.01.13 – 30%
Grant 7 29-Jan-11 140.05 4,25,400 1,22,242 85,898 2,600 - 3,36,902 29.01.12 – 20%29.01.13 – 20%29.01.14 – 30%29.01.15 – 30%
Grant 8 29-Jan-11 140.05 1,92,400 1,07,200 39,420 17,512 - 1,35,468 29.01.12 – 40%29.01.13 – 30%29.01.14 – 30%
Grant 9 29-Jan-11 140.05 13,900 11,120 2,780 - - 11,120 29.01.12 – 50%29.01.13 – 50%
Grant 10 2-May-11 140.45 55,000 3,936 31,384 - - 23,616 02.05.12 – 20%02.05.13 – 20%02.05.14 – 30%02.05.15 – 30%
Grant 11 1-Aug-11 159.75 33,600 - 6,720 - - 26,880 01.08.12 – 20%01.08.13 – 20%01.08.14 – 30%01.08.15 – 30%
Grant 12 2-Nov-11 143.10 1,26,800 21,900 3,460 - - 1,23,340 02.11.12 – 20%02.11.13 – 20%02.11.14 – 30%02.11.15 – 30%
46,76,940 26,89,734 15,93,416 18,99,308 - 11,84,216
During the past 5 years, the Company has allo ed 18,99,308 (Previous Year 15,35,317) Shares of `2 each to employees, pursuant to the exercise of their Op on under the Employees Stock Op on Scheme.
The total number of such Op ons outstanding as at 31 March 2013 is 11,84,216 (Previous Year 16,80,893) and each Op on is exercisable into one Equity Share of `2 face value within three/six years from the date of ves ng.
The movement in Stock Op ons during the year is given below:
Par cularsDate of
Grant
Op ons Outstanding at the
Beginning of the Year
During the yearOp ons Outstanding at the End of the Year Op ons
GrantedOp ons Cancelled/
lapsed
Op ons Exercised &
allo ed
Op ons Exercised in the previous year & alloted
during the year
Op ons Exercised & pending allotment
Grant 1 31-Oct-07 - - - - - - - Grant 2 31-Jan-08 - - - - - - - Grant 3 24-Mar-08 6,45,453 - - 2,38,435 5,296 - 4,07,018 Grant 4 31-Jul-08 2,15,220 - 16,011 79,337 - - 1,19,872 Grant 5 31-Oct-08 8,100 - 1,620 6,480 - - - Grant 6 30-Jan-09 15,174 - 843 14,331 - - - Grant 7 29-Jan-11 3,87,796 - 48,294 2,600 - - 3,36,902 Grant 8 29-Jan-11 1,81,240 - 28,260 17,512 - - 1,35,468 Grant 9 29-Jan-11 12,510 - 1,390 - - - 11,120 Grant 10 2-May-11 55,000 - 31,384 - - - 23,616 Grant 11 1-Aug-11 33,600 - 6,720 - - - 26,880 Grant 12 2-Nov-11 1,26,800 - 3,460 - - - 1,23,340
Total 16,80,893 - 1,37,982 3,58,695 5,296 - 11,84,216
NOTES TO FINANCIAL STATEMENTS

46 | Tube Investments of India Limited
3. Reserves and Surplus
` in Crores
Par cularsAs at
31.03.2013As at
31.03.2012 Capital Reserve
Balance at the beginning of the year 0.77 0.37 Industrial Promo on Subsidy from Govt. of Maharashtra 0.47 0.40 Balance at the end of the year 1.24 0.77
Capital Redemp on Reserve (Refer Note a below) 6.15 6.15 Securi es Premium Account
Balance at the beginning of the year 190.13 186.58 Addi ons during the year 2.01 3.55 Balance at the end of the year 192.14 190.13
Debenture Redemp on ReserveBalance at the beginning of the year 68.33 36.67 Addi ons during the year 84.27 31.66 Dele ons during the year (Refer Note b below) (17.50) - Balance at the end of the year 135.10 68.33
Hedge Reserve Account (Refer Note 40)Balance at the beginning of the year 0.46 (0.36)Addi ons/(Deduc ons) during the year (Net) (0.78) 0.82 Balance at the end of the year (0.32) 0.46
General ReserveBalance at the beginning of the year 532.16 332.16 Addi ons during the year 117.50 200.00 Balance at the end of the year 649.66 532.16
Surplus in the Statement of Pro t and LossSurplus at the beginning of the year 279.70 392.70 Pro t for the period 103.96 180.09 Final dividend including dividend distribu on tax (Refer Note c below) (0.00) (0.02)Transfer to General Reserve (100.00) (200.00)Transfer to Debenture Redemp on Reserve (84.27) (31.66)Interim Dividend @ `1.50 (Previous Year `2) per Equity Share of `2 each (27.99) (37.24)Final Dividend Proposed @ `0.50 (Previous Year `1) per Equity Share of `2 each (9.33) (18.63)Dividend Distribu on Tax - Current year (3.20) (7.30)Earlier year’s provision for dividend tax no longer required (Refer Note d below) 1.17 1.76 Surplus at the end of the year 160.04 279.70
1144.01 1077.70
Notes:
a) Represents the amount transferred, for a sum equal to the face value of the Equity Shares, at the me of Buy-back.
b) Represents the amount transferred to General Reserve on redemp on of Non-Conver ble Debentures.
NOTES TO FINANCIAL STATEMENTS

Tube Investments of India Limited | 47
c) Final Dividend including Dividend Distribu on Tax
Subsequent to the Balance Sheet date of 31 March 2012 and before the book closure date for declara on of the nal dividend for the year 2011-12, 48,640 (Previous Year 1,29,721) Equity Shares were allo ed under the Employees Stock Op on Scheme to employees and dividend of `0.0049 Cr. (Previous Year `0.0195 Cr.) on these shares were paid. The total amount of `0.0057 Cr. (Previous Year `0.0227 Cr.) including dividend distribu on tax, have been appropriated from the opening surplus in the Statement of Pro t and Loss.
d) Represents amount wri en back on account of set-o of Dividend Distribu on Tax paid by a Subsidiary on dividend distributed to the Company, against Dividend Distribu on Tax payable by the Company.
4. Share Applica on Money Pending Allotment
Pursuant to Op ons granted under Employees Stock Op on Scheme, the Company had received `0.03 Cr. towards share applica on money for 5,296 Equity Shares of `2 each with a premium of `54.80 per share during the year ended 31 March 2012. The shares were allo ed as per the Scheme during the year ended 31 March 2013 and un l the date of allotment of shares, the said amount was held in a designated bank account and was not available for use by the Company.
5. Long Term Borrowings
` in Crores
Par cularsAs at
31.03.2013As at
31.03.2012
Secured Borrowings
Secured, Listed and Rated Non-Conver ble Debentures (NCD)
10.15% Privately Placed NCD 50.00 -
9.99% Privately Placed NCD 50.00 -
9.81% Privately Placed NCD 150.00 -
9.95% Privately Placed NCD 100.00 -
8.50% Privately Placed NCD 30.00 -
9.90% Privately Placed NCD 100.00 100.00
11.70% Privately Placed NCD - 50.00
8.75% Privately Placed NCD - 150.00
Rupee Term Loan 50.00 -
Foreign Currency Term Loans
External Commercial Borrowing 73.50 73.50
External Commercial Borrowing 14.48 28.97
Unsecured Borrowings
Deferred Payment Liability - Sales Tax Deferral 12.38 16.24
630.36 418.71
5.1. Nature of Security
5.1.1. Secured, Listed and Rated Non-Conver ble Debentures (NCD)
(a) NCDs with Coupon of 10.15%, 9.99%, 9.81%, 9.95%, 9.90% and 8.75% are secured by a pari passu rst charge on certain immovable proper es of the Company.
(b) NCDs with Coupon of 8.50% and 11.70% are secured by a pari passu rst charge on all the Plant & Machinery and certain immovable proper es of the Company.
NOTES TO FINANCIAL STATEMENTS

48 | Tube Investments of India Limited
NOTES TO FINANCIAL STATEMENTS
5.1.2. Rupee Term Loan
Term Loan from IDBI Bank is secured by a pari passu rst charge on all the Plant & Machinery of the Company.
5.1.3. Foreign Currency Term Loans
(a) External Commercial Borrowing of USD 15 Mio. equivalent to `73.50 Cr. is secured by a pari passu rst charge on all the Plant & Machinery of the Company.
(b) External Commercial Borrowing of USD 9.32 Mio. equivalent to `43.46 Cr. (Outstanding as at 31 March 2013 – USD 6.21 Mio. equivalent to `28.97 Cr. including Current Maturi es of `14.49 Cr.) is secured by a pari passu rst charge on all the Plant & Machinery and certain immovable proper es of the Company.
5.2. Repayment Schedule
5.2.1. Secured, Listed and Rated Non-Conver ble Debentures (NCD)
Coupon Rate Outstanding Amount
(` in Crores)
Maturity Date and Redemp on Par culars
Op ons Available
Date of Redemp on if Op on is exercised
10.15% 50 9 August 2018 - `50 Cr. Call 9 August 2015
9.99% 50 26 April 2017 - `50 Cr. - -
9.81% 1509 August 2016 - `75 Cr.9 August 2017 - `75 Cr.
- -
9.95% 1009 August 2016 - `30 Cr.9 August 2017 - `30 Cr.9 August 2018 - `40 Cr.
Put & Call 9 August 2015
8.50% 30 27 November 2014 - `30 Cr. - -
9.90% 100 11 August 2016 - `100 Cr. Put & Call 11 August 2014
11.70%# 50 25 February 2014 - `50 Cr. - -
8.75%# 150 7 May 2015 - `150 Cr. Put & Call 7 May 2013
#Classi ed as “Other Current Liabili es” (Refer Note 9)
5.2.2. Rupee Term Loan
Interest at the rate of IDBI Bank’s Base Rate plus 0.50% p.a. is payable monthly. The said loan is repayable in twelve equal monthly instalments commencing 1 April 2014 with prepayment op on at the end of each quarter without any penalty star ng from 30 June 2013.
5.2.3. Foreign Currency Term Loans
Original Principal Amount
Outstanding Amount
Rate of Interest Repayment Date
USD 15 Mio. (`73.50 Cr.)
USD 15 Mio. (`73.50 Cr.)
3 Months USD LIBOR + 2.00% p.a payable
quarterly2 March 2015 - USD 15 Mio.
USD 9.32 Mio. (`43.46 Cr.)
USD 6.21 Mio. (`28.97 Cr.)
3 Months USD LIBOR + 2.40% p.a payable
Quarterly
10 February 2014 - USD 3.11#
10 February 2015 - USD 3.10
#Classi ed as “Other Current Liabili es” (Refer Note 9)

Tube Investments of India Limited | 49
5.2.4. Sales Tax Deferral
The Company has availed bene t for establishing capaci es in various states in the form of Sales Tax Deferral.The details of repayments are as under:
Repayment YearRepayment Amount
(` in Crores)
2013-14# 3.86
2014-15 4.19
2015-16 2.23
2016-17 1.85
2017-18 1.52
2018-19 1.24
2019-20 0.89
2020-21 0.46
#Classi ed as “Other Current Liabili es” (Refer Note 9)
6. Deferred Tax Liabili es (Net)
The net deferred tax liability of `52.29 Cr. as at 31 March 2013 (Previous Year `48.08 Cr.) comprises the following:
` in Crores
Nature - Liability/(Asset)As at
01.04.2012
Charged/(Credited) to Statement of Pro t and Loss
As at31.03.2013
Deferred Tax Liabili es
Di erence between the Deprecia on as per Books of Account and the Income Tax Act, 1961
59.43 4.66 64.09
Total (A) 59.43 4.66 64.09
Deferred Tax Assets
Deferred Revenue Expenses (1.74) 0.61 (1.13)
Provision for Doub ul Trade Receivables (2.89) (0.02) (2.91)
Provision for Employee Bene ts and Others (6.72) (1.04) (7.76)
Total (B) (11.35) (0.45) (11.80)
Net Deferred Tax Liability (A+B) 48.08 4.21 52.29
7. Short Term Borrowings
` in Crores
Par cularsAs at
31.03.2013As at
31.03.2012Secured Borrowings(secured by pari passu rst charge on inventories and trade receivables)
From Banks
Foreign Currency Loans 38.00 117.32
Working Capital Demand Loans 120.00 -
Cash Credit and other borrowings 38.14 42.85 196.14 160.17
NOTES TO FINANCIAL STATEMENTS

50 | Tube Investments of India Limited
` in Crores
Par cularsAs at
31.03.2013As at
31.03.2012
Unsecured Borrowings
From Banks
Foreign Currency Loans 56.61 4.79
Working Capital Demand Loans 50.00 100.00
Cash Credit and other borrowings 0.42 31.27
107.03 136.06
303.17 296.23
8. Trade Payables
` in Crores
Par cularsAs at
31.03.2013As at
31.03.2012
Trade Payables
- Dues to Micro, Small & Medium Enterprises (See Note below) 1.48 0.90
- Goods and Services* 421.77 490.44
Acceptances 62.16 59.06
485.41 550.40
*Includes Dues to Subsidiaries
- Sedis SAS - 0.03
- Cholamandalam Investment and Finance Co Ltd - 0.03
- Shanthi Gears Ltd 0.01 -
Note:
Based on, and to the extent of informa on received from the suppliers regarding their status under the Micro, Small and Medium Enterprises Development Act, 2006 (MSMED Act), and relied upon by the Auditors, the relevant par culars are furnished below:
` in Crores
Par cularsAs at
31.03.2013As at
31.03.2012
Principal amount due to suppliers under MSMED Act 1.39 0.88
Interest accrued and due to suppliers under MSMED Act, on the above amount
0.05 0.00
Payment made to suppliers (other than interest) beyond the appointed day, during the year
9.05 5.70
Interest paid to suppliers under MSMED Act (Sec on 16) 0.01 0.02
Interest due and payable to suppliers under MSMED Act, for payments already made
0.04 0.02
Interest accrued and remaining unpaid at the end of the year to suppliers under MSMED Act
0.09 0.02
NOTES TO FINANCIAL STATEMENTS

Tube Investments of India Limited | 51
9. Other Current Liabili es
` in Crores
Par cularsAs at
31.03.2013As at
31.03.2012
Current Maturi es of Long Term Borrowings
Secured, Listed and Rated Non-Conver ble Debentures (NCD)
11.70% Privately Placed NCD 50.00 -
9.75% Privately Placed NCD 150.00 -
8.75% Privately Placed NCD 150.00 -
8.60% Privately Placed NCD - 50.00
8.50% Privately Placed NCD - 50.00
External Commercial Borrowing 14.49 14.49
Deferred Payment Liability - Sales Tax Deferral 3.86 2.98
Interest Accrued but Not Due 45.98 21.06
Unpaid Dividends 2.00 1.91
Advances and Deposits from Customers/Others 5.42 5.17
Dues to Directors 1.89 1.72
Other Liabili es
- Recoveries from employees 2.67 2.00
- Statutory liabili es 9.29 10.77
- Capital Creditors 5.34 4.85
- Others 0.48 0.46
441.42 165.41
Amounts to be Credited to Investor Educa on and Protec on Fund towards: Unpaid Dividends
- -
Note:
The 9.75% Debentures are secured by a pari passu rst charge on certain immovable proper es of the Company. The Debentures are redeemable at par, at the end of thirteen months from the date of allotment, i.e., on 25 September 2013.
10. Short Term Provisions ` in Crores
Par cularsAs at
31.03.2013As at
31.03.2012
Provision for Compensated Absences 14.96 15.17
Provision for Warran es (Note a) 1.96 1.63
Provision for Con ngencies (Note b) 2.50 2.50
Provision for Wealth Tax 0.07 0.07
Provision for Others 13.52 13.31
Proposed Dividend 9.33 18.63
Distribu on Tax on Proposed Dividend 1.59 3.02
43.93 54.33
NOTES TO FINANCIAL STATEMENTS

52 | Tube Investments of India Limited
Note:
(a) Provision for Warran es ` in Crores
Par culars 2012-13 2011-12
At the beginning of the year 1.63 1.63
Created during the year 2.56 3.13
U lised during the year (2.23) (3.13)
At the end of the year 1.96 1.63
Provision for Warran es is es mated based on past experience and technical es mates.
(b) Provision for Con ngencies
The Company carries a general provision for con ngencies towards various claims against the Company not acknowledged as debts.
` in Crores
Par culars 2012-13 2011-12
At the beginning of the year 2.50 1.50
Created during the year - 1.00
U lised during the year - -
At the end of the year 2.50 2.50
NOTES TO FINANCIAL STATEMENTS

Tube Investments of India Limited | 53
11. Tangible Assets ` in Crores
Par culars
Gross Block at Cost Deprecia on/Amor sa on Net Block
As at 31.03.2012
Addi onsDele- ons
As at 31.03.2013
As at 31.03.2012
Addi ons (Note 1)
Dele- ons
As at 31.03.2013
As at 31.03.2013
As at 31.03.2012
Land (Freehold)
54.51 4.00 - 58.51 - - - - 58.51 54.51
(29.61) (24.90) - (54.51) - - - - (54.51) (29.61)
Land (Leasehold)
1.14 - - 1.14 0.11 0.03 - 0.14 1.00 1.03
(1.14) - - (1.14) (0.10) (0.01) - (0.11) (1.03) (1.04)
Buildings (Note 2)
174.33 16.13 0.12 190.34 48.38 5.85 0.05 54.18 136.16 125.95
(161.17) (13.28) (0.12) (174.33) (43.21) (5.22) (0.05) (48.38) (125.95) (117.96)
Plant & Machinery
941.70 79.98 15.55 1006.13 530.15 68.05 14.79 583.41 422.72 411.55
(873.39) (76.26) (7.95) (941.70) (470.69) (66.46) (7.00) (530.15) (411.55) (402.70)
Railway Siding 0.21 - - 0.21 0.20 - - 0.20 0.01 0.01
(0.21) - - (0.21) (0.19) (0.01) - (0.20) (0.01) (0.02)
O ce Equipment
27.21 2.70 6.92 22.99 19.97 3.44 6.58 16.83 6.16 7.24
(22.90) (5.36) (1.05) (27.21) (18.45) (2.57) (1.05) (19.97) (7.24) (4.45)
Furniture & Fixtures
12.11 1.86 0.80 13.17 9.28 1.02 0.80 9.50 3.67 2.83
(10.19) (1.92) - (12.11) (8.48) (0.80) - (9.28) (2.83) (1.71)
Vehicles 7.11 1.85 1.70 7.26 3.72 1.38 1.22 3.88 3.38 3.39
(7.14) (1.42) (1.45) (7.11) (3.79) (1.01) (1.08) (3.72) (3.39) (3.35)
TOTAL 1218.32 106.52 25.09 1299.75 611.81 79.77 23.44 668.14 631.61 606.51
Previous Year (1105.75) (123.14) (10.57) (1218.32) (544.91) (76.08) (9.18) (611.81) (606.51) (560.84)
Notes:
1. Deprecia on/Amor sa on for the year includes deprecia on amoun ng to `2.25 Cr. (Previous Year `2.39 Cr.) charged addi onally on certain assets.
2. Net Block of Buildings includes Improvement to Buildings `10.61 Cr. (Previous Year `11.06 Cr.) constructed on Leasehold Land.
3. Previous Year Figures are given in brackets.
NOTES TO FINANCIAL STATEMENTS

54 | Tube Investments of India Limited
12. Non-Current Investments
(Valued at cost unless stated otherwise)
` in Crores
Par cularsNominal
Value (`)/Unit
Number Amount
As at 31.03.2013
As at 31.03.2012
As at 31.03.2013
As at 31.03.2012
Investment in Subsidiary Companies:
Trade Investments:
Equity Shares (Fully Paid) - Quoted
Shanthi Gears Ltd. (Note a) 1 5,72,96,413 - 464.10 -
Equity Shares (Fully Paid) - Unquoted
Financiere C10 SAS (Note b) ¤15 2,23,920 1,72,712 60.14 43.59
TICI Motors (Wuxi) Company Ltd. (Note c) 3.81 3.81
Non-Trade Investments:
Equity Shares (Fully Paid) - Quoted
Cholamandalam Investment & Finance Co Ltd. 10 7,22,33,019 7,22,33,019 645.83 645.83
Equity Shares (Fully Paid) - Unquoted
Cholamandalam MS General Insurance Company Ltd. (Note d) 10 21,60,70,204 20,98,96,769 271.64 234.60
TI Financial Holdings Ltd. 10 1,10,000 1,10,000 0.11 0.11
Investment in Joint Venture:
Non-Trade Investments:
Equity Shares (Fully Paid) - Unquoted
Cholamandalam MS Risk Services Ltd. 10 9,89,979 9,89,979 0.99 0.99
Other Investments:
Trade Investments:
Equity Shares (Fully Paid) - Quoted
LG Balakrishnan & Bros. Ltd. (Cost - `40,238 only) 10 2,596 2,596 - -
LGB Forge Ltd. 1 25,960 25,960 - -
Non Trade Investments:
Equity Shares (Fully Paid) - Quoted
Carborundum Universal Ltd.(Cost - `23,574 only) 1 6,000 6,000 - -
Kar k Investments Trust Ltd. 10 33,790 33,790 0.04 0.04
Coromandel Engineering Company Ltd. 10 42,919 42,919 0.04 0.04
NOTES TO FINANCIAL STATEMENTS

Tube Investments of India Limited | 55
` in Crores
Par cularsNominal
Value (`)/Unit
Number Amount
As at 31.03.2013
As at 31.03.2012
As at 31.03.2013
As at 31.03.2012
GIC Housing Finance Ltd. 10 48,700 48,700 0.24 0.24
Equity Shares (Fully Paid) - Unquoted Indo Oceanic Shipping Co. Ltd.
(Cost - `1 only) 10 50,000 50,000 - - Bombay Mercan le Co-op. Ltd.
(Cost - `5,000 only) 10 500 500 - - Southern Energy Development
Corpora on Ltd. 10 70,000 70,000 0.07 0.07 Murugappa Management Services Ltd. 100 42,677 42,677 0.78 0.78 TI Cycles of India Co-opera ve Canteen
Ltd. (Cost - `250 only) 5 50 50 - - TI Diamond-Miller Co-opera ve
Canteen Ltd. (Cost - `100 only) 5 20 20 - - Andheri Sarabjit Co-opera ve Housing
Society Ltd. (Cost - `250 only) 50 5 5 - - Chennai Willingdon Corporate
Founda on (Cost - `100 only) 10 10 10 - - Others - Unquoted - Government of India Securi es 0.03 0.05 Less: Provision for Diminu on in Value of
Investments (Note c) (3.81) - 1444.01 930.15
As at 31.03.2013
As at 31.03.2012
Quoted Cost 1110.25 646.15 Market value 2296.63 1360.89 Unquoted Cost 333.76 284.00
Notes:
a. During the year, the Company acquired 70.12% stake in Shanthi Gears Limited (SGL) at the cost of `464.10 Cr. (5,72,96,413 Equity Shares at `81 per share) out of which 44.12% was acquired from erstwhile promoters on 3 September 2012 and 26% was acquired pursuant to the mandatory Open O er under the SEBI (Substan al Acquisi on of Shares & Takeovers) Regula ons, 2011 from the public shareholders on 19 November 2012. Accordingly, SGL has become a Subsidiary of the Company.
b. During the year, the Company acquired 22.87% stake in Financiere C10 SAS (FC10), an Overseas Subsidiary in France, at an investment of `16.55 Cr. As a result, FC10 has become a Wholly Owned Subsidiary of the Company with e ect from 17 December 2012.
c. Considering the business condi ons, the Company has decided to voluntarily liquidate TICI Motors (Wuxi) Company Limited, a Wholly Owned Overseas Subsidiary in China. Consequently a sum of `3.81 Cr. has been provided towards the diminu on in value of investments.
d. During the year, the Company subscribed to 61,73,435 Equity Shares of `10 each of Cholamandalam MS General Insurance Company Limited, a Subsidiary, o ered on Rights basis at `60 per share amoun ng to `37.04 Cr.
NOTES TO FINANCIAL STATEMENTS

56 | Tube Investments of India Limited
13. Long Term Loans and Advances
(Considered Good, Unsecured unless stated otherwise)
` in Crores
Par cularsAs at
31.03.2013As at
31.03.2012
Capital Advances
- Secured 21.35 19.57
- Unsecured 5.02 16.98
Loans and advances
- Electricity and other deposits 6.00 7.55
- Others 1.61 3.41
Balance with Customs, Excise and Sales Tax Authori es 6.60 8.52
Advance Income Tax (Net of Provision) 38.11 38.77
78.69 94.80
14. Current Investments
` in Crores
Par cularsNominal
Value(`)/Unit
Number of units Amount
As at 31.03.2013
As at 31.03.2012
As at 31.03.2013
As at 31.03.2012
Others (At cost) - Unquoted
Government Securi es - - 0.02 -
- - 0.02 -
Note:
During the year, the Company has invested an aggregate amount of `985.54 Cr.(Previous Year `507.91 Cr.) in units of various Cash Management Schemes of Mutual Funds, for the purpose of deployment of temporary cash surpluses.The total considera on on sale of these units during the year was `989.52 Cr. (Previous Year `525.87 Cr.).
15. Inventories
(Lower of Cost and es mated Net Realisable Value (Net of Allowances)) ` in Crores
Par cularsAs at
31.03.2013As at
31.03.2012
Raw Materials 145.46 177.79
Work-in-Progress 81.93 86.47
Finished Goods 97.22 93.82
Stock-in-Trade 21.20 25.78
Stores and Spare Parts 5.70 6.99
Goods-in-Transit
- Raw Materials 4.02 2.75
- Stock-in-Trade 1.24 16.40 356.77 410.00
NOTES TO FINANCIAL STATEMENTS

Tube Investments of India Limited | 57
NOTES TO FINANCIAL STATEMENTS
Details of Inventories ` in Crores
Par culars
Cycles/Components/E-Scooters
Steel Strips and Tubes Metal Formed Products Total
As at31.03.2013
As at31.03.2012
As at31.03.2013
As at31.03.2012
As at31.03.2013
As at31.03.2012
As at31.03.2013
As at31.03.2012
Raw Materials 53.78 62.28 65.12 77.15 26.56 38.36 145.46 177.79
Work-in-Progress 24.16 8.56 31.65 38.93 26.12 38.98 81.93 86.47
Finished Goods 19.04 24.25 57.24 48.39 20.94 21.18 97.22 93.82
Stock-in-Trade 19.78 24.19 - - 1.42 1.59 21.20 25.78
Stores and Spare Parts - - 3.87 3.83 1.83 3.16 5.70 6.99
Goods-in-Transit
- Raw Materials 2.89 - 0.77 2.61 0.36 0.14 4.02 2.75
- Stock-in-Trade 1.24 16.39 - - - 0.01 1.24 16.40
Total Inventory 120.89 135.67 158.65 170.91 77.23 103.42 356.77 410.00
16. Trade Receivables
(Unsecured) ` in Crores
Par cularsAs at
31.03.2013As at
31.03.2012
Outstanding for a period exceeding six months from the date they are due for payment
Considered good 2.53 4.96
Doub ul 8.28 8.52
10.81 13.48
Others
Considered good* 391.87 430.89
Doub ul 0.27 0.36
392.14 431.25
Gross Trade Receivables 402.95 444.73
Provision for Doub ul Receivables (8.55) (8.88)
394.40 435.85 *Includes Dues from Subsidiaries
- Financiere C10 SAS 4.62 3.38
- Societe De Commercialisa on De Composants Industriels - SARL 0.85 1.16
- Sedis SAS 4.09 5.05
- Shanthi Gears Limited 0.84 -

58 | Tube Investments of India Limited
17. Cash and Cash Equivalents
` in Crores
Par cularsAs at
31.03.2013As at
31.03.2012
Balance with Banks
- Current Accounts* 31.16 21.57
- Unpaid Dividend Accounts 2.00 1.91
- Fixed Deposit Accounts - 59.17
33.16 82.65
Cheques on Hand - 3.18
Cash on Hand 0.11 0.09
33.27 85.92
*includes balance in restricted bank account 0.91 0.91
Note: Of the above, the balances that meet the de ni on of Cash and Cash Equivalents as per AS 3 Cash Flow Statements is 30.36 83.10
18. Short Term Loans and Advances
(Unsecured and considered good unless otherwise stated)
` in Crores
Par cularsAs at
31.03.2013As at
31.03.2012
Advances Recoverable
- Goods and Services 17.17 28.09
- Employee related 1.14 1.23
- Prepaid expenses 3.95 3.54
- Gratuity Fund (Net of Provision) (Refer Note 34) 0.78 0.71
- Others 1.93 1.88
24.97 35.45
Deposit with Subsidiary - Cholamandalam MS General Insurance Co. Ltd. 0.07 0.06
Other deposits 5.97 5.39
Balances with Customs, Excise and Sales Tax Authori es 8.40 5.59
Fringe Bene ts Tax (Net of Provision) 0.01 0.01
39.42 46.50
NOTES TO FINANCIAL STATEMENTS

Tube Investments of India Limited | 59
19. Sale of Products
` in Crores
Par cularsYear Ended31.03.2013
Year Ended31.03.2012
Cycles/Components 1270.29 1276.63 E-Scooters 3.37 18.39 Steel Strips and Tubes 1495.66 1446.83 Metal Formed Products 872.93 922.92 Sale of Products - Gross# 3642.25 3664.77 Excise Duty on Sales (251.88) (200.35)Sale of Products - Net 3390.37 3464.42 #Includes Sale of Stock-in-Trade - Cycles/Components 158.08 210.76 - Metal Formed Products 9.94 11.96
20. Other Opera ng Revenue
` in Crores
Par cularsYear Ended31.03.2013
Year Ended31.03.2012
Conversion Income 1.29 2.80 Cash Discount 0.90 0.98 Export Bene ts 5.85 5.98 Service Income from Subsidiaries 5.36 3.38 Subsidy Income - 2.24 Liabili es no longer payable wri en back 0.77 4.16 Others 2.89 5.81
17.06 25.35
21. Other Income
` in Crores
Par cularsYear Ended31.03.2013
Year Ended31.03.2012
Dividend income from Subsidiary 25.28 21.67 Joint Venture 0.25 0.20 Non-Trade Investments 0.38 0.70 Current Investments - 3.93
25.91 26.50 Interest Income Fixed Deposits with Banks 4.36 0.47 Others 5.64 3.45
10.00 3.92 Rental Income 0.04 0.02 Royalty Income 0.32 0.41 Pro t on Tangible Assets Sold/Discarded (Net) - 0.12 Pro t on Sale of Current Investments 3.98 -
40.25 30.97
NOTES TO FINANCIAL STATEMENTS

60 | Tube Investments of India Limited
22. Cost of Materials Consumed
` in Crores
Par cularsYear Ended31.03.2013
Year Ended31.03.2012
Opening Raw Material 180.54 199.34 Purchases 2072.29 2149.96 Closing Raw Material (149.48) (180.54)Raw Materials Consumed 2103.35 2168.76 Scrap Sales (Net of Excise Duty) (158.11) (155.35)Raw Materials Consumed (Net) 1945.24 2013.41 Itemwise breakup of Raw Material Consumed is given below: Steel 1330.22 1377.13 Rims 70.29 73.80 Tyres 81.81 79.98 Cycle Tubes 32.20 32.96 Saddle 34.82 34.39 Chains 15.16 15.70 Frames 120.45 120.12 Forks 44.14 38.97 Mudguards 26.21 27.35 E Scooters, Bicycle Components and Others 348.05 368.36 Raw Materials Consumed 2103.35 2168.76
23. Changes in Inventories of Finished Goods, Work-in-Progress and Stock-in-Trade
` in Crores
Par cularsYear Ended31.03.2013
Year Ended31.03.2012
Opening Stock Work-in-Progress 86.47 65.19 Finished Goods 93.82 91.78 Stock-in-Trade 42.18 28.03
222.47 185.00 Closing Stock Work-in-Progress 81.93 86.47 Finished Goods 97.22 93.82 Stock-in-Trade 22.44 42.18
201.59 222.47 20.88 (37.47)
24. Employee Bene ts Expense
` in Crores
Par cularsYear Ended31.03.2013
Year Ended31.03.2012
Salaries, Wages and Bonus 227.49 212.21
Contribu on to Provident and Other Funds 18.36 18.29
Welfare Expenses 31.50 28.73 277.35 259.23
NOTES TO FINANCIAL STATEMENTS

Tube Investments of India Limited | 61
25. Other Expenses
` in Crores
Par cularsYear Ended31.03.2013
Year Ended31.03.2012
Consump on of Stores and Spares 145.72 144.30 Freight and Carriage Inwards 46.84 46.17 Conversion Charges 75.20 70.49 Power and Fuel* 147.52 125.10 Rent 12.51 9.41 Repairs to Buildings 0.90 0.75 Repairs to Machinery 48.31 49.97 Insurance 3.71 3.67 Rates and Taxes 12.46 8.04 Travelling and Conveyance 14.52 13.21 Prin ng, Sta onery and Communica on 5.79 5.40 Freight, Delivery and Shipping Charges 106.42 97.83 Discounts/Incen ves on Sales 26.54 33.51 Adver sement and Publicity 25.86 33.00 Trade Receivables Wri en O - 1.75 Release of Doub ul Trade Receivables Provision (0.33) (1.75)Provision for Doub ul Receivables - 0.97 Loss on Tangible Assets Sold/Discarded (Net) 0.17 - Auditors’ Remunera on (Note a) 0.60 0.49 Commission to Non Whole Time Directors 1.30 1.30 Directors’ Si ng Fees 0.08 0.08 Loss on Exchange Fluctua on (Net) 2.97 4.28 Provision for Con ngencies - 1.00 Bank Charges 2.51 2.05 Informa on Technology Expenses 7.15 7.09 Dona ons to Charitable and other ins tu ons 1.26 1.07 Dona ons to Poli cal Par es - Bhara ya Janata Party - 0.10 - Desiya Murpokku Dravida Kazhagam - 0.25 Administra on Expenses 8.24 6.89 Other Expenses 38.94 35.59
735.19 702.01 *Includes Stores Consumed 88.33 78.93
Note:
a) Auditors’ Remunera on ` in Crores
Par cularsYear Ended31.03.2013
Year Ended31.03.2012
As Auditor: Audit fee 0.30 0.25 Tax audit fee 0.03 0.03 Limited review 0.08 0.06 Consolida on fee 0.06 0.05In other capacity: Taxa on ma ers 0.02 0.02 Company law ma ers 0.01 0.01 Other services (Cer ca on fees) 0.09 0.07Reimbursement of expenses 0.01 0.00
0.60 0.49
NOTES TO FINANCIAL STATEMENTS

62 | Tube Investments of India Limited
26. Finance Costs` in Crores
Par cularsYear Ended31.03.2013
Year Ended31.03.2012
Interest Expense 93.93 68.81 Exchange di erence on Foreign Currency Loans 9.47 6.60 Other Borrowing Costs 0.76 1.15
104.16 76.56
27. Commitments and Con ngent Liabili es` in Crores
Par culars As at31.03.2013
As at31.03.2012
a) Es mated amount of contracts remaining to be executed on capital account and not provided for:
i. Capital Expenditure 94.76 90.82 ii. Investments - 53.85 b) Disputed Income-Tax demands from A.Y. 1993-94 to 2009-10 under appeal/
remand pending before various appellate/assessing authori es against which `28.02 Cr. (Previous Year `29.54 Cr.) has been deposited. The Balance of `1.47 Cr. (Previous Year `1.91 Cr.) is not deposited for which rec ca on pe ons/appeals have been led. The Management is of the opinion that the above demands are not sustainable. 29.49 31.45
c) Disputed Service Tax, Excise and Customs duty demand amoun ng to ̀ 1.78 Cr. (Previous Year `1.72 Cr.) and penalty of `1.22 Cr. (Previous Year `1.22 Cr.) pertaining to nancial years 1999-00 to 2005-06 under appeal pending before the Appellate Tribunal. The same has not been deposited. The Management is of the opinion that the demand is arbitrary and the same is not sustainable. 3.00 2.94
d) Cases decided in favour of the Company against which the department has gone on an appeal
i. Income Tax 43.21 43.14 ii. Excise 2.18 2.18 e) Export obliga on under EPCG/Advance License Scheme to be ful lled.
The Company is con dent of mee ng its obliga ons under the Schemes within the S pulated Period. 68.90 26.03
f) Bills drawn on Customers and Discounted with Banks 1.44 1.03
Note: Show Cause No ces received from various Government Authori es pending adjudica on have not been considered
as Con ngent Liabili es.
28. Research and Developme nt Expenses
Research and Development Expenses incurred by the Company are given below.
a) Revenue Expenditure (disclosed in Notes 24 and 25 under the respec ve heads) ` in Crores
Par culars 2012-13 2011-12Salaries, Wages and Bonus 5.00 4.44Contribu on to Provident and Other Funds 0.48 0.26Welfare Expenses 0.06 0.04Consump on of Stores and Spares 1.58 0.85Power and Fuel 0.29 0.22Repairs to Machinery 0.16 0.04Other Expenses 4.41 2.85Total 11.98 8.70
NOTES TO FINANCIAL STATEMENTS

Tube Investments of India Limited | 63
b) Capital Expenditure (disclosed in Note 11 under the respec ve heads)
Par culars 2012-13 2011-12
Plant & Machinery 2.76 0.63
O ce Equipment 0.25 0.30
Furniture & Fixtures 0.53 0.08
Vehicles 0.09 0.20
Total 3.63 1.21
29. Imported and Indigenous Materials Consumed
(a) Consump on of Raw Materials (Refer Note 22)
Par culars2012-13 2011-12
% ` in Crores % ` in Crores
Imported 10.23 215.27 9.77 211.90
Indigenous 89.77 1888.08 90.23 1956.86
Total 100.00 2103.35 100.00 2168.76
(b) Consump on of Stores and Spares
Par culars 2012-13 2011-12
% ` in Crores % ` in Crores
Imported 3.00 7.01 3.41 7.62
Indigenous
- Fuel 37.74 88.33 35.36 78.93
- Others 59.27 138.71 61.23 136.68
Total 100.00 234.05 100.00 223.23
30. Value of Imports on CIF Basis
` in Crores
Par culars 2012-13 2011-12
Raw Materials 223.36 230.30
Stores and Spare Parts 11.06 8.50
Finished Goods 129.12 180.03
Capital Goods 89.34 27.92
Total 452.88 446.75
31. Earnings in Foreign Exchange
` in Crores
Par culars 2012-13 2011-12
FOB Value of Exports 189.02 188.76
Service Income 4.62 3.38
Total 193.64 192.14
NOTES TO FINANCIAL STATEMENTS

64 | Tube Investments of India Limited
32. Amount Remi ed in Foreign Currency on account of Dividend Payment to Non-Resident Shareholders
Par culars 2012-13 2011-12
Dividend* - ` in Crores 0.01 0.02
Number of Non-Resident Shareholders 1 1
Number of Equity Shares held 56,700 of `2 each
56,700 of `2 each
Year for which Dividend Remi ed
- Final 2011-12 2010-11
- Interim 2012-13 2011-12
*The above excludes remi ances amoun ng to ̀ 1.61 Cr. (Previous Year ̀ 2.25 Cr.) to Global Depository Receipt (GDR) holders through the custodian of GDR holders.
33. Expenditure in Foreign Currency
` in Crores
Par culars 2012-13 2011-12
Travel 0.66 0.85
Interest on Foreign Currency Loans 4.38 1.23
Royalty 1.46 2.08
Others 4.75 5.42
Total 11.25 9.58
34. Employee Bene ts
a) Gratuity
Actuarial data on Gratuity: ` in Crores
Par culars 2012-13 2011-12
Change in Bene t Obliga on
Projected Bene t Obliga on as at Year Beginning 28.88 25.79
Service Cost 2.91 2.63
Interest Cost 2.23 1.97
Actuarial Losses 0.15 0.90
Bene ts Paid (2.00) (2.41)
Projected Bene t Obliga on as at Year End 32.17 28.88
Change in Plan Assets
Fair Value of Plan Assets as at Year Beginning 29.59 27.48
Expected/Actual Return on Plan Assets 2.75 2.45
Employer’s Contribu on 2.61 2.07
Bene ts Paid (2.00) (2.41)
Fair Value of Plan Assets as at Year End 32.95 29.59
NOTES TO FINANCIAL STATEMENTS

Tube Investments of India Limited | 65
` in Crores
Par culars 2012-13 2011-12
Amounts Recognised in the Balance Sheet
Projected Bene t Obliga on at the Year End 32.17 28.88
Fair Value of the Plan Assets at the Year End 32.95 29.59
Asset Recognised in the Balance Sheet 0.78 0.71
Cost of the De ned Bene t Plan for the Year
Current Service Cost 2.91 2.63
Interest on Obliga on 2.23 1.97
Expected/Actual Return on Plan Assets (2.75) (2.45)
Actuarial Losses Recognised in the Year 0.15 0.90
Net Cost Recognised in the Statement of Pro t and Loss 2.54 3.05
Assump ons 2012-13 2011-12
Discount Rate 8.00% 8.00%
Future Salary Increase (%) 5.00% 5.00%
A ri on Rate 1 to 3% 1 to 3%
Expected Rate of Return on Plan Assets 8.00% 8.00%
Notes:
i. The en re Plan Assets are managed by Life Insurance Corpora on of India (LIC). In the absence of the relevant informa on from the LIC/Actuary, the above details do not include the composi on of plan assets and experience adjustment in respect of actuarial losses/gains.
ii. The expected/actual return on Plan Assets is as furnished by LIC.
iii. The es mate of future salary increase takes into account in a on, likely increments, promo ons and other relevant factors.
b) Provident Fund
The Company’s Provident Fund is exempted under Sec on 17 of the Employees’ Provident Fund Act, 1952. Condi ons for the grant of exemp on s pulate that the employer shall make good the de ciency, if any, in the interest rate declared by the Trust over the statutory limit.
c) Long Term Compensated Absences
The assump on used for compu ng the long term accumulated compensated absences on actuarial basis are as follows:
Assump ons 2012-13 2011-12
Discount Rate 8.00% 8.00%
Future Salary Increase (%) 5.00% 5.00%
A ri on Rate 1 to 3% 1 to 3%
Expected Rate of Return on Plan Assets 8.00% 8.00%
NOTES TO FINANCIAL STATEMENTS

66 | Tube Investments of India Limited
35. Segment Informa on
The Company’s opera ons are organised into three major divisions - Cycles/Components/E-Scooters, Engineering and Metal Formed Products which comprise the primary basis of segmental informa on. Secondary segmental repor ng is based on geographical loca on of customers and assets.
(A) PRIMARY SEGMENT ` in Crores
PARTICULARSCYCLES/ COMPONENTS/
E-SCOOTERSENGINEERING
METAL FORMED PRODUCTS
ELIMINATIONS CONSOLIDATED TOTAL
2012-13 2011-12 2012-13 2011-12 2012-13 2011-12 2012-13 2011-12 2012-13 2011-12
REVENUE
External Sales 1255.45 1284.75 1340.60 1320.09 794.32 859.58 3390.37 3464.42
Inter-Segment Sales 0.00 0.00 126.80 129.24 0.47 0.25 (127.27) (129.49) - -
Other Opera ng Revenue 2.92 8.15 3.94 7.31 9.19 9.75 16.05 25.21
Unallocated Corporate Income 1.01 0.14
Total Revenue 1258.37 1292.90 1471.34 1456.64 803.98 869.58 (127.27) (129.49) 3407.43 3489.77
Unallocated Corporate Expenses (17.10) (23.48)
RESULTS
Opera ng Pro t 52.86 75.56 109.94 131.00 79.59 111.93 225.29 295.01
Pro t/(Loss) on Sale of Assets (0.06) 0.00 (0.18) 0.12 0.24 0.03 0.00 0.15
Net Opera ng Pro t 52.80 75.56 109.76 131.12 79.83 111.96 225.29 295.16
Dividend Income 25.91 26.50
Finance Costs (104.16) (76.56)
Tax Expense (43.25) (65.01)
Excep onal Item - Provision for
Diminu on in Value of Investment in Subsidiary (3.81) (3.81) -
Pro t on Sale of Current Investments 3.98 -
Net Pro t 48.99 75.56 109.76 131.12 79.83 111.96 103.96 180.09
ASSETS
Segment Assets 284.63 303.33 735.33 704.96 610.11 642.73 (23.08) (23.42) 1606.99 1627.60
Unallocated Corporate Assets* 1530.93 1020.55
Total Assets 284.63 303.33 735.33 704.96 610.11 642.73 (23.08) (23.42) 3137.92 2648.15
LIABILITIES
Segment Liabili es 199.35 212.91 235.27 255.99 122.11 151.08 (23.08) (23.42) 533.65 596.56
Unallocated Corporate Liabili es 68.76 56.11
Total Liabili es 199.35 212.91 235.27 255.99 122.11 151.08 (23.08) (23.42) 602.41 652.67
OTHER INFORMATION
Capital Expenditure 10.51 5.82 82.24 93.31 48.81 60.57 141.56 159.70
Unallocated Corporate Capital Expenditure
75.60 5.60
Deprecia on 8.90 6.97 33.87 30.23 33.93 36.67 76.70 73.87
Unallocated Corporate Deprecia on 3.07 2.21
*includes Income Tax Assets (Net)
NOTES TO FINANCIAL STATEMENTS

Tube Investments of India Limited | 67
(B) SECONDARY SEGMENT ` in Crores
Par culars 2012-13 2011-121) Revenue by Geographic Market India 3207.34 3292.03 Rest of The World 200.09 197.74 Total 3407.43 3489.772) Segment Assets by Geographic Market India 1571.24 1590.02 Rest of The World 35.75 37.58 Total 1606.99 1627.603) Capital Expenditure by Geographic Market India 217.16 165.30 Rest of The World - - Total 217.16 165.30
36. Disclosure in respect of Related Par es pursuant to Accoun ng Standard 18
a) List of Related Par es
I. Subsidiary Companies
a. Shanthi Gears Limited (Associate from 3 September 2012 to 18 November 2012 and Subsidiary with e ect from 19 November 2012)
b. Cholamandalam MS General Insurance Company Limited
c. Cholamandalam Investment and Finance Company Limited and its Subsidiaries namely
i. Cholamandalam Distribu on Services Limited
ii. Cholamandalam Factoring Limited and
iii. Cholamandalam Securi es Limited
d. TI Financial Holdings Limited
e. TICI Motors (Wuxi) Company Limited (Refer Note 12 (c))
f. Financiere C10 SAS and its Subsidiaries namely
i. Sedis SAS
ii. Societe De Commercialisa on De Composants Industriels - SARL (S2CI) and
iii. Sedis Co. Ltd.
II. Associate - Inves ng Company
Murugappa Holdings Limited
III. Joint Venture Company
Cholamandalam MS Risk Services Limited
IV. Key Management Personnel (KMP)
Mr. L Ramkumar - Managing Director
Note: Related party rela onships are as iden ed by the Management and relied upon by the Auditors.
NOTES TO FINANCIAL STATEMENTS

68 | Tube Investments of India Limited
b) During the year the following transac ons were carried out with the related par es in the ordinary course of business:
` in Crores
Transac on Related Party 2012-13 2011-12
Dividend Received Cholamandalam Investment and Finance Company LimitedCholamandalam MS Risk Services Limited
25.28 0.25
21.67 0.20
Dividend Paid Murugappa Holdings Limited Mr. L Ramkumar
16.01 0.05
22.42 0.06
Claims Received Cholamandalam MS General Insurance Company Limited 0.48 4.11
Premium Paid Cholamandalam MS General Insurance Company Limited 5.40 5.42
Rentals Paid Cholamandalam Investment and Finance Company Limited 0.14 0.33
Subscrip on to Equity Shares
Cholamandalam MS General Insurance Company LimitedTI Financial Holdings LimitedTICI Motors (Wuxi) Company Limited
37.04 - -
37.04 0.04 0.56
Sales and Services rendered
Shanthi Gears LimitedFinanciere C10 SASSedis SASS2CI
0.74 4.62
11.84 2.56
- 3.38
14.24 2.73
Purchases Shanthi Gears LimitedSedis SAS
0.14 0.04
- 0.11
Fee paid for Risk Services Cholamandalam MS Risk Services Limited - 0.05
Recovery of Expenses Sedis SAS 0.16 -
Reimbursement of Expenses
Cholamandalam MS General Insurance Company LimitedCholamandalam Investment and Finance Company LimitedTICI Motors (Wuxi) Company Limited
0.03 - -
0.02 0.03 0.06
Amount received on exercise of Employee Stock Op ons
Mr. L Ramkumar 0.19 0.39
Purchase of Fixed Assets Shanthi Gears LimitedSedis SAS
0.03 1.32
- 0.80
Sale of Fixed Assets Cholamandalam Investment and Finance Company Limited 0.03 -
Rental Deposit Cholamandalam Investment and Finance Company Limited 0.01 0.15
Payable Shanthi Gears LimitedCholamandalam Investment and Finance Company LimitedSedis SASMr. L Ramkumar
0.01 - -
0.59
- 0.03 0.03 0.42
Receivable Shanthi Gears LimitedCholamandalam MS General Insurance Company LimitedFinanciere C 10 SASSedis SASS2CI
0.84 0.07 4.62 4.09 0.85
- 0.06 3.38 5.05 1.16
NOTES TO FINANCIAL STATEMENTS

Tube Investments of India Limited | 69
c) Details of remunera on to Key Management Personnel is given below: ` in Crores
Par culars 2012-13 2011-12
Managing Director’s Remunera on
- Salaries and Allowances 1.65 1.54
- Provident Fund and Super Annua on 0.16 0.14
- Welfare and Perquisites 0.09 0.03
- Incen ve 0.59 0.42
2.49 2.13
Notes:
a. Managing Director’s remunera on excludes Provision for Gratuity and Compensated Absences since the amount cannot be ascertained individually.
b. The incen ve payable to the Managing Director is provisional and subject to determina on by the Board and the same will be paid a er the adop on of accounts by the shareholders at the Annual General Mee ng.
37. Opera ng Leases
The Company has opera ng lease agreements for o ce space and residen al accommoda on generally which are cancellable in nature. As per the lease terms, an amount of `9.14 Cr. (Previous Year `6.51 Cr.) has been recognised in the Statement of Pro t and Loss.
38. Earnings Per Share
Par culars 2012-13 2011-12
Pro t a er Taxa on – ` in Crores 103.96 180.09
Weighted Average Number of Shares
- Basic 18,64,65,999 18,59,37,978
- Diluted 18,69,61,944 18,64,59,480
Earnings Per Share of `2 each
- Basic 5.58 9.69
- Diluted 5.56 9.66
Stock Op ons
The Company has granted Stock Op ons to certain employees in line with the Employees Stock Op on Scheme. The Fair Value of Op ons used to compute proforma net pro t and earnings per Equity Share have been es mated on the date of the grants using Black-Scholes model by an independent consultant.
NOTES TO FINANCIAL STATEMENTS

70 | Tube Investments of India Limited
The key assump ons used in Black-Scholes model for calcula ng the fair value as on the date of the grants are:
Par culars Ves ng Date Risk-free Interest Rate Expected Life
Expected Vola lity of Share Price
Dividend Yield
Price of the Underlying Share in the market at the
me of Op on grant
Fair Value of the Op on
% (p.a) (Years) (%) (%) (`) (`)Grant 1 31.10.08 7.71 2.50 39.11 3.43 62.85 16.43Grant 2 30.01.09 7.44 2.50 42.02 3.43 66.10 18.11Grant 3 31.10.09
31.10.10 31.10.11
8.258.238.22
1.622.122.62
31.5632.2837.07
1.861.861.86
56.8056.8056.80
107.13107.73108.53
Grant 4 31.07.09 31.07.10 31.07.11 31.07.12
0.008.248.228.22
0.001.992.492.99
0.0032.3734.2239.82
1.861.861.861.86
44.4544.4544.4544.45
117.15118.02118.13118.38
Grant 5 31.10.09 31.10.10 31.10.11 31.10.12
8.318.238.228.21
0.122.122.623.24
32.9832.2837.0742.55
1.861.861.861.86
24.2524.2524.2524.25
137.33135.00134.38133.62
Grant 6 30.01.10 30.01.11 30.01.12 30.01.13
8.318.238.228.21
0.242.242.743.49
28.0433.9638.5243.77
1.861.861.861.86
31.0531.0531.0531.05
130.44129.19128.82128.32
Grant 7 29.01.1229.01.1329.01.1429.01.15
8.268.218.218.22
1.243.484.485.48
31.6943.7946.7345.74
1.861.861.861.86
140.05140.05140.05140.05
39.4567.5776.3480.72
Grant 8 29.01.1229.01.1329.01.14
8.268.218.21
1.243.484.48
31.6943.7946.73
1.861.861.86
140.05140.05140.05
39.4567.5776.34
Grant 9 29.01.1229.01.13
8.268.21
1.243.48
31.6943.79
1.861.86
140.05140.05
39.4567.57
Grant 10 02.05.1202.05.1302.05.1402.05.15
8.258.218.218.22
1.373.744.745.74
31.3842.9947.2745.12
1.861.861.861.86
140.45140.45140.45140.45
40.4468.5478.1081.25
Grant 11 01.08.1201.08.1301.08.1401.08.15
8.258.218.228.23
1.493.994.995.99
31.7646.6347.0144.83
1.861.861.861.86
159.75159.75159.75159.75
31.7866.7673.5876.81
Grant 12 02.11.1202.11.1302.11.1402.11.15
8.248.218.228.23
1.744.245.246.24
32.7446.9346.2046.36
1.861.861.861.86
143.10143.10143.10143.10
43.5574.0679.0383.69
Had compensa on cost for the Stock Op ons granted under the Scheme been determined based on fair value approach, the Company’s pro t and earnings per share would have been as per the pro forma amounts indicated below:
Impact on Pro t for the year ` in Crores
Par culars 2012-13 2011-12Pro t for the year (As reported) 103.96 180.09 Stock based employee compensa on expense included in Net Pro t - -Stock based compensa on expense determined under fair value based method (Pro forma)
(3.49) (0.41)
Pro t for the year (Pro forma) 100.47 179.68
Impact on Earnings Per Share
Par culars 2012-13 2011-12Basic Earnings per Share of `2 each (As reported) 5.58 9.69 Basic Earnings per Share of `2 each (Pro forma) 5.39 9.66 Diluted Earnings per Share of `2 each (As reported) 5.56 9.66 Diluted Earnings per Share of `2 each (Pro forma) 5.37 9.64
NOTES TO FINANCIAL STATEMENTS

Tube Investments of India Limited | 71
39. Informa on on Joint Venture En ty
The par culars of the Company’s Joint Venture En ty as at 31 March 2013 including its percentage holding and its propor onate share of assets, liabili es, income and expenditure of the Joint Venture En ty are given below:
` in CroresPar culars As at 31.03.2013 2012-13
Name of the Joint Venture
% Holding Assets Liabili esCon ngent Liabili es
Capital Commitments
Income Expenses
Cholamandalam MS Risk Services Limited
49.50% 6.12 1.28 0.04 - 7.17 5.63
(49.50%) (7.22) (3.12) (-) (-) (7.20) (5.11) Notes: a) Figures in brackets are for the previous year. b) The above Joint Venture En ty is located in India.
40. Accoun ng for Deriva ves
Pursuant to the announcement of the Ins tute of Chartered Accountants of India (ICAI) in respect of “Accoun ng for Deriva ves”, the Company had opted to follow the recogni on and measurement principles rela ng to deriva ves as speci ed in AS 30 “Financial Instruments, Recogni on and Measurement”, issued by the ICAI, from the year ended 31 March 2008.
Consequently, as of 31 March 2013, the Company has recognised Mark to Market (MTM) Loss of `0.32 Cr. (Previous Year Gain ̀ 0.46 Cr.) rela ng to Deriva ve Contracts entered into, to hedge the foreign currency risk of highly probable forecast transac ons that are designated as e ec ve cash ow hedges, in the Hedge Reserve Account as part of the Shareholders’Funds.
There was no undesignated/ine ec ve Deriva ve Contracts as on 31 March 2013. The movement in the Hedge Reserve Account during the year for deriva ves designated as Cash Flow Hedges is as
follows: ` in CroresPar culars 2012-13 2011-12
At the beginning of the year 0.46 (0.36)Net Movement for the year (0.78) 0.82At the end of the year (0.32) 0.46
The Contracts in Hedge Reserve Account are expected to be recognised in the Statement of Pro t and Loss on occurrence of transac ons which are expected to take place over the next 12 months.
Details of Deriva ve Exposures are as under:
Type of Deriva ve Contracts Booked for
As at 31.03.2013 As at 31.03.2012Number of Contracts Value Number of
Contracts Value
Forward Contracts entered into to hedge the foreign currency risk of highly probable forecast transac ons
Future Export - - 18 $ 1.80 MFuture Export - - 12 ¤ 2.25 MFuture Export 1 $ 0.03 M 5 $ 1.69 MFuture Export 2 ¤ 2.46 M - -
Other Deriva ves (including currency swaps) Borrowings 2 $ 21.21 M 2 $ 24.31 M
41. Previous Year’s Figures
The Company has reclassi ed regrouped previous year gures to conform to this year’s classi ca on.Signatures to Notes to Financial Statements
On behalf of the Board
M M MurugappanChairman
Chennai2 May 2013
S SureshCompany Secretary
K BalasubramanianChief Financial O cer
L RamkumarManaging Director
NOTES TO FINANCIAL STATEMENTS
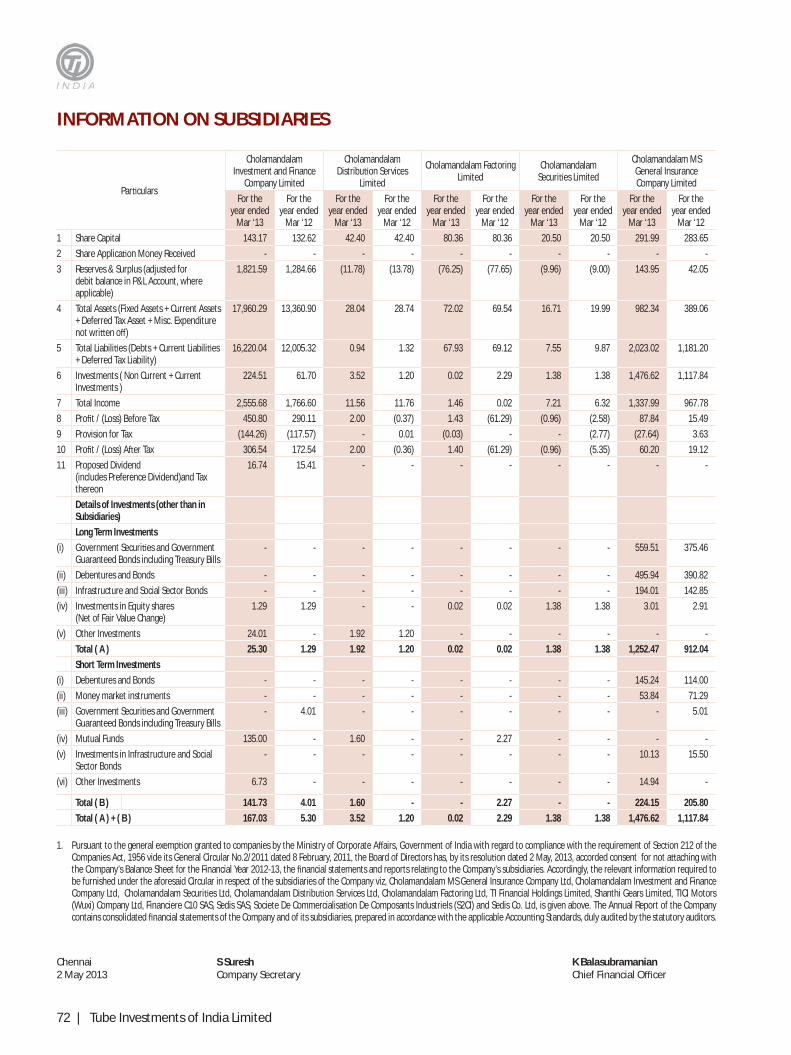
72 | Tube Investments of India Limited
INFORMATION ON SUBSIDIARIES
Par culars
Cholamandalam Investment and Finance
Company Limited
Cholamandalam Distribu on Services
Limited
Cholamandalam Factoring Limited
Cholamandalam Securi es Limited
Cholamandalam MS General Insurance Company Limited
For the year ended
Mar ‘13
For the year ended
Mar ‘12
For the year ended
Mar ‘13
For the year ended
Mar ‘12
For the year ended
Mar ‘13
For the year ended
Mar ‘12
For the year ended
Mar ‘13
For the year ended
Mar ‘12
For the year ended
Mar ‘13
For the year ended
Mar ‘12
1 Share Capital 143.17 132.62 42.40 42.40 80.36 80.36 20.50 20.50 291.99 283.65
2 Share Applica on Money Received - - - - - - - - - -
3 Reserves & Surplus (adjusted for debit balance in P&L Account, where applicable)
1,821.59 1,284.66 (11.78) (13.78) (76.25) (77.65) (9.96) (9.00) 143.95 42.05
4 Total Assets (Fixed Assets + Current Assets + Deferred Tax Asset + Misc. Expenditure not wri en o )
17,960.29 13,360.90 28.04 28.74 72.02 69.54 16.71 19.99 982.34 389.06
5 Total Liabili es (Debts + Current Liabili es + Deferred Tax Liability)
16,220.04 12,005.32 0.94 1.32 67.93 69.12 7.55 9.87 2,023.02 1,181.20
6 Investments ( Non Current + Current Investments )
224.51 61.70 3.52 1.20 0.02 2.29 1.38 1.38 1,476.62 1,117.84
7 Total Income 2,555.68 1,766.60 11.56 11.76 1.46 0.02 7.21 6.32 1,337.99 967.78
8 Pro t / (Loss) Before Tax 450.80 290.11 2.00 (0.37) 1.43 (61.29) (0.96) (2.58) 87.84 15.49
9 Provision for Tax (144.26) (117.57) - 0.01 (0.03) - - (2.77) (27.64) 3.63
10 Pro t / (Loss) A er Tax 306.54 172.54 2.00 (0.36) 1.40 (61.29) (0.96) (5.35) 60.20 19.12
11 Proposed Dividend (includes Preference Dividend)and Tax thereon
16.74 15.41 - - - - - - - -
Details of Investments (other than in Subsidiaries)
Long Term Investments
(i) Government Securi es and Government Guaranteed Bonds including Treasury Bills
- - - - - - - - 559.51 375.46
(ii) Debentures and Bonds - - - - - - - - 495.94 390.82
(iii) Infrastructure and Social Sector Bonds - - - - - - - - 194.01 142.85
(iv) Investments in Equity shares (Net of Fair Value Change)
1.29 1.29 - - 0.02 0.02 1.38 1.38 3.01 2.91
(v) Other Investments 24.01 - 1.92 1.20 - - - - - -
Total ( A ) 25.30 1.29 1.92 1.20 0.02 0.02 1.38 1.38 1,252.47 912.04
Short Term Investments
(i) Debentures and Bonds - - - - - - - - 145.24 114.00
(ii) Money market instruments - - - - - - - - 53.84 71.29
(iii) Government Securi es and Government Guaranteed Bonds including Treasury Bills
- 4.01 - - - - - - - 5.01
(iv) Mutual Funds 135.00 - 1.60 - - 2.27 - - - -
(v) Investments in Infrastructure and Social Sector Bonds
- - - - - - - - 10.13 15.50
(vi) Other Investments 6.73 - - - - - - - 14.94 -
Total ( B ) 141.73 4.01 1.60 - - 2.27 - - 224.15 205.80
Total ( A ) + ( B ) 167.03 5.30 3.52 1.20 0.02 2.29 1.38 1.38 1,476.62 1,117.84
1. Pursuant to the general exemp on granted to companies by the Ministry of Corporate A airs, Government of India with regard to compliance with the requirement of Sec on 212 of the Companies Act, 1956 vide its General Circular No.2/2011 dated 8 February, 2011, the Board of Directors has, by its resolu on dated 2 May, 2013, accorded consent for not a aching with the Company’s Balance Sheet for the Financial Year 2012-13, the nancial statements and reports rela ng to the Company’s subsidiaries. Accordingly, the relevant informa on required to be furnished under the aforesaid Circular in respect of the subsidiaries of the Company viz, Cholamandalam MS General Insurance Company Ltd, Cholamandalam Investment and Finance Company Ltd, Cholamandalam Securi es Ltd, Cholamandalam Distribu on Services Ltd, Cholamandalam Factoring Ltd, TI Financial Holdings Limited, Shanthi Gears Limited, TICI Motors (Wuxi) Company Ltd, Financiere C10 SAS, Sedis SAS, Societe De Commercialisa on De Composants Industriels (S2CI) and Sedis Co. Ltd, is given above. The Annual Report of the Company contains consolidated nancial statements of the Company and of its subsidiaries, prepared in accordance with the applicable Accoun ng Standards, duly audited by the statutory auditors.
Chennai2 May 2013
S SureshCompany Secretary
K BalasubramanianChief Financial O cer

Tube Investments of India Limited | 73
` in Crores
TI Financial Holdings Limited Shanthi Gears Limited TICI Motors (Wuxi)
Company Limited Financiere C10 SAS SEDIS SAS S2CI SEDIS Co.Ltd.
For the year ended
Mar ‘13
For the year ended
Mar ‘12
For the year ended
Mar ‘13
For the year ended
Mar ‘12
For the year ended
Dec ‘12
For the year ended
Dec ‘11
For the year ended
Dec ‘12
For the year ended
Dec ‘11
For the year ended
Dec ‘12
For the year ended
Dec ‘11
For the year ended
Dec ‘12
For the year ended
Dec ‘11
For the year ended
Dec ‘12
For the year ended
Dec ‘11
0.11 0.11 8.17 8.17 4.75 4.37 23.34 22.82 45.18 44.16 1.60 1.56 1.61 1.59
- - - - - - - - - - - - - -
(0.05) (0.04) 249.41 239.67 (4.30) (2.00) 42.52 35.92 6.38 8.34 1.86 1.92 1.39 1.55
0.01 0.02 250.38 289.19 0.56 4.30 6.36 0.89 132.93 143.46 9.44 11.85 5.04 5.54
- - 30.79 41.35 0.11 1.93 14.68 14.67 81.37 90.96 5.98 8.37 2.04 2.40
0.05 0.05 37.99 - - - 74.18 72.52 - - - - - -
- - 154.17 177.94 7.40 8.22 8.52 7.61 216.67 216.80 18.19 18.75 9.66 10.79
(0.01) (0.01) 22.07 41.60 (2.12) (0.72) 6.25 3.52 0.33 4.38 0.99 1.80 (0.08) 0.17
- - (6.60) (13.47) - - (0.47) (0.39) 1.40 (0.58) (0.33) (0.57) 0.03 (0.04)
(0.01) (0.01) 15.47 28.13 (2.12) (0.72) 5.78 3.13 1.73 3.80 0.66 1.23 (0.05) 0.13
- - - - - - - - - - - - - -
- - - - - - - - - - - - - -
- - - - - - - - - - - - - -
- - - - - - - - - - - - - -
- - - - - - - - - - - - - -
- - - - - - - - - - - - - -
- - - - - - - - - - - - - -
- - - - - - - - - - - - - -
- - - - - - - - - - - - - -
- - - - - - - - - - - - - -
0.05 0.05 37.99 - - - - - - - - - - -
- - - - - - - - - - - - - -
- - - - - - - - - - - - -
0.05 0.05 37.99 - - - - - - - - - - -
0.05 0.05 37.99 - - - - - - - - - - -
2. Indian rupee equivalent of the gures given in foreign currency appearing in the accounts of the respec ve overseas subsidiary companies along with exchange rate as on 31 March, 2013 (closing day of the Company’s Financial Year) is furnished below:
(a) 1 Euro = ` 69.50 for Financiere C10 SAS, Sedis SAS and S2CI ; (b) 1 Pound Sterling = ` 82.49 for Sedis Co. Ltd; & (c) 1 RMB = ` 8.78 for TICI Motors (Wuxi) Company Ltd.
3. Annual accounts of the aforesaid subsidiary companies and the related informa on will be made available to shareholders of the Company and the subsidiaries at any point of me, on request and will also be kept for inspec on at the registered o ces of the Company and the subsidiaries.
L RamkumarManaging Director
On behalf of the Board
M M MurugappanChairman

74 | Tube Investments of India Limited
INDEPENDENT AUDITORS’ REPORT
TO THE BOARD OF DIRECTORS OF TUBE INVESTMENTS OF INDIA LIMITEDReport on the Consolidated Financial Statements
We have audited the accompanying consolidated nancial statements of TUBE INVESTMENTS OF INDIA LIMITED (“the Company”), its subsidiaries and jointly controlled en ty (the Company, its subsidiaries and jointly controlled en ty cons tute “the Group”), which comprise the Consolidated Balance Sheet as at 31 March 2013, the Consolidated Statement of Pro t and Loss, and the Consolidated Cash Flow Statement for the year then ended, and a summary of the signi cant accoun ng policies and other explanatory informa on.
Management’s Responsibility for the Consolidated Financial Statements
The Company’s Management is responsible for the prepara on of these consolidated nancial statements that give a true and fair view of the consolidated nancial posi on, consolidated nancial performance and consolidated cash ows of the Group in accordance with the accoun ng principles generally accepted in India. This responsibility includes the design, implementa on and maintenance of internal control relevant to the prepara on and presenta on of the consolidated nancial statements that give a true and fair view and are free from material misstatement, whether due to fraud or error.
Auditors’ Responsibility
Our responsibility is to express an opinion on these consolidated nancial statements based on our audit. We conducted our audit in accordance with the Standards on Audi ng issued by the Ins tute of Chartered Accountants of India. Those Standards require that we comply with ethical requirements and plan and perform the audit to obtain reasonable assurance about whether the consolidated nancial statements are free from material misstatement.
An audit involves performing procedures to obtain audit evidence about the amounts and the disclosures in the consolidated nancial statements. The procedures selected depend on the auditor’s judgement, including the assessment of the
risks of material misstatement of the consolidated nancial statements, whether due to fraud or error. In making those risk assessments, the auditor considers internal control relevant to the Company’s prepara on and presenta on of the consolidated nancial statements that give a true and fair view in order to design audit procedures that are appropriate in the circumstances, but not for the purpose of expressing an opinion on the e ec veness of the Company’s internal control. An audit also includes evalua ng the appropriateness of the accoun ng policies used and the reasonableness of the accoun ng es mates made by the Management, as well as evalua ng the overall presenta on of the consolidated nancial statements.
We believe that the audit evidence we have obtained is su cient and appropriate to provide a basis for our audit opinion.
Opinion
In our opinion and to the best of our informa on and according to the explana ons given to us, and based on the considera on of the reports of the other Auditors on the nancial statements of the subsidiaries, jointly controlled en ty and associate referred to below in the Other Ma er paragraph, the aforesaid consolidated nancial statements give a true and fair view in conformity with the accoun ng principles generally accepted in India:
(a) in the case of the Consolidated Balance Sheet, of the state of a airs of the Group as at 31 March 2013;
(b) in the case of the Consolidated Statement of Pro t and Loss, of the pro t of the Group for the year ended on that date; and
(c) in the case of the Consolidated Cash Flow Statement, of the cash ows of the Group for the year ended on that date.
Emphasis of Ma er
In case of one of the subsidiaries of the Company, Cholamandalam MS General Insurance Company Limited, the audit report issued by their auditors on its Audited Financial Statements for the year ended 31 March 2013 includes the following emphasis of ma er:
“Without qualifying our opinion, we draw a en on to Note 4 of Schedule 16 to the nancial statements, which describes deferment of the liability on dismantling of Indian Motor Third Party Insurance Pool by the Company to the extent of
CONSOLIDATED FINANCIAL STATEMENTS

Tube Investments of India Limited | 75
`55 Crores pursuant to the exercise of the op on for the accoun ng treatment for the same prescribed under paragraph 3(b) of Insurance Regulatory and Development Authority Order no. IRDA/F&A/ORD/MTPP/070/03/2012 dated 22 March 2012”. Note 34(b) in the Consolidated nancial statements corresponds to Note 4 of Schedule 16 referred to above.
Our opinion is not quali ed in respect of this ma er.
Other Ma er
We did not audit the nancial statements of 10 subsidiaries and one jointly controlled en ty, whose nancial statements re ect total assets (net) of `2,982.39 Crores as at 31 March 2013, total revenues of `1,608.81 Crores and net cash ows amoun ng to `109.62 Crores for the year ended on that date, as considered in the consolidated nancial statements. The consolidated nancial statements also include the Group’s share of Pro t a er tax of `1.47 Crores for the period from 3 September 2012 to 18 November 2012, in respect of an associate, whose nancial statements has not been audited by us. These nancial statements/ nancial informa on have been audited by other auditors whose reports have been furnished to us by the Management and our opinion, in so far as it relates to the amounts and disclosures included in respect of these subsidiaries, jointly controlled en ty and associate, is based solely on the reports of the other auditors.
Our opinion is not quali ed in respect of this ma er.
For DELOITTE HASKINS & SELLSChartered Accountants
(Firm Registra on No. 008072S)
M.K.AnanthanarayananPartner
CHENNAI, 2 May 2013 (Membership No. 19521)

76 | Tube Investments of India Limited
CONSOLIDATED BALANCE SHEET` in Crores
Par cularsNote No.
As at31.03.2013
As at31.03.2012
EQUITY AND LIABILITIESShareholders’ funds (a) Share Capital 2 37.33 37.26 (b) Reserves and Surplus 3 1621.84 1272.79
1659.17 1310.05 Share Applica on Money Pending Allotment 4 - 0.03 Minority Interest 1159.03 736.99 Non-Current Liabili es (a) Long Term Borrowings 5 8929.07 7573.44 (b) Deferred Tax Liabili es (Net) 6 61.44 49.98 (c) Other Long Term Liabili es 7 1007.47 213.54 (d) Long Term Provisions 8 92.06 55.86
10090.04 7892.82 Current Liabili es (a) Short Term Borrowings 9 3297.51 1846.35 (b) Trade Payables 10 676.99 722.86 (c) Other Current Liabili es 11 6024.40 4173.11 (d) Short Term Provisions 12 254.42 218.19
10253.32 6960.51 TOTAL 23161.56 16900.40 ASSETSNon-Current Assets (a) Fixed Assets (i) Tangible Assets 13 887.74 714.75 (ii) Intangible Assets 13 17.87 13.10 (iii) Capital Work-in-Progress 164.30 42.43 Fixed Assets - Share in Joint Venture 0.61 0.51 (b) Goodwill on Consolida on 351.50 63.82 (c) Non-Current Investments 14 1282.30 918.19 (d) Deferred Tax Assets (Net) 15 69.48 55.24 Deferred Tax Assets (Net) - Share in Joint Venture 0.13 0.03 (e) Long Term Loans and Advances 16 622.82 190.74 (f) Receivable under Financing Ac vity 17 11473.65 8342.96 (g) Other Non-Current Assets 18 459.69 369.12
15330.09 10710.89 Current Assets (a) Current Investments 19 405.65 212.08 (b) Inventories 20 462.82 473.30 (c) Trade Receivables 21 536.25 511.68 (d) Cash and Cash Equivalents 22 764.00 553.55 (e) Short Term Loans and Advances 23 99.60 154.16 (f) Receivable under Financing Ac vity 24 5220.13 4047.96 (g) Other Current Assets 25 343.02 236.78
7831.47 6189.51 TOTAL 23161.56 16900.40 Signi cant Accoun ng Policies 1See accompanying Notes forming part of the Consolidated Financial Statements.
In terms of our report a ached For Deloi e Haskins & SellsChartered Accountants
On behalf of the Board
M M MurugappanChairman
M.K.AnanthanarayananPartner
Chennai2 May 2013
S SureshCompany Secretary
K BalasubramanianChief Financial O cer
L RamkumarManaging Director

Tube Investments of India Limited | 77
CONSOLIDATED STATEMENT OF PROFIT AND LOSS` in Crores
Par cularsNote No.
Year ended31.03.2013
Year ended31.03.2012
Revenue from Opera ons Sale of Products - Gross 3932.64 3871.53 Less: Excise Duty on Sales 258.26 200.35 Sale of Products - Net 3674.38 3671.18 Income from Financing Opera ons 2502.54 1729.11 Revenue from Opera ons - Share in Joint Venture 6.95 6.94 Premium Earned 1162.03 863.71 Other Opera ng Revenue 247.63 170.89 Total 7593.53 6441.83 Other Income 26 28.16 14.53 Total Revenue 7621.69 6456.36 Expenses Cost of Materials Consumed 27 2015.44 2058.62 Purchase of Stock-in-Trade - Cycles/Components and Metal Formed Products 180.13 231.08 Changes in Inventories of Finished Goods, Work-in-Progress and Stock-in-Trade 28 25.84 (42.80) Employee Bene ts Expense 29 592.24 510.68 Other Expenses 30 1282.37 1195.20 Claims Incurred (Net of Recovery) 899.88 617.94 Business Origina on Outsourcing 178.48 132.19 Provisions, Loan Losses and Other Charges 31 123.34 77.95 Financing Charges 1410.00 990.04 Total Expenses 6707.72 5770.90 Earnings Before Finance Costs, Tax, Deprecia on and Amor sa on Expense 913.97 685.46 Deprecia on and Amor sa on Expense 13 132.43 100.74 Deprecia on and Amor sa on Expense - Share in Joint Venture 0.19 0.16 Finance Costs 32 107.41 78.66 Pro t Before Tax and Excep onal Items 673.94 505.90 Excep onal items - Reversal of dimuni on in value of Investment 0.00 30.00 Pro t Before Tax 673.94 535.90 Tax Expense Income Tax - Current Year 237.31 104.14 - Prior Years (8.20) 5.77 MAT Credit En tlement (0.50) (1.63) Deferred tax (Net) (11.78) 74.95 Provision for Tax Expense - Share in Joint Ventures 0.50 0.69
217.33 183.92 Pro t for the Year before Minority Interest and Share of Pro t from Associate 456.61 351.98 Minority Interest in Pro t (169.57) (83.07)Share of Pro t from Associate 1.47 - Net Pro t for the Year 288.51 268.91 Earnings per Equity Share of `2 each 41 Basic 15.47 14.46 Diluted 15.43 14.42 Signi cant Accoun ng Policies 1See accompanying Notes forming part of the Consolidated Financial Statements.
In terms of our report a ached For Deloi e Haskins & SellsChartered Accountants
On behalf of the Board
M M MurugappanChairman
M.K.AnanthanarayananPartner
Chennai2 May 2013
S SureshCompany Secretary
K BalasubramanianChief Financial O cer
L RamkumarManaging Director

78 | Tube Investments of India Limited
CONSOLIDATED CASH FLOW STATEMENT
` in Crores
Par cularsYear Ended31.03.2013
Year Ended31.03.2012
A. Cash Flow from Opera ng Ac vi es:Net Pro t Before Tax 673.94 535.90 Adjustments for :Deprecia on and Amor sa on Expense 132.62 100.90 Financing Charges 1410.00 990.02 Finance Costs 107.41 78.66 Pro t on Tangible Assets Sold/Discarded (Net) (0.91) (0.12)Pro t on Sale of Investments (Net) (26.48) (11.57)Provision/(Reversal of Provision) for Doub ul Debts And Advances (Net) 0.06 (0.34)Provision/(Reversal of Provision) for Standard Assets (Net) 7.69 (17.10)Provision/(Reversal of Provision) for Non Performing Assets under Financing Ac vity (Net) 74.64 (98.87)Reversal of Provision for Credit Enhancement and Servicing Costs on Assets De-recognised (Net) (1.11) (25.88)Provision for Others 4.14 5.69 Loss on Repossessed Assets (Net) 29.95 16.17 Loss Assets Wri en O 11.54 172.23 Reinsurance acceptance from Terrorism Pool/Motor pool - (159.36)Claims from Declined Risk Pool 8.08 178.21 Liabili es no longer payable wri en back (4.03) (4.76)Unrealised Losses on Foreign Currency Borrowings (Net) 0.89 3.02 Interest Income (212.36) (134.85)Dividend Income (1.56) (4.90)Opera ng Pro t before Working Capital/Other Changes 2214.51 1623.05 Adjustments for :Increase in Liabili es and Provisions 928.44 347.91 Increase in Loans and Advances (565.33) (43.76)Decrease/(Increase) in Inventories 70.30 (39.40)Decrease/(Increase) in Trade Receivables 29.09 (57.31)Increase in Receivable Under Financing Ac vity (including Repossesed Assets) (6528.43) (5007.21)Decrease in Securi sa on/Bilateral Assignment of Receivables 2187.75 1113.37 Cash Generated From Opera ons (1663.67) (2063.35)Financing Charges Paid (1332.21) (923.56)Direct Taxes Paid (Net) (232.27) (106.74)Net Cash Flow Used in Opera ng Ac vi es (3228.15) (3093.65)
B. Cash Flow from Inves ng Ac vi es:Capital Expenditure (Including Capital Work-in-Progress and Capital Advances) (293.36) (219.55)Proceeds from Sale of Assets 5.45 1.98 Investments in Subsidiaries (480.65) - Purchase of Other Investments (20645.87) (13277.56)Sale/Redemp on of Other Investments 20358.88 13088.46 Interest Received 191.76 138.51 Dividend Received 1.56 4.90 Net Cash Used in Inves ng Ac vi es (862.23) (263.26)
C. Cash Flow from Financing Ac vi es:Proceeds from exercise of Employees Stock Op on 2.05 3.71 Increase in Equity Share Capital and Securi es Premium (Net of Expenses) 309.22 221.87 Repayment of Sales Tax Deferral (2.98) (2.74)Increase in Long Term Borrowings 1607.88 3017.30 Increase in Short Term Borrowings 2717.64 518.30 Increase in Fixed Deposits (0.14) - Finance Costs Paid (Including Exchange Di erences on Foreign Currency Loans) (81.21) (71.30)Dividends Paid (Including Dividend Distribu on Tax - Net) (88.24) (92.10)Receipt of Industrial Promo on Subsidy 0.47 0.40 Net Cash From Financing Ac vi es 4464.69 3595.44 Net Increase in Cash and Cash Equivalents [A+B+C] 374.31 238.53 Cash and Cash Equivalents at the Beginning of the Year 399.83 161.30 Cash and Cash Equivalents of Subsidiary Acquired during the Year 75.22 -Cash and Cash Equivalents as at End of the Year 849.36 399.83 Reconcilia on with Note 22 Cash and Cash Equivalents as at End of the Year as per Cash Flow Statement 849.36 399.83 Current Investments (Excluding Investments under Lien) (174.77) (2.27) Bank Deposits held for More than Three Months 9.20 75.23 Bank Deposits under Lien 76.54 77.60 Balance in Restricted Bank Account 0.91 0.91 Balance in Dividend Accounts 2.76 2.25 Cash and Cash Equivalents as at End of the Year as per Note 22 764.00 553.55
In terms of our report a ached For Deloi e Haskins & SellsChartered Accountants
On behalf of the Board
M M MurugappanChairman
M.K.AnanthanarayananPartner
Chennai2 May 2013
S SureshCompany Secretary
K BalasubramanianChief Financial O cer
L RamkumarManaging Director

Tube Investments of India Limited | 79
NOTES TO CONSOLIDATED FINANCIAL STATEMENTS
1. Signi cant Accoun ng Policies
1.1 Principles of Consolida on
The Consolidated Financial Statements relate to Tube Investments of India Limited (the Company), its Subsidiary Companies and Joint Ventures (Collec vely referred to as ‘the Group’) and the Group’s share of pro t/loss in its associates.
a) The Financial Statements of the Subsidiaries and Joint Ventures used in the Consolida on are drawn up to the same repor ng date as that of the Company i.e. 31 March except for some of the Subsidiaries indicated in Para 1.2 below for which the nancial statements as on the repor ng date are not available and hence, the same have been consolidated based on the latest available audited Financial Statements as at 31 December. No signi cant transac ons or events have occurred between this date and the date of consolida on.
b) The Financial Statements of the Company and its Subsidiary Companies have been combined on a line-by-line basis by adding together the book values of like items of assets, liabili es, income and expenses, a er fully elimina ng material intra-group balances, intra-group transac ons and the resul ng unrealised pro ts or losses, unless cost cannot be recovered, as per Accoun ng Standard 21 – Consolidated Financial Statements.
c) Share of pro t/loss, assets and liabili es in the jointly controlled en es, which are not subsidiaries, have been consolidated on a line by line basis by adding together the book values of like items of assets, liabili es, incomes and expenses on a propor onate basis to the extent of the Company’s equity interest in such en ty as per AS 27 – Financial Repor ng of Interests in Joint Ventures. The intra-group balances, intra-group transac ons and unrealised pro ts or losses have been eliminated to the extent of the Group’s share in the en ty.
d) The excess of Cost to the Company of its Investment in the Subsidiaries and Joint Ventures over the Company’s por on of the Equity, at the dates on which the investments are made, is recognised in the Consolidated Financial Statements as Goodwill. The carrying value of Goodwill is tested for impairment as at the end of each repor ng period.
e) The excess of the Company’s por on of Equity of the Subsidiaries and Joint Ventures over its Cost of Investment, at the dates on which the investments are made, is treated as Capital Reserve.
f) Minority Interest in the Net Assets of the Consolidated Subsidiaries consists of:
(i) The amount of Equity a ributable to Minori es at the date on which the investment in the Subsidiary is made; and
(ii) The Minori es’ share of movements in Equity since the date the Parent Subsidiary rela onship came into existence.
g) Minority Interest share in the Net Pro t for the year of the Consolidated Subsidiaries is iden ed and adjusted against the Pro t a er Tax of the Group.
1.2 Par culars of Consolida on
The list of Subsidiary Companies and Joint Ventures and the Company’s holding therein are as under:
Company Rela onship Year EndCountry of
Incorpora on
Propor on of Ownership
As at 31.03.2013
As at 31.03.2012
Cholamandalam MS General Insurance Company Limited (CMSGICL)
Subsidiary 31 March India 74.00% 74.00%
TI Financial Holdings Limited (TIFHL) Subsidiary 31 March India 100.00% 100.00%TICI Motors (Wuxi) Company Limited (TMWCL) Subsidiary 31 December China 100.00% 100.00%

80 | Tube Investments of India Limited
NOTES TO CONSOLIDATED FINANCIAL STATEMENTS
1. Signi cant Accoun ng Policies (Contd.)
Company Rela onship Year EndCountry of
Incorpora on
Propor on of Ownership
As at 31.03.2013
As at 31.03.2012
Financiere C10 SAS (FC 10)Subsidiaries of FC 10
- Sedis SAS- Societe De Commercialisa on De
Composants Industriels – SARL (S2CI)- Sedis Co. Ltd
Subsidiary 31 December
France
United Kingdom
100.00% 77.13%
Cholamandalam Investment and Finance Company Limited (CIFCL)Subsidiaries of CIFCL
- Cholamandalam Distribu on Services Limited (CDSL)
- Cholamandalam Factoring Limited (CFACT)
- Cholamandalam Securi es Limited (CSEC)
Subsidiary 31 March India 50.47% 54.49%
Shanthi Gears Limited
Subsidiary w.e.f. 19 November
2012. Associate for
the period from 3 September 2012 to 18
November 2012.
31 March India 70.12%Not
Applicable
Cholamandalam MS Risk Services Limited (CMSRSL)
Joint Venture 31 March India 49.50% 49.50%
The e ect of acquisi on of Shanthi Gears Limited, Subsidiary:
The e ect of acquisi on of Shanthi Gears Limited, Subsidiary w.e.f. 19 November 2012 on the nancial posi on and results as included in the Consolidated Financial Statements for the year ended 31 March 2013 is given below:
` in CroresPar culars AmountLiabili es 25.05Assets 288.35Revenue 66.94Expenses 60.11Pro t before tax 6.83Pro t a er tax 4.78
Goodwill on Consolida on: ` in Crores
Par cularsAs at
31.03.2013As at
31.03.2012Opening Balance 63.82 63.82Addi ons during the Year
Shanthi Gears Limited 284.30 -Financiere C10 SAS 3.38 -
Closing balance 351.50 63.82

Tube Investments of India Limited | 81
NOTES TO CONSOLIDATED FINANCIAL STATEMENTS
1. Signi cant Accoun ng Policies (Contd.)
1.3 Accoun ng Conven on
The Consolidated Financial Statements of the Group are prepared under the historical cost conven on, on an accrual basis, in accordance with the Generally Accepted Accoun ng Principles in India (Indian GAAP) to comply with the Accoun ng Standards no ed by the Government of India/issued by the Ins tute of Chartered Accountants of India (ICAI), as applicable, and the relevant provisions of the Companies Act, 1956. The accoun ng policies adopted in the prepara on of the nancial statements are consistent with those followed in the previous year.
The Consolidated Financial Statements have been prepared using uniform accoun ng policies for like transac ons and other events in similar circumstances with certain excep ons as men oned in the paragraphs below and are presented to the extent possible, in the same manner as the Company’s separate nancial statements.
CMSGICL follows accoun ng principles prescribed by The Insurance Regulatory and Development Authority (Prepara on of Financial Statements and Auditor’s Report of Insurance Companies) Regula ons, 2002, the Insurance Act, 1938, the Insurance Regulatory and Development Authority Act, 1999, Orders/Circulars/No ca ons issued by IRDA from me to me, the applicable Accoun ng Standards no ed by the Central Government of India under the Companies (Accoun ng Standard) Rules, 2006 and the requirements of the Companies Act, 1956, to the extent applicable.
CIFCL follows pruden al norms for income recogni on, asset classi ca on and provisioning as prescribed by the Reserve Bank of India for Non-deposit taking Non-Banking Finance Companies (NBFC-ND).
Financiere C10 SAS (FC 10) prepares its Consolidated Financials in accordance with the legal and regulatory provisions applicable in France (Regula on 99.02).
1.4 Presenta on and disclosure of nancial statements
An asset has been classi ed as current when it sa s es any of the following criteria:
a) It is expected to be realised in, or is intended for sale or consump on in, the normal opera ng cycle relevant for each of the en es in the Group;
b) It is held primarily for the purpose of being traded;
c) It is expected to be realised within twelve months a er the repor ng date; or
d) It is cash or cash equivalent unless it is restricted from being exchanged or used to se le a liability for at least twelve months a er the repor ng date.
A liability has been classi ed as current when it sa s es any of the following criteria:
a) It is expected to be se led within the normal opera ng cycle relevant for each of the en es in the Group;
b) It is held primarily for the purpose of being traded;
c) It is due to be se led within twelve months a er the repor ng date; or
d) The en es in the Group do not have an uncondi onal right to defer se lements of the liability for at least twelve months a er the repor ng date. Terms of a liability that could, at the op on of the counterparty, result in its se lement by the issue of equity instruments do not a ect its classi ca on.
All other assets and liabili es have been classi ed as non-current.
1.5 Use of Es mates
The prepara on of the nancial statements in conformity with Indian GAAP requires the Management to make es mates and assump ons considered in the reported amounts of assets and liabili es (including con ngent liabili es) as of the date of the nancial statements and the reported income and expenses during the repor ng year. The Management believes that the es mates used in the prepara on of the nancial statements are prudent and reasonable. Future results may vary from these es mates and the di erences between the actual results and the es mates are recognised in the periods in which the results are known/materialise.
1.6 Tangible Fixed Assets
Fixed Assets are stated at historical cost less accumulated deprecia on and impairment losses, if any. Cost includes related taxes, du es, freight, insurance, etc. a ributable to the acquisi on and installa on of the xed assets but

82 | Tube Investments of India Limited
NOTES TO CONSOLIDATED FINANCIAL STATEMENTS
1. Signi cant Accoun ng Policies (Contd.)
excludes du es and taxes that are recoverable from tax authori es. Borrowing costs are capitalised as part of qualifying xed assets.
Machinery spares which can be used only in connec on with an item of xed asset and whose use is expected to be irregular are capitalised and depreciated over the useful life of the principal item of the relevant assets. Subsequent expenditure rela ng to xed assets is capitalised only if such expenditure results in an increase in the future bene ts from such asset beyond its previously assessed standard of performance.
Fixed assets re red from ac ve use and held for sale are stated at the lower of their net book value and net realisable value and are disclosed separately in the Balance Sheet.
Capital Work-in-Progress: Projects under which assets are not ready for their intended use and other capital work-in-progress are carried at cost, comprising direct cost and a ributable interest.
1.7 Impairment of Assets
The carrying values of assets/cash genera ng units are reviewed at each Balance Sheet date to determine whether there is any indica on of impairment of the carrying amount of the Company’s assets. If any indica on exists, an asset’s recoverable amount is es mated. An impairment loss is recognised whenever the carrying amount of the asset exceeds the recoverable amount. The recoverable amount is the greater of the net selling price and their value in use. Value in use is arrived at by discoun ng the future cash ows to their present value based on an appropriate discount factor. When there is indica on that an impairment loss recognised for an asset in earlier accoun ng periods no longer exists or may have decreased such reversal of impairment loss is recognised in the Statement of Pro t and Loss.
1.8 Investments
a) Current investments are carried at lower of cost and fair value.
b) Non-Current investments are carried at cost. Diminu on in the value of such investments, other than temporary, is provided for.
c) In the case of CMSGICL –
(i) All debt securi es including Government securi es are considered as “held to maturity” and accordingly stated at historical cost subject to amor sa on of premium/accre on of discount over the balance period of maturity/holding.
(ii) Listed and ac vely traded equity securi es are stated at the lower of the last quoted closing price on the Na onal Stock Exchange of India Limited (NSE) or BSE Limited (BSE). The change in the value, as reduced by the provision carried for diminu on in value of investments, if any, is credited/(debited) to the “Fair Value Change Account”.
(iii) Units of Mutual Funds are valued at Net Asset Value (NAV). The change in the value is credited/(debited) to the “Fair Value Change Account”.
d) In the case of CIFCL –
Long Term Investments are stated at cost other than the investment in the shares of BSE, which is accounted at fair value based on the Expert Advisory Commi ee opinion on “Accoun ng for conversion of membership rights of erstwhile BSE (AOP) into trading rights of BSE and shares”. However, provision for diminu on in value is made to recognise a decline other than temporary in the value of investments.
1.9 Inventories
a) Raw materials, stores & spare parts and traded goods are valued at lower of weighted average cost and es mated net realisable value (net of allowances). Cost includes freight, taxes and du es and is net of credit under VAT and CENVAT scheme, where applicable.
b) Work-in-progress and nished goods are valued at lower of weighted average cost and es mated net realisable value (net of allowances). Cost includes all direct costs and appropriate propor on of overheads to bring the goods to the present loca on and condi on.
c) Due allowance is made for slow/non-moving items.

Tube Investments of India Limited | 83
NOTES TO CONSOLIDATED FINANCIAL STATEMENTS
1. Signi cant Accoun ng Policies (Contd.)
1.10 Revenue and Other Income
a) Sales are recognised on shipment or on uncondi onal appropria on of goods and comprise amounts invoiced for the goods, including Excise Duty, but excluding Sales Tax/Value Added Tax, Quan ty Discounts and Sales Returns.
b) Service revenues are recognised when services are rendered.
c) Dividend income is accounted for when the right to receive it is established.
d) Interest Income is recognised on me propor on basis.
e) In the case of CMSGICL:
(i) Premium (net of service tax) is recognised as income on assump on of risk, a er adjus ng for unexpired risk, which recogni on in the case of Rashtriya Swasthya Bima Yojna Scheme is done on receipt of Government acknowledgement of the enrolments done under the Scheme. Any cancella ons or changes in premium are accounted for in the period in which they occur.
(ii) Reserve for Unexpired Risk, represen ng that part of the premium wri en that is a ributable and allocable to the subsequent accoun ng period(s), is calculated principally on “Day Basis” subject to a minimum of 50 percent of the net premium wri en during the preceding twelve months in the case of Fire, Marine (Cargo) and Miscellaneous business except health line and 100 percent for Marine (Hull) business. In the case of health line of business, in terms of IRDA Circular No. IRDA/F&I/CIR/F&A/015/02/2011 dated February 2, 2011, the Reserve for Unexpired Risk is calculated only on “Day Basis”. Further, in the case of the inward premium from IMTPDRIP (DR Pool), in view of the “clean cut” arrangement, the en re inward premium is recognised as revenue.
(iii) Interest/Dividend income on investments is recognised on accrual basis and is net of accre on of discount or amor sa on of premium over the balance period of maturity/holding. Dividend income is recognised when right to receive the same is established.
(iv) Pro t/Loss on sale of investments - Realised gains or losses on investments represen ng the di erence between the sale considera on and the carrying cost is recognised on the date of sale. In determining the realised gain or loss on sale of a security, the cost of such security is arrived on weighted average cost basis. In the case of listed Equity Shares, pro t or loss on sale is adjusted for the accumulated changes in the fair value previously recognised in the fair value change account in respect of the shares sold.
f) In the case of CIFCL:
(i) Interest Income is recognised under the Internal Rate of Return method to provide a constant periodic rate of return on net investment outstanding on the Loan contracts. In the case of Non-Performing Loans, interest income is recognised upon realisa on, as per RBI guidelines. Unrealised interest recognised as income in the previous period is reversed in the month in which the loan is classi ed as Non-Performing.
(ii) Service Charges are recognised on issue of delivery instruc on to the dealer/manufacturer in respect of the assets nanced or on release of disbursement amount, whichever is earlier, and when there is no uncertainty in receiving the same.
(iii) Addi onal Finance Charges, Cheque bounce charges, Field visit charges and other penal/servicing charges are recognised as income on realisa on due to uncertainty in their collec on.
(iv) Interest spread on bilateral assignment or securi sa on of receivables is recognised on accrual basis over the tenor of the underlying assets.
(v) Loss, if any, in respect of securi sa on and assignment is recognised upfront in the Statement of Pro t and Loss.
(vi) Income from non- nancing ac vity is recognised as per the terms of the respec ve contract on accrual basis.
(vii) Brokerage Income on stock broking and other charges are recognised on the trade date of transac on upon con rma on of the transac on by the exchanges.

84 | Tube Investments of India Limited
NOTES TO CONSOLIDATED FINANCIAL STATEMENTS
1. Signi cant Accoun ng Policies (Contd.)
(viii) Income from depository services, nance charges on client dues are recognised on the basis of agreements entered into with the clients and when the right to receive the income is established.
(ix) Interest income on bonds and deposits and pass through cer cates is recognised on accrual basis.
(x) Commission is recognised on an accrual basis based on contractual obliga ons and when there is no uncertainty in receiving the same. Commission income is net of service tax.
(xi) Pro t/loss on sale of investments is recognised at the me of sale or redemp on.
1.11 Reinsurance Ceded and Commission Received (CMSGICL):
a) Reinsurance premium ceded is accounted in the year of commencement of risk in accordance with the treaty arrangements with the reinsurers. Non-propor onal reinsurance cost is recognised when incurred and included in the premium on reinsurance ceded.
b) Commission on reinsurance ceded is recognised as income on ceding of reinsurance premium. Pro t commission under reinsurance trea es, wherever applicable, is recognised in the year of nal determina on of the pro ts and included in commission on reinsurance ceded.
1.12 Acquisi on Cost of new insurance contracts (CMSGICL)
Costs rela ng to acquisi on of new/renewal of insurance contracts are expensed in the year in which they are incurred.
1.13 Claims and Premium De ciency (CMSGICL)
a) Claims incurred (net) include speci c se lement costs comprising survey, legal and other directly a ributable expenses and are net of salvage value and other recoveries, if any.
b) Es mated liability for outstanding claims in respect of direct business is provided based on claims reported a er adjus ng claims recoverable from reinsurers/co-insurers, and includes provision for sola um fund.
c) Es mated liability for claims Incurred But Not Reported (IBNR) and Claims Incurred But Not Enough Reported (IBNER) is based on available sta s cal data and is as cer ed by the Appointed Actuary.
d) In respect of incoming co-insurance, claims are accounted based on in ma ons received from co-insure.
e) In respect of Declined Risk Pool, in view of the “clean cut” arrangement, the reserving claim is made on the en re premium recognised as revenue.
f) Premium de ciency, if any, is calculated based on actuarial valua on duly cer ed by the Appointed Actuary.
1.14 Government Grants, Subsidies and Export Incen ves
Government grants and subsidies are recognised when there is reasonable assurance that the Company will comply with the condi ons a ached to them and the grants/subsidy will be received.
When the grant or subsidy from the Government relates to revenue, it is recognised as income on a systema c basis in the statement of pro t and loss over the period necessary to match them with the related costs, which they are intended to compensate.
When the grant or subsidy from the Government is in the nature of promoters’ contribu on, where no repayment is ordinarily expected in respect thereof, it is credited to Capital Reserve and treated as a part of the Shareholders’ funds on receipt basis.
Export bene ts are accounted for in the year of exports based on eligibility and when there is no uncertainty in receiving the same.
1.15 Receivables Under Financial Ac vity – (CIFCL)
All loan exposures to borrowers with instalment structure are stated at the full agreement value a er ne ng o
a) unearned income
b) instalments appropriated upto the year end
Provision for Standard Assets is made as per internal es mates, based on past experience, realisa on of security, and other relevant factors, on the outstanding amount of Standard Assets for all types of lending subject to minimum provisioning requirements speci ed by RBI.

Tube Investments of India Limited | 85
NOTES TO CONSOLIDATED FINANCIAL STATEMENTS
1. Signi cant Accoun ng Policies (Contd.)
Provision for Non-Performing Assets is made as per the provisioning norms approved by the Board for each type of lending ac vity subject to minimum provisioning requirements speci ed by RBI.
1.16 Employee Bene ts
a) De ned Contribu on Plan
(i) Superannua on
Contribu ons at a sum equivalent to 15% of eligible employees salary are made to Superannua on Funds administered by trustees and managed by Life Insurance Corpora on of India (LIC). There is no liability for future Superannua on Fund bene ts other than the annual contribu on and such contribu ons are recognised as an expense in the year incurred.
(ii) Provident Fund
Contribu ons towards Employees Provident Fund made to the Regional Provident Fund are recognised as expense in the year in which they are incurred.
b) De ned Bene t Plan
(i) Gratuity
Annual contribu ons are made to Gratuity Funds administered by trustees and managed by LIC/Private Insurance Company. The liability for future gratuity bene ts is accounted for based on actuarial valua on, as at the Balance Sheet date, determined every year using the Projected Unit Credit method less the Fair Value of Plan Assets out of which the obliga ons are expected to be se led. Actuarial gains/losses are immediately recognised in the Statement of Pro t and Loss.
(ii) Provident Fund
In respect of employees not covered under Point 1.16 (a) (ii), contribu ons to the Company’s Employees Provident Fund Trust are made in accordance with the fund rules. The interest rate payable to the bene ciaries every year is being no ed by the Government.
In the case of contribu on to the Trust, the Company has an obliga on to make good the shor all, if any, between the return from the investments of the Trust and the no ed interest rate and recognizes such obliga on, determined based on an actuarial valua on, as an expense.
c) Long Term Compensated Absences
The liability for long term compensated absences carried forward on the Balance Sheet date is provided for based on an actuarial valua on using Projected Unit Credit Method less the Fair Value of Plan Assets out of which the obliga ons are expected to be se led, as at the Balance Sheet date.
d) Short Term Employee Bene ts
Short term employee bene ts include short term compensated absences which is recognised based on the eligible leave at credit on the Balance Sheet date, and the es mated cost is based on the terms of the employment contract.
e) Voluntary Re rement Scheme
In the case of the Company, compensa on to employees under Voluntary Re rement Schemes is expensed in the period in which the liability arises.
Employee bene ts rela ng to employees of overseas subsidiaries are covered based on the labour laws prevailing in the country of incorpora on of the subsidiaries.
1.17 Opera ng Leases
Leases where the lessor e ec vely retains substan ally all the risks and bene ts of ownership of the leased assets are classi ed as opera ng leases. Opera ng lease payments are recognised as an expense in the Statement of Pro t and Loss as per the lease terms.

86 | Tube Investments of India Limited
NOTES TO CONSOLIDATED FINANCIAL STATEMENTS
1. Signi cant Accoun ng Policies (Contd.)
1.18 Foreign Currency Transac ons
Ini al recogni on
Transac ons in foreign currencies entered into by the Company are accounted at the exchange rates prevailing on the date of the transac on or at rates that closely approximate the rate at the date of the transac on.
Measurement
Foreign currency monetary items (other than Deriva ve Contracts) of the Company outstanding at the Balance Sheet date are restated at year end exchange rates.
Non-monetary items are carried at historical cost.
Treatment of Exchange Di erences
Exchange di erences arising on se lement/restatement of short-term foreign currency monetary assets and liabili es of the Company are recognised as income or expense in the Statement of Pro t and Loss.
Accoun ng of forward contracts
The Company enters into forward exchange contracts and other instruments that are in substance a forward exchange contract to hedge its risks associated with foreign currency uctua ons. The premium or discount arising at the incep on of a forward exchange contract (other than for a rm commitment or a highly probable forecast transac on) or similar instrument is amor sed as expense or income over the life of the contract. Exchange di erences on such a contract are recognised in the Statement of Pro t and Loss in the year in which the exchange rates change. Any pro t or loss arising on cancella on of such a contract is recognised as income or expense for the year.
Consolida on of subsidiaries situated in foreign countries
For the purpose of consolida on of subsidiaries situated in foreign countries, other than those whose opera ons are integral in nature (which are translated using the same principles and procedures as those of the Company), income and expenses are translated at average exchange rates and the assets and liabili es are stated at closing exchange rates. The net impact of such change is accumulated under foreign currency transla on reserve under Reserves and Surplus. On the disposal of a non-integral subsidiary, the cumula ve amount of the exchange di erences which have been included under Foreign Currency Transla on Reserve and which relate to that subsidiary are recognised as income or as expense in the period in which the gain or loss on disposal is recognised. When there is a change in the classi ca on of a subsidiary, the transla on procedures applicable to the revised classi ca on are applied from the date of change in the classi ca on.
1.19 Deriva ve Instruments and Hedge Accoun ng
Company
The Company uses forward contracts and currency swaps (Deriva ve Contracts) to hedge its risks associated with foreign currency uctua ons rela ng to highly probable forecast transac ons. The Company designates these as cash ow hedges.
The use of Deriva ve contracts is governed by the Company’s policies on the use of such nancial deriva ves consistent with the Company’s risk management strategy. The Company does not use deriva ve nancial instruments for specula ve purposes.
Deriva ve contracts are ini ally measured at fair value, and are re-measured at subsequent repor ng dates. Changes in the fair value of these deriva ves that are designated and e ec ve as hedges of future cash ows are recognised directly in “Hedge Reserve Account” under Shareholders’ Funds and the ine ec ve por on is recognised immediately in the Statement of Pro t and Loss.
Changes in the fair value of deriva ve nancial instruments that do not qualify for hedge accoun ng are recognised in the Statement of Pro t and Loss as they arise.
Hedge accoun ng is discon nued when the hedging instrument expires or is sold, terminated, or exercised, or no longer quali es for hedge accoun ng. If any of these events occur or if a hedged transac on is no longer expected to occur, the net cumula ve gain or loss recognised under shareholders’ funds is transferred to the Statement of Pro t and Loss for the year.

Tube Investments of India Limited | 87
NOTES TO CONSOLIDATED FINANCIAL STATEMENTS
1. Signi cant Accoun ng Policies (Contd.)
CIFCL
CIFCL enters into deriva ve contracts in the nature of foreign currency swaps with an inten on to hedge its exis ng assets and liabili es in foreign currency. Deriva ve Contracts which are closely linked to the exis ng assets and liabili es are accounted as per policy stated for foreign currency transac ons and transla ons.
All other deriva ve contracts are marked-to-market and losses are recognised in the Statement of Pro t and Loss. Gains arising on the same are not recognised, un l realised, on grounds of prudence.
1.20 Deprecia on and Amor sa on
a) Deprecia on has been provided based on the straight-line method as per the rates prescribed in Schedule XIV to the Companies Act, 1956 except in respect of the following categories of assets, where deprecia on is provided based on useful life of the assets assessed as under:
Descrip on of assets Useful life and Basis of Deprecia on/Amor sa on
Special tools and special purpose machines used in door frame products 4 Years
Lease hold land/improvements Over the primary lease period
Lease hold Improvements - CIFCL Primary Lease Period or 5 Years, whichever is lower
Computer Equipment 3 Years – 4 Years
Other Plant & Machinery/Equipment 5 Years – 20 Years
Intangible Assets
- Computer So ware License Period or 3 Years whichever is lower
- Stock Exchange Membership Card 15 Years
Vehicles 4 Years – 5 Years
O ce Equipment/Electronic Equipment (including Data Processing/Informa on Technology Equipment) 3 Years – 10 Years
Electrical Fi ngs 4 Years – 10 Years
Buildings 15 Years – 40 Years
Furniture & Fixtures 5 Years – 15 Years
Tools 3 Years
Deprecia on is normally provided pro-rata from the month of Capitalisa on.
Individual xed assets whose actual cost does not exceed ̀ 5,000 are fully depreciated in the year of acquisi on.
b) Certain xed assets are treated as Con nuous Process Plants based on technical evalua on done by the Management and are depreciated at the applicable rates.
c) Addi onal deprecia on is provided for, where in the opinion of the Management, the recovery of the xed asset is likely to be a ected by the varia on in demand and/or its condi on/usability.
d) Finance lease
(i) In the case of CMSGICL, assets acquired under nance leases are capitalised at the lower of the fair value of the asset and present value of the minimum lease payments at the incep on of the lease term and are disclosed as leased assets.

88 | Tube Investments of India Limited
NOTES TO CONSOLIDATED FINANCIAL STATEMENTS
1. Signi cant Accoun ng Policies (Contd.)
(ii) Lease payments are appor oned between the nance charges and the corresponding liability so as to achieve a constant rate of interest on the remaining balance of the liability. Finance charges are charged to Statement of Pro t and Loss.
(iii) Leased assets capitalised under nance leases are depreciated on a straight line basis over the lease term.
1.21 Research and Development
Revenue expenditure on research and development is expensed when incurred. Capital expenditure on research and development is capitalised under xed assets and depreciated in accordance with Note 1.20 above.
1.22 Taxes on Income
Current tax is the amount of tax payable on the taxable income for the year and is determined in accordance with the provisions of the Income Tax Act, 1961.
Deferred tax is recognised on ming di erences; being the di erences between taxable income and accoun ng income that originate in one period and are capable of reversal in one or more subsequent periods. Deferred tax is measured using the tax rates and tax laws enacted or substan vely enacted as at the repor ng date.
Deferred tax assets in respect of unabsorbed deprecia on and carry forward of losses are recognised only if there is virtual certainty that there will be su cient future taxable income available to realise such assets. Other deferred tax assets are recognised if there is reasonable certainty that there will be su cient future taxable income available to realise such assets.
Minimum Alternate Tax (MAT) paid in a year is charged to the Statement of Pro t and loss as current tax. The Company recognises MAT credit available as an asset only to the extent that there is convincing evidence that the Company will pay normal income tax during the speci ed period, i.e., the period for which MAT credit is allowed to be carried forward. In the year in which the Company recognises MAT credit as an asset in accordance with the Guidance Note on Accoun ng for Credit Available in respect of Minimum Alterna ve Tax under the Income-tax Act, 1961, the said asset is created by way of credit to the Statement of Pro t and Loss and shown as “MAT Credit En tlement.” The Company reviews the “MAT Credit En tlement” asset at each repor ng date and writes down the asset to the extent the Company does not have convincing evidence that it will pay normal tax during the speci ed period.
In respect of overseas subsidiaries, income tax is provided for based on income tax laws prevailing in the country of incorpora on of the respec ve subsidiaries.
1.23 Provisions and Con ngencies
Provisions are recognised when there is a present obliga on as a result of past events and when a reliable es mate of the amount of obliga on can be made. Con ngent liability is disclosed for (i) Possible obliga on which will be con rmed only by future events not wholly within the control of the Company or (ii) Present obliga ons arising from past events where it is not probable that an ou low of resources will be required to se le the obliga on or a reliable es mate of the amount of the obliga on cannot be made. Con ngent assets are not recognised in the nancial statements since this may result in the recogni on of income that may never be realised.
1.24 Segment Accoun ng
(i) The Generally Accepted Accoun ng Principles used in the prepara on of the nancial statements are applied to record revenue and expenditure in individual segments.
(ii) Segment revenue and segment results include transfers between business segments. Such transfers are accounted for at a compe ve market price and are eliminated in the consolida on of the segments.
(iii) Expenses that are directly iden able to segments are considered for determining the segment results. Expenses which relate to the Company as a whole and are not allocable to segments are included under unallocated corporate expenses.
(iv) Segments assets and liabili es include those directly iden able with the respec ve segments. Unallocated corporate assets and liabili es represent the assets and liabili es that relate to the Company as a whole and are not allocable to any segment.

Tube Investments of India Limited | 89
1.25 Borrowing Costs
Borrowing Costs include interest, amor sa on of ancillary costs incurred and Exchange di erences arising from foreign currency borrowings to the extent they are regarded as an adjustment to the nance cost. Finance Costs, allocated to and u lised for qualifying assets, pertaining to the period from commencement of ac vi es rela ng to construc on/development of the qualifying asset upto the date the asset is ready for its intended use is added to the cost of the assets. Capitalisa on of Finance Costs is suspended and charged to the Statement of Pro t and Loss during extended periods when ac ve development ac vity on the qualifying assets is interrupted.
1.26 Prepaid Finance Charges (CIFCL)
Prepaid Finance Charges represents ancillary costs incurred in connec on with the arrangement of borrowings, including borrowings sanc oned but not availed, and is amor sed on a straight line basis, over the tenure of the respec ve borrowings. Unamor sed borrowing costs remaining, if any, are fully expensed o as and when the related borrowing is prepaid/cancelled.
1.27 Earnings Per Share
Basic earnings per share is calculated by dividing the net pro t for the period a ributable to equity shareholders by the weighted average number of Equity Shares outstanding during the period.
The weighted average number of Equity Shares outstanding during the period and for all periods presented is adjusted for events, such as bonus shares, other than the conversion of poten al Equity Shares, that have changed the number of Equity Shares outstanding, without a corresponding change in resources. For the purpose of calcula ng diluted earnings per share, the net pro t for the period a ributable to equity share holders and the weighted average number of shares outstanding during the period is adjusted for the e ects of all dilu ve poten al Equity Shares.
1.28 Employees Stock Op on
Stock op ons granted to the employees under the stock op on scheme are evaluated as per the accoun ng treatment prescribed by the Employee Stock Op on Scheme and Employee Stock Purchase Scheme Guidelines, 1999 issued by Securi es and Exchange Board of India. The Company follows the intrinsic value method of accoun ng for the op ons and accordingly, the excess of market value of the stock op ons as on date of grant, if any, over the exercise price of the op ons is recognised as deferred employee compensa on and is charged to the Statement of Pro t and Loss on graded ves ng basis over the ves ng period of the op on.
1.29 Provision for Claw Back of Commission Income (CIFCL)
The es mated liability for claw back of commission income is recorded in the period in which the underlying revenue is recognised. These es mates are established using historical informa on on the nature, frequency and expected average cost of claw back and management es mates regarding possible future incidence. The es mates used for accoun ng of claw back claims are reviewed periodically and revisions are made as required.
NOTES TO CONSOLIDATED FINANCIAL STATEMENTS
1. Signi cant Accoun ng Policies (Contd.)

90 | Tube Investments of India Limited
2. Share Capital
` in Crores
Par cularsAs at
31.03.2013As at
31.03.2012
Authorised Capital
21,50,00,000 Equity Shares of `2 each 43.00 43.00
Issued, Subscribed and Paid-up Capital
18,66,79,308 Equity Shares of `2 each fully paid up (Previous Year 18,63,15,317 Equity Shares of `2 each fully paid up) 37.33 37.26
37.33 37.26
a) The Reconcilia on of Share Capital is given below:
Par culars As at 31.03.2013 As at 31.03.2012
No. of Shares ` in Crores No. of Shares ` in Crores
At the beginning of the year 18,63,15,317 37.26 18,56,66,931 37.13
Shares allo ed on exercise of employee stock op ons (Refer Note e below) 3,63,991 0.07 6,48,386 0.13
At the end of the year 18,66,79,308 37.33 18,63,15,317 37.26
b) Terms/Rights a ached to class of shares
The Company has only one class of shares referred to as Equity Shares having a par value of `2. The holders of Equity Shares are en tled to one vote per share. Dividend proposed by the Board of Directors, if any, is subject to the approval of the shareholders in the ensuing Annual General Mee ng, except in case of interim dividend. Repayment of capital will be in propor on to the number of Equity Shares held.
c) Details of Shareholder(s) holding more than 5% of Equity Shares in the Company as on 31 March 2013
As at 31.03.2013 As at 31.03.2012
Name of the Share Holder No. of Shares% against total
number of shares
No. of Shares% against total
number of shares
Murugappa Holdings Limited(Associate - Inves ng Company) 6,40,54,680 34.31% 6,40,54,680 34.38%
d) Status on Global Depository Receipts
The aggregate number of Global Depository Receipts (GDRs) outstanding as at 31 March 2013 is 52,23,460 (Previous Year 64,23,460) each represen ng one Equity Share of `2 face value. GDR % against total number of shares is 2.80% (Previous Year 3.45%). The GDRs carry the same terms/rights a ached to Equity Shares of the Company.
NOTES TO CONSOLIDATED FINANCIAL STATEMENTS

Tube Investments of India Limited | 91
e) Stock Op ons
The Company has granted Stock Op ons to certain employees in accordance with the Employees Stock Op on Scheme as follows:
Par culars Date of Grant
Exercise Price (`)
Op ons Granted
Op ons Vested
Op ons Cancelled/
lapsed
Op ons Exercised &
allo ed
Op ons Exercised, pending
allotment
Op ons Outstanding at the End of the
Year
Ves ng (subject to con nuous associa on with the Company and
performance ra ng parameters)
Grant 1 31-Oct-07 62.85 6,00,120 3,80,874 2,36,496 3,63,624 - - 31.10.08 – 100%Grant 2 31-Jan-08 66.10 1,05,460 81,324 24,136 81,324 - - 31.01.09 – 100%Grant 3 24-Mar-08 56.80 26,55,260 16,13,270 10,41,990 12,06,252 - 4,07,018 31.10.09 – 25%
31.10.10 – 37.5%31.10.11 – 37.5%
Grant 4 31-Jul-08 44.45 3,86,900 2,94,305 92,595 1,74,433 - 1,19,872 31.07.09 – 20%31.07.10 – 20%31.07.11 – 30%31.07.12 – 30%
Grant 5 31-Oct-08 24.25 54,000 30,240 23,760 30,240 - - 31.10.09 – 20%31.10.10 – 20%31.10.11 – 30%31.10.12 – 30%
Grant 6 30-Jan-09 31.05 28,100 23,323 4,777 23,323 - - 30.01.10 – 20%30.01.11 – 20%30.01.12 – 30%30.01.13 – 30%
Grant 7 29-Jan-11 140.05 4,25,400 1,22,242 85,898 2,600 - 3,36,902 29.01.12 – 20%29.01.13 – 20%29.01.14 – 30%29.01.15 – 30%
Grant 8 29-Jan-11 140.05 1,92,400 1,07,200 39,420 17,512 - 1,35,468 29.01.12 – 40%29.01.13 – 30%29.01.14 – 30%
Grant 9 29-Jan-11 140.05 13,900 11,120 2,780 - - 11,120 29.01.12 – 50%29.01.13 – 50%
Grant 10 2-May-11 140.45 55,000 3,936 31,384 - - 23,616 02.05.12 – 20%02.05.13 – 20%02.05.14 – 30%02.05.15 – 30%
Grant 11 1-Aug-11 159.75 33,600 - 6,720 - - 26,880 01.08.12 – 20%01.08.13 – 20%01.08.14 – 30%01.08.15 – 30%
Grant 12 2-Nov-11 143.10 1,26,800 21,900 3,460 - - 1,23,340 02.11.12 – 20%02.11.13 – 20%02.11.14 – 30%02.11.15 – 30%
46,76,940 26,89,734 15,93,416 18,99,308 - 11,84,216
During the past 5 years, the Company has allo ed 18,99,308 (Previous Year 15,35,317) Equity Shares of `2 each to employees, pursuant to the exercise of their Op on under the Employees Stock Op on Scheme.
The total number of such Op ons outstanding as at 31 March 2013 is 11,84,216 (Previous Year 16,80,893) and each Op on is exercisable into one Equity Share of `2 face value within three/six years from the date of ves ng.
The movement in Stock Op ons during the year is given below:
Par cularsDate of
Grant
Op ons Outstanding at the
Beginning of the Year
During the yearOp ons Outstanding at the End of the Year
Op ons Granted
Op ons Cancelled/lapsed
Op ons Exercised &
allo ed
Op ons Exercised in the previous year & alloted
during the year
Op ons Exercised & pending allotment
Grant 1 31-Oct-07 - - - - - - - Grant 2 31-Jan-08 - - - - - - - Grant 3 24-Mar-08 6,45,453 - - 2,38,435 5,296 - 4,07,018 Grant 4 31-Jul-08 2,15,220 - 16,011 79,337 - - 1,19,872 Grant 5 31-Oct-08 8,100 - 1,620 6,480 - - - Grant 6 30-Jan-09 15,174 - 843 14,331 - - - Grant 7 29-Jan-11 3,87,796 - 48,294 2,600 - - 3,36,902 Grant 8 29-Jan-11 1,81,240 - 28,260 17,512 - - 1,35,468 Grant 9 29-Jan-11 12,510 - 1,390 - - - 11,120 Grant 10 2-May-11 55,000 - 31,384 - - - 23,616 Grant 11 1-Aug-11 33,600 - 6,720 - - - 26,880 Grant 12 2-Nov-11 1,26,800 - 3,460 - - - 1,23,340
Total 16,80,893 - 1,37,982 3,58,695 5,296 - 11,84,216
NOTES TO CONSOLIDATED FINANCIAL STATEMENTS

92 | Tube Investments of India Limited
3. Reserves and Surplus
` in Crores
Par culars As at 31.03.2012 Movement As at
31.03.2013Capital Reserve (Refer Note a below) 0.79 0.47 1.26 Capital Reserve on Consolida on 0.16 0.00 0.16 Capital Redemp on Reserve 24.13 (1.32) 22.81 Securi es Premium Account 190.13 62.60 252.73 Debenture Redemp on Reserve 68.33 66.77 135.10 Hedge Reserve Account 0.46 (0.78) (0.32)Statutory Reserve (Refer Note b below) 68.69 26.03 94.72 Foreign Currency Transla on Reserve 1.86 (1.13) 0.73 Con ngency Reserve for Unexpired Risk (Refer Note c below) 7.07 11.59 18.66 Fair Value Change Account (0.64) (0.01) (0.65)General Reserve 619.52 357.48 977.00
980.50 521.70 1502.20 Surplus/(De cit) in the Statement of Pro t and LossSurplus at the beginning of the year 461.61 292.29 Pro t for the year 268.91 288.51 Final Dividend including Dividend Distribu on Tax (0.02) (0.00)Transfer to General Reserve (303.20) (250.74)Transfer to Statutory Reserve (34.51) (61.59)Transfer to Con ngency Reserve for Unexpired Risk (9.55) (25.21)Transfer to Debenture Redemp on Reserve (31.66) (84.27)Interim Dividend @ `1.50 (Previous Year `2) per Equity Share of `2 each (37.24) (27.99)Final Dividend Proposed @ `0.50 (Previous Year `1) per Equity Share of `2 each (18.63) (9.33)Dividend Distribu on Tax (5.18) (3.20)Earlier year’s provision for Dividend Distribu on Tax no longer required 1.76 1.17 Surplus at the end of the year 292.29 119.64
1272.79 1621.84 Notes:
a) Movement represents the amount received as Industrial Promo on Subsidy from the Government of Maharashtra.
b) Represents the Reserve Fund created under Sec on 45-IC of the Reserve Bank of India Act, 1934.
c) Reserve for Unexpired Risk, represen ng that part of the premium wri en that is a ributable and allocable to the subsequent accoun ng period(s), is calculated principally on “Day Basis” subject to a minimum of 50 percent of the net premium wri en during the preceding twelve months in the case of Fire, Marine (Cargo) and Miscellaneous business except health line and 100 percent for Marine (Hull) business. In the case of health line of business, in terms of IRDA Circular No. IRDA/F&I/CIR/F&A/015/02/2011 dated February 2, 2011, the Reserve for Unexpired Risk is calculated only on “Day Basis”. Further in the case of the inward premium from IMTPDRIP (DR Pool), in view of the “clean cut” arrangement, the en re inward premium is recognised as revenue.
4. Share Applica on Money Pending Allotment
Pursuant to Op ons granted under Employees Stock Op on Scheme, the Company had received `0.03 Cr. towards share applica on money for 5,296 Equity Shares of `2 each with a premium of `54.80 per share during the year ended 31 March 2012. The Shares were allo ed as per the Scheme during the year ended 31 March 2013 and un l the date of allotment of shares, the said amount was held in a designated bank account and was not available for use by the Company.
NOTES TO CONSOLIDATED FINANCIAL STATEMENTS

Tube Investments of India Limited | 93
5. Long Term Borrowings
` in Crores
Par cularsAs at
31.03.2013As at
31.03.2012Secured Borrowings Non-Conver ble Debentures 2529.40 1907.90 Foreign Currency Term Loans from Banks 142.26 255.08 Rupee Term Loans from Banks 4391.33 4108.34 Senior Debt and Others - 0.18Unsecured Borrowings Non-Conver ble Debentures 1853.70 1285.70 Deferred Payment Liability - Sales Tax Deferral 12.38 16.24
8929.07 7573.44
6. Deferred Tax Liabili es (Net)` in Crores
Nature - Liability/(Asset)As at
31.03.2013As at
31.03.2012COMPANYDeferred Tax Liabili es
Di erence between the Deprecia on as per Books of Account and the Income Tax Act, 1961 64.09 59.43
Total (A) 64.09 59.43 Deferred Tax Assets
Deferred Revenue Expenses (1.13) (1.74)Provision for Doub ul Debts/Advances (2.91) (2.89)Provision for Employee Bene ts and Others (7.76) (6.72)
Total (B) (11.80) (11.35)Net Deferred Tax Liability (A+B) 52.29 48.08 SUBSIDIARY - FINANCIERE C10 SASDeferred Tax Liabili es Others 2.28 1.90 Total (A) 2.28 1.90 Deferred Tax Assets Others - - Total (B) - - Net Deferred Tax Liability (A+B) 2.28 1.90 SUBSIDIARY - SHANTHI GEARS LIMITEDDeferred Tax Liabili es Di erence between the Deprecia on as per Books
of Account and the Income Tax Act, 1961 9.01 - Total (A) 9.01 - Deferred Tax Assets 43B liabili es/disallowance (2.14) -Total (B) (2.14) - Net Deferred Tax Liability (A+B) 6.87 -
Total Deferred Tax Liability (Net) 61.44 49.98
NOTES TO CONSOLIDATED FINANCIAL STATEMENTS

94 | Tube Investments of India Limited
7. Other Long Term Liabili es` in Crores
Par culars As at31.03.2013
As at31.03.2012
Advances from Customers/Others 1.16 0.79
Interest Accrued but Not Due on Loans/Other Deposits 45.24 16.79
Payable to IMTPIP - 121.06
Claims Outstanding 922.10 47.41
Reserve for Unexpired Risk 36.71 21.59
Other Liabili es 2.26 5.90
1007.47 213.54
8. Long Term Provisions
` in Crores
Par culars As at31.03.2013
As at31.03.2012
Provision for Standard Assets* 28.51 20.76
Provision for Non-Performing Assets* 52.17 25.37
Provision for Credit Enhancements and Servicing Costs on Assets De-recognised* 7.53 6.88
Provision for Compensated Absences 3.85 2.85
92.06 55.86
*Also Refer Note 12(iii)
9. Short Term Borrowings
` in Crores
Par culars As at31.03.2013
As at31.03.2012
Secured Borrowings
Foreign Currency Loans 38.00 117.32
Working Capital Demand Loans 120.00 -
Cash Credit and Other Borrowings 2149.21 42.85
2307.21 160.17
Unsecured Borrowings
Foreign Currency Loans 56.61 4.79
Working Capital Demand Loans 50.00 1413.06
Cash Credit and Other Borrowings 33.64 33.33
Commercial Papers 850.05 235.00
990.30 1686.18
3297.51 1846.35
NOTES TO CONSOLIDATED FINANCIAL STATEMENTS

Tube Investments of India Limited | 95
10. Trade Payables
` in Crores
Par cularsAs at
31.03.2013As at
31.03.2012
Trade Payables
- Dues to Micro, Small & Medium Enterprises 1.48 0.88
- Goods and Services 613.35 662.92
Acceptances 62.16 59.06
676.99 722.86
11. Other Current Liabili es` in Crores
Par cularsAs at
31.03.2013As at
31.03.2012Current Maturi es of Long Term Borrowings 4373.26 2864.29Deferred Payment Liability - Sales Tax Deferral 3.86 2.98Interest Accrued but Not Due 321.17 209.25Unpaid Dividends 2.76 2.25Income received in advance 0.03 0.30Unclaimed Fixed Deposits and interest 0.40 0.54Advances and Deposits from Customers/Others 91.78 24.79Collec ons in derecognised assets 184.87 -Claims Outstanding 261.08 415.77Reserve for Unexpired Risk 628.89 461.39Other Liabili es 155.80 191.23Share in Joint Venture 0.50 0.32
6024.40 4173.11
12. Short Term Provisions` in Crores
Par cularsAs at
31.03.2013As at
31.03.2012Provision for Compensated Absences (Net) 29.19 30.16 Provision for Warran es (Refer Note i below) 1.96 1.63 Provision for Con ngencies (Refer Note ii below) 4.12 3.49 Provision for Wealth Tax 0.13 0.07 Provision for Standard Assets (Refer Note iii below) 13.06 13.12 Provision for Non Performing Assets (Refer Note iii below) 172.14 124.30 Provision for Credit Enhancements and Servicing Costs on Assets De-recognised (Refer Note iii below) 0.75 2.51 Provision for Others 13.55 13.32 Con ngent Service Tax Claims (Refer Note iii below) 7.92 7.36 Proposed Dividend 9.33 18.63 Dividend Distribu on Tax 1.59 3.02 Share in Joint Venture 0.68 0.58
254.42 218.19
NOTES TO CONSOLIDATED FINANCIAL STATEMENTS

96 | Tube Investments of India Limited
Notes:
(i) Warran es - Company
The details of Provision for Warran es is given below: ` in Crores
Par culars 2012-13 2011-12
Opening Balance 1.63 1.63
Provision created during the year 2.56 3.13
U lised during the year (2.23) (3.13)
Closing Balance 1.96 1.63
Provision for Warran es is es mated based on past experience and technical es mates.
(ii) Con ngencies
The Company and one of its Subsidiaries carry a general provision for con ngencies towards various claims against the Company not acknowledged as debts.
` in Crores
Par culars 2012-13 2011-12
Opening Balance 3.49 3.51
Provision created during the year 0.63 1.00
U lised during the year - (1.02)
Closing Balance 4.12 3.49
(iii) Movement in Provisions in CIFCL
(Long Term Provisions and Short Terms Provisions) ` in Crores
Par cularsProvision
for Standard Assets
Provision for Non-
Performing Assets
Provision for Credit Enhancements and Servicing Costs on
Assets Derecognised
Con ngent Service Tax
Claims
Opening Balance
- Long Term (Refer Note 8) 20.76 25.37 6.88 -
- Short Term 13.12 124.30 2.51 7.36
Provision Created during the year 7.69 107.57 - 0.56
U lised/Reversed during the year - (32.93) (1.11) -
Closing Balance
- Long Term (Refer Note 8) 28.51 52.17 7.53
- Short Term 13.06 172.14 0.75 7.92
NOTES TO CONSOLIDATED FINANCIAL STATEMENTS

Tube Investments of India Limited | 97
13. Fixed Assets
` in Crores
Par culars
Gross Block at Cost Deprecia on / Amor sa on Net Block
As at31.03.2012
Addi on on Acquisi on of
Subsidiary
Addi ons/ Adjustments
Dele ons/ Adjustments
As at31.03.2013
As at31.03.2012
Addi on on Acquisi on of
Subsidiary
For the Year
(Note 1)
On Dele on
As at31.03.2013
As at31.03.2013
As at31.03.2012
Tangible Assets
Land (Freehold) 64.06 5.50 7.33 - 76.89 - - - - - 76.89 64.06
(34.01) - (30.05) - (64.06) - - - - (64.06) (34.01)
Land (Leasehold) 1.14 - - 1.14 0.20 - 0.02 - 0.22 0.92 0.94
(1.14) - - (1.14) (0.19) (0.01) - (0.20) (0.94) (0.95)
Buildings (Note 2) 250.39 34.01 26.35 0.12 310.63 57.13 9.33 29.54 0.05 95.95 214.68 193.26
(231.25) - (19.26) (0.12) (250.39) (49.85) - (7.33) (0.05) (57.13) (193.26) (181.40)
Plant & Machinery 1088.29 303.90 90.50 17.61 1465.08 661.22 221.57 70.08 16.94 935.93 529.15 427.07
(1004.64) - (92.49) (8.84) (1088.29) (592.93) (75.92) (7.63) (661.22) (427.07) (411.71)
Railway Siding 0.21 - - - 0.21 0.20 - - - 0.20 0.01 0.01
(0.21) - - - (0.21) (0.19) (0.01) - (0.20) (0.01) (0.02)
O ce Equipment 30.11 8.25 36.71 7.85 67.22 20.85 7.58 13.57 7.30 34.70 32.52 9.26
(22.90) - (9.04) (1.83) (30.11) (18.45) - (4.20) (1.80) (20.85) (9.26) (4.45)
Improvrment to Premises (Leasehold and Owned)
7.02 - 15.62 0.64 22.00 2.37 - 7.52 0.63 9.26 12.74 4.65
(4.65) - (2.37) - (7.02) (1.83) - (0.54) - (2.37) (4.65) (2.82)
Furniture & Fixtures 27.40 1.94 3.70 1.02 32.02 19.49 1.47 0.71 0.99 20.68 11.34 7.91
(18.74) - (9.09) (0.43) (27.40) (16.33) - (3.53) (0.37) (19.49) (7.91) (2.41)
Vehicles 13.44 2.80 5.01 3.06 18.19 5.85 2.14 2.92 2.21 8.70 9.49 7.59
(11.78) (4.33) (2.67) (13.44) (5.58) (2.22) (1.95) (5.85) (7.59) (6.20)
Leased Informa on Technology Equipment
- - - - - - - - - - -
(2.45) - - (2.45) - (1.98) (0.47) (2.45) - - (0.47)
Total 1482.06 356.40 185.22 30.30 1993.38 767.31 242.09 124.36 28.12 1105.64 887.74 714.75
(1331.77) - (166.63) (16.34) (1482.06) (687.33) - (94.23) (14.25) (767.31) (714.75) (644.44)
Intangible Assets
- Computer So ware 48.68 4.69 13.76 - 67.13 38.25 3.25 7.98 - 49.48 17.65 10.43
(40.71) - (7.97) - (48.68) (31.80) - (6.45) - (38.25) (10.43) (8.91)
- Others 6.65 - - 4.81 1.84 3.98 - 0.09 2.45 1.62 0.22 2.67
(6.65) - - - (6.65) (4.16) - (0.06) (0.24) (3.98) (2.67) (2.49)
Total 55.33 4.69 13.76 4.81 68.97 42.23 3.25 8.07 2.45 51.10 17.87 13.10
Total (47.36) - (7.97) - (55.33) (35.96) - (6.51) (0.24) (42.23) (13.10) (11.40)
Grand Total 1537.39 361.09 198.98 35.11 2062.35 809.54 245.34 132.43 30.57 1156.74 905.61 727.85
(1379.13) - (174.60) (16.34) (1537.39) (723.29) - (100.74) (14.49) (809.54) (727.85) (655.84)
Notes:
1. Addi ons to Deprecia on includes deprecia on amoun ng to `2.25 Cr. (Previous Year `2.39 Cr.) charged addi onally on certain assets.
2. Net Block of Buildings includes Improvement to Buildings `10.61 Cr. (Previous Year `11.06 Cr.) constructed on Leasehold Land.
3. Previous Year Figures are given in brackets.
NOTES TO CONSOLIDATED FINANCIAL STATEMENTS

98 | Tube Investments of India Limited
14. Non-Current Investments
` in Crores
Par cularsAs at
31.03.2013As at
31.03.2012
Long Term Investments (At Cost unless otherwise stated)
Trade Investments:
Government Securi es 559.55 375.51
Other Investments:
Equity Shares (Fully paid) - Quoted (Refer Note a and b below) 3.33 4.10
Equity Shares (Fully paid) - Unquoted 3.54 3.54
Debentures and Bonds 495.94 390.82
Investment in Mutual Fund Units 1.92 1.25
Investment in Infrastructure Bonds 194.01 142.85
Others 24.01 -
Share in Joint Venture - 0.12
1282.30 918.19
Notes:
a) Net of provision for diminu on in the value of Investments `1.10 Cr. (Previous Year `1.10 Cr.).
b) Market Value of Quoted Investments is `4.54 Cr. (Previous Year `4.39 Cr.).
NOTES TO CONSOLIDATED FINANCIAL STATEMENTS

Tube Investments of India Limited | 99
15. Deferred Tax Assets (Net)
` in Crores
Nature - Liability/(Asset)As at
31.03.2013As at
31.03.2012
SUBSIDIARY - CMSGICL
Deferred Tax Liabili es
Di erence between the Deprecia on as per Books of Account and the Income Tax Act, 1961 (1.17) (0.31)
Total (A) (1.17) (0.31)
Deferred Tax Assets
Provision for Employee Bene ts and Others 1.23 1.32
Unabsorbed business loss - 2.40
Provision for dimunu on in investments 0.37 0.36
Others 0.19 0.06
Total (B) 1.79 4.14
Net Deferred Tax Asset (A+B) 0.62 3.83
SUBSIDIARY - CIFCL
Deferred Tax Liabili es
Unamor sed Miscellaneous Expenditure (21.81) (20.31)
Total (A) (21.81) (20.31)
Deferred Tax Assets
Provision for Standard Assets 14.13 10.99
Provision for Non-Performing Assets 53.19 26.17
Provision for Credit Enhancements and Servicing Costs on Assets De-Recognised 2.82 3.05
Provision for Repossessed Stock 4.07 3.08
Provision for Con ngent Service Tax 2.69 -
Income Derecognised on Non-Performing Assets 7.51 19.64
Provision for Employee Bene ts and Others 3.56 -
Di erence between the Deprecia on as per Books of Account and the Income Tax Act, 1961 2.00 0.72
Others 0.70 7.79
Total (B) 90.67 71.44
Net Deferred Tax Asset (A+B) 68.86 51.13
SUBSIDIARY - TICI Motors (WUXI) Company Limited
Deferred Tax Assets
Others - 0.28
Net Deferred Tax Asset - 0.28
Total Deferred Tax Asset (Net) 69.48 55.24
NOTES TO CONSOLIDATED FINANCIAL STATEMENTS

100 | Tube Investments of India Limited
16. Long Term Loans and advances
(Unsecured, Considered Good unless otherwise stated) ` in Crores
Par cularsAs at
31.03.2013As at
31.03.2012Capital Advances - Secured 21.35 19.57 - Unsecured 6.93 20.63 Loans and Advances - Receivable from Terrorism Pool 49.61 37.93 - Electricity and Other Deposits 6.00 7.55 - Others 1.87 3.63 Deposits with Government, Public Bodies and Others 13.86 9.88 Balance with Customs, Excise and Sales Tax Authori es 6.60 8.52 Receivable from Indian Motor Third Party Insurance Pool Members 418.53 - Sundry Deposits 4.37 7.52 Advance Income Tax (Net of Provision) 91.69 73.74 MAT Credit En tlement 1.98 1.60 Share in Joint Venture 0.03 0.17
622.82 190.74
17. Receivable Under Financing Ac vity
` in Crores
Par cularsAs at
31.03.2013As at
31.03.2012Secured (Refere Note below) Automobile Financing 7414.12 5435.93 Loans against Immovable Property 3991.78 2785.63 Loans against Securi es 54.25 96.68 Other Loans 13.14 23.00 Unsecured Consumer Loans 0.36 1.72
11473.65 8342.96 Of the above: Considered Good 11402.47 8296.00 Others - Non Performing Assets 71.18 46.96
11473.65 8342.96 Note:
Secured means exposures secured wholly or partly by hypotheca on of automobile assets and/or, pledge of securi es and/or, equitable mortgage of property and/or, company guarantees or personal guarantees and/or, undertaking to create a security.
18. Other Non-Current Assets
(Unsecured, Considered Good unless otherwise stated) ` in Crores
Par cularsAs at
31.03.2013As at
31.03.2012Non-Current Bank Balances 350.97 247.39 Excess Interest spread - Derecognised Assets 51.13 57.91 Prepaid Finance Charges 49.49 48.29 Financial Assets 5.99 15.53 Deposits 2.11 -
459.69 369.12
NOTES TO CONSOLIDATED FINANCIAL STATEMENTS

Tube Investments of India Limited | 101
19. Current Investments
(At lower of Cost and Fair Value) ` in Crores
Par cularsAs at
31.03.2013As at
31.03.2012
Investments - Current
Investment in Infrastructure Bonds 10.13 15.50
Debentures/Bonds 145.24 114.00
Mutual Funds and Money Market Instruments 243.53 73.56
Government Securi es 6.75 9.02
405.65 212.08
20. Inventories
(Lower of Cost and es mated Net Realisable Value (Net of Allowances)) ` in Crores
Par cularsAs at
31.03.2013As at
31.03.2012Raw Materials 180.04 198.57 Work-in-Progress 131.44 105.28 Finished Goods 107.36 102.39 Stock-in-Trade 21.20 29.19 Stores and Spare Parts 16.93 16.27 Goods-in-Transit - Raw Materials 4.49 3.94 - Stock-in-Trade 1.36 17.66
462.82 473.30
21. Trade Receivables` in Crores
Par cularsAs at
31.03.2013As at
31.03.2012Outstanding for a period exceeding six months from the date they are due for payment Considered good 55.35 4.96 Doub ul 8.28 8.52
63.63 13.48 Others Considered good 477.84 503.91 Doub ul 0.78 0.36
478.62 504.27 Gross Trade Receivables 542.25 517.75 Provision for Doub ul Debts (9.06) (8.88)Share in Joint Venture 3.06 2.81
536.25 511.68 Of the above: - Secured 4.36 6.70 - Unsecured 531.89 504.98
536.25 511.68
NOTES TO CONSOLIDATED FINANCIAL STATEMENTS

102 | Tube Investments of India Limited
22. Cash and Cash Equivalents
` in Crores
Par cularsAs at
31.03.2013As at
31.03.2012
Balance with Banks
- Current Accounts 465.89 298.48
- Unpaid Dividend Accounts 2.76 2.25
- On Deposit Accounts
- Free of Lien 151.11 133.20
- Under Lien 6.31 4.70
- On Client and Exchange Related Accounts 2.84 0.88
- Deposits as Collateral towards Assets De-recognised 66.83 71.08
- Public Deposit Escrow Account 0.56 0.94
- In Deposit Accounts - Original maturity more than 3 months 7.44 -
Share in Joint Venture 1.78 1.50
705.52 513.03
Cheques on Hand 25.84 19.53
Cash on Hand 32.64 20.99
764.00 553.55
23. Short Term Loans and Advances
` in Crores
Par cularsAs at
31.03.2013As at
31.03.2012
Advances Recoverable
- Goods and Services 18.83 31.72
- Employee Related 12.12 10.04
- Prepaid Expenses 7.48 13.16
- Gratuity Fund (Net of Provision) 0.78 0.71
- Others 4.11 70.77
43.32 126.40
Other Deposits 11.28 5.51
Receivable from IMTPIP 32.17 -
Balances with Customs, Excise and Sales Tax Authori es 12.39 9.43
Advance Tax (Net of Provision) 0.04 12.66
Fringe Bene ts Tax (Net of Provision) 0.01 0.01
Share in Joint Venture 0.39 0.15
99.60 154.16
NOTES TO CONSOLIDATED FINANCIAL STATEMENTS
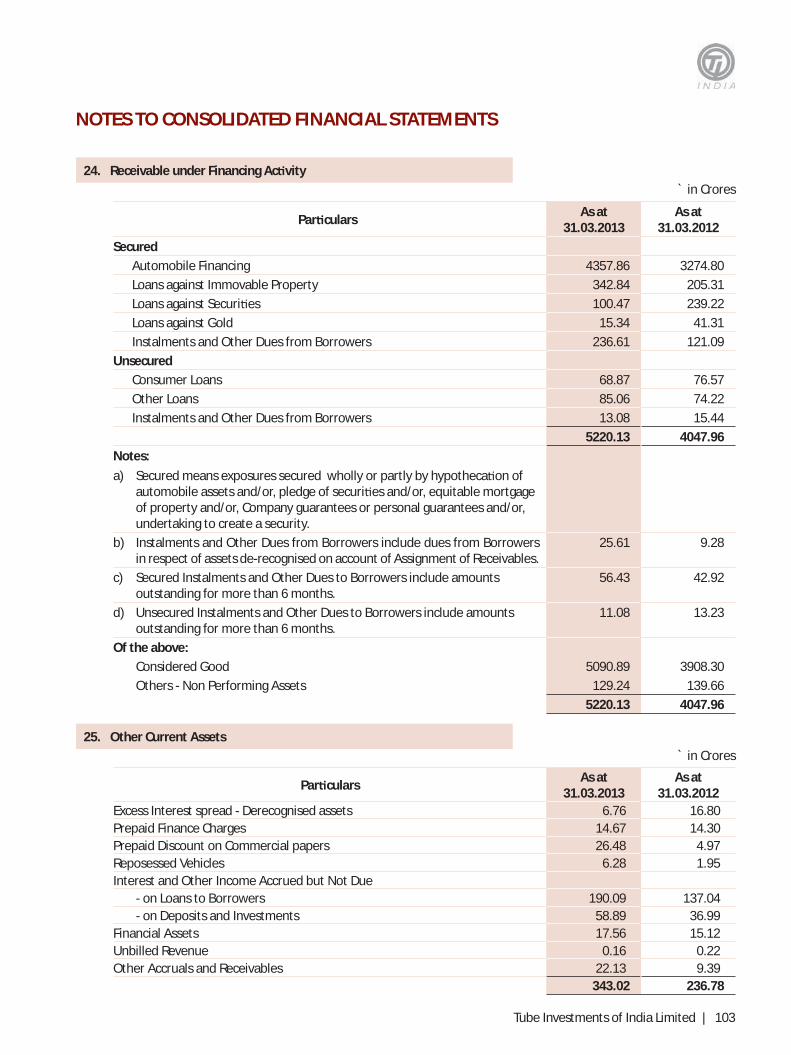
Tube Investments of India Limited | 103
24. Receivable under Financing Ac vity` in Crores
Par cularsAs at
31.03.2013As at
31.03.2012Secured
Automobile Financing 4357.86 3274.80 Loans against Immovable Property 342.84 205.31 Loans against Securi es 100.47 239.22 Loans against Gold 15.34 41.31 Instalments and Other Dues from Borrowers 236.61 121.09
UnsecuredConsumer Loans 68.87 76.57 Other Loans 85.06 74.22 Instalments and Other Dues from Borrowers 13.08 15.44
5220.13 4047.96 Notes:
a) Secured means exposures secured wholly or partly by hypotheca on of automobile assets and/or, pledge of securi es and/or, equitable mortgage of property and/or, Company guarantees or personal guarantees and/or, undertaking to create a security.
b) Instalments and Other Dues from Borrowers include dues from Borrowers in respect of assets de-recognised on account of Assignment of Receivables.
25.61 9.28
c) Secured Instalments and Other Dues to Borrowers include amounts outstanding for more than 6 months.
56.43 42.92
d) Unsecured Instalments and Other Dues to Borrowers include amounts outstanding for more than 6 months.
11.08 13.23
Of the above: Considered Good 5090.89 3908.30 Others - Non Performing Assets 129.24 139.66
5220.13 4047.96
25. Other Current Assets` in Crores
Par cularsAs at
31.03.2013As at
31.03.2012Excess Interest spread - Derecognised assets 6.76 16.80 Prepaid Finance Charges 14.67 14.30 Prepaid Discount on Commercial papers 26.48 4.97 Reposessed Vehicles 6.28 1.95 Interest and Other Income Accrued but Not Due - on Loans to Borrowers 190.09 137.04 - on Deposits and Investments 58.89 36.99 Financial Assets 17.56 15.12 Unbilled Revenue 0.16 0.22 Other Accruals and Receivables 22.13 9.39
343.02 236.78
NOTES TO CONSOLIDATED FINANCIAL STATEMENTS

104 | Tube Investments of India Limited
26. Other Income
` in Crores
Par cularsYear Ended31.03.2013
Year Ended31.03.2012
Interest and Dividend Income 15.81 13.10 Royalty Income 0.32 0.41 Pro t on Tangible Assets sold/Discarded (Net) 0.91 0.12 Pro t on Sale of Investments (Net) 4.08 - Miscellaneous Income 6.82 0.72 Share in Joint Venture 0.22 0.18
28.16 14.53
27. Cost of Materials Consumed
` in Crores
Par cularsYear Ended31.03.2013
Year Ended31.03.2012
Raw Materials Consumed 2174.43 2213.97 Scrap Sales (Net of Excise Duty) (158.99) (155.35) Raw Materials Consumed (Net) 2015.44 2058.62
28. Changes in Inventories of Finished goods, Work-in-Progress and Stock-in-Trade
` in Crores
Par cularsYear Ended31.03.2013
Year Ended31.03.2012
Opening Stock Work-in-Progress 105.28 83.10 Finished Goods 102.39 100.11 Stock-in-Trade 46.85 28.51
254.52 211.72 Addi on on Acquisi on of new Subsidiary 32.68 - Closing Stock Work-in-Progress 131.44 105.28 Finished Goods 107.36 102.39 Stock-in-Trade 22.56 46.85
261.36 254.52 25.84 (42.80)
29. Employee Bene ts Expense
` in Crores
Par cularsYear Ended31.03.2013
Year Ended31.03.2012
Salaries, Wages and Bonus 496.78 425.59 Contribu on to Provident and Other Funds 47.14 45.01 Welfare Expenses 45.58 37.44 Share in Joint Venture 2.74 2.64
592.24 510.68
NOTES TO CONSOLIDATED FINANCIAL STATEMENTS

Tube Investments of India Limited | 105
30. Other Expenses
` in Crores
Par cularsYear Ended31.03.2013
Year Ended31.03.2012
Consump on of Stores and Spares 149.55 144.30
Freight and Carriage Inwards 47.22 46.17
Conversion Charges 76.12 70.49
Power and Fuel 165.60 135.47
Rent 64.52 37.41
Repairs to Buildings 2.04 1.59
Repairs to Machinery 54.12 54.13
Repairs to Others 2.69 1.70
Insurance 4.50 2.83
Rates and Taxes 38.57 42.03
Travelling and Conveyance 38.51 36.37
Prin ng, Sta onery and Communica on 25.05 25.48
Freight, Delivery and Shipping Charges 113.75 104.93
Discounts/Incen ves on Sales 27.87 33.78
Adver sement and Publicity 32.01 45.31
Bad Debts Wri en O 0.51 1.75
Release of Bad Debts provision (0.33) (1.75)
Provision for Doub ul Debts 0.18 1.20
Advances Wri en O 0.11 -
Auditors’ Remunera on (Refer Note below) 1.82 1.47
Commission to Non Whole Time Directors - Company 1.30 1.30
Directors’ Si ng Fees - Company 0.08 0.08
Loss on Exchange Fluctua on (Net) 9.24 3.61
Provision for Con ngencies 0.63 1.00
Marke ng Expenses 128.40 118.20
Bank Charges 2.59 3.64
EDP Expenses 26.93 22.61
Dona ons to Charitable and other ins u ons 1.38 1.07
Administra on Expenses 55.11 6.89
Insurance Commission (Net) 17.05 49.94
Recovery Charges 64.98 57.56
Other Expenses 127.57 142.35
Share in Joint Venture 2.70 2.29
1282.37 1195.20
NOTES TO CONSOLIDATED FINANCIAL STATEMENTS

106 | Tube Investments of India Limited
Note: Auditors’ Remunera on (Including for other Auditors)
` in Crores
Par culars 2012-13 2011-12
Statutory Audit 1.22 1.00
Tax Audit & Other Services 0.55 0.46
Reimbursement of Expenses 0.05 0.01
Sub-Total 1.82 1.47
Share in Joint Venture 0.02 0.01
Total 1.84 1.48
31. Provisions, Loan Losses and Other Charges
` in Crores
Par cularsYear Ended31.03.2013
Year Ended31.03.2012
Loss Assets Wri en O 11.54 172.23
Loss on Repossessed Assets (Net) 29.95 16.17
Provision for Non Performing Assets 107.57 74.90
Provision Released for Non Performing Assets on Recovery/Write o (33.64) (198.88)
Provision for Standard Assets (Net) 7.69 12.90
Provision for other Doub ul Debts and Advances 0.21 0.54
Loss on Sale of Shares held as Stock-in-Trade (Net) 0.01 0.02
Provision for Dimuni on in value of Investment 0.01 0.07
123.34 77.95
32. Finance Costs
` in Crores
Par cularsYear Ended31.03.2013
Year Ended31.03.2012
Interest Expense 96.64 70.33
Exchange di erence on Foreign Currency Loans (Net) 9.96 7.18
Other Borrowing Costs 0.81 1.15
107.41 78.66
NOTES TO CONSOLIDATED FINANCIAL STATEMENTS

Tube Investments of India Limited | 107
33. Con ngent Liabili es and Commitments ` in Crores
Par culars As at 31.03.2013
As at 31.03.2012
a) Es mated amount of contracts remaining to be executed on capital account and not provided for:
i. Capital Expenditure 107.22 113.06 ii. Investments - 53.85b) Disputed Income-Tax demands from A.Y. 1993-94 to 2009-10 under
appeal/remand pending before various appellate/assessing authori es against which `28.02 Cr. (Previous Year `29.54 Cr.) has been deposited. The Balance of `1.47 Cr. (Previous Year `1.91 Cr.) is not deposited for which rec ca on pe ons/appeals have been led. The Management is of the opinion that the above demands are not sustainable. 29.49 31.45
c) Disputed Service Tax, Excise and Customs duty demand amoun ng to `1.78 Cr. (Previous Year `1.72 Cr.) and penalty of `1.22 Cr. (Previous Year `1.22 Cr.) pertaining to nancial years 1999-00 to 2005-06 under appeal pending before the Appellate Tribunal. The same has not been deposited. The Management is of the opinion that the demand is arbitrary and the same is not sustainable. 3.00 2.94
d) Cases decided in favour of the Company against which the department has gone on an appeal
i. Income Tax 43.21 43.14 ii. Excise 2.18 2.18e) Export obliga on under EPCG/Advance License Scheme not yet ful lled.
The Company is con dent of mee ng its obliga ons under the Schemes within the S pulated Period. 68.90 26.03
f) Bills Drawn of Customers and Discounted with Banks 1.44 1.03g) Counter Guarantees Provided by two of the Subsidiaries 39.86 56.66h) Sales Tax Pending before Appellate Authori es in respect of which one of
the Subsidiaries are on appeal and expects to succeed based on decision in earlier years - 3.84
i) Disputed claims against one of the Subsidiary lodged by various par es pending li ga on (to the extent quan able) 15.13 10.83
j) Cases decided in favour of the Subsidiaries against which the department has gone on appeal
i. Income Tax 0.98 32.35 ii. Excise/Service Tax - 17.37k) Disputed Excise/Sales/Service Tax Demands in respect of the Subsidiaries
and Joint Venture 42.81 0.23l) Disputed Income Tax Demands in respect of the Subsidiaries and Joint
Venture 64.25 21.42m) Claims Against Company not acknowledged as debts in one of the
subsidiaries 7.25 -n) Claims, under policies, not acknowledged as debts in one of the
Subsidiaries – in respect of a disputed claim under a re policy. Refer Note (a)
belowRefer Note (a)
belowNotes:
a) CMSGICL is in receipt of claim in ma on for a re loss from one of its customers which, in the opinion of the management, is not admissible on account of viola on of express terms and condi ons of the policy. This view is substan ated by the Joint Surveyors’ report and is also supported by legal opinion and accordingly the Company has repudiated the claim. The said claim, if provided for, would increase the net incurred claims upto `2.76 Cr.
b) Show cause no ces received from various Government Agencies pending adjudica on, have not been considered as con ngent liabili es.
NOTES TO CONSOLIDATED FINANCIAL STATEMENTS
108 | Tube Investments of India Limited
34. Subsidiary - CMSGICL
a. Terrorism Pool:
Premium received from customers on account of Terrorism cover has been ceded to General Insurance Corpora on of India (GIC) Terrorism Pool Account. CMSGICL’s share in the Terrorism Pool Account with GIC, based on the statements of account received during the current year for the period upto 31 December 2012 has been accounted under the respec ve heads as follows :-
a) Premium Inwards - Premium on Reinsurance Accepted
b) Claims - under Claims Paid and Claims Outstanding
c) Management Expenses - under Opera ng Expenses Related to Insurance Business
d) Investment Income (provisional statements received upto March 31, 2013) - under Interest and Dividends in the Statement of Pro t and Loss
The resultant surplus/de cit is re ected as RI Receivable/Payable on Terrorism Pool.
The CMSGICL’s share in the Terrorism Pool Account with GIC for the period 1 January 2013 to 31 March 2013 will be accounted on receipt of the relevant statements of account from GIC.
b. Indian Motor Third Party Insurance Pool (IMTPIP):
a) IRDA had vide its Orders No. IRDA/NL/ORD/MPL/277/12/2011 dated 23 December 2011 and IRDA/NL/ORD/MPL/003/01/2012 dated 3 January 2012 directed dismantling of the IMTPIP with e ect from 31 March 2012. The dismantling of the pooling arrangement of IMTPIP implied that the insurers liability on motor third party insurance on commercial vehicles got restated from industry market share basis to actual policy issued basis.
b) Further, vide Order No. IRDA/F&A/ORD/MTPP/070/03-2012 dated 22 March 2012, IRDA had directed all members to e ect the inter-se se lement of the transi onal liabili es arising out the dismantling of IMTPIP. Accordingly, based on the advice from the Pool Administrator, CMSGICL has e ected the se lement for the underwri en years 2007-08 and 2008-09 and has created claims outstanding liability for the underwri en years 2009-10, 2010-11 and 2011-12 with a corresponding asset towards receivable from other member companies.
c) IRDA, vide Order No. IRDA/F&A/ORD/MTPP/070/03-2012 dated 22 March 2012, amongst other things, had provided an op on to insurers for a deferred absorp on of the di eren al liability subject to certain condi ons listed in the said Order. The Company, having exercised the op on, has recognised in its Miscellaneous Revenue Account for the year ended 31 March 2013, `67 Cr. represen ng the current year’s share of the cumula ve di eren al actuarially es mated liability (net of earned premium) for the underwri ng years 2009-10, 2010-11 and 2011-12.
d) In terms of the above-said Order dated 22 March 2012,
1. CMSGICL has carried forward `55 Cr. of the di eren al liability represen ng the nal tranche, which will be absorbed in the next nancial year 2013-14.
2. CMSGICL has accrued and recognised interest income of `31 Cr. receivable from the member of the erstwhile IMTPIP. During the year, one of the members of the IMTPIP has appealed to the Central Government under Sec on 110H of the Insurance Act, 1938 for se ng aside the IRDA Order with respect to the payment of interest. The ma er is under considera on of the Central Government.
c. Indian Motor Third Party Declined Risk Insurance Pool (DR Pool):
a) In accordance with the direc ons of IRDA, the CMSGICL, together with other non-life insurance companies, par cipates in the DR Pool, a mul lateral reinsurance arrangement in respect of speci ed commercial vehicles and where the policy issuing member insurer cede the insurance premium to the DR pool based on underwri ng policy approved by IRDA. The DR Pool is administered by General Insurance Corpora on of India (GIC).
b) In terms of the DR Pool agreement,
1. Every member insurance company shall underwrite, net of reinsurance, a minimum percentage of “Act only” premium of speci ed commercial vehicles which is in propor on to the sum of y percent of the company’s percentage share in total gross premium and y percent of the total motor premium of the industry for the nancial year.
NOTES TO CONSOLIDATED FINANCIAL STATEMENTS

Tube Investments of India Limited | 109
2. 70% of the premium wri en by the member insurer is to be ceded to the DR Pool.
3. The ful lment or shor all of the above mandatory obliga ons shall be determined based on actual premium wri en (net of reinsurance) by the Company and premium retained with respect to the business ceded to the DR Pool.
4. The DR Pool shall be ex nguished at the end of every nancial year on a clean cut basis, based on the statement of accounts drawn by the Pool Administrator.
c) CMSGICL has recognised the DR Pool transac ons in its books as under :
1. Amounts collected towards declined risks is re ected in GWP (Direct) and the ceding to the DR Pool in Premium on reinsurance ceded.
2. Likewise, premium received from the DR Pool is re ected in Reinsurance accepted.
3. Earned Premium is considered at 100% of the premium received from the DR Pool since the risks have been transferred on a clean cut basis. This treatment of earned premium is di erent from the accoun ng policy in respect of earned premium from other pooling arrangements which is generally at 50% of the Reinsurance accepted.
4. Likewise, CMSGICL’s share of incurred claims of the DR Pool has also been considered on 100% of the earned premium and re ected in Claims Paid and Claims Outstanding.
5. The impact of such change in the accoun ng policy is that the surplus in the Statement of Pro t and Loss is lower by `5.22 Cr. with a corresponding e ect in Net Current Assets.
6. The CMSGICL’s share of administra ve expenses of the DR Pool is disclosed under expenses of management and are net of deduc ons, if any.
7. For the rst 3 quarters ended 31 December 2012, the actual share of premium, claims, pool administrator fees based on the audited statements received from the DR Pool Administrator has been considered.
8. For the calendar quarter ended 31 March 2013, the premium, claims and pool administrator fees have been considered based on the management es mate. The di erence, if any, between the es mates and the actuals for the said quarter shall be recognised in the calendar quarter in which the Pool Administrator makes available the audited statement.
d. Con ngency Reserve for Unexpired Risks:
CMSGICL has created the Reserve for Unexpired Risks for the health line of business based on the 1/365 method availing the op on provided in terms of IRDA Circular No. IRDA/F&I/CIR/F&A/015/02/2011 dated 2 February 2011. The di erence between the reserve on the basis of 1/365 method and URR as would have been created based on sec on 64V(1)(ii)(b) of the Act amounts to `37.32 Cr. (Previous Year – `26.56 Cr.).
In terms of the said circular:
a) ̀ 25.21 Cr. (Previous year – `9.55 Cr.) has been transferred to Con ngency Reserve for Unexpired Risks.
b) The Con ngency Reserve of `9.55 Cr. created as of 31 March 2012 has been transferred to General Reserve as of 31 March 2013.
35. Subsidiary - CIFCL
Assets De-recognised ` in Crores
Par cularsAs at
31.03.2013As at
31.03.2012
Assets De-recognised
On Bilateral Assignment of Receivables 429.96 1008.53
On Securi sa on of Receivables 2098.81 313.38
Deposits provided as Collateral for Credit Enhancements 448.29 314.05
NOTES TO CONSOLIDATED FINANCIAL STATEMENTS

110 | Tube Investments of India Limited
NO
TES
TO C
ON
SOLI
DAT
ED F
INA
NCI
AL
STAT
EMEN
TS
36.
Segm
ent I
nfor
ma
on
(A) P
RIM
ARY
SEG
MEN
T
` in
Cro
res
COM
PONE
NTS/
PROD
UCTS
CYCL
ES/
COM
PONE
NTS/
E SCO
OTER
SEN
GINE
ERIN
GM
ETAL
FORM
ED
PROD
UCTS
GEAR
S AND
GEA
R PR
ODUC
TSIN
SURA
NCE
OTHE
R FI
NANC
IAL
SERV
ICES
OTHE
RSEL
IMIN
ATIO
NSCO
NSOL
IDAT
ED TO
TAL
Curre
nt
Year
Prev
ious
Ye
arCu
rrent
Ye
arPr
evio
us
Year
Curre
nt
Year
Prev
ious
Ye
arCu
rrent
Ye
arPr
evio
us
Year
Curre
nt
Year
Prev
ious
Ye
arCu
rrent
Ye
arPr
evio
us
Year
Curre
nt
Year
Prev
ious
Ye
arCu
rrent
Ye
arPr
evio
us
Year
Curre
nt
Year
Prev
ious
Ye
ar
REVE
NUE
Exte
rnal
Sale
s12
62.5
8 12
92.9
7 13
40.6
0 13
20.0
9 10
08.1
3 10
58.1
7 63
.07
1162
.03
863.
71
2502
.54
1729
.11
6.95
6.
89
7345
.90
6270
.94
Inte
r-Seg
men
t Sale
s0.
00
0.00
12
6.80
12
9.24
0.
47
0.25
0.
14
5.40
5.
42
0.05
(1
32.8
1)(1
34.9
6)0.
00
Othe
r Ope
ra n
g Inc
ome
2.92
8.
15
3.94
7.
31
4.57
6.
37
17
0.56
98
.65
65.3
7 50
.20
0.07
24
7.36
17
0.75
Unall
ocat
ed C
orpo
rate
Inco
me
0.27
0.
14
Tota
l Rev
enue
1265
.50
1301
.12
1471
.34
1456
.64
1013
.17
1064
.79
63.2
1 13
37.9
9 96
7.78
25
67.9
1 17
79.3
1 6.
95
7.01
(1
32.8
1)(1
34.9
6)75
93.5
3 64
41.8
3
Unall
ocat
ed C
orpo
rate
Expe
nses
(17.
10)
(23.
80)
RESU
LT
Oper
a n
g Pro
t51
.16
74.8
5 10
9.94
13
1.00
83
.59
120.
77
5.35
89
.01
15.5
4 45
1.99
28
9.21
1.
44
2.10
77
5.38
60
9.67
Pro
t/(L
oss)
on Sa
le o
f Ass
ets
(0.4
0)0.
00
(0.1
8)0.
12
0.31
0.
03
0.83
0.
01
0.
57
0.15
Net O
pera
ng P
ro t
50.7
6 74
.85
109.
76
131.
12
83.9
0 12
0.80
6.
18
89.0
1 15
.54
452.
00
289.
21
1.44
2.
10
775.
95
609.
82
Divid
end
Inco
me
1.32
4.
74
Inte
rest
Expe
nse
(107
.41)
(78.
66)
Inco
me
Taxe
s(2
17.3
3)(1
83.9
2)
Pro
t on
Sale
of I
nves
tmen
ts4.
08
Min
ority
Inte
rest
in N
et In
com
e(1
69.5
7)(8
3.07
)
Shar
e in
Ass
ociat
e Pr
o t
1.47
0.
00
Net P
ro t
50.7
6 74
.85
109.
76
131.
12
83.9
0 12
0.80
6.
18
89.0
1 15
.54
452.
00
289.
21
1.44
2.
10
288.
51
268.
91
Othe
r Inf
orm
a o
n
Segm
ent A
sset
s28
5.19
30
7.36
73
5.33
70
4.96
75
3.11
76
3.46
28
8.35
24
58.3
2 15
03.9
6 18
159.
68 1
3437
.88
5.99
5.
26
(33.
64)
(33.
19)
2265
2.33
16
689.
69
Unall
ocat
ed C
orpo
rate
Ass
ets
88.1
2 91
.62
Tota
l Ass
ets
285.
19
307.
36
735.
33
704.
96
753.
11
763.
46
288.
35
2458
.32
1503
.96
1815
9.68
134
37.8
8 5.
99
5.26
(3
3.64
)(3
3.19
)22
740.
45
1678
1.31
Segm
ent L
iabili
es
199.
46
214.
85
235.
27
255.
99
175.
34
214.
73
18.1
8 20
23.0
1 11
81.2
1 16
259.
17 1
2069
.80
1.27
0.
90
(33.
64)
(33.
19)
1887
8.06
13
904.
29
Unall
ocat
ed C
orpo
rate
Liab
ili e
s68
.76
56.1
1
Tota
l Lia
bili
es
199.
46
214.
85
235.
27
255.
99
175.
34
214.
73
18.1
8 20
23.0
1 11
81.2
1 16
259.
17 1
2069
.80
1.27
0.
90
(33.
64)
(33.
19)
1894
6.82
13
960.
40
Capi
tal E
xpen
ditu
re10
.51
6.01
82
.24
93.3
1 61
.62
67.5
0 3.
10
24.0
2 15
.16
35.9
8 31
.70
0.29
0.
27
217.
76
213.
95
Unall
ocat
ed C
orpo
rate
Cap
ital E
xpen
ditu
re75
.60
5.60
Depr
ecia
on
8.98
7.
04
33.8
7 30
.23
42.3
4 42
.51
12.4
6 10
.14
8.09
21
.57
10.3
8 0.
19
0.16
12
9.55
98
.41
Unall
ocat
ed C
orpo
rate
Dep
recia
on
3.07
2.
49

Tube Investments of India Limited | 111
(B) SECONDARY SEGMENT
` in Crores
Par culars 2012-13 2011-12
1. Revenue by Geographic Market
India 7172.46 6,037.17
Rest of the World 421.07 404.66
Total 7593.53 6441.83
2. Segment Assets by Geographic Market
India 22473.02 16,527.35
Rest of the World 179.31 162.34
Total 22652.33 16689.69
3. Capital Expenditure by
India 280.55 212.43
Rest of the World 12.81 7.12
Total 293.36 219.53
37. Disclosure in respect of Related Par es pursuant to Accoun ng Standard 18
a) List of Related Par es
I. Company having Substan al Interest in Vo ng Power Cholamandalam MS General Insurance Company Limited Mitsui Sumitomo Insurance Company Limited.
II. Associate – Inves ng Company Murugappa Holdings Limited
III. Joint Venture Companies Cholamandalam MS Risk Services Limited
IV. Key Management Personnel (KMP) In Company Mr. L Ramkumar – Managing Director
Note: Related party rela onships are as iden ed by the Management and relied upon by the Auditor.
NOTES TO CONSOLIDATED FINANCIAL STATEMENTS

112 | Tube Investments of India Limited
b) During the year the following transac ons were carried out with the aforesaid related par es in the ordinary course of business:
` in Crores
Transac on Related Party 2012-13 2011-12Rentals Received/Recovered Mitsui Sumitomo Insurance Company Limited 0.70 0.72Management Expenses Mitsui Sumitomo Insurance Company Limited (a) Paid/Payable 0.91 1.24 (b) Recovery 0.39 0.16Reinsurance Ceded Mitsui Sumitomo Insurance Company Limited 44.64 38.45Reinsurance Commission Received Mitsui Sumitomo Insurance Company Limited 6.03 6.03Reinsurance Recovery on claims Mitsui Sumitomo Insurance Company Limited 50.56 26.52Dividend Paid Murugappa Holdings Limited 22.17 22.42
KMP of the Company 0.05 0.06Amount received from KMP KMP of the Company 0.19 0.39Remunera on KMP of the Company 2.49 2.13Balance at Year EndReceivable (Net) – Due from other En es Carrying on Insurance Business
Mitsui Sumitomo Insurance Company Limited 1.99 3.22
Receivable (Net) – Management expenses and rent
Mitsui Sumitomo Insurance Company Limited 1.11 0.17
Payable KMP of the Company 0.59 0.42
38. Employee Bene ts
a. Gratuity ` in Crores
Details of Actuarial Valua on 2012-13 2011-12Change in Bene t Obliga onProjected Bene t Obliga on as at Year Beginning 35.10 30.40 Service Cost 4.49 3.65 Interest Cost 2.99 2.33 Actuarial Losses 1.27 1.42 Bene ts Paid (2.88) (2.70)Projected Bene t Obliga on as at Year End 40.97 35.10 Fair Value of Plan Assets as at Year Beginning 36.08 32.07 Expected Return on Plan Assets 3.65 2.90 Employer’s Contribu on 4.47 3.80 Bene ts Paid (2.91) (2.69)Inward Transfer of Equitable Interest 0.15 - Fair Value of Plan Assets as at Year End 41.44 36.08 Amounts Recognised in the Balance SheetProjected Bene t Obliga on at the Year End 40.97 35.10 Fair Value of the Plan Assets at the Year End 41.44 36.08 Asset Recognised in the Balance Sheet 0.47 0.98 Cost of the De ned Bene t Plan for the YearCurrent Service Cost 4.49 3.65 Interest on Obliga on 2.99 2.33 Expected Return on Plan Assets (3.65) (2.90)Net Actuarial Losses Recognised in the Year 1.27 1.42 Net Cost Recognised in the Statement of Pro t and Loss 5.10 4.50
NOTES TO CONSOLIDATED FINANCIAL STATEMENTS

Tube Investments of India Limited | 113
Notes:
i. The en re Plan Assets are managed by Life Insurance Corpora on of India (LIC). In the absence of the relevant informa on from LIC/Actuary, the above details do not include the composi on of plan assets and experience adjustment in respect of actuarial losses/gains.
ii. The expected/actual return on Plan Assets is as furnished by LIC.
iii. The es mate of future salary increase takes into account in a on, likely increments, promo ons and other relevant factors.
b) Provident Fund
The Company’s Provident Fund is exempted under Sec on 17 of the Employees’ Provident Fund Act, 1952. Condi ons for the grant of exemp on s pulate that the employer shall make good the de ciency, if any, in the interest rate declared by the Trust over the statutory limit.
c) Long Term Compensated Absences
The Key assump ons for compu ng the long term accumulated compensated absences on actuarial basis are as follows:
Assump ons 2012-13 2011-12Discount Rate 8.00% 8.00%Future Salary Increase (%) 5.00% 5.00%A ri on Rate 1 to 3% 1 to 3%Expected Rate of Return on Plan Assets 8.00% 8.00%
39. Accoun ng for Deriva ves
Company
Pursuant to the announcement of the Ins tute of Chartered Accountants of India (ICAI) in respect of “Accoun ng for Deriva ves”, the Company has opted to follow the recogni on and measurement principles rela ng to deriva ves as speci ed in AS 30 “Financial Instruments, Recogni on and Measurement”, issued by the ICAI, from the year ended 31 March 2008.
Consequently, as of 31 March 2013, the Company has recognised Marked-to-Market (MTM) Loss of `0.32 Cr. (Previous Year Gain of `0.46 Cr) rela ng to Deriva ve contracts entered into to hedge the foreign currency risk of highly probable forecast transac ons that are designated as e ec ve cash ow hedges, in the Hedge Reserve Account as part of the Shareholders funds.
There was no undesignated/ine ec ve Deriva ve contracts as on 31 March 2013.
The movement in the Hedge Reserve Account during the year for deriva ves designated as Cash Flow Hedges is as follows:
` in Crores
Par culars 2012-13 2011-12
Balance as at Beginning of the Year 0.46 (0.36)
Net Movement for the Year (0.78) 0.82
Balance as at End of the Year (0.32) 0.46
The Contracts in Hedge Reserve Account are expected to be recognised in the Statement of Pro t and Loss on occurrence of transac ons which are expected to take place over the next 12 months.
40. Lease Commitments
a) The Company has opera ng lease agreements for o ce space and residen al accommoda on generally which are cancellable in nature. As per the lease terms an amount of `9.14 Cr. (Previous Year `6.51 Cr.) has been recognised in the Statement of Pro t and Loss.
NOTES TO CONSOLIDATED FINANCIAL STATEMENTS

114 | Tube Investments of India Limited
b) Opera ng Lease – CMSGICL
The Company has opera ng lease agreements for: ` in Crores
Par culars 2012-13 2011-12
O ce space and residen al accommoda on generally for a period of 5 years with op on to renew and with escala on in rent once in three years.
7.81 7.54
Informa on Technology hardware, Branch Infrastructure (Furniture & Fixtures, O ce and Electrical equipment) for a period of 4 years and are renewable at the op on of the Company.
4.12 4.12
` in Crores
Par cularsAs at
31.03.2013As at
31.03.2012
Not later than 1 Year 4.12 4.12
Later than 1 year but not later than 5 Years - 4.12
c) Opera ng Lease – Subsidiary – CIFCL
Assets taken on Non-cancellable opera ng lease consists of Plant and Machinery, Furniture and Fixtures and O ce Equipment.
The details of Maturity pro le of Non-cancellable Future Opera ng Lease Payments are given below.
` in Crores
Par cularsAs at
31.03.2013As at
31.03.2012
Not later than 1 year 5.40 5.61
Later than 1 year and not later than 5 years 1.35 7.02
Later than 5 years - -
Total 6.75 12.63
41. Earnings Per Share
Par culars 2012-13 2011-12
Pro t a er Taxa on – ` in Crores 288.51 268.91
Weighted Average Number of Shares
- Basic 18,64,65,999 18,59,37,978
- Diluted 18,69,61,944 18.64,59,480
Earnings Per Share of `2 each
- Basic 15.47 14.46
- Diluted 15.43 14.42
42. Stock Op ons
Company
The Company has granted Stock Op ons to certain employees in line with the Employees Stock Op on Scheme. The Fair Value of Op ons used to compute proforma net pro t and earnings per Equity Share have been es mated on the date of the grants using Black-Scholes model by an independent consultant.
NOTES TO CONSOLIDATED FINANCIAL STATEMENTS

Tube Investments of India Limited | 115
The key assump ons used in Black-Scholes model for calcula ng the fair value as on the date of the grants are:
Par culars Ves ng Date Risk-free Interest Rate Expected Life
Expected Vola lity of Share Price
Dividend Yield
Price of the Underlying Share in the market at the
me of Op on grant
Fair Value of the Op on
% (p.a) (Years) (%) (%) (`) (`)Grant 1 31.10.08 7.71 2.50 39.11 3.43 62.85 16.43Grant 2 30.01.09 7.44 2.50 42.02 3.43 66.10 18.11Grant 3 31.10.09
31.10.10 31.10.11
8.258.238.22
1.622.122.62
31.5632.2837.07
1.861.861.86
56.8056.8056.80
107.13107.73108.53
Grant 4 31.07.09 31.07.10 31.07.11 31.07.12
0.008.248.228.22
0.001.992.492.99
0.0032.3734.2239.82
1.861.861.861.86
44.4544.4544.4544.45
117.15118.02118.13118.38
Grant 5 31.10.09 31.10.10 31.10.11 31.10.12
8.318.238.228.21
0.122.122.623.24
32.9832.2837.0742.55
1.861.861.861.86
24.2524.2524.2524.25
137.33135.00134.38133.62
Grant 6 30.01.10 30.01.11 30.01.12 30.01.13
8.318.238.228.21
0.242.242.743.49
28.0433.9638.5243.77
1.861.861.861.86
31.0531.0531.0531.05
130.44129.19128.82128.32
Grant 7 29.01.1229.01.1329.01.1429.01.15
8.268.218.218.22
1.243.484.485.48
31.6943.7946.7345.74
1.861.861.861.86
140.05140.05140.05140.05
39.4567.5776.3480.72
Grant 8 29.01.1229.01.1329.01.14
8.268.218.21
1.243.484.48
31.6943.7946.73
1.861.861.86
140.05140.05140.05
39.4567.5776.34
Grant 9 29.01.1229.01.13
8.268.21
1.243.48
31.6943.79
1.861.86
140.05140.05
39.4567.57
Grant 10 02.05.1202.05.1302.05.1402.05.15
8.258.218.218.22
1.373.744.745.74
31.3842.9947.2745.12
1.861.861.861.86
140.45140.45140.45140.45
40.4468.5478.1081.25
Grant 11 01.08.1201.08.1301.08.1401.08.15
8.258.218.228.23
1.493.994.995.99
31.7646.6347.0144.83
1.861.861.861.86
159.75159.75159.75159.75
31.7866.7673.5876.81
Grant 12 02.11.1202.11.1302.11.1402.11.15
8.248.218.228.23
1.744.245.246.24
32.7446.9346.2046.36
1.861.861.861.86
143.10143.10143.10143.10
43.5574.0679.0383.69
Subsidiary - CIFCL
The Board at its mee ng held on 22 June 2007, approved an issue of Stock Op ons up to a maximum of 5% of the issued Equity Capital of the Company (before Rights Issue) aggrega ng to 1,904,162 Equity Shares in a manner provided in the SEBI (Employee Stock Op on Scheme and Employee Stock Purchase Scheme) Guidelines, 1999 subject to the approval of the shareholders under Sec on 81(1A) of the Companies Act, 1956. The Shareholders of the Company at the Annual General Mee ng held on 30 July 2007 approved the aforesaid issue of 1,904,162 Equity Shares of the Company under one or more Employee Stock Op on Scheme(s). The Compensa on and Nomina on Commi ee has approved the following grants to a list of senior level execu ves of the Company and some of its Subsidiaries in accordance with the Stock Op on Scheme -2007:
Par culars Date of Grant
Exercise Price (`)
Ves ng Commences on
Op ons Granted
Op ons Exercised
Op ons Forfeited/
Lapsed
Op ons Outstanding at the end of the period
Grant No Vested Yet to vest1 Original* 30-07-07 193.40 30-07-08 7,65,900 12,040 6,35,732 1,18,128 - CAA* 25-01-08 178.70 - 54,433 546 44,337 9.550 - 2 Original 24-10-07 149.90 24-10-08 70,400 - 70,400 - - 3 Original 25-01-08 262.20 25-01-09 1,62,800 - 1,33,638 29,162 - 4 Original 25-04-08 191.80 25-04-09 4,68,740 3,484 3,10,955 1,54,301 -5 Original 30-07-08 105.00 30-07-09 10,070 3,445 1,491 5,134 -6 Original 24-10-08 37.70 24-10-09 65,600 17,384 38,786 9,430 -7
- Tr I Original 27-01-11 187.60 27-01-12 2,94,600 3,192 29,672 93,196 1,68,540 - Tr II Original 27-01-11 187.60 27-01-12 2,09,700 2,000 27,123 1,21,387 59,190
8 Original 30-04-11 162.55 30-04-12 1,13,400 - 36,414 13,466 63,5209 Original 28-07-11 175.35 28-07-12 61,800 - 2,208 10,152 49,440
10 Original 27-10-11 154.55 27-10-12 1,95,680 - - 32,658 1,56,544 *CAA- Corporate Ac on Adjustment
NOTES TO CONSOLIDATED FINANCIAL STATEMENTS

116 | Tube Investments of India Limited
The fair value of op ons used to compute Proforma net pro t and earnings per Equity Share have been es mated on the date of the grant using Black-Scholes model by an independent Consultant.
The key assump ons used in Black-Scholes model for calcula ng fair value as on the date of the grant are:
Date of GrantRisk Free
Interest RateExpected Life Expected Vola lity
Dividend Yield
Price of the underlying Share in the Market at the me of the Op on
Grant (`)
Fair Value of the Op on
(`)
30-Jul-07 7.10% - 7.56% 3-6 years 40.64% -43.16% 5.65% 193.40 61.4224-Oct-07 7.87% -7.98% 3-6 years 41.24% -43.84% 5.65% 149.90 44.2525-Jan-08 6.14% -7.10% 3-6 years 44.58% -47.63% 5.65% 262.20 78.1525-Apr-08 7.79% - 8.00% 2.5-5.5 years 45.78% - 53.39% 3.97% 191.80 76.7430-Jul-08 9.14% - 9.27% 2.5-5.5 years 46.52% - 53.14% 3.97% 105.00 39.2224-Oct-08 7.54% - 7.68% 2.5-5.5 years 48.2% - 55.48% 3.97% 37.70 14.0127-Jan-11 - Tranche I 8% 4 years 59.50% 10% 187.60 94.82 - Tranche II 8% 3.4 years 61.63% 10% 187.60 90.6230-Apr-11 8% 4 years 59.40% 25% 162.55 73.0728-Jul-11 8% 4 years 58.64% 25% 175.35 79.1727-Oct-11 8% 4 years 57.52% 25% 154.55 67.26
43. Previous Year Figures
The Company has reclassi ed/regrouped previous year gures to conform to this year’s classi ca on.
Signatures to Notes to Consolidated Financial Statements
On behalf of the Board
M M MurugappanChairman
Chennai2 May 2013
S SureshCompany Secretary
K BalasubramanianChief Financial O cer
L RamkumarManaging Director
NOTES TO CONSOLIDATED FINANCIAL STATEMENTS

