application wohler
DESCRIPTION
Application WohlerTRANSCRIPT
INTERNATIONAL JOURNAL FOR NUMERICAL METHODS IN ENGINEERING Int. J. Numer. Meth. Engng. XX, xxxx-xxxx (2001)
* Correspondence to: Sergio Oller, Universitat Politècnica de Catalunya, E.T.S. Ingenieros de Caminos, Canales y Puertos, Campus Nord UPC, c/ Gran Capitán s/n, Módulo C1, 08034 Barcelona, Spain.
THERMO-MECHANICAL FATIGUE ANALYSIS USING
GENERALIZED CONTINUUM DAMAGE MECHANICS AND THE FINITE ELEMENT METHOD
SERGIO OLLER1,2,*, OMAR SALOMÓN2 AND EUGENIO OÑATE1,2
1. Universitat Politècnica de Catalunya, E.T.S. Ingenieros de Caminos, Canales y Puertos, Campus
Nord UPC, 08034 Barcelona, Spain.
2. International Center for Numerical Methods in Engineering (CIMNE), 08034 Barcelona, Spain.
SUMMARY
In this paper, a thermo-mechanical constitutive model for the predictions of fatigue in structures using the finite element method is formulated. The model is based on the damage mechanics of the continuous medium and allows the treatment, in a unified way, of coupled phenomena such as fatigue with damage, plasticity, viscosity and temperature effects. A formulation based on the theories of damage and plasticity is developed. The necessary modifications in these theories are outlined in order to include the fatigue phenomena. Details of the finite element implementation are given. Finally, results of the performance of the proposed model are shown through the fatigue analysis of an aluminium engine alternator support is presented. KEY WORDS: fatigue; continuum damage mechanics; coupled thermo-mechanical behaviour
1. INTRODUCTION
Time varying cyclic loads produce failure of structural parts for values of stress lower than those obtained in static tests. This phenomenon is called fatigue and it is defined more generally in the ASTM code [12] as: "the process of permanent, progressive and localized structural change which occurs to a material point subjected to strains and stresses of variable amplitudes which produces cracks which lead to total failure after a certain number of cycles".
Fatigue is the main cause of failure of machine parts in service, in mechanisms and structural elements functioning in aeronautics, naval and the automotive industry as well as in civil engineering structures such as bridges, buildings, etc.
The study of fatigue starts from the basic fact that it is not a phenomenon associated to the classic concept of plasticity and/or damage and that failure occurs under load conditions well below the strength limit of the material. Typically, a progressive loss of strength occurs depending on the number of stress cycles that induces local plasticity and/or damage effects. In addition, all these phenomena are usually coupled with thermal effects.
Collapses by fatigue are especially dangerous because they are unpredictable, giving no prior notification of the imminent failure: they occur suddenly and show no exterior plastic deformations. They are fragile failures which display two well separated zones: a dark polished zone showing obvious ductile cleavage which happened
2 S. OLLER, O. SALOMÓN AND E. OÑATE
smoothly and a rough shinier zone where the final break is localized after surpassing the fatigue-reduced material strength.
It must be noted that fatigue itself always occurs with accompanying mechanical actions, which do not seem critical by themselves but, at the end, they are decisive for the life of the material.
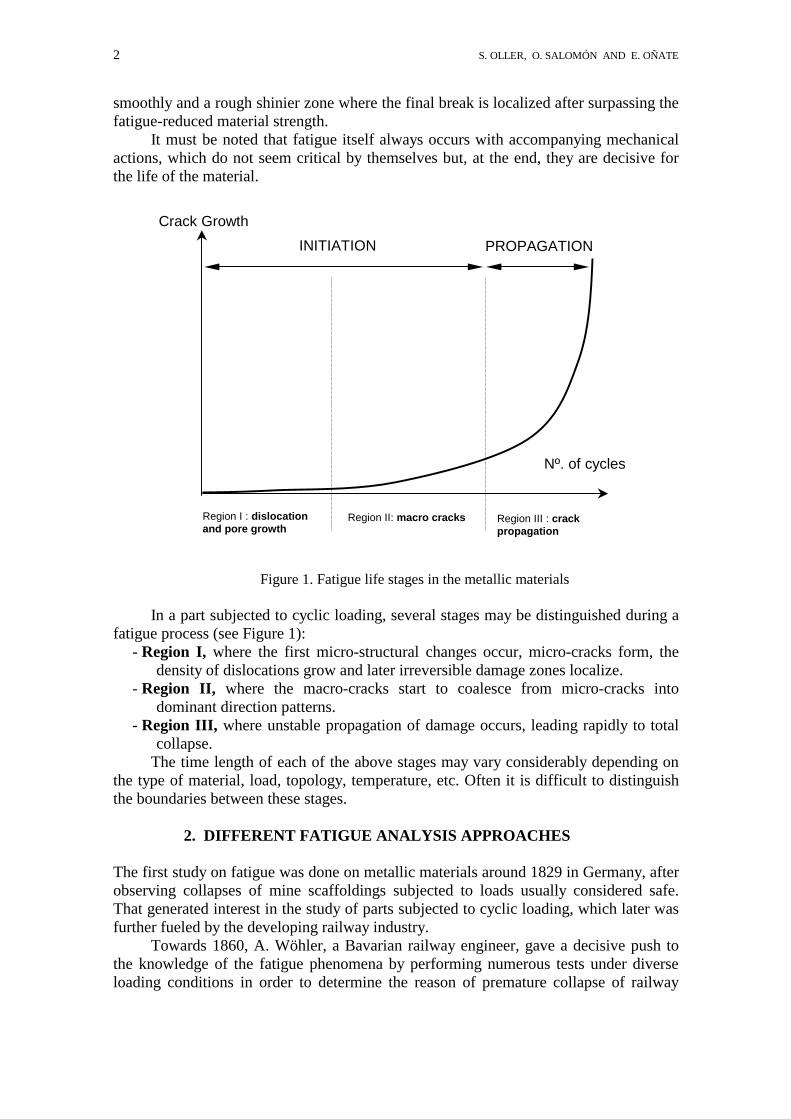
Figure 1. Fatigue life stages in the metallic materials In a part subjected to cyclic loading, several stages may be distinguished during a
fatigue process (see Figure 1): - Region I, where the first micro-structural changes occur, micro-cracks form, the
density of dislocations grow and later irreversible damage zones localize. - Region II, where the macro-cracks start to coalesce from micro-cracks into
dominant direction patterns. - Region III, where unstable propagation of damage occurs, leading rapidly to total
collapse. The time length of each of the above stages may vary considerably depending on
the type of material, load, topology, temperature, etc. Often it is difficult to distinguish the boundaries between these stages.
2. DIFFERENT FATIGUE ANALYSIS APPROACHES
The first study on fatigue was done on metallic materials around 1829 in Germany, after observing collapses of mine scaffoldings subjected to loads usually considered safe. That generated interest in the study of parts subjected to cyclic loading, which later was further fueled by the developing railway industry.
Towards 1860, A. Wöhler, a Bavarian railway engineer, gave a decisive push to the knowledge of the fatigue phenomena by performing numerous tests under diverse loading conditions in order to determine the reason of premature collapse of railway
Region I : dislocation and pore growth
Region II: macro cracks Region III : crack propagation
INITIATION PROPAGATION Crack Growth
Nº. of cycles
THERMO-MECHANICAL FATIGUE ANALYSIS 3
axles (Wöhler [13]). Results of his studies are the well-known Stress-Nºcycles curves (S-N) as well as the concept of fatigue limit strength or endurance.
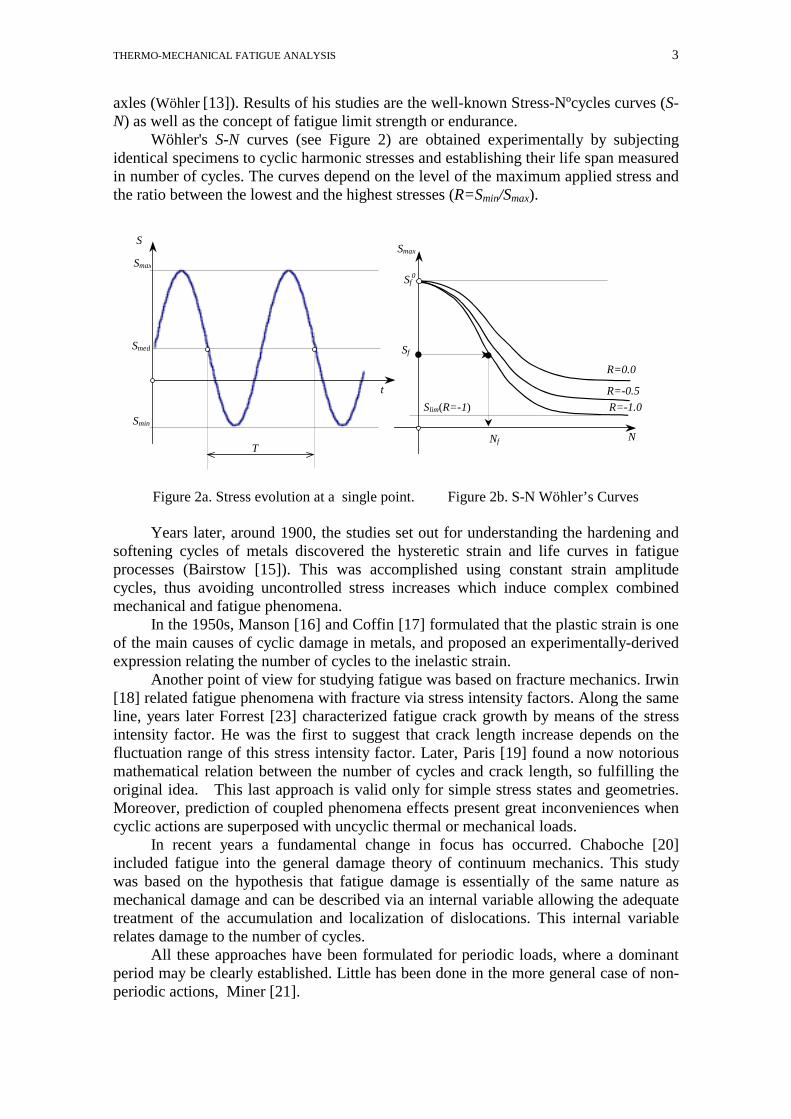
Wöhler's S-N curves (see Figure 2) are obtained experimentally by subjecting identical specimens to cyclic harmonic stresses and establishing their life span measured in number of cycles. The curves depend on the level of the maximum applied stress and the ratio between the lowest and the highest stresses (R=Smin/Smax).
Figure 2a. Stress evolution at a single point. Figure 2b. S-N Wöhler’s Curves Years later, around 1900, the studies set out for understanding the hardening and
softening cycles of metals discovered the hysteretic strain and life curves in fatigue processes (Bairstow [15]). This was accomplished using constant strain amplitude cycles, thus avoiding uncontrolled stress increases which induce complex combined mechanical and fatigue phenomena.
In the 1950s, Manson [16] and Coffin [17] formulated that the plastic strain is one of the main causes of cyclic damage in metals, and proposed an experimentally-derived expression relating the number of cycles to the inelastic strain.
Another point of view for studying fatigue was based on fracture mechanics. Irwin [18] related fatigue phenomena with fracture via stress intensity factors. Along the same line, years later Forrest [23] characterized fatigue crack growth by means of the stress intensity factor. He was the first to suggest that crack length increase depends on the fluctuation range of this stress intensity factor. Later, Paris [19] found a now notorious mathematical relation between the number of cycles and crack length, so fulfilling the original idea. This last approach is valid only for simple stress states and geometries. Moreover, prediction of coupled phenomena effects present great inconveniences when cyclic actions are superposed with uncyclic thermal or mechanical loads.
In recent years a fundamental change in focus has occurred. Chaboche [20]
included fatigue into the general damage theory of continuum mechanics. This study was based on the hypothesis that fatigue damage is essentially of the same nature as mechanical damage and can be described via an internal variable allowing the adequate treatment of the accumulation and localization of dislocations. This internal variable relates damage to the number of cycles.
All these approaches have been formulated for periodic loads, where a dominant period may be clearly established. Little has been done in the more general case of non-periodic actions, Miner [21].
Smin
Smed
Smax
S
t
T
Smax
N Nf
Sf
Sf0
R=0.0
R=-0.5
R=-1.0 Slim(R=-1)
4 S. OLLER, O. SALOMÓN AND E. OÑATE
The problem becomes more complicated when plastic effects occur due to high- level loads combined with cyclic effects including additional plastic effects. Even in the absence of detectable plastic effects, fatigue generates non-linear behaviour at micro-structural level in metals (Suresh [26] , Osgood [27]).
The previous description suggests that the theoretical structure of continuum mechanics, such as plasticity and damage (Lubliner [3,4], Malvern [7]) are suitable for the study of non linear fatigue problems. From another point of view, it can be stated that the mechanical effect known as fatigue produces a loss of material strength as a function of the number of cycles, reversion index, load amplitude, etc. This loss of strength induce the material to inelastic behavior, which may be interpreted as micro-cracking followed by crack coalescence leading to the final collapse of structural parts.
This paper extend the original work of Chaboche [20] by formulating a new fatigue prediction model based on a continuum mechanics formulation accounting for coupled thermo-mechanical effects. The rest of the paper layout is as follows. In next sections the basis of the continuum mechanics formulation is presented. Next the fatigue life prediction methodology proposed is described. Details of the finite element formulations are also given. Finally the efficiency and accuracy of the proposed model is shown in a practical example.
3. A CONTINUUM MECHANICS MODEL FOR FATIGUE ANALYSIS
3.1. Introduction
A fatigue model formulated within a continuum mechanics framework overcomes most of drawbacks associated to the standard fracture mechanics based procedures:
a. The classical models proposed for fatigue only forecast the life of a part as a
function of the number of cycles of periodical loads (Paris [19]). The proposed model permits the introduction of the loss of strength of metals due to combined effects of fatigue, fracture damage, plasticity, viscoelasticity, temperature, etc. This means that complex phenomena that occur in materials may be forecast for parts in service to study their safety at a given moment of their life, prior to total collapse.
b. Extending the previous idea, it must be recalled that experimental tests constitute a good tool for specific cases and for obtaining parameters, but they cannot be extended to situations more complex than those studied in the laboratory. Fracture mechanics does not offer a true solution to this problem, thus being extremely complicated to quantify the effect due to complex load conditions. Approaching the problem in a more general way, using continuum mechanics theory, makes it possible to take into account the combined effects of other factors such as thermal loads, mean stress, multi-axial stress states, plastic damage, etc.
c. The introduction of a new internal variable related to fatigue allows treating accumulative damage without the need to formulate a complementary constitutive rule (Suero [28]). In this manner, the model proposed here is able to account for non-linear damage accumulation problems that occur when a structural part is subjected to cycles of different load amplitudes.
THERMO-MECHANICAL FATIGUE ANALYSIS 5
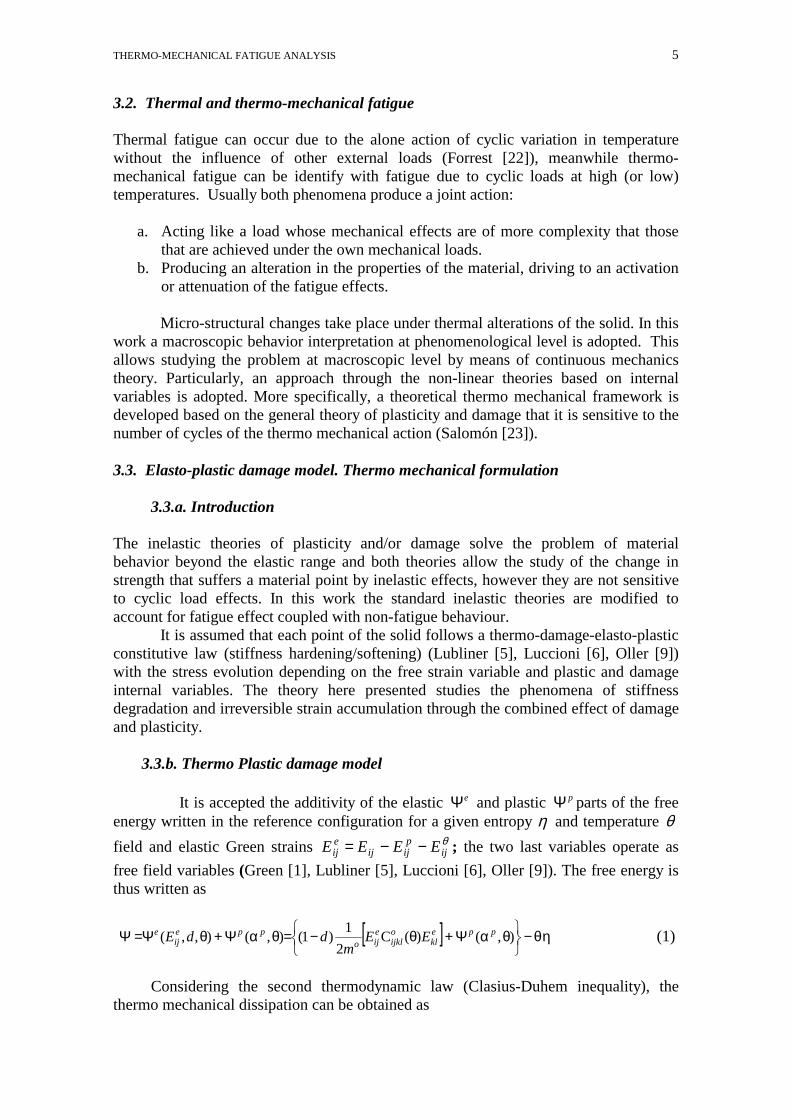
3.2. Thermal and thermo-mechanical fatigue Thermal fatigue can occur due to the alone action of cyclic variation in temperature without the influence of other external loads (Forrest [22]), meanwhile thermo-mechanical fatigue can be identify with fatigue due to cyclic loads at high (or low) temperatures. Usually both phenomena produce a joint action:
a. Acting like a load whose mechanical effects are of more complexity that those that are achieved under the own mechanical loads.
b. Producing an alteration in the properties of the material, driving to an activation or attenuation of the fatigue effects.
Micro-structural changes take place under thermal alterations of the solid. In this
work a macroscopic behavior interpretation at phenomenological level is adopted. This allows studying the problem at macroscopic level by means of continuous mechanics theory. Particularly, an approach through the non-linear theories based on internal variables is adopted. More specifically, a theoretical thermo mechanical framework is developed based on the general theory of plasticity and damage that it is sensitive to the number of cycles of the thermo mechanical action (Salomón [23]). 3.3. Elasto-plastic damage model. Thermo mechanical formulation
3.3.a. Introduction
The inelastic theories of plasticity and/or damage solve the problem of material behavior beyond the elastic range and both theories allow the study of the change in strength that suffers a material point by inelastic effects, however they are not sensitive to cyclic load effects. In this work the standard inelastic theories are modified to account for fatigue effect coupled with non-fatigue behaviour.
It is assumed that each point of the solid follows a thermo-damage-elasto-plastic constitutive law (stiffness hardening/softening) (Lubliner [5], Luccioni [6], Oller [9]) with the stress evolution depending on the free strain variable and plastic and damage internal variables. The theory here presented studies the phenomena of stiffness degradation and irreversible strain accumulation through the combined effect of damage and plasticity. 3.3.b. Thermo Plastic damage model
It is accepted the additivity of the elastic Ψe and plastic Ψ p parts of the free energy written in the reference configuration for a given entropy η and temperature θ field and elastic Green strains θ
ijp
ijijeij EEEE −−= ; the two last variables operate as
free field variables (Green [1], Lubliner [5], Luccioni [6], Oller [9]). The free energy is thus written as
[ ] ηθ−
θαΨ+θ−=θαΨ+θΨ=Ψ ),()(C
21)1(),(),,( ppe
kloijkl
eijo
ppeij
e EEm
ddE (1)
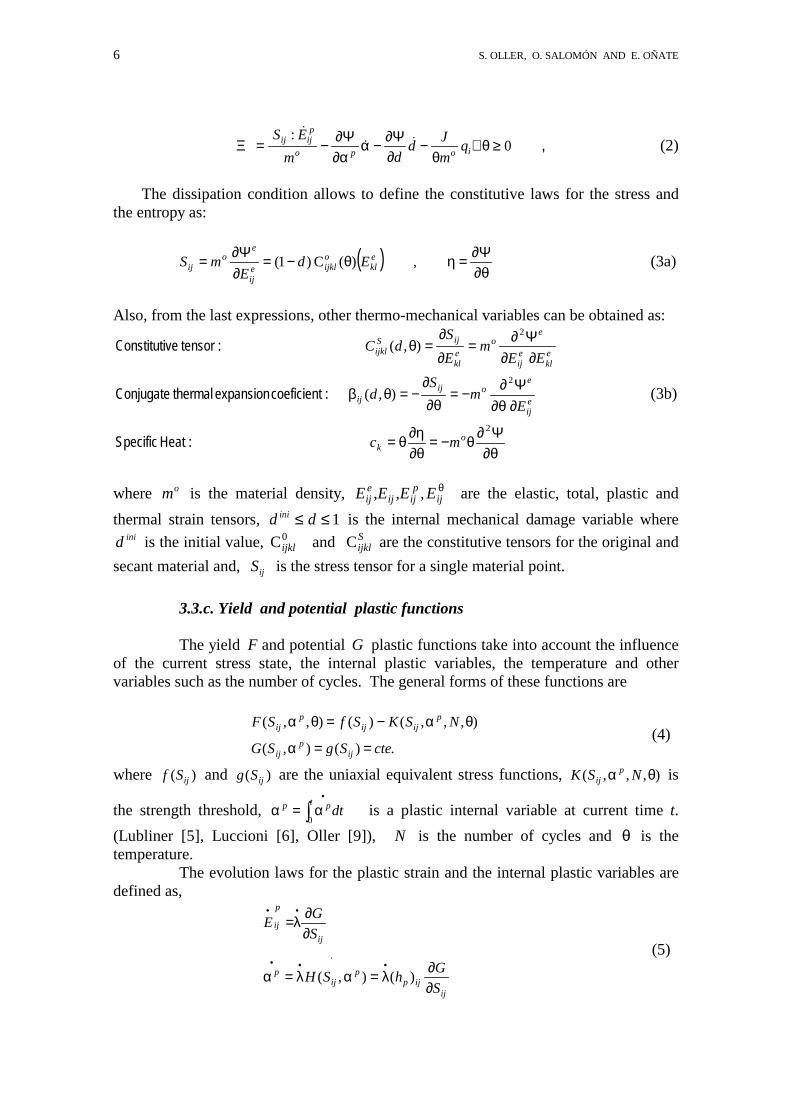
Considering the second thermodynamic law (Clasius-Duhem inequality), the
thermo mechanical dissipation can be obtained as
6 S. OLLER, O. SALOMÓN AND E. OÑATE
0:
≥θ∇θ
−∂Ψ∂−α
α∂Ψ∂−=Ξ iopo
pijij q
mJd
dmES
��
�
, (2)
The dissipation condition allows to define the constitutive laws for the stress and the entropy as:
( )θ∂Ψ∂=ηθ−=
∂Ψ∂= ,)(C)1( e
kloijkle
ij
eo
ij EdE
mS (3a)
Also, from the last expressions, other thermo-mechanical variables can be obtained as:
θ∂Ψ∂θ−=
θ∂η∂θ=
∂∂θΨ∂−=
∂θ∂
−=θβ
∂∂Ψ∂=
∂∂
=θ
2
2
2
),(
),(
ok
eij
eoij
ij
ekl
eij
eo
ekl
ijSijkl
mc
Em
Sd
EEm
ES
dC
:HeatSpecific
:coeficient expansion thermal Conjugate
:tensor veConstituti
(3b)
where om is the material density, θ
ijp
ijijeij EEEE ,,, are the elastic, total, plastic and
thermal strain tensors, d dini ≤ ≤ 1 is the internal mechanical damage variable where inid is the initial value, 0Cijkl and S
ijklC are the constitutive tensors for the original and secant material and, Sij is the stress tensor for a single material point. 3.3.c. Yield and potential plastic functions The yield F and potential G plastic functions take into account the influence of the current stress state, the internal plastic variables, the temperature and other variables such as the number of cycles. The general forms of these functions are
.)(),(
),,,()(),,(
cteSgSG
NSKSfSF
ijp
ij
pijij
pij
==α
θα−=θα (4)
where )( ijSf and )( ijSg are the uniaxial equivalent stress functions, ),,,( θα NSK pij is
the strength threshold, dtt pp∫
•
α=α0
is a plastic internal variable at current time t. (Lubliner [5], Luccioni [6], Oller [9]), N is the number of cycles and θ is the temperature. The evolution laws for the plastic strain and the internal plastic variables are defined as,
ijijp
pij
p
ij
p
ij
SGhSH
SGE
∂∂λ=αλ=α
∂∂λ=
•••
••
)(),(. (5)
THERMO-MECHANICAL FATIGUE ANALYSIS 7
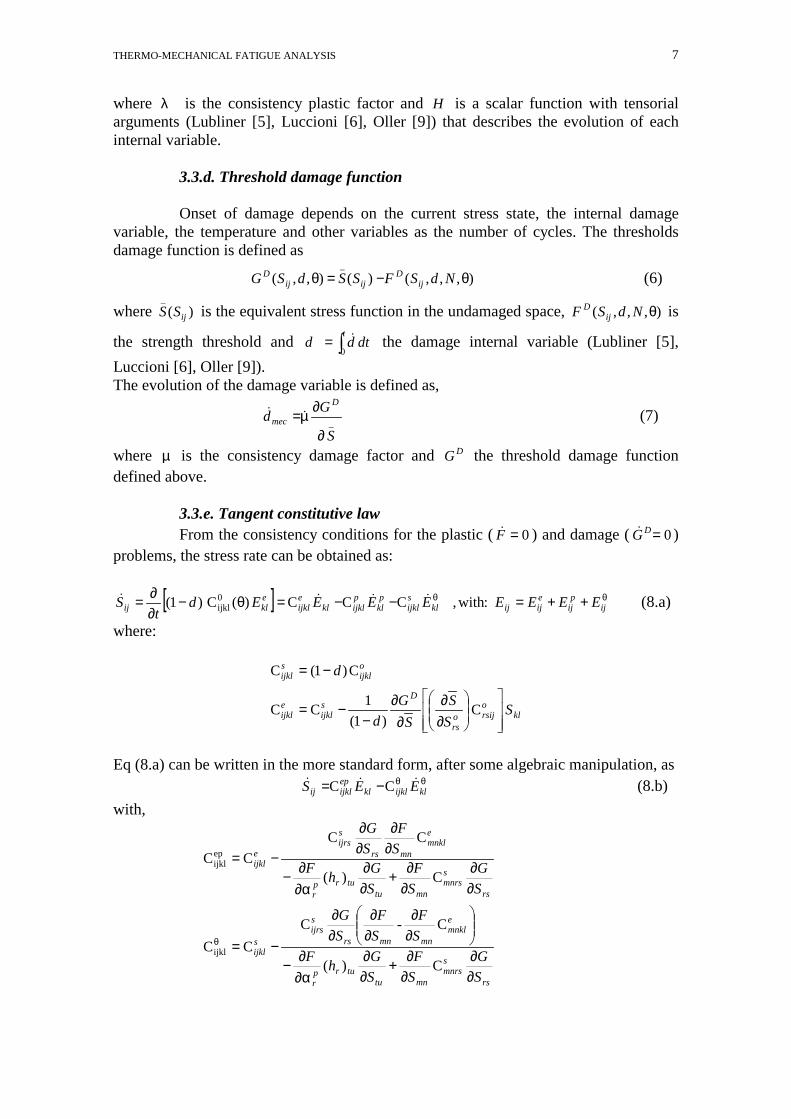
where λ is the consistency plastic factor and H is a scalar function with tensorial arguments (Lubliner [5], Luccioni [6], Oller [9]) that describes the evolution of each internal variable. 3.3.d. Threshold damage function Onset of damage depends on the current stress state, the internal damage variable, the temperature and other variables as the number of cycles. The thresholds damage function is defined as
),,,()(),,(_
θ−=θ NdSFSSdSG ijD
ijijD (6)
where )(_
ijSS is the equivalent stress function in the undamaged space, ),,,( θNdSF ijD is
the strength threshold and dtddt
∫=0D the damage internal variable (Lubliner [5],
Luccioni [6], Oller [9]). The evolution of the damage variable is defined as,
_S
GdD
mec
∂
∂µ=DD (7)
where µ is the consistency damage factor and DG the threshold damage function defined above.
3.3.e. Tangent constitutive law
From the consistency conditions for the plastic ( 0=FD ) and damage ( 0=DGD ) problems, the stress rate can be obtained as:
[ ] θθ ++=−−=θ−∂∂= ij
pij
eijijkl
sijkl
pkl
pijklkl
eijkl
eklij EEEEEEEEd
tS :with,CCC)(C)1( 0
ijklCCCC (8.a)
where:
klorsijo
rs
Dsijkl
eijkl
oijkl
sijkl
SSS
SG
d
d
∂∂
∂∂
−−=
−=
C)1(
1CC
C)1(C
Eq (8.a) can be written in the more standard form, after some algebraic manipulation, as
θθ−= klijklklepijklij EES CCC CC (8.b)
with,
rs
smnrs
mntuturp
r
emnkl
mnmnrs
sijrs
sijkl
rs
smnrs
mntuturp
r
emnkl
mnrs
sijrs
eijkl
SG
SF
SGhF
SF
SF
SG
SG
SF
SGhF
SF
SG
∂∂
∂∂+
∂∂
∂α∂−
∂∂
∂∂
∂∂
−=
∂∂
∂∂+
∂∂
∂α∂−
∂∂
∂∂
−=
θ
C)(
C-CCC
C)(
CCCC
ijkl
epijkl
8 S. OLLER, O. SALOMÓN AND E. OÑATE
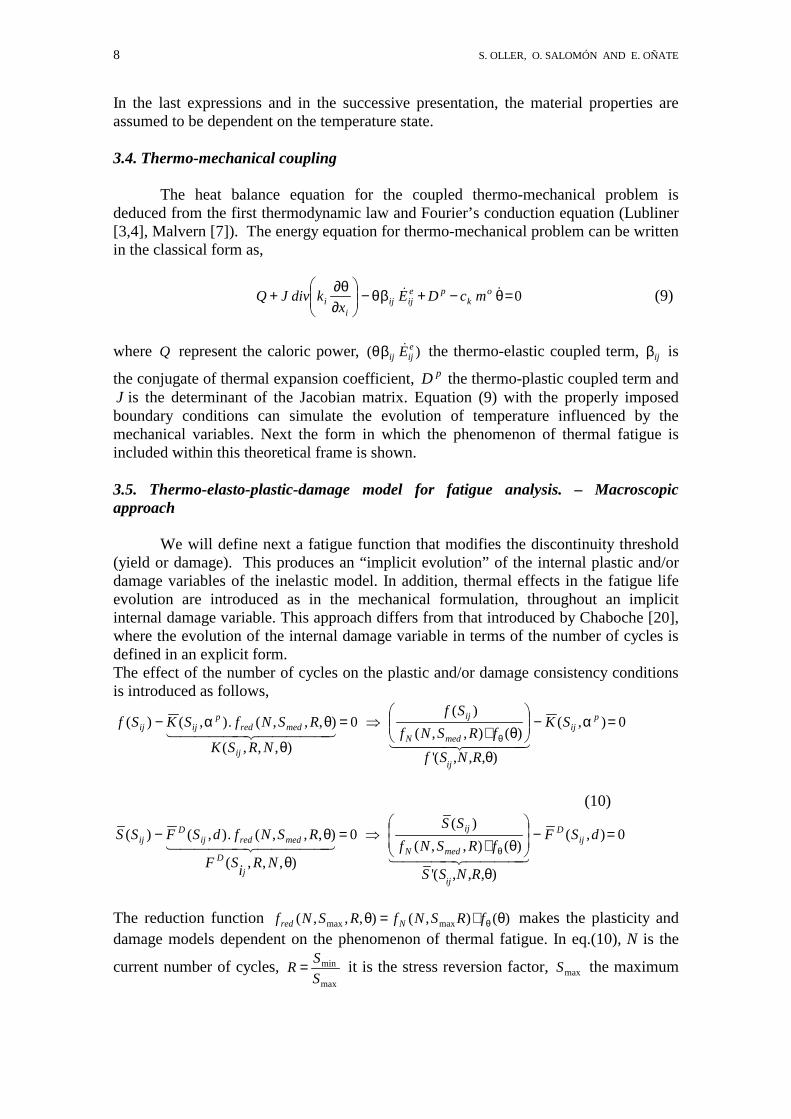
In the last expressions and in the successive presentation, the material properties are assumed to be dependent on the temperature state. 3.4. Thermo-mechanical coupling
The heat balance equation for the coupled thermo-mechanical problem is deduced from the first thermodynamic law and Fourier’s conduction equation (Lubliner [3,4], Malvern [7]). The energy equation for thermo-mechanical problem can be written in the classical form as,
0=θ−+βθ−
∂θ∂+ �� o
kpe
ijiji
i mcDEx
kdivJQ (9)
where Q represent the caloric power, )( e
ijij E�βθ the thermo-elastic coupled term, ijβ is
the conjugate of thermal expansion coefficient, pD the thermo-plastic coupled term and J is the determinant of the Jacobian matrix. Equation (9) with the properly imposed boundary conditions can simulate the evolution of temperature influenced by the mechanical variables. Next the form in which the phenomenon of thermal fatigue is included within this theoretical frame is shown. 3.5. Thermo-elasto-plastic-damage model for fatigue analysis. – Macroscopic approach
We will define next a fatigue function that modifies the discontinuity threshold (yield or damage). This produces an “implicit evolution” of the internal plastic and/or damage variables of the inelastic model. In addition, thermal effects in the fatigue life evolution are introduced as in the mechanical formulation, throughout an implicit internal damage variable. This approach differs from that introduced by Chaboche [20], where the evolution of the internal damage variable in terms of the number of cycles is defined in an explicit form. The effect of the number of cycles on the plastic and/or damage consistency conditions is introduced as follows,
0),(
),,,('
)(),,()(
0
),,,(
),,,(.),()( =α−
θ
θ⋅⇒=
θ
θα−θ
pij
ij
medN
ij
ij
medredp
ijij SK
RNSffRSNf
Sf
NRSK
RSNfSKSfOOOO NOOOO ML
OOOOO NOOOOO ML
(10)
0),(
),,,('
)(),,()(
0
),,,(
),,,(.),()( =−
θ
θ⋅⇒=
θ
θ−θ
dSF
RNSS
fRSNfSS
NRiSF
RSNfdSFSS ijD
ij
medN
ij
jD
medredijD
ij
OOOO NOOOO ML
OOOOO NOOOOO ML
The reduction function )(),(),,,( maxmax θ⋅=θ θfRSNfRSNf Nred makes the plasticity and damage models dependent on the phenomenon of thermal fatigue. In eq.(10), N is the
current number of cycles, max
min
SSR = it is the stress reversion factor, maxS the maximum
THERMO-MECHANICAL FATIGUE ANALYSIS 9
applied stress (see Figure 2a), ),,( max RSNf N is the reduction function influenced by the number of the cycles N and )(θθf is the thermal reduction function. The constitutive law for the thermo-mechanical fatigue problem can be rewritten as equations (8.a) and (8.b), simply changing the f and S functions by the normalized ones )/(' θffff N= and )/(' θffSS N= .
It is also necessary to define a unique global hardening internal variable, for the considered plastic and damage effects, based on the normalized dissipation energy as
( )
=
−+Ξ+Ξ=ℜΞ=
•
compresionpurefor0tensionpurefor1
)(,))(1()(
)(. ijc
ij
f
ijdpijm Sr
gSr
gSr
Sq (11)
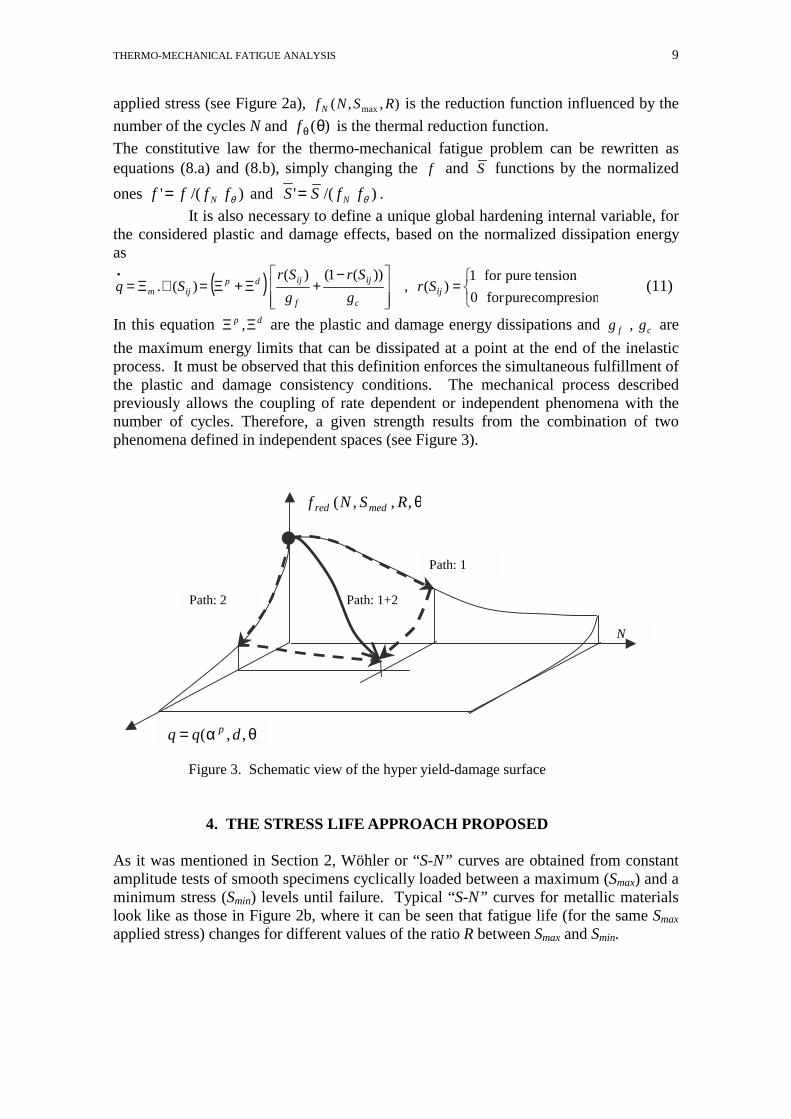
In this equation dp ΞΞ , are the plastic and damage energy dissipations and cf gg , are the maximum energy limits that can be dissipated at a point at the end of the inelastic process. It must be observed that this definition enforces the simultaneous fulfillment of the plastic and damage consistency conditions. The mechanical process described previously allows the coupling of rate dependent or independent phenomena with the number of cycles. Therefore, a given strength results from the combination of two phenomena defined in independent spaces (see Figure 3).
Figure 3. Schematic view of the hyper yield-damage surface
4. THE STRESS LIFE APPROACH PROPOSED As it was mentioned in Section 2, Wöhler or “S-N” curves are obtained from constant amplitude tests of smooth specimens cyclically loaded between a maximum (Smax) and a minimum stress (Smin) levels until failure. Typical “S-N” curves for metallic materials look like as those in Figure 2b, where it can be seen that fatigue life (for the same Smax applied stress) changes for different values of the ratio R between Smax and Smin.
N
Path: 1
Path: 2
),,( θα= dqq p
,,,( θRSNf medred
Path: 1+2
10 S. OLLER, O. SALOMÓN AND E. OÑATE
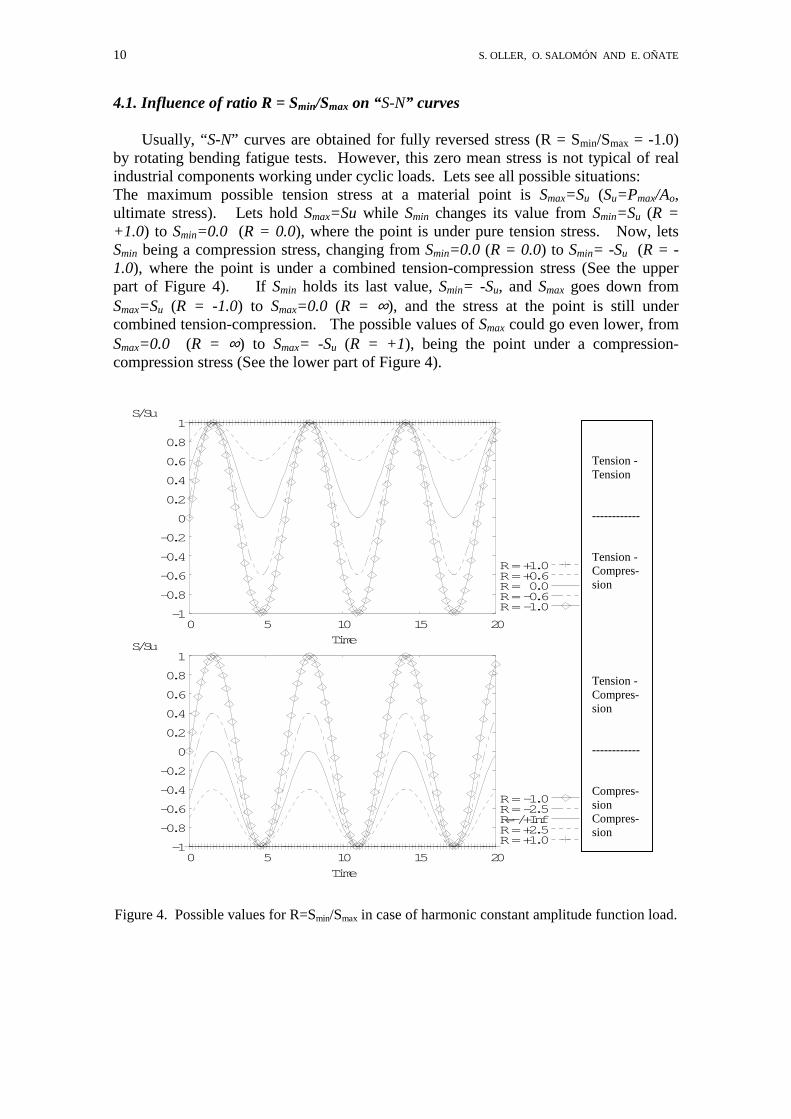
4.1. Influence of ratio R = Smin/Smax on “S-N” curves Usually, “S-N” curves are obtained for fully reversed stress (R = Smin/Smax = -1.0) by rotating bending fatigue tests. However, this zero mean stress is not typical of real industrial components working under cyclic loads. Lets see all possible situations: The maximum possible tension stress at a material point is Smax=Su (Su=Pmax/Ao, ultimate stress). Lets hold Smax=Su while Smin changes its value from Smin=Su (R = +1.0) to Smin=0.0 (R = 0.0), where the point is under pure tension stress. Now, lets Smin being a compression stress, changing from Smin=0.0 (R = 0.0) to Smin= -Su (R = -1.0), where the point is under a combined tension-compression stress (See the upper part of Figure 4). If Smin holds its last value, Smin= -Su, and Smax goes down from Smax=Su (R = -1.0) to Smax=0.0 (R = ∞), and the stress at the point is still under combined tension-compression. The possible values of Smax could go even lower, from Smax=0.0 (R = ∞) to Smax= -Su (R = +1), being the point under a compression-compression stress (See the lower part of Figure 4).
Figure 4. Possible values for R=Smin/Smax in case of harmonic constant amplitude function load.
Tension - Tension ------------ Tension - Compres-sion Tension - Compres-sion ------------ Compres-sion Compres-sion
-1
-0.8
-0.6
-0.4
-0.2
0
0.2
0.4
0.6
0.8
1
0 5 10 15 20
S/Su
Time
R=+1.0R=+0.6R= 0.0R=-0.6R=-1.0
-1
-0.8
-0.6
-0.4
-0.2
0
0.2
0.4
0.6
0.8
1
0 5 10 15 20
S/Su
Time
R=-1.0R=-2.5R=-/+InfR=+2.5R=+1.0
THERMO-MECHANICAL FATIGUE ANALYSIS 11
4.2. S-N Curves function proposed Based on the actual value of the R ratio and a basic value of the endurance stress Se (for R = -1) the model proposed here postulates a threshold stress Sth. The meaning of Sth is that of an endurance stress limit for a given value of R=Smin/Smax.
if abs(R) <= 1Sth(R) = Se+(Su-Se)*(0.5+0.5*R)STHR1
else (12) Sth(R) = Se+(Su-Se)*(0.5 +0.5/R)STHR2
end If the actual value of R is R= -1 then, Sth=Se. The effect of the number of load cycles (Ncycles) on the ultimate stress Su for a given value of R is taken into account by an exponential function,
S(R,Ncycles) = Sth(R) + (Su-Sth(R))*exp(-ALFAT(R)*log10(Ncyles)BETAF) (13) The value of ALFAT(R) is given by the function,
if abs(R) <= 1 ALFAT(R) = ALFAF + (0.5+0.5*R)*AUXR1
else (14) ALFAT(R) = ALFAF - (0.5 +0.5/R)*AUXR2
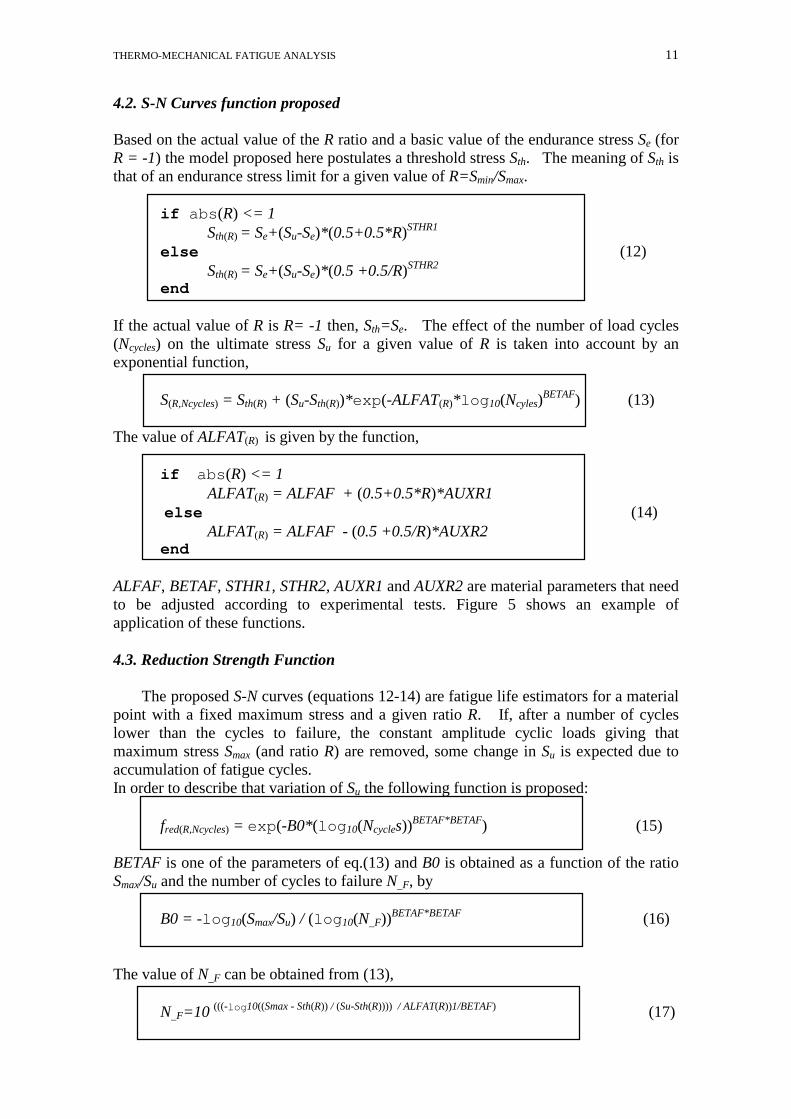
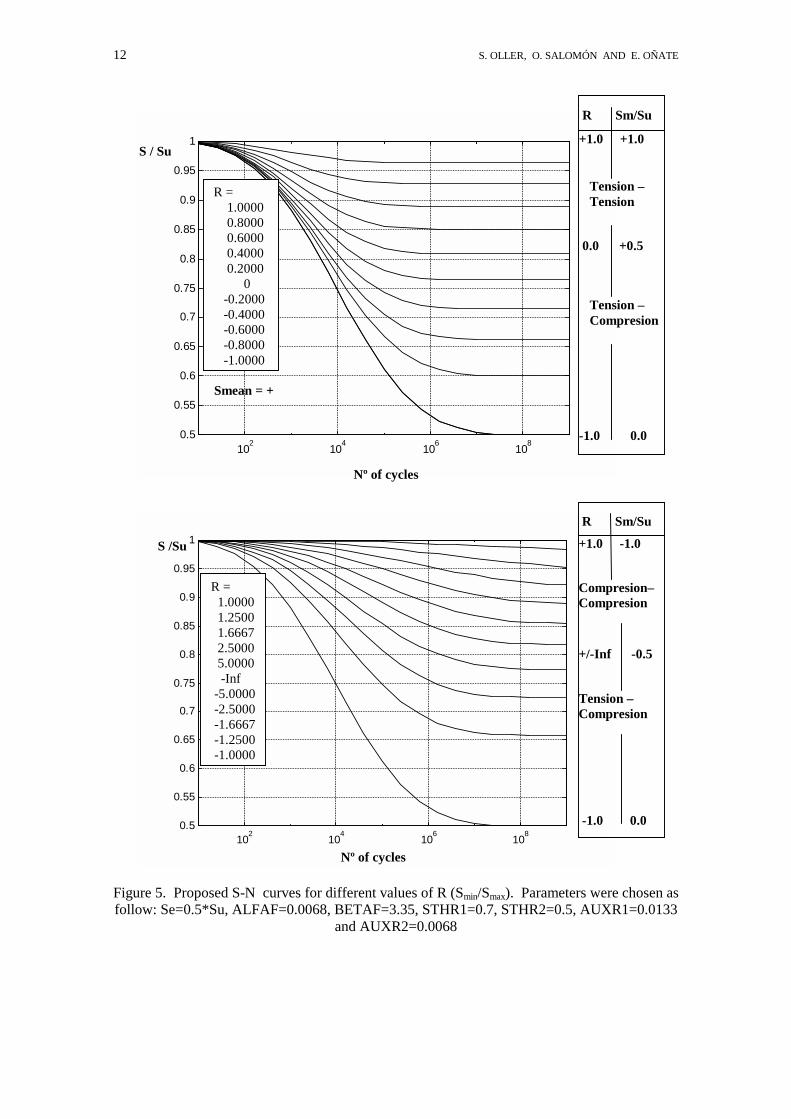
end ALFAF, BETAF, STHR1, STHR2, AUXR1 and AUXR2 are material parameters that need to be adjusted according to experimental tests. Figure 5 shows an example of application of these functions. 4.3. Reduction Strength Function The proposed S-N curves (equations 12-14) are fatigue life estimators for a material point with a fixed maximum stress and a given ratio R. If, after a number of cycles lower than the cycles to failure, the constant amplitude cyclic loads giving that maximum stress Smax (and ratio R) are removed, some change in Su is expected due to accumulation of fatigue cycles. In order to describe that variation of Su the following function is proposed:
fred(R,Ncycles) = exp(-B0*(log10(Ncycles))BETAF*BETAF) (15) BETAF is one of the parameters of eq.(13) and B0 is obtained as a function of the ratio Smax/Su and the number of cycles to failure N_F, by
B0 = -log10(Smax/Su) / (log10(N_F))BETAF*BETAF (16) The value of N_F can be obtained from (13),
N_F=10 (((-log10((Smax - Sth(R)) / (Su-Sth(R)))) / ALFAT(R))1/BETAF) (17)
12 S. OLLER, O. SALOMÓN AND E. OÑATE
102 104 106 1080.5
0.55
0.6
0.65
0.7
0.75
0.8
0.85
0.9
0.95
1
R Sm/Su
+1.0 +1.0
Tension – Tension
0.0 +0.5
Tension – Compresion
-1.0 0.0
Nº of cycles
S / Su
Smean = +
R = 1.0000 0.8000 0.6000 0.4000 0.2000 0 -0.2000 -0.4000 -0.6000 -0.8000 -1.0000
Figure 5. Proposed S-N curves for different values of R (Smin/Smax). Parameters were chosen as follow: Se=0.5*Su, ALFAF=0.0068, BETAF=3.35, STHR1=0.7, STHR2=0.5, AUXR1=0.0133
and AUXR2=0.0068
102 104 106 1080.5
0.55
0.6
0.65
0.7
0.75
0.8
0.85
0.9
0.95
1
R = 1.0000 1.2500 1.6667 2.5000 5.0000 -Inf -5.0000 -2.5000 -1.6667 -1.2500 -1.0000
Nº of cycles
S /Su
R Sm/Su
+1.0 -1.0
Compresion–Compresion
Tension – Compresion
-1.0 0.0
+/-Inf -0.5

THERMO-MECHANICAL FATIGUE ANALYSIS 13
1 0 2 1 0 4 1 0 6 1 0 80
0 .1
0 .2
0 .3
0 .4
0 .5
0 .6
0 .7
0 .8
0 .9
1
Nº of cycles
S/Su
Figure 6 shows a S-N curve and the reduction strength function fred using the same material parameters of Figure 5, a ratio R = -1 and a Smax=0.7*Su. Su*fred intersect S-N curve at a Smax stress level.
Figure 6. Proposed S-N and fred curves for R = -1 and Smax = 0.7*Su. Parameters were chosen
as follow: Se=0.5*Su, ALFAF=0.0068, BETAF=3.35, STHR1=0.7, STHR2=0.5, AUXR1=0.0133 and AUXR2=0.0068
5. FINITE ELEMENT EQUATIONS
Following the virtual work principle and the first thermodynamic law, the mechanical and thermal equilibrium equations in the referential configuration are obtained,
( )
=−∇+
=−−∇⋅+⋅⋅
∫ ∫ ∫
∫ ∫ ∫
V V S biiii
V V S iiiio
jsiiji
oi
b
dSnqdVqdVqdiv
dSutdVubmdVuSumu
0)(:thermal
0:mechanical
θθθ
DDDDDD
substituting eq.(11) in the mechanical equation and eq.(9) in the thermal one, and approximating the displacements UNu ⋅≅ )()( i
ui xx and the temperature
Θ⋅≅θ θ )()( ii xx N by the standard finite element procedure (Zienkiewicz and Taylor [29]), the following equilibrium equations are obtained,
=−+Θ⋅+⋅+Θ⋅
=−Θ⋅++⋅
−
−
0
int
θθθθ
θ
fDKUMC0fMfUM
pu
extuuuu
��
���
(18)
where )(and)( ii
u xx θNN are the displacement and temperature shape functions, Θ andU are the nodal values of the displacements and the temperature, uM is the
mass matrix, ∫ ∇==V
ujk
Siijuku dVNSf intint )(f is the mechanical internal forces vector,
u−θM is the thermal stiffness matrix, extuf is the nodal force vector due to external
loads, θC is the caloric capacity matrix, θ−uM is the thermoelastic coupling matrix, θK
14 S. OLLER, O. SALOMÓN AND E. OÑATE
is the conductivity matrix, pD is the mechanical dispassion and θf is the thermal load vector. The detailed definitions of these matrices is given in [31, 32]. The solution of eqs.(18) follows a structured staggered implicit time integration scheme. Details can be found in [31, 32]. 5.1. Time advancing strategy
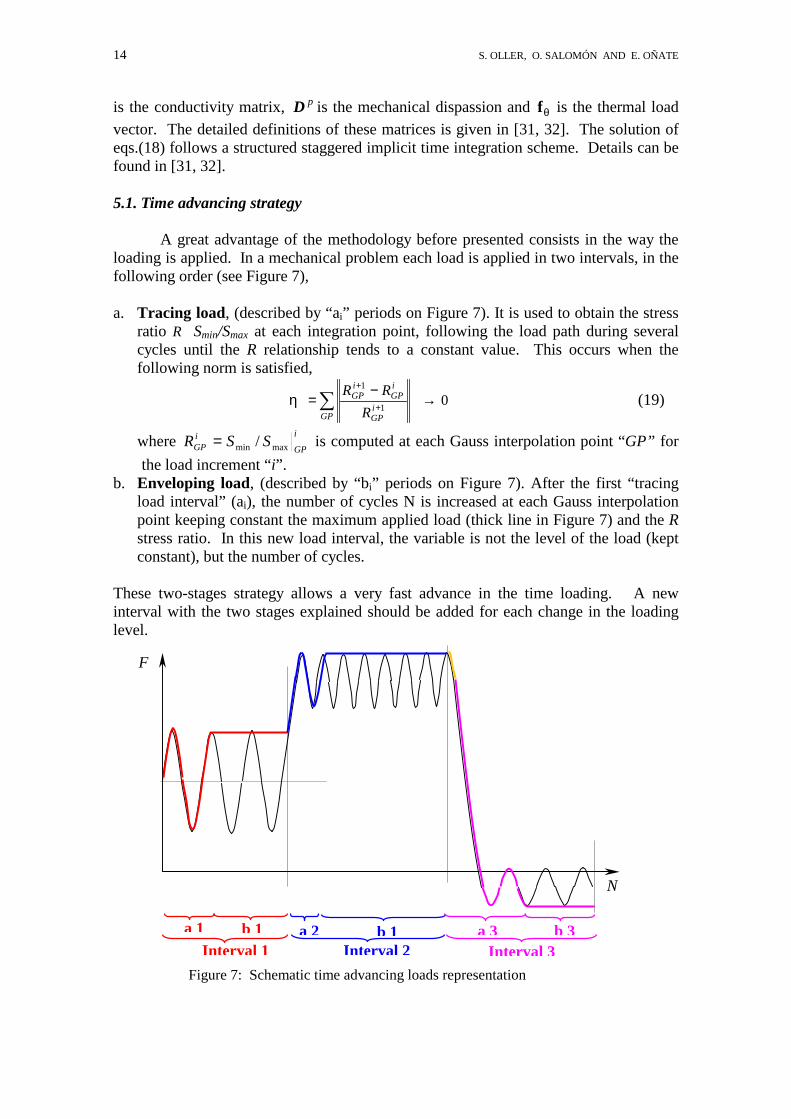
A great advantage of the methodology before presented consists in the way the loading is applied. In a mechanical problem each load is applied in two intervals, in the following order (see Figure 7),
a. Tracing load, (described by “ai” periods on Figure 7). It is used to obtain the stress
ratio R Smin/Smax at each integration point, following the load path during several cycles until the R relationship tends to a constant value. This occurs when the following norm is satisfied,
01
1
→−
=η ∑ +
+
GPiGP
iGP
iGP
RRR (19)
where i
GPiGP SSR maxmin /= is computed at each Gauss interpolation point “GP” for
the load increment “i”. b. Enveloping load, (described by “bi” periods on Figure 7). After the first “tracing
load interval” (ai), the number of cycles N is increased at each Gauss interpolation point keeping constant the maximum applied load (thick line in Figure 7) and the R stress ratio. In this new load interval, the variable is not the level of the load (kept constant), but the number of cycles.
These two-stages strategy allows a very fast advance in the time loading. A new interval with the two stages explained should be added for each change in the loading level.
Figure 7: Schematic time advancing loads representation
Interval 1 Interval 2 Interval 3a 1 b 1 a 2 b 1 a 3 b 3
N
F
THERMO-MECHANICAL FATIGUE ANALYSIS 15
6. INDUSTRIAL VALIDATION OF THE PROPOSED FATIGUE MODEL
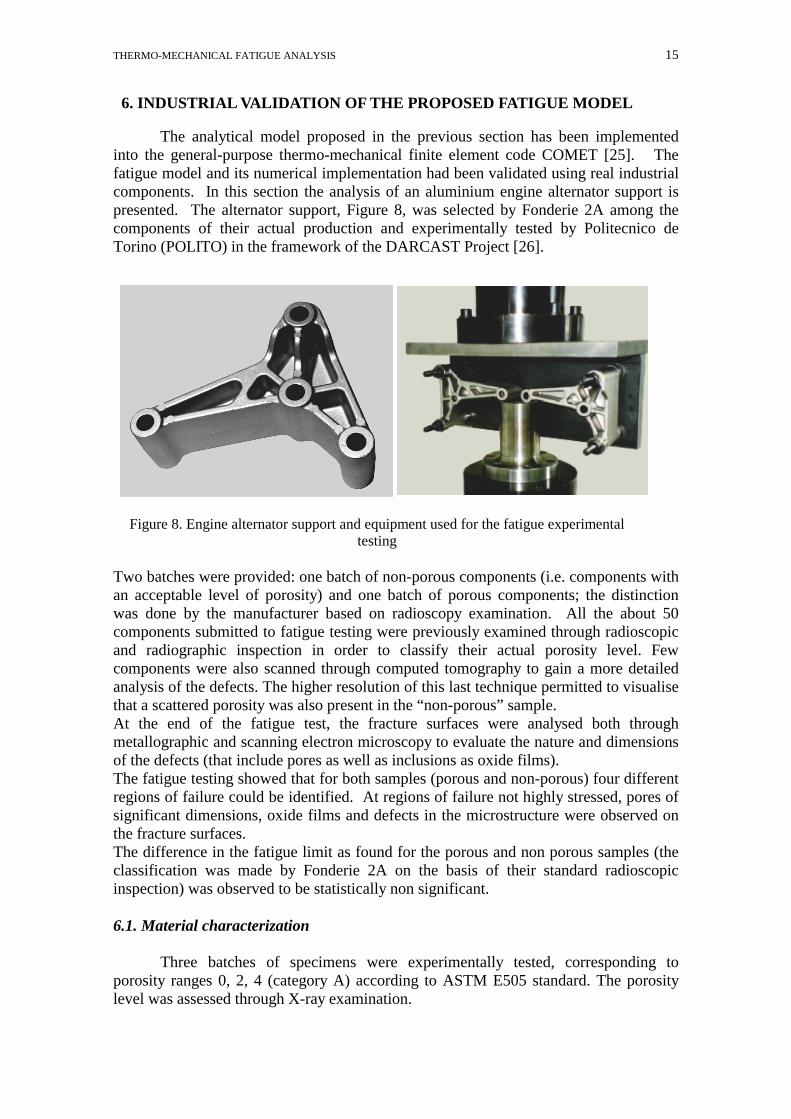
The analytical model proposed in the previous section has been implemented into the general-purpose thermo-mechanical finite element code COMET [25]. The fatigue model and its numerical implementation had been validated using real industrial components. In this section the analysis of an aluminium engine alternator support is presented. The alternator support, Figure 8, was selected by Fonderie 2A among the components of their actual production and experimentally tested by Politecnico de Torino (POLITO) in the framework of the DARCAST Project [26].
Figure 8. Engine alternator support and equipment used for the fatigue experimental
testing Two batches were provided: one batch of non-porous components (i.e. components with an acceptable level of porosity) and one batch of porous components; the distinction was done by the manufacturer based on radioscopy examination. All the about 50 components submitted to fatigue testing were previously examined through radioscopic and radiographic inspection in order to classify their actual porosity level. Few components were also scanned through computed tomography to gain a more detailed analysis of the defects. The higher resolution of this last technique permitted to visualise that a scattered porosity was also present in the “non-porous” sample. At the end of the fatigue test, the fracture surfaces were analysed both through metallographic and scanning electron microscopy to evaluate the nature and dimensions of the defects (that include pores as well as inclusions as oxide films). The fatigue testing showed that for both samples (porous and non-porous) four different regions of failure could be identified. At regions of failure not highly stressed, pores of significant dimensions, oxide films and defects in the microstructure were observed on the fracture surfaces. The difference in the fatigue limit as found for the porous and non porous samples (the classification was made by Fonderie 2A on the basis of their standard radioscopic inspection) was observed to be statistically non significant. 6.1. Material characterization
Three batches of specimens were experimentally tested, corresponding to porosity ranges 0, 2, 4 (category A) according to ASTM E505 standard. The porosity level was assessed through X-ray examination.
16 S. OLLER, O. SALOMÓN AND E. OÑATE
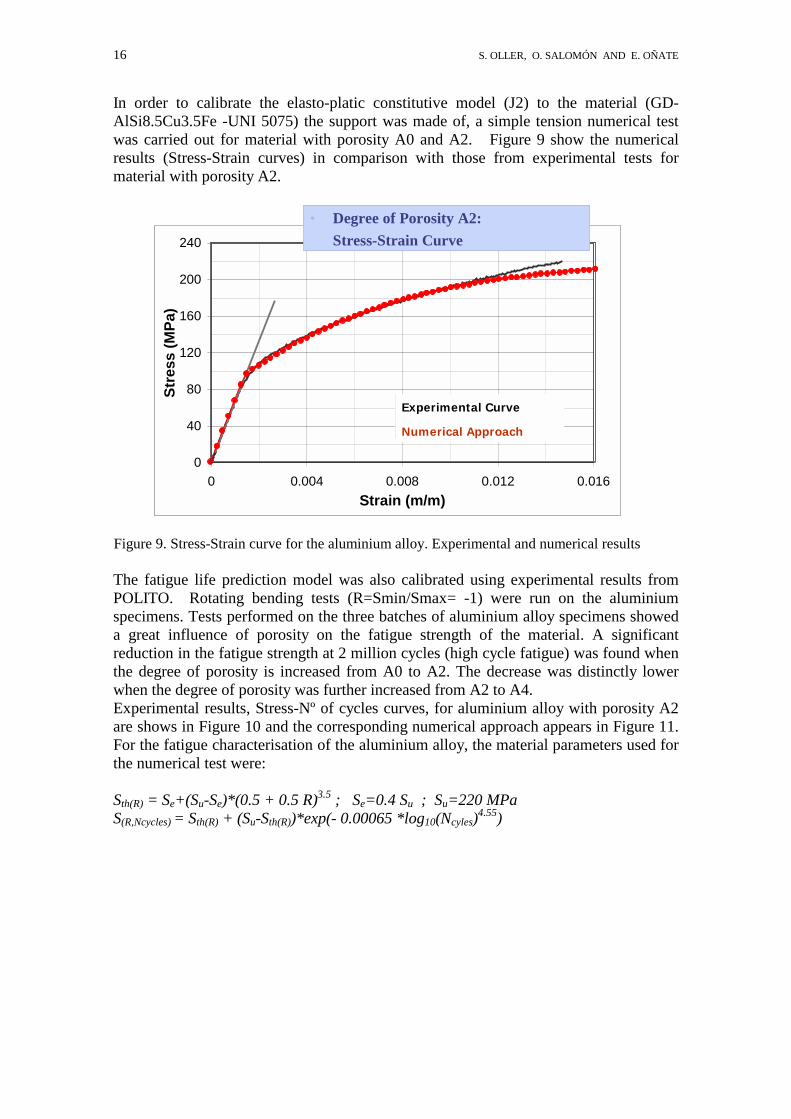
In order to calibrate the elasto-platic constitutive model (J2) to the material (GD-AlSi8.5Cu3.5Fe -UNI 5075) the support was made of, a simple tension numerical test was carried out for material with porosity A0 and A2. Figure 9 show the numerical results (Stress-Strain curves) in comparison with those from experimental tests for material with porosity A2.
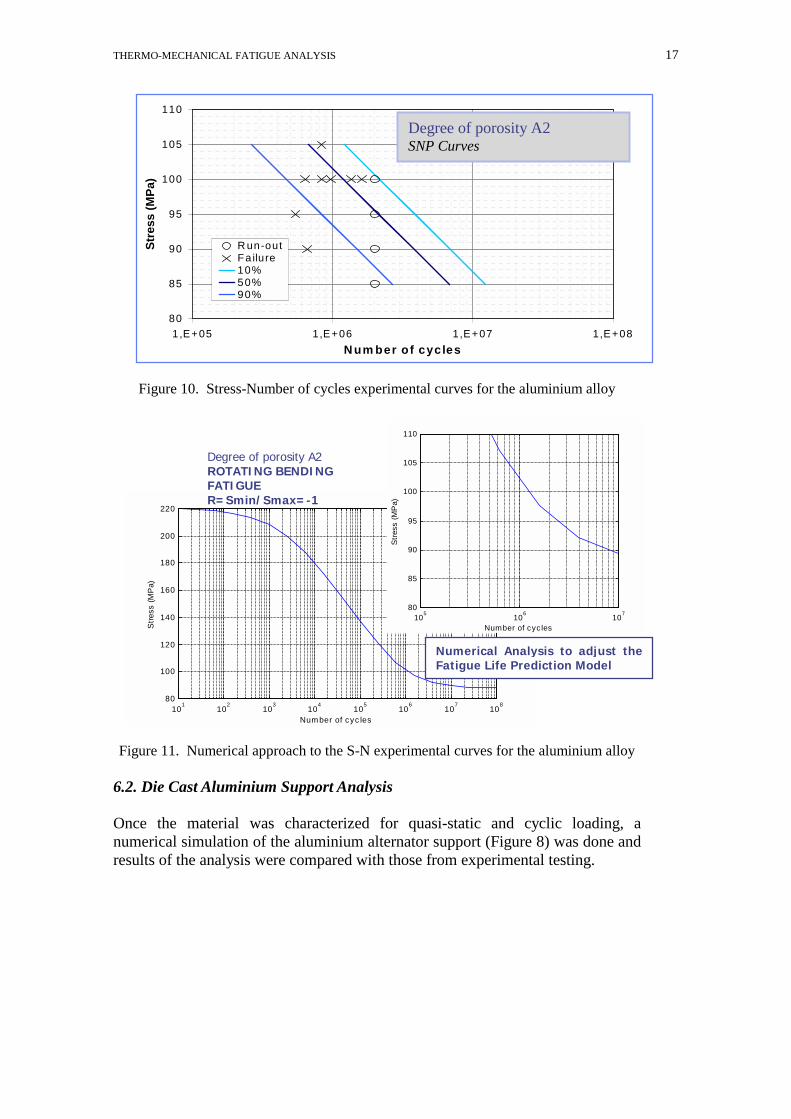
Figure 9. Stress-Strain curve for the aluminium alloy. Experimental and numerical results The fatigue life prediction model was also calibrated using experimental results from POLITO. Rotating bending tests (R=Smin/Smax= -1) were run on the aluminium specimens. Tests performed on the three batches of aluminium alloy specimens showed a great influence of porosity on the fatigue strength of the material. A significant reduction in the fatigue strength at 2 million cycles (high cycle fatigue) was found when the degree of porosity is increased from A0 to A2. The decrease was distinctly lower when the degree of porosity was further increased from A2 to A4. Experimental results, Stress-Nº of cycles curves, for aluminium alloy with porosity A2 are shows in Figure 10 and the corresponding numerical approach appears in Figure 11. For the fatigue characterisation of the aluminium alloy, the material parameters used for the numerical test were: Sth(R) = Se+(Su-Se)*(0.5 + 0.5 R)3.5 ; Se=0.4 Su ; Su=220 MPa S(R,Ncycles) = Sth(R) + (Su-Sth(R))*exp(- 0.00065 *log10(Ncyles)4.55)
0
40
80
120
160
200
240
0 0.004 0.008 0.012 0.016Strain (m/m)
Stre
ss (M
Pa)
Experimental Curve
Linear Elastic Behaviour
Experimental Curve
Numerical Approach
• Degree of Porosity A2: Stress-Strain Curve
0
40
80
120
160
200
240
0 0.004 0.008 0.012 0.016Strain (m/m)
Stre
ss (M
Pa)
Experimental Curve
Linear Elastic Behaviour
0
40
80
120
160
200
240
0 0.004 0.008 0.012 0.016Strain (m/m)
Stre
ss (M
Pa)
Experimental Curve
Linear Elastic Behaviour
Experimental Curve
Numerical Approach
• Degree of Porosity A2: Stress-Strain Curve
THERMO-MECHANICAL FATIGUE ANALYSIS 17
Figure 10. Stress-Number of cycles experimental curves for the aluminium alloy
Figure 11. Numerical approach to the S-N experimental curves for the aluminium alloy
6.2. Die Cast Aluminium Support Analysis Once the material was characterized for quasi-static and cyclic loading, a numerical simulation of the aluminium alternator support (Figure 8) was done and results of the analysis were compared with those from experimental testing.
80
85
90
95
100
105
110
1,E+05 1,E+06 1,E+07 1,E+08N um ber of cycles
Stre
ss (M
Pa)
R un-outFa ilure10%50%90%
Degree of porosity A2 SNP Curves
101 102 103 104 105 106 107 10880
100
120
140
160
180
200
220
Number of cyc les
Stre
ss (M
Pa)
105 106 10780
85
90
95
100
105
110
Number of cyc les
Stre
ss (M
Pa)
Degree of porosity A2 ROTATING BENDING FATIGUE R=Smin/Smax=-1
Numerical Analysis to adjust theFatigue Life Prediction Model
18 S. OLLER, O. SALOMÓN AND E. OÑATE
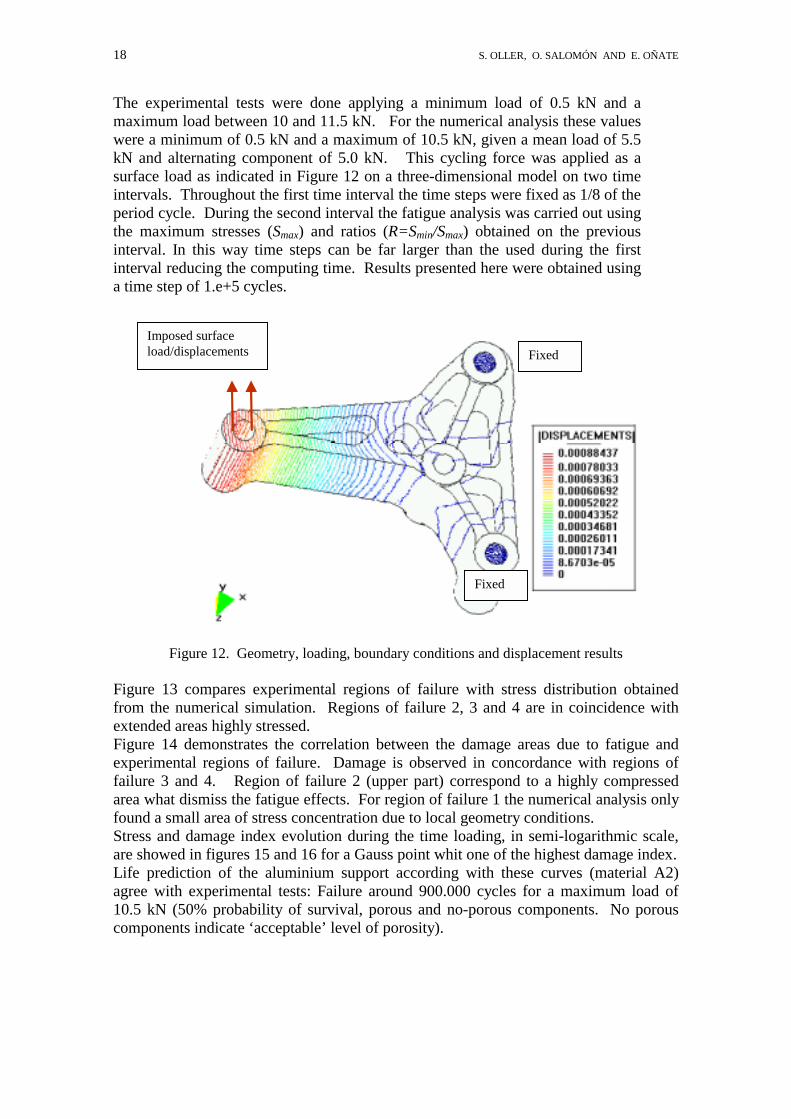
The experimental tests were done applying a minimum load of 0.5 kN and a maximum load between 10 and 11.5 kN. For the numerical analysis these values were a minimum of 0.5 kN and a maximum of 10.5 kN, given a mean load of 5.5 kN and alternating component of 5.0 kN. This cycling force was applied as a surface load as indicated in Figure 12 on a three-dimensional model on two time intervals. Throughout the first time interval the time steps were fixed as 1/8 of the period cycle. During the second interval the fatigue analysis was carried out using the maximum stresses (Smax) and ratios (R=Smin/Smax) obtained on the previous interval. In this way time steps can be far larger than the used during the first interval reducing the computing time. Results presented here were obtained using a time step of 1.e+5 cycles.
Figure 12. Geometry, loading, boundary conditions and displacement results
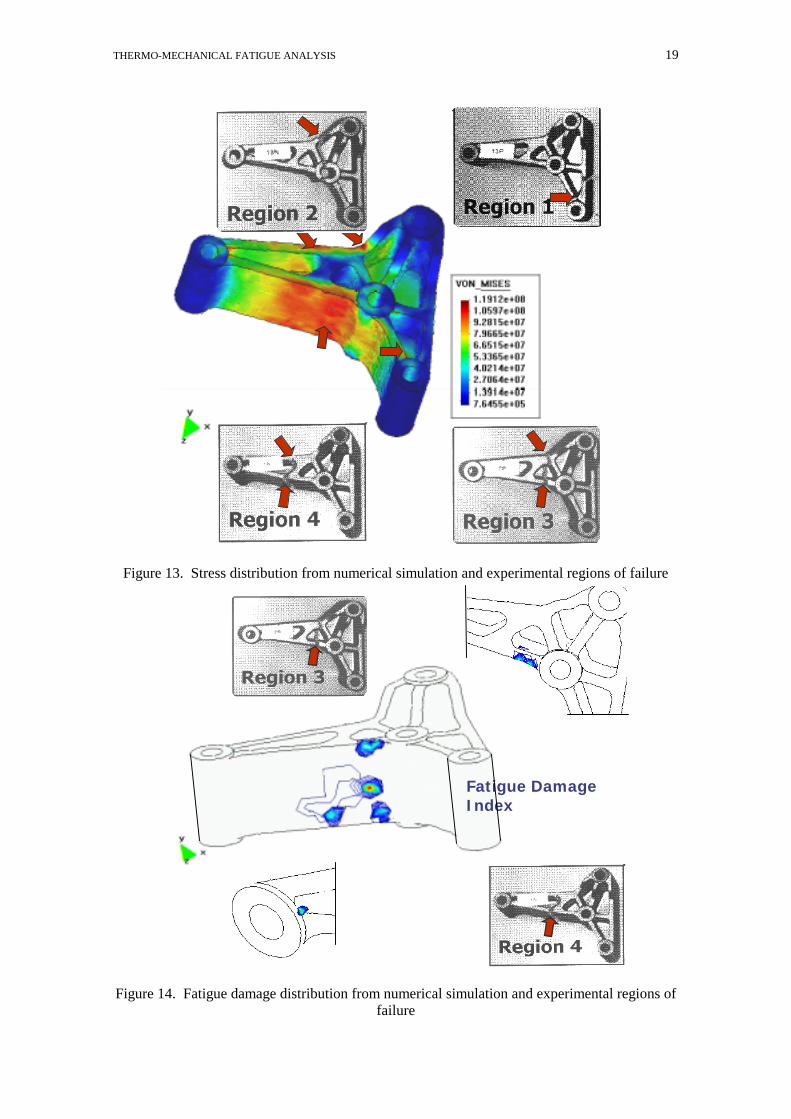
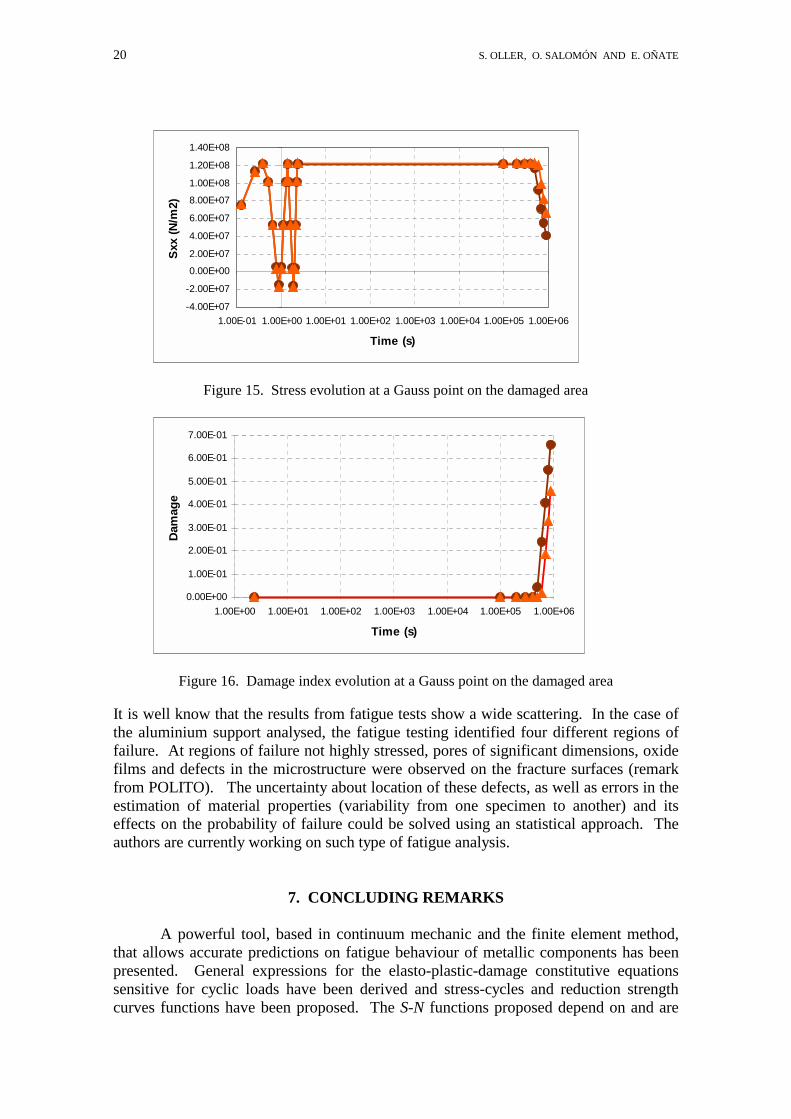
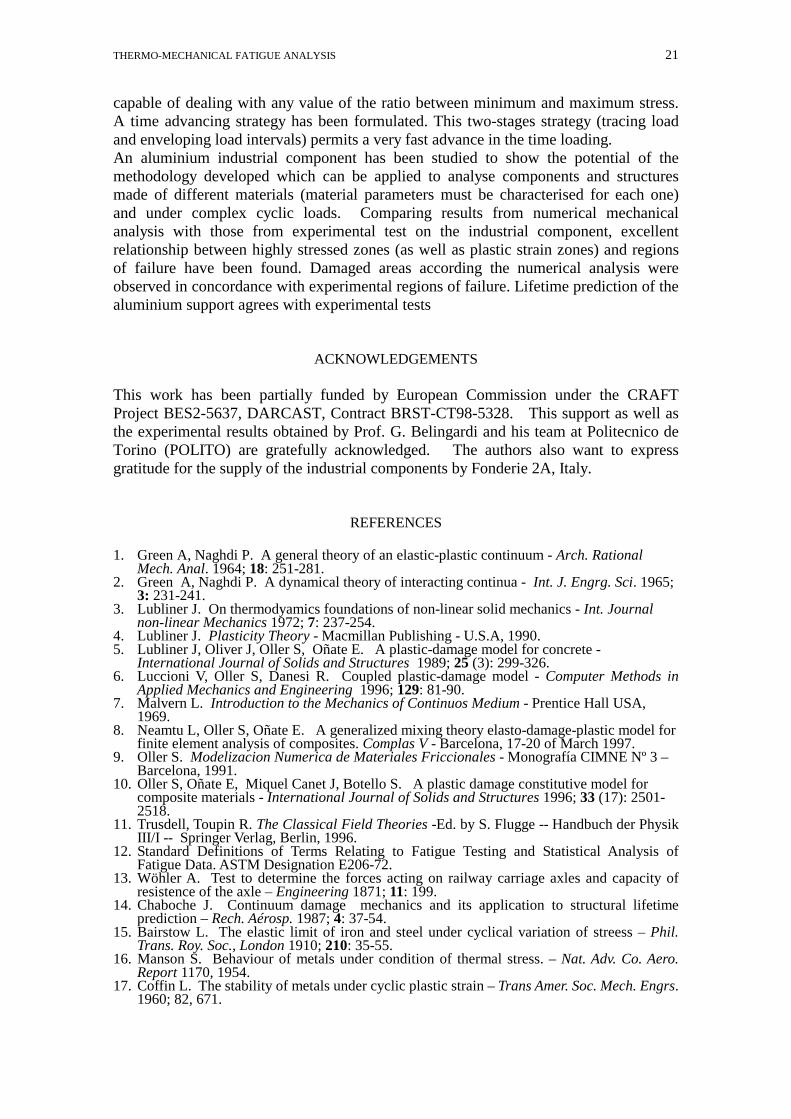
Figure 13 compares experimental regions of failure with stress distribution obtained from the numerical simulation. Regions of failure 2, 3 and 4 are in coincidence with extended areas highly stressed. Figure 14 demonstrates the correlation between the damage areas due to fatigue and experimental regions of failure. Damage is observed in concordance with regions of failure 3 and 4. Region of failure 2 (upper part) correspond to a highly compressed area what dismiss the fatigue effects. For region of failure 1 the numerical analysis only found a small area of stress concentration due to local geometry conditions. Stress and damage index evolution during the time loading, in semi-logarithmic scale, are showed in figures 15 and 16 for a Gauss point whit one of the highest damage index. Life prediction of the aluminium support according with these curves (material A2) agree with experimental tests: Failure around 900.000 cycles for a maximum load of 10.5 kN (50% probability of survival, porous and no-porous components. No porous components indicate ‘acceptable’ level of porosity).
Imposed surface load/displacements Fixed
Fixed
THERMO-MECHANICAL FATIGUE ANALYSIS 19
Figure 13. Stress distribution from numerical simulation and experimental regions of failure
Figure 14. Fatigue damage distribution from numerical simulation and experimental regions of failure
Fatigue Damage Index
20 S. OLLER, O. SALOMÓN AND E. OÑATE
Figure 15. Stress evolution at a Gauss point on the damaged area
Figure 16. Damage index evolution at a Gauss point on the damaged area
It is well know that the results from fatigue tests show a wide scattering. In the case of the aluminium support analysed, the fatigue testing identified four different regions of failure. At regions of failure not highly stressed, pores of significant dimensions, oxide films and defects in the microstructure were observed on the fracture surfaces (remark from POLITO). The uncertainty about location of these defects, as well as errors in the estimation of material properties (variability from one specimen to another) and its effects on the probability of failure could be solved using an statistical approach. The authors are currently working on such type of fatigue analysis.
7. CONCLUDING REMARKS
A powerful tool, based in continuum mechanic and the finite element method, that allows accurate predictions on fatigue behaviour of metallic components has been presented. General expressions for the elasto-plastic-damage constitutive equations sensitive for cyclic loads have been derived and stress-cycles and reduction strength curves functions have been proposed. The S-N functions proposed depend on and are
-4.00E+07
-2.00E+07
0.00E+00
2.00E+07
4.00E+07
6.00E+07
8.00E+07
1.00E+08
1.20E+08
1.40E+08
1.00E-01 1.00E+00 1.00E+01 1.00E+02 1.00E+03 1.00E+04 1.00E+05 1.00E+06
Time (s)
Sxx
(N/m
2)
0.00E+00
1.00E-01
2.00E-01
3.00E-01
4.00E-01
5.00E-01
6.00E-01
7.00E-01
1.00E+00 1.00E+01 1.00E+02 1.00E+03 1.00E+04 1.00E+05 1.00E+06
Time (s)
Dam
age
THERMO-MECHANICAL FATIGUE ANALYSIS 21
capable of dealing with any value of the ratio between minimum and maximum stress. A time advancing strategy has been formulated. This two-stages strategy (tracing load and enveloping load intervals) permits a very fast advance in the time loading. An aluminium industrial component has been studied to show the potential of the methodology developed which can be applied to analyse components and structures made of different materials (material parameters must be characterised for each one) and under complex cyclic loads. Comparing results from numerical mechanical analysis with those from experimental test on the industrial component, excellent relationship between highly stressed zones (as well as plastic strain zones) and regions of failure have been found. Damaged areas according the numerical analysis were observed in concordance with experimental regions of failure. Lifetime prediction of the aluminium support agrees with experimental tests
ACKNOWLEDGEMENTS This work has been partially funded by European Commission under the CRAFT Project BES2-5637, DARCAST, Contract BRST-CT98-5328. This support as well as the experimental results obtained by Prof. G. Belingardi and his team at Politecnico de Torino (POLITO) are gratefully acknowledged. The authors also want to express gratitude for the supply of the industrial components by Fonderie 2A, Italy.
REFERENCES 1. Green A, Naghdi P. A general theory of an elastic-plastic continuum - Arch. Rational
Mech. Anal. 1964; 18: 251-281. 2. Green A, Naghdi P. A dynamical theory of interacting continua - Int. J. Engrg. Sci. 1965;
3: 231-241. 3. Lubliner J. On thermodyamics foundations of non-linear solid mechanics - Int. Journal
non-linear Mechanics 1972; 7: 237-254. 4. Lubliner J. Plasticity Theory - Macmillan Publishing - U.S.A, 1990. 5. Lubliner J, Oliver J, Oller S, Oñate E. A plastic-damage model for concrete -
International Journal of Solids and Structures 1989; 25 (3): 299-326. 6. Luccioni V, Oller S, Danesi R. Coupled plastic-damage model - Computer Methods in
Applied Mechanics and Engineering 1996; 129: 81-90. 7. Malvern L. Introduction to the Mechanics of Continuos Medium - Prentice Hall USA,
1969. 8. Neamtu L, Oller S, Oñate E. A generalized mixing theory elasto-damage-plastic model for
finite element analysis of composites. Complas V - Barcelona, 17-20 of March 1997. 9. Oller S. Modelizacion Numerica de Materiales Friccionales - Monografía CIMNE Nº 3 –
Barcelona, 1991. 10. Oller S, Oñate E, Miquel Canet J, Botello S. A plastic damage constitutive model for
composite materials - International Journal of Solids and Structures 1996; 33 (17): 2501-2518.
11. Trusdell, Toupin R. The Classical Field Theories -Ed. by S. Flugge -- Handbuch der Physik III/I -- Springer Verlag, Berlin, 1996.
12. Standard Definitions of Terms Relating to Fatigue Testing and Statistical Analysis of Fatigue Data. ASTM Designation E206-72.
13. Wöhler A. Test to determine the forces acting on railway carriage axles and capacity of resistence of the axle – Engineering 1871; 11: 199.
14. Chaboche J. Continuum damage mechanics and its application to structural lifetime prediction – Rech. Aérosp. 1987; 4: 37-54.
15. Bairstow L. The elastic limit of iron and steel under cyclical variation of streess – Phil. Trans. Roy. Soc., London 1910; 210: 35-55.
16. Manson S. Behaviour of metals under condition of thermal stress. – Nat. Adv. Co. Aero. Report 1170, 1954.
17. Coffin L. The stability of metals under cyclic plastic strain – Trans Amer. Soc. Mech. Engrs. 1960; 82, 671.
22 S. OLLER, O. SALOMÓN AND E. OÑATE
18. Irwin G. Analysis of stresses and strains near to the end of crack traversing a plate. Trans, ASME Journal of Applied Mechanics 1957; 24: 361-364.
19. Paris P, Gómez M, Anderson W. Trend Eng., Univ. Wash 1961; 13: 9-14. 20. Paris P, Erdogan F. A Critical Analysis of Crack Propagation Laws- ASME, J. Basic Engrg.
1963; 85: 528-534 21. Chaboche J. Une loi différentielle d’endommagement de fatigue avec cumulation non
linéaire – Revue Francaise de Mécanique 1974; Nº. 50-51. 22. Miner M. Cumulative damage fatigue- J. App. Mech 1945; 12: 159-164. 23. Forrest P. Fatigue of Metals – Pergamon Press, London, 1962. 24. Salomón O, Oller S, Car E, Oñate E. Thermomechanical fatigue analysis based on
continuum mechanics. Congreso Argentino de Mecánica Computacional, MECOM'99, Mendoza, Argentina, 1999.
25. COMET Coupled Mechanics and Thermal Analysis. Data Input Manual. A finite element system for analysis of solidification and cooling in casting processes. Technical Report Nº 308, CIMNE, Barcelona, Jan 2000.
26. DARCAST Enhanced Design and Manufacturing of High Resistance Casted Parts. Final Technical Report. Craft Project N° : BES2-5637 funded by the European Community, Dec. 2000
27. Suresh S. Fatigue of Materials. Cambridge Univ.Press, 2º edition, 1998. 28. Osgood C. Fatigue Design. Pergamon Press, 1982. 29. Suero A, Oller S. Tratamiento del Fenómeno de Fatiga Mediante la Mecánica de Medios
Continuos, Monografía CIMNE Nº 45, Barcelona, 1998. 30. Zienkiewicz OC, Taylor R. El Método los Elementos Finitos, Vol.1, Mc Graw Hill -
CIMNE, Barcelona, 1994. 31. Celentano D, Oller S, Oñate E. A coupled thermo mechanical model for the solidification
cast metals. Int. J. Solids Structures 1996; 33 (5): 647-673. 32. Sluzalec A. An analysis of thermal effects of coupled thermo-plasticity in metal forming
processes. Comm. Appl. Num. Meth. 1988; 4: 675-685.