applications of x-ray powder diffraction in the ... · 1.1. x-ray crystallography of small...
TRANSCRIPT
IntroductionX-ray powder diffraction assumes many roles
in the analysis of pharmaceuticals. Pharmaceu-ticals, typically organic solids, exist in numer-ous solid forms that feature different physicaland chemical properties. The vast majority ofpharmaceuticals are administered as oral tabletdosage forms. In order for a drug molecule tobe absorbed by the body, it must first dissolve.One of the most effective means of modifyingthe physical properties of an active pharmaceu-tical ingredient (API) is through formation of asalt, if the molecule possesses a basic or acidicfunctional group. In general, salt forms of drugsare more soluble in aqueous environments, po-tentially leading to improved bioavailabilitywhen compared to administration of a drug inits neutral form. Furthermore, there are oppor-tunities to modify a pharmaceutical’s physicalproperties by isolation of different crystallo-graphic forms of the same chemical substancein different polymorphic, solvated, desolvatedand amorphous solids. This phenomenon pre-sents an opportunity for pharmaceutical scien-tists who are interested in understanding thestructure-property relationships in organicsolids. Thus the importance of polymorphismhas prompted much interest in the characteriza-tion of pharmaceutical solids. Different poly-morphs require different strategies and tech-
niques for development. Researchers have ac-cess to many different analytical techniquesthat allow them to study many aspects of poly-morphism. Single crystal provides the beststructural evidence for polymorphism, howeverthe stringent sample requirements limit its ap-plications to high-quality, single crystals. X-raypowder diffraction allows characterization ofmaterials that do not meet these criteria. Thistechnique has been improved through the ad-vances in beam intensity using rotating anodesor synchrotron radiation sources, advances inparallel beam optics, and advances in detectortechnology with solid-state detectors, linear andarea position sensitive detectors. These ad-vances allow for rapid data collection times andtime-resolved studies of phase transformations.Controlled environment stages allow studies ofpolymorphic conversions as a function of tem-perature and humidity. Analysis of powder dif-fraction has become more sophisticated, thusenabling extraction of greater amounts of infor-mation from a diffraction pattern than ever be-fore. Crystal indexation packages now offer ahigh success rate even for low symmetry mate-rials [1]. Powder diffraction data are widelyused for quantitative polymorphic mixtures. Ri-etveld and other whole-powder pattern meth-ods enable superior accuracy than single peakmethods. The powder diffraction file, the PDF,
THE RIGAKU JOURNALVOL. 22 / NO. 1 / 2005, 2–15
2 The Rigaku Journal
APPLICATIONS OF X-RAY POWDER DIFFRACTION IN THEPHARMACEUTICAL INDUSTRY
GREGORY A. STEPHENSON
Eli Lilly and Company, Lilly Research Laboratories, Indianapolis, Indiana 46285. E-mail: [email protected]
The objective of the following article is to present an overview of the application of X-raypowder diffraction in the pharmaceutical industry, with discussion covering the stages of dis-covery, development, and post product launch. Such applications range from lead optimizationwhere many molecules are examined for their solid-state characteristic, that is developabilityassessment, in parallel with studies assessing toxicological effects and pharmacological activ-ity. Other applications relate to development stages where the technique is used primarily forform identification and monitoring of form during pharmaceutical processing and later quan-tification activities aimed at product control. The role of additional applications such as struc-ture solution using the powder method is discussed.
Invited Papers

can be useful for identification of unknowns andfor unraveling the crystalline composition offormulated products. More recently, structuresolution from powder diffraction data has en-abled structure determination of organic mole-cules whose structures were previously unableto be solved. Each of these advances has ex-tended the application of X-ray powder diffrac-tion in the pharmaceutical industry. The follow-ing paper will attempt to provide a better under-standing of the many roles that X-ray diffractionassumes in the pharmaceutical laboratory asone progresses a molecule from discoverythrough development and into the post mar-keted phase of a drug product’s life cycle.
1. Applications in DiscoveryDuring the discovery phase, X-ray powder dif-
fraction plays little role, whereas both large andsmall molecule crystallography play a signifi-cant role. Large molecule techniques provide in-formation about the three dimensional structureof receptor sites and target enzymes, often withpotential drug candidates as bound ligands.These studies enable rational drug design suchthat structural changes can be made that opti-mize a drug molecule’s interaction with the tar-get structure.
1.1. X-ray Crystallography of Small MoleculesX-ray crystallography is used through out the
discovery and development process. It servesthe primary role of structural elucidation of mol-ecular conformation. It is used in the confirma-tion of structure (COS) reports that are pre-sented in the investigational new drug applica-tion (IND) and new drug application (NDA) thatprove the identity of the molecule to be testedin clinical trials. The technique serves otherniche roles in the pharmaceutical industry. Itcan elucidate the absolute configuration of chi-ral molecules, and aids in structural determina-tion of systems that contain heterocyclic sys-tems that are not readily amenable to magneti-zation transfer used in two-dimensional NMRtechniques. Furthermore, heterocyclic systemsgive rise to complex fragmentation patterns intheir mass spectra making their interpretationmore complex. Despite advances in the deter-mination of structures from X-ray powder dif-fraction data, the importance of such a defini-tive, high-resolution technique as single crystalX-ray diffraction remains as the favorite of syn-thetic organic chemists.
1.2. High Throughput Salt and PolymorphScreening
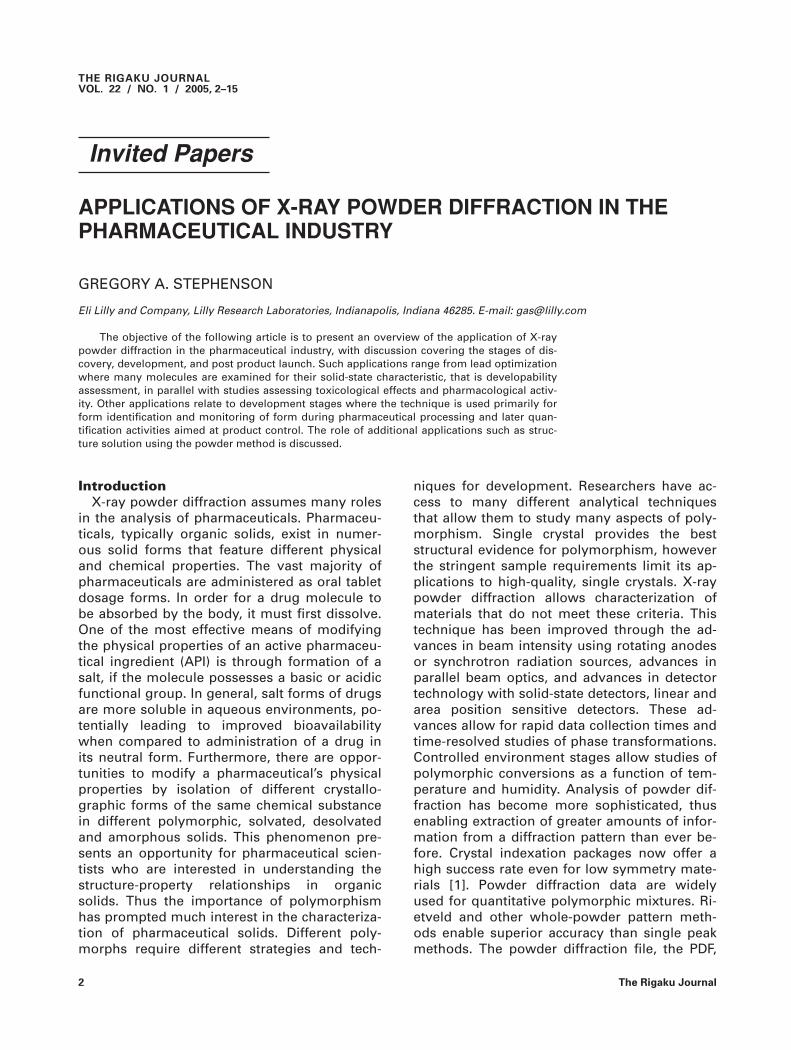
After tens of thousands of molecules havebeen screened for activity against a particulartarget for disease intervention, a subset of ac-tive molecules advance into lead optimizationwhere they undergo toxicological testing. Dur-ing toxicological testing the primary objective isto establish the blood levels that the compoundcan safely be dosed, using animal models, anddetermine if any short-term reaction to the po-tential therapeutic agent is detected. Prior to theinvestment of large amounts of money andtime into a given compound, it becomes impor-tant to assess whether or not the drug candi-date can be produced in a form that might bedevelopable as a product. Material is committedto salt screening activities to produce materialsthat can be tested to see if they are crystalline,chemically stable, and bioavailable. At thispoint, the purity of the material produced be-gins to approach that acceptable for a finalproduct, hence crystallizations using this mater-ial becomes more relevant. Purity is not theonly factor involved in crystallization, the re-lated substance profile also plays a major rolein determining the crystallization outcome. Al-teration of the synthetic route will alter the re-lated substance profile and potentially the re-sults observed from a crystallization screen. Asa consequence, studying the crystallizationcharacteristics of a molecule at the very earlystages does not supplant the further investiga-tion of its crystallization properties using repre-sentative material later in development. Saltscreening is attempted when sufficient materialbecomes available and one becomes concernedabout achieving sufficient blood levels to con-duct meaningful toxicological testing. Consider-able challenges can result when trying to relatethe observations from one toxicological studyto the next if the solid form is not well charac-terized. Furthermore, often it is necessary toachieve much greater levels of bioavailabilityduring toxicological studies aimed at establish-ing the margin of safety of a drug. In such stud-ies, one often attempts to reach blood levels fargreater than the anticipated therapeutic level.The enhanced bioavailability achieved by saltformation can enable such studies to be moreeffectively conducted. Figure 1, provides an ex-ample of a drug and its active metabolite’sbioavailability when administered as a mesylatesalt versus being dosed as an HCl salt [2]. In thisstudy, a 2.6 fold increase was observed by ad-ministration of the drug in the mesylate form.
Vol. 22 No. 1 2005 3
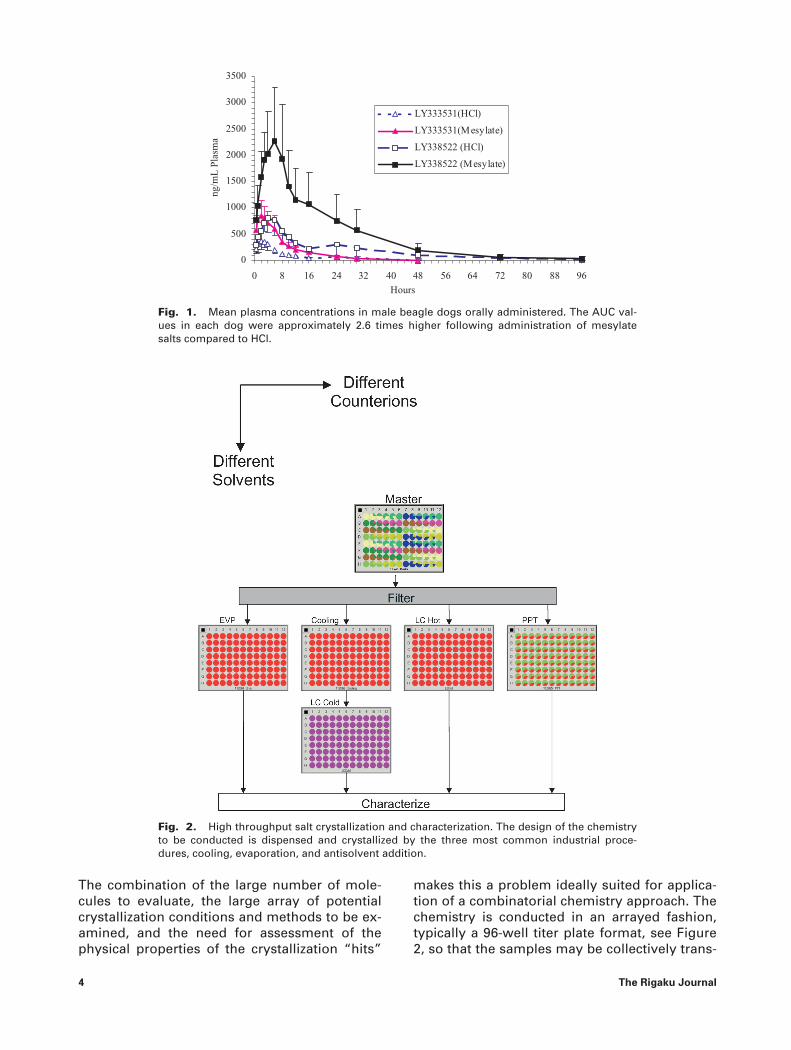
The combination of the large number of mole-cules to evaluate, the large array of potentialcrystallization conditions and methods to be ex-amined, and the need for assessment of thephysical properties of the crystallization “hits”
makes this a problem ideally suited for applica-tion of a combinatorial chemistry approach. Thechemistry is conducted in an arrayed fashion,typically a 96-well titer plate format, see Figure2, so that the samples may be collectively trans-
4 The Rigaku Journal
0
500
1000
1500
2000
2500
3000
3500
0 8 16 24 32 40 48 56 64 72 80 88 96
Hours
ng/m
L P
lasm
a
LY333531(HCl)
LY333531(Mesylate)
LY338522 (HCl)
LY338522 (Mesylate)
Fig. 1. Mean plasma concentrations in male beagle dogs orally administered. The AUC val-ues in each dog were approximately 2.6 times higher following administration of mesylatesalts compared to HCl.
Fig. 2. High throughput salt crystallization and characterization. The design of the chemistryto be conducted is dispensed and crystallized by the three most common industrial proce-dures, cooling, evaporation, and antisolvent addition.
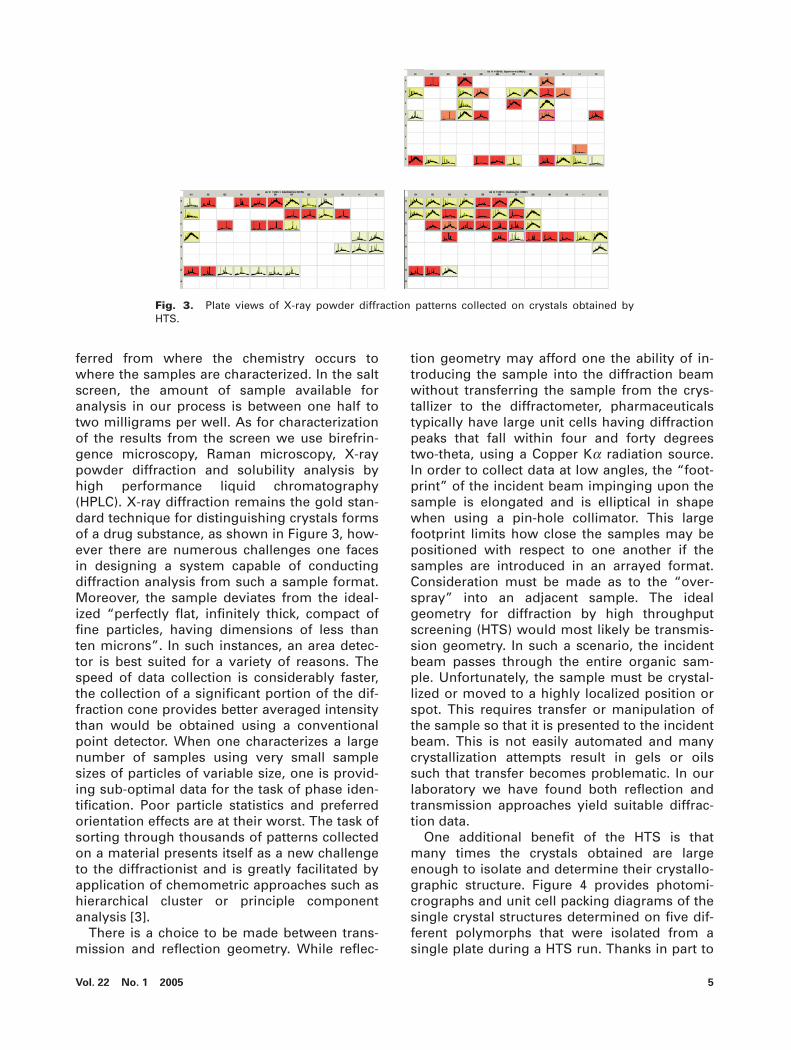
ferred from where the chemistry occurs towhere the samples are characterized. In the saltscreen, the amount of sample available foranalysis in our process is between one half totwo milligrams per well. As for characterizationof the results from the screen we use birefrin-gence microscopy, Raman microscopy, X-raypowder diffraction and solubility analysis byhigh performance liquid chromatography(HPLC). X-ray diffraction remains the gold stan-dard technique for distinguishing crystals formsof a drug substance, as shown in Figure 3, how-ever there are numerous challenges one facesin designing a system capable of conductingdiffraction analysis from such a sample format.Moreover, the sample deviates from the ideal-ized “perfectly flat, infinitely thick, compact offine particles, having dimensions of less thanten microns”. In such instances, an area detec-tor is best suited for a variety of reasons. Thespeed of data collection is considerably faster,the collection of a significant portion of the dif-fraction cone provides better averaged intensitythan would be obtained using a conventionalpoint detector. When one characterizes a largenumber of samples using very small samplesizes of particles of variable size, one is provid-ing sub-optimal data for the task of phase iden-tification. Poor particle statistics and preferredorientation effects are at their worst. The task ofsorting through thousands of patterns collectedon a material presents itself as a new challengeto the diffractionist and is greatly facilitated byapplication of chemometric approaches such ashierarchical cluster or principle componentanalysis [3].
There is a choice to be made between trans-mission and reflection geometry. While reflec-
tion geometry may afford one the ability of in-troducing the sample into the diffraction beamwithout transferring the sample from the crys-tallizer to the diffractometer, pharmaceuticalstypically have large unit cells having diffractionpeaks that fall within four and forty degreestwo-theta, using a Copper Ka radiation source.In order to collect data at low angles, the “foot-print” of the incident beam impinging upon thesample is elongated and is elliptical in shapewhen using a pin-hole collimator. This largefootprint limits how close the samples may bepositioned with respect to one another if thesamples are introduced in an arrayed format.Consideration must be made as to the “over-spray” into an adjacent sample. The idealgeometry for diffraction by high throughputscreening (HTS) would most likely be transmis-sion geometry. In such a scenario, the incidentbeam passes through the entire organic sam-ple. Unfortunately, the sample must be crystal-lized or moved to a highly localized position orspot. This requires transfer or manipulation ofthe sample so that it is presented to the incidentbeam. This is not easily automated and manycrystallization attempts result in gels or oilssuch that transfer becomes problematic. In ourlaboratory we have found both reflection andtransmission approaches yield suitable diffrac-tion data.
One additional benefit of the HTS is thatmany times the crystals obtained are largeenough to isolate and determine their crystallo-graphic structure. Figure 4 provides photomi-crographs and unit cell packing diagrams of thesingle crystal structures determined on five dif-ferent polymorphs that were isolated from asingle plate during a HTS run. Thanks in part to
Vol. 22 No. 1 2005 5
Fig. 3. Plate views of X-ray powder diffraction patterns collected on crystals obtained byHTS.

HTS, it is rare that a drug will achieve the INDstage without its single crystal structure havingbeen determined, thus reducing the need formanual attempts at crystal growth for the solepurpose of determination of structure.
2. Applications in DevelopmentThe development cycle for a drug candidate
typically takes approximately 13 years andnearly one billion dollars. One in 100,000 com-pounds make it through the toxicological test-ing, and clinical trials where the safety and effi-cacy of the drug is established. During this timeframe, a large amount of effort is placed on thedevelopment of robust processes whereby thedrug product can be produced in high yield andpurity. Furthermore, analytical tests are devel-oped that enable assessment of a drug API andformulated product’s quality and performance.X-ray powder diffraction assumes many differ-ent roles during the development process andextends throughout the life of the product.
2.1. Phase IdentificationThe role of X-ray powder diffraction for iden-
tification of unknown chemicals is limited in thepharmaceutical industry, since there are numer-ous techniques available for determining mole-cular structure of organic molecules. The tech-niques of mass spectrometry and nuclear mag-netic resonance are dominant in this role. Onthe other hand, due to its speed of data acquisi-tion and sensitivity, X-ray powder diffraction ex-ists as the primary tool for phase identification,that is identifying the unique crystallographicform of a given substance.
With the intent and objective to assist in theestablishment of a single set of global specifica-tions for new drug substances and products,guidelines were written that provide guidanceon setting and justifying acceptance criteria andthe selection of test procedures for new drugsubstances of synthetic chemical origin whichhave not been previously registered in the U.S.,European Union or Japan. In particular, a guide-line was written that provides a rationale for ap-proaching the development of pharmaceuticalsthat are polymorphic. In the guideline, thebroad sense of the word polymorphism is usedsuch that it encompasses true polymorphs, hy-drates, solvates, and amorphous forms. Differ-ences in forms could, in some cases, affectquality or performance of new drug products. Incases where differences exist which have beenshown to affect drug product performance,bioavailability or stability, then the appropriatesolid state should be specified. The polymor-phic form of a drug product is monitored duringstability testing. If a change of form that couldaffect safety or efficacy of the product doesoccur then acceptance criteria are establishedfor the product.
2.2. Diffraction Analysis of Effects of Process-ing on Crystal Form
Polymorphic mixtures can result from a rangeof pharmaceutical processes, each step may beresponsible for generation of a different form.One example is the drying process of the API.
2.2.1. Monitoring Crystallization ProcessesIt is also important to ensure that a salt is ac-
tually formed during recrystallization. Whenforming the salt of a relatively weak acid orbase, it is possible for them to disproportionateupon recrystallization or upon suspension in anaqueous vehicle. Suspensions are commonlyused for toxicological studies as well as in pedi-atric or gerontology samples. If disproportiona-tion occurs, the characteristics of the solid will
6 The Rigaku Journal
Fig. 4. Photomicrograph and unit cell diagrams of sin-gle crystal structures solved from crystals obtained fromdifferent wells using HTS.

no longer be that of the salt form, but rather ofthe individual components. For this reason it isimportant to study the stability of an API in toxi-cological formulations prior to administration.Sometimes disproportionation occurs duringthe actual recrystallization steps, particularlycommon with polar solvents and weakly basiccompounds. Rather than observing a uniquepattern for the salt form, the pattern observed isof the two individual components that were re-acted to give the desired salt form. By analysisof the diffraction pattern it is easy to establishthat the salt was not formed and different crys-tallization conditions should be explored to pro-vide the desired salt. The sample shown in Fig-ure 5 was prepared for toxicological testing andwas analyzed by diffraction prior to testing. If ithad been tested, one might anticipate the sam-ple to have lower bioavailability compared tothe desired salt form and potentially hinder es-tablishment of appropriate dosing levels forclinical investigations.
2.2.2. Monitoring Drying of Active Pharmaceu-tical Ingredient
After the drug is recrystallized and is filteredfrom its “mother liquor”, it is typically dried byone of a variety of processes. If the drug is ini-tially isolated as a hydrated form, it can un-dergo dehydration and conversion to an anhy-drous form or perhaps remain in the same crys-tallographic form, but with altered physicalproperties. Figure 6 shows a study conducted
using an environmental chamber where thedrug, erythromycin A dihydrate, was dehy-drated at low humidity and allowed to exist in amoisture free environment for an extended pe-riod of time. Though the crystal form does notcollapse to an amorphous state nor does ittransform to a crystallographically distinctphase, it shows “relaxation” behavior over timethat relates to a reduction in unit cell volume.The lattice energy is expressed as a function ofthe van der Waals, coulombic, and hydrogenbonding energies, see equation 1. While the vander Waals contribution is not as well describedas hydrogen bonding interactions for organicmolecules, the relatively large number of vander Waals contacts make its contribution to the
Vol. 22 No. 1 2005 7
0
2000
2-Theta - Scale
5 10 20
Acid + Free Base (Salt not Formed)
Free Base
Acid
Fig. 5. The X-ray powder diffraction pattern showing that disproportionation of the salt oc-curred during recrystallization.
8 10 12 14 16 18 20 degrees 2Q
004
011
200
1 day
hydrated
7 days
32 days
NIST 675
Fig. 6. X-ray powder diffraction patterns of erythro-mycin A dihydrate before and after dehydration. Theshifting of unit cell parameters toward higher angle indi-cated a reduction of unit cell volume during relaxation ofthe desolvated lattice.
lattice energy very important in determining thestability of an organic substance. The van derWaals term is often expressed as the Lennard–Jones functional form where r represents theinteratomic separation and A and B areLennard–Jones coefficients, equation 2. As thecrystal lattice of the sample relaxes as its cellvolume reduces, heat is given off as the latticeachieves a more favorable close packing of itsdesolvated structure, see Figure 7.
Elattice�Evan der Waals�Ecoulombic�Ehydrogen bonding
(1)
Evan der Waals(r )�Ar �12�Br �6 (2)
Similarly, such studies involving humidity-controlled experiments have resulted in betterunderstanding of cromolyn and cefazolinsodium non-stoichiometric hydrate dryingprocesses, whose unit cell parameters vary con-
tinuously depending upon the humidity of theirenvironment [4].
2.2.3. Monitoring the Influence of Milling ofActive Pharmaceutical Ingredient
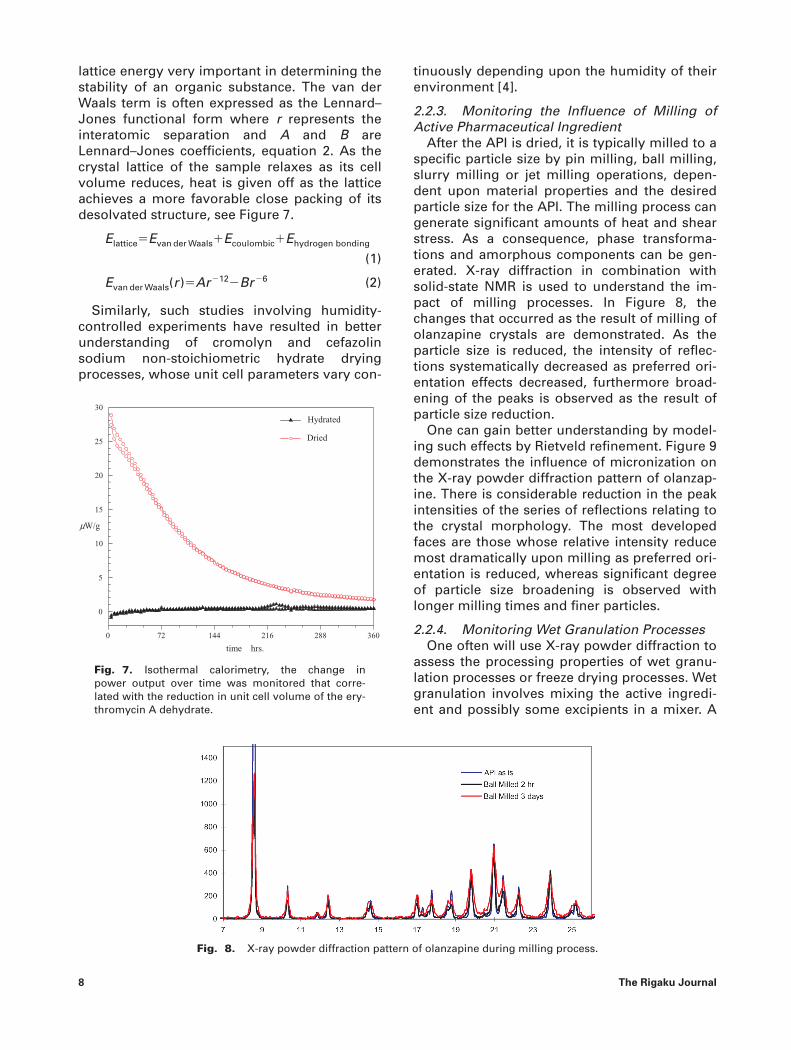
After the API is dried, it is typically milled to aspecific particle size by pin milling, ball milling,slurry milling or jet milling operations, depen-dent upon material properties and the desiredparticle size for the API. The milling process cangenerate significant amounts of heat and shearstress. As a consequence, phase transforma-tions and amorphous components can be gen-erated. X-ray diffraction in combination withsolid-state NMR is used to understand the im-pact of milling processes. In Figure 8, thechanges that occurred as the result of milling ofolanzapine crystals are demonstrated. As theparticle size is reduced, the intensity of reflec-tions systematically decreased as preferred ori-entation effects decreased, furthermore broad-ening of the peaks is observed as the result ofparticle size reduction.
One can gain better understanding by model-ing such effects by Rietveld refinement. Figure 9demonstrates the influence of micronization onthe X-ray powder diffraction pattern of olanzap-ine. There is considerable reduction in the peakintensities of the series of reflections relating tothe crystal morphology. The most developedfaces are those whose relative intensity reducemost dramatically upon milling as preferred ori-entation is reduced, whereas significant degreeof particle size broadening is observed withlonger milling times and finer particles.
2.2.4. Monitoring Wet Granulation ProcessesOne often will use X-ray powder diffraction to
assess the processing properties of wet granu-lation processes or freeze drying processes. Wetgranulation involves mixing the active ingredi-ent and possibly some excipients in a mixer. A
8 The Rigaku Journal
0 72 144 216 288 360
0
5
10
15
20
25
30
time hrs.
mW/g
Hydrated
Dried
Fig. 7. Isothermal calorimetry, the change inpower output over time was monitored that corre-lated with the reduction in unit cell volume of the ery-thromycin A dehydrate.
Fig. 8. X-ray powder diffraction pattern of olanzapine during milling process.

binder is typically added in the dry mix state ordissolved in the fluid used for granulating. Thegranulating solution or suspension is added tothe dry powders in the mixer and mixed untilthe desired characteristics are achieved. Thisusually produces a granule that is of suitablecharacteristics for producing tablets with ade-quate hardness, dissolution, content uniformity,and other physical characteristics. After the wetgranulation step, the product is most oftendried and then milled after drying to get a majorpercentage of the product within a desired sizerange. The dry granulation is then processed toget an acceptable size range by first screeningwith a sieving device, and then milling the over-sized particles. For normal compressed tablets,the broad particle size range produced by this
method is usually satisfactory. It is important tounderstand the phase conversions that occurduring processing. By profiling the process, onecan determine which phases dissolve and thenrecrystallized upon drying. If the API dissolves,it is important to understand whether it recrys-tallizes or remains amorphous, or if it forms ahydrate or different polymorph. Certainly if itdissolves and recrystallizes, its particle size willdiffer from that of the API introduced into thedry blend of the formulation. All of these factorscan impact the chemical stability of the drugproduct, and potentially its bioavailability ortablet disintegration. Figure 10 shows a profil-ing of a formulation that is predominantly com-posed of lactose monohydrate, a smalleramount of anhydrous lactose and a small con-
Vol. 22 No. 1 2005 9
Fig. 9. Demonstration of the influence of particle size reduction on the intensity of the 1 0 0reflection of olanzapine.
Fig. 10. Characterization of changes occurring during drying of a wet granulated formula-tion. The top trace is of lactose monohydrate. The middle three are of the formulation com-posed of a mixture of hydrated and anhydrous lactose, as well as the drug (D) at 15, 60, and120 minutes (top to bottom). The lower trace shows a diffraction pattern of anhydrous lactose.

centration of a water-insoluble drug when thedry blend is formed. After adding the granulat-ing solution the lactose is exclusively convertedto the monohydrate form, as the drying processproceeds, most of the lactose monohydrate isconverted to anhydrous lactose after two hoursof drying. Throughout this process, due to thedrug’s low solubility, the API remains in thesame crystalline state as it was first introducedinto the formulation. It is not completely un-common for acid-base reactions to occur duringwet granulation. In fact, many of the an-giotensin converting enzyme (ACE) inhibitorformulations, such as that of enalipril maleate,have used basic excipients to neutralize theacidic API and render it more chemically stablein the tablet.
2.2.5. X-ray Powder Diffraction of Freeze Dry-ing Processes
When one produces a freeze-dried formula-tion such as one for parenteral administrationof a drug substance, a bulking agent is oftenadded to make a uniform “plug” that rapidlydissolves upon reconstitution. One of the mostcommon bulking agents is mannitol. In onelow-temperature study, X-ray powder diffrac-tion was used to identify a new form of manni-tol, a hemi-hydrate that is stable only at lowtemperature, see Figure 11 [5]. This crystallineform is thought to be involved in a well knownvial breakage problem that causes a significantpercentage of vials to break as they are broughtback to room temperature while under vacuum.The mechanical stress afforded by the phasetransition combined with defects in the glasscause vials to break as they are heated, undervacuum, to room temperature.
2.3. X-ray Powder Diffraction of Forensic Sam-ples
X-ray powder diffraction is not the primarymeans for determination of chemical identifica-tion of organic molecules, lagging well behindnuclear magnetic resonance and mass spec-trometry. As the proprietor of relatively sophis-ticated instrumentation, and perhaps the moststraightforward method for determining thestructural identity of inorganic materials, X-raypowder diffraction is commonly called upon toidentify inorganic unknowns from manufactur-ing processes. Whether the investigation in-volves analysis of metals when mechanical fail-ure occurs, gasket materials, or common inor-ganic salts that are formed as byproducts of re-actions, X-ray diffraction is the tool of choice.One of the more interesting identifications
problems was when a protein product was crys-tallizing to a size that was 100 times the productspecification. The only thing unique about thisrecrystallization was that a new supplier of abuffer ingredient, sodium phosphate, had beenused. When the sample was examined moreclosely by X-ray powder diffraction, it was evi-dent that the supplier had formed a significantamount, 18 percent, sodium pyrophosphate asthe result of an errant drying process. Spikingof crystallizations with pyrophosphate resultedin reproduction of the larger crystal size anddemonstrated the role of pyrophosphate in en-hancing crystal growth.
2.4. Reverse Engineering of Drug ProductsIt is often desirable, particularly if one is in
the generic industry, to reverse engineer a com-petitor’s formulation. This is particularly useful,since the innovator company has already estab-lished sufficient compatibility of the API withthe excipient ingredients. As a consequence, itcan be quite useful to determine the composi-tion of a competitor’s product, since it will ad-vance one’s formulation development consider-ably. Many of the pharmaceutical excipients areamorphous, whereas others such as mannitol,lactose monohydrate, and anhydrate are crys-talline. A combination of IR, X-ray powder dif-fraction, and SSNMR provide a great under-standing of the composition and solid stateforms of the components that make up the for-mulation.
10 The Rigaku Journal
Fig. 11. Evidence of hydrated form of mannitol atinitial, low-temperature (1) conditions prior to heatingto room temperature (2) versus stick diagrams ofknown crystal forms of mannitol.

2.5. Quantitative Phase Analysis Using X-rayPowder Diffraction
Because the physical form of a drug can im-pact pharmaceutical drug product performance,there are occasions when it is not sufficient tomerely qualitatively identify the forms presentin the API or final product. In such cases, onemay need to develop a quantitative method tomonitor the production process and ensure thatthe active pharmaceutical ingredient remainswithin manufacturing control limits and thedrug product performance is not compromised.To meet regulatory requirements for drug prod-uct registration, flow charts were constructedfor investigators to use as guidelines for charac-terizing compounds under development [6]. Ac-cording to Byrn et al., quantitative methods arecalled for only in cases where mixtures of poly-morphs or hydrates, that are known to have dif-ferent physical properties that are relevant todosage form performance (bioavailability orchemical stability) or manufacturing repro-ducibility, cannot be avoided. In such cases, val-idated methods would be needed to ensure thatthe ratio of forms is reproducible and the pro-duction process is controlled. A variety of physi-cal techniques (crystallography, spectroscopy,thermal analysis, and microscopy) are useful forcharacterizing the solid forms of pharmaceuti-cals and have recently been reviewed [7].
X-ray powder diffraction has been used ex-tensively for quantitative analysis of mixtures ofcrystal forms and to a lesser extent the determi-nation of the degree of crystallinity. There aretwo primary methods for quantification; usingeither individual peaks or the whole patterns toestablish the relationship between phase com-position and the intensity of individual peaks orof patterns of the phases being quantified. Klugand Alexander first outlined the basic mathe-matical relationships for quantitative analysis ofpowder mixtures in 1948 [8]. The primary as-sumption of the diffraction method relies on theparticle size to be sufficiently small that extinc-tion and micro-absorption effects are negligible.Furthermore, accurate quantification reliesheavily on our ability to minimize the effects ofpreferred orientation. With inorganic samples,this is typically accomplished by grinding of thesample. With organic compounds, this may notbe so readily accomplished. The potential ofphase inter-conversion while reducing particlesize is of major concern. Oftentimes crystallinesamples can be made amorphous, solvates des-olvate, and metastable phases convert to morethermodynamically stable forms. This problem
is particularly troublesome during the earlieststages of development when only limitedamounts of “unmilled” material are availableand lot sizes are smaller. As the process isscaled up and controls are made on the particlesize of the API, the precision and accuracy ofthe method tends to improve. There are numer-ous considerations that must be made whenconsidering exactly what method is best to de-velop [9]. Most whole pattern methods requirea greater level of knowledge about the phasesto be analyzed than the single peak methods.Two exceptions would be the whole pattern ap-proaches such as factor-based Partial LeastSquares (PLS) or the whole pattern method de-scribed by Smith et al. Factor-based PLS is amultivariate method that has found widespreadanalytical application [10]. Such methods in-volve establishing a calibration set that is usedto derive a predictive model for analysis of fu-ture data sets. The calibration set should con-tain as many sources of sample variation aspossible. In doing so, one might expect to beable to empirically correct for (or at least par-tially compensate for) the influence of preferredorientation [11]. Such methods require no moreinformation than single peak methods becausethey rely on empirically derived correlation ofintensity/composition through training sets.
The program GMQUANT, developed bySmith et al., uses a whole powder pattern ap-proach that does not require indexation of theindividual components of the mixture [12]. In-dexation of pharmaceuticals can be highlyproblematic due to their low symmetry andcommonly large unit cell axes. This require-ment is perhaps the greatest limitation to theutility of the whole powder pattern approachesdescribed later. GMQUANT uses least squaresminimization of the difference between the digi-tized experimental pattern of a mixture and thatof a convolution of the digitized pattern of theindividual phases related by weighting factors.This approach represents perhaps the most eas-ily applied whole pattern method and is suitablefor quality control applications, since it requiresminimal interaction of the analyst.
• Whole Powder-pattern Decomposition Meth-ods (WPPD)In WPPD the integrated intensity parameters,
unit-cell parameters, and the peak profile para-meters are refined by least squares fitting pro-cedures along with an overall scale-factor relat-ing the individual phases (or even amorphousbackground). intensity of the diffraction pattern
Vol. 22 No. 1 2005 11

profile intensity, Y, at individual steps, i, of 2q isdecomposed
(3)
where B(2q i) is the background function, P(2q i)is the profile function and Sk is the scale factor.There are a number of different backgroundfunctions and profile functions that describe thediffraction profile [13].
In the WPPD as implemented by Toraya et al.[14], the peak profiles and background functionsare decomposed to obtain the best fit to the ex-perimental powder pattern of the individualpure phase data by least-squares refinement.The integrated intensities of the pure phasesare then stored with the other refined parame-ters, such as the profile parameters and theunit-cell parameters of the phases to be quanti-fied. During quantification step, the integratedintensity of the phase being quantified is scaled,as defined in equation 3, such that the total ofthe scale factors for the component phases sumto unity. The scale factors of the individual com-ponents are then refined by least-squares meth-ods until a best fit is observed with respect tothe pattern of unknown composition. In the Ri-etveld method, essentially the same approach isused as in Toraya’s method except a structuralmodel (typically from a crystallographic deter-mination) is used to calculate the intensities ofthe individual phases.
There seems to be an endless number of ap-proaches to quantification by X-ray powder dif-fraction, some of which have been briefly dis-cussed herein. When deciding what approach touse there are many considerations one musttake into account; are you developing a methodto guide the development of a process, are youdeveloping a method that will ultimately serveas a quality control application. Many factors in-fluence the lab-to-lab or instrument-to-instru-ment transferability of a diffraction method. Forinstance, it might not be advisable for one totransfer a Rietveld method to a quality controllaboratory since the success of quantificationrelies heavily on obtaining a global minimumfrom a non-linear least squares refinementprocess. The robustness of such a methodologyis highly dependent upon the skill level of theanalyst and may not be readily automated.Since organic compounds may decompose withtime, consideration must also be made aboutthe long-term availability of standards if stan-dard curves are to be used. Development of agood quantitative method requires careful con-
sideration of many factors and oftentimes de-pends on trade-off between ease and sophisti-cation of approach.
2.5.1. Applications of Quantitative Analysis toPharmaceuticals in the Solid-state
• Quantification of mixtures of crystalline formsChrist et al. reported the first application of
quantitative X-ray powder diffraction to a phar-maceutical system in 1948 [15]. In this work, X-ray powder diffraction was used to quantify theamount of crystalline sodium penicillin G insamples containing a mixture of five other re-lated substances from the fermentationprocess. Measuring the intensity of a single re-flection against an external standard and plot-ting its ratio versus concentration determinedsodium penicillin G content. A straight-lineworking curve was obtained. They found thataddition of carbon black to the sample reducedthe effect of preferred orientation. We havefound this approach effective for minimizingpreferred orientation of a number of other phar-maceuticals. The advantage of carbon black isthat its color provides a visible indication of thehomogeneity of mixing. Being relatively inertand amorphous, it is non-reactive and disfavorssuccessive layering of platy crystals, as was thecase with penicillin G samples. In 1963, Shellstudied the application of quantitative XRPD topamoic acid, sulfonamide, tetracycline, andnovobiocin. He further surveyed the use of di-rect simple calibration curves and the use of in-ternal standards. In this work, Shell demon-strated the use of quantitative XRPD for thecompletion of a salt forming reaction. Dudduand coworkers studied the reaction betweentwo enantiomers to form a racemic crystal [16].In the method, physical mixtures were made ofthe racemic crystalline form and one of theenantiomers. A linear relationship was ob-served in a plot of the peak area versus theweight fraction. The standard curve was used todetermine the amount of crystalline racemateformed during the solid-state reaction.
More recently, the development of quantita-tive methods by the group of Suryarananan toinvestigate carbamazepine has occurred. A sin-gle-peak powder diffraction method was devel-oped to quantify the relative amounts of anhy-drous carbamazepine and carbamezapine dihy-drate to study the kinetics of transformationupon suspending the anhydrous form in water[17]. Although the study used a single-peakmethod, which may be most affected by pre-ferred orientation, its influence was minimized
Y B S I Pi ik
N
kj
jk i jk( ) ( ) ( )2 2 21
θ θ θ� ��
∑ ∑
12 The Rigaku Journal
by selection of lines least influenced by pre-ferred orientation. This was accomplished bysystematic evaluation of the standard deviationof the individual peak areas as the result of re-peat sample preparation. Another important as-pect of the study was that it demonstrated theminimal influence of a change of hydrationstate on the mass absorption coefficient of thecompound, changing from 5.21 cm2 g�1 to5.87 cm2 g�1 in the anhydrous versus hydratedphase. In most of the pharmaceutical literature,this difference is not considered. The lack ofcorrection for differences in mass absorption ofdifferent states of hydration of pharmaceuticalsbeing quantified can be expected to introduce arelatively small, albeit unnecessary error insuch analyses.
In another study by Suryanarayanan, a pow-der diffraction method was developed to quan-tify the active ingredient in intact tablets [18].Two model drugs were examined, lithium car-bonate and carbamazepine. The drugs of vari-ous weight fractions were mixed with micro-crystalline cellulose, as well as starch in thecase of carbamazepine, and then compressedinto tablets. Though use was not made of theentire diffraction pattern, the intensities of sev-eral different reflections were used for quantifi-cation, thereby resulting in a more robustmethod. The objective was to monitor the drugcontent in individual tablets during acceleratedstability studies. The method was carried out onintact tablets and resulted in a simple procedurethat could readily be automated.
There are numerous opportunities for furtherdevelopment of quantitative methods for phar-maceuticals. One can expect to see more fre-quent application of “whole pattern” ap-proaches to quantitative X-ray powder diffrac-tion analysis of pharmaceuticals. Because of theever-increasing need to reduce particle size toenhance bioavailability of highly permeable-water insoluble compounds, there continues tobe a largely unmet need for the detection of lowlevels of an amorphous component present incrystalline pharmaceuticals as well as a lack of agood internal standard for quantification of or-ganic phases.
3. Interplay of Single Crystal and Pow-der Diffraction
Because of the commonness of programsthat are useful for calculation of X-ray powderdiffraction data from single crystal structuresand our ability to make comparisons with ex-perimental powder patterns, there has been
considerable advancement in the utility of thetechnique beyond mere phase identification.
3.1. Calculated Powder Diffraction PatternsPreferred orientation can cause problems in
interpretation of powder diffraction patterns, itprovides uncertainty in the intensity that peaksare to be observed. Consequently the appear-ance of peaks at locations where there previ-ously might not have been is a cause for alarmfor the diffractionist. The use of calculated pow-der diffraction patterns has become an indis-pensable tool for the diffraction laboratory,where the presence of peaks that are not ac-counted for in the calculated powder diffractionpattern or indexed pattern provides unambigu-ous evidence for phase impurity.
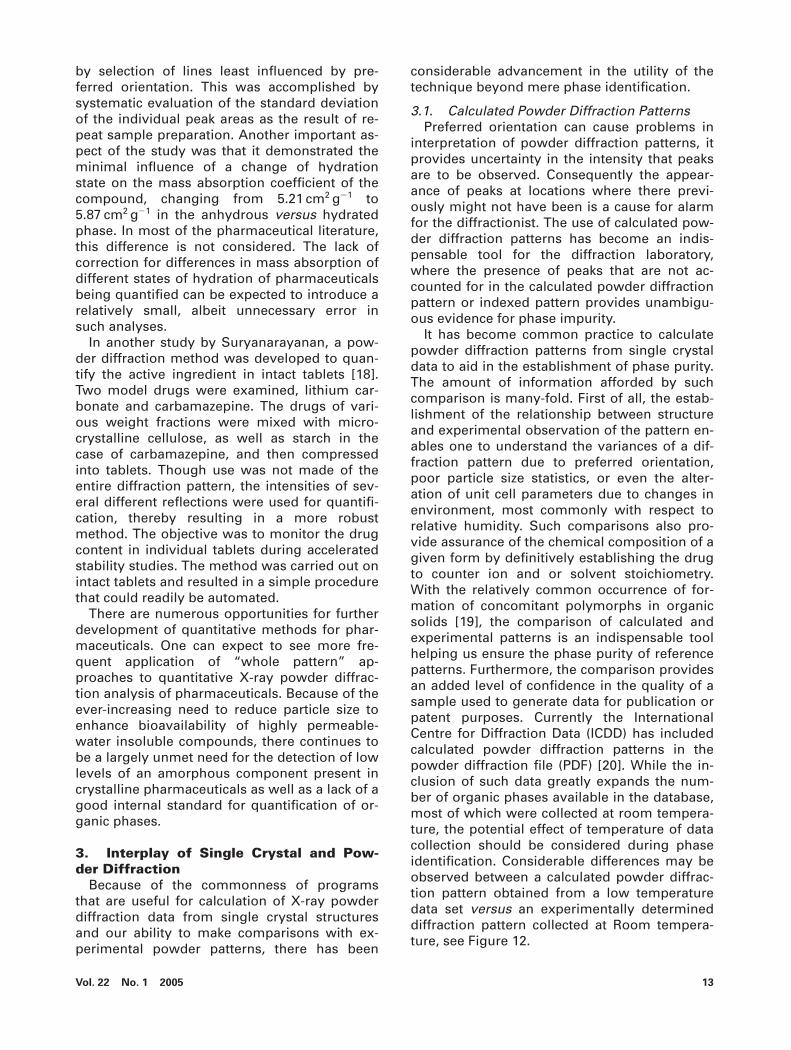
It has become common practice to calculatepowder diffraction patterns from single crystaldata to aid in the establishment of phase purity.The amount of information afforded by suchcomparison is many-fold. First of all, the estab-lishment of the relationship between structureand experimental observation of the pattern en-ables one to understand the variances of a dif-fraction pattern due to preferred orientation,poor particle size statistics, or even the alter-ation of unit cell parameters due to changes inenvironment, most commonly with respect torelative humidity. Such comparisons also pro-vide assurance of the chemical composition of agiven form by definitively establishing the drugto counter ion and or solvent stoichiometry.With the relatively common occurrence of for-mation of concomitant polymorphs in organicsolids [19], the comparison of calculated andexperimental patterns is an indispensable toolhelping us ensure the phase purity of referencepatterns. Furthermore, the comparison providesan added level of confidence in the quality of asample used to generate data for publication orpatent purposes. Currently the InternationalCentre for Diffraction Data (ICDD) has includedcalculated powder diffraction patterns in thepowder diffraction file (PDF) [20]. While the in-clusion of such data greatly expands the num-ber of organic phases available in the database,most of which were collected at room tempera-ture, the potential effect of temperature of datacollection should be considered during phaseidentification. Considerable differences may beobserved between a calculated powder diffrac-tion pattern obtained from a low temperaturedata set versus an experimentally determineddiffraction pattern collected at Room tempera-ture, see Figure 12.
Vol. 22 No. 1 2005 13
3.2. Structures Solution from Powder Diffrac-tion Data
While single crystal X-ray diffraction will con-tinue to be the sole provider of absolute config-uration data for organic molecules [21], X-raypowder diffraction continues to advance to astate where it can provide reasonably accurateinformation about molecular conformation,three dimensional packing arrangement, andhydrogen bonding patterns in organic molecu-lar solids. With the increasing performance andavailability of programs that apply MonteCarlo/Simulated Annealing (MC/SA) or molecu-lar searching methods to powder diffractiondata, the solution of structures that were previ-ously inaccessible to single crystal methods arenow possible [19, 22–24]. The use of powderdiffraction for the solution of structures has re-cently been reviewed [25]. Certain types of crys-talline substances are difficult or beyond the ca-pability of single crystal techniques, even whenperforming micro-crystal diffraction using asynchrotron radiation source. In particular,metastable polymorphic forms that are isolatedby rapid crystallization from the melt or thatrapidly grow from solution are typically ex-tremely small or highly flawed crystals. Desol-vation processes commonly result in crystalsthat appear to have the same particle size as thecrystals from which they were formed; how-ever, upon examination by polarized light mi-croscopy they are usually composed of micro-crystalline aggregates [26]. As in single crystaldiffraction, the first step, indexing, presents per-haps the biggest obstacle. Typically if one cansuccessfully index a crystal, its structure can bedetermined. This is apparently true for the pow-der method also. The number of variables ofthe problem can be limited by restraining bonddistances and angles of the molecule to knownvalues. Portions of molecules may be consid-ered rigid bodies based on chemical intuition
and when similar fragments are found to haveconsistent conformations in different structuresthat are reported in the Cambridge StructuralDatabase (CSD) [27], or by searching ones ownlibrary of molecules of a particular therapeuticcategory. Alternatively, conformations can becalculated using molecular mechanics, semi-empirical, or ab initio methods. As a result,seemingly complex molecules can be reducedto merely a few torsion variables describing themolecule’s internal degrees of freedom, threeCartesian coordinates describing the position ofthe molecule in the unit cell, and three Eulerianangles describing molecular orientation.
As described in section 2.2.5, a previously un-known hydrated crystalline phase was identifiedusing low temperature X-ray powder diffrac-tion. That crystalline phase had been implicatedin the common “vial breakage” problem offreeze-drying mannitol containing parenteralformulations. Despite the sample consisting ofa mixture of crystalline phases of mannitol, thestructure was solved on the phase-mixture pat-tern, having the peaks associated with thephases whose structures had previously beendetermined subtracted from the pattern [28]. Theintensity and resolution afforded by the synchro-tron radiation source resulted in the reasonablylow R factor. The information gained from thestudies of the freeze drying process using lowtemperature X-ray diffraction combined withthe subsequent structure solution by the pow-der method highlights the important role that X-ray diffraction can play in the pharmaceuticalindustry as it helped understand a problem thathas plagued parenteral product manufacturingfor more than one half of a century.
4. ConclusionsX-ray powder diffraction continues to be the
“gold standard” technique for identification ofdifferent crystalline forms of a given substance
14 The Rigaku Journal
Fig. 12. Comparison of simulated powder diffraction pattern of olanzapine based on struc-tures collected at �100°C (lower) and 23°C (upper).

in the pharmaceutical industry. While it doesserve as a means for identification of primarilyinorganic unknowns, it remains the dominanttechnique for studies of polymorphism, solva-tion, and salt form identification. We have seenadvances of the application to high throughputscreening for crystal form in the discoveryphases of pharmaceutical research. The tech-nique continues to play a primary role in exami-nation of lots of active pharmaceutical ingredi-ent produced and the influence of pharmaceuti-cal process on crystal form and crystallinity. Theincreased availability of single crystal data ondiscovery compounds and programs for com-parison of calculated and experimental diffrac-tion patterns has had significant impact on ourability to quantify phase purity and to solvestructures of materials whose structures haveeluded us for many years.
References and Notes
[ 1 ] Jenkins, Ron; Snyder, Robert (Eds.). Introduction to X-Ray Powder Diffractometry. (1996), 544 pp., (approx.).CAN 126: 179319 AN 1997: 174497 CAPLUS.
[ 2 ] Engel, G. L.; Farid, N. A.; Faul, M. M.; Richardson, L.A.; Winneroski, L. L. Salt Form Selection and Charac-terization of LY333531 Mesylate Monohydrate. Inter-national Journal of Pharmaceutics (2000), 198(2), 239–247.
[ 3 ] Martens, Harald; Naes, Tormod. Multivariate Calibra-tion. NATO ASI Series, Series C: Mathematical andPhysical Sciences (1984), 138 (Chemometrics), 147–156.
[ 4 ] Stephenson, G. A.; Diseroad, B. A. Structural Relation-ship and Desolvation Behavior of Cromolyn, Cefazolinand Fenoprofen Sodium Hydrates. International Jour-nal of Pharmaceutics (2000), 198(2), 167–177.
[ 5 ] Yu, Lian; Milton, Nathaniel; Groleau, Edward G.;Mishra, Dinesh S.; Vansickle, Ronald E. Existence of aMannitol Hydrate during Freeze-Drying and PracticalImplications. Journal of Pharmaceutical Sciences(1999), 88(2), 196–198.
[ 6 ] Byrn, S.; Pfeiffer, R.; Ganey, M.; Hoiberg, C.;Poochikian, G. Pharmaceutical Solids: A Strategic Ap-proach to Regulatory Considerations. Pharm. Res.(1995), 12, 945–954.
[ 7 ] Yu, L.; Reutzel, S. M.; Stephenson, G. A. PhysicalCharacterization of Polymorphic Drugs: An IntegratedCharacterization Strategy. Pharm. Sci. Tech. Today(1998), 1, 118–127.
[ 8 ] Alexander, L.; Klug, H. P. Basic Aspects of X-ray Ab-sorption in Quantitative Diffraction Analysis of Pow-der Mixtures. Anal. Chem. (1948), 20, 886–889.
[ 9 ] Stephenson, G. A.; Forbes, R. A.; Reutzel-Edens, S. M.Characterization of the Solid State: Quantitative Is-sues. Advanced Drug Delivery Reviews (2001), 48(1),67–90.
[10] Thomas, E. V. A Primer on Multivariate Calibration.Anal. Chem. (1994), 66(15), 795A–804A.
[11] Maple, S. R.; Groleau, E. G.; Stephenson, G. A. Quan-titative Analysis of Polymorphism Using PrincipleComponent and Partial Least Squares Methods.Powd. Diffraction (Submitted to J. Pharm. Sci.).
[12] Smith, D. K.; Johnson, G. G., Jr.; Scheible, A.; Wims,A. M.; Johnson, J. L.; Ullmann, G. Quantitative X-rayPowder Diffraction Method Using the Full DiffractionPattern. Powder Diffr. (1987), 2(2), 73–77.
[13] Young, R. A. (Ed.). The Rietveld Method. (1995), Ox-ford University Press Inc., New York.
[14] Toraya, H.; Tsusaka, S. Quantitative Phase AnalysisUsing the Whole-Powder-Pattern DecompositionMethod. I. Solution from Knowledge of ChemicalCompositions. J. Appl. Cryst. (1995), 28, 392–399.
[15] Christ, C. L.; Barnes, R. Bowling; Williams, E. F. Or-ganic Quantitative Analysis Using the Geiger CounterX-ray Spectrometer. Anal. Chem. (1948), 20, 789–795.
[16] Duddu, S. P.; Khin-Khin, A.; Grant, D. J. W.; Surya-narayanan, R. A Novel X-ray Powder DiffractionMethod for Studying the Reaction between Pseu-doephedrine Enantiomers. J. Pharm. Sci. (1997),86(3), 340–345.
[17] Suryanarayanan, R. Determination of the RelativeAmounts of Anhydrous Carbamazepine and Carba-mazepine Dihydrate in a Mixture by Powder X-ray Dif-fraction. Pharm. Res. (1989), 6(12), 1017–1024.
[18] Suryanarayanan, R.; Herman, C. S. QuantitativeAnalysis of the Active Tablet Ingredient by Powder X-ray Diffraction. Pharm. Res. (1991), 8(3), 393–399.
[19] Bernstein, Joel; Davey, Roger J.; Henck, Jan-Olav.Concomitant Polymorphs. Angewandte Chemie, Inter-national Edition (1999), 38(23), 3441–3461.
[20] Kabekkodu, Soorya N.; Faber, John; Fawcett, Tim.New Powder Diffraction File (PDF-4) in RelationalDatabase Format: Advantages and Data-mining Capa-bilities. Acta Crystallographica, Section B: StructuralScience (2002), B58 (3, No. 1), 333–337.
[21] Determination of absolute configuration by anom-alous dispersion requires resolution of Friedel oppo-site reflections, something not possible for three di-mensional intensity data convoluted into a powderpattern. Of course determination of relative stereo-chemistry by formation of a chiral salt is quite possi-ble by powder diffraction.
[22] David, W. I. F.; Shankland, K.; Shankland, N. RoutineDetermination of Molecular Crystal Structures fromPowder Diffraction Data. Chem, Commun. (1998),931–932.
[23] Engel, G. E.; Wilke, S.; Konig, O.; Harris, K. D. M.;Leusen, F. J. J. Powder Solve—A Complete Packagefor Crystal Structure Solution from Powder DiffractionPatterns. J. Appl. Cryst. (1999), 55.
[24] Tremayne, M.; Kariuki, B.M.; Harris, K. D. M. Solutionof an Organic Crystal Structure from X-ray Powder Dif-fraction Data by a Generalized Rigid-Body Monte CarloMethod: Crystal Structure Determination of 1-Methyl-fluorene. J. Mater. Chem. (1996), 6(9), 1601–1604.
[25] Harris, Kenneth D. M.; Cheung, Eugene Y. How to De-termine Structures when Single Crystals Cannot beGrown: Opportunities for Structure Determination ofMolecular Materials Using Powder Diffraction Data.Chemical Society Reviews (2004), 33(8), 526–538.
[26] Byrn, S. R.; Solid State Chemistry of Drugs. (1982),Academic Press: New York.
[27] Cambridge Crystallographic Data Centre, The Cam-bridge Structural Database, University Chemical Lab-oratory. (1999), Cambridge. UK.
[28] Nunes, Cletus; Suryanarayanan, Raj; Botez, CristianE.; Stephens, Peter W. Characterization and CrystalStructure of D-Mannitol Hemihydrate. Journal ofPharmaceutical Sciences (2004), 93(11), 2800–2809.
Vol. 22 No. 1 2005 15