arlington public schools 2020 3-year enrollment
TRANSCRIPT
Arlington Public Schools 2020 3-Year Enrollment Projections Report 01/27/2021
2
Contents Executive Summary ....................................................................................................................................... 3
Glossary ......................................................................................................................................................... 6
Data Sources ................................................................................................................................................. 8
Assumptions and Methodology .................................................................................................................. 10
Steps to Validate Projections ...................................................................................................................... 24
Attachments:
Attachment A: Fall 2020 3-Year Enrollment Projections, 2021-22 through 2023-24 Attachment B: Fall 2020 Housing Unit Forecast and Projected Student Yield Attachment C: Fall 2019 Student Generation Rates (Updated to reflect 2021 updated
elementary school boundaries) Attachment D: Background on Projections

3
Executive Summary Every fall, APS typically publishes 10-year enrollment projections that are used for planning purposes. Because of possible COVID-19 pandemic impact on school enrollment, in Fall 2020 APS experienced an unexpected drop in enrollment compared to Fall 2019 and to last year’s projections for the 2020-21 school year. Because there is uncertainty whether this change in enrollment represents a lasting change in trend or is a temporary change, the decision was made to only extend the projection’s time horizon to three-year, from 2021-22 to 2023-24.
In the short term, the three-year projections will help inform needs such as budgeting and staffing for the next fiscal year. These enrollment projections, though, will not inform the FY 2022 four-to-six year Capital Improvement Plan (CIP).
The Fall 2020, 3-Year enrollment projections reflect the 2019 School Moves and the new neighborhood elementary school boundaries for the 2021-22 school year. The 2019 school moves included moving the majority of McKinley students to the new school at the Reed site; the Arlington Traditional School (ATS) program to the current McKinley building, and the Key Immersion program to the current ATS building. This recommendation will repurpose the current Key building into a new neighborhood school in a rapidly growing part of the county where APS needs more neighborhood school capacity for students. The Fall 2020 boundary process was limited in scope because of the impacts of COVID-19. Boundaries were developed for a new neighborhood school at the Key site and adjustments made to the attendance zones for five current elementary schools: Ashlawn, ASFS, McKinley, Taylor and Tuckahoe.
In Spring 2021, APS will publish the 2021-22 School Year Annual Update. Using these projections, Planning and Evaluation works with school leaders and several Central office departments to determine how to manage enrollment in the upcoming school year. The Spring Projections Update is made based on those decisions.
Preparing this Report The “2020 3-Year Enrollment Projections Report” was produced by Planning and Evaluation, based on the following:
• Student enrollment on Sept. 30, 2019• Methods validated by the 2015 Community Facilities Study and improved upon regularly in
consultation with the external consulting firm of RLS Demographics, most recently in Fall 2020• Estimates for additional enrollment over the next three years are based on data from Arlington
County Government (ACG) that consider:o Approved and potential housing developments expected over the next three yearso Outstanding housing building permits as of Fall 2020o Historical births to Arlington County parents from 2016 to 2018
Why 2019 Enrollment is Being Used for Neighborhood School Projections Ordinarily, enrollment projections for neighborhood schools would rely on the most current official enrollment counts from September 30, 2020. Given that the K-12 enrollment from Fall 2020 (26,051) was lower than Fall 2019 (26,906) and last year’s projected enrollment for 2020-21, it was not used under the assumption that:
• Fall 2020 pupil counts are artificially lower than is reasonable, it is assumed that this is due tofamilies’ decision making around the Covid-19 pandemic
• This drop in enrollment does not represent a long-term trend

4
• To use Fall 2020 enrollment as a starting point for projections would needlessly dampen futureprojected enrollment, which in turn could:
o under-project future enrollmento ill prepare APS in future planning, since under-projecting will lower the expectation for
the budget and staffing resources needed if there is an influx of students in a post-pandemic period
The County and APS collaborate closely on data sharing to produce the enrollment projections. For background on how APS has worked with the County, the community, and consultants to evaluate County and APS methodologies and develop recommendations for the projections process, please see Attachment D of this report.
Note that PreK enrollment is not produced using the same methodology as the projections for K to Grade 12. PreK enrollment is allocated in the budget and managed by the Department of Teaching and Learning only for one year and this figure is held constant throughout the projection years.
Key Findings The new projections show that PreK-Grade 12 enrollment is expected to surpass 30,000 students by 2022-23. When looking at projected enrollment change from 2021 to 2023, the following trends are anticipated at each school level:
• High school enrollment is expected to increase by about 570 students, from approximately8,170 students in 2021-22 to about 8,740 by 2023-24.
• Middle school enrollment could increase by about 80 students from about 6,470 in 2021-22 to6,550 students in 2023-24.
• Elementary school enrollment, excluding PreK, might increase by almost 160 students from13,740 in 2021-22 to 13,900 in 2023-24.
Table 1. PreK to Grade 12 Enrollment Projections for 2021-22 to 2023-24
The Fall 2020 3-year enrollment projections anticipate that, barring the decline in enrollment from 2019 to 2020 (see Chart 1), the PreK to 12 enrollment growth will resume. This resumption in growth will be relatively modest though, since the Fall 2020 enrollment projections do incorporate some of the dampening trends from the 2019 to 2020 period.
2021 2022 2023 Change ('21 to '23) % ChangeElementary 13,735 13,870 13,900 165 1.2%Middle 6,469 6,453 6,551 82 1.3%High 8,171 8,565 8,738 567 6.9%PreK* 1,278 1,278 1,278 0 0.0%
Total 29,653 30,166 30,467 814 2.7%
* Estimate as of December 2020. This figure i s l ikely to change with the AnnualUpdate.

5
Chart 1. PreK to Grade 12 Historic Enrollment for Sept. 30 of 2014 to 2020 and Projected Enrollment for 2021 to 2023
* Enrollment from 2021 to 2023 includes K-12 projections from the Department of Planning and Evaluation and PreK estimatesfor the 2021-22 school year (held constant for 2021 to 2023) are from the Department of Teaching and Learning.
Using the Projections APS updates the enrollment projections annually. This iterative approach allows APS staff to incorporate the most current information on enrollment trends; residential construction activity, such as the possible impact from Amazon’s new headquarters on homebuilding; and demographic change with each new projection.
These three-year projections are done at the school-by-school level. They are not produced at the smaller planning unit level. Planning unit projections are a separate data product which employs a different methodology and are produced only for purposes of school boundary updates. The primary benefit of planning unit-level enrollment projections is that they permit flexibility in combining different planning units to envision new boundary scenarios. Information about the Planning Unit data review methodology is available at www.apsva.us/engage/data-review-for-fall-2020-boundary-process/. Middle and high school planning unit projections will be produced in Spring 2021 to assist with a Fall 2021 boundary process.
6
Glossary
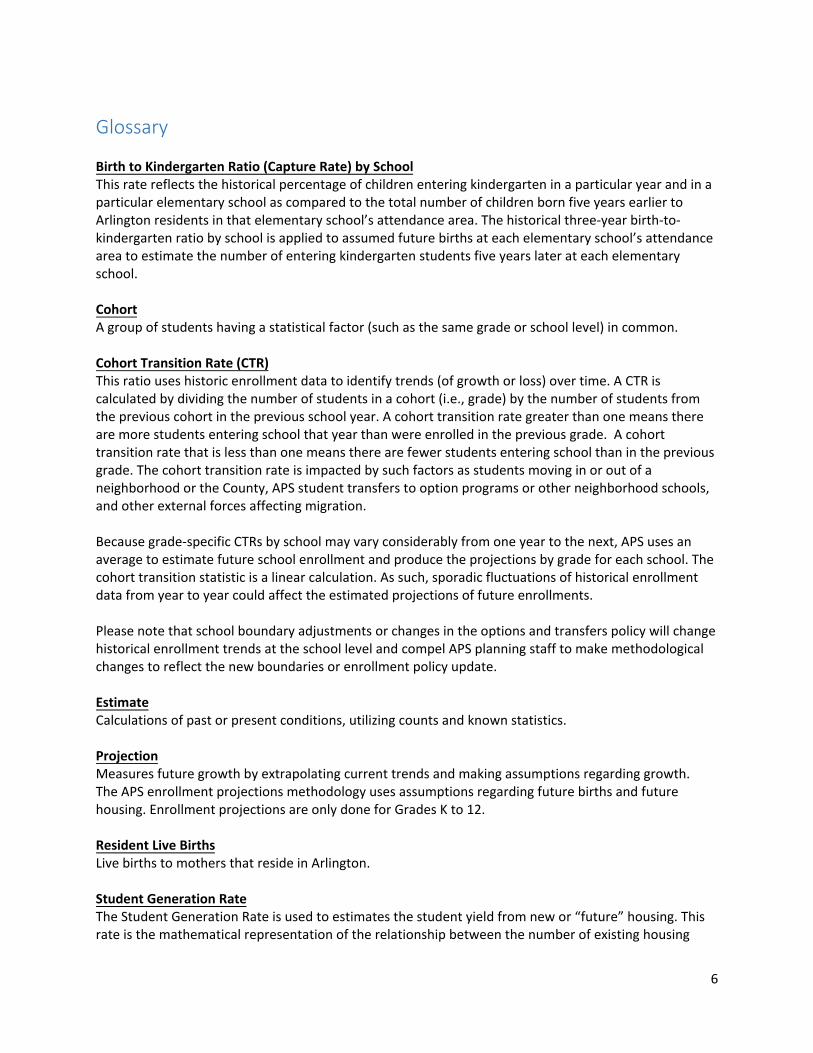
Birth to Kindergarten Ratio (Capture Rate) by School This rate reflects the historical percentage of children entering kindergarten in a particular year and in a particular elementary school as compared to the total number of children born five years earlier to Arlington residents in that elementary school’s attendance area. The historical three-year birth-to-kindergarten ratio by school is applied to assumed future births at each elementary school’s attendance area to estimate the number of entering kindergarten students five years later at each elementary school.
Cohort A group of students having a statistical factor (such as the same grade or school level) in common.
Cohort Transition Rate (CTR) This ratio uses historic enrollment data to identify trends (of growth or loss) over time. A CTR is calculated by dividing the number of students in a cohort (i.e., grade) by the number of students from the previous cohort in the previous school year. A cohort transition rate greater than one means there are more students entering school that year than were enrolled in the previous grade. A cohort transition rate that is less than one means there are fewer students entering school than in the previous grade. The cohort transition rate is impacted by such factors as students moving in or out of a neighborhood or the County, APS student transfers to option programs or other neighborhood schools, and other external forces affecting migration.
Because grade-specific CTRs by school may vary considerably from one year to the next, APS uses an average to estimate future school enrollment and produce the projections by grade for each school. The cohort transition statistic is a linear calculation. As such, sporadic fluctuations of historical enrollment data from year to year could affect the estimated projections of future enrollments.
Please note that school boundary adjustments or changes in the options and transfers policy will change historical enrollment trends at the school level and compel APS planning staff to make methodological changes to reflect the new boundaries or enrollment policy update.
Estimate Calculations of past or present conditions, utilizing counts and known statistics.
Projection Measures future growth by extrapolating current trends and making assumptions regarding growth. The APS enrollment projections methodology uses assumptions regarding future births and future housing. Enrollment projections are only done for Grades K to 12.
Resident Live Births Live births to mothers that reside in Arlington.
Student Generation Rate The Student Generation Rate is used to estimates the student yield from new or “future” housing. This rate is the mathematical representation of the relationship between the number of existing housing

7
units in Arlington County and the number of students—by housing unit type and affordability designation—enrolled at APS on September 30 for a given year. The student generation rate can be calculated each year because of the information sharing between APS (student data by address) and ACG (housing data by parcel). Student Yield The anticipated students estimated from “future” housing units are included in the projections by the impacted neighborhood elementary, middle, and high schools. The projected student yield is calculated using the relevant student generation rates by the housing unit type (i.e., high-rise apartment, garden apartment, town house, etc.) and school attendance zone. The student generation rates by school attendance zones reflect the 2021-22 boundaries. In incorporating the student yield from new development, it is assumed that the yield from newly developed housing units will produce the same number of students every year once the development is finished and habitable. This approach has a cumulative effect that increases projected student enrollment at neighborhood schools that have future housing developments within their school attendance zones. This approach to student yields is applied to incoming cohorts in Kindergarten, Grade 6 and Grade 9. Phasing of Student Yield Student yields from Committed Affordable Units (CAFs)1 and single-family detached homes are incorporated into the enrollment projections in the year that these units are assumed to be built. Student yields from single-family construction permits are incorporated into the projections in the year they are provided by ACG to APS; in the Fall 2020 3-year projections, that is the 2020-21 school year. Meanwhile, the student yield from market rate residential developments, including town homes, were phased into the enrollment projections over a two-year period from the date that a residential development is forecast to be completed.
1 These units are guaranteed by agreement with the federal, state, or County Government, or through mechanisms such as tax-exempt financing, to remain affordable to low and moderate income households for a specified period of time; generally 30 to 60 years. Rents in most cases are affordable to households earning 60% or less of the Area Median Income, although some CAFs have rents affordable to households earning up to 80% of median. See, https://housing.arlingtonva.us/affordable-housing/what-is-affordable/
8
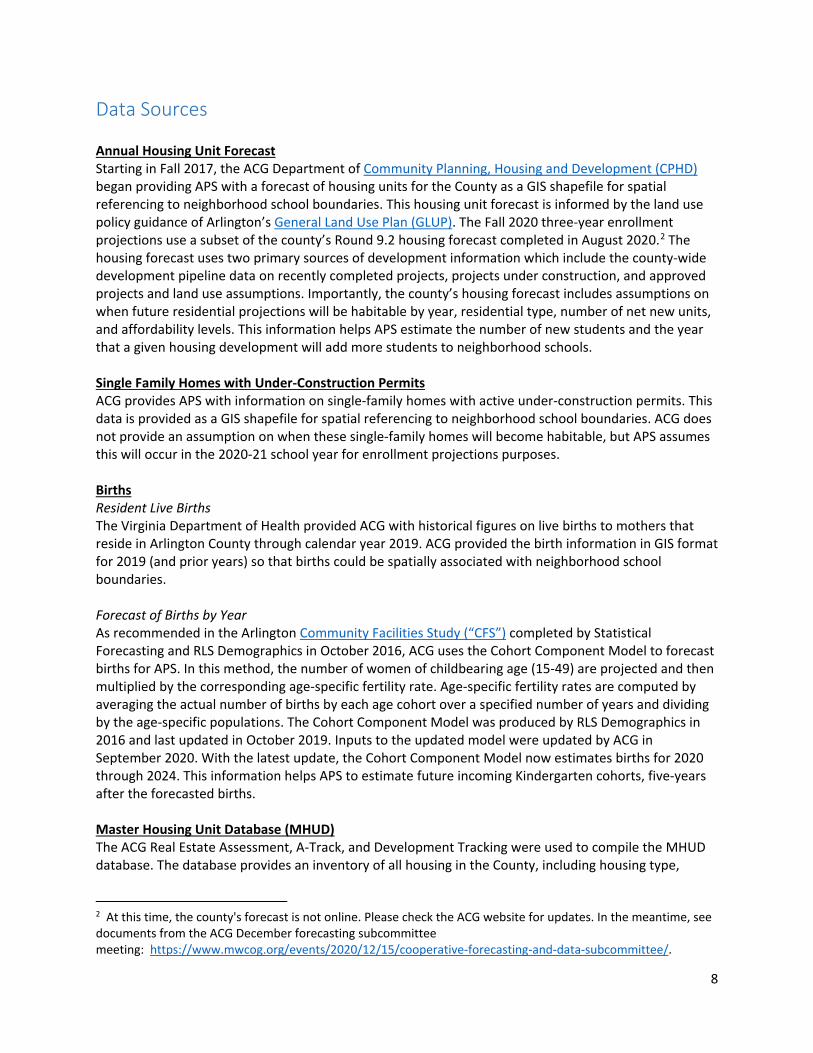
Data Sources Annual Housing Unit Forecast Starting in Fall 2017, the ACG Department of Community Planning, Housing and Development (CPHD) began providing APS with a forecast of housing units for the County as a GIS shapefile for spatial referencing to neighborhood school boundaries. This housing unit forecast is informed by the land use policy guidance of Arlington’s General Land Use Plan (GLUP). The Fall 2020 three-year enrollment projections use a subset of the county’s Round 9.2 housing forecast completed in August 2020.2 The housing forecast uses two primary sources of development information which include the county-wide development pipeline data on recently completed projects, projects under construction, and approved projects and land use assumptions. Importantly, the county’s housing forecast includes assumptions on when future residential projections will be habitable by year, residential type, number of net new units, and affordability levels. This information helps APS estimate the number of new students and the year that a given housing development will add more students to neighborhood schools. Single Family Homes with Under-Construction Permits ACG provides APS with information on single-family homes with active under-construction permits. This data is provided as a GIS shapefile for spatial referencing to neighborhood school boundaries. ACG does not provide an assumption on when these single-family homes will become habitable, but APS assumes this will occur in the 2020-21 school year for enrollment projections purposes. Births Resident Live Births The Virginia Department of Health provided ACG with historical figures on live births to mothers that reside in Arlington County through calendar year 2019. ACG provided the birth information in GIS format for 2019 (and prior years) so that births could be spatially associated with neighborhood school boundaries. Forecast of Births by Year As recommended in the Arlington Community Facilities Study (“CFS”) completed by Statistical Forecasting and RLS Demographics in October 2016, ACG uses the Cohort Component Model to forecast births for APS. In this method, the number of women of childbearing age (15-49) are projected and then multiplied by the corresponding age-specific fertility rate. Age-specific fertility rates are computed by averaging the actual number of births by each age cohort over a specified number of years and dividing by the age-specific populations. The Cohort Component Model was produced by RLS Demographics in 2016 and last updated in October 2019. Inputs to the updated model were updated by ACG in September 2020. With the latest update, the Cohort Component Model now estimates births for 2020 through 2024. This information helps APS to estimate future incoming Kindergarten cohorts, five-years after the forecasted births. Master Housing Unit Database (MHUD) The ACG Real Estate Assessment, A-Track, and Development Tracking were used to compile the MHUD database. The database provides an inventory of all housing in the County, including housing type,
2 At this time, the county's forecast is not online. Please check the ACG website for updates. In the meantime, see documents from the ACG December forecasting subcommittee meeting: https://www.mwcog.org/events/2020/12/15/cooperative-forecasting-and-data-subcommittee/.
9
number of units, details on the number of CAF, and affordability classification for each complex (CAF only, Market Rate, or Mixed), and the presence of an approved Accessory Dwelling Unit (ADU) on a residential parcel. This information helps APS to develop student generation rates by housing unit type and school level. The Student Generation Rate is a mathematical representation of the relationship between housing units in Arlington County and the number of students enrolled in Arlington Public Schools on September 30 of each year. In other words, it is a factor applied to new housing to estimate the expected number of enrolled students from the new housing; this is specific to the building’s location (relevant neighborhood elementary, middle, or high school boundary), housing type, and affordability characteristics. September 30 Official Enrollment Count Historical September 30 enrollment counts, by grade for each school, are used to develop the cohort progression ratios that estimate future enrollment. The data comes from the APS Monthly Membership Report for the month of September, which is prepared by the Information Services Department, see https://www.apsva.us/statistics/monthly-enrollment/. This data is analyzed by school and by grade for purposes of developing historical enrollment trends. In addition, APS staff has access to address level enrollment information from September 30. This information is relevant for assessing enrollment trends when boundary changes occur, see “Assumptions and Methodology” section. In the Fall 2020 3-year enrollment projections, September 30, 2019 enrollment is used as a basis for enrollment projections. The September 30, 2020 enrollment was not used, see Preparing this Report section (page 3).
10
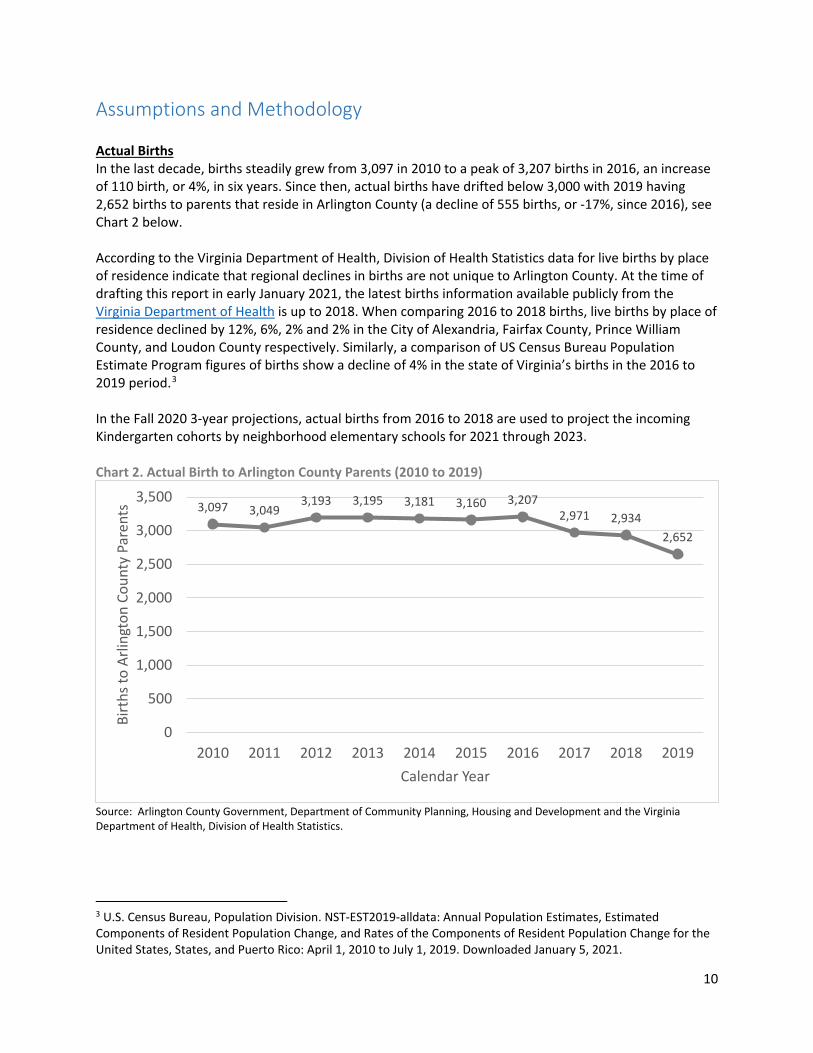
Assumptions and Methodology Actual Births In the last decade, births steadily grew from 3,097 in 2010 to a peak of 3,207 births in 2016, an increase of 110 birth, or 4%, in six years. Since then, actual births have drifted below 3,000 with 2019 having 2,652 births to parents that reside in Arlington County (a decline of 555 births, or -17%, since 2016), see Chart 2 below. According to the Virginia Department of Health, Division of Health Statistics data for live births by place of residence indicate that regional declines in births are not unique to Arlington County. At the time of drafting this report in early January 2021, the latest births information available publicly from the Virginia Department of Health is up to 2018. When comparing 2016 to 2018 births, live births by place of residence declined by 12%, 6%, 2% and 2% in the City of Alexandria, Fairfax County, Prince William County, and Loudon County respectively. Similarly, a comparison of US Census Bureau Population Estimate Program figures of births show a decline of 4% in the state of Virginia’s births in the 2016 to 2019 period.3 In the Fall 2020 3-year projections, actual births from 2016 to 2018 are used to project the incoming Kindergarten cohorts by neighborhood elementary schools for 2021 through 2023. Chart 2. Actual Birth to Arlington County Parents (2010 to 2019)
Source: Arlington County Government, Department of Community Planning, Housing and Development and the Virginia Department of Health, Division of Health Statistics.
3 U.S. Census Bureau, Population Division. NST-EST2019-alldata: Annual Population Estimates, Estimated Components of Resident Population Change, and Rates of the Components of Resident Population Change for the United States, States, and Puerto Rico: April 1, 2010 to July 1, 2019. Downloaded January 5, 2021.
3,097 3,0493,193 3,195 3,181 3,160 3,207
2,971 2,9342,652
0
500
1,000
1,500
2,000
2,500
3,000
3,500
2010 2011 2012 2013 2014 2015 2016 2017 2018 2019
Birt
hs to
Arli
ngto
n Co
unty
Par
ents
Calendar Year
11
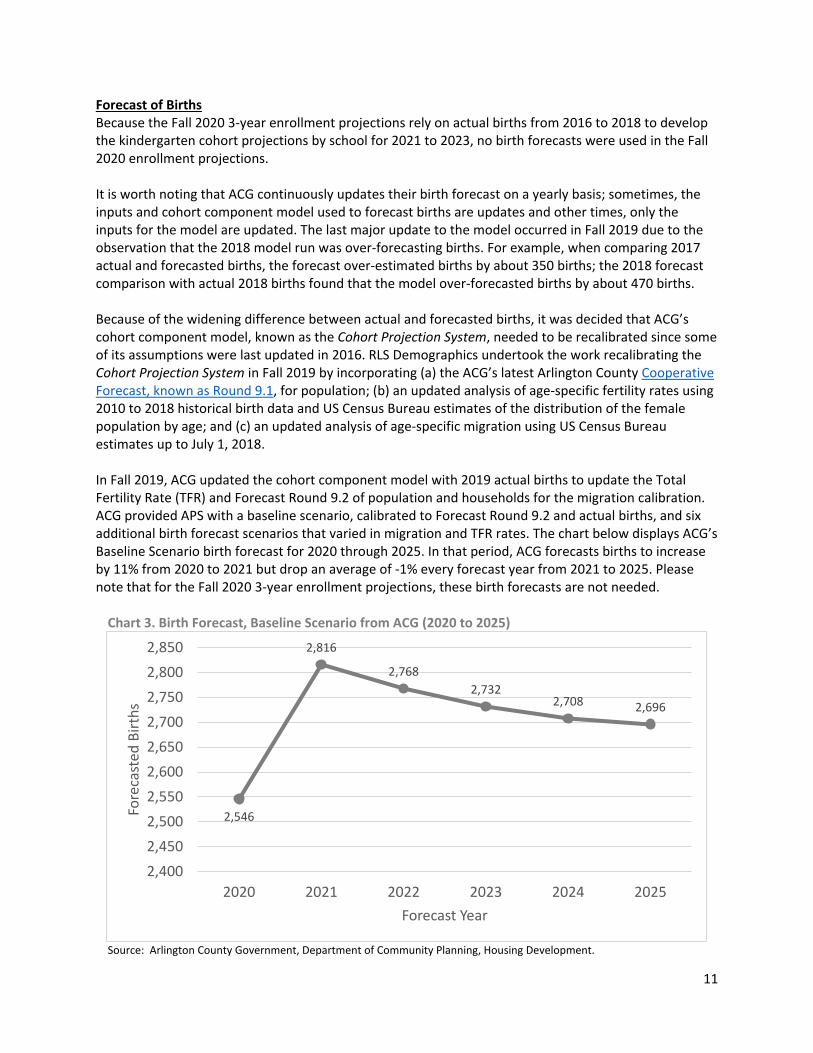
Forecast of Births Because the Fall 2020 3-year enrollment projections rely on actual births from 2016 to 2018 to develop the kindergarten cohort projections by school for 2021 to 2023, no birth forecasts were used in the Fall 2020 enrollment projections. It is worth noting that ACG continuously updates their birth forecast on a yearly basis; sometimes, the inputs and cohort component model used to forecast births are updates and other times, only the inputs for the model are updated. The last major update to the model occurred in Fall 2019 due to the observation that the 2018 model run was over-forecasting births. For example, when comparing 2017 actual and forecasted births, the forecast over-estimated births by about 350 births; the 2018 forecast comparison with actual 2018 births found that the model over-forecasted births by about 470 births. Because of the widening difference between actual and forecasted births, it was decided that ACG’s cohort component model, known as the Cohort Projection System, needed to be recalibrated since some of its assumptions were last updated in 2016. RLS Demographics undertook the work recalibrating the Cohort Projection System in Fall 2019 by incorporating (a) the ACG’s latest Arlington County Cooperative Forecast, known as Round 9.1, for population; (b) an updated analysis of age-specific fertility rates using 2010 to 2018 historical birth data and US Census Bureau estimates of the distribution of the female population by age; and (c) an updated analysis of age-specific migration using US Census Bureau estimates up to July 1, 2018. In Fall 2019, ACG updated the cohort component model with 2019 actual births to update the Total Fertility Rate (TFR) and Forecast Round 9.2 of population and households for the migration calibration. ACG provided APS with a baseline scenario, calibrated to Forecast Round 9.2 and actual births, and six additional birth forecast scenarios that varied in migration and TFR rates. The chart below displays ACG’s Baseline Scenario birth forecast for 2020 through 2025. In that period, ACG forecasts births to increase by 11% from 2020 to 2021 but drop an average of -1% every forecast year from 2021 to 2025. Please note that for the Fall 2020 3-year enrollment projections, these birth forecasts are not needed.
Chart 3. Birth Forecast, Baseline Scenario from ACG (2020 to 2025)
Source: Arlington County Government, Department of Community Planning, Housing Development.
2,546
2,816
2,7682,732
2,708 2,696
2,4002,4502,5002,5502,6002,6502,7002,7502,8002,850
2020 2021 2022 2023 2024 2025
Fore
cast
ed B
irths
Forecast Year

12
Birth to Kindergarten Ratio by School The birth-to-kindergarten ratio is defined as the percentage of children entering kindergarten in a particular year as compared to the total number of children born five years earlier to Arlington County parents. System-wide, the birth-to-kindergarten ratio has hovered close to 70%. As noted earlier, the COVID-19 pandemic contributed to overall 2020 enrollment dropping relative to 2019 enrollment, see Preparing this Report section (pg. 3). This also impacted kindergarten enrollment which dropped by about 12% from 2019 to 2020. Because of this 2020 drop in kindergarten enrollment, the system-wide birth-to-kindergarten ratio dropped 0.079 when comparing 2015 births and 2020 enrollment—a drop of this magnitude has not been experienced among the birth-to-kindergarten ratios from the last five years.
Table 2. Historical birth to kindergarten ratios Birth Year Resident
Births School Year
Entering Grade K Actual APS
Grade K Enrollment
Birth to Kindergarten
Ratio (Capture Rate)
2010 3,097 2015 2,152 0.695 2011 3,049 2016 2,127 0.698 2012 3,193 2017 2,253 0.706 2013 3,195 2018 2,293 0.718 2014 3,181 2019 2,231 0.701 2015 3,160 2020 1,966 0.622
Source: APS, Department of Planning and Evaluation and Arlington County Government, Department of Community Planning, Housing Development.
Prior to Fall 2020, the birth-to-kindergarten ratios were calculated system-wide and used as a key input in the enrollment projections. This is no longer the case; starting with the Fall 2020 3-year enrollment projections, the birth-to-kindergarten ratio is calculated school-by-school at the elementary level. This is done in this process as follows:
• Matching (by address) and quantifying births that occurred in 2013, 2014, and 2015 to 2021-22 school year elementary school attendance zones (including McKinley at Reed and the new neighborhood elementary school at the Key site)
• Matching (by address) and quantifying the kindergarten students in 2018, 2019, and 2020 to 2021-22 school year elementary school attendance zones. For the six school that will have adjusted or new elementary school boundaries, (see https://www.apsva.us/engage/fall2020elementaryboundaries/,) the 2018, 2019, and 2020 kindergarten students were matched to the adjusted or new boundaries if they attended their formerly assigned neighborhood school or transferred in from another neighborhood school.
• 2021-22 school specific ratios were developed for three periods of time and weights applied: o Ratio of 2018 kindergarten enrollment to 2013 births, with a 40% weight o Ratio of 2019 kindergarten enrollment to 2014 births, with a 40% weight o Ratio of 2020 kindergarten enrollment to 2015 births, with a 20% weight o When calculating a 3-year average of birth-to-kindergarten ratio by individual school,
weights are applied. The weighted average emphasizes 2018 kindergarten enrollment and 2013 births and 2019 kindergarten enrollment and 2014 birth, which are pre-
13
COVID-19 pandemic periods, with 40% weights respectively. At the same time the weighted average incorporates the dampening effect of the 2020 kindergarten enrollment, but de-emphasizes this effect by giving the 2020 kindergarten enrollment and 2015 birth ratio a 20% weight.
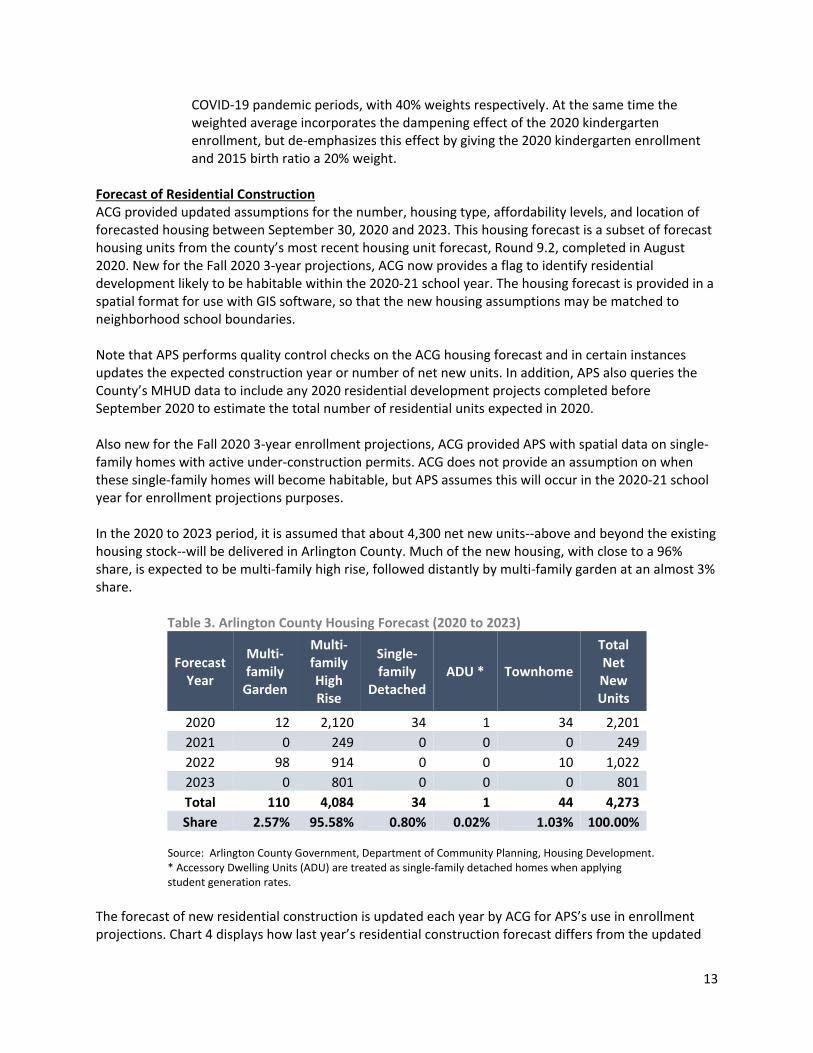
Forecast of Residential Construction ACG provided updated assumptions for the number, housing type, affordability levels, and location of forecasted housing between September 30, 2020 and 2023. This housing forecast is a subset of forecast housing units from the county’s most recent housing unit forecast, Round 9.2, completed in August 2020. New for the Fall 2020 3-year projections, ACG now provides a flag to identify residential development likely to be habitable within the 2020-21 school year. The housing forecast is provided in a spatial format for use with GIS software, so that the new housing assumptions may be matched to neighborhood school boundaries. Note that APS performs quality control checks on the ACG housing forecast and in certain instances updates the expected construction year or number of net new units. In addition, APS also queries the County’s MHUD data to include any 2020 residential development projects completed before September 2020 to estimate the total number of residential units expected in 2020. Also new for the Fall 2020 3-year enrollment projections, ACG provided APS with spatial data on single-family homes with active under-construction permits. ACG does not provide an assumption on when these single-family homes will become habitable, but APS assumes this will occur in the 2020-21 school year for enrollment projections purposes. In the 2020 to 2023 period, it is assumed that about 4,300 net new units--above and beyond the existing housing stock--will be delivered in Arlington County. Much of the new housing, with close to a 96% share, is expected to be multi-family high rise, followed distantly by multi-family garden at an almost 3% share.
Table 3. Arlington County Housing Forecast (2020 to 2023)
Forecast Year
Multi-family
Garden
Multi-family High Rise
Single-family
Detached ADU * Townhome
Total Net New Units
2020 12 2,120 34 1 34 2,201 2021 0 249 0 0 0 249 2022 98 914 0 0 10 1,022 2023 0 801 0 0 0 801 Total 110 4,084 34 1 44 4,273 Share 2.57% 95.58% 0.80% 0.02% 1.03% 100.00%
Source: Arlington County Government, Department of Community Planning, Housing Development. * Accessory Dwelling Units (ADU) are treated as single-family detached homes when applying student generation rates.
The forecast of new residential construction is updated each year by ACG for APS’s use in enrollment projections. Chart 4 displays how last year’s residential construction forecast differs from the updated
14
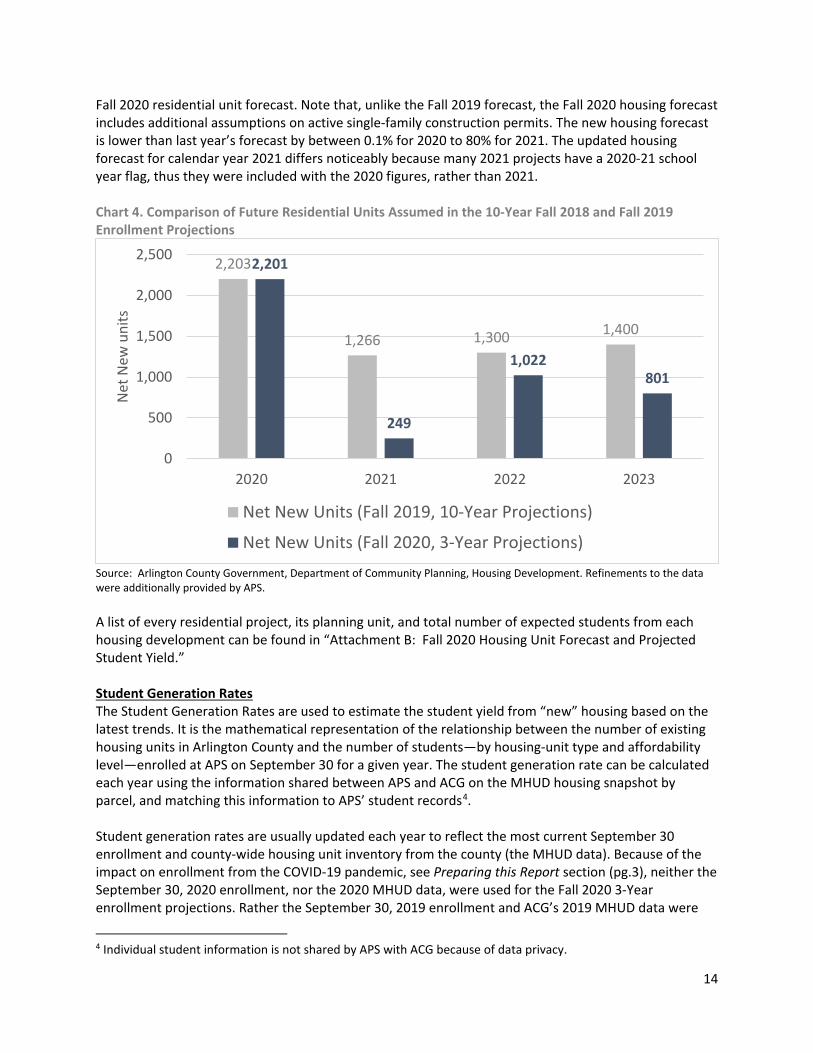
Fall 2020 residential unit forecast. Note that, unlike the Fall 2019 forecast, the Fall 2020 housing forecast includes additional assumptions on active single-family construction permits. The new housing forecast is lower than last year’s forecast by between 0.1% for 2020 to 80% for 2021. The updated housing forecast for calendar year 2021 differs noticeably because many 2021 projects have a 2020-21 school year flag, thus they were included with the 2020 figures, rather than 2021. Chart 4. Comparison of Future Residential Units Assumed in the 10-Year Fall 2018 and Fall 2019 Enrollment Projections
Source: Arlington County Government, Department of Community Planning, Housing Development. Refinements to the data were additionally provided by APS. A list of every residential project, its planning unit, and total number of expected students from each housing development can be found in “Attachment B: Fall 2020 Housing Unit Forecast and Projected Student Yield.” Student Generation Rates The Student Generation Rates are used to estimate the student yield from “new” housing based on the latest trends. It is the mathematical representation of the relationship between the number of existing housing units in Arlington County and the number of students—by housing-unit type and affordability level—enrolled at APS on September 30 for a given year. The student generation rate can be calculated each year using the information shared between APS and ACG on the MHUD housing snapshot by parcel, and matching this information to APS’ student records4. Student generation rates are usually updated each year to reflect the most current September 30 enrollment and county-wide housing unit inventory from the county (the MHUD data). Because of the impact on enrollment from the COVID-19 pandemic, see Preparing this Report section (pg.3), neither the September 30, 2020 enrollment, nor the 2020 MHUD data, were used for the Fall 2020 3-Year enrollment projections. Rather the September 30, 2019 enrollment and ACG’s 2019 MHUD data were
4 Individual student information is not shared by APS with ACG because of data privacy.
2,203
1,266 1,300 1,400
2,201
249
1,022801
0
500
1,000
1,500
2,000
2,500
2020 2021 2022 2023
Net
New
uni
ts
Net New Units (Fall 2019, 10-Year Projections)
Net New Units (Fall 2020, 3-Year Projections)

15
used. Note that the 2019-based student generation rates are different from those published last year with the Fall 2019 Ten-Year Enrollment Projections report, due to:
• The student generation rate table was updated to reflect the adjusted or new elementary school boundaries for the 2021-22 school year
• One residential project in the 2019 MHUD file was reclassified from Multi-Family Elevator CAF Only to Multi-Family Garden CAF Only. This is the new neighborhood school at Key attendance area in the Fall 2020 report and student generation rate tables (formerly this building would have been in the Arlington Science Focus School boundary).
Table 4 displays the county-wide Student Generation Rates for twelve combinations of housing types and affordability levels for illustrative purposes. Note that in the enrollment projections, county-wide rates are only used when a forecasted housing-unit type does not currently exist in a neighborhood school boundary area, thus there is no generation rate for that housing type in that boundary area. The highest student generation rate factor in the county is for Multi-family Elevator CAF Only residential buildings, with a rate of 0.688; note, however, that this housing type represents a fraction of the county’s 2019 housing stock, with a share of 0.48%. Meanwhile, the housing type with the largest share of all housing, at nearly a quarter, is Single-Family Detached homes. This housing type has the third-highest student generation rate factor at 0.498. Table 4. County-Wide Student Generation Rates Used in the Fall 2020 3-Year Enrollment Projections
1 Excludes Apartment Elevator Senior Housing. 2 The Fall 2019 Student Generation Rates were amended in Fall 2020 to reflect that 50 units had been mistakenly classified as Multi-family Elevator CAF Only. In Fall 2020, these 50 units were re-classified as Multi-family Garden CAF Only. Source: APS, Department of Planning and Evaluation. Sept. 30, 2019 student enrollment and 2019 Master Housing Unit Database (MHUD) records. The student generation rate by school level, neighborhood school boundary, housing type, and affordability level is included with “Attachment C: Fall 2020 Student Generation Rates.” Note that similar to the Fall 2019 report, the Fall 2020 Student Generation Rate factors include a field for “Single Family Detached with Accessory Dwelling.” Although ACG provided this information to APS, ACG requested that analysis which uses this housing designation not be published yet, pending further refinements to the addresses for accessory dwelling units that share a parcel with a single family detached home.
Projection Approaches by School Level
Each enrollment projection uses historical student counts as the base data--or starting point--from which to project forward in time. It is this base data that is applied to cohort transition rates (for example to age a Grade 4 student into a Grade 5 student) or is added to students estimated to reside in future residential units. As noted earlier in the Preparing This Report section (p. 3), the Fall 2020 3-Year
K-12SingleFamily
Detached
Single FamilyDetached with
Accessory DwellingTownhome Duplex
MarketRate
MixedIncome
CAFOnly 1 2
MarketRate
MixedIncome
CAFOnly
Elevator GardenTotal bySchool
Total 0.498 N/A 0.214 0.345 0.066 0.127 0.688 0.254 0.383 0.627 0.055 0.113 0.232
2019 Master Housing Unit Database (MHUD) housing by type shares 1
24.09% 0.03% 3.77% 2.27% 25.24% 7.86% 0.48% 8.55% 1.88% 3.04% 12.78% 10.00% 100.00%
Multi-family Elevator Multi-family Garden Condo

16
enrollment projections do not use the September 30, 2020 enrollment as a base for projecting neighborhood school enrollment; instead, the September 30, 2019 enrollment is used. The following content in this report describes the assumptions used to graduate September 30, 2019 enrolled students into the next grade from 2020 through 2021, although the 2020 figures are not published. It also describes the assumption of how births that occurred between 2015 and 2018 are used to estimate kindergarten enrollees by school in 2020-2023. In addition, the Fall 2020 3-Year enrollment projections are based on the boundaries that will be effective in 2021-22, including the adjusted and new neighborhood elementary school boundaries approved by the School Board in December 2020. In accordance, the Fall 2020 projections redistribute Grades K-5 enrollment on September 30, 2019, to conform to the adjusted and new elementary school boundaries. Elementary School Assumptions:
Elementary Neighborhood Schools Enrollment Assumptions: • To project enrollment at neighborhood elementary schools, the Sept. 30, 2019 enrollment is
used as a base, or starting point, for the Fall 2020 3-Year enrollment projections. Ordinarily, September 30, 2020 enrollment would be used, but due to the COVID-19 pandemic’s effect on enrollment, it was not used in the Fall 2020 3-Year projections, see Preparing this Report section (p. 3).
• Incoming Kindergarten cohorts by neighborhood schools for 2021 to 2023 was determined through the following new process:
o In order to develop birth-to-kindergarten ratios by school, it requires associating historical births and kindergarten enrollment to the 2021-22 neighborhood elementary boundaries. GIS software was used to match (by address) births that occurred in 2013, 2014, and 2015 to 2021-22 school year elementary school attendance zones (including for McKinley at Reed and the new school at the Key site). The number of births in 2013, 2014, and 2015 are then quantified by the 2021-22 school year elementary school boundaries.
o Similarly, kindergarten enrollment that occurred five years later—in 2018, 2019, and 2020—needs to be spatially matched to 2021-22 elementary school boundaries. For this purpose, historical kindergarten students’ addresses are used. In addition, for the 2018, 2019, and 2020 kindergarten students whose addresses are matched to adjusted or new elementary school boundaries, they are retroactively matched to the relevant adjusted or new neighborhood school boundaries if they attended their formerly assigned neighborhood school or transferred in from another neighborhood school.
o Once historical births and kindergarten enrollment are matched to 2021-22 neighborhood elementary school boundaries, they are used to calculate Birth-to-kindergarten ratios specific to each neighborhood elementary. The combination of historical births and kindergarten enrollment used include: Ratio of 2013 births to 2018 kindergarten enrollment by 2021-22 neighborhood
elementary school Ratio of 2014 births to 2019 kindergarten enrollment by 2021-22 neighborhood
elementary school
17
Ratio of 2015 births to 2020 kindergarten enrollment by 2021-22 neighborhood elementary school
o A neighborhood elementary school specific weighted 3-year average birth-to-kindergarten ratio is then calculated. The ratio of 2013 births to 2018 kindergarten enrollment is assigned a 40% weight in the 3-year average. The ratio of 2014 births to 2019 kindergarten enrollment is assigned a 40% weight. And, the 2015 births to 2020 kindergarten enrollment is assigned a 20% weight. The weights were developed to de-emphasize 2015 births to 2020 kindergarten enrollment ratio, since 2020 enrollment was affected by the COVID-19 pandemic.
o Another calculation using the historical 2013, 2014, and 2015 birth information assigned to neighborhood elementary boundaries for 2021-22 assesses each neighborhood school’s share of births for each year. Once these shares are established, a 3-year weighted average of each school’s shares of births is calculated. The weights are 40% for each school’s share of 2013 births, 40% for each school’s share of 2014 births, and 20% for each school’s share of 2015 births.
o The incoming Kindergarten cohorts for each neighborhood elementary school in 2021 to 2023 is calculated by: Multiplying each school’s 3-year weighted average of share of births by the
number of births five years prior. Example: Nottingham’s share of births x total 2016 births = 2016 weighted average estimate of births in the Nottingham attendance zone
Then, multiply this product by the weighted average birth to kindergarten ratio specific to each school. Example: The 2016 weighted average estimate of births in the Nottingham attendance zone x Nottingham’s 3-year weighted average birth to kindergarten ratio = the number of incoming kindergarten students five years later in 2021 at Nottingham
• Neighborhood school CTRs: o For neighborhood elementary schools that will have adjusted or new boundaries in the
2021-22 school year, the September 30 enrollment in 2020, 2019, 2018, and 2017 had to be redistributed to conform to the new or adjusted boundaries. This redistribution primarily applied to students whose home address in 2020, 2019, 2018, or 2017 spatially matches the neighborhood school boundaries for Arlington Science Focus School, Ashlawn, McKinley at Reed, the new school at the Key site, Taylor or Tuckahoe for the 2021-22 school year. These students were retroactively matched to the relevant adjusted or new neighborhood boundary if they attended their formerly assigned neighborhood school or transferred in from another neighborhood school. Once enrollment for Grades K-5 is established by the 2021-22 boundaries for 2020, 2019, 2018, and 2017, the 3-year weighted CTRs are calculated based on the following weights: 42.5% for CTRs between 2018 and 2017 42.5% for CTRs between 2019 and 2018 15.0% for CTRs between 2020 and 2019 (the lower weight is to de-emphasize
the 2020 enrollment which was impacted by the COVID-19 pandemic, while still acknowledging its possible impact to future enrollment trends)
18
o For neighborhood elementary schools that had a boundary adjustment which took effect as of the 2019-20 school year—this includes Abingdon, Alice West Fleet, Barcroft, Dr. Charles Drew, Hoffman-Boston, Long Branch, and Oakridge—the Sept. 30, 2019 and 2020 enrollment figures reflect the adjusted or new boundaries. In order to calculate CTRs, the 2017 and 2018 enrollment for Grades K-5 had to be retroactively redistributed to conform to the new or adjusted boundaries. This only affected students with home addresses in 2017 and 2018 that matched one of the adjusted or new elementary boundaries for the 2019-20 school year and attended a neighborhood school in 2017 and 2018. Once the Sept. 30 enrollments in 2017, 2018, 2019, and 2020 refer to the same boundaries, the 3-year weighted CTRs are calculated based on the following weights: 42.5% for CTRs between 2018 and 2017 42.5% for CTRs between 2019 and 2018 15.0% for CTRs between 2020 and 2019 (the lower weight is to de-emphasize
the 2020 enrollment which was impacted by the COVID-19 pandemic, while still acknowledging its possible impact to future enrollment trends)
o For all other elementary schools where no historical enrollment redistribution was needed—because they did not experience a boundary change in 2019-20 or will experience a boundary change in 2021-22—the historical Sept. 30 enrollment for Grades K-5 in 2017, 2018, 2019, and 2020 was used. CTRs were calculated based on the following weights: 42.5% for CTRs between 2018 and 2017 42.5% for CTRs between 2019 and 2018 15.0% for CTRs between 2020 and 2019 (the lower weight is to de-emphasize
the 2020 enrollment which was impacted by the COVID-19 pandemic, while still acknowledging its possible impact to future enrollment trends)
• In addition, adjustments to 2020 and 2021 enrollment figures were performed to account for sibling/grandfathering and the Fort Myer CDC exceptions, both items approved by the School Board on December 6, 2018.
Elementary Option Schools Enrollment Assumptions:
• For projections from 2021-22 to 2023-24, the incoming Kindergarten (K) cohorts at all elementary options schools are based on the K cohort assumed in the “Spring 1-Year Projections Update for the 2020-21 School Year” student estimate, see https://www.apsva.us/wp-content/uploads/2020/03/2020-03-19-Spring-Update-2020-21_for_website.pdf. This initial information, though, is updated to reflect:
o In the 2021-22 School Year, Arlington Traditional will have an increase of class size for Grades K-3 from 24 to 25 pupils per classroom and for Grades 4-5 from 25 to 26 pupils per classroom. Consequently, starting in 2021-22, the Grade 1-5 enrollment for Arlington Traditional keeps the number of classroom assumptions from the Spring 1-Year Projections Update for the 2020-21 school year, but applies the new students-per-pupil factor.
19
• For Campbell, Claremont Immersion, Key Immersion, and the Montessori Public School of Arlington, the base used is the September 30, 2020 enrollment. To this enrollment, starting in 2021-22, the following CTRs are applied:
o Campbell, Claremont Immersion, Key Immersion use a three-year weighted average CTR which emphasize enrollment trends between 2017 to 2018 and 2018 to 2019, but de-emphasize the 2019 to 2020 period that was affected by the COVID-19 pandemic. The weights applied are 42.5% for 2017 to 2018, 42.5% for 2018 to 2019, and 15% for the 2019 to 2020 period. The use of this 3-year average weighted CTR provides for fluctuations in enrolled cohorts between grades and years, with some grade-to-grade transitions having net gains or net losses in enrollment over time.
o Montessori Public School of Arlington’s cohorts are applied a 1.0 CTR. This CTR assumes that if a student exits the program, then another student can be enrolled in the program from the waiting list; there is no attrition assumed for this program as cohorts graduate from one grade to the next grade.
• Similarly, a CTR of 1.0 is also applied to 2022-23 to 2023-24 at Arlington Traditional. Again, with a CTR of 1.0 the assumption is that the program’s classrooms can accommodate the maximum number of students at any one time because of its extensive wait list.
Middle School Assumptions:
Neighborhood Middle School Enrollment Assumptions: • Similar to the approach used for neighborhood elementary schools, the Sept. 30, 2019
enrollment is used as a base, or starting point, for the Fall 2020 3-Year Middle School enrollment projections. As noted earlier in the Preparing This Report section (pg. 3), September 30, 2020 enrollment is not used as a base because it is lower than anticipated and diverges from recent enrollment trends, given the impact from the COVID-19 pandemic.
• Incoming Grade 6 students were estimated using the following approach: o The first step in this process is to identify Grade 5 students that reside in neighborhood
Middle School boundaries because they will eventually become incoming Grade 6 students.
o Enrolled Grade 5 students from September 30, 2019 were matched by home address to neighborhood Middle School boundaries which took effect in the 2019-20 school year.
o Students enrolled in Grades 5, 4, 3, and 2 students on September 30, 2020 were also matched by home address to neighborhood Middle School boundaries which took effect in the 2019-20 school year. The Grade 4 students will be in Grade 5 in 2021, the Grade 3 students will be in Grade 5 in 2022, and the Grade 2 students will be in Grade 5 in 2023.
o Because the students in Grades 4, 3, and 2 assigned to Middle School boundaries need to be aged into Grade 5, a combination of county-wide 3-year average cohort transition rates (42.5% for 2017 to 2018, 42.5% for 2018 to 2019, and 15% for 2019 to 2020) is used. To age Grade 4 students to Grade 5, the county-wide 4 to 5 CTR 3-year weighted average is applied. To age the Grade 3 students to Grade 5, the county-wide Grade 3 to 4 and Grade 4 to 5 CTR 3-year weighted average is applied. To age the Grade 2 students to Grade 5, the county-wide Grade 2 to 3, Grade 3 to 4, and Grade 4 to 5 CTR 3-year weighted average is applied.
20
o Once there are Grade 5 student estimates available for neighborhood middle school boundaries from 2019 to 2023, they need to be aged into Grade 6 by applying middle school specific Grade 5 to 6 CTRs. These CTRs are based on the ratio of Grade 5 students residing within a middle school’s neighborhood boundaries one year and how many Grade 6 students are enrolled within that middle school’s neighborhood boundaries the following year. This CTR is a 3-year weighted average of Grade 5 in 2017 to Grade 6 in 2018 (42.5% weight), Grade 5 in 2018 and Grade 6 in 2019 (42.5% weight), and Grade 5 in 2019 and Grade 6 in 2020 (15% weight).
o The Grade 5 to 6 3-year weighted average CTR is applied to historical or projected Grade 5 students to estimate Grade 6 students in the following year. This CTR was applied to the following Grade 5 students to estimate future Grade 6 students: Grade 5 students in 2019 that might enroll in Grade 6 in 2020 Grade 5 students in 2020 that might enroll in Grade 6 in 2021 Grade 5 students in 2021 that might enroll in Grade 6 in 2022 Grade 5 students in 2022 that might enroll in Grade 6 in 2023
• Projecting Grades 7 and 8: o In order to project the number of Grade 7 and 8 students, CTRs for Grade 6 to 7 and
Grade 7 to 8 must be established by neighborhood middle school to, for example, age the estimated Grade 6 students into Grade 7. As part of calculating CTRs, students in Grades 6, 7, and 8 at neighborhood middle schools on September 30 of 2017 and 2018 are matched retroactively by home address to 2019-20 neighborhood middle school boundaries. This step is not needed for enrollees from September 30, 2019 and 2020 since they are already assigned to a neighborhood middle school that reflects the 2019-20 middle school boundaries.
o From these enrollment figures, CTRs are calculated for Grade 6 to 7 and Grade 7 to 8 by neighborhood middle school. The Grade 6 to 7 CTR is a 3-year weighted average of Grade 6 in 2017 to Grade 7 in 2018 (42.5% weight); Grade 6 in 2018 and Grade 7 in 2019 (42.5% weight), and Grade 6 in 2019 and Grade 7 in 2020 (15% weight). Similarly, the Grade 7 to 8 CTR is a 3-year weighted average of Grade 7 in 2017 to Grade 8 in 2018 (42.5% weight); Grade 7 in 2018 and Grade 8 in 2019 (42.5% weight), and Grade 7 in 2019 and Grade 8 in 2020 (15% weight).
o These school specific CTRs are then applied starting with the Grade 6 enrollment for September 30, 2019 which is graduated to Grade 7 using the relevant school’s Grade 6 to 7 3-year weighted average CTR. Similarly, Grade 7 enrollment for September 30, 2019, by neighborhood school is graduated to Grade 8 using the relevant school’s Grade 7 to 8 3-year weighted average CTR. This process is repeated in subsequent projection year, for example the school specific CTR for Grade 6 to 7 is applied to the relevant school’s Grade 6 estimate (see above section to learn more about Grade 6 estimates for neighborhood middle schools).
Option Middle Schools/Programs: • Eunice Kennedy Shriver program’s enrollment estimates for Grades 6, 7, and 8 was provided
by the APS Department of Teaching and Learning, Secondary Special Education in November 2020. The enrollment estimates for Grades 6, 7, and 8 are used in each projection year, from 2021 to 2023.
21
• H-B Woodlawn’s incoming Grade 6 cohort is assumed to be the same as that from the Spring 1-Year Projections Update for the 2020-21 School Year.
• H-B Woodlawn uses a 3-year weighted average CTR for Grades 6 to 7 and 7 to 8. The Grade 6 to 7 CTR is a 3-year weighted average of Grade 6 in 2017 to Grade 7 in 2018 (42.5% weight); Grade 6 in 2018 and Grade 7 in 2019 (42.5% weight), and Grade 6 in 2019 and Grade 7 in 2020 (15% weight). Similarly, the Grade 7 to 8 CTR is a 3-year weighted average of Grade 7 in 2017 to Grade 8 in 2018 (42.5% weight); Grade 7 in 2018 and Grade 8 in 2019 (42.5% weight), and Grade 7 in 2019 and Grade 8 in 2020 (15% weight).
High School Assumptions:
Neighborhood High School Enrollment Assumptions: • Similar to the approach used for neighborhood elementary and middle schools, the enrollment
on Sept. 30, 2019 is used as a base, or starting point, for the Fall 2020 3-Year High School enrollment projections. As noted earlier in the Preparing This Report section (p. 3), September 30, 2020 enrollment is not used as a base because it is lower than anticipated and diverges from recent enrollment trends, given the impact from the COVID-19 pandemic.
• High school boundaries were last adjusted in the 2017-18 school year. 2017 to 2019 enrollment represents three years’ worth of student information that reflect the impacts from that boundary adjustment.
• Incoming Grade 9 students were estimated using the following approach: o The first step in this process is to identify Grade 8 students that reside in neighborhood
high school boundaries because they will eventually become incoming Grade 9 students. o Grade 8 students enrolled on September 30, 2019 were matched by home address to
neighborhood high school boundaries which took effect in the 2019-20 school year. o Grade 8, 7, 6, and 5 students enrolled on September 30, 2020 were also matched by
home address to neighborhood high school boundaries which took effect in the 2019-20 school year. The Grade 7 students will be in Grade 8 in 2021, the Grade 6 students will be in Grade 8 in 2022, and the Grade 5 students will be in Grade 8 in 2023.
o Because the Grade 7, 6, and 5 students that reside within high school boundaries need to be aged into Grade 8, a combination of county-wide 3-year average cohort transition rates (42.5% for 2017 to 2018, 42.5% for 2018 to 2019, and 15% for 2019 to 2020) are used. To age Grade 7 students to Grade 8, the county-wide Grade 7 to 8 CTR 3-year weighted average is applied. To age the Grade 6 students to Grade 8, the county-wide Grade 6 to 7 and Grade 7 to 8, the 3-year weighted average CTR is applied. To age the Grade 5 students to Grade 8 the county-wide Grades 5 to 6, 6 to 7, and 7 to 8, a 3-year weighted average CTR is applied.
o Once there are Grade 8 student estimates available for high school neighborhood boundaries from 2019 to 2023, they need to be aged into Grade 9 by applying high school specific Grade 8 to 9 CTRs. These CTRs are based on the ratio of Grade 8 students residing within a neighborhood high school’s boundary one year and how many Grade 9 students in that neighborhood high school’s boundaries enrolled the following year. This CTR is a 3-year weighted average of Grade 8 in 2017 to Grade 9 in 2018 (42.5% weight); Grade 8 in 2018 and Grade 9 in 2019 (42.5% weight), and Grade 8 in 2019 and Grade 9 in 2020 (15% weight).
22
o Note that before calculating Grade 8 to 9 CTRs, Grade 9 students in neighborhood high schools in 2018 were retroactively re-enumerated to exclude any full-time Arlington Tech, ACADE, HILT and PEP students that attend the Career Center. Previously to the 2019-20 school year, these students were counted at their neighborhood high school.
o When the Grade 8 to 9, 3-year weighted average CTR is applied, an estimate for Grade 8 students in 2019 that might enroll in Grade 9 in 2020, Grade 8 students in 2020 that might enroll in Grade 9 in 2021, Grade 8 students in 2021 that might enroll in Grade 9 in 2022, and Grade 8 students in 2022 that might enroll in Grade 9 in 2023, is estimated.
• Projecting enrollment for Grades 10, 11, and 12: o Note that to produce CTRs that include 2017 high school enrollment figures, the Grade
9, 10, 11 and 12 student counts had to be retroactively re-enumerated to exclude any full-time Arlington Tech, ACADE, HILT and PEP students that attend the Career Center. Previous to the 2019-20 school year, these students were counted at their neighborhood high school.
o In order to project the Grade 10, 12 and 12 students, CTRs for Grades 9 to 10, 10 to 11, and 11 to 12 must be established by neighborhood high schools to, for example, age estimated Grade 10 students to Grade 11: The Grade 9 to 10 CTR is a 3-year weighted average of Grade 9 in 2017 to Grade
10 in 2018 (42.5% weight); Grade 9 in 2018 and Grade 10 in 2019 (42.5% weight), and Grade 9 in 2019 and Grade 10 in 2020 (15% weight).
The Grade 10 to 11 CTR is a 3-year weighted average of Grade 10 in 2017 to Grade 11 in 2018 (42.5% weight); Grade 10 in 2018 and Grade 11 in 2019 (42.5% weight), and Grade 10 in 2019 and Grade 11 in 2020 (15% weight).
Similarly, the Grade 11 to 12 CTR is a 3-year weighted average of Grade 11 in 2017 to Grade 12 in 2018 (42.5% weight); Grade 11 in 2018 and Grade 12 in 2019 (42.5% weight), and Grade 11 in 2019 and Grade 12 in 2020 (15% weight).
o These high school specific CTRs are then applied to project future Grade 10, 11, and 12 students. For example, the Grade 9 enrollment at a specific high school from September 30, 2019 is graduated to Grade 10 in 2020 using the relevant school’s Grade 9 to 10 3-year weighted average CTR. In turn, the following school year, that Grade 10 student is graduated to Grade 11 in 2021 using the relevant school’s Grade 10 to 11 3-year weighted CTR.
Option High School Schools/Programs: • Eunice Kennedy Shriver program’s enrollment estimates for Grades 9, 10, 11, and 12 was
provided by the APS Department of Teaching and Learning, Secondary Special Education in November 2020. The Grade 9, 10, 11, and 12 enrollment estimates are used in each projection year, from 2021 to 2023.
• Note that as of Sept. 30, 2019, Arlington Career Center’s official enrollment reflects only full-time Arlington Tech, ACADE, HILT and PEP students; prior to the 2019-20 school year, these students were counted at their neighborhood high school.
• Arlington Career Center’s enrollment projections are a combination of the following: o Assumption that the combined Sept. 30, 2020 enrollment by grade for ACADE, HILT, and
PEP will continue for all the projection years.
23
o Assumption that the Arlington Tech incoming Grade 9 cohort will be 150 students, the CTR used for each grade is 1.0, and enrollment has a ceiling of 600 students.
• H-B Woodlawn’s enrollment projections assume: o H-B Woodlawn uses a 3-year weighted average CTR for Grades 8 to 9, 9 to 10, 10 to 11,
and 11 to 12. The Grade 8 to 9 CTR is a 3-year weighted average of Grade 8 in 2017 to Grade 9
in 2018 (42.5% weight); Grade 8 in 2018 and Grade 9 in 2019 (42.5% weight), and Grade 8 in 2019 and Grade 9 in 2020 (15% weight).
The Grade 9 to 10 CTR is a 3-year weighted average of Grade 9 in 2017 to Grade 10 in 2018 (42.5% weight); Grade 9 in 2018 and Grade 10 in 2019 (42.5% weight), and Grade 9 in 2019 and Grade 10 in 2020 (15% weight).
The Grade 10 to 11 CTR is a 3-year weighted average of Grade 10 in 2017 to Grade 11 in 2018 (42.5% weight); Grade 10 in 2018 and Grade 11 in 2019 (42.5% weight), and Grade 10 in 2019 and Grade 11 in 2020 (15% weight).
Similarly, Grade 10 to 12 CTR is a 3-year weighted average of Grade 11 in 2017 to Grade 12 in 2018 (42.5% weight); Grade 11 in 2018 and Grade 12 in 2019 (42.5% weight), and Grade 11 in 2019 and Grade 12 in 2020 (15% weight).
o The incoming Grade 9 students are projected using the Grade 8 students projected for H-B Woodlawn in a prior year—for example, a Grade 8 student projected for 2021 is graduated to Grade 9 in 2022 using the Grade 8 to 9 3-year weighted CTR.
• Enrollment by grade as of Sept. 30, 2020 is used for all projection years for Arlington Community High School, Langston, and New Directions programs.
Estimated student impact from new housing:
• Assumptions on the timing of the enrollment impacts from new housing: o Full impact in the year of construction is assume for Committed Affordable Units (CAFs)
and Single Family Detached units. o The impact from all other housing types, mixed-income, and market-rate units is spread
over a two-year period. o Single-family construction permits are incorporated into the projections in the year they
are provided by ACG to APS; in the Fall 2020 3-year projections, that is the 2020-21 school year.
• The student yield from new housing is added on a cumulative basis across projection years for Grades K, 6, and 9.
• For all other grades, the student yield from new housing is not added on a cumulative basis. Rather the student yield from new residential construction is added on the year of construction (for CAFs and SFD) or over the course of two years (for all other housing types) only once.

24
Steps to Validate Projections To validate the enrollment projections, an internal review committee met during the enrollment projection process to discuss assumptions, approaches, technical issues that arose, and review projection results. This process was put in place to allow various perspectives and expertise to assist with decision-making on assumptions and methods. The stakeholders from APS included staff from Planning and Evaluation (P&E), Facilities and Operations, and Finance and Management Services. External experts from Arlington County Government, CPHD and Dr. Richard Grip from Statistical Forecasting LLC also offered perspectives. Additionally, two members of the Advisory Council on School Facilities and Capital Programs (FAC) participated in the committee and provided updates on the enrollment projection’s process to the rest of the FAC. This is the third year in which the P&E staff tasked with performing the enrollment projections identified key assumptions and approaches, such as how to estimate incoming kindergarten students, that needed input from the Internal Review Committee. Once this feedback from the Internal Review Committee was received, P&E staff worked on projection models which reflected these key assumptions and approaches. Later, the projections drafts were shared with the internal review committee. Along with sharing the projection drafts, staff also shared assumptions which evolved during the process of modeling projections, such as the various CTR weights that were tested. Dr. Grip was consulted throughout the enrollment projections modeling process to validate approaches and lend perspective on questions that arose as the modeling process evolved. An important review step suggested two years ago by the Internal Review Committee was the development of an alternative projection model that used county-wide enrollment figures, construction assumptions, and cohort transition rates. The enrollment projections from this approach, known as a “top-down” approach, was compared to the projections from the “bottom-up” approach, which is outlined in this report. The purpose of this comparison was to observe the enrollment growth trends from different iterations of the enrollment projections modeling with the goal that the evolving versions of the “top-down” and “bottom-up” models reflect similar scales of enrollment growth trends, see page 14 for Chart 4. The enrollment projections from the two approaches were reviewed and ultimately validated with assistance from Dr. Grip.

25
Chart 5. Enrollment Projections Comparisons, Grades K to 12
Source: APS, Department of Planning and Evaluation.

Attachment A, Table 1 - PreK Estimate and Enrollment Projection for Grades K to 12 (2021-22) The 2021-22 enrollment projections will be updated as part of the Annual Update.
K 1 2 3 4 5 6 7 8 9 10 11 12GradeK-12Total
VPIPreKSPED
3&4Mont
CommPeers
PreKTotal
Total
ELEMENTARY SCHOOLAbingdon Elementary School 133 131 155 144 115 135 813 32 16 0 0 48 861Alice West Fleet Elementary School 94 95 94 88 88 96 555 32 6 34 6 78 633Arlington Science Focus Elementary 86 84 96 88 92 80 526 0 7 0 7 14 540Arlington Traditional Elementary 100 100 100 125 104 104 633 32 6 0 0 38 671Ashlawn Elementary School 105 104 118 111 111 76 625 32 16 0 0 48 673Barcroft Elementary School 75 78 67 76 81 56 433 32 15 0 7 54 487Barrett Elementary School 91 90 94 101 73 87 536 42 22 17 0 81 617Campbell Elementary School 72 59 64 73 63 63 394 48 0 0 0 48 442Carlin Springs Elementary School 87 90 98 103 104 83 565 58 31 17 11 117 682Claremont Elementary School 144 129 120 122 107 112 734 32 0 0 0 32 766Discovery Elementary School 85 86 91 94 106 93 555 0 8 28 0 36 591Dr. Charles R. Drew Elementary School 78 72 69 84 62 61 426 26 44 0 14 84 510Glebe Elementary School 85 80 68 84 102 102 521 0 7 0 7 14 535Hoffman-Boston Elementary School 92 83 86 98 88 76 523 52 37 0 7 96 619Jamestown Elementary School 84 82 92 97 82 104 541 0 16 51 4 71 612Key Elementary School 144 113 111 101 113 97 679 32 0 0 0 32 711Long Branch Elementary School 72 75 71 79 81 86 464 16 6 0 0 22 486McKinley at Reed 127 127 117 144 119 123 757 0 0 0 0 0 757New School at Key 90 95 101 98 93 85 562 562Montessori Public School of Arlington 1 50 61 89 66 65 55 386 0 8 111 0 119 505Nottingham Elementary School 64 64 77 54 81 82 422 0 14 0 14 28 450Oakridge Elementary School 119 118 133 105 114 103 692 16 16 28 0 60 752Randolph Elementary School 68 68 72 72 69 60 409 44 16 0 0 60 469Taylor Elementary School 85 86 97 89 95 92 544 0 7 0 7 14 558Tuckahoe Elementary School 73 73 63 83 80 68 440 0 14 0 14 28 468Integration Station 2 - - - - - - - 0 56 0 0 56 56
Elementary School Subtotal 2,303 2,243 2,343 2,379 2,288 2,179 - - - - - - - 13,735 526 368 286 98 1,278 15,013
MIDDLE SCHOOL 3 0Dorothy Hamm Middle School 374 326 309 1,009 1,009Eunice Kennedy Shriver Program 8 4 3 15 15Gunston Middle School 338 363 411 1,112 1,112H-B Woodlawn Secondary Program 81 82 82 245 245Jefferson Middle School 397 377 319 1,093 1,093Kenmore Middle School 370 404 326 1,100 1,100Swanson Middle School 315 322 352 989 989Williamsburg Middle School 286 288 332 906 906
Middle School Subtotal - - - - - - 2,169 2,166 2,134 - - - - 6,469 6,469
HIGH SCHOOL 3 0Arlington Career Center (Full-Time) 4 156 158 134 163 611 611Arlington Community High School 1 10 21 45 77 77Eunice Kennedy Shriver Program 1 3 9 16 29 29H-B Woodlawn Secondary Program 104 146 127 112 489 489Langston High School Continuation 5 0 4 27 44 75 75New Directions Program 0 3 3 10 16 16Wakefield High School 691 647 556 487 2,381 2,381Washington-Liberty High School 593 553 583 521 2,250 2,250Yorktown High School 592 533 618 500 2,243 2,243
High School Subtotal - - - - - - - - - 2,138 2,057 2,078 1,898 8,171 8,171
Total (Grade K to Grade 12) 2,303 2,243 2,343 2,379 2,288 2,179 2,169 2,166 2,134 2,138 2,057 2,078 1,898 28,375Total (PreK to Grade 12) 2,303 2,243 2,343 2,379 2,288 2,179 2,169 2,166 2,134 2,138 2,057 2,078 1,898 28,375 526 368 286 98 1,278 29,6531 Five-year-old Montessori students are reported in Kindergarten.2 PreK SPED classes (16) are in Integration Station as placeholders for Fiscal Year (FY) 2021. Integration Station is housed outside of APS with community PreK partners; totals do not include 5.0 FTE staffing for 60 community-based resource students.3 Schools that accept enrollment through a lottery process can also include students from the Secondary Program for Students with Autism (Grade 6 to 12) and H.S. HILT students (English Learners) enter through the year (Grade 9 to 12). H-B Woodlawn is an example of such a school.4 Arlington Career Center full-time students include Arlington Tech, Academic Academy, HILT Institute, and PEP. Arlington Career Center part-time students are included at their neighborhood school.5 Langston and Arlington Community membership does not include students over 20 years old. The above projections do not include the adult students at Arlington Community and at Langston.6 From the Spring 1-Year Projections Update for the 2020-21 School Year, https://www.apsva.us/wp-content/uploads/2020/03/2020-03-19-Spring-Update-2020-21_for_website.pdf. Some adjustments requested by the Departmetn of Teaching and Learning were done in December 2020.7 The incoming K enrollment for elementary option school/programs are the same as the K enrollment in the Spring 1-Year Projections Update for the 2020-21 School Year. The incomign K enrollment assumptions will be updated as part of the 2021 Annual Update.
2020-21 School Year Estimate: PreK 6Enrollment Projection: Grade K to 12
Note:All Grade K-12 Special Education students, including those in self-contained classes, and English Learners are included within the grade totals at each school.The projections for option schools were calculated differently from neighborhood schools. For certain option schools, either their enrollment was static as of Sept. 30, 2020 or the incoming class was based on the Spring 1-Year Projections Update for the 2020-21 School Year.
All Arlington Public Schools (APS) budget and operations decisions are based on the best information available at the time. Staff and community members are reminded that funding forecasts from Arlington County and the state may change, based on many external factors. Similarly, student enrollment and projections are based on the best available information, but are also subject to change due to employment, housing and other economic factors. For these reasons, APS and the Arlington School Board may adjust future budget allocations, staffing and other operations decisions to reflect the existing community and operating landscape.

Attachment A, Table 2 - PreK Estimate and Enrollment Projection for Grades K to 12 (2022-23)
K 1 2 3 4 5 6 7 8 9 10 11 12GradeK-12Total
VPIPreKSPED
3&4Mont
CommPeers
PreKTotal
Total
ELEMENTARY SCHOOLAbingdon Elementary School 124 133 141 171 146 121 836 32 16 0 0 48 884Alice West Fleet Elementary School 89 98 100 101 91 94 573 32 6 34 6 78 651Arlington Science Focus Elementary 91 95 99 103 91 102 581 0 7 0 7 14 595Arlington Traditional Elementary 100 100 100 100 125 104 629 32 6 0 0 38 667Ashlawn Elementary School 98 105 108 118 107 110 646 32 16 0 0 48 694Barcroft Elementary School 69 80 72 72 78 86 457 32 15 0 7 54 511Barrett Elementary School 90 97 99 101 103 84 574 42 22 17 0 81 655Campbell Elementary School 72 68 60 68 75 63 406 48 0 0 0 48 454Carlin Springs Elementary School 80 91 93 102 101 109 576 58 31 17 11 117 693Claremont Elementary School 144 140 124 112 116 101 737 32 0 0 0 32 769Discovery Elementary School 79 87 83 92 95 106 542 0 8 28 0 36 578Dr. Charles R. Drew Elementary School 72 73 70 66 76 61 418 26 44 0 14 84 502Glebe Elementary School 79 81 77 66 87 98 488 0 7 0 7 14 502Hoffman-Boston Elementary School 89 87 94 88 98 93 549 52 37 0 7 96 645Jamestown Elementary School 78 84 83 96 93 83 517 0 16 51 4 71 588Key Elementary School 144 136 104 105 95 104 688 32 0 0 0 32 720Long Branch Elementary School 67 76 74 76 80 80 453 16 6 0 0 22 475McKinley at Reed 118 129 122 116 137 122 744 0 0 0 0 0 744New School at Key 85 98 99 102 108 91 583 583Montessori Public School of Arlington 1 50 50 61 89 66 65 381 0 8 111 0 119 500Nottingham Elementary School 59 65 63 77 53 77 394 0 14 0 14 28 422Oakridge Elementary School 113 121 117 133 108 114 706 16 16 28 0 60 766Randolph Elementary School 63 69 69 68 71 66 406 44 16 0 0 60 466Taylor Elementary School 80 89 94 97 93 100 553 0 7 0 7 14 567Tuckahoe Elementary School 68 74 72 60 82 77 433 0 14 0 14 28 461Integration Station 2 - - - - - - - 0 56 0 0 56 56
Elementary School Subtotal 2,201 2,326 2,278 2,379 2,375 2,311 - - - - - - - 13,870 526 368 286 98 1,278 15,148
MIDDLE SCHOOL 3 0Dorothy Hamm Middle School 335 368 334 1,037 1,037Eunice Kennedy Shriver Program 8 4 3 15 15Gunston Middle School 364 334 350 1,048 1,048H-B Woodlawn Secondary Program 81 79 81 241 241Jefferson Middle School 406 402 378 1,186 1,186Kenmore Middle School 336 368 397 1,101 1,101Swanson Middle School 343 318 326 987 987Williamsburg Middle School 272 280 286 838 838
Middle School Subtotal - - - - - - 2,145 2,153 2,155 - - - - 6,453 6,453
HIGH SCHOOL 3 0Arlington Career Center (Full-Time) 4 156 173 159 206 694 694Arlington Community High School 1 10 21 45 77 77Eunice Kennedy Shriver Program 1 3 9 16 29 29H-B Woodlawn Secondary Program 103 112 149 130 494 494Langston High School Continuation 5 0 4 27 44 75 75New Directions Program 0 3 3 10 16 16Wakefield High School 674 698 591 516 2,479 2,479Washington-Liberty High School 631 610 566 549 2,356 2,356Yorktown High School 621 604 524 596 2,345 2,345
High School Subtotal - - - - - - - - - 2,187 2,217 2,049 2,112 8,565 8,565
Total (Grade K to Grade 12) 2,201 2,326 2,278 2,379 2,375 2,311 2,145 2,153 2,155 2,187 2,217 2,049 2,112 28,888Total (PreK to Grade 12) 2,201 2,326 2,278 2,379 2,375 2,311 2,145 2,153 2,155 2,187 2,217 2,049 2,112 28,888 526 368 286 98 1,278 30,1661 Five-year-old Montessori students are reported in Kindergarten.2 PreK SPED classes (16) are in Integration Station as placeholders for Fiscal Year (FY) 2021. Integration Station is housed outside of APS with community PreK partners; totals do not include 5.0 FTE staffing for 60 community-based resource students.3 Schools that accept enrollment through a lottery process can also include students from the Secondary Program for Students with Autism (Grade 6 to 12) and H.S. HILT students (English Learners) enter through the year (Grade 9 to 12). H-B Woodlawn is an example of such a school.4 Arlington Career Center full-time students include Arlington Tech, Academic Academy, HILT Institute, and PEP. Arlington Career Center part-time students are included at their neighborhood school.5 Langston and Arlington Community membership does not include students over 20 years old. The above projections do not include the adult students at Arlington Community and at Langston.6 From the Spring 1-Year Projections Update for the 2020-21 School Year, https://www.apsva.us/wp-content/uploads/2020/03/2020-03-19-Spring-Update-2020-21_for_website.pdf. Some adjustments requested by the Departmetn of Teaching and Learning were done in December 2020.7 The incoming K enrollment for elementary option school/programs are the same as the K enrollment in the Spring 1-Year Projections Update for the 2020-21 School Year. The incomign K enrollment assumptions will be updated as part of the 2021 Annual Update.
Enrollment Projection: Grade K to 12 2020-21 School Year Estimate: PreK 6
Note:All Grade K-12 Special Education students, including those in self-contained classes, and English Learners are included within the grade totals at each school.The projections for option schools were calculated differently from neighborhood schools. For certain option schools, either their enrollment was static as of Sept. 30, 2020 or the incoming class was based on the Spring 1-Year Projections Update for the 2020-21 School Year.
All Arlington Public Schools (APS) budget and operations decisions are based on the best information available at the time. Staff and community members are reminded that funding forecasts from Arlington County and the state may change, based on many external factors. Similarly, student enrollment and projections are based on the best available information, but are also subject to change due to employment, housing and other economic factors. For these reasons, APS and the Arlington School Board may adjust future budget allocations, staffing and other operations decisions to reflect the existing community and operating landscape.

Attachment A, Table 3 - PreK Estimate and Enrollment Projection for Grades K to 12 (2023-24)
K 1 2 3 4 5 6 7 8 9 10 11 12GradeK-12Total
VPIPreKSPED
3&4Mont
CommPeers
PreKTotal
Total
ELEMENTARY SCHOOLAbingdon Elementary School 122 123 143 157 174 154 873 32 16 0 0 48 921Alice West Fleet Elementary School 89 93 103 108 104 97 594 32 6 34 6 78 672Arlington Science Focus Elementary 91 90 102 97 96 92 568 0 7 0 7 14 582Arlington Traditional Elementary 100 100 100 100 100 125 625 32 6 0 0 38 663Ashlawn Elementary School 107 108 120 118 123 115 691 32 16 0 0 48 739Barcroft Elementary School 68 74 73 77 73 82 447 32 15 0 7 54 501Barrett Elementary School 90 91 101 101 98 111 592 42 22 17 0 81 673Campbell Elementary School 72 68 69 63 69 74 415 48 0 0 0 48 463Carlin Springs Elementary School 90 95 105 107 111 116 624 58 31 17 11 117 741Claremont Elementary School 144 140 134 115 106 109 748 32 0 0 0 32 780Discovery Elementary School 78 81 84 84 93 95 515 0 8 28 0 36 551Dr. Charles R. Drew Elementary School 71 68 71 67 60 75 412 26 44 0 14 84 496Glebe Elementary School 78 75 78 75 68 83 457 0 7 0 7 14 471Hoffman-Boston Elementary School 88 82 96 93 85 102 546 52 37 0 7 96 642Jamestown Elementary School 77 77 84 86 92 94 510 0 16 51 4 71 581Key Elementary School 144 136 126 99 98 87 690 32 0 0 0 32 722Long Branch Elementary School 66 71 75 78 76 79 445 16 6 0 0 22 467McKinley at Reed 116 119 124 122 110 141 732 0 0 0 0 0 732New School at Key 85 94 102 100 113 106 600 600Montessori Public School of Arlington 1 50 50 50 61 89 66 366 0 8 111 0 119 485Nottingham Elementary School 59 61 63 63 75 50 371 0 14 0 14 28 399Oakridge Elementary School 114 116 120 117 136 109 712 16 16 28 0 60 772Randolph Elementary School 63 64 70 65 66 68 396 44 16 0 0 60 456Taylor Elementary School 80 84 97 94 101 98 554 0 7 0 7 14 568Tuckahoe Elementary School 67 69 73 69 59 80 417 0 14 0 14 28 445Integration Station 2 - - - - - - - 0 56 0 0 56 56
Elementary School Subtotal 2,209 2,229 2,363 2,316 2,375 2,408 - - - - - - - 13,900 526 368 286 98 1,278 15,178
MIDDLE SCHOOL 3 0Dorothy Hamm Middle School 374 322 368 1,064 1,064Eunice Kennedy Shriver Program 8 4 3 15 15Gunston Middle School 393 359 321 1,073 1,073H-B Woodlawn Secondary Program 81 82 83 246 246Jefferson Middle School 404 411 404 1,219 1,219Kenmore Middle School 376 341 369 1,086 1,086Swanson Middle School 348 351 327 1,026 1,026Williamsburg Middle School 276 267 279 822 822
Middle School Subtotal - - - - - - 2,260 2,137 2,154 - - - - 6,551 6,551
HIGH SCHOOL 3 0Arlington Career Center (Full-Time) 4 156 173 174 231 734 734Arlington Community High School 1 10 21 45 77 77Eunice Kennedy Shriver Program 1 3 9 16 29 29H-B Woodlawn Secondary Program 102 112 115 153 482 482Langston High School Continuation 5 0 4 27 44 75 75New Directions Program 0 3 3 10 16 16Wakefield High School 682 682 637 548 2,549 2,549Washington-Liberty High School 664 645 620 530 2,459 2,459Yorktown High School 583 634 594 506 2,317 2,317
High School Subtotal - - - - - - - - - 2,189 2,266 2,200 2,083 8,738 8,738
Total (Grade K to Grade 12) 2,209 2,229 2,363 2,316 2,375 2,408 2,260 2,137 2,154 2,189 2,266 2,200 2,083 29,189Total (PreK to Grade 12) 2,209 2,229 2,363 2,316 2,375 2,408 2,260 2,137 2,154 2,189 2,266 2,200 2,083 29,189 526 368 286 98 1,278 30,4671 Five-year-old Montessori students are reported in Kindergarten.2 PreK SPED classes (16) are in Integration Station as placeholders for Fiscal Year (FY) 2021. Integration Station is housed outside of APS with community PreK partners; totals do not include 5.0 FTE staffing for 60 community-based resource students.3 Schools that accept enrollment through a lottery process can also include students from the Secondary Program for Students with Autism (Grade 6 to 12) and H.S. HILT students (English Learners) enter through the year (Grade 9 to 12). H-B Woodlawn is an example of such a school.4 Arlington Career Center full-time students include Arlington Tech, Academic Academy, HILT Institute, and PEP. Arlington Career Center part-time students are included at their neighborhood school.5 Langston and Arlington Community membership does not include students over 20 years old. The above projections do not include the adult students at Arlington Community and at Langston.6 From the Spring 1-Year Projections Update for the 2020-21 School Year, https://www.apsva.us/wp-content/uploads/2020/03/2020-03-19-Spring-Update-2020-21_for_website.pdf. Some adjustments requested by the Departmetn of Teaching and Learning were done in December 2020.7 The incoming K enrollment for elementary option school/programs are the same as the K enrollment in the Spring 1-Year Projections Update for the 2020-21 School Year. The incomign K enrollment assumptions will be updated as part of the 2021 Annual Update.
Enrollment Projection: Grade K to 12 2020-21 School Year Estimate: PreK 6
Note:All Grade K-12 Special Education students, including those in self-contained classes, and English Learners are included within the grade totals at each school.The projections for option schools were calculated differently from neighborhood schools. For certain option schools, either their enrollment was static as of Sept. 30, 2020 or the incoming class was based on the Spring 1-Year Projections Update for the 2020-21 School Year.
All Arlington Public Schools (APS) budget and operations decisions are based on the best information available at the time. Staff and community members are reminded that funding forecasts from Arlington County and the state may change, based on many external factors. Similarly, student enrollment and projections are based on the best available information, but are also subject to change due to employment, housing and other economic factors. For these reasons, APS and the Arlington School Board may adjust future budget allocations, staffing and other operations decisions to reflect the existing community and operating landscape.

Attachment B: Fall 2020 Housing Unit Forecast and Estimated StudentsForecastYear
Development Name AddressNet NewUnits
PlanningUnits
Projected StudentEstimate (K-12)
2020 Red Cross/Trenton St. Residential 4333 ARLINGTON BLVD 19 12080 4.202020 624 N HARRISON ST 1 13060 0.472020 637 N HARRISON ST 1 13060 0.472020 The Waycroft *** 750 N GLEBE RD 483 13070 42.512020 843 N BUCHANAN ST 1 13080 0.502020 843 N BUCHANAN ST 1 13080 0.502020 920 N QUESADA ST 1 14010 0.572020 5214 11TH ST N 1 14080 0.542020 5222 12TH ST N 1 14080 0.542020 1731 N GREENBRIER ST 1 15010 0.572020 5521 15TH ST N 1 15020 0.542020 2007 N EDISON ST 1 15030 0.522020 5016 22ND ST N 1 15030 0.522020 1937 N CULPEPER ST 1 15040 0.522020 1945 N EDISON ST (ADU) 1 15041 0.522020 4432 17TH ST N 1 15110 0.472020 4641 13TH ST N 1 15121 0.492020 5139 15TH ST N 1 15121 0.492020 1511 N ABINGDON ST 1 15121 0.492020 1209 N UTAH ST 1 15130 0.472020 1209 N UTAH ST 1 15130 0.472020 1240 N VERMONT ST 1 15130 0.472020 6716 31ST ST N 1 16010 0.612020 6801 31ST ST N 1 16010 0.612020 6830 30TH RD N 1 16010 0.612020 6700 WILLIAMSBURG BLVD 1 16020 0.552020 6711 Lee Highway (Sun Trust Site) 6711 LEE HWY 27 16020 7.192020 6565 LEE HWY 1 16021 0.552020 6605 25TH ST N 1 16021 0.552020 6407 25TH ST N 1 16031 0.552020 2285 N POWHATAN ST 1 16050 0.542020 6032 20TH ST N 1 16061 0.572020 2012 N MADISON ST 1 16061 0.572020 2230 N KENSINGTON ST 1 16070 0.602020 5730 22ND ST N 1 16080 0.572020 5708 19TH ST N 1 16080 0.572020 2008 N KENTUCKY ST 1 16080 0.572020 2013 N GREENBRIER ST 1 16090 0.522020 1809 N TUCKAHOE ST 1 16110 0.552020 3017 N TRINIDAD ST 1 16910 0.612020 6593 WILLIAMSBURG BLVD 1 16910 0.612020 3109 N TORONTO ST 1 16910 0.612020 2926 JOHN MARSHALL DR 1 17021 0.612020 2438 N POWHATAN ST 1 17023 0.612020 5600 32ND ST N 1 17030 0.612020 5821 25TH RD N 1 17033 0.612020 5306 27TH ST N 1 17040 0.582020 5310 26TH RD N 1 17040 0.582020 2538 N GREENBRIER ST 1 17050 0.582020 4911 25TH RD N 1 17060 0.582020 2244 N GLEBE RD 1 17080 0.582020 5808 37TH ST N 1 17920 0.582020 5800 37TH ST N 1 17920 0.582020 5801 36TH ST N 1 17920 0.582020 4306 40TH ST N 1 22030 0.542020 4040 37TH ST N 1 22041 0.542020 4110 37TH ST N 1 22041 0.54
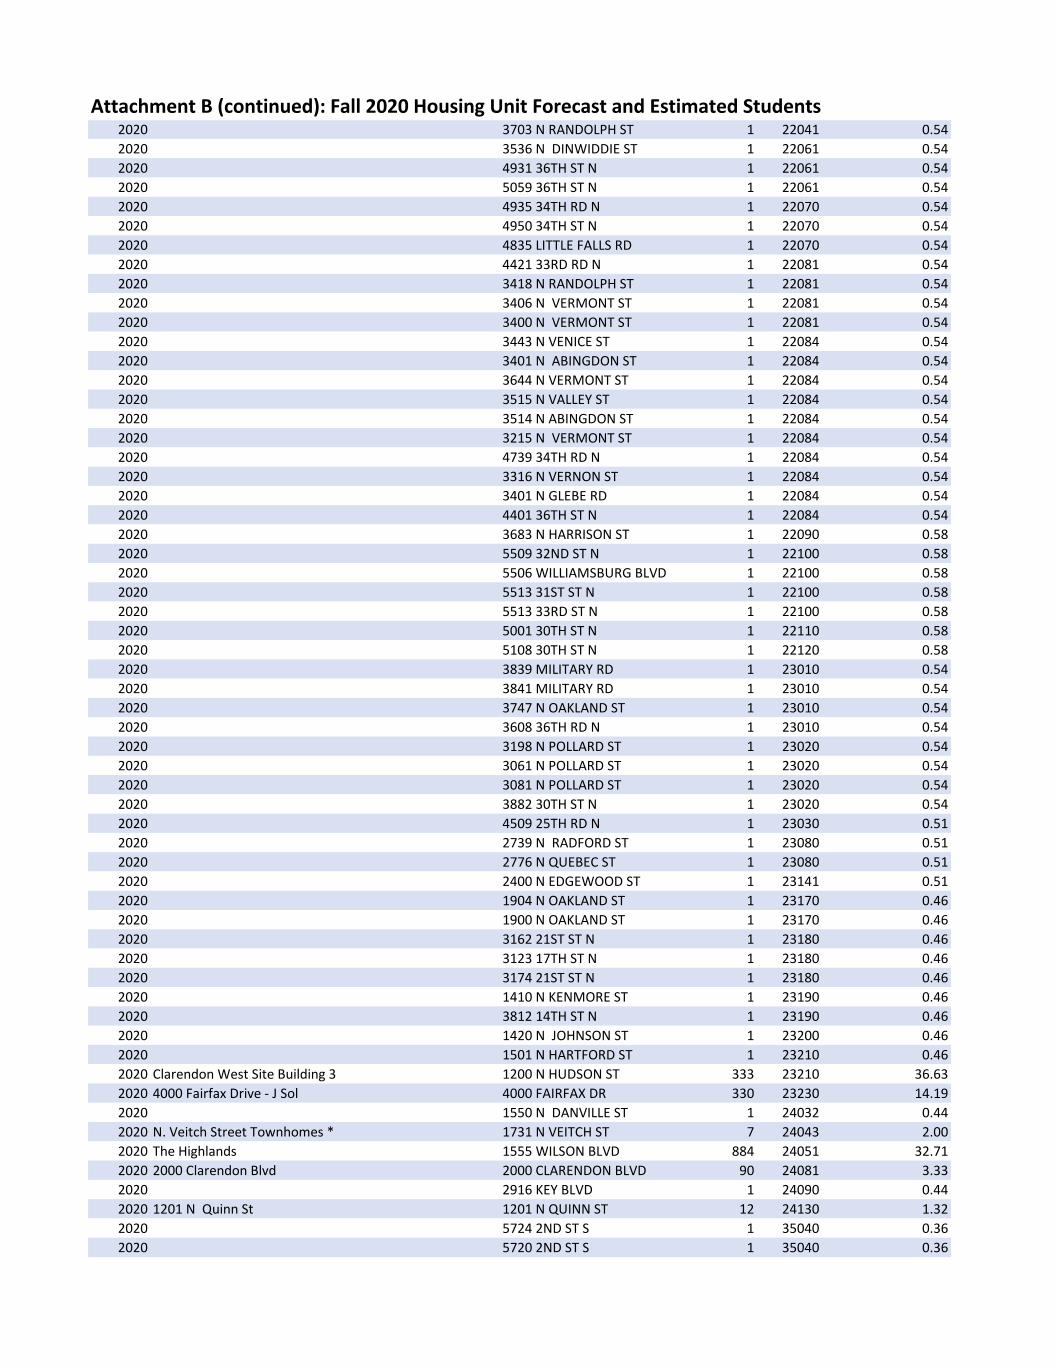
Attachment B (continued): Fall 2020 Housing Unit Forecast and Estimated Students2020 3703 N RANDOLPH ST 1 22041 0.542020 3536 N DINWIDDIE ST 1 22061 0.542020 4931 36TH ST N 1 22061 0.542020 5059 36TH ST N 1 22061 0.542020 4935 34TH RD N 1 22070 0.542020 4950 34TH ST N 1 22070 0.542020 4835 LITTLE FALLS RD 1 22070 0.542020 4421 33RD RD N 1 22081 0.542020 3418 N RANDOLPH ST 1 22081 0.542020 3406 N VERMONT ST 1 22081 0.542020 3400 N VERMONT ST 1 22081 0.542020 3443 N VENICE ST 1 22084 0.542020 3401 N ABINGDON ST 1 22084 0.542020 3644 N VERMONT ST 1 22084 0.542020 3515 N VALLEY ST 1 22084 0.542020 3514 N ABINGDON ST 1 22084 0.542020 3215 N VERMONT ST 1 22084 0.542020 4739 34TH RD N 1 22084 0.542020 3316 N VERNON ST 1 22084 0.542020 3401 N GLEBE RD 1 22084 0.542020 4401 36TH ST N 1 22084 0.542020 3683 N HARRISON ST 1 22090 0.582020 5509 32ND ST N 1 22100 0.582020 5506 WILLIAMSBURG BLVD 1 22100 0.582020 5513 31ST ST N 1 22100 0.582020 5513 33RD ST N 1 22100 0.582020 5001 30TH ST N 1 22110 0.582020 5108 30TH ST N 1 22120 0.582020 3839 MILITARY RD 1 23010 0.542020 3841 MILITARY RD 1 23010 0.542020 3747 N OAKLAND ST 1 23010 0.542020 3608 36TH RD N 1 23010 0.542020 3198 N POLLARD ST 1 23020 0.542020 3061 N POLLARD ST 1 23020 0.542020 3081 N POLLARD ST 1 23020 0.542020 3882 30TH ST N 1 23020 0.542020 4509 25TH RD N 1 23030 0.512020 2739 N RADFORD ST 1 23080 0.512020 2776 N QUEBEC ST 1 23080 0.512020 2400 N EDGEWOOD ST 1 23141 0.512020 1904 N OAKLAND ST 1 23170 0.462020 1900 N OAKLAND ST 1 23170 0.462020 3162 21ST ST N 1 23180 0.462020 3123 17TH ST N 1 23180 0.462020 3174 21ST ST N 1 23180 0.462020 1410 N KENMORE ST 1 23190 0.462020 3812 14TH ST N 1 23190 0.462020 1420 N JOHNSON ST 1 23200 0.462020 1501 N HARTFORD ST 1 23210 0.462020 Clarendon West Site Building 3 1200 N HUDSON ST 333 23210 36.632020 4000 Fairfax Drive - J Sol 4000 FAIRFAX DR 330 23230 14.192020 1550 N DANVILLE ST 1 24032 0.442020 N. Veitch Street Townhomes * 1731 N VEITCH ST 7 24043 2.002020 The Highlands 1555 WILSON BLVD 884 24051 32.712020 2000 Clarendon Blvd 2000 CLARENDON BLVD 90 24081 3.332020 2916 KEY BLVD 1 24090 0.442020 1201 N Quinn St 1201 N QUINN ST 12 24130 1.322020 5724 2ND ST S 1 35040 0.362020 5720 2ND ST S 1 35040 0.36

Attachment B (continued): Fall 2020 Housing Unit Forecast and Estimated Students2020 5424 3RD ST S 1 35040 0.362020 5616 4TH ST S 1 35040 0.362020 2135 S OXFORD ST 1 36103 0.472020 Neslo St Townhomes 2130 S NELSON ST 3 36104 0.632020 4645 4TH ST S 1 37020 0.442020 628 S TAYLOR ST 1 37030 0.442020 Columbia Pike Village Centro *** 950 S GEORGE MASON DR 205 37032 25.832020 3935 6TH ST S 1 37040 0.442020 1308 S RANDOLPH ST 1 38020 0.392020 1701 S POLLARD ST 1 38080 0.392020 Axumite Village 1100 S HIGHLAND ST 36 46010 14.832020 805 N DANIEL ST 1 46030 0.422020 801 N DANIEL ST 1 46030 0.422020 919 N CLEVELAND ST 1 46030 0.422020 911 N DANIEL ST (ADU) 1 46030 0.422020 705/707 N Barton St * 703 N BARTON ST 2 46030 0.512020 262 N BARTON ST 1 46033 0.422020 722 N GARFIELD ST 1 46050 0.422020 508 N HIGHLAND ST 1 46051 0.422020 31 N JACKSON ST 1 46060 0.422020 3219 1ST ST N 1 46060 0.422020 641 N LINCOLN ST 1 46070 0.422020 600 N JACKSON ST 1 46070 0.422020 4040 Wilson Blvd (Founder's Square Phase 5) *** 4040 WILSON BLVD 244 46093 10.252020 2707 1ST ST S 1 46900 0.462020 2711 1ST ST S 1 46900 0.462020 1610 23RD ST S 1 48040 0.382020 2302 S NASH ST 1 48040 0.382020 1900 Crystal Drive - CAF UNITS at Riverhouse 1111 ARMY NAVY DR 35 48070 20.352020 1101 18TH ST S 1 48080 0.382020 1106 18TH ST S 1 48080 0.382020 904 19TH ST S 1 48100 0.382020 818 19TH ST S (ADU) 1 48100 0.382020 1550 13TH ST S 1 48150 0.382020 The Trove 1201 S ROSS ST 402 48150 27.332020 Green Valley Townhomes * 2807 24th RD S 6 48171 1.242020 911 S OAK ST 1 48180 0.392020 830 22ND ST S 1 48191 0.382020 3008 20TH ST S 1 48210 0.472020 1222 26TH RD S 1 48240 0.382020 2631 S ARLINGTON RIDGE RD 1 48240 0.382020 2614 S IVES ST 1 48240 0.382020 The Clark: Potomac Yard - Land Bay D - West *** 3400 S CLARK ST 342 48250 22.922020 Potomac Yard - Land Bay D-East (Brittany East) 3400 POTOMAC AVE 360 48250 24.122020 The Wellington - CAF Unit Conversion 1301 S SCOTT ST 65 48281 37.782020 The Apex *** 2900 S GLEBE RD 256 48960 148.732021 1801 N Quinn St * 1801 N QUINN ST 249 24051 144.672022 Red Cross/Trenton St. Residential - The Candence 31 N TRENTON ST 97 12080 71.012022 11th and Vermont Residences North Block 1031 N VERMONT ST 10 13090 1.542022 11th and Vermont Residences South Block -Garden 1031 N VERMONT ST 98 13090 14.012022 American Legion/APAH 3445 WASHINGTON BLVD 160 23190 116.002022 Washington Kirkwood 1122 KIRKWOOD RD 255 23190 28.062022 Key Bridge Marriot 1401 LEE HWY 451 23250 25.262022 Best Western 1501 ARLINGTON BLVD 48 24071 7.962022 Westmont Shopping Center -3233 COl Pike 3233 COLUMBIA PIKE 250 46022 31.252022 The Witmer: Pentagon Centre PDSP-4 cAF units 710 12th ST S 4 48110 2.332022 Arlington View Terrace East 1420 S ROLFE ST 47 48150 27.302022 1900 Crystal Dirve - Sourth Building 1900 CRYSTAL DRIVE 472 48260 31.632023 Harris Teeter and American Service Center Phase 1 600 N GLEBE RD 505 12040 18.19

Attachment B (continued): Fall 2020 Housing Unit Forecast and Estimated Students2023 Ballston Station ** 4201 FAIRFAX DR 144 13090 116.502023 Holiday Inn 1900 FORT MYER DR 490 24051 18.132023 1200 N Courthouse Rd 1200 N COURTHOUSE RD 167 24080 7.352023 COLUMBIA PIKE **** 871 S GREENBRIER ST 392 35072 182.672023 Crystal City Verizon 400 11TH ST S 306 48110 20.812023 Crystal City M6 2001 S CLARK ST 189 48260 12.67
* APS did not use ACG's demolition information for this project.
** APS amended ACG's construction date for this project.
*** APS added units built in 2020 from ACG's MHUD 2020 file.
Note: Forecasted development has high potential, but not all proposed projects may be built
Source: Arlington County Government, CPHD Department. Data provided to APS, Fall 2020.
**** APS amended the designation to mixed-income from market rate, based on the "Pike West" site plan application from October 2020. Updated the construction date to2023 in consultation with ACG's CPHD Department.
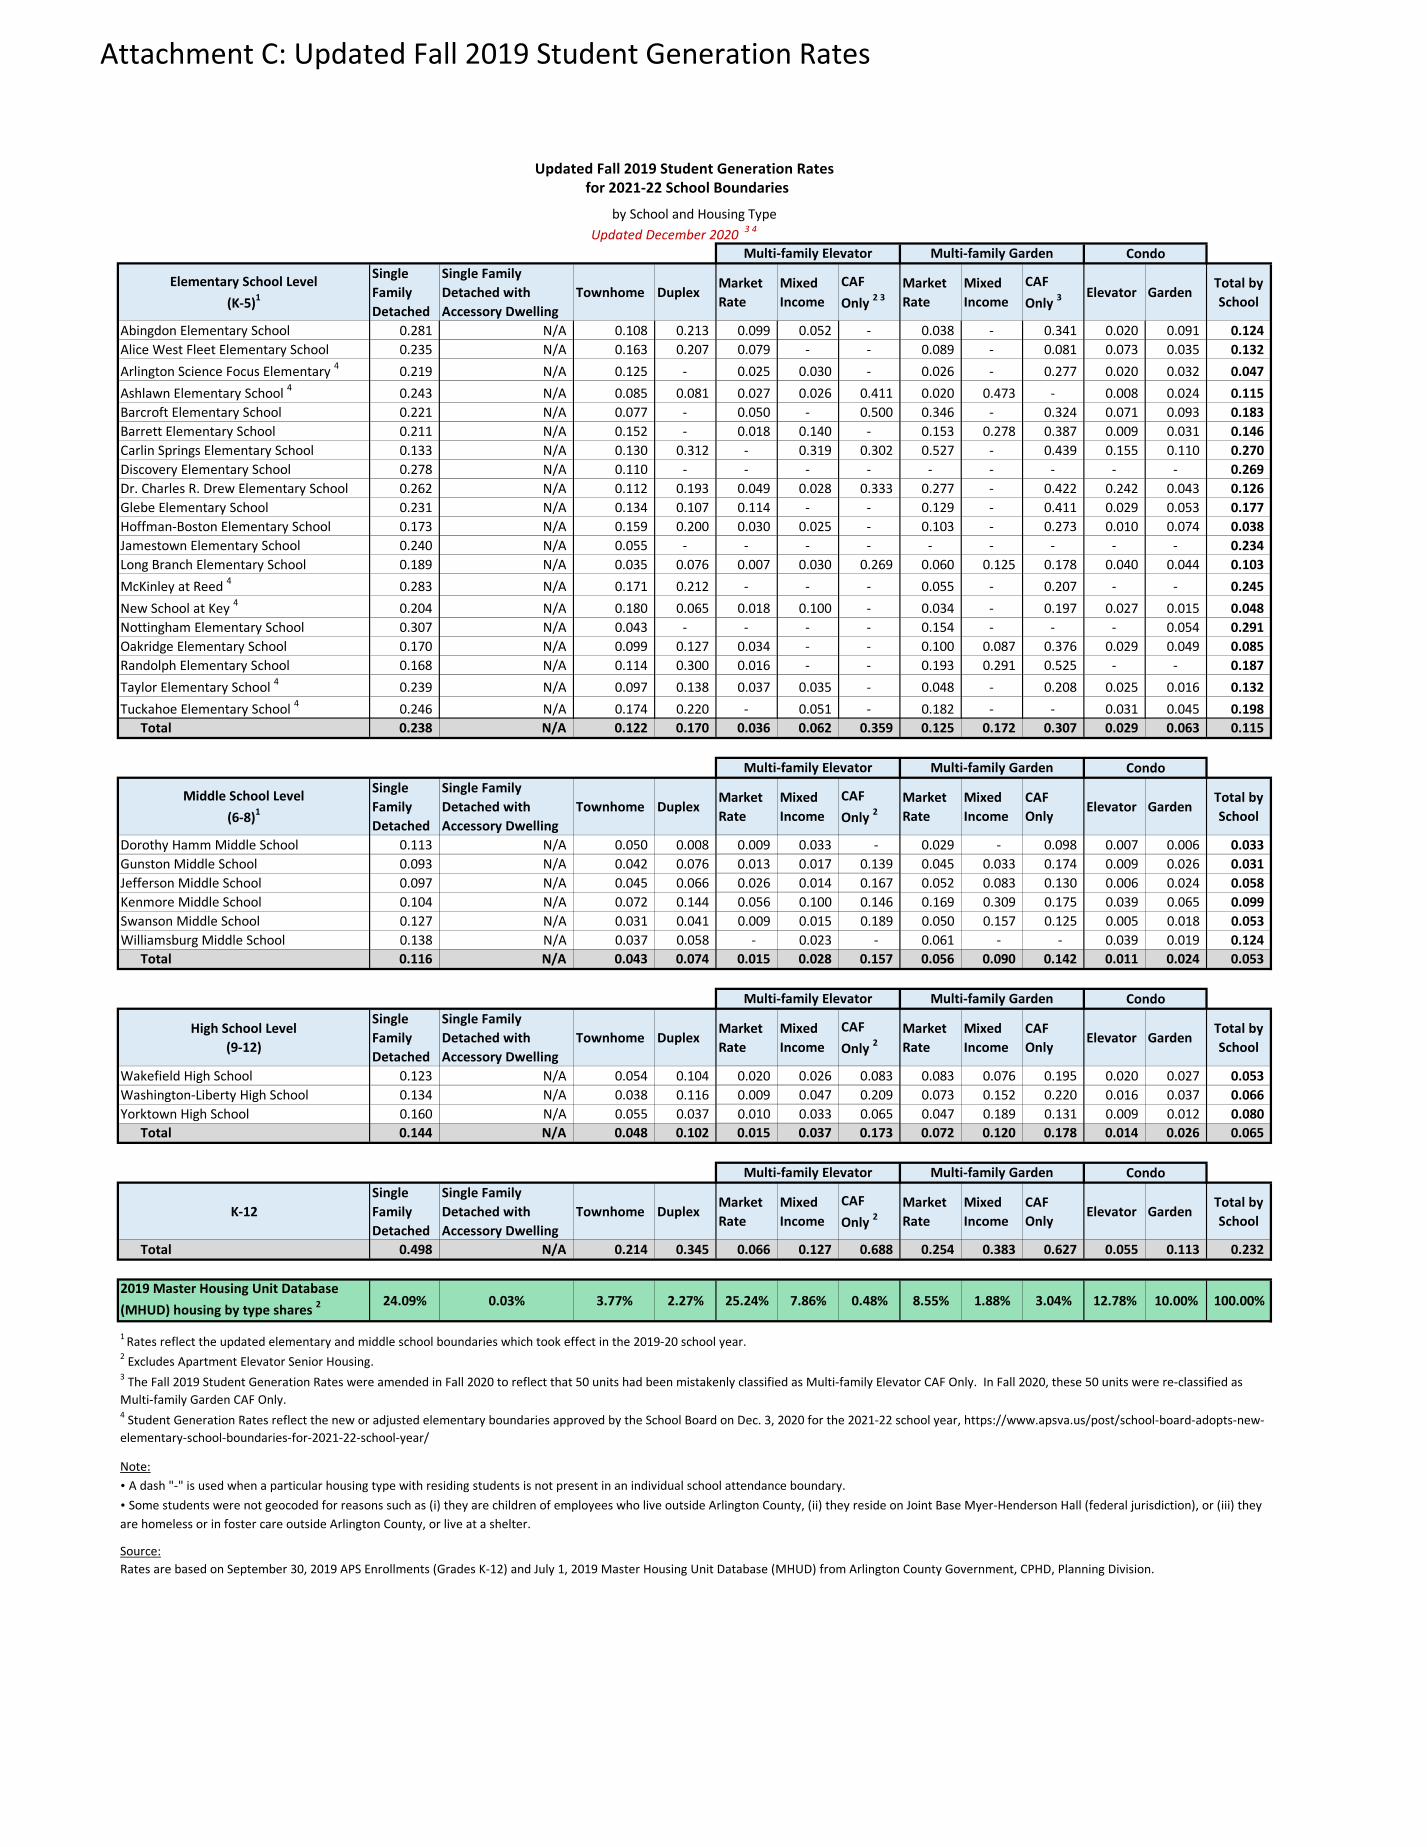
Elementary School Level(K-5)1
SingleFamilyDetached
Single FamilyDetached withAccessory Dwelling
Townhome DuplexMarketRate
MixedIncome
CAFOnly 2 3
MarketRate
MixedIncome
CAFOnly 3
Elevator GardenTotal bySchool
Abingdon Elementary School 0.281 N/A 0.108 0.213 0.099 0.052 - 0.038 - 0.341 0.020 0.091 0.124 Alice West Fleet Elementary School 0.235 N/A 0.163 0.207 0.079 - - 0.089 - 0.081 0.073 0.035 0.132 Arlington Science Focus Elementary 4 0.219 N/A 0.125 - 0.025 0.030 - 0.026 - 0.277 0.020 0.032 0.047 Ashlawn Elementary School 4 0.243 N/A 0.085 0.081 0.027 0.026 0.411 0.020 0.473 - 0.008 0.024 0.115 Barcroft Elementary School 0.221 N/A 0.077 - 0.050 - 0.500 0.346 - 0.324 0.071 0.093 0.183 Barrett Elementary School 0.211 N/A 0.152 - 0.018 0.140 - 0.153 0.278 0.387 0.009 0.031 0.146 Carlin Springs Elementary School 0.133 N/A 0.130 0.312 - 0.319 0.302 0.527 - 0.439 0.155 0.110 0.270 Discovery Elementary School 0.278 N/A 0.110 - - - - - - - - - 0.269 Dr. Charles R. Drew Elementary School 0.262 N/A 0.112 0.193 0.049 0.028 0.333 0.277 - 0.422 0.242 0.043 0.126 Glebe Elementary School 0.231 N/A 0.134 0.107 0.114 - - 0.129 - 0.411 0.029 0.053 0.177 Hoffman-Boston Elementary School 0.173 N/A 0.159 0.200 0.030 0.025 - 0.103 - 0.273 0.010 0.074 0.038 Jamestown Elementary School 0.240 N/A 0.055 - - - - - - - - - 0.234 Long Branch Elementary School 0.189 N/A 0.035 0.076 0.007 0.030 0.269 0.060 0.125 0.178 0.040 0.044 0.103 McKinley at Reed 4 0.283 N/A 0.171 0.212 - - - 0.055 - 0.207 - - 0.245 New School at Key 4 0.204 N/A 0.180 0.065 0.018 0.100 - 0.034 - 0.197 0.027 0.015 0.048 Nottingham Elementary School 0.307 N/A 0.043 - - - - 0.154 - - - 0.054 0.291 Oakridge Elementary School 0.170 N/A 0.099 0.127 0.034 - - 0.100 0.087 0.376 0.029 0.049 0.085 Randolph Elementary School 0.168 N/A 0.114 0.300 0.016 - - 0.193 0.291 0.525 - - 0.187 Taylor Elementary School 4 0.239 N/A 0.097 0.138 0.037 0.035 - 0.048 - 0.208 0.025 0.016 0.132 Tuckahoe Elementary School 4 0.246 N/A 0.174 0.220 - 0.051 - 0.182 - - 0.031 0.045 0.198
Total 0.238 N/A 0.122 0.170 0.036 0.062 0.359 0.125 0.172 0.307 0.029 0.063 0.115
Middle School Level(6-8)1
SingleFamilyDetached
Single FamilyDetached withAccessory Dwelling
Townhome DuplexMarketRate
MixedIncome
CAFOnly 2
MarketRate
MixedIncome
CAFOnly
Elevator GardenTotal bySchool
Dorothy Hamm Middle School 0.113 N/A 0.050 0.008 0.009 0.033 - 0.029 - 0.098 0.007 0.006 0.033 Gunston Middle School 0.093 N/A 0.042 0.076 0.013 0.017 0.139 0.045 0.033 0.174 0.009 0.026 0.031 Jefferson Middle School 0.097 N/A 0.045 0.066 0.026 0.014 0.167 0.052 0.083 0.130 0.006 0.024 0.058 Kenmore Middle School 0.104 N/A 0.072 0.144 0.056 0.100 0.146 0.169 0.309 0.175 0.039 0.065 0.099 Swanson Middle School 0.127 N/A 0.031 0.041 0.009 0.015 0.189 0.050 0.157 0.125 0.005 0.018 0.053 Williamsburg Middle School 0.138 N/A 0.037 0.058 - 0.023 - 0.061 - - 0.039 0.019 0.124
Total 0.116 N/A 0.043 0.074 0.015 0.028 0.157 0.056 0.090 0.142 0.011 0.024 0.053
High School Level(9-12)
SingleFamilyDetached
Single FamilyDetached withAccessory Dwelling
Townhome DuplexMarketRate
MixedIncome
CAFOnly 2
MarketRate
MixedIncome
CAFOnly
Elevator GardenTotal bySchool
Wakefield High School 0.123 N/A 0.054 0.104 0.020 0.026 0.083 0.083 0.076 0.195 0.020 0.027 0.053 Washington-Liberty High School 0.134 N/A 0.038 0.116 0.009 0.047 0.209 0.073 0.152 0.220 0.016 0.037 0.066 Yorktown High School 0.160 N/A 0.055 0.037 0.010 0.033 0.065 0.047 0.189 0.131 0.009 0.012 0.080
Total 0.144 N/A 0.048 0.102 0.015 0.037 0.173 0.072 0.120 0.178 0.014 0.026 0.065
K-12SingleFamilyDetached
Single FamilyDetached withAccessory Dwelling
Townhome DuplexMarketRate
MixedIncome
CAFOnly 2
MarketRate
MixedIncome
CAFOnly
Elevator GardenTotal bySchool
Total 0.498 N/A 0.214 0.345 0.066 0.127 0.688 0.254 0.383 0.627 0.055 0.113 0.232
2019 Master Housing Unit Database (MHUD) housing by type shares 2
24.09% 0.03% 3.77% 2.27% 25.24% 7.86% 0.48% 8.55% 1.88% 3.04% 12.78% 10.00% 100.00%
1 Rates reflect the updated elementary and middle school boundaries which took effect in the 2019-20 school year.2 Excludes Apartment Elevator Senior Housing.
Note:• A dash "-" is used when a particular housing type with residing students is not present in an individual school attendance boundary.
Source:
Updated Fall 2019 Student Generation Ratesfor 2021-22 School Boundaries
by School and Housing TypeUpdated December 2020 3 4
Multi-family Elevator Multi-family Garden Condo
Multi-family Elevator Multi-family Garden Condo
Multi-family Elevator Multi-family Garden Condo
Rates are based on September 30, 2019 APS Enrollments (Grades K-12) and July 1, 2019 Master Housing Unit Database (MHUD) from Arlington County Government, CPHD, Planning Division.
Multi-family Elevator Multi-family Garden Condo
3 The Fall 2019 Student Generation Rates were amended in Fall 2020 to reflect that 50 units had been mistakenly classified as Multi-family Elevator CAF Only. In Fall 2020, these 50 units were re-classified as Multi-family Garden CAF Only.4 Student Generation Rates reflect the new or adjusted elementary boundaries approved by the School Board on Dec. 3, 2020 for the 2021-22 school year, https://www.apsva.us/post/school-board-adopts-new-elementary-school-boundaries-for-2021-22-school-year/
• Some students were not geocoded for reasons such as (i) they are children of employees who live outside Arlington County, (ii) they reside on Joint Base Myer-Henderson Hall (federal jurisdiction), or (iii) theyare homeless or in foster care outside Arlington County, or live at a shelter.
Attachment C: Updated Fall 2019 Student Generation Rates
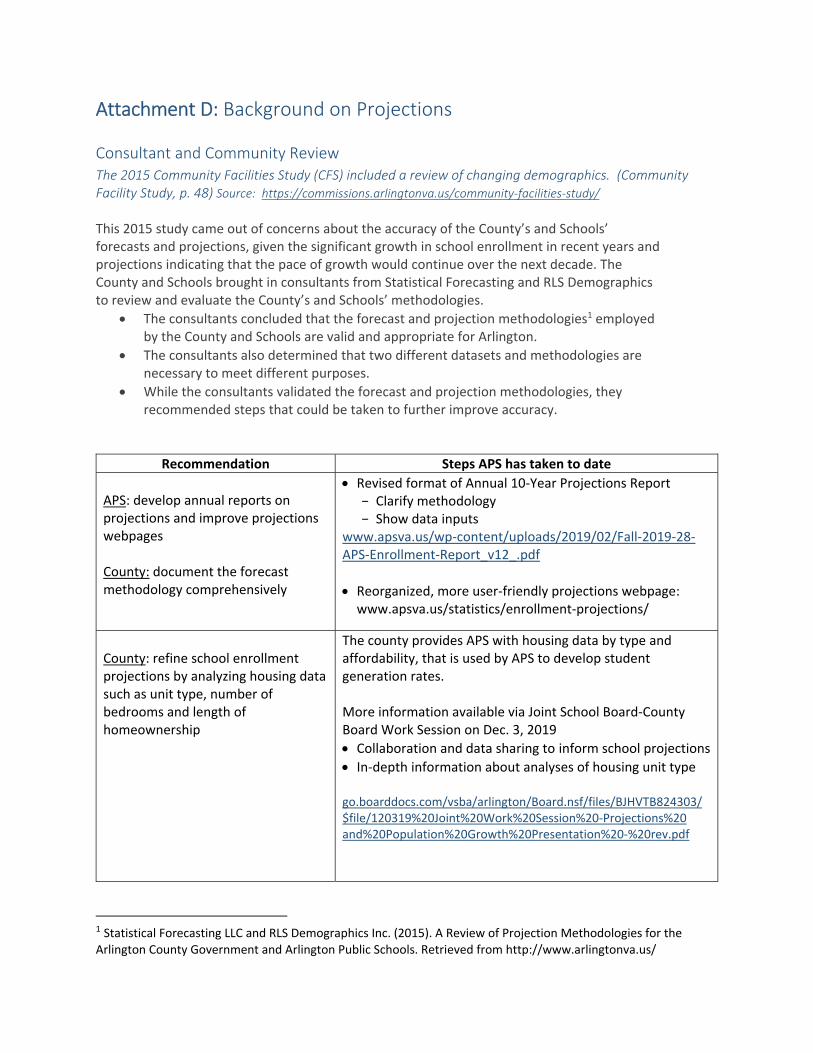
Attachment D: Background on Projections Consultant and Community Review The 2015 Community Facilities Study (CFS) included a review of changing demographics. (Community Facility Study, p. 48) Source: https://commissions.arlingtonva.us/community‐facilities‐study/
This 2015 study came out of concerns about the accuracy of the County’s and Schools’ forecasts and projections, given the significant growth in school enrollment in recent years and projections indicating that the pace of growth would continue over the next decade. The County and Schools brought in consultants from Statistical Forecasting and RLS Demographics to review and evaluate the County’s and Schools’ methodologies.
The consultants concluded that the forecast and projection methodologies1 employed by the County and Schools are valid and appropriate for Arlington.
The consultants also determined that two different datasets and methodologies are necessary to meet different purposes.
While the consultants validated the forecast and projection methodologies, they recommended steps that could be taken to further improve accuracy.
Recommendation Steps APS has taken to date
APS: develop annual reports on projections and improve projections webpages County: document the forecast methodology comprehensively
Revised format of Annual 10‐Year Projections Report − Clarify methodology − Show data inputs
www.apsva.us/wp‐content/uploads/2019/02/Fall‐2019‐28‐APS‐Enrollment‐Report_v12_.pdf Reorganized, more user‐friendly projections webpage:
www.apsva.us/statistics/enrollment‐projections/
County: refine school enrollment projections by analyzing housing data such as unit type, number of bedrooms and length of homeownership
The county provides APS with housing data by type and affordability, that is used by APS to develop student generation rates. More information available via Joint School Board‐County Board Work Session on Dec. 3, 2019 Collaboration and data sharing to inform school projections In‐depth information about analyses of housing unit type
go.boarddocs.com/vsba/arlington/Board.nsf/files/BJHVTB824303/ $file/120319%20Joint%20Work%20Session%20‐Projections%20 and%20Population%20Growth%20Presentation%20‐%20rev.pdf
1 Statistical Forecasting LLC and RLS Demographics Inc. (2015). A Review of Projection Methodologies for the Arlington County Government and Arlington Public Schools. Retrieved from http://www.arlingtonva.us/

Recommendation Steps APS has taken to date
APS: monitor emerging trends in multi‐family housing and potential changes in student generation rates
The 10‐Year Projection Reports annually update student generation rates by housing types More information available via Joint School Board‐County Board Work Session on Dec. 3, 2019; in‐depth information about: Emerging trends in multi‐family housing Changes in student generation rates
go.boarddocs.com/vsba/arlington/Board.nsf/files/BJHVTB824303/ $file/120319%20Joint%20Work%20Session%20‐Projections%20 and%20Population%20Growth%20Presentation%20‐%20rev.pdf
County: Supplement County forecasts with a cohort‐component and demographic analysis, which could help predict future births and students by focusing on the County’s population of women of childbearing age and fertility rates
More information available via Joint School Board‐County Board Work Session on Dec. 3, 2019, which included factors to predict future births: − Cohort component − Demographic analysis
Contracted RLS Demographics in Fall 2019 to update
County forecast model, the Cohort Projection system (last updated in 2016).2 Key findings: − Comparisons of forecasted and actual births for 2017
and 2018 showed that births were over‐estimated in the forecast model
− Total Fertility Rate estimated to decline from 1.44 for 2010‐2015 to 1.34 in 2015‐2020
− Reduced level of in‐migration for ages 20‐29, compared with 2016 model3
go.boarddocs.com/vsba/arlington/Board.nsf/files/BJHVTB824303/ $file/120319%20Joint%20Work%20Session%20‐Projections%20 and%20Population%20Growth%20Presentation%20‐%20rev.pdf
2 RLS Demographics’ update of the birth forecasts includes:
− The latest AGC population forecast (Round 9.1) − Updated analysis of age‐specific fertility rates using 2010 to 2018 historical birth data and US Census
bureau estimates of the distribution of the female population by age − Updated analysis of age‐specific migration using US Census Bureau estimates up to July 1, 2018
3 The updated migration uses the latest Census estimates extrapolated to 2020

Consultant Review March 2017 Review of APS’ Enrollment Projection Process (Presented to School Board on April 6, 2017) https://www.apsva.us/wp‐content/uploads/2015/04/March‐22‐2017‐Projections‐Review‐Report.pdf In Spring 2017, Statistical Forecasting was hired by APS to review the enrollment projection process and to offer recommendations on standardizing the process for the future. As a result, the following steps were taken:
In September 2017, a reorganization moved the Director of Facilities Planning and responsibility for enrollment projections from Facilities and Operations to the new Department of Planning and Evaluation.
APS started to implement the recommendations in the 2017 10‐Year Projections. In January of 2018, APS hired a principal planner to oversee the projections process. The 2018 10‐Year Projections did the following:
− Continued to build upon the recommendations defined in the Statistical Forecasting report − Factored in new boundaries for 2019‐20 for elementary and middle school, and changes to
the Options and Transfer Policy The work plan for the enrollment projections builds three reviews into the process, including:
− An internal review in the summer and again in November by: APS staff in P&E, Finance & Management Services, and Facilities & Operations County government staff from CPHD Statistical Forecasting consultant
− An external review with representatives from the community and advisory committees in November
Additional work was done in 2019 by RLS Demographics to update the Arlington County births forecast model, the Cohort Projection System, last updated in 2016.