asian international journal - aijss.org€¦ · the only constraint on reproduction and...
TRANSCRIPT


Asian International Journal
of
Social Sciences
ISSN 2539-6102
Volume 17 Issue 2
April – June 2017
https://doi.org/10.29139/aijss.201702
Produced in cooperation with the College of Educational and Innovation Research (CEIR) at the
King Mongkut’s Institute of Technology Ladkrabang (KMITL), Bangkok, Thailand.
All works licensed under a Creative Commons Attribution-Non Commercial-No Derivatives 4.0 International License.
The Asian International Journal of Social Sciences (AIJSS) allows the author(s) to hold the copyright without restrictions.
The Asian International Journal of Social Sciences (AIJSS) allows the author(s) to retain publishing rights without restrictions.
http://www.aijss.org
© Asian International Journal of Social Sciences (ISSN 2539-6102) 2014 -2018
This journal is open-access and users may read, download, copy, distribute, print, search, or
link to the full texts, crawl them for indexing, pass them as data to software, or use them for any
other lawful purpose, without financial, legal, or technical barriers other than those inseparable
from gaining access to the internet itself. The only constraint on reproduction and distribution,
and the only role for copyright in this domain, should be to give authors control over the
integrity of their work and the right to be properly acknowledged and cited.

Editor-in-Chief:
Associate Professor Dr. Paitoon Pimdee
Assistant Editor
Assistant Prof. Dr. Puris Sornsarut
Journal Submission Coordinator:
Ms. Montana Srisaisong
The Asian International Journal of Social Sciences (ISSN 2539-6102) is published four
times a year.

Papers/Authors Page
Antecedents affecting Thai auto parts enterprise organizational performance
Somyos Phoosawad and Charlie Jones
https://doi.org/10.29139/aijss.20170201
4-40
Petro-rentierism, Petroleum Pipeline Vandalism and Energy Security in
Nigeria
Al Chukwuma Okoli and Stephen Nnaemeka Azom
https://doi.org/10.29139/aijss.20170202
41-61
Feeding the Planet – Energy for life
Supaloek Sinlaparatanaporn
https://doi.org/10.29139/aijss.20170203
62 – 87
Analyzing the Relationship between Advertising and Sales Promotion
with Brand Equity
Haim Hilman, Jalal R. M. Hanaysha and Noor Hasmini Abd. Ghani
https://doi.org/10.29139/aijss.20170204
88 – 103
Electronics and Hard Disk Industry Competitive Advantage: Is Technology
Capability the Missing Link?
Adisak Suebthamma and Thepparat Pimonsatian
https://doi.org/10.29139/aijss.20170205
104 – 122
Decentralization and Public Expenditure: Does Special Local
Autonomy Affect Regional Economic Growth?
Martapina Anggai and Ari Warokka
https://doi.org/10.29139/aijss.20170206
123–138
4
Antecedents Affecting Thai Auto Parts Enterprise Organization Performance
Somyos Phoosawad
Dr. & C.E.O.
BestTech International Pro Advance Co., Ltd.
14/1 Moo 5 Tambon Ban Pathum Amphur Sam Khok
Pathum Thani Province 12160
Charlie Jones
Academic Advisor
King Mongkut’s Institute of Technology Ladkrabang (KMITL)
1 Chalong Krung, Thanon Chalong Krung, Lat Krabang
Bangkok 10520, Thailand
Reference to this paper should be made as follows:
Somyos Phoosawad and Charlie Jones
Phoosawad, S., & Jones, C. (2017). Antecedents affecting Thai auto parts enterprise organization
performance. Asian International Journal of Social Sciences, 17(2), 4 – 40.
https://doi.org/10.29139/aijss.20170201
All works licensed under a Creative Commons Attribution-Non Commercial-No Derivatives 4.0 International License.
The Asian International Journal of Social Sciences (AIJSS) allows the author(s) to hold the copyright without restrictions.
The Asian International Journal of Social Sciences (AIJSS) allows the author(s) to retain publishing rights without restrictions.
5
Abstract: Thailand is ranked 12th in the world in automotive production, with 57 of the world’s
top 100 auto parts manufacturers having factories in Thailand. The industry employs 525,000
workers and represents 12% of Thailand’s gross domestic production (GDP). The automotive
industry has also been identified as a core industry in the transition to Thailand 4.0, with digitally
enable, knowledge workers key to its success. This study therefore undertook structural equation
modeling to conduct an analysis of variables affecting Thai auto parts industry enterprises
organizational performance. Using purposive sampling, 320 executives in the Thai automotive
industry were selected whose responses to the question constructs were captured using a five-
point Likert type agreement scale. Results determined that leadership skills have a significant
effect on management skills, and that management skills have a direct and positive effect on
management innovation. Additionally, innovation thus far has been viewed as an external
process, primarily in response to customer demands or ‘home office’ requirements. Research
findings therefore suggests that the Thai auto parts industry must develop innovative leadership
management which is crucial in sustaining a competitive, domestic capability.
Keywords: leadership, management innovation, management skill, Thailand
6
Introduction
According to Thailand’s Board of Investment (BOI), in 2016 Thailand had 18 automotive
assemblers, with a combined production of 1.94 million vehicles, which contributed 12% to
Thailand’s gross domestic production (GDP) (Asawachintachit, 2017). Additionally, Thailand
has also become the sixth largest producer of commercial vehicles in the world, which was being
sustained by 462 Tier 1 suppliers and 1,137 Tier 2 and Tier 3 suppliers (Figure 1). Also, 57 of
the world’s top 100 auto parts manufacturers have factories in Thailand (Anthony, 2016), with an
estimated 525,000 automotive sector workers, which the BOI has referred to as ‘highly skilled
and highly trained’.
In regard to the auto parts and car accessory industries, they have a tendency for higher
growth then the manufacturing sector they support. Reasons include the knock-on effect of car
owners tending to enhance their vehicles with enhancement products over the life of the vehicle.
Proof of this is Thailand’s export market for automotive parts, in which Australia and Indonesia
represent 23% of Thailand’s total automotive exports, which represented nearly US$7 billion
(Board of Investment, 2015). Further data shows that US$352 million in engine parts were
exported representing 12.5%, while automotive OEM parts exports represented 78.8%, while 8%
represented spare parts.
According to auto parts manufacturers, component life within the vehicle leads to higher
sales since they complement the purchased product. They also contend that longer lasting and
more durable components is more important to the sector than manufacturing replacement parts
of lower quality. With higher technological and quality standards within the auto parts industry,
longer vehicle life is attained and is viewed as essential by this sector.

7
A typical vehicle consists of 30,000 separate components and even the largest
manufacturing companies cannot produce all their own parts (Dicken, 2003), with outsourcing
often required to furnish the required pieces. The Thai government has therefore identified this
outsourcing requirement as a strategic industry within Thailand, and critical to Thailand’s export
goals (Ministry of Industry, 2010).
Vehicle production and part supply can be categorized in the following two ways:
1) Companies that supply parts or systems directly to original equipment
manufacturers (OEMs) are called Tier 1 suppliers (Silver, 2016). OEM suppliers usually provide
components to auto assembly operations which include such things as cushions, doors, tires,
safety belts and other assembly components for new cars (Figure 1).
2) Many firms supply parts that wind up in cars, even though these firms themselves
does not sell directly to OEMs. These firms are called Tier 2 suppliers, and include examples
such as computer chip manufacturers like Intel or NVIDIA. In the Thai automotive industry’s
supply chain, the 2nd and 3rd tier suppliers are indirect suppliers who provide or produce raw
materials and small auto parts for 1st tier suppliers, who are direct suppliers or OEM suppliers
who produce large auto parts for assemblers (Komolavanij, Jeenannunta, & Ammarapala, 2011).
3) In the automotive industry, the term Tier 3 refers to suppliers of raw, or close-to-
raw, materials like metal or plastic (Silver, 2016). Tier 3 suppliers sell the raw materials that
other firms in the supply chain require to make their specialized products, systems, and
components.

8
Figure 1. Thai automotive suppliers
Source. Nitipathanapirak (2017)
It is difficult to discuss the Thai manufacturing sector today without a side discussion
about Thailand 4.0, which in 2017 has become a daily mantra for what Thailand is to become. In
the simplest of terms Thailand 4.0 is an offshoot of Germany’s Industry 4.0 and the Internet of
Things (IOT). Some also refer to it as the Fourth Industrial Revolution (4IR) (Jones & Pimdee,
2017). It is term also being applied to a new generation of digitally enabled ‘knowledge workers’
that are the pillars for ten key economic sectors identified by the Thai government (Thailand
Investment Review, 2017; Thailand’s 20-Year National Strategy and Thailand 4.0 Policy, 2016).
Bussi and Khatiwada (2017) and Baxter (2017) have also stated that the Thailand 4.0 agenda is
an economic model based on creativity, innovation, new technology, and high-quality services,
which is used to boost the quality of life.
Thailand 4.0 for the automobile and parts manufacturers sectors has been referred to as
the ‘next-generation automotive’. In this sector, the organizations have been advised to urgently

9
adopt new technology and innovative production processes to serve rising demand for energy
saving, environmental protection, and waste management, while responding to increasing
demand for electric vehicles (Thailand 4 auto parts, 2017). Nitipathanapirak (2017) in a Thailand
Automotive Institute presentation depicted Next Generation Vehicles as shown in Figure 2.
This need for urgency is supported by research from Lee (2005), which examined the
controversial relationship between market competition and R&D, and determined that a
company’s ability to compete is tied to the firm’s expertise in technical competency and R&D
productivity. Trott (2011), supports these findings as well in his investigation of Taiwan’s hi-
tech companies’ R&D processes, which determined that when R&D and technology
management ability and performance is strong, new product development increases. Further
research also indicates that when both upstream and downstream R&D cooperation is strong,
process innovation is high (Un & Kazuhiro, 2015), and that external R&D collaborations with
universities and suppliers are the most helpful.
Figure 2. Thai Next Generation Vehicles
Source. Nitipathanapirak (2017)
10
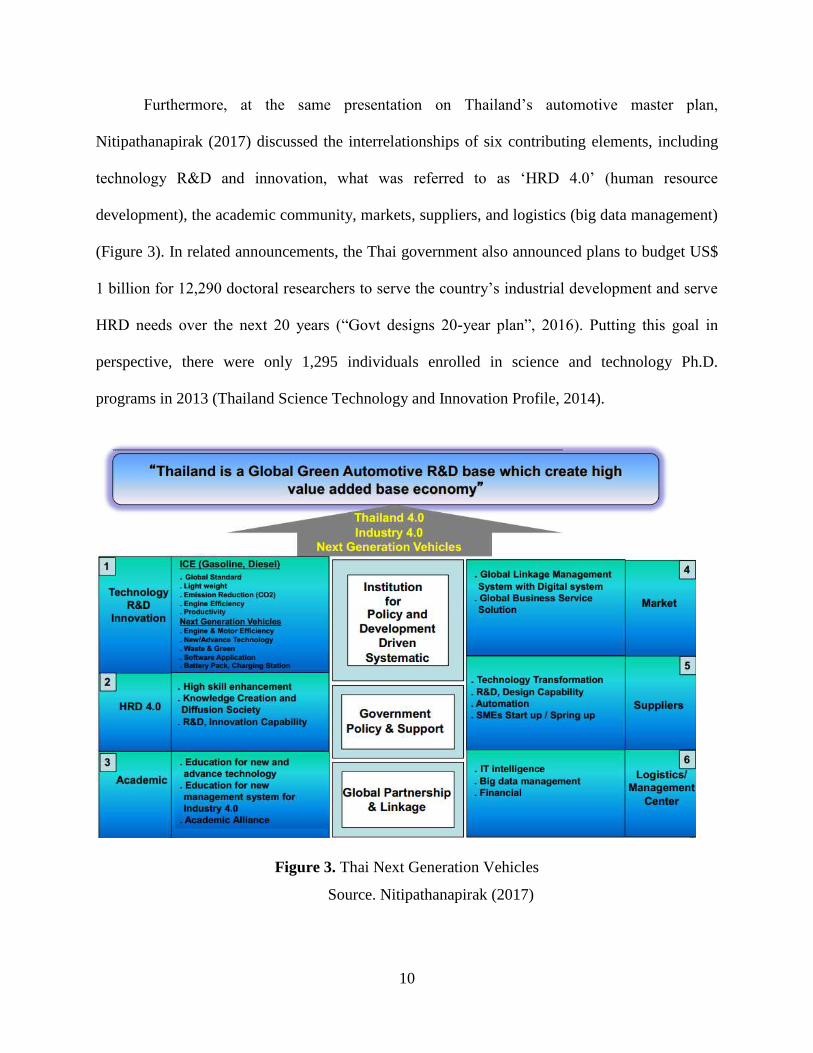
Furthermore, at the same presentation on Thailand’s automotive master plan,
Nitipathanapirak (2017) discussed the interrelationships of six contributing elements, including
technology R&D and innovation, what was referred to as ‘HRD 4.0’ (human resource
development), the academic community, markets, suppliers, and logistics (big data management)
(Figure 3). In related announcements, the Thai government also announced plans to budget US$
1 billion for 12,290 doctoral researchers to serve the country’s industrial development and serve
HRD needs over the next 20 years (“Govt designs 20-year plan”, 2016). Putting this goal in
perspective, there were only 1,295 individuals enrolled in science and technology Ph.D.
programs in 2013 (Thailand Science Technology and Innovation Profile, 2014).
Figure 3. Thai Next Generation Vehicles
Source. Nitipathanapirak (2017)

11
Research Model
Figure 4 shows the conceptual framework for the interdependence and indirect affect
between independent and dependent variables. Management skills for the model include the
observed variables communications skills (COM), motivation (MOV), decision making skills
(DES), and problem-solving skills (PRB). Additionally, management innovation consists of the
observed variables organizational culture (CUL), organizational strategy (STR), and knowledge
management (KM). It also shows, leadership consisting of the observed variables ethical
leadership (ETH), transactional leadership (TRS), and transformational leadership (TRF).
Finally, the dependent variable organization performance consists of three latent variables, which
are personnel (PR), profit (PRO), and income (REV).
Figure 4. Conceptual Model

12
Methodology
Survey Respondents
Thai auto parts industry executives were queried using quantitative research methods of
which 320 responded. The responses to the questions capturing focal constructs used a five-point
Likert type agreement scale (Likert, 1931) with rating statements 1-5; 1 = strongly disagree and
5= strongly agree to survey questions.
Questionnaire Design
For this research, the measurement instrument or questionnaires utilized were prepared
from the literature. To gauge both the content validity and reliability of the survey, 5 specialists
in their respective fields were chosen to evaluate the consistency of the content and confirm it
was valid for the purposes of the research. Additionally, the index of item-objective congruence
(IOC) developed by Rovinelli and Hambleton (1977) was employed to carry out the screening of
questions. The IOC is a procedure used in test development for evaluating content validity at the
item development stage. This measure is limited to the assessment of unidimensional items or
items that measure specified composites of skills. The method prescribed by Rovinelli and
Hambleton (1977) results in indices of item congruence in which experts rate the match between
an item and several constructs assuming that the item taps only one of the constructs which is
unbeknownst to the experts. The research then proceeded to select items that with an IOC index
higher than 0.5 which were considered acceptable.
Questionnaires were constructed to be a tool to measure concept definition and practice.
The instrument or questionnaire used the 5-Point Likert Scale (Likert, 1931) as the measurement
scale and the conceptual framework for determining the internal consistency measured by
coefficient alpha (α-coefficient) of Akron BAC (Cronbach) to calculate the average value of the
13
correlation coefficient. All values lower than 0.50 were eliminated from the measurement. The
α-coefficient found was between 0.763 to 0.908, which is considered reliable. If the alpha value
of each question was below 0.50, the researchers eliminated it from the measurements.
Dependent variable
Organization performance was measured from the observed variable income, profit, and
(Kaplan & Norton, 1992; Post & Griffin, 1997) as a tool in analysis according to a conceptual
framework and operational definitions. The analytical measuring tool or questionnaire used a 5-
Point Likert Scale as a measuring tool (Likert, 1931).
Independent Variables
The scales of organizational leadership have been developed into three types of
leadership measures such as transformational leadership, transactional leadership (Bass, 1985;
Yukl, 1989; Sarros et al., 2011), and ethical leadership (Aronson, 2001) The construction of the
measuring tool or questionnaire used a 5-point Likert Scale as a measuring scale (Likert,1931).
Management skill was analyzed with the measuring scale from Olorisade (2011) and
Yukl (1989) and has been classified into four areas which are communication skills, motivation,
decision-making skills, and problem-solving skills and has developed the measuring scale from
(Y). The construction of the measuring tool or questionnaire used a 5-Point Likert Scale as a
measuring scale (Likert,1931).
Management innovation consists of organizational strategies, which were developed from
the measuring scale from Chong, Felix, Chan, Ooi, and Sim, (2011). Organizational culture was
developed from the measuring scale from Marcoulides and Heck (1993) and Petty, Beadles,
Lowery, Chapman, and Connell (1995), while knowledge management was developed from the
measuring scale from (Ahmad & Schroeder, 2011; Kadapa and Wolf, 2006). The construction of

14
the analysis tool and questionnaire used a 5 -Point Likert Scale as a measuring scale (Likert,
1931).
Results
Quantitative research was conducted by using the Partial Least Squares (PLS) statistical
method and hypothesis testing with PLS-Graph software (Chin, 2001), which analyzes the
display and model structure associated with the observed manifest variables with latent variables.
Verification of the accuracy and reliability of the measurements multi-item measures
were developed based on Cronbach’s (alpha). This study then calculated Cronbach’s alphas
for each construct. As shown, the reliability measured ranged from 0.763 to 0.908, which is
considered to have good reliability.
Reflective model structures were created for this research and tested for convergent
validity and discriminant validity. The criteria for convergent validity are as follows: the loading
value must be positive, the indicator loading values must be over 0.707 with a statistical
significance of ( t 1.96) for all values with the study using a loading value from 0.707 and a
significant level of confidence at 95% (t-stat. > 1.96), showing which factors affect organization
performance. (Lauro & Vinzi, 2004; Henseler, Ringle, & Sinkovics, 2009) The results are shown
in Table 1 below.
Convergent validity refers to where the results acquired from one scale are correlated
with those of a different measure of the same variable: and if the results are high, convergent
validity has been achieved. Conversely, discriminate validity involved correlating the results of a
measure to a different variable and in this case a low result indicates discriminant validity (Hair,
Jr., Hult, Ringle, & Sarstedt, 2016).

15
Table 1 shows that the latent variable leadership, included three observed variables
including ethical leadership, transactional leadership, and transformational leadership, which
had loading factors of 0.919, 0.888 and 0.935, respectively. The data showed a significant level
of confidence percentage of 0.95 ( t 1.96), which validates high reliability influence on
organization performance.
Table 1
Statistic values presenting convergent validity of reflective scales of latent variables
Construct/Item Loading t-stat
LDS: Leadership
ETH: Ethical Leadership 0.919 54.240
TRS: Transactional Leadership 0.888 42.185
TRF: Transformational Leadership 0.935 48.435
MGS: Management Skills
COM: Communication Skills 0.911 38.601
MOV: Motivation 0.851 48.301
DES: Decision Making Skills 0.925 42.364
PRB: Problem Solving Skills 0.888 45.613
INO: Management Innovation
CUL: Organizational Culture 0.916 47.020
STR: Organizational Strategy 0.927 52.608
KM: Knowledge Management 0.927 51.525
PER: Organization Performance
REV: Income 0.850 21.3285
PRO: Profit 0.851 23.0463
PR: Personnel 0.835 16.4266

16
Factors of management skill are communication, motivation, decision making, and
problem solving, which had loading factors of 0.911, 0.851, 0.925, and 0.888, respectively.
The data therefore showed a significant level of confidence percentage of 0.95 ( t 1.96),
which validates high reliability influence on organization performance.
Factors of management innovation are organizational culture, organizational strategy,
and knowledge management, which had loading factors of 0.916, 0.927, and 0.927,
respectively. The data therefore showed a significant level of confidence percentage of 0.95 (t-
stat> 1.96), which validates high reliability influence on organization performance.
Factors of organization performance are income, profit, and personnel, which had
loading factors of 0.850, 0.851, and 0.835, respectively. The data therefore showed a significant
level of confidence percentage of 0.95 ( t 1.96).
Discriminant validity
Hooper, Coughlan, and Mullen (2008) indicated that items with low multiple R2 (less
than 0.20) should be removed from an analysis, as this is an indication of very high levels of
error. This is confirmed by Hair, Jr. et al. (2016) which has indicated that R2 values of 0.75 are
substantial, 0.50 are moderate, and 0.25 are weak.
Discriminant validity was also tested on scale reliability, including composite reliability
(CR), which should not be lower than 0.60, while average variance extract (AVE) should not be
lower than 0.50, while the AVE in the diagonal should have a value higher than cross construct
correlation of all values in the same column. The data validates that there was discriminant
validity for each construct, without exception (Lauro & Vinzi, 2004). Testing results of
discriminate validity of this research was in accordance with all conditions shown in Table 2.

17
Table 2
Results of confirmatory factor analysis (CFA) for the measurement model showing the statistical
discriminant validity
Construct CR R2 AVE cross construct correlation
LDS MGS INO PER
Leadership (LDS) 0.939 - 0.836 0.914
Management Skills (MGS) 0.941 0.773 0.800 0.879 0.894
Management Innovation (INO) 0.946 0.724 0.853 0.755 0.851 0.924
Organization Performance (PER) 0.882 0.488 0.714 0.667 0.661 0.640 0.845
Note. Statistical significance level is at 0.01 and diagonal figures mean AVE . CR - composite
reliability, AVE - average variance extracted, R2 - square of the correlation
The final analysis model of factors affecting the organization performance of the
automotive parts company in Thailand are shown in Figure 5.

18
Figure 5. Final Model
Notes. Circles represent the latent variables, and boxes represent the observed variables.
Quantities above the numbers in parentheses, are the standardized factor loadings or correlations,
while their standard errors are in parentheses. The values for R2 in the final model are MGS =
.773, INO = .724, and PER = .488.

19
The research hypothesis test results according to the research hypothesis as shown in Table 3
Table 3
The research hypothesis test results according to the research hypothesis
Hypothesis coef. t-stat Results
H1: Leadership has a direct positive effect on management skills
0.879 51.172 Supported
H2: Leadership has a direct positive effect on management innovation 0.032 0.381 Rejected
H3: Leadership has a direct positive effect on organization
performance
.
0.429 4.343 Supported
H4: Management skills have a direct positive effect on management
innovation
0.823 12.037 Supported
H5: Management skills have a direct positive effect on organization
performance.
0.241 1.857 Rejected
H6: Management innovation has a direct positive effect on
organization performance.
0.316 3.098 Supported
Discussion
Leadership
The study confirmed hypothesis 1 (H1) that leadership has a direct positive effect on
management skills. This is consistent with research from China in which it was determined that
relational leadership plays a significant role on the three different stages of employee innovation
and is a powerful motivational tool (Akram, Lei, & Haider, 2016).
Hypothesis 2 (H2) however was rejected. Hypothesis 2 was hypothesized that leadership
had a direct positive effect on management innovation. Reasons for this are most probably
associated with the nature of the survey and the related structure of the enterprises and the
management structure of Thai auto parts companies. Since Thai executives are seldom looked to
for creative or innovative thinking (that is an external), their answers most probably reflected the

20
fact that innovation comes from the ‘home office’ (Japan, Germany, USA, etc.), and it was not
their job in this process.
Komolavanij, Jeenannunta, and Ammarapala (2011) succinctly summarized this issue
when they stated in their analysis of the Thai auto industry that the major motivation for
innovation is the change in demands on products or production styles from customers, forcing
the company to generate new ideas and production methods. In other words, innovation need
originates from outside the organization, and more times than not, both the customer and
corporate managers are not in Thailand.
The study additionally confirmed hypothesis 3 (H3) that leadership has a direct positive
effect on organization performance. Support for this comes from a study concerning
transformational leadership on Toyota’s dealership network in Thailand in which it was revealed
that intellectual stimulation has a significant positive effect on strategic human resource
management (Pongpearchan, 2016). Furthermore, intellectual stimulation and inspirational
motivation play significant roles in the firm’s success, while strategic human resource
management has a significant and positive effect on the firm’s overall success.
Transformational Leadership
The characteristics of transformational leaders cause crucial changes (Dvir et al., 2002;
Judge & Piccolo, 2004; Turner et al., 2002), and have the capacity of vision, strategy, and
organizational culture, including promotion of work (Avolio, 1999; Bass & Riggio, 2005).
Ethical Leadership
In research concerning ethical leadership, it was revealed that leadership affected spirit
and teamwork morale, good social relationship building, and success from organizational
performance (Aronson, 2001). These characteristics are consistent with the study results of

21
Panuwatwanich et al. (2009) on leadership, in which organizational team building through
organizational culture was determined to influence innovation distribution that led to business
performance increases.
Transactional Leadership
With regards to education, transactional leaders focus on running a smooth, highly
efficient, and highly motivated operation. This is why these types of leaders tend to be experts in
management functions (Bass, 1985; Yukl, 1989). Transactional leadership can only be
established when the leader has determined the goals or objectives, completely understands the
requirements of operational personnel, and selects suitable rewards for motivation (Bass &
Avolio, 1990; Chen & Fahr, 2001; Sadler, 1997; Sarros, Cooper, & Santora, 2011).
Management Skills
The study also confirmed hypothesis 4 (H4) that management skills have a direct positive
effect on management innovation.
The study however rejected hypothesis 5 (H5) that management skills have a direct
positive effect on organization performance. Once again, the reason for this most likely lies in
the nature of Thai automotive parts enterprise management structure, and the fact that the
innovation of process improvement is done via the auditing process between the automotive
manufacturers and the suppliers, as is required by ISO/TS 16949 (Somolavanij, Jeenanunta, &
Ammarapala, 2010).

22
Management Innovation
The study also confirmed hypothesis 6 (H6) that management innovation has a direct
positive effect on organization performance. This is consistent with research from Brazil
concerning large industrial companies in which it was determined that innovation is now
becoming a distinct and emerging organizational function (Bagno, Salerno, & Dias, 2017).
Knowledge Management
Thailand’s goal for a digital economy is based on knowledge management, with planning
being crucial to success (Reeve, 2016; Tan & Tang, 2016; Tortermvasana, 2016). This includes
online management, digital content, and understanding and implementing the ‘Internet of
Things’, as nearly everything in the future will be linked to the Internet. Success will be
determined by how well organizations can collect, analyze, and use their ‘big data’. Not only will
machines talk to humans, but machines will be talking to machines. If Thailand
automates, embraces digitalization, and ramps up R&D, it can maintain its position as the
region’s top manufacturing hub (Baxter, 2017).
Furthermore, a rich pipeline of innovations in materials and processes—from
nanomaterials to 3-D printing to advanced robotics—also promises to create fresh demand and
drive further productivity gains across manufacturing industries and geographies (McKinsey,
2012). The determination of strategy, target, organizational structure, and human behavior in the
organization from employees and organizational leaders need to be targeted on responding to
these fast paced, changing business environments.
For knowledge management dimension, Klomthong (2006) studied the way of learning
development in the organization of Thai automotive industry, organizational learning
development term of Thai auto parts industry and developed organizational learning

23
development term that could enhance operational potential in Thai automotive industry. The
finding result was on status and potential of Thai automotive industry that auto assembly
industry had still had high potential.
However, Kadapa and Wolf (2006) found that knowledge exchange among employees
would be the driver for creating new production method also directly affecting delivery time
reduction. The learning was based on technological strategy under environmental and
organizational context, the user of production technology and knowledge construction process
could affect competitive potential of organization (Ahmad & Schroeder, 2011). The essence for
application of knowledge management was organization and technology that were supportive
tools for effective transition of knowledge management to people in both internal and external
organization (Grant, 1996; Spender, 1996) and such variables would affect higher performance
in the organization.
Kaymaz (2010)’s research in Turkey on how job rotation motivated employees confirmed
the hypothesis, with job rotation contributing to a reduction in work monotony, an enhancement
of job related knowledge, increased skills, and increased the ability for better communications
skills between operators within the organization.
Organizational Culture
According to the study of Kotter and Heskett (1992), organizational culture has a
significant impact on long term economic performance, especially in those organizations with an
emphasis on the organization’s external environment. Organizational culture was also judged to
be an important factor in organizational success and failure.

24
Research from Marcoulides and Heck (1993) found that organizational culture consisted
of five variables, including organizational structure, organizational works, organizational values,
and organizational environment, and attitudes of employees.
Belzowski, Flynn, Richardson, and Sims (2003) investigated the North America auto
industry and determined that the following issues related to knowledge initiatives need to be
considered within their organizations. They were:
1. the value of knowledge within the organisation;
2. acknowledge likely gaps between the perceived benefits and reported knowledge
activity levels;
3. resolve discontinuities in knowledge sharing activities within the company;
4. consider possible differences in the perceptions of knowledge activities among the
company, its customers, and its suppliers;
5. take into account differing emphases by the company, its customers, and its
suppliers on people, technology, process, and culture as facilitators of knowledge activities;
6. and measure and incent knowledge activities in order to manage them effectively.
West & Burnes (2000) studied on organizational learning: Lesson from automotive
industry and the finding gained was that learning in the organization and organization of learning
were concepts being interested in the past decade. The studying result showed that the companies
tried to foster learning in the organization for effective development in the operations in order
that the learning in the organization was always not the factor to assure the organizational
success.

25
Conclusion and Suggestions
Thailand is embraced in a race to innovate and digitize. Knowledge workers with 21st
Century skill sets are required but too many studies confirm this is going to be a tall mountain to
climb domestically. Some have suggested Thailand relax its investment and foreign worker rules
and invite foreigners with appropriate and necessary skills to ease the burdens of organizations
desperate for digitally enabled, critical thinking capable, new generation knowledge workers. At
the core of Thailand 4.0 is the automobile manufacturing and auto parts industry, which in 2017
is number one within the ASEAN community, and 12th globally.
The bottom line for the automobile and automotive parts industry is although globally on
the surface performance is strong, with worldwide sales reaching a record 88 million autos in
2016, the industry is in serious trouble (Parkin, Wilk, & Singh, 2017).
In simple terms, total shareholder return (TSR) for the automotive industry is
significantly below the annual rates of return that the S&P 500 and Dow Jones Industrial
Average achieved for investors. Second, return on invested capital in 2016 was anemic. These
numbers almost outweigh the positive sales and earnings results. Assessments suggest that there
will be relatively few winners in the auto industry during the next five years and beyond. Those
that do stand out will be the companies that harness their limited capital resources in creative
ways, to navigate a still-unfolding and unfamiliar landscape (Parkin et al., 2017).
To quote Parkin et al. (2017), “…what is particularly notable about the current wave of
innovation in automobiles is…the breadth of the innovation — how much it is altering the basic
contours and features of the traditional automobile and amplifying the difficulty and cost of
manufacturing cars. Ubiquitous electronics, a variety of digital services, and novel powertrains
and connectivity systems are hastening the need for expensive new parts, components, and

26
functions. For OEMs, the price tag is high — as much as 20% greater than the cost of the
previous generation of automobiles.”
Therefore, what are the key innovations that will play a role on Thai automotive parts
organization performance in the future?
1. Embracing new technologies such as in safety and entertainment, such as 3D
laminated glass, haptic sensors, and augmented reality heads-up displays — which offer drivers
alerts, safety aids, and warnings on invisible screens embedded in the windshield.
2. Encourage and develop domestic software engineers as a new Ford F150 pickup
comes with over 150 million lines of code, which compares to a Boeing 787 Dreamliner which
has only 7 million lines of code (Edelstein, 2015). Automobile companies have become data
companies, collecting, analyzing, and leveraging the vast amounts of data from thousands of
sensors in their cars.
3. Offload more development work to technology suppliers. OEMs need to identify
which aspects of a vehicle’s digital features they can hand off to tech industry partners that have
more expertise in designing and producing digital components and software.
4. Redesign distribution models, as typically 15% of a car’s cost typically goes to
distribution (Parkin et al., 2017). This is a perfect knock-on effect for a digitally enabled
Thailand, as significant consumer savings can be made from selling via Web channels and with
the use of smartphones.
5. Focus on the development of smart innovative clusters, where regulatory issues
take a second position to the pace of change, and the needs for creativity and innovation.

27
6. Robotics technology is a critical component of automotive manufacturing today.
According to a Brookings Institute study, of the 233,305 industrial robots in the US in 2015,
nearly 50% were working in the automotive sector (Muro, 2017).
7. And finally, “Talk is cheap” and “It is not what you say, it is what you do” that is
important at the end of the day.

28
References
Ahmad, S., & Schroeder, R. G. (2003). The impact of human resource management practices on
operational performance: recognizing country and industry differences. Journal of Operations
Management, 21(1), 19-43. https://doi.org/10.1016/s0272-6963(02)00056-6
Akram, T., Lei, S., & Haider, M. J. (2016). The impact of relational leadership on employee
innovative work behavior in IT industry of China. Arab Economic and Business Journal, 11(2),
153 – 161. https://doi.org/10.1016/j.aebj.2016.06.001
Anthony, C. (2016, November 11). Inside Thailand’s rising automotive industry.
Retrieved from http://tinyurl.com/y92d8lyp
Aronson, E. (2001). Integrating leadership styles and ethical perspectives. Canadian Journal of
Administrative Sciences, 18, 244-256. https://doi.org/10.1111/j.1936-4490.2001.tb00260.x
Asawachintachit, D. (2017, April). Opportunity Thailand. Thailand Board of Investment.
Retrieved from http://tinyurl.com/ybwh4h2s
Avolio, B. (1999). Full Leadership Development: Building the Vital Forces in Organizations.
Retrieved from http://tinyurl.com/y96u5chg

29
Bagno, R. B., Salerno, M. S., & Dias, A. V. C. (2017). Innovation as a new
organizational function: evidence and characterization from large industrial companies in
Brazil. Production, 27. http://dx.doi.org/10.1590/0103-6513.207316
Bass, B. M. (1985). Leadership and performance beyond expectations. New York: Free Press.
Bass, B. M., & Avolio B. J. (1990). The implications of transactional and
transformational leadership for individual, team, and organizational development. Research in
Organizational Change and Development, 4, 231–272.
Bass, B. M., & Riggio, R. E. (2005). Transformational Leadership. London: Routledge.
Baxter, W. (2017). Thailand 4.0 and the future of work in the Kingdom. International
Labour Organisation. Retrieved from http://tinyurl.com/ybvqew6n
Bennis, W., & Nanus, B. (1985). Leaders. New York, NY: Harper & Row.
Belzowski, B. M., Flynn, M. S., Richardson, B. C., & Sims, M. K. (2003). Harnessing
knowledge: The next challenge to interfirm cooperation in the North American auto industry.
International Journal of Automotive Technology and Management, 3(1/2), 9-
29. https://doi.org/10.1504/ijatm.2003.003380

30
Birkinshaw, J., Hamel, G., & Mol, M. J. (2008). Management innovation. Academy
of Management Review, 33, 825–845.
Board of Investment. (2015). Thailand: Global green automotive production base. Retrieved
from http://tinyurl.com/ht74q8g
Boedker, C., Vidgen, R., Meagher, K., Cogin, J., Mouritsen, J., & Runnalls, J. M. (2011).
Leadership, culture and management practices of high performing workplaces in Australia: The
high performing workplace index. Department of Education, Employment and Workplace
Relations. Published by the Society for Knowledge Economics, October 2011.
Burns, J. (1978). Leadership. New York, NY: Harper and Row.
Bussi, M., & Khatiwada, S. (2017, April 11). Thailand 4.0 and the future of work. Bangkok
Post. Retrieved from http://tinyurl.com/y86afunj
Chin, W. W. (2001). PLS-Graph user’s guide, Version 3.0. Houston, TX: Soft Modeling.
Conger, J. (1999). Charismatic and transformational leadership in organizations: An insider’s
perspective on these developing streams of research. Leadership Quarterly, 10(2), 145-179.
https://doi.org/10.1016/s1048-9843(99)00012-0

31
Chen, X-P., & Fahr, J-L. (2001) Transformational and transactional leader behaviors in Chinese
organizations: Differential effects in the People’s Republic of China and Taiwan. Advances in
Global Leadership, 2, 101 – 126. https://doi.org/10.1016/s1535-1203(01)02116-5
Chong, A. Y. L., Chan, F. T. S., Ooi, K. B., & Sim, J. J. (2011). Can Malaysian firms improve
organizational/innovation performance via SCM? Industrial Management & Data Systems,
111(3), 410 – 431. https://doi.org/10.1108/02635571111118288
Cusumano, M. A. (1988). Manufacturing innovation: Lessons from the Japanese auto industry.
MIT Sloan Management Review. Retrieved from http://tinyurl.com/yarlsy9f
Dicken, P. (2003). Global production networks in Europe and East Asia: The automobile
components industries. GPN Working Paper 7. University of Manchester.
Retrieved from http://tinyurl.com/y6wbj46y
Dvir, T., Eden, D., Avolio, B. J., & Shamir, B. (2002). Impact of transformational leadership on
follower development and performance: A field study. Academy of Management Journal,
45,735–744.
Edelstein, S. (2015, May 14). The Ford GT has more lines of code than a Boeing passenger jet.
Retrieved from http://tinyurl.com/p48a89e

32
Govt designs 20-year plan to churn out more researchers. (2016, August 20). Bangkok
Post. Retrieved from http://tinyurl.com/gkuqeuj
Grant, R. M. (1996). Prospering in dynamically-competitive environments: organisational
capability as knowledge integration. Organisation Science, 7(4), 375-
87. https://doi.org/10.1016/b978-0-7506-7088-3.50011-5
Hair, J. F., Jr., Hult, G. T. M., Ringle, C. & Sarstedt, M. (2016). A primer on partial
least squares structural equation modeling (PLS-SEM) (3rd ed.). Thousand Oaks, CA: Sage.
Henseler, J., Ringle, C. M., & Sinkovics, R. R. (2009). The use of partial least squares
path modeling in international marketing. The use of partial least squares path modeling
in international marketing, in R. R. Sinkovics, P. N. Ghauri (ed.) New Challenges
to International Marketing (Advances in International Marketing,Volume 20) Emerald
Group Publishing Limited, pp.277 – 319. Retrieved from http://tinyurl.com/lcy4xkc
Javadin, S. R. S., Tehrani, F. A. M., & Ramezani, A. (2010). Studying the Relationship Between
Managerial Skills and Efficiency of Bank Branches. World Applied Sciences Journal, 11(2),
170-177.
Jones, C., & Pimdee, P. (2017). Innovative ideas: Thailand 4.0 and the Fourth
Industrial Revolution. Asian International Journal of Social Sciences, 17(1), 4 –
35. https://doi.org/10.29139/aijss.20170101

33
Judge, T. A., & Piccolo, R. F. (2004). Transformational and transactional leadership: A meta-
analytic test of their relative validity. Journal of Applied Psychology, 89, 755-
768. https://doi.org/10.1037/0021-9010.89.5.755
June vehicle sales in Thailand up 5.7%, June production down 2.5%. (2017, June).
Retrieved from http://tinyurl.com/y7m4gu2u
Kadapa, K., & Wolf, P., (2006). Building KM. Real life knowledge management: Lessons from
the field. London: Knowledge Board.
Kanungo, R. N. (2009). Ethical values of transactional and transformational leaders. Canadian
Journal of Administrative Sciences, 18(4), 257 – 265. https://doi.org/10.1111/j.1936-
4490.2001.tb00261.x
Kaplan, R. S., & Norton, D. P. (1992). The balanced scorecard – Measures that drive
performance. Harvard Business Review, (January-February), 71-79. Retrieved
from http://tinyurl.com/mswv8ch
Katz, R. L. (1974). Skills of an effective administrator. Harvard Business Review, 52, 90–102.
Retrieved from http://tinyurl.com/ybq8kbe5

34
Kaymaz, K. (2010). The effects of job rotation practices on motivation: A research on managers
in the automotive organizations. Business and Economics Research Journal, 1(3), 69-85.
Retrieved from http://tinyurl.com/y7sxcd3g
Klomthong, P. (2006). Organizational learning development of Thai automotive industry.
Retrieved from http://drpranee.blogspot.com/
Komolavanij, S., Jeenannunta, C., & Ammarapala, V. (2011). Innovation capability of
Thailand’s automotive industrial network, in Intarakumnerd, P. (ed.), How to Enhance
Innovation Capability with Internal and External Sources. ERIA Research Project Report 2010-
9, Jakarta: ERIA. pp.219-272. Retrieved from http://tinyurl.com/y9txfd94
Kotter, J. P., & Heskett, J. L. (1992). Corporate Culture and Performance. New York, NY: The
Free Press.
Lauro, C., & Vinzi, V. E. (2004). Some contribution of PLS path modeling and a system for the
European customer satisfaction. Dipartimento di Matematica e Statistica Universita Federico II
di Napoli. Retrieved from http://tinyurl.com/lp8qcrf
Lee, C.-Y. (2009). Competition favors the prepared firm: Firms’ R&D responses to competitive
market pressure. Research Policy, 38(5), 861–870.
http://dx.doi.org/10.1016/j.respol.2009.01.005

35
Likert, R. (1931). A technique for the measurement of attitudes. Archives of Psychology. New
York, NY: Columbia University Press.
Lomas, M. (2017 February 18). Which Asian Country Will Replace China as the ‘World’s
Factory’? The Diplomat. Retrieved from http://tinyurl.com/y7clmoaf
Marcoulides, G. A., & Heck, R. H. (1993). Organizational culture and performance: Proposing
and testing model. Organization Science, 4(2), 209-225.
Mintzberg, H. (2003). The strategy process: concepts, contexts, cases. Pearson education.
McKinsey. (2012). Manufacturing the future: The next era of global growth and innovation.
Retrieved from http://tinyurl.com/gttepsg
Ministry of Industry. (2010). FTA with advancement of Thailand industry to AEC and world
market. Public Relations Newsletter, Office of Industrial Economics.
Mobley, W., & Dorfman, P. W. (2003). Advances in Global Leadership. Oxford, U.K.: Elsevier
Science Ltd.
Nitipathanapirak, R. (2017, April 27). Thai automotive industry current situation
and structure. Thailand Automotive Institute. Retrieved from http://tinyurl.com/ybxz5s6b

36
Northouse, P. G. (2001). Leadership: Theory and Practice. Thousand Oaks, CA: Sage.
Olorisade, G. O., (2011). Influence of managerial skills of middle-level managers on
organizational effectiveness, in Nigerian colleges of education. Academic Research
International, 1(2).
Panuwatwanich, K., Stewart, R. A., & Mohamed S. (2009). Validation of an empirical model for
innovation diffusion in design firms. Construction Innovation, 9(4), 449-
467. https://doi.org/10.1108/14714170910995976
Parkin, R., Wilk, R., & Singh, A. (2017). 2017 Automotive Trends. Retrieved
from http://tinyurl.com/yc4ysq6z
Petty, M. M., Beadles, N. A., Lowery, C. M., Chapman, D. F., & Connell, D. W. (1995).
Relationships between organizational culture and organizational performance.
Psychological Reports, 76, 483-492. https://doi.org/10.2466/pr0.1995.76.2.483
Pongpearchan, P. (2016). Effect of transformational leadership on strategic human resource
management and firm success of Toyota’s dealer in Thailand. Journal of Business and Retail
Management Research, 10(2). Retrieved from http://tinyurl.com/y9trg59g
Post, J., & Griffin, J. (1997). Corporate reputation and external affairs management. Corporate
Reputation Review, 1, 165-171.

37
Reeve, E. M. (2016). 21st century skills needed by students in technical and vocational education
and training (TVET). Asian International Journal of Social Sciences, 16(4), 65 –
82. https://doi.org/10.29139/aijss.20160404
Rovinelli, R. J., & Hambleton, R. K. (1977). On the use of content specialists in the assessment
of criterion-referenced test item validity. Dutch Journal of Educational Research, 2, 49-60.
Sadler, L. (1997). Clitics and the structure-function mapping. Retrieved
from http://tinyurl.com/y98mm52r
Sadoi, U. (2010). Technological capability of automobile parts suppliers in Thailand. Journal
of the Asia Pacific Economy, 15(3), 320 – 334.
http://dx.doi.org/10.1080/13547860.2010.494912
Sarros J. C., Cooper, B. K., & Santora, J. C. (2011). Leadership vision, organizational culture,
and support for innovation in not-for-profit and for-profit organizations. Leadership &
Organization Development Journal, 32(3), 291-309.
https://doi.org/10.1108/01437731111123933
Sashkin, M. (1987). A new vision of leadership. The Journal of Management Development, 6(4),
19-28.
38
Sashkin, M. (1996). Visionary Leadership Theory. Washington, DC: The George Washington
University.
Sashkin, M. (2004). Transformational leadership approaches: a review and synthesis. In
Antonakis, J., Cianciolo, A. T., & Sternberg, R. J. (Eds). The Nature of Leadership.
Silver, D. (2016). The automotive supply chain, explained. Retrieved
from http://tinyurl.com/y7yrnykw
Sitterly, C. (1993). The woman manager: Developing essential skills for success. Crisp
Publications.
Smircich, L. (1983). Concept of culture and organizational analysis. Journal of Administrative
Science Quarterly, 28, 339-358.
Somolavanij, S., Jeenanunta, C., & Ammarapala, V. (2010). Thai Automotive
industry: Opportunities and challenges’, in Intarakumnerd, P. (ed.), Fostering Production
and Science and Technology Linkages to Stimulates Innovation in ASEAN. ERIA Research
Project Report 2009-7-4, Jakarta: ERIA. pp.230-270. Retrieved from http://tinyurl.com/y6uoevjj
Spender, J. C. (1996). Organizational knowledge, learning and memory: three concepts in search
of a theory. Journal of Organizational Change Management, 9, 63-78.
https://doi.org/10.1108/09534819610156813
39
Tan, K. S., & Tang, T. H. J. (2016). New skills at work: Managing skills challenges in ASEAN-5.
Information Systems. Research Collection School of Economics. Retrieved
from http://ink.library.smu.edu.sg/soe_research/1891
Thailand 4 Auto parts makers urged to adopt new technology. (2017, May
1). The Nation. Retrieved from http://tinyurl.com/ycgf4vo9
Thailand’s 20-Year National Strategy and Thailand 4.0 Policy (2016). Retrieved from
http://tinyurl.com/n3wlsu6
Thailand Investment Review. (2017). Thailand 4.0 mean opportunity Thailand.
Retrieved from http://tinyurl.com/m4gxq47
Thailand Science Technology and Innovation Profile. (2014, February). Ministry of Science
(Thailand). Retrieved from http://tinyurl.com/jspqebs
Tibus, C. (2010). Leadership beyond the glass ceiling: does ownership matter? Leadership &
Organization Development Journal, 31(8), 743-757.
https://doi.org/10.1108/01437731011094784
Tortermvasana, K. (2016, May 27). ICT pushes drive towards ‘Thailand 4.0’. Bangkok
Post. Retrieved from http://tinyurl.com/hkbv4t7
Trott, P. (2011). Innovation management and new product development. Prentice Hall.
40
Turner, N., Barling, J., Epitropaki, O., Butcher, V., & Milner, C. (2002).
Transformational leadership and moral reasoning. Journal of Applied Psychology, 87, 304 –
311. https://doi.org/10.1037//0021-9010.87.2.304
Un, C. A., & Kazuhiro, A. (2015). Types of R&D collaborations and process innovation: The
benefit of collaborating upstream in the knowledge chain. Journal of Product Innovation and
Management, 32(1), 138–153. http://dx.doi.org/10.1111/jpim.12229
West, P., & Burnes, B. (2000). Applying organizational learning: lessons from the automotive
industry. International Journal of Operations & Production Management, 20(10), 1236 –
1252. https://doi.org/10.1108/01443570010343762
Yukl, G. A (1989). Leadership in Organizations. Englewood Cliffs, NJ: Prentice-Hall.

41
Petro-Rentierism, Petroleum Pipeline Vandalism and Energy Security in Nigeria
Al Chukwuma Okoli
Lecturer, PhD.
Department of Political Science
Federal University, Lafia
Nasarawa State, Nigeria
Stephen Nnaemeka Azom
Lecturer, PhD.
Department of Political Science
Federal University, Lafia
Nasarawa State, Nigeria
Reference to this paper should be made as follows:
Al Chukwuma Okoli and Stephen Nnaemeka Azom
Okoli, A. C., & Azom, S. N. (2017). Petro-rentierism, petroleum pipeline vandalism and energy
security in Nigeria. Asian International Journal of Social Sciences, 17(2), 41 – 61. Retrieved
from http://aijss.org/index.php/aijss20170202/
All works licensed under a Creative Commons Attribution-Non Commercial-No Derivatives 4.0 International License.
The Asian International Journal of Social Sciences (AIJSS) allows the author(s) to hold the copyright without restrictions.
The Asian International Journal of Social Sciences (AIJSS) allows the author(s) to retain publishing rights without restrictions.

42
Abstract: This paper interrogates the nexus between petro-rentierism, petroleum pipeline
vandalism and energy security in Nigeria. By means of qualitative discourse, predicated on
secondary data and systematized by the structural theory of the state, the paper posits that the
incidence of petroleum pipeline vandalism in Nigeria is symptomatic of petro-rentier pathology
whose impact has negated the prospect of sustainable energy security. The paper submits that
petroleum pipeline vandalism is structural, both in essence and in effect; hence, any meaningful
effort to mitigate the problem must recognize and address the gamut of socio-structural and
material conditions that underpin and predispose it.
Keywords: energy security, petro-state, pipeline vandalism, rentierism, structural materialism
43
Introduction
The crisis of the petroleum sector in Nigeria has been pathological. The pathology of the
sector has been so extreme over the years, swinging precariously betwixt coma and paralysis.
The crisis is symptomatic of petro-rentierism in the context of an abusive alliance between the
ruling elite and multinational oil companies. It mirrors the systemic contradictions of the wider
Nigerian political economy instantiated by productive inertia, development crisis and
opportunistic living (Okoli & David, 2016).
Since the 1970s, the petroleum sector has remained the mainstay of Nigerian economy,
generating billions of dollars for the Nigerian government annually. The central government
controls revenues from the sale of crude oil and sets up a formula for sharing them among the
tiers of government. Unfortunately, the practice of an unbalanced federal system has grossly
skewed the oil wealth in favour of the dominant political elite (Ibeanu, 2000; 2005), to the
exclusion of ethnic minorities in the Niger Delta, where the treasured hydro-carbon is mined.
Over the years, therefore, the sector has progressively degenerated into an arena for undignified
scramble for petro-rents, primitive accumulation of capital, as well as systemic malfeasance and
perfidy. It has also been a theatre for all forms of petro-criminality and petro-violence, ranging
from oil theft, piracy, and militancy, to sabotage (Igbinovia, 2014; Boris, 2015; Okoli & David,
2016).
A critical dimension of the genealogy of the petrostate in Nigeria is the symbiotic
relationship between the governing class and multinational oil companies in the Niger Delta. The
Nigerian government through the Nigeria National Petroleum Corporation (NNPC) collects
profit from petrobusiness without making any meaningful investment in oil exploration and
production (cf. Ngwu, 2014). In fact, the NNPC is more interested in securing higher percentages
of oil profit than controlling the petroleum sector through productive industrialism (Azom,
2016). On the other hand, the oil majors dominate and control the oil industry and pay rents to
the Nigeria government. This dominance, amidst the paradoxes of government’s intervention
programmes, has had far-reaching implications for human and environmental security in the
Niger Delta. These paradoxes, which capture the roots of crisis in the region, include:
…The paradox of plenty, which refers to the tendency for petroleum wealth to create
enormous poverty. Second is the paradox of security, namely the tendency in a petro-state for
national security to undermine the security of nationals. Thirdly, there is the paradox of

44
development, which refers to the tendency for the putative development efforts of the petro-state
to generate underdevelopment (Ibeanu, 2000, p.29).
Added to the inability of the Nigerian government to provide basic social security to the
populace, is the irresistible urge to unleash state violence on individuals or groups perceived to
constitute a threat to petrobusiness. This has given rise to populist grievances and protests
(Okolo & Etekpe, 2010), and has provided a veritable pretexts for criminal indulgence and
impunity among the populace (Okoli & Orinya, 2013), who have often mobilized to engage the
Nigerian government and multinational oil companies for improved social welfare. It is the
foregoing organic contexts that provide incentive and impetus for petroleum pipeline vandalism
in Nigeria.
Pipeline vandalism, in the context of this study, refers to deliberate and malicious
destruction of petroleum pipelines for economic gains, or for political or idiosyncratic reasons
(Okoli, 2016). It is an advanced complication of the Nigerian petro-rentier question, driven
principally by the tripartite factors of need, greed, and grievance (Okoli, 2016). The impacts and
implications of petroleum pipeline vandalism have been apocalyptic, given the country’s peculiar
status as a gross petro-dependent economy. The apparent indispensability of the petroleum sector
to the sustainability of Nigeria’s economy is best demonstrated by the disproportionate reliance
on the sector for the bulk of the country’s energy needs (Ezirim, Eke & Onuoha, 2016; Maren,
Agontu, & Mangai, 2013). The implication of this is that petroleum pipeline vandalism appears
to pose a threat to the progress of the Nigerian energy economy.
Although the existing literature on the nature, impact and dimensions of petroleum
pipeline vandalism is rich and revealing, scholars have tended to lavish intellectual energy on
themes like environmental impact of pipeline vandalism (Lawal & Ese, 2012), pipeline
vandalism and national security (Okoli & Orinya, 2013); oil thefts and pipeline vandalism
(Igbinovia, 2014), pipeline vandalism and socio-economic development (Njoku, 2016), and so
on, to the neglect of the effect of petroleum pipeline vandalism on energy security in Nigeria.
There is, thus, a need to address this scholarly gap in an effort to further enrich the extant
knowledge in the subject area. It is against this backdrop that this study seeks to problematize the
implications of petroleum pipeline vandalism for energy security in Nigeria, in addition to
exploring the nexus between petro-rentierism and petroleum pipeline vandalism. The remainder
of the study is structured along the following discursive themes: the Nigerian state and the petro-
45
rentier syndrome: a structural theorizing; overview of the Nigerian petroleum pipeline system;
situating the nexus between petro-rentierism and pipeline vandalism in Nigeria; Nigeria’s energy
security question: contours and dimensions; petroleum pipeline vandalism and Nigeria’s energy
security; conclusion and recommendations.
The Nigerian State and the Petro-Rentier Syndrome: A Structural Theorizing
This study relied on the basic propositions adapted from the Marxist Structuralist theory
of the state to provide an insight into oil rents dynamics, lack of democratic control of oil wealth
and the challenges of energy security in Nigeria. Structural Marxism, which rose in opposition to
the humanistic Marxism that dominated many Western Universities in the 1970s, was first
associated with the works of French philosopher, Louis Althusser. It was further highlighted in
the works of Nicos Poulantzas and Maurice Godelier (Carnoy, 1985).
Althusser posits that Marx’s concept of the mode of production involved three distinctly
articulated levels: the economic, the political, and the ideological (as cited in Carnoy, 1985).
These three levels intimately and internally combine to form the matrix of the mode of
production. Although in a given social formation, any of these three levels could be the dominant
structure, the economic structure would always determine which of the three would be dominant
(Azom, 2016). In adapting the structuralist elements to develop a coherent theory of the state,
Nico Poulantzas, a disciple of Althusser, observed that the state in the capitalist mode of
production is determined to fulfill reproductive function through the class nature of the
ideological and repressive state apparatuses (Poulantzas, 1973). The function of the state, as
succinctly summarized by Barrow (1993), is to protect and reproduce the social structure of
capitalist societies.
The structuralists thus highlight the inherent contradictions that exist in any capitalist
order and how they moderate and drive the character of the state. Capitalist societies are
inherently prone to crises which originate in regular cycles of economic stagnation and continual
outbreaks of class war between capital and labour. On account of this underlying tendency
toward crises, the state must intervene politically to maintain economic stability and to mediate
class struggles in capitalist societies. As a consequence, decisions, policies and institutions of
states in capitalist societies basically function in the long-term interests of capital and capitalism,

46
rather than in the short term interests of members of the capitalist class (Azom, 2016; Jessop,
1982).
The Marxist Structuralist theory of the state has been further developed and employed in
the explanation of the peculiarity of the neo-colonial African states by scholars such as Ake
(1981), Ekekwe (1985), Kwanashie (2010), Onimode (1985), and others. These scholars
highlight the structural weaknesses that largely account for systemic disarticulation, crisis of
development and perpetual impotency of post-colonial African states in the face of western-
styled democracy that has accentuated civilian dictatorship. For instance, Ekekwe (1985) harps
on the mutual alliance between Nigerian bourgeoisie and foreign capital. Ake (1981) notes that
the role of foreign capital which constitutes the dominant social forces in the Nigerian economy
is underlined by the weakness of indigenous technological base that has increasingly separated
production from consumption, accounting for the enormous rise in imports. Kwanashie (2010,
p.40) submits that states in Africa “cannot drive development because of internal disarticulation,
incoherence in the organization and the structure of the state,”
The Marxist structuralist theory of the captures the dynamics of the alliance and
interaction between the Nigerian government and the oil majors in the oil-rich Niger Delta.
Given its structural and functional weaknesses, the Nigeria state has remained prostrated in
comprador and subordinate relationship with foreign capital that control the oil industry. This
apparent weakness in a sector that drives its political economy is the reason why the Nigerian
government frequently intervenes to fend off possible threats to petro business.
In the downstream oil and gas sector, the reliance on MNCs for production technology,
external oil refining and importation of petroleum products accounts for the structural challenges
in the development and optimal performance of the nation’s refineries and corresponding
reliance on rent. The rent situation heightens the dominance of foreign capital in the oil industry.
It also fosters the neglect of the fragile ecosystem; unbridled corruption; relegation of the welfare
of the populace, particularly the ethnic minorities in the Niger Delta; and the use of state
violence to quell ethnic agitations so as to convince foreign capitalists that there is stability for
continued investment. The use of excessive force to suppress the demands for socio-economic
and cultural rights with a view to guaranteeing uninterrupted flow of oil has given rise to all
forms of petro-criminalities in opposition to the alliance of the government and multinational oil
companies. Of all these criminalities, pipeline vandalism stands out as the most formidable threat

47
to petro business in Nigeria, with serious implications for the energy sector. In other words, the
incidence of petroleum pipeline vandalism is highly inimical to energy security in Nigeria. This
study is an attempt to determine the veracity of this assertion.
Overview of the Nigerian Petroleum Pipeline System
Nigeria operates a 5,120km length of petroleum pipeline network (NNPC, 2012). This
consists of about 4,315km of multi-purpose pipelines and 666km of crude oil pipelines (Lawal &
Ese, 2012, p.74). The pipelines crisscross the country and interlink the petroleum storage depots
strategically situated across the country: the refineries at Kaduna, Port Harcourt I and II and
Warri; the offshore terminals at Bonny and Escravos; and the jetties at Atlas-Cove, Calabar,
Okirika and Warri (Lawal & Ese, 2012).
The pipelines run across the rivers, creeks, swamps and farmlands in the various parts of
Nigeria. The Niger Delta and the adjoining littoral states host the bulk of the pipelines. Beyond
the Niger Delta, petroleum pipelines also intersperse the areas of Aba, Enugu, Gombe, Gusau,
Ibadan, Ikorodu, Kaduna, Kano, Lagos, Ilorin, Maiduguri, Makurdi, Ore, and Yola (Okoli &
Orinya, 2013). This network of pipelines connects the various petroleum oil and gas facilities
across the country for easy haulage of petroleum products (Okoli, 2016).
Figure 1. Nigeria’s National Pipeline Network
Source: Culled from: www.nweeorldnigeria.org (accessed 11/10/2015).
48
Figure 1 shows the network of pipelines connecting the various flow stations, depots and
refineries within the Nigeria midstream and downstream petroleum sectors. The refineries are
situated in Port-Harcourt, Warri, and Kaduna while the depots are located in the major cities
dotted red in the map (Fig. 1). While some of the pipelines are multi-purpose carriers (conveying
both crude oil and refined products), others are dedicated to single product (either crude or
refined products).
The Nigerian Gas Company (NGC), a subsidiary of the NNPC, operates 1,100km of gas
pipelines, with diameters between 4 and 36 inches that has a total transport capacity of more than
2Bcf/d, as well as 14 compressor stations and 13 metering stations (Pipelines International,
2011). Currently, the Escravos-Lagos Pipeline System (ELPS), which was completed in the
1990s, constitutes the main pipeline system for Nigeria’s domestic gas consumption (Pipelines
International, 2011 as cited in Okoli, 2016).
The network of pipelines in Nigeria functionally connects the downstream and upstream
sectors of the Nigerian petroleum industry in an organic articulation. To guarantee the integrity
of the pipelines, a ‘buffer zone’ called pipeline Right-of-Way (PROW) is created around the
spatial stretch where the pipes are buried. The pipes are buried about 1m below the earth’s
surface to foreclose possible untoward impact from other land-use or development activities that
may vitiate their safety (Onuoha, 2008). Despite this safety assurance mechanism, experience in
Nigeria has shown that such pipelines have been maliciously damaged by oil saboteurs and
thieves.
Situating the Nexus between Petro-rentierism and Pipeline Vandalism in Nigeria
Petroleum pipeline vandalism in Nigeria does not occur in an existential vacuum. It is a
phenomenon that obtains in an organic context that has made its occurrence not only possible but
also inevitable. The organic context in question refers to the abusive petro-rentier political
economy of Nigeria. In this regard, we contend that pipeline vandalism is symptomatic of
contradictions of petro-rentierism in the context of an abusive political economy.
The Nigerian state typifies what has been described in the extant literature as a ‘petro-
state’ (Watts, 2007; Watts, 2008). This is a peculiar pattern of state structure whose existential
morphology mirrors petro-renteirism (Katsouris & Sayne, 2013). It is characterized by ‘petro
racy’, a system whereby government exists at the mercy of legal and illegal oil barons (Naneen

49
& Tolan, 2014, p.73). It is equally characterized by an over-developed petroleum economy that
reproduces an awkward material pathology that thrives ‘on rat-race’ for looted resources (cf.
Katsouris & Sayne, 2013).
Being a member of the global confraternity of petro-rentier state, Nigeria also doubles as
a petro-dependent and petro-corrupt state (Okoli, 2016). In this context, income for many does
not derive from productive investment but from abusive state patronage (cf. Ngwu & Ugwu,
2015). The members of the political elite live by state-enabled appropriation and
misappropriation of “rented, unearned income” (Okoli, 2016, p.145). While the political elite and
their patronage networks wallow in rent-seeking and rent-sharing, the rest of the populace
scrambles for what is left through violent and criminal opportunism.
As state officials and members of the civil society get enmeshed in undignified struggles
for petrodollars and petro-rents, a volatile atmosphere of conflict and disorder is thus created. In
the absence of functional legal-cum-policy frameworks to moderate and mediate such struggles,
what plays out is a vicious cycle of violence and criminality (Okoli, 2016). According to Ukiwo
(2009) - as cited in Evoh (2009, p.42)- this drives “elite kleptocracy and mass opportunism”. So,
while the petro-rentier elite help themselves with oil-wealth expropriation through entrenched
‘white-collar’ corruption, the rest of the masses join the bandwagon by indulging in all manner
of petro-violence and criminality. It is within this analytical framework that the phenomenon of
petroleum pipeline vandalism in Nigeria can be best understood.
Besides, the Nigerian petro-rentier elite have also failed to judiciously harness, manage
and invest the proceeds of the petroleum patrimony in a manner that is equitable and progressive.
According to Oppewal:
The average Nigerian has not experienced much benefit from the country’s massive oil
wealth over the past half century. The country is ranked 156th on the Human Development
Index, making it the lowest ranked OPEC member, and poverty levels remain extremely high. In
the oil-rich Niger Delta, the local population, besides not experiencing any benefits from their
region’s oil wealth, actually suffers from it as a result of environmental degradation and
pollution caused by the oil industry. In that region, these tensions have culminated in violent
conflict. The violence has directly targeted the energy sector, by sabotage oil-related
infrastructures… (2011, p.5).
The implication of the above citation is that petroleum pipeline vandalism is a necessary
consequence of state’s neglect of legitimate concerns of governance (Okoli, 2014). Properly put,
it is a product of a four-count state failure syndrome instantiated in:

50
1. Failure of the state to improve the material conditions of the people
2. Failure of the state to address the legitimate environmental and political concerns
of the people
3. Failure of the state to ensure effective surveillance and protection of pipelines
4. Failure of the state to ensure equitable distribution of the oil wealth.
The aforementioned translates to the ‘need-grievance’ thesis of petroleum pipeline
vandalism (Okoli & Orinya, 2013). It is, however, pertinent to note that petroleum pipeline
vandalism has also been motivated by material greed and avarice. The penchant and inordinate
ambition of many Nigerians for material enrichment and aggrandizement has also contributed in
fuelling the problem (Njoku, 2016).
The tragedy of petroleum pipeline vandalism in Nigeria is that the criminal practice is
already systematically entrenched as part of the petro-rentier relations of the Nigerian political
economy. Curiously, the highs and lows of the Nigerian society as well as the custodians of
public law and security have often been implicated in the act (Asuni, 2009; Ekwo, 2011). The
apparent complicity of the agents of the state, multinational oil corporations and civil society in
aiding and abetting the crime explains its seeming intractability over the years. Table 2
highlights important drivers of petroleum pipeline vandalism in Nigeria from the ‘needs-
grievance’ perspective.
Table 1
Drivers of Need/Grievance-based Pipeline Vandalism in Nigeria
Driver Narrative Actor(s)
Anger/Frustration An expression of anger/frustration over the
historic marginalization of communities by
government and oil companies. These
communities feel that their oil have been
unfairly taken away, while they are left to
suffer in poverty. This anger motivates a
determination to inflict losses on the oil
companies and government
Community leadership
and members; ex-
militants, cult groups
Attention/
Propaganda
A strategy to attract the attention of
government and oil company to engage in
dialogue or any from of negotiation
Same as above
Unemployment or clean-
up/surveillance contracts
To gain employment from artisanal refining
labour opportunities
Community members
Cash/cheap money Implicit incentive to vandalism to obtain
clean-up and surveillance contracts and access
‘easy money’ to feed patronage networks
Prospective clean-
up/surveillance
contractors, community
leadership, oil
companies

51
Table 1
Drivers of Need/Grievance-based Pipeline Vandalism in Nigeria
Driver Narrative Actor(s)
Demand for refined fuel To supply oil and refined products to local
and international markets under black-market
relations
Ex-militants, local
businessmen, fuel
distributors, criminal
opportunists
Source: Adapted from SDN (2015, p.38). Building bridges: Community-based approaches to
tackle pipeline vandalism. A publication of SDN.
Nigeria’s Energy Security Question: Contours and Dimensions
Energy security refers to the continuous availability of energy in varied forms, in
sufficient quantities, and at reasonable prices (UNDP 1999 as cited in Maren, Agontu & Mangai,
2013, p.2). It is a state in a country’s energy economy that is contingent on a number of
conditions as cataloged in table 2.
Table 2
Determinants of Energy Security
S/N Condition Remark(s)
1. Availability Existence of energy resources; reserve and potentials
2. Accessibility Ability to access available energy resources
3. Affordability Availability of energy resources at reasonable prices
4. Diversity Availability of energy resources in varied mix/forms
5. Efficacy Usefulness of energy resources in supporting economic/technological
growth and development
6. Sustainability Continuous availability, accessibility, affordability of energy for the present
and the future
7. Sufficiency/
Adequacy
Availability of energy in sufficient quantities
8. Efficiency Cost-effectiveness and economy of energy resourcing (generation,
distribution, consumption)
9. Resilience Ability of the energy to withstand shocks and disruptions, local or global
10. Portability The simplicity and ease of contingent inter-switches within the varied
energy mix
Source: Original compilation by authors, 2016.
Energy security is a crucial component of the sustainable development praxis (Okeke,
Izueke & Nzekwe, 2014; Maren, Agontu & Mangai, 2013). It has been a topical development
issue engaging the attention of nations at the global, regional and national levels. In effect,
concerns of energy security have been incorporated in the national development strategy of many
nations (Oppewal, 2011).
52
Contemporary global energy indicators point to the fact that the world has been in a
period of rapid and volatile energy transformation. The trend has risen from the dynamics of
international energy market, which have assumed a volatile complexion since 2014 (Dudley,
2015). This has far reaching implications for the developing economies, most of which are
energy poor and dependent.
Nigeria is endowed with immense energy resources and potentials, ranging from fossil to
non-fossil fuel. As indicated in a recent government document:
Nigeria is blessed with abundant primary energy resources. These include non-renewable
energy sources such as gas, crude oil, coal and tar sands; and renewable energy sources such as
hydro, biomass, solar and wind. However, the economy has mainly depended on the
consumption of oil and gas for commercial energy. The use of hydro-power plants, which
entered the Nigerian energy scene in the 1960’s, now accounts for the second largest energy
resources for electricity generation in Nigeria, contributing approximately 26% of the total
installed grid-connected generated energy (Federal Government of Nigeria, 2015, p.1).
Yet, the country can hardly boast of appreciable levels of energy security. The Nigerian
energy security debacle can be explained on the bases of the following structural factors:
i. external dependency of the country’s energy sector
ii. mono-cultural structure of the energy sector
iii. failure of corporate governance in the sector
iv. incessant vandalism of energy infrastructure (cf. Maren, Agontu & Mangai, 2013;
Oppewal, 2011; Atume, Igberi & Udude, 2016).
The external dependency of Nigeria’s energy industry is best illustrated by the country’s
queer practice of relying on importation of refined fuels in meeting her industrial and household
energy requirements (Oppewal 2011). This has been necessitated by the collapse of the country’s
petroleum refineries, which have been producing at abysmal levels far below their capacities
(Ekwo 2011; Okoli, 2016).
The mono-cultural structure of the Nigerian energy sector refers to the sector’s reliance
(undue dependence) on “a particular energy option” as its mainstay (Maren, Agantu & Mangai,
2013, p.1). This presupposes non-diversification of the country’s energy base and mix in a
manner that makes for sustainable energy security.
The absence or failure of corporate governance in Nigeria’s energy industry has
occasioned systemic inefficiencies and abuses in that context. From the perspective of the

53
petroleum sector, Oppewal (2011, p.4) opines that the scenario “include political
mismanagement, misaligned incentives and corruption, as officials can profit by not allocating
crude oil to the refineries and instead earn rents on the issuance of import licenses for petroleum
products”.
Vandalism of energy infrastructure has substantially accounted for Nigeria’s perennial
energy security crisis (Ekwo, 2011; Okoli & Orinya, 2013). According to Oppewal (2011, p.5),
this “has directly targeted the energy sector by sabotaging oil-related infrastructure…; thus
negatively impacting the sector and by extension, Nigeria’s energy security”. A critical
dimension of energy infrastructure vandalism in Nigeria is the phenomenon of petroleum
pipeline vandalism (Okoli, 2016). How has that manifested over the years? And how has it
impacted energy security in Nigeria? These salient questions are answered in the next section.
Petroleum Pipeline Vandalism and Nigeria’s Energy Security
Petro-fuel and electricity power are two critical components of the Nigerian energy mix.
Ideally, refined fuel is supposed to emanate from national refineries that rely on petroleum
pipelines for the supply of crude oil. To some extent, wholesale haulage of refined fuel is also
dependent on the pipelines (Onuoha, 2008; Ekwo, 2011).
Similarly, electricity power generation in Nigeria relies a lot on petroleum pipelines. This
is in view of the fact that over 80% of power generated in the country comes from thermal
plants, which are dependent on the availability of gas supply from the national pipeline networks
(Nebo, 2015, slide 2). The implication of the foregoing is that petroleum pipelines are
indispensable to the energy sector in Nigeria.
It follows from the above that the incidence of petroleum pipeline vandalism in Nigeria is
essentially inimical to energy security in Nigeria. In the sub-sections that follow, an attempt is
made to buttress this fact by examining the impact of pipeline vandalism on petroleum refining
and power generation in the country.
Pipeline vandalism and petroleum refining
Although Nigeria has four ‘mega’ refineries; the country has persistently relied on
importation of petroleum products to serve its domestic energy needs (Oppewal, 2011; Okoli,
2016). This situation is traceable to the incidence and prevalence of pipeline vandalism in the
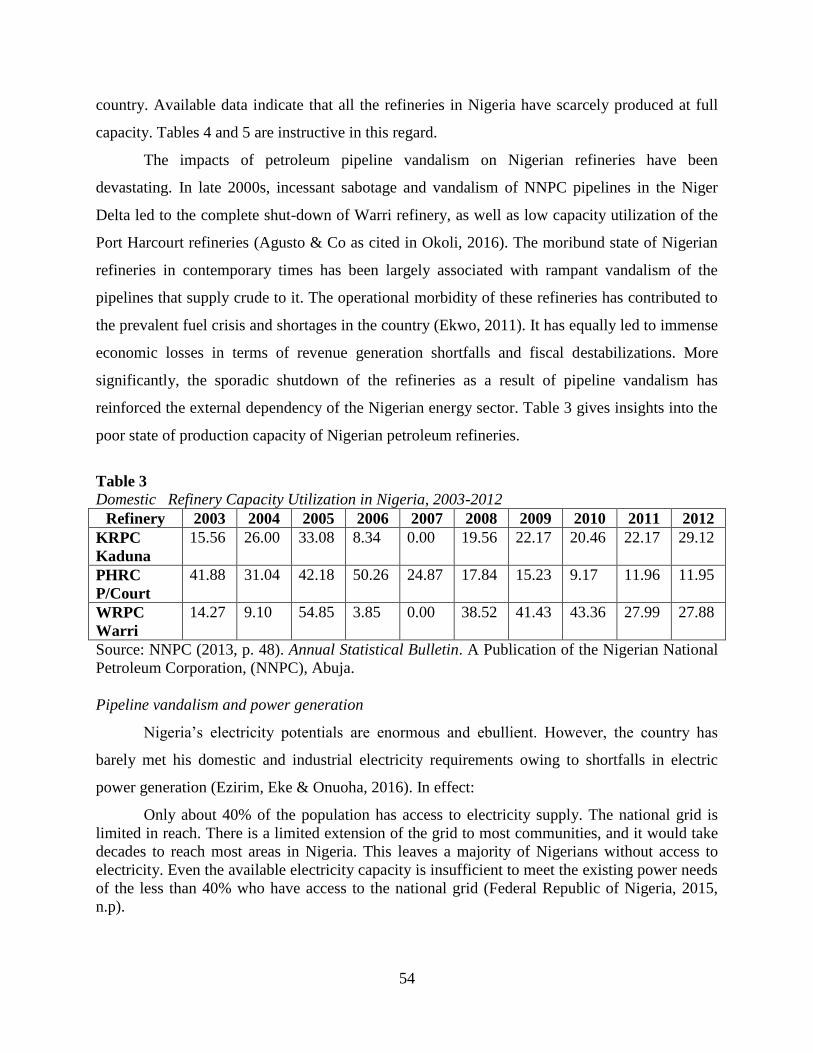
54
country. Available data indicate that all the refineries in Nigeria have scarcely produced at full
capacity. Tables 4 and 5 are instructive in this regard.
The impacts of petroleum pipeline vandalism on Nigerian refineries have been
devastating. In late 2000s, incessant sabotage and vandalism of NNPC pipelines in the Niger
Delta led to the complete shut-down of Warri refinery, as well as low capacity utilization of the
Port Harcourt refineries (Agusto & Co as cited in Okoli, 2016). The moribund state of Nigerian
refineries in contemporary times has been largely associated with rampant vandalism of the
pipelines that supply crude to it. The operational morbidity of these refineries has contributed to
the prevalent fuel crisis and shortages in the country (Ekwo, 2011). It has equally led to immense
economic losses in terms of revenue generation shortfalls and fiscal destabilizations. More
significantly, the sporadic shutdown of the refineries as a result of pipeline vandalism has
reinforced the external dependency of the Nigerian energy sector. Table 3 gives insights into the
poor state of production capacity of Nigerian petroleum refineries.
Table 3
Domestic Refinery Capacity Utilization in Nigeria, 2003-2012
Refinery 2003 2004 2005 2006 2007 2008 2009 2010 2011 2012
KRPC
Kaduna
15.56 26.00 33.08 8.34 0.00 19.56 22.17 20.46 22.17 29.12
PHRC
P/Court
41.88 31.04 42.18 50.26 24.87 17.84 15.23 9.17 11.96 11.95
WRPC
Warri
14.27 9.10 54.85 3.85 0.00 38.52 41.43 43.36 27.99 27.88
Source: NNPC (2013, p. 48). Annual Statistical Bulletin. A Publication of the Nigerian National
Petroleum Corporation, (NNPC), Abuja.
Pipeline vandalism and power generation
Nigeria’s electricity potentials are enormous and ebullient. However, the country has
barely met his domestic and industrial electricity requirements owing to shortfalls in electric
power generation (Ezirim, Eke & Onuoha, 2016). In effect:
Only about 40% of the population has access to electricity supply. The national grid is
limited in reach. There is a limited extension of the grid to most communities, and it would take
decades to reach most areas in Nigeria. This leaves a majority of Nigerians without access to
electricity. Even the available electricity capacity is insufficient to meet the existing power needs
of the less than 40% who have access to the national grid (Federal Republic of Nigeria, 2015,
n.p).

55
The crisis of power generation in Nigeria can be best appreciated in comparative cross-
country terms. In this regard, information in table 4 is veritably insightful.
Table 4
Nigeria’s Power Generation Capacity in Comparative Terms
Country Generation Capacity (GW) Watts per capita
South Africa 40.498 826
Egypt 20.46 259
Nigeria 5.96 40 (25 available)
Ghana 1.49 62
USA 977.06 3,180
Germany 120.83 1,468
UK 80.42 1,316
Brazil 96.64 486
China 623.56 466
India 143.77 124
Indonesia 24.62 102
Source: Nnaji, B. (2011,Slide 3). Power sector outlook in Nigeria: Government renewed
priorities. Official publication, the Presidency, Federal Republic of Nigeria.
Table 4 paints a woeful picture of power insecurity in Nigeria. With a teeming population
estimated at over 170m, Nigeria maintained a decimal generation capacity of 5.96 (GW) in
comparison to Egypt with a population of about 70 million that maintained 20.46 (GW).
Although the figures in table 4 are fairly dated, more recent data concerning Nigeria’s power
generation profile have consistently remained abysmal. This observation resonates with the
following citation:
In the Americas (North and South) the U.S with a population of 250 million generated
813, 000MW with per capita consumption of 3.2 KW while Cuba with a population of 10.54m
generates 4,000MW and a per capita consumption of 0.38KW. In Europe, the U.K with a
population of 57.5m generates 76,000MW and has a 1.33KW per capita consumption. In the
Middle East and Far East, Iraq with 23.6m inhabitants generates 10,000MW with a 0.42 per
capita consumption and South Korea generates 52,000MW with population of 47m and has a
1.09KW per capita consumption. In Africa, Nigeria with a population 150m generates below
4,000MW with a 0.03KW per capita consumption; Egypt with a population of 67.9m generates
18,000MW and has a 0.256KW per capita consumption while South Africa’s 1.015KW per
capita consumption derives from 45,000MW generation for a population of 44.3m (FMI, n.d as
cited in Ezirim, Eke & Onuoha, 2016, p.445).
One of the most poignant reasons for Nigeria poor performance in terms of power
generation is the phenomenon of pipeline vandalism. Of particular reference in this direction is
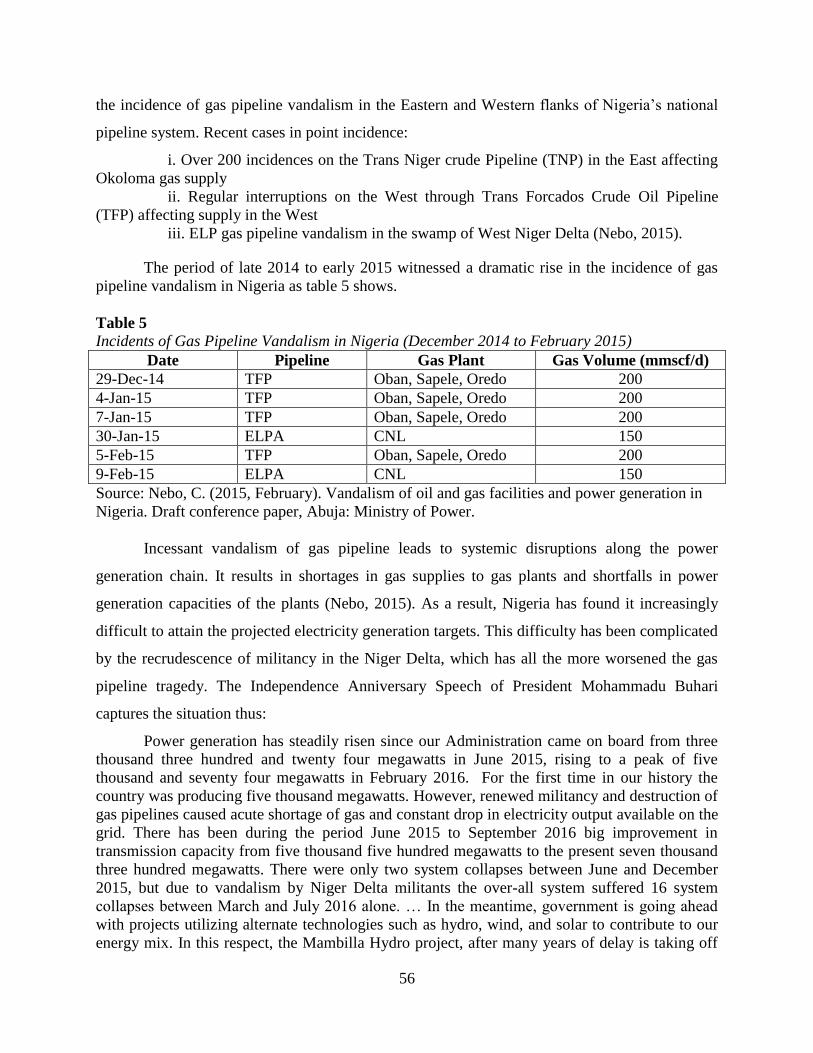
56
the incidence of gas pipeline vandalism in the Eastern and Western flanks of Nigeria’s national
pipeline system. Recent cases in point incidence:
i. Over 200 incidences on the Trans Niger crude Pipeline (TNP) in the East affecting
Okoloma gas supply
ii. Regular interruptions on the West through Trans Forcados Crude Oil Pipeline
(TFP) affecting supply in the West
iii. ELP gas pipeline vandalism in the swamp of West Niger Delta (Nebo, 2015).
The period of late 2014 to early 2015 witnessed a dramatic rise in the incidence of gas
pipeline vandalism in Nigeria as table 5 shows.
Table 5
Incidents of Gas Pipeline Vandalism in Nigeria (December 2014 to February 2015)
Date Pipeline Gas Plant Gas Volume (mmscf/d)
29-Dec-14 TFP Oban, Sapele, Oredo 200
4-Jan-15 TFP Oban, Sapele, Oredo 200
7-Jan-15 TFP Oban, Sapele, Oredo 200
30-Jan-15 ELPA CNL 150
5-Feb-15 TFP Oban, Sapele, Oredo 200
9-Feb-15 ELPA CNL 150
Source: Nebo, C. (2015, February). Vandalism of oil and gas facilities and power generation in
Nigeria. Draft conference paper, Abuja: Ministry of Power.
Incessant vandalism of gas pipeline leads to systemic disruptions along the power
generation chain. It results in shortages in gas supplies to gas plants and shortfalls in power
generation capacities of the plants (Nebo, 2015). As a result, Nigeria has found it increasingly
difficult to attain the projected electricity generation targets. This difficulty has been complicated
by the recrudescence of militancy in the Niger Delta, which has all the more worsened the gas
pipeline tragedy. The Independence Anniversary Speech of President Mohammadu Buhari
captures the situation thus:
Power generation has steadily risen since our Administration came on board from three
thousand three hundred and twenty four megawatts in June 2015, rising to a peak of five
thousand and seventy four megawatts in February 2016. For the first time in our history the
country was producing five thousand megawatts. However, renewed militancy and destruction of
gas pipelines caused acute shortage of gas and constant drop in electricity output available on the
grid. There has been during the period June 2015 to September 2016 big improvement in
transmission capacity from five thousand five hundred megawatts to the present seven thousand
three hundred megawatts. There were only two system collapses between June and December
2015, but due to vandalism by Niger Delta militants the over-all system suffered 16 system
collapses between March and July 2016 alone. … In the meantime, government is going ahead
with projects utilizing alternate technologies such as hydro, wind, and solar to contribute to our
energy mix. In this respect, the Mambilla Hydro project, after many years of delay is taking off

57
this year. Contract negotiations are nearing completion with Chinese firms for technical and
financial commitments (Buhari, 2016: para.31-37; emphasis in bold letters).
The above citation captures the precarious state and outlook of power generation in
Nigeria. Suffice it to note that Nigeria’s power sector has been enmeshed in systemic crisis,
arising principally from the menace of pipeline vandalism. This has made it difficult for the
country to meet its energy potentials and projections. The records in table 6 are indicative of this
fact.
Table 6
Current Nigeria’s Power Generation Factsheet as at October, 2016
Fact Est. figure in mega watts (mw)
Average national power need 40,000
Projected power generation by 2020 20,000
Installed generation capacity of available power plants 11,500
Operational generation capacity 7,300
Transmittable output 3,500
Source: Adapted from Buhari, M. (2016, October). 2016 Independence Speech/broadcast,
Federal Radio Corporation of Nigeria, Abuja.
Conclusion and Recommendations
The story of Nigeria’s petroleum economy has been the paradox of ‘unfortunate fortune’
(Okoli & Atelhe, 2015). Decades of oil extraction and exploitation in the country has not brought
about the expected socio-economic leap and transformation. Antithetically, the country has
witnessed accentuated woes, miseries and unfulfilled expectations.
The land and peoples of the Niger Delta have paid rather dearly for their hostship of the
Nigerian petroleum industry. Oil spills, gas flaring and petro-violence have gone unabated in the
region with grave implications for the environment, health, and livelihood of the people. The
material conditions of the rural populace in that context tend to have been deteriorating amidst
crude, ostentations exhibition of grandiose affluence by the parasitic and self-aggrandizing petro-
dollar aristocrats.
The proceeds of petroleum exploitation have not been transparently managed, equitably
distributed, or judiciously invested. Rather than harnessing and investing such proceeds into
productive industrialism to engender positive returns, the petro-rentier class that superintends the
industry prefers to deploy the proceeds to unproductive investments. In effect, the bulk of the oil

58
wealth is squandered in servicing the entrenched vested interests of the profiteering patronage
networks, comprising the parasitic petro-rentier class and the clientele of their opportunistic
cohorts.
What plays out of this awry scenario is a free-for-all ‘rat-race’ for petro-dollar. So, while
the petro-rentier class is engaged in an escapade for oil wealth via ‘rents grab’ through systemic
corruption and abuse, the masses join the criminal franchise by engaging in various dimensions
of organized and opportunistic petro-criminality (sabotage, piracy, kidnapping and vandalism) as
a matter of need, greed or grievance. It is in this complicated political ecology that the
phenomenon of pipeline vandalism begins and becomes.
As it has been established in this paper, gas pipeline vandalism has grave implications for
the progress of Nigeria’s energy sector. This is in view of its adverse impacts and complications
that negate the functionality and sustainability of the country’s petroleum refining and power
generating industries. Given the primacy of the petroleum sector in Nigeria’s contemporary
political economy, and given the indispensability of the sector to the energy industry, any major
destabilization in the sector will definitely result in disastrous outcomes. It is in the light of this
observation that this paper submits that petroleum pipeline vandalism is a veritable threat to
energy security in Nigeria.
To mitigate the scourge of petroleum pipeline vandalism as well as promote sustainable
energy security in Nigeria, the following recommendations are instructive:
1. The Federal Government of Nigeria should ensure judicious management,
investment and distribution of oil wealth in such a manner that forecloses abusive tendencies
2. There is a crucial need for the National Assembly to pass the long-awaited
Petroleum Industry Bill (BIP) so as to provide an enabling legal-cum-policy framework for the
proper government/regulation of the petroleum sector
3. The extant institutional and ad-hoc mechanisms for pipeline surveillance and
protection should be strengthened through proper technical and logistical resourcing as well as
political oversight to boost their operational efficiency
4. Perpetrators of pipeline vandalism and their collaborators should be arrested and
promptly prosecuted so as to provide optimal deterrence for future indulgence
5. The Federal Government of Nigeria should seek to improve the material conditions
of the populace through gainful livelihood opportunities so as to provide structural disincentive
for ‘need’ and ‘grievance’ induced pipeline vandalism/sabotage
6. Oil multinationals should synergize with credible formal community-based
platforms to work out a grassroots approach to pipelines surveillance and protection
7. Alternative sources of renewable energy should be explored by the Federal
Government in order to make for the diversification of energy mix in the country

59
8. The Nigerian power and petroleum sectors should be structurally revamped
through a credible home-grown reform strategy that emphasizes diversification, corporate
governance and economic efficiency.
References
Asuni, J.B. (2009). Blood Oil in the Niger Delta. Official Report of the United States Institute of
Peace, Washington, DC.
Atume, E., Igberi C.O., & Udude, C.C (2016). Power supply, average manufacturing capacity
utilization and unemployment in Nigeria. Asian Research Journal of Arts and Social
Science, 1(2), 1-15. https://doi.org/10.9734/arjass/2016/27683
Awogbade, M.O., Olaniyan, R.A., & Faleye, O.A. (2016). Eco-violence or trans-border
terrorism? Revisiting Nigerian pastoral nomadic Fulani’s question. In R.A Olaniyan & R.T.
Akinyele (Eds.) Nigerian’s ungoverned spaces (41-58). Ile- Ife: Obafemi Awolowo University
Press.
Azaiki, S. (2006). Oil, politics and blood: The Niger Delta story. Ibadan: Y-Book (Associated
Books-Makers Nigeria Ltd).
Boris, O. H. (2015). The upsurge of oil theft and illegal bunkering in the Nigeria Delta region of
Nigeria: Is there a way out? Mediterranean Journal of Social Sciences, 16(3), 363-
373. https://doi.org/10.5901/mjss.2015.v6n3s2p563
Buhari, M. (2016, October). 2016 Independence Speech/broadcast, Federal Radio Corporation
of Nigeria, Abuja.
Dudley, B. (2015, June). Energy in 2014 – A year of change in the energy landscape. BP
Statistical Review of World Energy, 64.
EIA (2011, August). Country analysis briefs (Nigeria). A publication of Energy Information
Administration.
Ekwo, U.S. (2011, February). Collaboration-based management of petroleum pipeline Rights of
Way in Nigeria. PhD thesis submitted to the School of Architecture, Planning and Landscape,
Newcastle University, United Kingdom.
Evoh, .C.J. (2009). Green Crimes, Petro-violence and the Tragedy of Oil: The Case of the Niger-
Delta in Nigeria. In-Spire Journal of Law, Politics and Society, 4(1), 40-60.
Ezirim, G, Eke O., & Onuoha, F. (2016). The political of Nigeria’s power sector reforms:
Challenges and prospects. Mediterranean Journal of Social Sciences, 7(4), 443 –
453. https://doi.org/10.5901/mjss.2016.v7n4p443

60
Federal Republic of Nigeria (2015, April). National renewable energy efficiency policy
(NREEEP), Ministry of Power, Federal Republic of Nigeria.
Ibeanu, O. (2006). Civil society and conflict management in the Niger Delta: Scoping gaps for
policy and advocacy. CLEEN Foundation Monograph Series, No. 2.
Igbinovia, P.E. (2014). Oil thefts and pipeline vandalization in Nigeria. Ibadan: Safari Books
Ltd.
Katsouris, C. & Sayne, A. (2013). Nigeria’s Criminal crude: International options to combat the
export of stolen oil. Chatham House.
Lawal, M.O., & Ese, T.C. (2012). Environmental impact of pipeline vandalism on the Nigerian
Landscape: The case of the Niger Delta region. Kamala-Raj (Journal of Ecology), 39(1), 73-84.
Maren, I. B., Agontu, J.A., & Mangai, M.M. (2013). Energy Security in Nigeria: Challenges and
the way forward. International Journal of Engineering Science Invention, 2(11), 1-6.
Middleton, P. (2007). The end of oil: The Gulf, Nigeria and beyond. London: Constable &
Robinson Ltd.
Naneen, B.. & Tolan, P. (2014). Private gain public disaster: Social context of illegal oil
bunkering and artisanal refining in Niger Delta. Port Harcourt: Niger Delta Environment and
Relief Foundation (NIDEREF).
Nebo, C. (2015, February). Vandalism of oil and gas facilities and power generation in Nigeria.
Presentation by Minister of Power, Abuja-Nigeria.
Njoku, A.O. (2016). Oil pipelines vandalism and its effects on the socio-economic development
in Nigerian society. International Journal of Multidisciplinary Academic Research, 4(4), 44-60.
Nnaji, B. (2011). Power sector outlook in Nigeria: Government renewed priorities. The
Presidency, Federal Republic of Nigeria.
NNPC (2012). Annual Statistical Bulletin. A Publication of the Nigerian National Petroleum
Corporation, (NNPC), Abuja.
NNPC (2013). Annual Statistical Bulletin. A Publication of the Nigerian National Petroleum
Corporation, (NNPC), Abuja.
Obi, C.. & Rustad, A.S. (2011). Oil and insurgency in the Niger Delta: Managing the complex
politics of petro-violence. London: Zed Books.
Okeke, R.C, Izueke, E.M.C, & Nzekwe, F.I (2014). Energy security and sustainable development
in Nigeria. Arabian Journal of Business and Management Review (OMAN Chapter), 4(3), 63-72.

61
Okoli, A.C., & David, A. N. (2016). Militancy and the Dilemma of Petro-Rentier Criminality in
the Niger Delta. Paper prepared for publication, Department of Political Science, Federal
University Lafia.
Okoli, A.C., & Orinya, S. (2013). “Oil pipeline vandalism and Nigeria’s national
security”. Global Journal of Human Social Science(F: Political Science), 13(5:1.0), pp. 67 – 75.
Okoli, A.C. & Atelhe, G. (2015). Fortunate Misfortune? Death and the Dynamics of Political
Succession in Nigeria. Research on Humanities and Social Sciences, 5(9), pp. 45-49.
Okoli, A.C. & Ochim, F.I. (2016). Forestlands and national security in Nigeria: A threat–import
analysis. IIARD International Journal of Political and Administrative Studies, 2(2), 68-74.
Okoli, A.C. (2008). The Political ecology of the Niger Delta crisis, in the Nigerian state, oil
industry and the Niger Delta conflict(conference proceedings). Niger Delta University,
Wiberforce Island, Bayelsa, 730 -736.
Oppewal, J.R. (2011). Energy Security in Nigeria. ISPI Analysis, No. 86.
SDN (2015). Building bridges: Community-based approaches to tackle pipeline vandalism. A
publication of SDN.
Watts, M. (1999). Petro-Violence: Some Thoughts on Community, Extraction, and Political
Ecology, UC Berkeley Workshop on Environmental Politics. Berkeley Workshop on
Environmental Politics Working Papers WP 03–WP 12, Berkeley: Institute of International
Studies, University of California.
Watts, M. (2007). Petro-insurgency or criminal syndicate? Conflict and violence in the Niger
Delta, Review of African Political Economy, 34(114). https://doi.org/10.1080/030562
40701819517

62
Feeding the Planet – Energy for Life
Supaloek Sinlaparatanaporn
Faculty of Administration and Management
King Mongkut’s Institute of Technology Ladkrabang (KMITL)
1 Chalong Krung, Thanon Chalong Krung, Lat Krabang
Bangkok 10520, Thailand
Reference to this paper should be made as follows:
Supaloek Sinlaparatanaporn
Sinlaparatanaporn, S. (2017). Feeding the Planet – Energy for life. Asian International Journal
of Social Sciences, 17(2), 62 – 87. https://doi.org/10.29139/aijss.20170203
All works licensed under a Creative Commons Attribution-Non Commercial-No Derivatives 4.0 International License.
The Asian International Journal of Social Sciences (AIJSS) allows the author(s) to hold the copyright without restrictions.
The Asian International Journal of Social Sciences (AIJSS) allows the author(s) to retain publishing rights without restrictions.

63
Abstract: Between now and 2050, the world’s population will increase from 7.2 billion today to
9.6 billion in 2050. This will require a 70% increase in food production, without additional land
or natural resources to do so. In 1960, each US farmer produced food for 25.8 people. By 2050,
the same farmer will need to feed 232 people. This study, therefore, is designed to research by
use of a structural equation model the variables affecting innovation behavior of the industrial
feed mill industry in Thailand and Thailand’s contribution to the world food supply process
which is significant and growing. Competition, however, is expected to become more intense as
the 10-nation community of the AEC reaches their 2015 integration date. Hosting one of the
largest agribusiness conglomerates in Asia, Thailand has already achieved a significant footprint
within the agribusiness and food production sectors, primarily based on Thailand’s rich and
productive agricultural economy which employs, directly or indirectly, 40 million out of a total
of 67 million individuals. Animal feeds however generally account for up to 70 percent of the
cost of production, with industry leaders embracing innovation as the critical component in
maintaining competitiveness and profitability. It is therefore paramount that further research be
conducted to determine the variables and their effects on reducing costs while increasing the
efficiency of the animal feed mill production industry.
Keywords: external work contacts, innovation behavior, innovative climate, leadership
behavior

64
Introduction
Feeding the Planet, Energy for Life
As we consider what innovation is needed to improve our global agriculture, nutrition,
and health, we also must consider a very important demographic change. Between now and
2050, the world’s population will increase from 7.2 billion today to 9.6 billion in 2050. This will
require a 70% increase in food production, without additional land or natural resources to do so
(Schimdt & Reed, 2015).
From farm to table, much about food production has changed over the past decades–for
both farmers and consumers. Like any other business, farmers must adapt to a changing world.
Today, we know that each U.S. farmer feeds more people worldwide than ever before, at 155
people per farmer. In 1960, that number was 25.8 people. By 2050, the same farmer will need to
feed 232 people (Schimdt & Reed, 2015).
With finite resources, it will take innovation and a variety of technologies to meet the
world’s food demand. This includes using new technologies. At every step of the journey from
farm to fork, technology is helping us produce a safe, abundant, sustainable, and nutritious food
supply.
After the Second World War, nitrogen fertilizer became increasingly available and
existing production capacities were used for the Haber-Bosch ammonia synthesis process (Smil,
2004). The subsequent increased use of nitrogen fertilizer, together with other technical progress
in crop production such as breeding and mechanization, resulted in significantly higher crop
yields (Hinrichs & Steinfeld, 2007). Crop surpluses made feed for poultry production
increasingly available. A first wave of intensified poultry production using high-quality feed

65
inputs occurred in the United States of America in the 1950s and in Europe in the 1960s.
Industrialized poultry production supplied the increasing demand for animal-based protein which
was arising from growing incomes.
Subsequent to the first wave of poultry-sector intensification, the demand for animal-
based protein increased simultaneously with income growth in developed countries. Additional
demand for meat resulted from rising incomes and populations in developing countries,
especially in emerging economies with growing populations in Asia such as Thailand (Figure 1).
The increased demand for meat was met through sustained growth and intensification of beef,
pork and broiler production with developing countries applying the same intensified poultry
production systems as those seen in the West. These trends led to an accelerated demand for
high-quality feed, and between 1975 and 1985, the global quantity of manufactured feed
increased by 52 percent to 440 million tons (Feed International, 2002).
Figure 1. ASEAN countries (Thailand, Vietnam and the Philippines) Growth Rates 1960-2013
(Source: World Bank)
As the above industrialized world events were unfolding, developing nations such as
Thailand looked to foreign countries and companies to supply feed stock, technology, and
innovation for their growing national agricultural sectors, as can be seen in Figure 1, where
Thailand in 1960 had a population of 27.37 million while today, it has increased to over 67
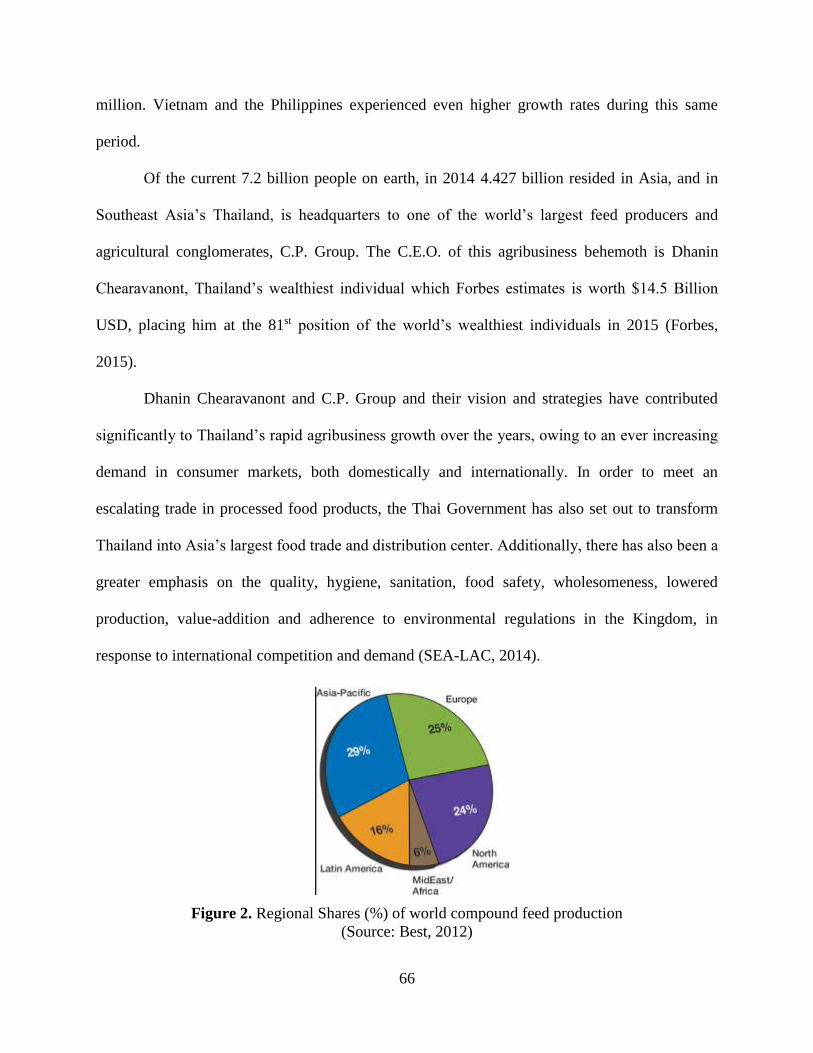
66
million. Vietnam and the Philippines experienced even higher growth rates during this same
period.
Of the current 7.2 billion people on earth, in 2014 4.427 billion resided in Asia, and in
Southeast Asia’s Thailand, is headquarters to one of the world’s largest feed producers and
agricultural conglomerates, C.P. Group. The C.E.O. of this agribusiness behemoth is Dhanin
Chearavanont, Thailand’s wealthiest individual which Forbes estimates is worth $14.5 Billion
USD, placing him at the 81st position of the world’s wealthiest individuals in 2015 (Forbes,
2015).
Dhanin Chearavanont and C.P. Group and their vision and strategies have contributed
significantly to Thailand’s rapid agribusiness growth over the years, owing to an ever increasing
demand in consumer markets, both domestically and internationally. In order to meet an
escalating trade in processed food products, the Thai Government has also set out to transform
Thailand into Asia’s largest food trade and distribution center. Additionally, there has also been a
greater emphasis on the quality, hygiene, sanitation, food safety, wholesomeness, lowered
production, value-addition and adherence to environmental regulations in the Kingdom, in
response to international competition and demand (SEA-LAC, 2014).
Figure 2. Regional Shares (%) of world compound feed production
(Source: Best, 2012)
67
Global output of commercial compound feeds had grown in 2010 to 725 million tons
with 2011 estimated at a volume of over 734.5 million tons (Best, 2013). The global Animal
Feed Industry output was estimated at US$240 billion annually (Best, 2011) with the United
States accounting for just less than 155.3 million metric tons, or 21.6% of world production
(Figure 1’s North American data includes both the US and Canada). The industry has grown in
the past several decades, from global production of 290 million metric tons in 1975 to 626
million metric tons in 2005, jumping to over 735 million tons in 2011 with a continued 1.3
annual growth in the production of compound feeds by commercial mills worldwide.
The largest regional share of world feed production is held by the Asia-Pacific countries
(Figure 2). The region’s own growth rate in 2011 was about 1 percent compared with a 2
percent increase in 2010. Europe is second for size. It grew its feed output by only 0.1 percent in
2011, after a 2010 rise of 2.5 percent. North America is in third place, having produced 1
percent more in 2011, following a 2 percent boost the previous year. Latin America holds the
fourth spot, following a near-3 percent growth in 2010, with an increase of more than 3 percent
in 2011. Although starting from a lower level, compound feeds output in the region comprising
the Middle East with Africa rose 5 percent in 2011 after 1.5 percent in 2010 (Best, 2013).
On a regional level within the ASEAN community (Association of Southeast Asian
Nations), Thailand’s agricultural industry is a major economic engine which employs 40% of the
country’s labor force contributing to a sizable food-processing industry generating exports of
over USD$32 billion in 2011 (Vissessanguan and Eurwilaichitr, 2012). The animal feed sector
therefore represents a key component for Thailand’s food production export engine to the
ASEAN community as well as the rest of the world.
68
According to the UN FAO (Food and Agriculture Organization of the United Nations),
‘feed’ may be broadly classified as concentrates and roughages, which depends on their
composition. Concentrates are feeds that contain a high density of nutrients, usually low in crude
fibre content (less than 18 percent of dry matter) and high in total digestible nutrients. Roughages
are feeds with a low density of nutrients, with crude fiber content over 18 percent of dry matter,
including most fresh and dried forages and fodders (AMIS, 2014). Definitions however of these
feeds and their nutrient contents can vary somewhat in the literature.
Six countries in Asia including China, India, Indonesia, Philippines, Thailand, and
Vietnam represent about 25 percent of the global cereal use for feed. China alone is now the
largest consumer of feed ingredients in the world, absorbing one fifth of global totals (AMIS,
2014). Rising incomes in these countries have led to a rapid growth in the consumption of
animal-based products, which has mostly been met by local production. These developments
have led to a very rapid increase in the consumption of concentrate feeds, progressively
accelerated by a shift from smallholding production to larger-scale commercial operations. While
annual feed consumption stood at approximately 114 million tons in the mid-1980s, this number
had increased to about 358 million tons in 2009-2011, of which 183 million tons were cereals.
Cereals are, therefore, estimated to account for 51 percent of total feed use, which is very similar
to the share in the United States of 53 percent (AMIS, 2014).

69
Figure 3. Thailand Animal Feed Ingredients 9 million tons
(Source: Process Management, 2012)
With the rising populations, along with the associated sophistication of the methods to
provide ever increasing yields, Thailand must find the tools to keep pace with the change.
Livestock production in Thailand plays an important role both in supplying meat, milk, eggs for
domestic consumption and for export. Animal feeds generally account for up to 70 percent of the
cost of production and within these costs, protein sources are likely to have a significant impact
(Wanapat, 2002).
Thailand has a very large market for imported animal feed, which include both prepared
animal feeds and feed ingredients and inputs (Figure 3). The country also imports large
quantities of wheat, mainly for the production of flour for human food production, although a
few thousand tons of lower grade wheat may be used in feed. There is also a small market for
imported barley. Oats and grain sorghum imports are minuscule and undeveloped. Very large
quantities of soybeans are imported to Thailand for crushing purposes, which provides the Thai
feed industry with equally large quantities of domestically available soybean meal.
Although Thailand tries to buy most of its needs in the surrounding countries there is a
demand for products from the developed world. For prepared animal feeds and premixes, starch
industry residues, brewing and distilling industry residues and whey the USA is the leading

70
supplier. Australia leads the markets for meat and bone meal and barley, but is also a sizeable
supplier of whey. Other developed world countries with sizeable markets in Thailand include
New Zealand for MBM, France for whey and the Netherlands for prepared animal feed and
premixes.
As previously stated, one of the largest agriculture and food conglomerates in Thailand
and Asia is the ‘CP Group’. The Charoen Pokphand Group (CP), is Thailand's largest private
company, and is one of Asia's largest conglomerates. Founded in 1921, the CP Group currently
employs, through its subsidiaries, over 300,000 people with offices and factories located
worldwide. With some 200 subsidiaries in China, C.P. Group, known in China as "Zhen Da",
was the country's first foreign investor, and, through is extensive investments, is credited with
changing the country's dietary habits and leading China's Green Revolution (IDCH, 2004).
In a 2012 interview with CNBC Managing Asia, Dhanin Chearavanont, C.P. Groups
C.E.O. stated that technology and innovation were keys to the company’s success at becoming
the global top maker of animal feed (CNBC, 2012). Additionally, helping local’s gain access to
markets while streamlining supply chains were also important components.
What was also very clear in Dhanin Chearavanont’s statements were that “a trade secret
of CP” was that wherever CP went, “they brought the latest technology to increase efficiency and
increase income with more than 90% of the technology coming from the US, with the remaining
10% from Europe”. Additionally, knowledge transfer to the farmers on how to operate and use
the technology was paramount to the business model success.

71
Figure 4. Thailand feed consumption 2004-2014
(Source: Thai Feed Mill Association, 2015)
As can be seen in Figure 4, Thailand’s feed consumption is ever increasing rising, from
10 million tons in 2004 to over 16 million tons a decade later. By 2050, each global farmer will
need to feed 232 people (Schimdt & Reed, 2015) and keys to achieving this are the innovative
climate of the agribusiness organizations, the leadership behavior of management, external work
contacts and relationships leading to innovation behavior assuring sustainability for the
enterprise (Figure 4).
This study is therefore being undertaken to:
1) study the variables and the management of innovation in the agribusiness feed
production sector;
2) to determine the effects, both directly and indirectly, of the variables on innovation
behavior within Thailand’s industrial feed production business;
3) to develop a structural equation model of the variables that influence the
management of innovation within the animal feed production industry in Thailand in order to
determine the benefits and value to the animal feed industry in both the short and long terms so
that enterprises and businesses can compete more effectively within the upcoming integration of
the AEC (ASEAN Economic Community).
Conceptual Development
Innovative Climate
In the bi-annual ‘Consumer Perceptions of Food Technology Survey’ conducted by the
International Food Information Council’s (IFIC), American consumers are not predisposed to

72
fear and when they understand food biotechnology and its benefits, they respond positively
(Schimdt & Reed, 2015).
The 2014 Survey showed that more than seven in 10 American consumers agree that
modern agriculture–conventional farming using today’s modern tools and equipment–can be
sustainable and produce high-quality, nutritious foods. The two-thirds of the Survey’s
respondents say it is important that their food be produced in a sustainable way, affordably–with
the same or fewer resources–and in a way that is better for the environment (Schimdt & Reed,
2015).
Teece (2010) indicated that to profit from innovation, business pioneers need to excel not
only at product innovation but also at business model design, understanding business design
options as well as customer needs and technological trajectories. Business model innovation can
itself be a pathway to competitive advantage if the model is sufficiently differentiated and hard
to replicate for incumbents and new entrants alike.
This is consistent with Charoen Pokphand Group’s (C.P. Group) Chairman and CEO
Dhanin Chearavanont’s (2009) contention that innovation is an important and essential
requirement in the 21st century and the company must prepare itself in an ever-changing world
to reach its goal as a leading Thai global company. Success in developing innovation originates
from ‘people’ who are proficient and the company enhances their knowledge and skills which
grows a skilled workforce capable of driving the company. However, understanding how to use
the latest technology the world has to offer assists in the development of business and the reason
why the business has advanced sufficiently in is such a short period is because innovation is a
key corporate value.

73
In research by de Jong (2006), connections between innovation and leadership were
studied. It was determined that leaders with a desire to stimulate individual innovation are
twofold. First, the most important aspects of innovation-stimulating leadership relate to
participation and direct support. Participation includes consulting, delegating and assigning
employees with challenging tasks. The more employees can participate in decision-making, have
freedom to plan and act, and feel challenged by their tasks, the more enthusiastic and committed
they will be to innovate. Direct support relates to providing support, recognition and resources
for innovation. The more leaders demonstrate confidence in their employees, praise and
appreciate innovative efforts, and demonstrate enacted support by providing time and money, the
more employees can focus on being innovative rather than having to worry of being punished or
unable to realize innovations.
This is also consistent with Isaksen and Akkermans (2011) which indicated that the
working atmosphere within an organization has an important influence on its level of innovative
productivity and that organizational leaders influence innovative productivity as well as the
climate for creativity and innovation. It was also determined that those who perceived more
leadership support for innovation had significantly better creative climate scores and those who
perceived higher levels of innovative productivity also had better climate scores. Finally,
organizational climate as an intervening variable between leadership behavior and innovation
was confirmed through partial correlation and mediation analysis. The findings of the study
supported the pivotal role that creative climate plays between leadership behavior and innovative
productivity.
A study by Nanda and Singh (2009), said in today's competitive business environment,
the global competition is forcing companies to perpetually seek ways to improve their products

74
and services. The pressure on organizations to adapt to new technologies and external threats
requires resourcefulness, creativity and innovation and that leader’s decision to innovate must be
backed by actions that create an environment in which people are so comfortable with innovation
that they create it.
In research from the ILO (International Labor Organization) reports authors Rogovsky
and Tolentino (2010) stated that because of dynamic markets, rapid advance of production and
information technology, changes in resource availability and constantly changing customer
expectations, on-going innovations in products, processes and organizations are essential for
productivity. Productivity improvement must now focus on value creation rather than on
minimization of inputs.
Rogovsky and Tolentino (2010) also went on to include a case study about Thailand’s
agribusiness ‘Betagro’. In attempting to meet Betagro’s long term expansion and growth
objectives, Betagro had to overcome two of their major problems which were lack of
professional and qualified workers. The company therefore developed measures to address these
issues by approaching college students at several universities in Thailand to introduce the
company and persuade students to join it after graduation. To deal with the lack of qualified
workers, the company provided an internship program and training courses. The training courses
were in two categories: production and management. Production training focused on technical
skills through on-the-job-training. Management training aimed to improve skills in management,
leadership, and communication. In addition, Betagro applied the “Kaizen System for 5 years to
increase the efficiency of each production line and to set up a production plan for the entire
system. In addition, to increase work incentives, a salary system based on personal performance
evaluation was introduced. After implementing an ‘innovative climate’, the company has grown

75
to 21,000 employees in 25 subsidiaries with only a 6% turnover rate and is a leading company in
integrated agricultural business.
External Work Contacts
As has been seen with C.P. Group and Betagro, a key to innovation has been external
(foreign) working relationships, especially focused on the US and Europe (CNBC, 2012;
Rogovsky & Tolentino, 2010). Another key component has been their vertical integration while
controlling the entire process from production of raw materials up to marketing of final products
(Panyakul & Levin, 1993).
Companies such as C.P. Group also use contract farming, especially the wage contract
system, as their most important method for external work contacts within Thailand and has
expanded this process into neighboring countries. The practice ensures lower production costs
and better control over the product by CP (Panyakul & Levin, 1993).
Sriboonchitta and Wiboonpoongse (2008) defined contract farming is a means to assist
small growers in gaining market access and reducing price risk, and as such it has attracted
attention from development agencies and governments in developing countries In the long run,
small farmers were able to accumulate production and management skills, thus improving their
bargaining position. Together with improved infrastructure and a more competitive market due
to farmers’ innovation however, the research concluded that the farmers’ best choice may
include non-contract production.
In other words, external work contacts involve the supplier, foreign instructions such as
NGOs, universities, trade associations, etc. as well as customers and competitors.
76
Innovation-Stimulating Leadership Behavior
Organizations constantly encounter forces driving them to change. Because change
means doing something new and unknown, the natural reaction is to resist it (Waldron,
Vsanthakumar and Arulraj, 1998). This is consistent with Mintzberg (1990) who showed
managers spend most of their time reacting to events and almost no time planning. He or she has
status that leads to various interpersonal relations, and from this comes access to information.
Information, in turn, enables the manager to devise strategies, make decisions, and implement
action (Mintzberg, 1988). Management is therefore concerned with the optimum attainment of
organizational goals and objectives with and through other people (Waldron, Vsanthakumar and
Arulraj, 1998).
Mintzberg (1990) also developed ten management roles which included: 1) Figurehead 2)
Leader 3) Liaison 4) Monitor 5) Disseminator 6) Spokesperson 7 ) Entrepreneur 8) Disturbance
Handler 9) Resource Allocator and finally, 10) Negotiator. These 10 roles were then placed into
3 categories including:
a) Interpersonal
b) Informational and
c) Decisional.
Mintzberg has also consistently attacked the planning approach to strategy,
demonstrating that most strategies change very irregularly and show that most companies appear
to take an ‘emergent’ rather than a ‘planned’ route to developing their strategies. They ‘craft’
their strategies rather than ‘design’ them (Campbell, 1991).
Furthermore, Carmeli, Meitar and Weisberg (2006) studied self-leadership skills and
innovative behavior at work and concluded that the three-dimensional scale of self-leadership
skills is positively associated with both self and supervisor ratings of innovative behaviors. The

77
findings also showed that income and job tenure are significantly related to innovative behaviors
at work.
Innovation Behavior
According to Li and Zheng (2014), in order to obtain and maintain a competitive
advantage, the organizations must innovate continuously. There is no doubt that the employees
are the main force for the organizations, and their innovative behaviors are vital for innovation
performance of an organization. Therefore, the organizations have to take measures to stimulate
the innovation willingness of employees and promote their innovation behavior. Based on the
relevant research results, the paper summed up the main factors affecting employees’ innovative
behavior including organizational commitment, psychological capital on the individual level, and
organizational innovation atmosphere, leadership, social capital, work characteristics on the
organizational level.
This is consistent with Boehlje, Roucan-Kane, and Bröring (2011) which stated that the
global food and agribusiness industry is in the midst of major changes, and the pace of change
seems to be increasing. These changes suggest three fundamental critical future issues for the
sector: 1) decisions must be made in an environment of increasing risk and uncertainty,
2) developing and adopting technology and new innovations is critical to long- term financial
success, and 3) responding to changes in industry structure and the competitor landscape and
industry boundaries is essential to maintain market position.
Research from Wong and Chin (2007) also supports the above has it was stated that
organizational innovation management (OIM) is one of the critical means to sustain
competitiveness in organizational innovation in the long term. Cormican and O'Sullivan (2004)
added to this by stating that the product innovation process is extremely complex and involves

78
the effective management of many different activities. Despite the fact that many tools and
techniques have been developed in an attempt to make this process more effective, product
development projects are still prone to failure.
Proposed Conceptual Framework (Figure 5)
Figure 5. Influencing factors on Innovation Behavior within the Thai Feed Industry
Research Hypothesis
H1: The Innovative Climate has a direct influence on Leadership Behavior that encourages
innovation.
H2: The Innovative Climate has a direct influence on Innovation Behavior.
H3: External Work Contacts has a direct influence on the Leadership Behavior that encourages
innovation.
H4: External Work Contacts has a direct influence Innovation Behavior.
H5: Innovation Behavior directly influences Innovation Behavior.
Methodology
This research aims to model the structure of the factors influencing the innovation
behavior of industrial feed production in Thailand, so the researchers wish to determine the
details and procedures from the methods below:

79
The approach used in the study
For this research the researchers used both quantitative and qualitative research from both
primary and secondary data. The researchers have determined the following steps for this study:
Primary and Secondary Data Research
Primary data is most generally understood as data gathered from the information source
and which has not undergone analysis before being included in the analysis. Primary data is
collected directly from the surveyed population and involves face to face interviews or
discussions with members of the surveyed community. It can also be also be collected by phone
interviews, radio communication, email exchange and direct observation (Acaps, 2012).
Secondary data is information which has typically been collected by researchers not
involved in the current assessment and has undergone at least one layer of analysis prior to
inclusion in the needs assessment. Secondary data can comprise published research, internet
materials, media reports, and data which has been cleaned, analyzed and collected for a purpose
other than the needs assessment, such as academic research or an agency or sector specific
monitoring reports (Acaps, 2012).
The Quantitative Research Study
Quantitative research will be performed from the primary data by collecting a questionnaire
from the target sample. The questionnaire to be used to collect data is structured and written and
a realistic, easy-to-understand format with are deemed to be reliable and reasonable. Further
reliability validation will be undertaken as follows:
Review of the questionnaire will be conducted by academic scholars to validate the
investigation questions and the use of rhetoric and the simplicity and comprehension of the
questions.

80
During the question trial period, questions will undergo and continual review for
their clarity and ability to the meet the objectives of the research.
Update the survey questions after completion of the trial period.
Perform both data collection and statistical analysis.
Qualitative Research Approaches
Qualitative research will involve confirming the model of quantitative research. It is a
collection of interviews with those involved in innovation, including plant managers, production
managers and animal feed mill managers.
Population and Sampling
The population in this study is animal feed mill factories in Thailand which have been
included on a list compiled by Thailand’s Ministry of Agriculture Food and Drug Control
Division’s Department of Livestock, which is current as of July 12, 2014 representing a total of
699 factories. Questionnaires were constructed as a tool to measure concept definition and
practice. Questionnaires will be constructed as a tool to measure concept definition and practice
using a 5-Point Likert Scale. This research will conduct Confirmatory Factor Analysis (CFA)
and subsequently reliability analysis to measure Cronbach’s alphas (Cronback, 1951) for this
scale items to ensure internal consistency. Multi-item measures were developed based on
Cronbach’s alpha >0.68. This study will then calculate Cronbach’s alphas for each construct. If
the value is below 0.50, the research question will be cut off. This is considered highly reliable.
The responses to the questions capturing focal constructs will use a five-point Likert scale (rating
statements 1-5; 1 = strongly disagree and 5= strongly agree) (Likert, 1972).

81
Sample
The sample used in this study was drawn from managers involved in various capacities in
Thailand’s feed factories including plant managers, production managers, engineering managers
or feed mill managers.
The Sample Size
1. Quantitative research is currently envisioned using the partial least squares (PLS)
statistical method and hypothesis testing with PLS-Graph software (Chin, 2001), which analyses
the display and model structure associated with the observed manifest variables with latent
variables. Verification of the accuracy and reliability of the measurements multi-item measures
will be developed based on Cronbach’s alpha (Cronbach, 1951). This study will then calculate
Cronbach’s alphas for each construct. Schumacker and Lomax (2010) stated that Structural
Equation Modeling (SEM) uses a variety of models to show the relationships between observed
variables with the same basic goal of providing a quantitative test of a theoretical model
hypothesized by a researcher. Another very important consideration is the intended sample size
with many authors recommending a sample size of at least 100 to generate good results, so,
therefore, a sample size smaller than 100 should not be used as it is unreliable and consequently
SEM should not be used (Meldrum, 2010). Therefore, using a factor of 10 for each variable from
the research survey, it is anticipated that a total of 160 samples are adequate to assure a reliable
sample size (Schumacker and Lomax, 2010).
2. Qualitative Research is to be undertaken through the use of in-depth interviews with
those involved in innovation, including plant managers, production managers and engineering
managers. To confirm the model of quantitative research, the sample size of the research to be
used will be 10 individuals.

82
Tools used in research
Tools used in the research will include the following steps:
Self-administered questionnaire (SAQ)
For this research, the measurement instrument or questionnaires utilized was prepared
from the literature. A self-administered questionnaire (SAQ) is being used as it is exploratory in
nature and serves as a starting point for other methodologies.
Research Quality Inspection Tools
The research will be conducted to determine the quality of the instruments used in the
research. Tools used to measure quality are divided into 2 phases including content validity and
reliability (Hale and Astolfi, 2014). The research is divided into two phases.
1. Phase I consists of an inspection by experts, totally 5 individuals. These include :
1.1 Factory Manager 1 person
1.2 Production Manager 1 person
1.3 Engineering Manager 1 person
1.4 Technical Innovation Managers 2 persons
2. Phase II consists of measures to ensure the quality of the questionnaire. In this
study, the draft questionnaire was created with 16 main items which were later checked for their
content validity by five experts in their related fields of feed production management and were
based on the Item-Objective Congruence (IOC) Index. The items with IOC index higher than 0.5
were acceptable. In order to test the proper reliability of the questionnaire, the questionnaire will
be piloted with 30 feed service production businesses lower and middle-level managers and
calculated for proper reliability value by using Cronbachs Coefficient Alpha (Cronback, 1951).

83
Data Collection
Primary Data
Primary data will come from a collection of factors influencing the innovation behavior
of industrial feed mill production in Thailand.
Secondary Data
By studying theories related to the research from various sources, including books,
articles, research papers, instruction manuals, etc., to frame concepts and theories used in the
study.
Data analysis and statistics used
The analysis of quantitative data will be conducted using statistical analysis as follows:
1. An analysis will be conducted by descriptive statistics by characterizing the
frequency, percentage, mean and standard deviation.
2. Analysis will be conducted using structural equation analysis (SEM) to determine
the relationship of the factors influencing the innovation behavior of industrial feed production in
Thailand.
Qualitative Data Analysis
To confirm the results of the quantitative analysis, the researchers conducted interviews
with those involved as plant managers, production managers or engineering managers involved
with animal feed mills in Thailand.

84
Conclusion
With the approaching integration of the ASEAN community at the end of 2015,
competition within the region is expected to increase. Labor cost is a significant component of
the feed factory cost equation and Thailand now has one of the highest costs within the 10 nation
community. From the review of the literature, numerous studies enforce the idea that innovation
is a key component of enterprise profitability, competitiveness and sustainability. Employee
behavior innovation and contribution is therefore a crucial element in an organization’s potential
for success including the feed mill factory industry. Understanding the variables that create a
climate of innovation using leadership behaviors that encourage innovation is a key to this
research. Furthermore, understanding the external factors and their relationships can also help
with enhancing productivity and competitiveness of the feed mill factory industry in modern
times.

85
References
Acaps. (2012). Qualitative and quantitative research techniques for humanitarian needs
assessment: An introductory brief. Retrieved from http://tinyurl.com/krnh24h
AMIS. (2014). Improving feed use estimations: Data, methodologies and challenges.
Agricultural Market Information System: An AMIS scoping study. Retrieved
from http://tinyurl.com/oh2ablp
Best, P. (2011). World feed panorama: Expensive grain slows industry expansion. Feed
International, January/February 2011. Retrieved http://tinyurl.com/p3f9lgl
Best, P. (2013). World feed panorama: Once again, industry increases its volume. Retrieved
from http://tinyurl.com/mzr9wgz
Boehlje, M., Roucan-Kane, M., & Bröring, S. (2011). Future agribusiness challenges: Strategic
uncertainty, innovation and structural change. International Food and Agribusiness Management
Review, 14(5). Retrieved from http://tinyurl.com/macy2al
Campbell, A. (1991). Brief Case: Strategy and Intuition: A Conversation with Henry
Mintzberg. Long Range Planning, 24(2), 108 – 110. Retrieved from http://tinyurl.com/kamoqnh
Carmeli, A., Meitar, R., & Weisberg, J. (2006). Self-leadership skills and innovative behavior at
work. International Journal of Manpower, 27(1), 75 - 90.
https://doi.org/10.1108/01437720610652853
Chearavanont, D. (2009). Innovation will drive CP to become a Leading Thai Global Company.
CP Innovation Exposition. Retrieved from http://tinyurl.com/pnp8vzc
Chin, W.W. 2001. PLS-Graph User’s Guide-Version 3.0, Houston, TX: Soft Modeling Inc.
CNBC. (2012). Dhanin Chearavanont on CNBC Managing Asia 2012. Retrieved
from http://tinyurl.com/kozztdk
Cormican, K., & O’Sullivan, D. (2004). Auditing best practice for effective product innovation
management, Technovation, 24(10), 819-829. https://doi.org/10.1016/s0166-4972(03)00013-0
Cronbach, L.J. (1951). Coefficient alpha and the internal structure of tests.
Psychometrika,16(3), 297–334.
de Jong, J. (2006). Individual Innovation: The connection between leadership and employees’
innovative work behavior. Retrieved from http://tinyurl.com/lw87ozw

86
Feed International. (2002). World feed panorama survey 2001 data. Retrieved
from http://tinyurl.com/ml94dx9
Forbes. (2015). The World’s Billionaires. Retrieved from http://tinyurl.com/orse2wf
Hale, C. D., & Astolfi, D. (2014). Measuring Learning and Performance: A Primer. Retrieved
from http://tinyurl.com/prhafoo
Hinrichs, J., & Steinfeld, H. (2007). Feed availability inducing structural change in the poultry
sector. UN FAO Report. Retrieved from http://tinyurl.com/pumxygg
IDCH. (2004). International Directory of Company Histories. St. James Press.
Isaksen, S. G., & Akkermans, H. J. (2011). Creative climate: A leadership lever for
innovation. Journal of Creative Behavior, 45(3). Retrieved from http://tinyurl.com/ljurnwm
Li, X., & Zheng, Y. (2014). The influential factors of employees’ innovative behavior and the
management advices. Journal of Service Science and Management, 7, 446-450.
https://doi.org/10.4236/jssm.2014.76042
Likert, R. (1972). Likert Technique for Attitude Measurement. In: Social Psychology:
Experimentation, Theory, Research, Sahakian, W.S. (Ed.). Intext Educational Publishers,
Scranton, PA. 101-119.
Meldrum, K. (2010). Structural equation modeling: Tips for getting started with your research.
Contemporary Approaches to Research in Mathematics, Science, Health and Environmental
Education 2010. Retrieved from http://tinyurl.com/megll3d
Mintzberg, H. (1988). Mintzberg on management. New York, NY: Free Press.
Mintzberg, H. (1989). Mintzberg on management: inside our strange world of organizations.
New York, NY: Free Press.
Nanda, T., & Singh, T. P. (2009). Determinants of creativity and innovation in the workplace: a
comprehensive review. International Journal of Technology, Policy and Management,
9(1). https://doi.org/10.1504/ijtpm.2009.022845
Panyakul, V. R., & Levin, P. (1993). Agriculture or agribusiness? Thai farmers search for viable
alternatives. Retrieved from http://tinyurl.com/p9ehz4n
Process Management. (2012). Thai animal feed market flexible with in a strait-jacket.
Retrieved http://tinyurl.com/m8zl2x7

87
Rogovsky, N., & Tolentino, A. (2010). Sustainable enterprise promotion through
good workplace practices & human resource management. ILO International Labour
Organization. Retrieved from http://tinyurl.com/m9odu2a
Schumacker, R. E., & Lomax, R. G. (2010). A beginners guide to structural equation modeling.
New York, NY: Routledge. Retrieved from http://tinyurl.com/lzx5fzy
Schmidt, D. B., & Reed, K. (2015, May 4). The future of food: Production, innovation, and
technology. The Diplomatic Courier. Retrieved from http://tinyurl.com/q69dvj6
SEA-LAC. (2014, March). Thailand Food Processing Industry. The SEA-LAC Trade Center,
University of the Thai Chamber of Commerce. Retrieved from http://tinyurl.com/lqpn8sb
Smil, V. (2004). Enriching the earth. Fritz Haber, Carl Bosch and the transformation of
world food production. Cambridge, MA: M.I.T. Press.
Sriboonchitta, S., & Wiboonpoongse, A. (2008). Overview of Contract Farming in Thailand:
Lessons learned. ADBI Discussion Paper 112. Tokyo: Asian Development Bank Institute.
Retrieved from http://tinyurl.com/nyo88vf
Teece, D.J. (2010). Business Models, Business Strategy and Innovation, Long Range
Planning. In Crafting and Executing Strategy, Thompson, Peteraf, and Strickland (eds.);
Irwin/McGraw-Hill. Retrieved from http://tinyurl.com/nok8j6a
Thai Feed Mill Association. (2015). Animal Population and Feed Consumption. Retrieved
from http://www.thaifeedmill.com/tabid/56/Default.aspx
Vissessanguan, W., & Eurwilaichitr, L. (2012). Boosting Thailand’s Food and Feed
Industry. Asia Pacific Biotech News. Retrieved from http://tinyurl.com/k92wkwr
Waldron, M. W., Vsanthakumar, J., & Arulraj, S. (1998). Chapter 13 – Improving
the organization and management of extension. Retrieved from http://tinyurl.com/odta79d
Wanapat, M. (2002, May). Current livestock production and protein sources as animal feeds in
Thailand, FAO Animal Production and Health. Retrieved from http://tinyurl.com/q9th3vr
Wong, S-Y., & Chin, K-S. (2007). Organizational innovation management. Industrial
Management & Data Systems, 107(9), 1290 – 1315.
https://doi.org/10.1108/02635570710833974

88
Analysing the Relationship between Advertising and Sales Promotion with Brand Equity
Haim Hilman
Universiti Utara Malaysia
Malaysia
Jalal R. M. Hanaysha
Universiti Utara Malaysia
Malaysia
Noor Hasmini Abd. Ghani
Universiti Utara Malaysia
Malaysia
Reference to this paper should be made as follows:
Haim Hilman, Jalal R. M. Hanaysha and Noor Hasmini Abd. Ghani
Hilman, H., Hanaysha, J. R. M., & Ghani, N. H. A. (2017). Analysing the relationship between
advertising and sales promotion with brand equity. Asian International Journal of Social
Sciences, 17(2), 88 – 103. Retrieved from http://aijss.org/index.php/aijss20170204/
All works licensed under a Creative Commons Attribution-Non Commercial-No Derivatives 4.0 International License.
The Asian International Journal of Social Sciences (AIJSS) allows the author(s) to hold the copyright without restrictions.
The Asian International Journal of Social Sciences (AIJSS) allows the author(s) to retain publishing rights without restrictions.

89
Abstract: In today’s competitive business environment, customers are considered to be the
source of brand success. Customers have numerous choices to form among alternative products,
and they apply a high level of effect in the market with regard to several aspects such as
quality, product size, services, and price. Hence, it is very important for manufacturers to
meet customers’ needs in order to stay competitive. Advertising and sales promotion
are considered as the main tools of marketing communication which is influential in
attracting the attention of the customer and building brand equity. Advertising and sales
promotions are highly effective in affecting consumer purchase decisions of a particular brand.
The main purpose of this paper is to analyze the link between advertising and sales promotion
with brand equity. It reviews the past studies on the above-mentioned variables and provides
some clarification to the nature of relationship existing between them.
Keywords: advertising, brand equity, sales promotion

90
Introduction
In increasingly competitive markets, companies recognize that they have to monitor,
improve and strengthen their brands regularly in order to communicate consumer value for a
long period of time (Yang, 2010). Nowadays, high equity brands play a vital role in the
formation of marketing strategy, and are viewed as the main sources of differentiation that
enhance firms’ competitiveness (Harun, Kassim, Igau, Tahajuddin, & Al-Swidi, 2010). In this
concern, the need for strategic brand management is of significant importance (Keller, 2008).
Consumers assess a brand according to their past experience with regard to its ability to meet
and fulfil their needs and whether it delivers products and services beyond their expectations
(Aaker, 1996; Siddiqi, 2011).
Certainly, brands that can effectively manage to position themselves successfully in
consumers’ minds can enjoy multiple advantages. The most important advantage is the
creation of brand equity. In particular, brand equity measures the ability of a brand to attract
customers and maintain them profitably and expressively in financial terms (Haefner, DeliGray,
& Rosenbloom, 2011). The increasing interests in branding nowadays while taking into
consideration the high competition in markets, it has become very important to understand
how brand equity can be established and enhanced. Previously, it was demonstrated that the
creation of brand equity is the responsibility of the whole firm (Aaker, 1991; Schreuer, 1998),

91
and thus strategic brand management plays a vital role in the creation of brand equity (Keller,
2008).
Previous research demonstrated that advertising and sales promotions are they factors
that influence the creation of brand equity (Yoo et al., 2000; Buil et al., 2011). However, despite
the importance of these variables, the individual contributions of advertising and sales
promotions to brand equity still unclear and some scholars suggested the need to additional
explanation of the effect of these variables (Netemeyer et al., 2004; Chu and Keh, 2006).
Hence, this paper aims to analyze the past literature on advertising and sales promotion and
their relationships with brand equity. The outcomes of this paper will provide some
guidelines and suggestion for future researchers as well as business practitioners. In the next
sections, a discussion on these variables with brand equity is provided.
Literature Review
Brand Equity
Brand equity is one of the principal concepts in the field of brand management and it has
obtained significant attention in previous researches wit particular to different contexts (Boo,
Busser, & Baloglu, 2009). Certainly, the basic foundation of brand equity is largely
associated with the firm’s success, because when it is created, more profits and fewer
expenses will be engendered (Myers, 2003; Keller, 2003). In the last few years, brand equity
has gained large attention from several scholars demonstrating that it plays a vital strategic
role in developing competitive advantage throughout strategic management of the brand
(Moradi & Zarei, 2011).

92
A number of definitions were suggested to brand equity in the existing literature. Brand
equity was initially defined by Farquhar (1989), as “the ‘added value’ with which a given
brand endows a product” (p. 24). Brand equity was also defined as “the enhancement in the
perceived utility and desirability a brand name confers on a product” (Lassar et al., 1995, p.
13). Brands that have high equity can establish their competitive advantage, charge a price
premium on their products; and exploit customer demand (Bendixen, Bukasa, & Abratt,
2003).
Furthermore, Aaker (1991) stated that brand equity is a multidimensional construct which
contains several dimensions namely brand association, brand awareness, brand loyalty,
perceived quality and other proprietary assets. On the other hand, Keller (1993) viewed brand
equity as a concept that includes brand image and brand association. Yoo, Donthu, and Lee
(2000) revealed that brand equity can be establishing by reinforcing those dimensions. All of
the said brand equity dimensions build up the credibility and value of brands and
consequently encourage the customers to establish favourable attitude towards strong brands
during the process of decision making. However, previous researches have used different set
of dimensions for measuring this variable with particular to different contexts. The majority
of these studied followed the pattern of Aaker (1991) to measure brand equity because they
comprehensively measure this variable.
Advertising
Advertising is one of the main marketing communication tools that affect consumer tastes
and preferences and creates the differentiation of products (Shah & Akbar, 2008).
Advertising refers to “any paid form of non-personal presentation and promotion of ideas,

93
goods or services by an identified sponsor” (Kotler et al., 2005, p.761). Business practitioners
as well as academics (Aaker 1991, Keller, 1993) verified that advertising has a considerable
role in the formation of powerful brands. Ha (2011) suggested that advertising can strongly
influence the development of brand awareness, and can affect consumer decisions during the
purchase of products and services. Moreover, Kirmani (1990) supported this view that
advertising has a strong effect on improving brand performance, at the same time it
encourages practical experience of a particular brand, and plays a critical role in the creation
of brand equity (Buil, de Chernatony & Martínez, 2011).
As mentioned by Hilman (2009), effective business plan demands firms to look for
appropriate strategies that meet up the needs of customers. Advertising is one the
marketing communication strategies that can be used to inspire or persuade customers to
purchase a certain product or service (Buil et al., 2011). Generally, the key function of
advertising is to influence the behaviour of customers according to a particular offering
(Aaker, 1991; Keller, 2003). Advertising messages are normally paid for communicating a
brand by the firm and can visualized through various traditional media, such as mass media
including outdoor advertising, direct mail, radio advertisements, or newspaper; and new
media for example, blogs, text messages, and websites (Iranzadeh, Norouzi, & Heravi, 2012).
Sedaghat, Sedaghat, and Moakher (2012) indicated t several advertising media that can be
used to communicate the brand, such as magazines, television (satellite, terrestrial, local, and
national) cinema, journals, outdoor advertising (bus sides and posters,), newspapers (free,
local, trade, and national). On the other hand, Chattopadhyay, Dutta, and Sivani (2010),
suggest several types of advertising, such as: television advertisement, event sponsorship,

94
print advertisement, mobile phone advertisement, and internet advertisement.

95
Advertising and Brand Equity
Advertising has gained significant interest in latest years assuming it as a valuable
strategy for firms seeking to gain competitive advantage and exploit their brand equity
(Doraszelski &
Markovich, 2007; Chattopadhyay et al., 2010; Gill et al., 2007). Tilley (1999) verified that
advertising plays a critical role in creating a leadership brand. Moreover, a brand that spends
more on advertising to communicate its messages for customers, can develop its image,
increase customer trust, and obtain new ones to purchase its products; this is because
customers usually trust the product quality of the well-known brands (Mitchell & Olson,
1981; Balaji, 2011).
Past research have examined the relationship between advertising and brand equity, and
showed inconsistent findings. For instance, several studies revealed significant positive
influence from advertising on brand equity (Chen & Green, 2012; Chattopadhyay et al., 2010;
Gill et al., 2007; Sedaghat et al., 2012; Smith 2007; So & King, 2010; Sriram et al., 2007).
However, other studies conducted by Buil et al. (2011) Huang and Sarigöllü, (2011), and Chen
and Green (2012) indicated that advertising spending has insignificant effect on brand
equity.
For instance, Gill et al. (2007) conducted a study to examine the influence of
advertising on the formation of brand equity in context of Spain. This study has focused on
various brands from three different product categories namely milk, olive oil, and toothpaste.
Generally, the results revealed a significant positive influence of advertising on brand equity
assets (brand awareness, perceived quality, and brand associations). The main limitation in
this study lies in the small sample size which may not allow for analyzing differences

96
between the selected product categories. Hence, it would be distrustful to generalize the
findings to other contexts without additional investigation.
Likewise, Chen and Green (2012) examined the perceptions of age groups towards
retailers’ marketing mix strategies and their effect on customer-based brand equity. This study
indicated a negative and insignificant relationship between advertising and brand equity. The
result is in line with that of Buil et al. (2011) who indicated that advertising spending had an
insignificant effect on brand equity dimensions: perceived quality, brand association, and
brand awareness.
Hence, this review reveals that advertising is a very important variable for enhancing
brand equity. Companies with higher advertising are likely to have higher equity than those
which pay less emphasis to this variable. In order to make advertising more effective, it is
essential to ensure the creativity and originality of advertising campaigns and develop them in a
manner that can attract customers and build their confidence toward the brand. This would
enhance the image of the brand in long run and provides a basic for creating sustainable
competitive advantage.
Sales Promotion
The importance of sales promotion in shaping brands has been documented in the
literature. For instance, sales promotions influence the process of establishing strong brands and
facilitate the creation competitive advantage; this is because sales promotions improve brand
awareness for the whole product category and the promoted brands (Blattberg & Neslin,
1990). Though, in contemporary management practices, customers may think that firms
develop promotional programmes in order to differentiate and modernise their brand image
and enhance brand awareness (Palazón-Vidal & Delgado-Ballester, 2005).

97
According to past researches of Kwok and Uncles, (2005); Palazón-Vidal and
DelgadoBallester, (2005), sales promotions can be valuable for customers and positively
influence their behavioural decisions, because they endow them with experiential benefits that
may not be engendered in the product itself. In this way, sales promotions may possibly improve
customers’ experiences such as fun, delight and distraction, and influence their attitude
toward the brand (Palazón-Vidal & Delgado-Ballester). A part from sales promotion,
product-gift fit also significantly affect consumers’ evaluation particularly for high equity
brands (Montaner de Chernatony & Buil, 2011).
Sales promotion can differentiate a brand from its potential rivals and also it helps brand
managers to communicate distinctive brand attributes, leading to improved brand equity
(Mela, Gupta, & Jedidi, 1998; Chu & Keh, 2006). Sales promotions are well-known for their
strong capability to attain business objectives and develop brand image or strengthen brand
awareness (Chattopadhyay et al., 2010). They add stimulation and hence value to the brands
(Aaker, 1991).
Sales Promotion and Brand Equity
Brand equity has been shown to be the central issue in research by which the focus has
been cantered on the examination of its antecedents and consequences (Chattopadhyay et al.,
2009). Earlier researches verified that the level of brand equity plays an important role in
determining whether or not a brand is well focused on the offering sales promotions to
influence consumer behaviour positively over competitive brands from the same product
category (Raju et al., 1990). Sales promotions are expected to have the ability to create strong

98
brand equity because they influence brand image and brand association which in turn play an
key role in shaping brand equity (Keller 1998; Krishnan 1996).
In reviewing the past literature on sales promotions and brand equity, it can be noticed
that most of the studies revealed insignificant relationship between sales promotions and brand
equity (Gil et al., 2007; Chattopadhyay et al., 2010; Hosseini and Zareebaf, 2011; Buil et al.,
2011). Moreover, Valette-Florence et al. (2011); Yoo et al. (2000) demonstrated that sales
promotions have significant but negative effect on building brand equity. They added that
sales promotions minimize brand equity even though they have a short-term benefit for
potential consumer (Villarejo-Ramos et al., 2005. Hosseini and Zareebaf (2011) investigated
the influence of sales promotions on brand equity in context of banking industry in Iran. This
study found insignificant relationship between sales promotion and brand equity dimensions
namely brand association, perceived quality, brand loyalty, brand awareness).
Similarly, Chattopadhyay et al., (2010) studied the effect of sales promotion for different
media vehicles on building brand equity in context of Indian passenger car market. Generally,
the results revealed that sales promotion has insignificant relationship with two dimensions of
brand equity namely perceived quality and brand awareness. However, certain studies
indicated that sales promotions have significant positive effects on brand equity (Sriram et
al., 2007; So and King, 2010; Chen and Green, 2012). For example, So and King, (2010)
conducted a study in Australia to examine the impact of sales promotions and advertising on
brand equity, and their study results demonstrated that sales promotion has a significant
positive effect on brand equity.
The above discussion on sales promotion and brand equity demonstrates that high
emphasis on sales promotion negatively influence brand equity. The majority of previous studies

99
support this argument by indicating that customers think of sales promotions as they usually
provided by brands having low quality products, and the purpose is just to get out of that
products. In particular, this paper suggests that in the future, other researches should be
conducted to clearly establish the actual relationship between sales promotions and brand
equity with regard to different cultures and country contexts.
Conclusion and Future Research Directions
In highly competitive global markets, it has become necessary for brands to sustain their
positions and build up their competitive advantages through enhanced brand equity. In
particular, creating brand equity has recently become a strategic initiative for firms, mainly
because brand value is usually evaluated according to the positive image created in
consumers’ mind and their repeat purchases. Two marketing communication tools include
advertising and sales promotions have received significant attention over the last years as
important elements in influencing brand equity. One of the main objectives of advertising and
sales promotion is to improve the short-term sales of a product or service and influence
consumer behaviour. However, Long-term effects are under an academic debate and diverse
research shows conflicting results.
This paper has discussed past studies that examined the influence of advertising and sales
promotions on building brand equity. In general, the majority of the scholars have declared
that advertising has significant positive impact on brand equity development. The more
advertising a brand spends, the higher brand equity will be. However, investments in this
variable are not sufficient to influence the image of a brand. In this concern, firms should pay
high attention to the design of creative advertising campaigns and ensuring their originality.

100
Moreover, this paper concludes that a review of the past literature demonstrated that sales
promotions are insignificant in developing brand equity. They have further stated that sales
promotion negatively affect brand equity, and customers usually think of sales promotions as
an indicator of low quality products.
This paper opens an opportunity for some future research directions. For example, future
studies can focus on examining the effect of advertising and sales promotions on brand equity
with particular to different contexts and make a comparison between different product
categories. In addition, the theme of this research can also be conducted by different research
methods. A mixture of both quantitative and qualitative research methods can be used to
depict a direct impact on the consumers purchasing behavior. Future research also can
conduct a cross-case analysis whereby the implementation of advertising and sales promotion
used can be compared between various companies in the same consumer market. Finally, this
paper contributes to better understanding of the role of advertising and sales promotion in
developing brand equity, and offers some insights into how business managers can manage
the significance of these assets.
101
References
Aaker, D. A. (1991). Managing brand equity. New York, NY: Free Press.
Aaker, D. A. (1996). Building Strong Brands. New York, NY: Free Press.
Balaji, M. S. (2011). Building Strong Service Brands: The Hierarchical Relationship
between Brand Equity Dimensions. The IUP Journal of Brand Management, 8(3). Retrieved
from http://tinyurl.com/y8nok3f2
Bendixen, M., Bukasa, K. A., & Abratt, R. (2004). Brand Equity in the Business-to-
Business Market. Industrial Marketing Management, 33(5), 371-380.
https://doi.org/10.1016/s0019-8501(03)00122-6
Blattberg, R. C., & Neslin, S. A. (1990). Sales promotion concepts, methods, and
strategies. Englewood Cliffs, NJ: Prentice Hall.
Boo, S., J. Busser., & Baloglu, S. (2009). A model of customer-based brand equity and
its application to multiple destinations. Tourism Management, 30(2), 219-231.
https://doi.org/10.1016/j.tourman.2008.06.003
Buil, I., de Chernatony, L., & Martínez, E. (2011). Examining the role of advertising and sales
promotions in brand equity creation. Journal of Business Research, 66(1), 115 – 122.
https://doi.org/10.1016/j.jbusres.2011.07.030
Chattopadhyay, T., Shivani, S., & Krishnan, M. (2009). Determinants of brand equity – A blue
print for building strong brand: A study of automobile segment in India. African Journal of
Marketing Management, 1(4), 109-121.
Chattopadhyay, T., Dutta, R. N., & Sivani, S. (2010). Media mix elements affecting
brand equity: A study of the Indian passenger car market. IIMB Management Review, 22(4), 173-
185. https://doi.org/10.1016/j.iimb.2010.10.006
Chen, H.-C., & Green, R. D. (2012). Brand equity, marketing strategy, and consumer income: A
hypermarket study. Journal of Management and Marketing Research, 1-18. Retrieved
from http://tinyurl.com/ybphh5kx
Chu, S., & Keh, H.T. (2006). Brand value creation: analysis of the Interbrand-Business Week
brand value rankings. Marketing Letters, 17, 323-31. https://doi.org/10.1007/s11002-006-9407-6
Doraszelski, U. & Markovich, S. (2007). Advertising dynamics and competitive
advantage. RAND Journal of Economics, 38(3), 557-592.
https://doi.org/10.1111/j.0741-6261.2007.00101.x
Farquhar, P. H. (1989). Managing Brand Equity. Marketing Research, 1(3), 24-33.

102
Gill, D., Byslma, B., & Ouschan, R. (2007). Customer perceived value in a cellar door visit: The
impact on behavioural intentions.International Journal of Wine Business Research,19(4), 257-
275. https://doi.org/10.1108/17511060710837418
Ha, H.-Y., Janda, S., & Muthaly, S. (2010). Development of brand equity: Evaluation of
four alternative models. The Service Industries Journal, 30(6), 911-928.
https://doi.org/10.1080/02642060802320253
Haefner, J. E., Deli-Gray, Z., & Rosenbloom, A. (2011). The importance of brand liking
and brand trust in consumer decision making: Insights from Bulgarian and Hungarian consumers
during the global economic crisis. Managing Global Transitions, 9(3), 249- 273.
Harun, A., Kassim, A. W. B. M., Igau, O. A., Tahajuddin, S., & Al-Swidi, A. K.
(2010). Managing local brands in facing challenges of globalization: Be a local or
global leader? European Journal of Social Sciences, 17(2), 254-265.
Hilman, H. (2009). The relationship of Competitive Strategy, Strategic Flexibility and Sourcing
Strategy on Organizational Performance. Doctoral Thesis, Uiniversiti Putra Malaysia, Malaysia.
Hosseini, S. R., & Zareebaf, M. (2011). An evaluation of effect on selected marketing
mix elements on brand equity with extended Aacker’s model on brand equity at
Agriculture Bank in Mazandaran Province. Paper presented at the The Second Asian Business
and Management Conference 2011, Japan.
Huang, R., & Sarigöllü, E. (2011). How brand awareness relates to market outcome,
brand equity, and the marketing mix. Journal of Business Research, 65(1), 92 – 99.
https://doi.org/10.1016/j.jbusres.2011.02.003
Iranzadeh, S., Norouzi, D., & heravi, S. B. (2012). Survey on the effects of
marketing communications on brand equity (case study). American Journal of
Scientific Research, 49, 82-90.
Keller, K. L. (1993). Conceptualizing, measuring, and managing customer-based
brand equity. Journal of Marketing, 57(1), 1-22. https://doi.org/10.2307/1252054
Keller, K. L. (1998). Strategic brand management: Building, measuring, and managing brand
equity. Upper Saddle River. NJ: Prentice Hall.
Keller, K. L. (2003). Strategic brand management: Building, measuring, and managing brand
equity. Upper Saddle River, NJ: Prentice-Hall.
Keller, K. L. (2008). Strategic branding management: building, measuring, and managing brand
equity. (3rd ed.). Upper Saddle River, NJ: Prentice Hall.
Kirmani, A. (1990). The effect of perceived advertising costs on brand perceptions. Journal of
Consumer Research, 17(2), 160-171. https://doi.org/10.1086/208546
103
Kotler, P., Armstrong, G., Saunders, J., & Wong, V. (2005). Principles of Marketing. London,
UK: Prentice Hall Europe.
Kwok, S. & Uncles, M. (2005). Sales promotion effectiveness: the impact of
consumer differences at an ethnic-group level. Journal of Product & Brand Management,
14(3), 170-186. https://doi.org/10.1108/10610420510601049
Krishnan, H. S. (1996). Characteristics of memory associations: a consumer-based brand equity
perspective. International Journal of Research in Marketing, 13(4), 389-405.
https://doi.org/10.1016/s0167-8116(96)00021-3
Lassar, W., Mittal, B., & Sharma, A. (1995). Measuring customer-based brand equity. Journal of
Consumer Marketing, 12(4), 11-19.
Li, H., Jin, H., & Yuan, G. (2011). Research on brand equity of sports—Take the replacement of
the brand lining as example. Journal of Sustainable Development, 4(1), 207-210.
https://doi.org/10.5539/jsd.v4n1p207
Mela, C. F., Gupta, S., & Jedidi, K. (1998). Assessing long-term promotional influences
on market structure. International Journal of Research in Marketing, 15, 89-107.
https://doi.org/10.1016/s0167-8116(97)00041-4
Mitchell, A. A. & Olson, J. C. (1981). Are Product Attribute Beliefs the Only Mediator
of Advertising Effects on Brand Attitude? Journal of Marketing Research, 18(3), 318-
332. https://doi.org/10.1353/asr.2000.0010
Montaner, T., de Chernatony, L., & Buil, I. (2011). Consumer response to gift
promotions. Journal of Product & Brand Management, 20(2), 101-110.
https://doi.org/10.1108/10610421111121099
Moradi, H., & Zarei, A. (2011). The impact of brand equity on purchase intention and
brand preference-the moderating effects of country of origin image. Australian Journal of Basic
& Applied Sciences, 5(3), 539-545.
Myers, C. (2003). Managing brand equity: a look at the impact of attributes. Journal of Product
& Brand Management, 12(1), 39-51. https://doi.org/10.1108/10610420310463126
Palazón-Vidal, M., & Delgado-Ballester, E. (2005). Sales promotions effects on consumer based
brand equity. International Journal of Market Research, 47(2), 179-204.
Raju, J. V. S., & Rajiv, L. (1990). The effects of brand loyalty on competitive price promotional
strategies. Journal of Management Sciences, 36(3). https://doi.org/10.1287/mnsc.36.3.276
Sedaghat, N., Sedaghat, M., & Moakher, A. K. (2012). The impact of promotional mix elements
on brand equity. American Journal of Scientific Research, 43, 5-15.

104
Shah, S. Z. A., & Akbar, S. (2008). Value relevance of advertising expenditure: A review of the
literature. International Journal of Management Reviews, 10(4), 301-325.
https://doi.org/10.1111/j.1468-2370.2007.00228.x
Schreuer, R. (1998). Putting a brand on the changing banking industry. Boston Business Journal,
18(24), 36.
Siddiqi, K. O. (2011). The drivers of customer loyalty to retail banks: An empirical study in
Bangladesh. Industrial Engineering Letters, 1(1), 40-55.
Smith, D. J., Gradojevic, N., & Irwin, W. S. (2007). An analysis of brand equity determinants:
Gross profit, advertising, research, and development. Journal of Business & Economics
Research, 5(11), 103 – 16.
https://doi.org/10.19030/jber.v5i11.2607
So, K. K. F., & King, C. (2010). When experience matters”: building and measuring hotel brand
equity: The customers’ perspective. International Journal of Contemporary
Hospitality Management Research News, 22(5), 589 – 608.
https://doi.org/10.1108/95961191080000538
Sriram, S., Balachander, S., & Kalwani, M. U. (2007). Monitoring the dynamics of brand equity
using store-level data. Journal of Marketing, 71, 61-78. https://doi.org/10.1509/jmkg.71.2.61
Tilley, C. (1999). Built-in branding: How to engineer a leadership brand. Journal of Marketing
Management, 15(1/3), 181-191. https://doi.org/10.1362/026725799784870405
Tolba, A. H., & Hassan, S. S. (2009). Linking customer-based brand equity with brand market
performance: A managerial approach. The Journal of Product and Brand Management, 18(5),
356-66.
https://doi.org/10.1108/10610420910981837
Valette-Florence, P., Guizani, H., & Merunka, D. (2011). The impact of brand personality and
sales promotions on brand equity. Journal of Business Research, 64, 24-28.
https://doi.org/10.1016/j.jbusres.2009.09.015
Yang, D. (2010). Building Brand Equity through Perfect Customer
Relationship Management. 3rd International Conference on Information Management,
Innovation Management and Industrial Engineering, China.
Yoo, B., Donthu, N. & Lee, S. (2000). An examination of selected marketing mix elements and
brand equity. Academy of Marketing Science, 28(2), 195-212.
https://doi.org/10.1177/0092070300282002
105
Electronics and Hard Disk Industry Competitive Advantage: Is Technology Capability the
Missing Kink?
Adisak Suebthamma Faculty of Administration and Management
King Mongkut’s Institute of Technology Ladkrabang (KMITL)
1 Chalong Krung, Thanon Chalong Krung, Lat Krabang
Bangkok 10520, Thailand
Thepparat Pimonsatian Faculty of Administration and Management
King Mongkut’s Institute of Technology Ladkrabang (KMITL)
1 Chalong Krung, Thanon Chalong Krung, Lat Krabang
Bangkok 10520, Thailand
Reference to this paper should be made as follows:
Adisak Suebthamma and Thepparat Pimonsatian
Suebthamma, A., & Pimonsatian, T. (2017). Electronics and hard disk industry competitive
advantage: Is technology capability the missing link? Asian International Journal of Social
Sciences, 17(2), 104 – 122. https://doi.org/10.29139/aijss.20170205
All works licensed under a Creative Commons Attribution-Non Commercial-No Derivatives 4.0 International License.
The Asian International Journal of Social Sciences (AIJSS) allows the author(s) to hold the copyright without restrictions.
The Asian International Journal of Social Sciences (AIJSS) allows the author(s) to retain publishing rights without restrictions.

106
Abstract: In 2014 Thailand’s overall trade in the electronics industry was worth approximately
US$59.5 billion currently employing over 600,000 people in the sector. At the end of 2015,
Thailand joined a 10-nation economic community with 625 million and a $2.5 economy with a
projected growth of six percent per year over the next decade. This study, therefore, presents a
conceptual framework about the structure of the factors including technology capability and new
product development that affect the competitive advantage of manufacturing enterprises in the
electronics components and hard disk drive industries. Quantitative data is being obtained from a
proposed sample of 220 production control and operations managers, including executive
directors, managers and department heads that have had a minimum of five years of experience.
Qualitative research is being conducted with 10 executives by the use of purposive sampling.
The analysis will be conducted using Partial Least Square (PLS-Graph) software to apply
Structural Equation Modeling (SEM).
Keywords: AEC, ASEAN, new product development, SEM

107
Introduction
According to Thailand’s Board of Investment (BOI, 2015), Thailand’s electronics
industry is a core element of the Thai manufacturing sector’s success and in 2014, Thailand’s
overall trade in the electronics industry was worth approximately US$59.5 billion, with export
revenues accounting for over US$32 billion. The electrical and electronics industry has not
merely played an important role in Thailand’s economy as a main growth driver, but has also
made Thailand Southeast Asia’s electrical and electronics manufacturing hub.
Figure 1. Thailand’s electronics exports and imports 2010-2014
In 2014, Thailand’s main electronics exports (Figure 1) were computer components and
integrated circuits (IC), which accounted for approximately 56% and 24% of total electronics
exports respectively. Having two of the global data storage manufacturers, Western Digital and
Seagate, has made Thailand the second largest data storage product producer and exporter in the
world. At the same time, Thailand holds an equally renowned reputation in the IC and
semiconductor sectors due to Thailand being one of the main manufacturing bases for these
products in the ASEAN (Association of Southeast Asian Nation) region with exports reaching
US$32 billion in 2014 (BOI, 2015).
Having long been a cornerstone for an automatic data processing (ADP) machine
industry, Thailand is one of the largest global producers and exporters of automatic data
processing machines. In 2014, Thailand’s exports totaled US$12 billion and grew by 7% from
2011. The competitiveness of Thailand’s HDD industry is based on its world class industrial
clusters containing supporting industries that manufacture most of the components utilized in the

108
assembly of HDDs. Technological innovations in the consumer and enterprise sectors have
produced next generation of HDD and newer data storage techniques such as Solid-State Drives
(SSD) and Solid State Hybrid Drives (SSHD).
HDD production in Thailand began in around 1983 after Seagate Technology shifted its
head-stack assembly (HSA), the most labor-intensive segment in the HDD production process,
out of Singapore (TIR, 2015). It was relatively low-wage labor as well as a favorable investment
climate in the Kingdom that enticed HDD makers. Back then, the imported content of HSA
exports was close to 80%. Despite the presence of high tariffs, HDD manufacturers were eligible
for exemption schemes as their products were principally for export.
In 2013, Thailand’s main electronics exports were hard disk drives (HDD) and integrated
circuits (IC), which accounted for approximately US$11.79 billion and US$7.42 billion worth of
total electronics exports, respectively (TIR, 2015). Major HDD producers –Western Digital,
Seagate, Hitachi and Toshiba – have production facilities in Thailand. Similarly, the country is
recognized as a leader in the IC and semiconductor industries, and boasts one of the largest
concentrations of assembly plants in Southeast Asia for these products.
The primary markets for these exports were the USA (19.5%), Hong Kong (19.3%),
ASEAN (14.3%), China (10.8%) and Japan (7%) as seen in Figure 2 below. Increasing demand
for electronics saw imports rise to US$27 billion with mainly printed circuits and IC being
imported to supply Thailand’s increasingly advanced electronics manufacturing ecosystem.
Figure 2 Thailand’s major electronics export markets 2014

109
Furthermore, Techanuvat and Tantisunthorn (2015) reported that Thai exports of
electronic circuits expanded significantly by 20%YOY in April 2015 after a 10% drop the
previous month. The growth was propelled by exports to Hong Kong and the U.S. that grew by
37.7% YOY and 24.4% YOY. In addition, exports of electronic circuits to China rose by 60%
YOY in April. Auto and parts exports grew by 9%YOY in April after a 5% rise in March.
Particularly, auto exports to Australia, one of Thailand’s key markets, leaped by 71.8%YOY.
Similarly, auto exports to markets such as CLMV and EU maintained the high growth levels of
30.6%YOY and 74.1%YOY in the first four months of 2015.
Currently, over 600,000 people are employed in Thailand’s electrical and electronics
sector and with entry into the AEC (ASEAN Economic Community) at the end of 2015;
Thailand entered a 625 million, $2.5 trillion economic community projected to grow 6 percent
per annum over the next decade (Menon, 2016). The AEC will expand export opportunities for
electrical & electronics manufacturers located in Thailand with manufacturers benefiting from
manufacturing clusters, government research programs, and incentives devoted to the electrical
& electronics industry.
Thailand’s government, recognizing the crucial role the electrical and electronics industry
will continue to play in Thailand’s economic development, offers attractive investment
incentives to attract major global players in the electrical and electronics industry. Some
unfortunately do not see such a rosy picture as others might suggest.
According to the SCB (Siam Commercial Bank) Economic Intelligence Center analyst
Amornvivat (2014), the inconvenient truth is that Thailand has reached the tail end of growth in
several of Thailand's major tech-related exports; e.g., computer hard disk drives. Foreign direct
investment is only a short-term solution, notwithstanding. Thai businesses indeed must invest
more in research and development for a more sustainable growth path. At present, Thai
companies rank low in R&D investment levels with spending on R&D at just 0.3% of GDP,
much lower than those in China and Malaysia.
Also, to ensure a sustainable path, innovations must not be limited to large companies.
Encouraging innovations among our SMEs is crucial to uplift the growth potential. The
government has to equip them with knowledge and access. One way to facilitate this is to
establish testing facilities for SMEs to improve their products. Domestic testing center that is up

110
to par with international standard will reduce test time sending sample products overseas for
testing, facilitating innovation and increasing our value added (Amornvivat, 2014).
As Thailand surges up the ladder of economic development, the country naturally has
moved away from an over-reliance upon labor-intensive industries to a more tech-savvy,
knowledge-based economy. To further support this move towards a high value-added economy,
the government has prioritized the development and promotion of science, research and
development, technology and innovation and has stated its intention to increase R&D
expenditures to 1% of total GDP (TIR, 2015).
The commercial production and marketing of electronic and industrial components and
hard disk drives is causing dramatic changes to the competitive environment of the industry. A
case in point is Seagate Technologies which opened its operations in Thailand in 1983 having to
date invested more than US$2.5 billion in capital now having two manufacturing facilities with
over 16,000 employees (TIR, 2015). It is the largest hard drive facility in the world and produces
slider, head gimbal assembly (HGA), head stack assembly (HSA), and drive assembly and
conducts R&D.
According to Seagate Technology, data storage will continue to expand at 26% per year
through 2020, when the data storage market is expected to be three or four times its current size
and about 60% of it will be in the cloud. More big data is to come as demand keeps increasing
from governments and the private sector, especially manufacturing, retail, media, banking, real
estate and science with Asia being the largest revenue source for the industry.
In the above short discussion of Thailand’s electronics and hard disk drive manufacturing
sector we have seen an industry to soar to new highs which momentarily seems to be on the
precipice of change. From all directions we hear government leaders and corporate CEOs bang
the drum for the development of R&D and testing facilities that are up to international standards
along with higher investment in innovation to increase Thailand’s competitive advantage.
With the tighter integration of the AEC at the end of 2015, many regulations, laws, tariffs
and the ability for the movement of workers changed. As yet, this change is small as
bureaucracies move slowly. Companies however must be quick to change or their very survival
often times becomes critical. Production, trade, marketing and investment are also other
components in the equation of having a competitive advantage.

111
The researchers therefore have decided to undertake a study how competitive advantage
is affected by new product development and technology capability.
Literature Review
Technology Capability
There are many interpretations of what technology capabilities consist of but according to
the German Development Institute (GDI, 1994) it is stated that adequately developed
technological capability that is essential is the knowledge of the technologies available, the
ability to evaluate and select such technologies, to utilize, adapt, improve, and, finally, to further
develop them.
This is consistent with Meyer-Stamer (GDI, 1994) which describes the Four Pillars of
Technological Capability (embraced by the GDI) as the capacity to gain an overview of the
technological components on the market, assess their value, select which specific technology is
needed, use it, adapt and improve it and finally develop technologies oneself.
Technological capabilities can also vary between sectors (Eckaus, 1991; Zahlan, 1990).
In the industrial sector, the elements of technology capability - production engineering,
manufacture of capital goods, and research and development, etc. - are different from those
essential for the services sector.
Huang (2011) investigated technology competencies and stated it plays a significant role
in firm innovation and competitiveness. Research from Taiwan's information and communication
technology (ICT) industry suggested that capabilities of exploring or exploiting technological
opportunities, core technology capability, and autonomy of R&D decisions are particularly
important to firm innovation in a highly competitive environment.
Rasiah (2004) discusses the importance of foreign firms in technological capability
building and economic performance in developing countries. Research reveals that although
foreign firms tend to enjoy higher human resource and process technology capabilities in the
most underdeveloped economies, in the more advanced nations this comparative advantage is
significantly eroded. Institutional and systemic strength of a country can help to explain the level
of participation of foreign firms in R&D activities. Also, domestic and regional markets,
infrastructure, incentives, natural resources and human capital are important factors in
stimulating significant R&D investment by foreign firms.

112
According to the study’s research and examination of the literature, it was determined
that there were 4 key manifest variants or observable variables related to competitive advantage.
Scholars have studied these manifest variants or observable variables effects on technology
capability from which the researchers have synthesized the research to include automation
production, production technology, design technology and technology development in this study
(GDI, 1994; Eckaus, 1991; Zahlan, 1990; Huang, 2011; Rasiah, 2004.(
New Product Development
Feng and Wang (2013) investigated the impacts of three types of supply chain
involvement (SCI) on three types of new product development (NPD) performance from 214
Chinese manufacturing companies. It was discovered that internal involvement is positively
associated with customer and supplier involvement. It was also found that three types of SCI
influence three types of NPD performance differently. Specifically, internal involvement is
important in improving NPD speed, while customer and supplier involvement have significant
effects on NPD cost and NPD speed. Moreover, internal and customer involvement enhance
market performance indirectly, whereas supplier involvement improves market performance both
directly and indirectly.
Trainor, Krush, & Agnihotri (2013) examined how a firm's behavioral tendencies, along
with its existing business resources, contribute to the formation of new product development
(NPD) capability using survey data from more than 150 US-based firms. Findings suggested that
a firm's competency in marketing intelligence and its tendency to engage in partner-style
relationships have both direct and interactive effects on NPD capability. This capability is further
shown to positively relate to organizational performance, and this relationship is moderated by
technological uncertainty.
Tan (2001) analyzed the effects of supplier assessment, Just-In-Time, and quality
management strategies on new product design and development from a survey of senior
managers who are members of the American Production and Inventory Control Society in the
United States. Results showed that supplier assessment and Just-In-Time strategies were
correlated and affected the quality management strategy used, which in turn influenced the new
product design and development strategy. The data also showed that the Just-In-Time strategy
directly influenced the new product design and development strategy.

113
Mikkola (2006) discussed the implications of platform management for new product
development and sourcing strategies using a Danish hearing aid manufacturer as a case study.
Analysis revealed the risk of single sourcing and raised the question, how buyers without
leverage can become an interesting customer for large suppliers?
Lai, Chen, & Yang (2012) examined the effects of supply chain and third party
involvement on product innovation performance on 208 Taiwanese firms. The concept of supply
chain network was studied as the type of external member collaboration for firm new product
development. The results indicated that external member involvement had a positive impact on
product innovation performance.
According to the study’s research and examination of the literature, it was determined
that there were 3 key manifest variants or observable variables related to competitive advantage.
Scholars have studied these manifest variants or observable variables effects on New Product
Development from which the researchers have synthesized the research to include time to market,
engineering change request, and development cost in this study (Trainor, Krush, & Agnihotri,
2013; Feng & Wang, 2013; Lai, C-S., Chen, C-S., & Yang, C-F., 2012; Tan, 2001; Mikkola,
2006; Mikkola & Skjøtt-Larsen, 2006).
Competitive Advantage
Porter (2001) identified two basic types of competitive advantages consisting of cost
advantage and differentiation advantage. A competitive advantage exists when the firm is able to
deliver the same benefits as competitors but at a lower cost (cost advantage) or deliver benefits
that exceed those of competing products (differentiation advantage). Thus, a competitive
advantage enables the firm to create superior value for its customers and superior profits for
itself.
Awwad, Al Khattab and Anchor (2013) stated that competitive priorities included
quality, cost, flexibility and delivery. In the research, the results of the data analysis indicated a
significant relationship between competitive priorities and competitive advantage and suggested
that recognizing and nurturing this relationship provides the master key for a firm to survive in a
turbulent environment. Therefore, operational and marketing strategies should place emphasis on
competitive priorities such as quality, cost, flexibility and delivery to achieve, develop and
maintain competitive advantage.

114
Chang (2011), focused research on the relationships between corporate environmental
ethics and competitive advantage, and concluded that companies should invest more resources to
enhance their environmental ethics. By so doing, this will help to improve their competitive
advantage as well as driving green innovations.
This is consistent with Chen (2008) which showed that three types of green intellectual
capital – green human capital, green structural capital, and green relational capital – had positive
effects on competitive advantages of firms. Moreover, this study found that green relational
capital was the most common among these three types of green intellectual capital, and the three
types of green intellectual capital of Medium & Small Enterprises (SMEs) were all significantly
less than those of large enterprises in the information and electronics industry in Taiwan. In sum,
companies investing many resources and efforts in green intellectual capital could not only meet
the trends of strict international environmental regulations and popular environmental
consciousness of consumers, but also eventually obtain corporate competitive advantages.
Peng, Schroeder, & Shah (2011) examined the strategic contingency of plant
improvement capability and innovation capability from 238 manufacturing plants and found that
improvement capability and innovation capability are associated with different competitive
priorities and also have varying impact on different operational performance dimensions.
Ong, Ismail, Guan, & Goh, 2010 collected 356 survey results from Malaysian SMEs
(small and medium-sized enterprises). Analysis suggested that flexibility in operations and
adaptability to changes afford SMEs with a greater possibility to gain from unexpected changes
and accidental discoveries. Furthermore, both entrepreneurship and luck play a significant role in
influencing the competitive advantage of SMEs. Therefore, SMEs are encouraged to cultivate a
flexible and adaptive organizational structure in order for it to benefit from both endogenous and
exogenous luck.
According to the study’s research and examination of the literature, it was determined
that there were 4 key manifest variants or observable variables related to competitive advantage.
Scholars have studied these manifest variants or observable variables effects on competitive
advantage from which the researchers have synthesized the research to include cost, quality,
delivery, and flexibility in this study (Porter, 2001Awwad, Al Khattab, & Anchor, 2013; Chang,
2011; Peng, Schroeder, & Rachna, 2011; Chen, 2008; Ong, Ismail, Guan, & Goh, 2010).

115
Proposed Conceptual Framework
Proposed Research Hypotheses (Figure 3)
H 1 : Technology Capability has a direct influence on Competitive Advantage
H 2 : Technology Capability has a direct influence New Product Development
H 3 : New Product Development has a direct influence Competitive Advantage
Figure 3. Proposed conceptual model
Methodology
This research aims to study the structure of the factors influence the competitive
advantage of enterprises in Thailand’s electronics and hard-disk components industry.
Therefore, researchers have determined the following detailed steps of how to carry out the
proposed research.
The approach used in the study
For this study the researchers used both quantitative and qualitative research from both
primary and secondary data. The researchers thus determined the following steps for this study:
Study of Secondary Data
The researchers are reviewing the literature related to the electronics and hard-disk
components industry. Thus far, research has been comprised of published research, textbooks,
internet materials, media reports, and data which have been synthesized from the secondary data

116
to develop a conceptual model for the variables that influence the competitive advantage of
Thailand’s electronics and hard disk drive components industry
Quantitative Research Methods
Quantitative research will be performed using the primary data by collecting a
questionnaire from the target sample. The questionnaire to be used to collect data is structured
and written in a realistic, easy-to-understand format which is deemed to be reliable and
reasonable. Further measurement and reliability validation will be undertaken as follows:
1. Questionnaire review will be conducted by academic scholars to validate the
investigation questions and the use of rhetoric and the simplicity and comprehension of the
questions.
2. During the questionnaire trial stage, questions and responses will be monitored so
better clarity can be achieved. Questions will be updated as needed.
3. Perform data collection and statistical analysis
Qualitative Research Methods
Qualitative research will involve confirming the model of the quantitative research. It is a
collection of interviews with individuals who have been involved in the electronics and hard disk
components industry, including executive directors, managers and department heads that have
had a minimum of five years of experience.
Sample
The sample used in this study was CEOs, executive directors, and managers responsible
for the performance of their respective manufacturing enterprises in the electronics and hard-disk
components industry in Thailand.
The sample size
Schumacker and Lomax (2010) stated that Structural Equation Modeling (SEM) uses a
variety of models to show the relationships between observed variables with the same basic goal
of providing a quantitative test of a theoretical model hypothesized by a researcher with
Meldrum (2010) further stating that a sample size smaller than 100 should not be used in SEM as
it is unreliable. Therefore, using a factor of 20 for each of the 11 variables from the research

117
survey, it is anticipated that a total of 220 samples are adequate to assure a reliable sample size
(Schumacker & Lomax, 2010).
To confirm the model of quantitative research, 10 in-depth interviews with those
involved in innovation, production control and operations, including executive directors,
managers and department heads that have had a minimum of five years of experience to confirm
the quantitative research.
Tools used in the research
For this research, the measurement instrument or questionnaires utilized was prepared
from the literature. A self-administered questionnaire (SAQ) is being used as it is exploratory in
nature and serves as a starting point for other methodologies.
Quality inspection tools used in the research
Researchers will continue to monitor the quality of the instruments used in the research to
be used as a measurement of quality. The entire content validity and reliability is divided into
two stages.
1. The questionnaire will be created by the research team, and be peer-reviewed and
tested by use of the content validity of item objective congruence index (IOC) by
five experts in their respective fields. The IOC for each item is the summation of
scores given by the experts divided by the number of experts. This ensures the
quality of the questionnaire with any IOC score less than 0.05 being eliminated.
2. Checked by five experts in their fields including:
Management Engineering 1 individual
Production and Cost Control Management 2 individuals
Academic Management Scholars 2 individuals

118
Data Collection
Primary data is a collection of factors that influence Thailand’s electronics and hard-disk
components industry enterprises.
Secondary data
Secondary Data consists of studying the theories related to the research from various
sources; including books, manuals, tutorials, articles, research papers, etc., which will be used to
define the concepts and theories used in the study.
Data analysis and statistics used
Quantitative data analysis research will be conducted using statistical analysis as follows:
Descriptive statistics including frequency, percentages, means, and standard deviations will be
used to demonstrate the profiles as well as rating scores and response rate.
An analysis will be conducted using structural equation modeling (SEM) to determine the
relationship of the factors influencing the competitive advantage of Thailand’s electronics and
hard-disk components industry enterprises.
Qualitative data analysis
To confirm the results of the quantitative analysis are credible and the findings reliable,
the researchers will conduct interviews with those involved in product innovation such as
executive directors, managers and department heads in manufacturing or operations that have
had a minimum of five years of experience.
Afterwards, the researchers will proceed to interpret qualitative information, including
classified information. According to Hancock, Windridge, and Ockleford (2007) data collection
and analysis should proceed concurrently: in theory, data analysis should occur at the same time
as data collection to allow researchers to refine the research question and data collection
procedures in the light of new findings, but in reality, this is hard to achieve (e.g. because
transcribing recorded interviews takes time, and analysis takes even more time). However it is
important to review transcripts as they are transcribed and to undertake informal modification of
prompt guides.
The idea that qualitative data is mainly ‘unstructured’ is useful, if this is taken not as a
definition but rather as an imperative for analysis. Although unstructured data may not be
119
classified, it can be classified and indeed one of the main aims of qualitative analysis is often to
do just that (Dey, 1993).
Conclusion
From a review of the literature, it was established that if engineering changes are
underestimated, the impact on the project budget or time-to-market can be severe with even a
relatively modest time delay greatly compromising the profit margins for large projects as well
as a firm’s competitive advantage (Eger, Eckert, & Clarkson, 2007).
As was seen in the discussion on Seagate Technology’s investment in Thailand and its
subsequent global leadership, competitive advantages for multinational firms comes from not
relying only on wage levels and land resources but instead incentives from the country in which
it is based, with the key to achieving this being the forming of industrial clusters (Amano, 2005).
Electronic components and hard disk drives manufacturers can achieve a competitive
advantage by developing new products focusing on their time to market, engineering changes
and development costs. Additionally, new product development results from strategic
development, management efficiency and competitiveness which can lead to a competitive
advantage. Technological capabilities consist of automated production, manufacturing
technology, and design and technology development. These factors are the most immediate
causes to competitiveness and contribute to the development of new products, which are
intermediate variables that affect competitiveness as well.

120
References
Amano, T. (2005). East Asian linkage and Japanese firms: A new perspective of corporate
growth. Tokyo: Yuhikaku.
Amornvivat, S. (2014, October 22). Devising strategies for Thailand’s lasting growth. SCB
(Siam Commercial Bank) Economic Intelligence Center. Retrieved
from http://tinyurl.com/hev6ttn
Awwad, A.S., Al Khattab, A.A., & Anchor, J.R. (2013). Competitive priorities and competitive
advantage in Jordanian manufacturing.Journal of Service Science and Management, 6, 69-79
Retrieved from http://tinyurl.com/gr29o8v
BOI (2015). Thailand electrical and electronics industry. Thailand Board of
Investment. Retrieved from http://tinyurl.com/zu2445m
Chang, C-H. (2011). The influence of corporate environmental ethics on competitive advantage:
The mediation role of green innovation. Journal of Business Ethics, 104, 361-370. Retrieved
from http://tinyurl.com/hhov5xn
Chen, Y-S. (2008). The positive effect of green intellectual capital on competitive advantages of
firms. Journal of Business Ethics, 77,271-286. https://doi.org/10.1007/s10551-006-9349-1
Dey, I. (1993). Qualitative data analysis A user-friendly guide for social
scientists. London: Routledge. Retrieved from http://tinyurl.com/gsrjhes
Eckaus, R. S. (1991). The creation of technology capability in developing countries. London:
Frances Pinter.

121
Eger, T., Eckert, C. M., & Clarkson, P. J. (2007). Engineering change analysis during ongoing
product development. International Conference on Engineering Design, ICED’07, Paris, France.
Retrieved from http://tinyurl.com/zxaawwf
Feng, T., & Wang, D. (2013). Supply chain involvement for better product development
performance. Industrial Management & Data Systems, 113(2), 190-
206. https://doi.org/10.1108/02635571311303532
GDI (1994). Strengthening technological capability in developing countries-Lessons
from German technical cooperation. German Development Institute. Retrieved
from http://tinyurl.com/h8cpb48
Hancock B., Windridge K., & Ockleford, E. (2007). An introduction to qualitative research.
Retrieved from http://tinyurl.com/hj32z8z
Huang, K. F. (2011). Technology competencies in competitive environment. Journal of Business
Research, 64. 172-179. https://doi.org/10.1016/j.jbusres.2010.02.003
Lai, C-S., Chen, C-S., & Yang, C-F. (2012). The involvement of supply chain partners in new
product development: The role of a third party. International Journal of Electronic Business
Management, 10(4), 261-273.
Meldrum, K. (2010). Structural equation modeling: Tips for getting started with your
research. Contemporary Approaches to Research in Mathematics, Science, Health and
Environmental Education, 1-5. Retrieved from http://tinyurl.com/hxxoslr
Menon, N. (2016, January 5). ASEAN’S AEC must remove hurdles, boost use of digital to fuel
growth. CNBC. Retrieved fromhttp://tinyurl.com/jhpvnbn

122
Mikkola, J. H., & Skjøtt-Larsen, T. (2006). Platform management Implication for new product
development and supply chain management. European Business Review, 18(3), 214-230.
Ong, J. W., Ismail, H. B., Guan, G., & Goh, G. (2010). The competitive advantage of small and
medium enterprises (SMEs): The role of entrepreneurship and luck. Journal of Small Business
and Entrepreneurship, 23(3), 373-391. https://doi.org/10.1080/08276331.2010.10593491
Peng, D. X., Schroeder, R. G., & Shah, R. (2011). Competitive priorities, plant improvement and
innovation capabilities, and operational performance A test of two forms of fit. International
Journal of Operations & Production Management, 31(5), 484-
510. http://dx.doi.org/10.1108/01443571111126292
Porter, M. E. (2001). Strategy and the Internet. Harvard Business Review, March, 1-21.
Retrieved from http://tinyurl.com/znjhje7
Rasiah, R. (2004). Foreign firms, technological capabilities and economic
performance: Evidence from Africa, Asia and Latin America. Edward Elgar Publishing.
Schumacker, R. E. & Lomax, R. G. (2010). A beginners guide to structural equation Modeling.
New York: Routledge. Retrieved from http://tinyurl.com/z2sdwtr
Tan, K.C. (2001). A structural equation model of new product design and development. Decision
Sciences, 32(2), 195-226. https://doi.org/10.1111/j.1540-5915.2001.tb00958.x
Techanuvat, C., & Tantisunthorn, V. (2015, May 26). Thai exports in April contracted by
1.7% YOY, while imports shrank by 6.8%YOY. SCB Economic Indigence Center. Retrieved
from http://tinyurl.com/jaledmz
TIR (2015, February). Tech-Savy Thailand. Thailand Investment Review. Retrieved
from http://tinyurl.com/htjk59z

123
Trainor, K. J., Krush, M. T., & Agnihotri, R. (2013). Effects of relational proclivity and
marketing intelligence on new product development. Marketing Intelligence & Planning, 31(7),
788-806.
https://doi.org/10.1108/mip-02-2013-0028
Zahlan, A.B. (1990). Acquiring technological capacity: A study of Arab contracting
and consulting firm. London: Macmillan.

124
Decentralization and Public Expenditure: Does Special Local Autonomy
Affect Regional Economic Growth?
Martapina Anggai Cenderawasih University, Indonesia
Ari Warokka State University of Jakarta, Indonesia
Email: [email protected]
Reference to this paper should be made as follows:
Martapina Anggai and Ari Warokka
Anggai, M. & Warokka, A. (2017). Decentralization and public expenditure: Does special local
autonomy affect regional economic growth? Asian International Journal of Social Sciences,
17(2), 123–138. https://doi.org/10.29139/aijss.20170206
All works licensed under a Creative Commons Attribution-Non Commercial-No Derivatives 4.0 International License.
The Asian International Journal of Social Sciences (AIJSS) allows the author(s) to hold the copyright without restrictions.
The Asian International Journal of Social Sciences (AIJSS) allows the author(s) to retain publishing rights without restrictions.
Abstract: This study examines the relationship between public expenditure within regional
autonomy policy and economic growth in West Papua and Papua provinces. We distinguish two
kinds of expenditure's decentralization – operational and capital – and also private expenditures.
We use an unbalanced panel data over the period of 2007-2010 to investigate those
expenditures, whether they enhance regional economic growth or not. We find that the
government's operating and private expenditures have a positive effect on local economic
growth, but there is no relationship between capital expenditure's decentralization on
economic growth. The findings did not conform to a-priori efficiency expectations, which
suggest needing to reform regional autonomy and fiscal decentralization policy in both
provinces.

125
Keywords: economic growth, efficiency, operating and capital expenditures, regional autonomy,

126
Introduction
It refers to Law No. 21/2001, which is then revised by the Presidential Decree No.
1/2008, there are local governments labeled special autonomy regions, i.e. Nangroe Aceh
Darussalam, Papua, and West Papua provinces. In this circumstance, they receive a
substantial amount of the fund from central government, including General-Purpose Grant,
Specific Purpose Grant, and tax/non tax sharing revenues. However, unlike other provinces,
the three regions also earn Special Autonomy Fund. Given the large amount of fund and
allocation discretionary, this brought about the need to examine and determine the effect of
budgetary allocations by sector on the regional economy to generate the much-needed
information critical in decision making and prioritizing expenditure.
The impact of public expenditures on economic growth has been the intense research and
heated debate. The existing studies on the linkages between public expenditure and economic
growth showed conflicting results. For instance, according to Ram (1986) and Romer (1989,
1990a, 1990b), there was a significant and positive relationship between public expenditure
and economic growth. In contrast, Landau (1983, 1985), Grier and Tullock (1989), Alexander
(1990), Barro (1990, 1991) found a significant but negative relationship. Kormendi and
Meguire (1985), Levine & Renelt (1992) found the association between public expenditure
and economic growth to be insignificant.
These conflicting findings highlighted the importance of more research to identify the
linkage between the composition of public expenditure and economic growth for developing
countries, including Indonesia. The purpose of this paper is to shed light on the relationship
between the composition of public expenditure and economic growth. As suggested by Bose,

127
Haque, and Osborn (2007), to get further insights into the linkages between fiscal policies
and economic growth, we identify the elements of public expenditure.
This paper is closely related to the previous studies, and it contributes to the literature, at
least, in two ways. First, we estimate the regional public expenditure in relation to economic
growth in the case of a special autonomy region which has its own uniqueness. Second, we
combine the local public expenditures and private expenditure approaches. We hope that the
combination of the two approaches can offer wider perspective.
Literature Review
Keynes (1964) advocated for government spending to create jobs and employ capital that
has been unemployed or underutilized when an economy is in a downturn with high
unemployment of labor and capital. Keynes’s theory postulates that government spending is
needed to increase economic output and promote growth.
The explicit intension of public expenditures in relation to economic growth was initiated
by Barro (1990). Previously, the Solow growth model (1956) considered that public expenditure
was only related to the equilibrium factor ratios and it was assumed that public investment
was not related to long run economic growth. The endogenous growth model (Romer, 1990)
argues that the significant relationship between long run economic growth and public
expenditure rests on the inclusion of fiscal policies into the endogenous growth model with
the conclusion that public spending can affect the long run economic growth (Barro and Salai-
Martin, 1992).
Much of the empirical literature on fiscal policy and long-run growth has focused on
taxes rather than public expenditures, and suffers from various methodological weaknesses
(Temple, 1999). In particular, it is now recognized that tests of the growth effect of public

128
expenditure decompositions (and other fiscal variables) must accommodate the total government
budget (expenditures, revenues, deficits); a feature missing from much of the earlier literature
(Bleaney, Gemmell, & Kneller, 2001).
Regarding to the composition of public expenditure, Devarajan, Swaroop, and Zou
(1996) observed economic growth in 140 OECD countries. They show that an increase in the
share of current expenditure has positive and statistically significant growth effects. By contrast,
the relationship between the capital component of public expenditure and per-capita growth is
negative. Thus, seemingly productive expenditures, when used in excess, could become
unproductive.
Colombier (2011) estimates the growth effects of the composition of public expenditure
for the Swiss case. One main finding is that public expenditures on transport infrastructure,
education, and administration foster growth. These results imply that developing-country
governments have been mis-allocating public expenditures in favor of capital expenditures at
the expense of current expenditures.
In the context of developing countries, Sennoga and Matovu (2010) utilize a dynamic
Computable General Equilibrium model to study these interrelationships. Their paper
demonstrates that public spending composition does indeed influence economic growth and
poverty reduction in Uganda. In particular, this study shows that improved public sector
efficiency coupled with re-allocation of public expenditure away from the unproductive
sectors such as public administration and security to the productive sectors, including
agriculture, energy, water, and health leads to higher GDP growth rates and accelerates
poverty reduction.

129
Olabisi and Oloni (2012) explore the relationship between the composition of public
expenditure and economic growth in Nigeria. Government expenditure is expected to be
means of reducing the negative impacts of market failure of the economy. However,
allocations of public expenditure with lack of consideration for the urgent needs of the
country may engender greater distortion in the economy which may be detrimental to growth.
They have analyzed the relationship between public expenditure compositions on economic
growth using the vector auto-regressive models. The finding shows that expenditure on
education has failed to enhance economic growth due to the high rate of rent seeking in the
country as well as the growing rate of unemployment.
Mudagi and Masaviru (2012) investigated the impact of public spending on education,
health, economic affairs, defense, agriculture, transport and communication on economic growth
in Kenya. The findings showed that expenditure on education was a highly significant
determinant of economic growth while expenditure on economic affairs, transport and
communication were also significant albeit weakly. In contrast, expenditure on agriculture
was found to have a significant though a negative impact on economic growth. Outlays on
health and defense were all found to be insignificant determinants of economic growth.
In light of these findings, Barro and Sala-i-Martin (1992) cautioned that government
expenditure may be productive or unproductive. It seems that consumption government
expenditures tend to have a negative impact on economic growth in advanced countries but
have a positive impact in developing countries. Similarly, the productive government
expenditures in developed countries may be productive in developing countries.
130
Methodology
Those studies suggest that the root of the problem of the impact of public expenditures on
economic growth is the efficiency of the corresponding expenditures. To test the efficiency of
expenditures, especially local public expenditure, we adopt the conventional Cobb-Douglas
production function and applied at the regency/municipality level in Papua and West Papua
Indonesia.
Based on the literature review in the previous section, the regional income (Y) is assumed
to be dependent on government expenditures (GE) and private expenditures (PE):
Y = f (GE, PE)
The government expenditures can be divided into 2 broad
categories, i.e. capital expenditures
(CE, typically investment expenditures) and operating
expenditures (OE, representing
consumption expenditures):
GE {CE, OE} (2)
Private expenditure is total expenditure minus total government expenditure:
PE = Y – GE (3)
To avoid perfect co-linearity among variables above, we specified PE in relative term to GE
(PE/GE).
This study has been made on the basis of panel data models to investigate the
contribution of public and private expenditures performance on local economic growth. In order
to overcome this problem, this study uses log linear specification and the model can be written as
follows:
Log Yit = α + β1 Log CEit + β2 Log OEit + β3 (PE/GE)it + eit (4)
Subscripts i denotes regency/municipality, t is time, and e = random disturbance terms.
The neoclassical production theory predicts that an increase in capital expenditure will raise
regional income so we expect β1 is positive. The estimated value of β2 could be positive or

131
negative. When the private expenditure rises, the local income tends to increase. We predict
β3 is positive.
The traditional microeconomic theory proposed that the local government expenditure is
treated similarly to the private expenditure and the local public expenditure is examined
under the assumption that local government faces linear budget constraints to supply public
goods/services. Given that, we can test some restrictions imposed into equation (4):
1 = 2;
i.e. public expenditures have equal impact on economic growth (5)
1 = 2 =1
i.e. public expenditures have an allocative efficiency (6)
[1 = 2] + 3 = 1,
i.e. constant return to scale – Public and private expenditures have equal impact
on economic growth (7)
The test is done using both analysis of variance (F-test) and chi-square (2-test) tests for
each parameter restriction imposed (see for example: Gujarati, 2004).
This study utilizes regencies/municipalities data of Papua and West Papua provinces
throughout a period of 2007 until 2010 with a total of 29 and 11 regencies/municipalities
respectively. Due to the altered number of regions in both provinces during the study period,
the samples utilized in this study are the regions that meet the following criteria: (a) the
availability of Local Budget Realization Report data; (b) regencies/municipalities that already
exist and not experiencing changes (division, unification); and (c) the associated regencies/
municipalities have the complete required data.

132
Referring to those above criteria, there were only 87 sample-points
regencies/municipalities exerted as a sample in this study. All the data are taken from Local
Budget Realization Report data published by General Directorate of Fiscal Balance, Ministry of
Treasury website (http://www.djpk.depkeu.go.id/). Other data come from Central Board of
Statistics (http://www.bps.go.id). This study employs regression analysis, i.e. multiple regression
analysis and applied for unbalanced panel data by assuming all requirements in regression
analysis are satisfied.
The variables used here are specified as follows. The regional income is the summation
of final products measured in 2000 constant prices (million Rupiah). The capital expenditure
follows the sectoral/functional budgetary realizations. The operating expenditures cover
realizations of wage/salary, goods/services purchases, maintenance, etc. (in million Rupiahs).
Those expenditures are then converted into a real term by dividing by GDP deflator (2000 =
1).
Results and discussion
Table 1 delivers the descriptive statistics of all variables under study covering mean,
extreme, standard deviation, and also kurtosis values covering all regions. Statistically, a variable
is said to be volatile if its CV (coefficient of variation, the ratio of standard deviation to mean)
is more than 50 percent. Based on the empirical rule, the regional income is the most volatile
indicated by the highest CV (312.15 percent) which more than 54 trillion contributed by
Mimika regency.
The variability of capital expenditure is also relatively high closes to 46 percent. The total
public expenditure is the least diverse revealed by the lowest CV (36.25 percent). This raises
preliminary hypothesis that capital expenditures and private expenditures support to regional
133
economic growth. We will check it more deeply later using econometric tools.
All of variables of interest are asymmetrically distributed (bell-shaped) indicated by the high
value of skewness, especially Y. Intuitively, the null hypotheses state that the series data is
normally distributed can be rejected The Jarque-Bera test supports to the asymmetric
distribution. The upper tail of the distribution is thicker than the lower tail (indicated by the
positive values of skewness), and the tails of the distribution are thicker than the normal
(indicated by the kurtosis coefficient is greater than 3).
Table 1
Descriptive Statistics
CE TE Y
Mean 206269.98 529998.56 2647428.61
Median 202406.65 540975.73 708169.73
Maximum 547009.17 1207114.12 54840480.61
Minimum 43119.77 161236.20 140707.55
Std. Dev. 94777.05 192148.65 8264070.60
Skewness 0.7413 0.5266 5.1829
Kurtosis 3.8205 4.4275 29.4212
CV (%) 45.95 36.25 312.15
Jarque-Bera 10.4080 11.4078 2920.0373
Probability 0.0055 0.0033 0.0000
Table 2 reports the estimation results of log linear model based on the fixed effect model
as specified in equation (4) for West Papua, Papua, and both provinces respectively. The sign of
public expenditures coefficients are contradict both across expenditure and province. The
coefficient of capital expenditure is negative (in Papua and total provinces) and as expected
before is positive (in West Papua). The sign of operating expenditures coefficients are
positive for all three regions.
The statistical evaluation on the corresponding coefficient unfortunately is statistically
insignificant. Given that, we infer that public capital expenditure failed to support regional

134
economic growth suggesting the capital expenditure is unproductive. This finding is in line
with recent studies in developing countries, especially for Africa (Olabisi & Oloni, 2012;
Mudaki & Masaviru, 2012).
With regard to the operating expenditure, the magnitude of the corresponding coefficients
is higher compared to the capital expenditure, especially in Papua province. Consequently,
overall, the public expenditures remain contributing marginally to economic growth. Given
that, we can say that the division/construction of new localities in the spirit of regional
autonomy followed by increasing operating expenditures support to economic growth.
The private expenditure significantly contributes to the local income growth. The increase 1
percent in private expenditure overall tends to raise local income for about 0.1 percent on the
average. Looking at the coefficient of private expenditure, the magnitude is lower than that of
the operating expenditure for all three cases. When we replaced it with its lag to
accommodate persistent private investment, the result does not change. In such a case, we
conclude that private sector is weak enough to play an important role to the economy.
Probably, it could explain why Papua and West Papua provinces are relatively less developed
than other provinces in Indonesia.
Table 2
Regression Results
Dep. Var: Log (Y) West Papua Papua Total
Coeff. t-stat Coeff. t-stat Coeff. t-stat
Constant 1.520003 0.77857 -2.323454 -0.72032 2.686592 1.12620
Log (CE) 0.213823 1.51770 -0.136237 -0.57788 -0.249710 -1.61253
Log (OE) 0.726996 4.91650 1.371784 6.00736 1.082461 6.15540
(PE/GE) 0.300831 9.78143 0.093181 12.92708 0.094119 12.08317
R-sq 0.83449 0.81947 0.69558
F 58.82415 66.57738 63.21556
SEE 0.32998 0.53291 0.58631
N 39 48 87

135
So far, we have talked about the determinants of local economic growth. In the next
section, we will answer the main question, whether both the public and private expenditures have
been already optimal. In absolute term, the expenditures' elasticity as presented in Table 2 in
some cases is less than unity. It seems that the increase in regional income is slower than that
in both public and private expenditures implying inefficiency in the corresponding
expenditures.
Table 3 presents the result of statistical tests based on some restrictions imposed into the
regression equation. By imposing coefficient of both public expenditures are assumed to be
equal (β1 = β2), the result shows that we can reject it in all provinces. The coefficient of
capital expenditure statistically does not equal to the operating expenditure implying that the
local government internally faces allocative inefficiency problems.
Table 3
Test of Restrictions
Restrictions West Papua Papua Total
F ; 2 Stat Prob. F ; 2 Stat Prob. F ; 2 Stat Prob.
β1 = β2 4.69106 0.0372 16.26817 0.0002 25.82817 0.0000
4.69106 0.0303 16.26817 0.0001 25.82817 0.0000
β1 = β2 = 1 3.40868 0.0733 2.65080 0.1106 0.21988 0.6404
3.40868 0.0649 2.65080 0.1035 0.21988 0.6391
[(β1=β2) + β3] = 1 16.13373 0.0000 11.81258 0.0001 33.09966 0.0000
32.26746 0.0000 23.62516 0.0000 66.19931 0.0000
Furthermore, imposing coefficient of operating expenditure equals to unity (β1 = β2 = 1),
the result shows that we can accept it in all provinces. The corresponding coefficient statistically
does not equal to unity implying that the operating expenditure is elastic with respect to
regional income. This result is consistent with the analysis above that only the operating
expenditures support to regional economic growth.

136
The third restriction is an assumption of the existence of constant return to scale ([β1=β2]
+ β3 = 1), i.e. the sum of magnitude coefficients of public and private expenditures are imposed
equals to unity. The regional output is said to enjoy a constant return to scale when the
increase in both public and private expenditures induce proportionally the regional output
increase. In such a case, the regional income is then said to be efficient.
The statistical tests show that we reject the restriction for both provinces. To accept the
null hypothesis that the private and public expenditures induce proportionally the local output,
we need almost 0 percent confidence level. It means that regency/municipality in West Papua
and Papua provinces do not experience constant return to scale. This is in line with the result
of the second restriction that proves statistically that β1 = 0 and β2 = 1.
To sum up, all regency/municipality in both provinces has not enjoyed a constant return
to scale yet or even experienced increasing return to scale. Consequently, the expenditure is not
optimal yet and potential to be prioritized further. This conclusion is consistent with the fact
that the human development indices in most regency/municipality in Papua and West Papua
provinces are the lowest compared to the other provinces in Indonesia (BPS, 2011). The
human development index is determined mainly by regional income, health and education
expenditures. The two latest variables are also decentralized to local government. It implies
that the private and public expenditures have some technical inefficient problems in the
provinces.
Conclusion
This paper analyzed the local income growth in relation to public expenditure's
optimization in the special autonomy region, i.e. Papua and West Papua provinces. The study

137
employed secondary data published by formal institutions focusing on the unbalanced panel data
at the regency/municipality level. The motivation of this paper is triggered by the fact that local
governments in Indonesia have been decentralized to manage their own revenues and outlays.
This brought about the need to examine the efficiency of sectoral budgetary allocations to
provide the critical information in decision making and prioritizing their expenditures.
This paper adopts input-output elasticity method to evaluate the present public and private
expenditure optimization at the regency/municipality level in the period of 2007-2010. The
elasticity of capital expenditure with respect to regional income is insignificant indicating that
the economic growth is not responsive to the capital expenditure. Regarding the operating
expenditure, we found unitary elastic indicating that it supports to regional economic growth.
Combining to the private expenditure, the regency/municipality in both provinces has
increased return to scale implying that the local economy is suboptimal and potential to be
accelerated further.
Based on those findings, we suggest that local governments need to improve
discretionary public expenditures at the local level, such as prioritize their expenditures and
sharpen them – into soft and hard infrastructures - so they create complement to the private
expenditures.
They also should improve the budget composition as well as enforce the expenditures'
efficiency. Furthermore, the study leads to the recommendation to improve local business
environment, such as streamlining local regulations and reducing harmful local taxes and user
charges to attract more investors. Finally, it needs to reform regional autonomy and fiscal
decentralization policies in both provinces.
138
References
Alexander, W. R. (1990). Growth: Some combined cross-sectional and time-series evidence
from OECD countries. Applied Economics, 22, 1197-204.
https://doi.org/10.1080/00036849000000039
Barro, R. J. (1990). Government spending in a simple model of endogenous growth. Journal of
Political Economy, 98(5), 103-25. https://doi.org/10.3386/w2588
Barro, R. J. (1991). Economic growth in a cross section of countries. Quarterly Journal
of Economics, CVI(May), 407-44. https://doi.org/10.3386/w3120
Barro, R. J., & Sala-i-Martin, X. (1992). Public finance in models of economic growth. Review
of Economic Studies, 59, 645-61. https://doi.org/10.3386/w3362
Bleaney, M., Gemmell, N. & Kneller, R. (2001). Testing the endogenous growth model:
Public expenditure, taxation and growth over the long run. Canadian Journal of
Economics, 34, 36-57. https://doi.org/10.1111/0008-4085.00061
Bose, N., Haque, M. E. & Osborne, D. (2007). Public expenditure and economic growth.
A disaggregated analysis for developing countries. Manchester School, 75, 533-56.
BPS. (2011). Indeks Pembangunan Manusia Indonesia, BPS, Jakarta.
Colombier, C. (2011). Does the composition of public expenditure affect economic
growth? Evidence from the Swiss Case. Applied Economics Letters, 18(16), 1583-9.
https://doi.org/10.1080/13504851.2011.554361
Devarajan, S, Swaroop, V., & Zou, H. (1996). The composition of public expenditure and
economic growth. Journal of Monetary Economics, 37, 313-44.
https://doi.org/10.1016/0304-3932(96)01249-4
Grier, K. B., & Tullock, D. (1989). An empirical analysis of cross-national economic
growth, 1951- 1980. Journal of Monetary Economics, 24, 259–76.
https://doi.org/10.1016/0304-3932(89)90006-8
Gujarati, D. N. (2004). Basic Econometrics. Singapore: McGraw-Hill Book Co. Inc.
Keynes, J. M., (1964). The general theory of employment, interest, and money. Orlando, Fl:
Harcourt, Inc.
Kormendi, R. C., & Meguire, P. G., (1985). Macroeconomic determinants of growth: Cross-
country evidence. Journal of Monetary Economics, 16(2), 141–63.
https://doi.org/10.1016/0304-3932(85)90027-3

139
Landau, D. L. (1983). Government expenditure and economic growth: A cross country
study. Southern Economic Journal, 49(January), 783–92. https://doi.org/10.2307/1058716
Landau, D. L. (1985). Government expenditure and economic growth in the developed
countries, 1952 – 76. Public Choice, 47(3), 459–77. https://doi.org/10.1007/bf00182148
Levine, R., & Renelt, D. (1992). A sensitivity analysis of cross-country growth
regressions. American Economic Review, 82(4), 942–63.
Mudaki, J., & Masaviru, W. (2012). Does the composition of public expenditure matter to
economic growth for Kenya? Journal of Economics and Sustainable Development, 3(3),
60-70
Olabisi, A. S., & Funlayo, O. E. (2012). Composition of public expenditure and economic
growth in Nigeria. Journal of Emerging Trends in Economics and Management Sciences,
3(4), 403-7.
Ram, R. (1986). Government size and economic growth: A new framework and some
evidence from cross-section and time series data. American Economic Review, 76, 191-
203.
Romer, P. M. (1989). What determines the rate of growth and technological change. World
Bank Working Papers.
Romer, P. M. (1990a). Human capital and growth: Theory and evidence. Carnegie–
Rochester Conference Series on Public Policy, 40, 47–57.
Romer, P. M. (1990b). Capital, labour and productivity. Brookings Papers on Economic
Activity, Special Issue, 337-420.
Sennoga, E. B., & Matovu, J. M. (2010). Public spending composition and public sector
efficiency: Implications for growth and poverty reduction in Uganda. Economic Policy
Research Centre, Research Series No. 66, February.
Solow, R. M. (1956). A contribution to the theory of economic growth. Quarterly
Journal of Economics, 70, 65-94.
Temple, J. R. W. (1999). The new growth evidence. Journal of Economic Literature, 37,
112-56.