attitudes toward cohabitation: a cross sectional study
TRANSCRIPT
University of Central Florida University of Central Florida
STARS STARS
Electronic Theses and Dissertations, 2004-2019
2016
Attitudes Toward Cohabitation: A Cross Sectional Study Attitudes Toward Cohabitation: A Cross Sectional Study
Kensington Shields-Dutton University of Central Florida
Part of the Sociology Commons
Find similar works at: https://stars.library.ucf.edu/etd
University of Central Florida Libraries http://library.ucf.edu
This Masters Thesis (Open Access) is brought to you for free and open access by STARS. It has been accepted for
inclusion in Electronic Theses and Dissertations, 2004-2019 by an authorized administrator of STARS. For more
information, please contact [email protected].
STARS Citation STARS Citation Shields-Dutton, Kensington, "Attitudes Toward Cohabitation: A Cross Sectional Study" (2016). Electronic Theses and Dissertations, 2004-2019. 4982. https://stars.library.ucf.edu/etd/4982

ATTITUDES TOWARDS COHABITATION: A CROSS-SECTIONAL STUDY
by
KENSINGTON A. SHIELDS-DUTTON B.A. Florida State University, 2008
A thesis submitted in partial fulfillment of the requirements for the degree of Master of Arts in the Department of Sociology
in the College of Sciences at the University of Central Florida
Orlando, Florida
Spring Term 2016
Major Professor: David Gay

ii
©2016 Kensington A. Shields-Dutton
iii
ABSTRACT
Cohabitation and attitudes toward cohabitation have been of interest to social scientists since
the 1970s. Early research on cohabitation concentrated on college aged students enrolled at
institutions of higher learning. This trend was due to convenience sampling (Trost, 1978). Later
research demonstrated the college population represented less than half of the total number of
cohabitating persons. With the growth in numbers of persons who are choosing to cohabitate
versus marrying, this study examines current attitudes towards cohabitation. This research
augments the existing literature on attitudes toward cohabitation in the following ways: (1) it
updates the current research on the attitudes toward cohabitation by using the 2012 General
Social Survey, (2) it examines cohort differences in attitudes toward cohabitation among the
four major birth cohorts in our society today (i.e., the Silent Generation, the Baby Boomer
cohort, Generation X, and the Millennial cohort), and (3) it controls for other factors that affect
attitudes toward cohabitation.

iv
ACKNOWLEDGMENTS
I would like to acknowledge my wonderful thesis committee for providing me feedback and
guidance as I participated in this fun, long, and sometimes stressful process of writing my thesis.
I greatly appreciate your guidance through the highs and the lows of this journey of discovery.
I would also like to thank all of my family and friends. Thank you for providing listening ears,
shoulders to lean on, and words of inspiration. Without you all I could not have finished.
v
TABLE OF CONTENTS
LIST OF TABLES .............................................................................................................................. viii
LIST OF ACRONYMS (or) ABBREVIATIONS ....................................................................................... ix
CHAPTER ONE: INTRODUCTION ...................................................................................................... 1
CHAPTER TWO: THEORHETICAL FRAMWORK................................................................................. 6
CHAPTER THREE: LITERATURE REVIEW ........................................................................................ 10
Shifting Attitudes toward Cohabitation .................................................................................... 10
Birth Cohorts and Generations ................................................................................................. 12
Silent Generation ...................................................................................................................... 13
Baby Boomers ........................................................................................................................... 14
Generation X ............................................................................................................................. 15
Millennials ................................................................................................................................. 16
Controls ..................................................................................................................................... 17
Gender .................................................................................................................................. 17
Income................................................................................................................................... 18
Education .............................................................................................................................. 18
Race and Ethnicity ................................................................................................................. 19
Political Views ....................................................................................................................... 20
vi
CHAPTER FOUR: DATA .................................................................................................................. 21
Research Expectations .............................................................................................................. 22
CHAPTER FIVE: ANALYTIC STRATEGY ............................................................................................ 23
CHAPTER SIX: METHODS ............................................................................................................... 24
Dependent Variable .................................................................................................................. 24
Cohabitation .......................................................................................................................... 24
Independent Variables .............................................................................................................. 24
Birth Cohort ........................................................................................................................... 24
Control Variables ...................................................................................................................... 25
Gender .................................................................................................................................. 25
Income................................................................................................................................... 25
Education .............................................................................................................................. 25
Race and Ethnicity ................................................................................................................. 26
Political Ideology ................................................................................................................... 26
Regional residence ................................................................................................................ 26
Life Course indicator Variables ................................................................................................. 27
Divorced ................................................................................................................................ 27
Birth Control ok ..................................................................................................................... 27
vii
Ever Unemployed .................................................................................................................. 28
Children Home ...................................................................................................................... 28
CHAPTER SEVEN: RESULTS ............................................................................................................ 29
CHAPTER EIGHT: DISCUSSION ....................................................................................................... 34
Limitations ................................................................................................................................ 35
REFERENCES .................................................................................................................................. 37
viii
LIST OF TABLES
Table 1 Descriptive Statistics by Birth Cohort ............................................................................... 29
Table 2 Descriptive Statistics of Control Variables ....................................................................... 30
Table 3 Multiple Regression Results: The Effects of Cohort, Sociodemographic controls, and Life
course variables on Attitudes toward Non-marital Cohabitation ................................................ 32
ix
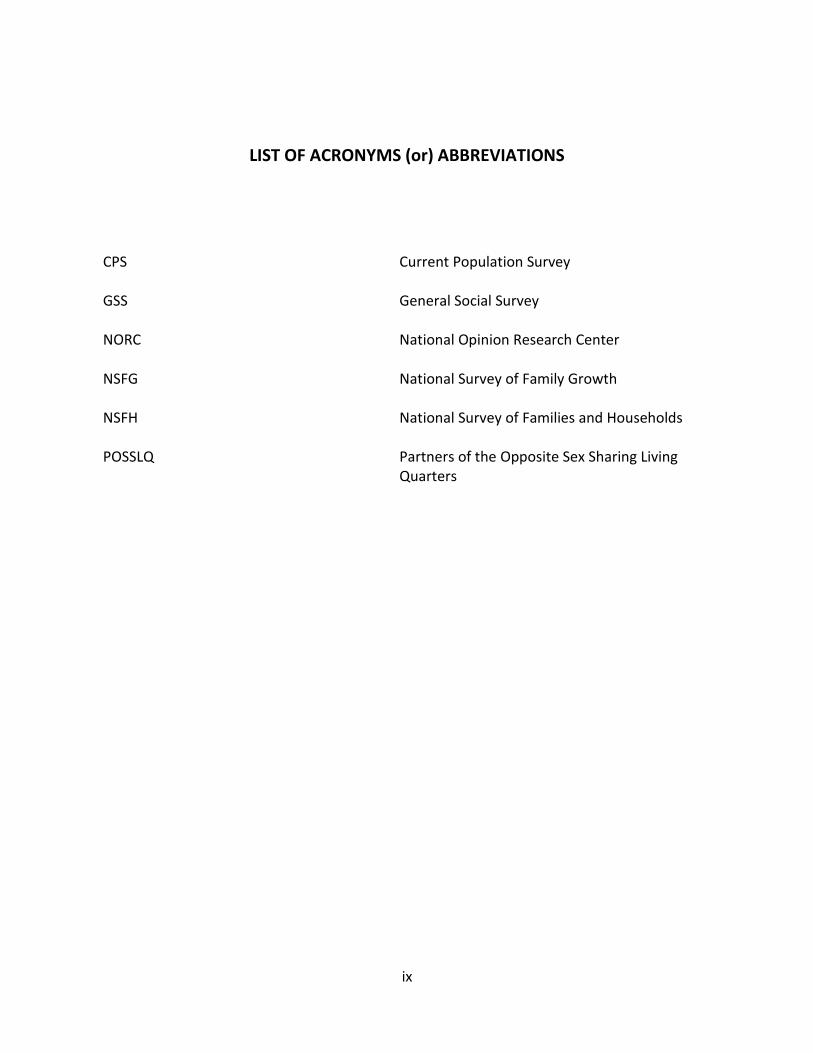
LIST OF ACRONYMS (or) ABBREVIATIONS
CPS
Current Population Survey
GSS
General Social Survey
NORC
National Opinion Research Center
NSFG
National Survey of Family Growth
NSFH
National Survey of Families and Households
POSSLQ Partners of the Opposite Sex Sharing Living Quarters
1
CHAPTER ONE: INTRODUCTION
Marriage is an institution that varies in importance by culture. Cherlin (2009) wrote that
in America unlike other western countries, marriage is a social ideal that has significant
importance to members in society. Yet, while marriage may be idealized as a step to family
formation, in an ever changing society, it is not “the” only step. Over the last few decades,
couples increasingly chose to cohabitate. Smock, Manning, & Porter (2005) contend that
cohabitation is now the “modal path to marriage” (2005: 1). Many young men and women
cohabitate at some point in their lives, and a majority of marriages and remarriages are
precipitated by cohabiting (Smock, 2000). Therefore, relationships in contemporary American
society are diverse and do not follow a single chronological pattern. Different types of marriage
and family structures allow for unique and diverse perspectives. Various perspectives address
changing age at marriage, cohabitation, non-marital childbirth, divorce, and remarriage that
may occur over the course of time. This study focuses on attitudes toward cohabitation in the
United States using the 2012 General Social Survey (hereafter, GSS). In particular, this study
examines attitudes toward cohabitation across four major birth cohorts. The study of
cohabitation has a growing body of research that has escalated very quickly over the last few
decades (Bumpass and Lu 1999; Bumpass and Sweet 1989; Bumpass, Sweet, and Cherlin, 1991;
Bumpass and Lu, 2000; Wang and Taylor 2011). It is important to understand attitudes toward
cohabitation in order to address marriage and family formations and patterns.
2
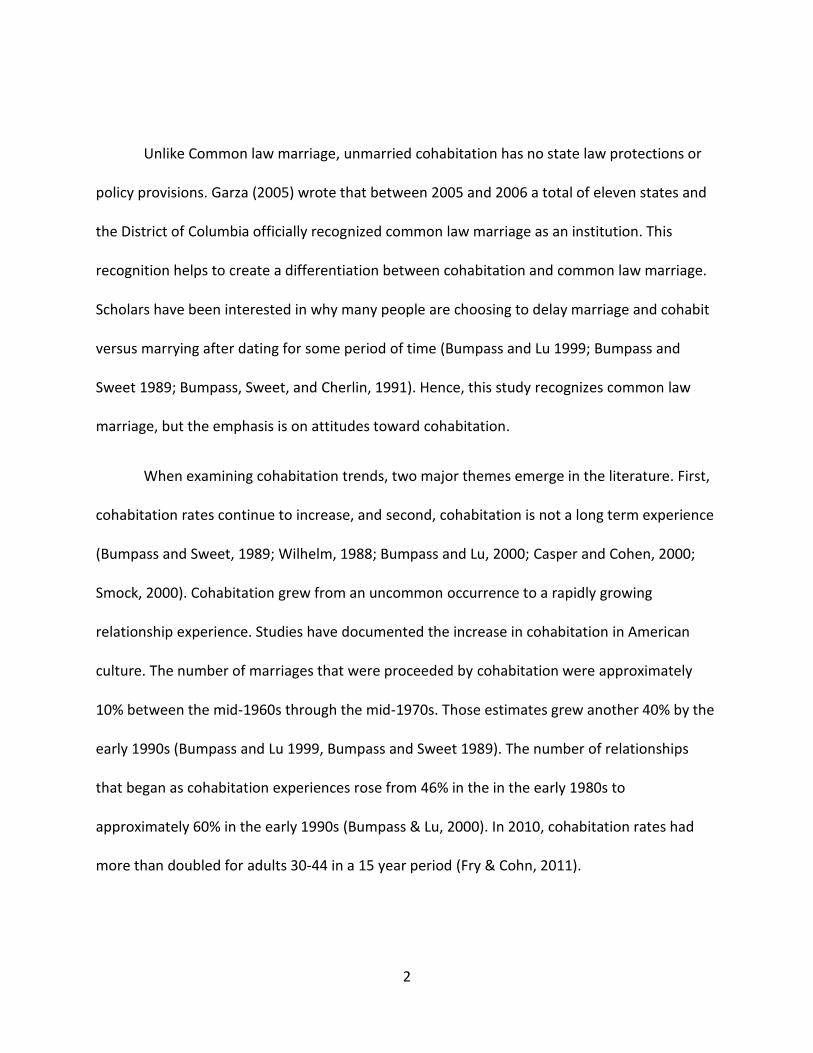
Unlike Common law marriage, unmarried cohabitation has no state law protections or
policy provisions. Garza (2005) wrote that between 2005 and 2006 a total of eleven states and
the District of Columbia officially recognized common law marriage as an institution. This
recognition helps to create a differentiation between cohabitation and common law marriage.
Scholars have been interested in why many people are choosing to delay marriage and cohabit
versus marrying after dating for some period of time (Bumpass and Lu 1999; Bumpass and
Sweet 1989; Bumpass, Sweet, and Cherlin, 1991). Hence, this study recognizes common law
marriage, but the emphasis is on attitudes toward cohabitation.
When examining cohabitation trends, two major themes emerge in the literature. First,
cohabitation rates continue to increase, and second, cohabitation is not a long term experience
(Bumpass and Sweet, 1989; Wilhelm, 1988; Bumpass and Lu, 2000; Casper and Cohen, 2000;
Smock, 2000). Cohabitation grew from an uncommon occurrence to a rapidly growing
relationship experience. Studies have documented the increase in cohabitation in American
culture. The number of marriages that were proceeded by cohabitation were approximately
10% between the mid-1960s through the mid-1970s. Those estimates grew another 40% by the
early 1990s (Bumpass and Lu 1999, Bumpass and Sweet 1989). The number of relationships
that began as cohabitation experiences rose from 46% in the in the early 1980s to
approximately 60% in the early 1990s (Bumpass & Lu, 2000). In 2010, cohabitation rates had
more than doubled for adults 30-44 in a 15 year period (Fry & Cohn, 2011).
3
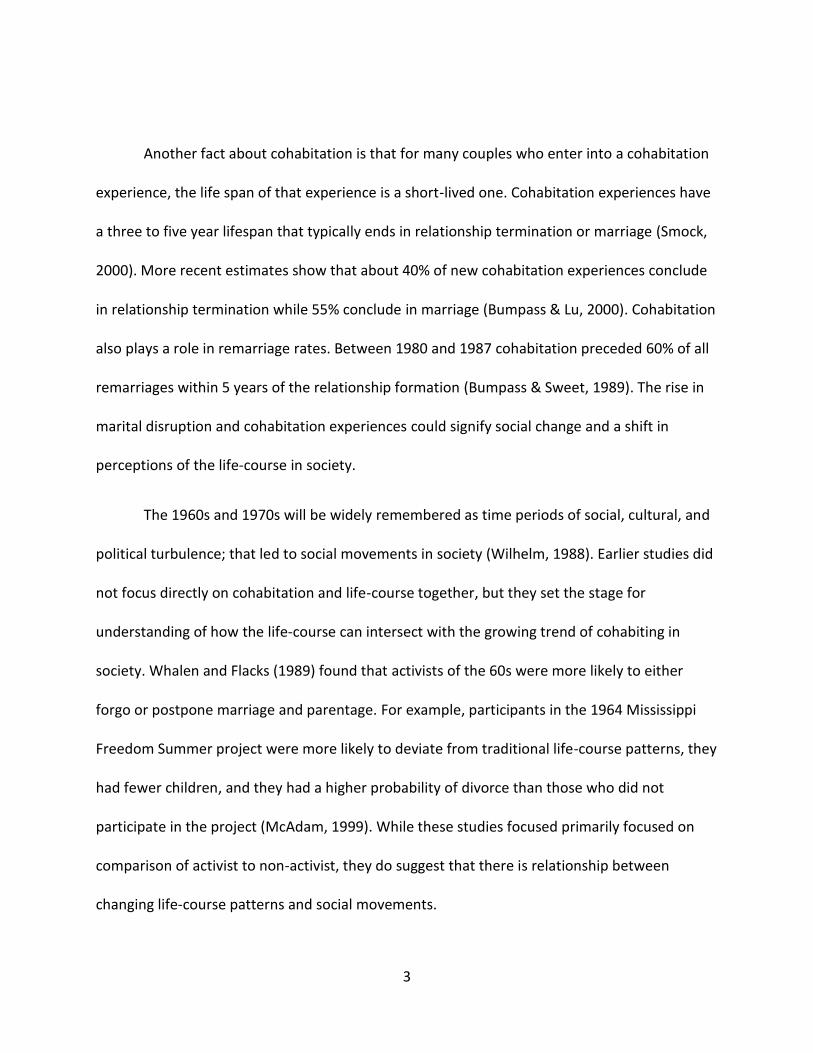
Another fact about cohabitation is that for many couples who enter into a cohabitation
experience, the life span of that experience is a short-lived one. Cohabitation experiences have
a three to five year lifespan that typically ends in relationship termination or marriage (Smock,
2000). More recent estimates show that about 40% of new cohabitation experiences conclude
in relationship termination while 55% conclude in marriage (Bumpass & Lu, 2000). Cohabitation
also plays a role in remarriage rates. Between 1980 and 1987 cohabitation preceded 60% of all
remarriages within 5 years of the relationship formation (Bumpass & Sweet, 1989). The rise in
marital disruption and cohabitation experiences could signify social change and a shift in
perceptions of the life-course in society.
The 1960s and 1970s will be widely remembered as time periods of social, cultural, and
political turbulence; that led to social movements in society (Wilhelm, 1988). Earlier studies did
not focus directly on cohabitation and life-course together, but they set the stage for
understanding of how the life-course can intersect with the growing trend of cohabiting in
society. Whalen and Flacks (1989) found that activists of the 60s were more likely to either
forgo or postpone marriage and parentage. For example, participants in the 1964 Mississippi
Freedom Summer project were more likely to deviate from traditional life-course patterns, they
had fewer children, and they had a higher probability of divorce than those who did not
participate in the project (McAdam, 1999). While these studies focused primarily focused on
comparison of activist to non-activist, they do suggest that there is relationship between
changing life-course patterns and social movements.

4
Birth cohorts, or generations, experience different sets of social and cultural events.
With each different cohort, society changes and evolves given the unique perspective or
characteristics of each group. Cohorts or generations of people not only share a period of birth,
but they also share similar social and historical conditions (Wilhelm, 1988). Mannheim (1952)
saw birth cohorts as instruments of social change. Mannheim also stated that cohorts arise
because they are socialized similarly. The generations are formed because they share similar
structural locations and dimensions such as education, religion, social class, along with
formative experiences (Mannheim, 1952).
Like Mannheim, Ryder (1965) argues that birth cohorts are important mechanisms of
social change. The lives and deaths of individuals from a societal standpoint go through a
massive process of personnel replacement, which is referred to as demographic metabolism
(Ryder, 1965). Every new birth cohort is sensitive and responsive to social change during the
early adult years that is typically a period of rapid individual life change because of transitions in
work, marriage, and parenthood (Wilhelm, 1988). Ryder viewed society as being able to
socialize individuals who are responsive to social change. With an increasing number of
socializing forces, individuals are exposed to numerous conflicting ideas and values, which
promote social change (Wilhelm, 1988). This social change shapes the values, ideas, and
attitudes for generational birth cohorts.
The purpose of this study is to examine attitudes toward cohabitation. This research
augments the existing literature on attitudes toward cohabitation in the following ways: (1) it
5
updates the current research on the attitudes toward cohabitation by using the 2012 General
Social Survey; (2) it examines cohort differences in attitudes toward cohabitation among the
four major birth cohorts in our society today (i.e., the Silent Generation, the Baby Boomer
cohort, Generation X, and the Millennial cohort); and (3) it controls for other factors that affect
attitudes toward cohabitation.
6
CHAPTER TWO: THEORHETICAL FRAMWORK
Change affects aspects of individual and family life. Things evolve and change. The 1960s
and 1970s was a time period of social, cultural, and political turbulence. This turbulence is
responsible for sparking the literature on social change and processes (Wilhelm, 1988). In 1994,
Elder referred to life course theory as an emerging paradigm that would change the way we
study and view human life. He defined life course as having multiple theoretical strands: age
stratification, cultural and intergenerational models, and developmental life span psychology.
These different theoretical strands all blend together to create the foundation of life course
theory.
Elder (1994) stated that the link in lives principle was a central theme to the life course
paradigm. The lives of humans are interdependent on social relationships between family and
friends throughout a lifetime (Elder, 1994). The principle of linked lives examines the many
relationships that a person has spanning across their social worlds, ranging from family, friends,
and work life during a lifetime. The life experience of a child in the great depression was a
signifier of hard times coming of age, whereas the children who were coming of age during the
Second World War experienced employment booms, but possible absentee parents. Social
regulation and support are birthed out of these relationships. Unexpected changes in life not
only impact the person directly, but also effect those who are directly connected to that
person. When parents get divorced or lose employment, this can significantly postpone a young

7
person’s ability to go to college, seek employment, and start a family; when looking from the
opposite end of the spectrum a child’s loss of employment or failed marriage could lead to
moving back in with parents and affect their retirement plans (Elder Jr, 1985). The
opportunities and misfortunes of adults and children, as well as their personal problems
become intergenerational (Elder, 1994). Each generation is effected by the decisions and the
events that occur in other generation’s lifetime (Elder Jr, 1985).
In 1994, Hareven (1994) stated that it is important to have both an historical perspective
and understanding of the life course paradigm to understand generational relations and large
processes of social change, and how they have affected family patterns, and reciprocal relations
among kin. Hareven (1994) went on to explain that life course theory was composed of two
parts in its natural state; developmental and historical. She explained that the life course is
composed of three major dimensions: (1) the timing of the life transitions in the context of
history; (2) the synchronized timing of the life transitions with familial transitions and
generational relations; and (3) the impact of early life events shaped by historical circumstances
and the implications they have for future events in life. These dimensions deliver a framework
from which to view life course theory.
The first dimension addresses the question of timing in an individual’s life. The timing of
a life transitions includes the balancing that a person must have during entry and exit of
different roles from education, family, work, and community over their life course (Hareven T,
1994). Essentially, this dimension addresses how individual time and sequence affect transitions

8
in the changing historical context. The timing is dependent upon the cultural and social context
in which the transition takes place while recognizing the time period in which the transition
occurred as well (Neugerten and Datan, 1996).
The second dimension of the life course is the synchronization of individual transitions
in life with those of the larger family transitions such as leaving home for the first time, starting
a career, getting married, and having children. Age is very important when it comes to the
timing of a life transition. The subsequent transition can vary depending on the age that it
occurs. While age is important, changes in family status and the shifting of roles within the
familial structure are just as important as age in the life course theory (Hareven 1994; Hareven
and Masaoka 1988; Riley and Riley 1993). The synchronization of individual transitions with
familial transitions is important in life course and relies directly on the relation of generations,
because individual goals cannot be in conflict with the needs of the family unit (Hareven T,
1994). An example of this would be parents encouraging an older sibling to get a job out of high
school, in lieu of going to college to assist with financial support for the family.
The third and final dimension concerns the impact of early life events and how they
intersect within the historical circumstances of that time frame. Similar to what Elder
addresses in the linkage of lives, this dimension covers how one generation of events transmits
a ripple effect over history given the historical circumstances that affect others (Hareven T,
1994).
9
The life course perspective is relevant to this study because there is an understanding
that life transitions and events in other domains affect union formation (Elder, 1985; Guzzo,
2006). One could possibly expect that different life events can influence a person’s attitude
toward one type of union over another (Guzzo, 2006). Life events that indicate instability can
encourage cohabitation rather than marriage (Guzzo, 2006). Cohabitation is a union of choice
for those whose lives are in a state of transition and uncertainty and or instability (Duvander,
1999). The decision to enter into different forms of life experiences through life transitions is
affected by prior events in life (Elder Jr, 1985). Cohabitation is a transition experience this study
examines with a focus on attitudes toward cohabitation as an acceptable alternative to
marriage, by birth cohort.
10
CHAPTER THREE: LITERATURE REVIEW
Shifting Attitudes toward Cohabitation
Societal changes such as relaxation of social pressure to marry because of unmarried
pregnancy, liberalization of norms relating to life style, and increased sexual freedom and
exploration are all plausible reasons that marriage is delayed and increased rates of
cohabitation have become attractive alternatives (Tanfer, 1987). Rates in cohabitation have
consistently risen in the United States over the last few decades (Casper & Cohen, 2000). With
no obvious signs of slowing in the trend of couples choosing to cohabit rather than marry, an
understanding of the evolution of cohabitation may help to provide insight on these trends.
Early research on cohabitation was hardly generalizable, because most of this research
used non-representative samples (Smock, 2000). Most of the early cohabitation research was
conducted by professors who utilized convenience sampling to test their student populations.
(Glick and Norton) 1977 reported that 25% of cohabitating couples were 25 years of age or
younger and one or both were enrolled in a college or university. This left 75% of the total
cohabitating population unaccounted for. Researchers used the Decennial Census or the
Current Population Surveys (CPS) to try and understand the prevalence of cohabitation, which
at that time was described as POSSLQ (Partners of the Opposite Sex Sharing Living Quarters)
(Casper & Cohen, 2000). Those data sets were still problematic because they did not measure
cohabitation directly; one could only infer cohabitation based on the information that was
provided regarding household composition (Smock, 2000). This became problematic for

11
researchers because a more representative sample was needed to gain a better understanding
of this growing trend.
In the early to mid-1980s representative survey information was collected about
populations outside of the college ranks. Clayton & Voss (1977) surveyed men ages 20-30, while
Tanfer & Horn (1985) surveyed never-married women ages 20-29. These surveys asked the
participants directly about cohabitation; however, the age ranges were limited, thus affecting
the generalizability. The National Survey of Family Growth (NSFG) Cycle III in 1982 delivered a
more representative data collection of cohabitation in the United States at that time (Bachrach,
1987). The NSFG was a survey conducted by the National Center for Health Statistics. The
survey collected self-reported information from a nationally representative sample of women,
regardless of the marital status, who ranged in age from 15 to 44. The information collected
included data about current and not past cohabitation experiences. Another more
representative sample, the Detroit Area Study (Thorton, 1988), examined cohabitation through
follow-up interviews with the children of mothers from the original 1962 family study. One of
the more widely used surveys however was the National Survey of Families and Households
(NSFH). The NSFH contained complete cohabitation histories from men and women of all ages
thus making it a more representative basis for cohabitation estimates, and examination of
cohort change (Smock, 2000). Earlier surveys had limitations in regard to age, sex, and
geographical location, while also primarily focusing on specific birth cohorts.
12
Birth Cohorts and Generations
Most of the literature that focuses on cohabitation and birth cohorts is centered on the
Baby Boomer cohort and some people identified as Generation X (Bumpass and Lu 1999;
Bumpass, Sweet, and Cherlin, 1991). While these were primarily the birth cohorts that were
examined, the studies were not focused on birth cohort comparisons. Studies examining the
Millennial cohort are limited and studies done on cohabitation and the Silent Generation are
scarce at best.
Generational units, or cohort segments, are conceptualized as groups of individuals who
are located in the same birth cohort and who share common locations along other structural
dimensions or similar formative experiences (Wilhelm, 1988). Hareven (1994) explains that
there is a need to differentiate between generations and birth cohorts. She explains that a
generation denotes a kinship comprised of parents, grandparents, children, or grandchildren,
and can span longer than 30 years. While a cohort is a more precise group of people who share
a historical experience, and are defined by their interaction with the historical events that help
shape the life course of that particular group (Ryder 1975; Riley 1978; Hareven 1994).
Generation and cohort studies can present difficulties when trying to operationalize
each generation or cohort. Different studies present different categorical rankings for each
cohort or generational grouping see (Howe and Strauss, 2000; Mitchell, 2003; Taylor, 2014).
The latter part of this section profiles the social characteristics of the four generations
examined in this study.
13
Silent Generation
The Silent Generation cohort includes all of the people born in the United States
between 1925 and 1945 (Howe & Strauss, 2000). The Silent generation has been described as
the transitional or middle generation (Pennington-Gray & Lane, 2002). The first half of the
Silent generation was marked by the Great Depression and the second half by World War II.
Strauss and Howe (1991) stated that the Silent generation name was coined by G.I. historian
William Manchester. Manchester stated that the Silent Generation had no apparent leaders, no
programs, no sense of their own power, and no sense of culture that was their own (Strauss &
Howe, 1991). In contrast Mitchell (2003) entitles “Silent generation” as the Swing generation
because their attitude and lifestyles swing to either side of the generations that sandwich them.
Mitchell also attributes the Swing generation with being the generation of leaders of many
social movements. Although Mitchell’s timeframe and perspective may differ, she shares some
commonalties in her overview of the life course events of the Silent generation. Along with the
fall of the Stock Market with the Great Depression, the number of births in America fell below
2.3 million in the early 1930s (Mitchell, 2003). This downward trend in population would later
be reversed by the Baby Boom. Taylor (2014) describes the Silent Generation as conservative
and conformist who are uneasy with the changing landscape of cultural, demographic,
technological advancements, and growing size of government. The silent Generation joined
groups such as the peace core in record numbers because of their belief in American
institutions and historical experiences (Strauss & Howe, 1991). Literature does not directly
address cohabitation trends during the period of their young adulthood, but it can be assumed

14
that those with lower socioeconomic standings would experience cohabitation at a greater rate
than those from higher economic groups (Bumpass & Sweet, 1989). Although, there are no
longitudinal studies about the Silent Generation and their views on cohabitation, there are still
relationships in their purview that can be drawn upon. One is that the Silent generation is
known for having conservative values (Howe and Strauss, 2000; Pennington-Gray and Lane,
2002; Bumpass and Lu, 2000; Taylor, 2014). Studies have shown that those who are more
conservative are less favorable to nontraditional familial roles and structures (Lye & Waldron,
1997). According to 2011 Pew Research Center data, nearly 50% of “Silent generation”
described themselves as conservative, which was a 6 point increase since the year 2000 (Taylor
& Keeter, 2011)
Baby Boomers
The baby boomers are comprised of all of those born in the U.S. between 1946 and
1964 (Howe & Strauss, 2000). The labeling of Baby Boomer is derived from the increase in birth
rates for this cohort. Total births per year during this period grew from 2.3 million to 4.3 million
and then fell to 3.1 million (Macunovich, 2000). All religious affiliations, race, ethnicities, and
ethnic groups took part in the population boom (Macunovich, 2000). This generation took
shape during times of war, the civil rights movement, and the second wave of the feminist
movement (Howe and Strauss, 2000; Pennington-Gray and Lane, 2002; Mitchell, 2003; Taylor,
2014). This generation was the first to be studied in conjunction with unmarried cohabitation,
because they were the college students that researchers had access to for convenience
sampling (Trost, 1978). Early cohabitation studies on this group were not generalizable because
15
they only represented 25% of the total cohabitating population. Thus, the survey, was based on
a convenience sample, that was not representative of the larger U.S. population (Newcomb,
1979). The Baby Boomer cohort was raised to be independent and believe in controlling their
own destinies (Mitchell, 2003). They were also the first to have birth control generally
available; a fact that allowed them to make choices about timing of their children’s births as
well as control the number of children they chose to have.
Generation X
The Generation X cohort includes all of those born in the United States between 1965
and 1980 (Howe & Strauss, 2000). The time frame for this generation has been questioned.
Mitchell (2003) categorized them from 1965 – 1976. Strauss and Howe (1991) originally set
them between the years of 1961 – 1981, before settling on 1965 – 1980 (Howe & Strauss,
2000). Strauss and Howe (1991) refer to this generation as the 13th generation. Mitchell (2003)
labels them the baby bust generation, due to a decline in birth rates starting in the first year of
Generation X. There were about a million fewer children born in the year 1965 than were born
in the final year for the Baby Boomer generation (Mitchell, 2003). The label of Generation X was
actually created by writer Douglas Coupland in the 1991 novel Generation X: Tales from an
accelerated culture. It has become the most common label for this generation. Generation Xers
faced familial disruption more frequently when compared to Baby Boomers. They were 50%
more likely to face parental divorce (Howe & Strauss, 2000). Generation X suffered through
lower employment prospects, which caused them to live at home with parents longer and delay
marriage because of economic issues (Williams, Coupland, Folwell, & Sparks, 1997). This delay

16
in marriage could have been an indicator of a rising cohabiting population. In 1995, when
Generation X was in their 20sand 30s, the population of those who were cohabiting grew by
one fourth in comparison to Baby boomers in 1987 (Bumpass & Lu, 2000).
Millennials
The Millennial cohort is comprised of everyone born in America between 1981 and 2000
(Howe & Strauss, 2000). The current study uses the birth years 1981 to 1996 to define the
Millennial cohort, due to using the GSS as the data source. This cohort has been labeled
Generation Y and Generation Next. The label of Millennial was coined by Howe and Strauss
because of this generation’s coming of age during the new millennium (Howe & Strauss, 2000).
Mitchell (2003) states that Millennials have a greater sense of racial diversity, and global
boundaries are more transparent due to travel migration and the inter connections fostered by
this generation. Millennials are optimistic about their economic outlook despite coming of age
in the midst of economic downturn (Taylor, 2014). One consensus about this generation is that
they are the generation of the technology age (Taylor, 2014; Howe and Strauss, 2000; Mitchell,
2003). Millennials have been slow to marry in comparison to their counterpart generations. In
2014, a Pew Research survey found that 26% of Millennials age 18 -32 were currently married.
Other generations percentages were much higher when they were in that age range (10%
higher for Gen X, 20% higher for Baby Boomers, and 30% higher for Silent Generation).
Cohabitation rates for Millennials are higher than those for Generation Xers when they were
age 18 – 29, in 2011 cohabitation rates were at 9.2% up from 5.8% in 1997 (Wang & Taylor,
2011).
17
Controls
Gender
Research on cohabitation as a substitute for marriage has a variety of different forms
(Clarkberg, 1999). One argument is that a shift toward secular individualism has reduced the
appeal of a permanent commitment, such as marriage (Thornton, Axinn, & Hill, 1992).
Following this thought, the view is that liberal gender role attitudes are making traditional
marriages less attractive to women (Clarkberg, Stolzenberg, & Waite, 1995). An economic
argument suggests that women’s rising employment provides them greater economic
independence, which in turn reduces the gains of marriage (Oppenheimer V. K., 2003). Early
literature suggests that the silent generation was the last generation to embrace “American
institutions” (Pennington-Gray & Lane, 2002). Those beliefs feed into the realities of traditional
gender roles and early marriage. Women in the silent generation were a part of the earliest
marrying and baby making generation in American history. Ultimately, 93% of the women of
the silent generation became mothers (Huyck, 2001). This lasted until the baby boomer cohort
came of age and the second wave of the woman’s movement took hold. The second wave of
the women’s movement concentrated on the options available to women to advance in
education and prosperous careers (Macunovich, 2000). During this time, cohabitation rates
began to rise. This research also examined the relationship between education levels for
women and marriage and cohabitation (Spanier, 1983). In 2009–2010, nearly three quarters of
women without a high school degree had cohabited, versus half of women with a college
degree (Manning, 2013). According to Bumpass & Sweet (1989), one of the most significant
18
increases in cohabitation was among women who had a high school degree. They reported a
100% increase in cohabitation experiences over a 23 year period. This finding was also
supported by Manning (2013). Hence, it is important to control for gender when examining
attitudes toward cohabitation.
Income
Research has shown a higher rate of cohabitation among working and lower
socioeconomic groups than among higher earning groups (Wilhelm, 1988). Examining the
differences in income levels and social class have been important for understanding differences
in family patterns in the United States (Smock & Gupta, 2002). Cohabitation has been a practice
by people of slightly lower socioeconomic status, usually measured in terms of educational
attainment or income (Bumpass & Lu, 1998). For some cohabiting couples, who are planning to
marry, one reason for cohabiting before marriage may well be the lack of sufficient economic
resources for marriage (Xie, Raymo, Goyette, & Thornton, 2003). Men who cohabitate are more
likely to have a lower wage than those who marry (Bumpass & Sweet, 1989).
Education
According to research in the 1980s, cohabitation has been a practice of those with less
education (Bumpass & Sweet, 1989). However, later studies produced a different outlook.
Laumann (1994) found that education had little to no effect on cohabitation. According to
Bumpass, Sweet, & Cherlin (1991) cohorts who were born between the 1920s and 1960s were
less likely to cohabitate with people of different educational levels than their own. Those
19
studies indicate that the effect of education is more ambiguous among older cohorts (Laumann,
1994). Another interesting finding is that the higher the education level of a person’s father,
the greater the odds of a cohabitation (Bumpass & Sweet, 1989). More recent studies have
produced similar results, for example, recent data show that the percentage of 19- to 44-year-
old women who have cohabited at some point is almost 60% among high school dropouts
versus 37% among college graduates (Bumpass & Lu, 1998). As a result, educational attainment
serves as a control variable.
Race and Ethnicity
Early studies on cohabitation gave little attention to race (Loomis & Landale, 1994).
Over the past 20 years, the numbers of individuals who have cohabited rose more quickly
among Whites and Hispanics 94% and 97% increases over time, respectively than among Blacks
67% increase over time (Bumpass & Sweet, 1989; Manning, 2013). This notion was somewhat
contradicted by another study that suggested Whites and Blacks had higher levels than Latinos.
In 1997 data showed that 45% of White and Black and 40% of Latino women ages 19-44 have
cohabited (Bumpass & Lu, 1998). While cohabitation rates were escalating marriage rates were
declining. Between the years of 1970 and 1998, White males age 25-29 had a 30% decrease in
marriage, while Black males in that same age bracket had a 50% decrease (Oppenheimer,
2003). Cohabitation was viewed as a stepping stone toward marriage for whites, unfortunately
that had not been the case for Blacks (Bumpass, Sweet, & Cherlin, 1991). In 2003, Oppenheimer
found that 32% of her White participants married after their cohabitation experiences versus
13% of the Black participants in her study. Due to higher levels of economic hardship, lead to

20
speculation as to the rise in cohabitation rates for Blacks and Latinos (Manning & Lichter, 1996).
A study by Landale & Forste (1991) revealed that Puerto Rican women living on the mainland
are more likely to enter cohabitation experiences instead of legal marriage. Another study
suggested that economic standing has an important impact in the decision to marry versus
cohabitate for Blacks rather than Whites (Bulcroft & Bulcroft, 1993). Although studies have
been done, there is a need for more research on the association among the effect of race,
ethnicity and cohabitation. (Landale & Forste, 1991).
Political Views
Cohabitation is an alternative to marriage that runs counter to conservative ideology.
Conservative ideology is generally centered on traditional family formation and traditional
gender roles. Cohabitants have been identified as persons who have a more liberal ideology-,
than their counterparts on this issue. Previous research also suggests that those who choose to
cohabitate practice more egalitarian family structures than non-cohabiters (Eggebeen, 2005).
Individuals who have a more conservative political ideology view relationships, sex, gender
roles, and marriage in a traditional sense (Lye & Waldron, 1997). These values have served as a
foundational basis around which many conservative candidates have formed a platform. These
platforms have been a sticking point for politicians that make “traditional family values” a
rallying cry in public statements to insight nostalgia for those who crave traditional family and
gender roles (Lye & Waldron, 1997). This study controls for political ideology in the analysis of
attitudes toward cohabitation.
21
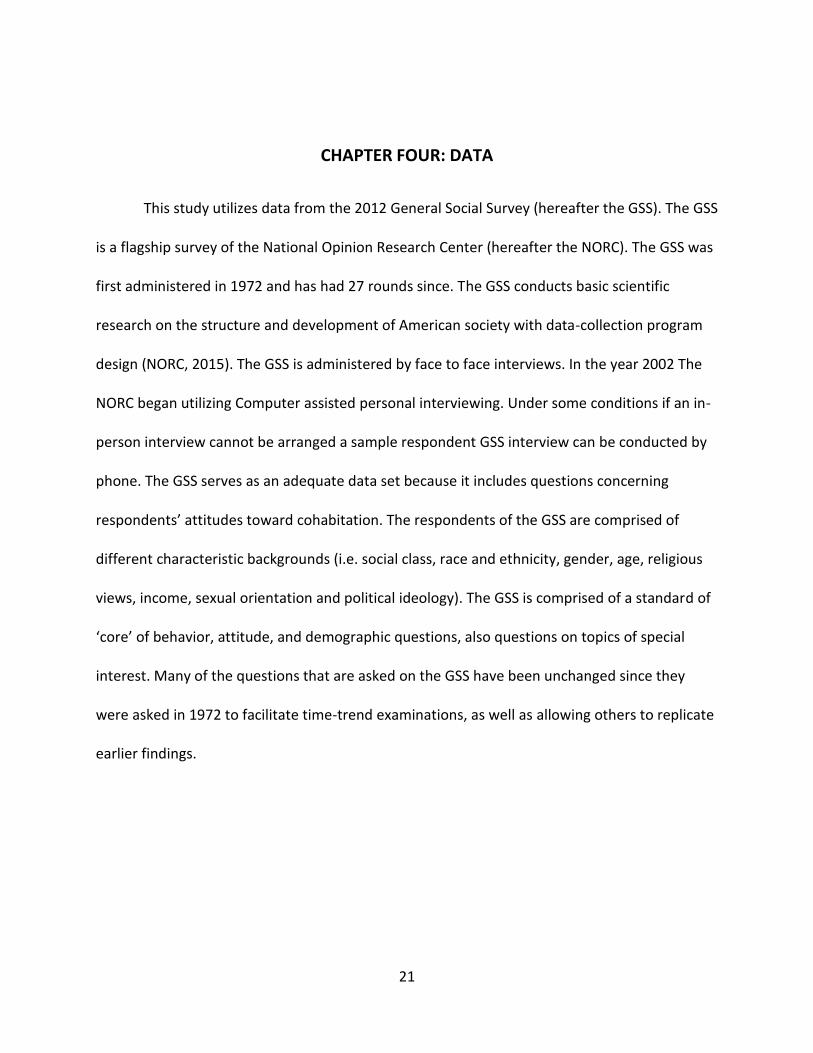
CHAPTER FOUR: DATA
This study utilizes data from the 2012 General Social Survey (hereafter the GSS). The GSS
is a flagship survey of the National Opinion Research Center (hereafter the NORC). The GSS was
first administered in 1972 and has had 27 rounds since. The GSS conducts basic scientific
research on the structure and development of American society with data-collection program
design (NORC, 2015). The GSS is administered by face to face interviews. In the year 2002 The
NORC began utilizing Computer assisted personal interviewing. Under some conditions if an in-
person interview cannot be arranged a sample respondent GSS interview can be conducted by
phone. The GSS serves as an adequate data set because it includes questions concerning
respondents’ attitudes toward cohabitation. The respondents of the GSS are comprised of
different characteristic backgrounds (i.e. social class, race and ethnicity, gender, age, religious
views, income, sexual orientation and political ideology). The GSS is comprised of a standard of
‘core’ of behavior, attitude, and demographic questions, also questions on topics of special
interest. Many of the questions that are asked on the GSS have been unchanged since they
were asked in 1972 to facilitate time-trend examinations, as well as allowing others to replicate
earlier findings.

22
Research Expectations
In sum, it is predicted that there will be significant differences in birth cohort attitudes
towards non-marital cohabitation. It is further expected that gender ideology, political ideology,
education, and income will vary in attitudes towards non-marital cohabitation. It is predicted
that life course indicators such as divorce, children living at home, and birth control will all have
an on attitudes toward non-marital cohabitation.
23
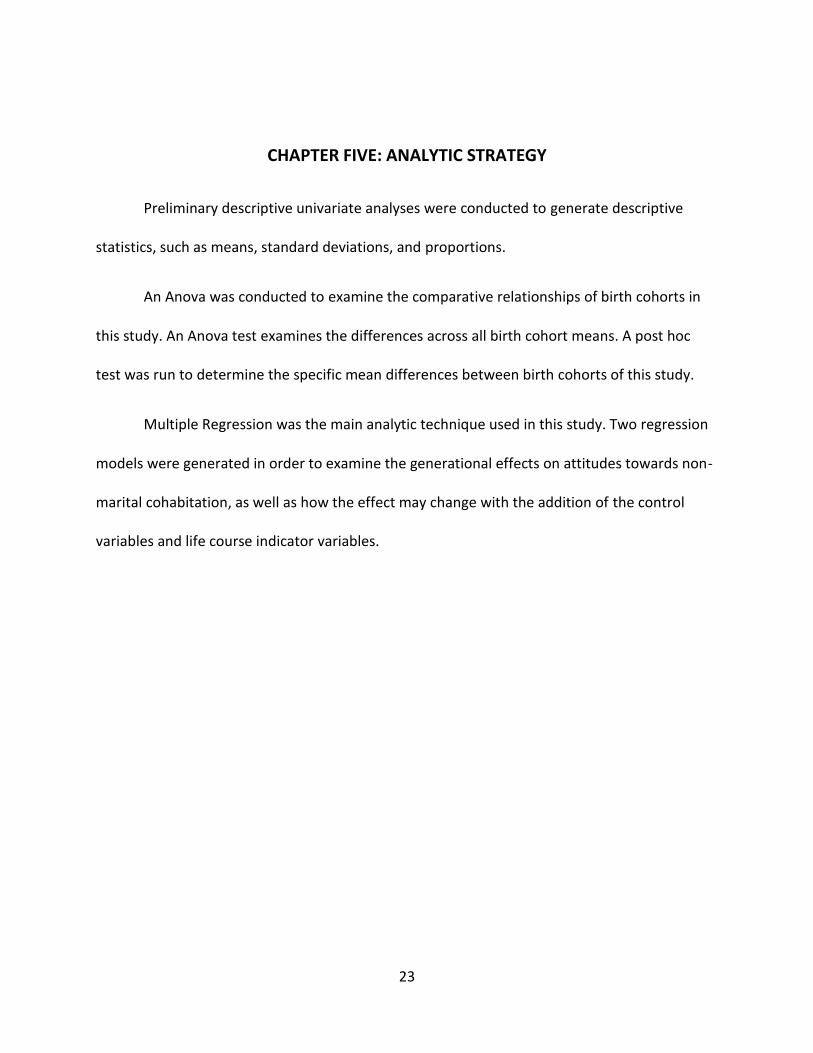
CHAPTER FIVE: ANALYTIC STRATEGY
Preliminary descriptive univariate analyses were conducted to generate descriptive
statistics, such as means, standard deviations, and proportions.
An Anova was conducted to examine the comparative relationships of birth cohorts in
this study. An Anova test examines the differences across all birth cohort means. A post hoc
test was run to determine the specific mean differences between birth cohorts of this study.
Multiple Regression was the main analytic technique used in this study. Two regression
models were generated in order to examine the generational effects on attitudes towards non-
marital cohabitation, as well as how the effect may change with the addition of the control
variables and life course indicator variables.

24
CHAPTER SIX: METHODS
Dependent Variable
Cohabitation
Attitudes toward cohabitation were measured using the following question on the 2012
GSS. “It is alright for a couple to live together without intending to get married.” The five
response categories were presented on a Likert scale ranging from strongly disagree to strongly
agree. The responses are coded (1) strongly disagree, (2) disagree, (3) neither agree nor
disagree, (4) agree, and (5) strongly agree. All other responses (i.e., don’t know and no answer)
are excluded from the analysis.
Independent Variables
Birth Cohort
For this study four major birth cohorts are used. As it is stated in the literature review
the silent generation is identified as all U.S. citizens who were born before 1945. The baby
boomer generation is comprised of all U.S. citizens born between the years of 1946 and 1964.
Generation X is identified as U.S. citizens who were born between 1965 and 1980. The
millennial cohort is identified as U.S. citizens who were born between 1981 and 1996. The GSS
ask what year the respondent was born in. The four birth cohorts identified are as follows: (1)
Birth years before 1946, (2) Birth years 1946-1964, (3) Birth Years 1965 - 1980, and (4) Birth
Years 1981 - 1996. Dummy variables are created with Baby Boomers (1946-1964) serving as the
reference category.
25
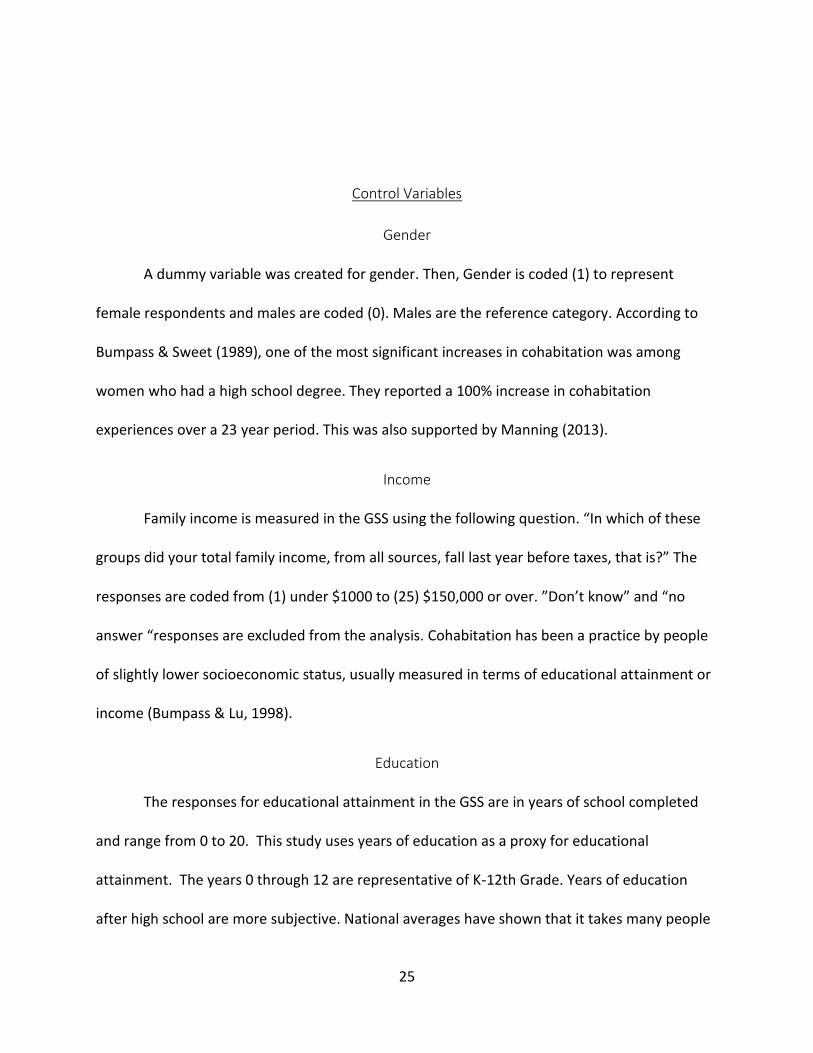
Control Variables
Gender
A dummy variable was created for gender. Then, Gender is coded (1) to represent
female respondents and males are coded (0). Males are the reference category. According to
Bumpass & Sweet (1989), one of the most significant increases in cohabitation was among
women who had a high school degree. They reported a 100% increase in cohabitation
experiences over a 23 year period. This was also supported by Manning (2013).
Income
Family income is measured in the GSS using the following question. “In which of these
groups did your total family income, from all sources, fall last year before taxes, that is?” The
responses are coded from (1) under $1000 to (25) $150,000 or over. ”Don’t know” and “no
answer “responses are excluded from the analysis. Cohabitation has been a practice by people
of slightly lower socioeconomic status, usually measured in terms of educational attainment or
income (Bumpass & Lu, 1998).
Education
The responses for educational attainment in the GSS are in years of school completed
and range from 0 to 20. This study uses years of education as a proxy for educational
attainment. The years 0 through 12 are representative of K-12th Grade. Years of education
after high school are more subjective. National averages have shown that it takes many people
26
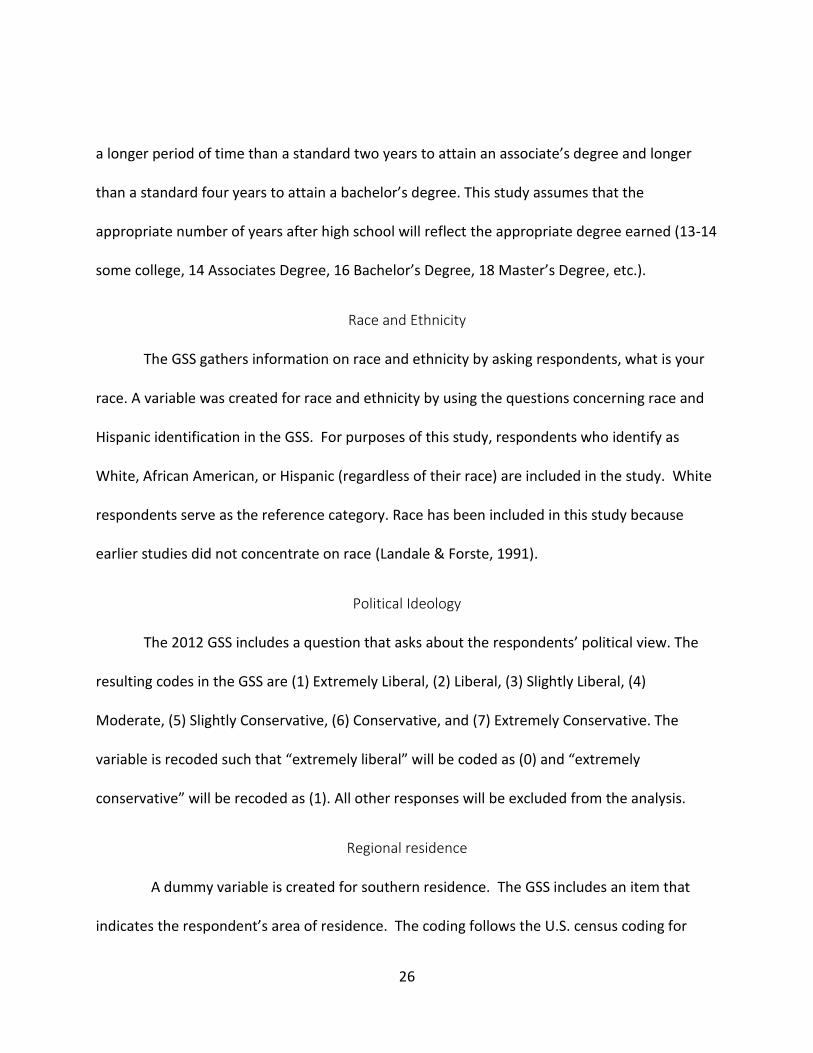
a longer period of time than a standard two years to attain an associate’s degree and longer
than a standard four years to attain a bachelor’s degree. This study assumes that the
appropriate number of years after high school will reflect the appropriate degree earned (13-14
some college, 14 Associates Degree, 16 Bachelor’s Degree, 18 Master’s Degree, etc.).
Race and Ethnicity
The GSS gathers information on race and ethnicity by asking respondents, what is your
race. A variable was created for race and ethnicity by using the questions concerning race and
Hispanic identification in the GSS. For purposes of this study, respondents who identify as
White, African American, or Hispanic (regardless of their race) are included in the study. White
respondents serve as the reference category. Race has been included in this study because
earlier studies did not concentrate on race (Landale & Forste, 1991).
Political Ideology
The 2012 GSS includes a question that asks about the respondents’ political view. The
resulting codes in the GSS are (1) Extremely Liberal, (2) Liberal, (3) Slightly Liberal, (4)
Moderate, (5) Slightly Conservative, (6) Conservative, and (7) Extremely Conservative. The
variable is recoded such that “extremely liberal” will be coded as (0) and “extremely
conservative” will be recoded as (1). All other responses will be excluded from the analysis.
Regional residence
A dummy variable is created for southern residence. The GSS includes an item that
indicates the respondent’s area of residence. The coding follows the U.S. census coding for
27
region. The resulting codes in the GSS are (1) New England, (2) Middle Atlantic, (3) East North
Central, (4) West North Central, (5) South Atlantic, (6) East South Central, (7) West South
Central, (8) Mountain, and (9) Pacific. A dummy variable is created using the South Atlantic,
East South Central, West South Central codes to represent the South (South = 1, all others = 0).
Life Course indicator Variables
Divorced
The following questions are used to create the dummy variable for whether the
respondent had ever been divorced. “Are you currently--married, widowed, divorced,
separated, or have you never been married? B. If currently married or widowed: Have you ever
been divorced or legally separated?” The responses are recoded as a dummy variable (1) yes (0)
no. ”Don’t know” and “no answer “responses will be excluded from the analysis.
Birth Control ok
The variable, pillok, is measured in the GSS using the following question “Do you
strongly agree, agree, disagree, or strongly disagree that methods of birth control should be
available to teenagers between the ages of 14 and 16 if their parents do not approve?” The
responses are recoded so that higher scores represent more agreement. The range is from (1)
strongly disagree to (4) strongly agree. ”Don’t know” and “no answer “responses will be
excluded from the analysis.
28
Ever Unemployed
The variable, unemp, is measured in the GSS using the following question “At any time
during the last ten years, have you been unemployed and looking for work for as long as a
month?” The responses are recoded as a dummy variable (1) yes (0) no. ”Don’t know” and “no
answer “responses will be excluded from the analysis.
Children Home
A dummy variable was created for respondents who have children living at home.
Kidshome is coded (0) to represent respondents with no children at home (1) for respondents
with children at home.
29
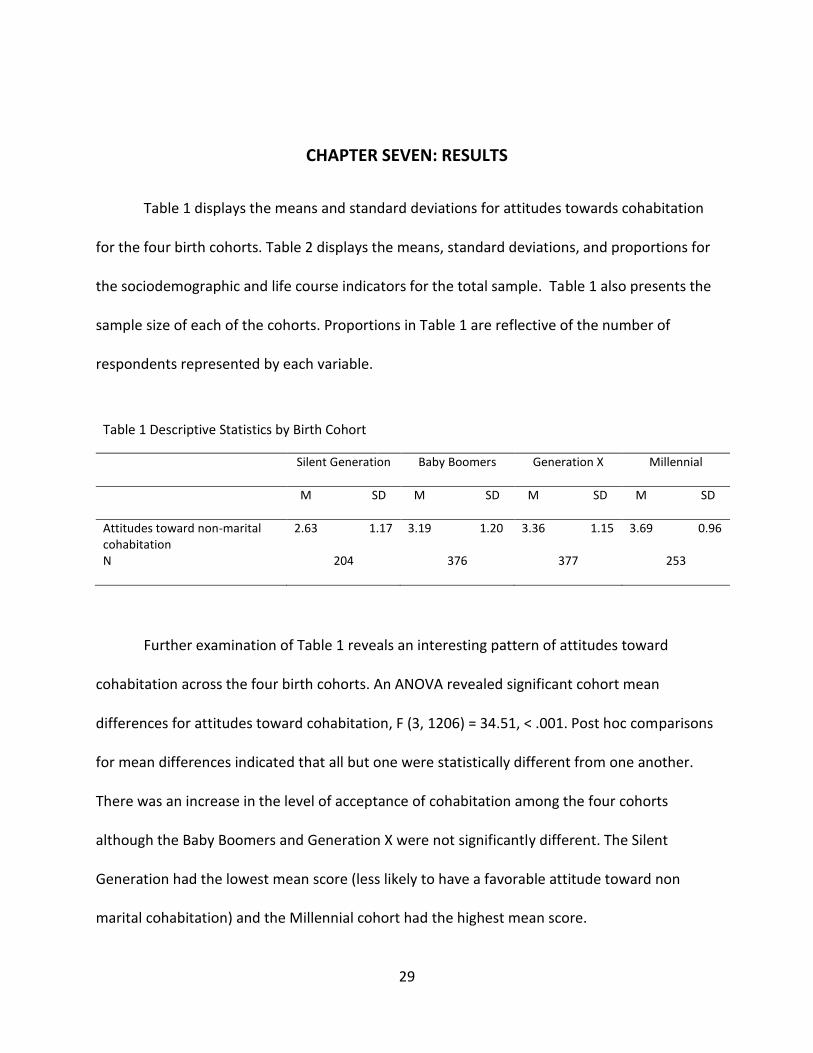
CHAPTER SEVEN: RESULTS
Table 1 displays the means and standard deviations for attitudes towards cohabitation
for the four birth cohorts. Table 2 displays the means, standard deviations, and proportions for
the sociodemographic and life course indicators for the total sample. Table 1 also presents the
sample size of each of the cohorts. Proportions in Table 1 are reflective of the number of
respondents represented by each variable.
Further examination of Table 1 reveals an interesting pattern of attitudes toward
cohabitation across the four birth cohorts. An ANOVA revealed significant cohort mean
differences for attitudes toward cohabitation, F (3, 1206) = 34.51, < .001. Post hoc comparisons
for mean differences indicated that all but one were statistically different from one another.
There was an increase in the level of acceptance of cohabitation among the four cohorts
although the Baby Boomers and Generation X were not significantly different. The Silent
Generation had the lowest mean score (less likely to have a favorable attitude toward non
marital cohabitation) and the Millennial cohort had the highest mean score.
Table 1 Descriptive Statistics by Birth Cohort
Silent Generation Baby Boomers Generation X Millennial
M SD M SD M SD M SD
Attitudes toward non-marital cohabitation
2.63 1.17 3.19 1.20 3.36 1.15 3.69 0.96
N 204 376 377 253
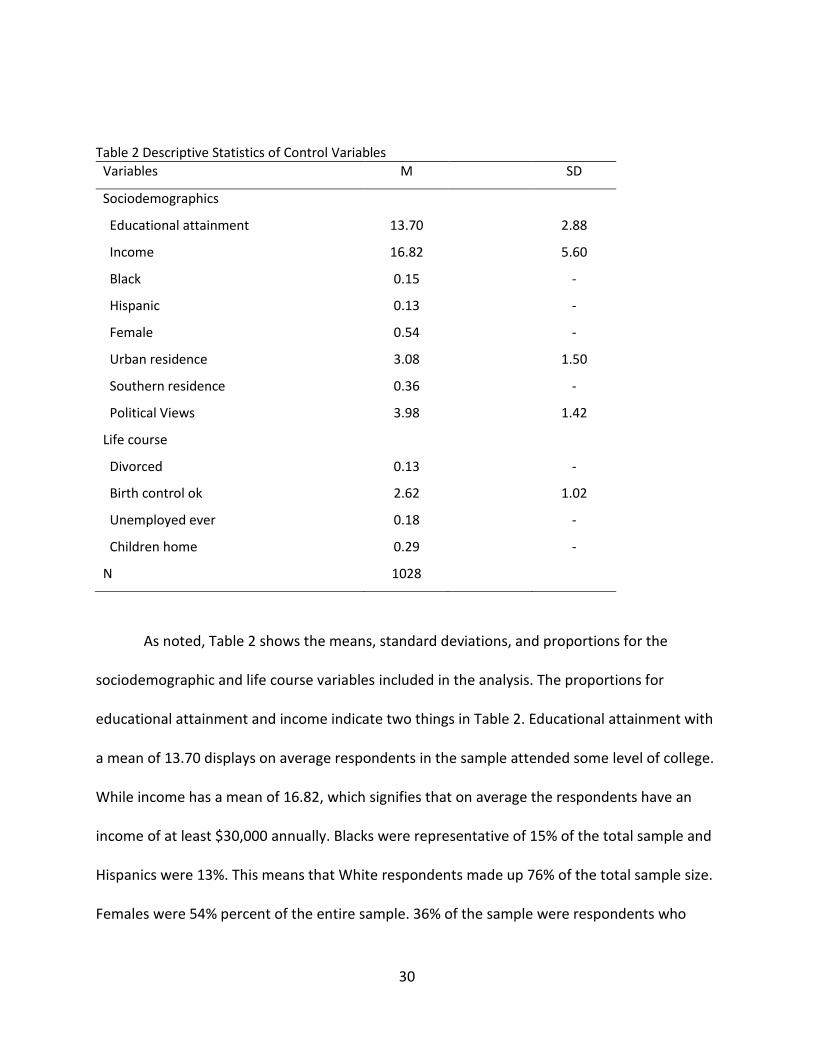
30
Table 2 Descriptive Statistics of Control Variables
Variables M SD
Sociodemographics
Educational attainment 13.70 2.88
Income 16.82 5.60
Black 0.15 -
Hispanic 0.13 -
Female 0.54 -
Urban residence 3.08 1.50
Southern residence 0.36 -
Political Views 3.98 1.42
Life course
Divorced 0.13 -
Birth control ok 2.62 1.02
Unemployed ever 0.18 -
Children home 0.29 -
N 1028
As noted, Table 2 shows the means, standard deviations, and proportions for the
sociodemographic and life course variables included in the analysis. The proportions for
educational attainment and income indicate two things in Table 2. Educational attainment with
a mean of 13.70 displays on average respondents in the sample attended some level of college.
While income has a mean of 16.82, which signifies that on average the respondents have an
income of at least $30,000 annually. Blacks were representative of 15% of the total sample and
Hispanics were 13%. This means that White respondents made up 76% of the total sample size.
Females were 54% percent of the entire sample. 36% of the sample were respondents who

31
resided in the south. Given the mean proportions for political views (M = 3.98, SD = 1.42) on
average respondents perceived themselves to be slightly liberal to moderate. Life Course
indicator variables in the sample show that 13% percent of the respondents had ever been
divorced. While 18% had experienced being unemployed at some point in their life. 29% of the
sample had children living at home currently. Table 2 is most interesting because on average
respondents were split between agreeing or disagreeing on whether birth control is ok for
teens.
Table 3 displays the results of the OLS regression. Two models are presented. Model 1
shows the results of the bivariate analysis, and Model 2 shows the multivariate analysis. The
analysis addresses the impact of birth cohort on attitudes toward non-marital cohabitation with
and without controls for life course indicators and sociodemographic variables. Model I shows
the regression coefficients for the Millennial cohort, Generation X, and the Silent Generation.
The Baby Boomer cohort served as the reference group for both Models I and II. The
coefficients for birth cohort in Table 3 represent mean differences in (Model I) and adjusted
mean differences in (Model II) between the three dummy variables of the Millennial cohort,
Generation X, the Silent Generation, and the Baby Boomer reference cohort.
32
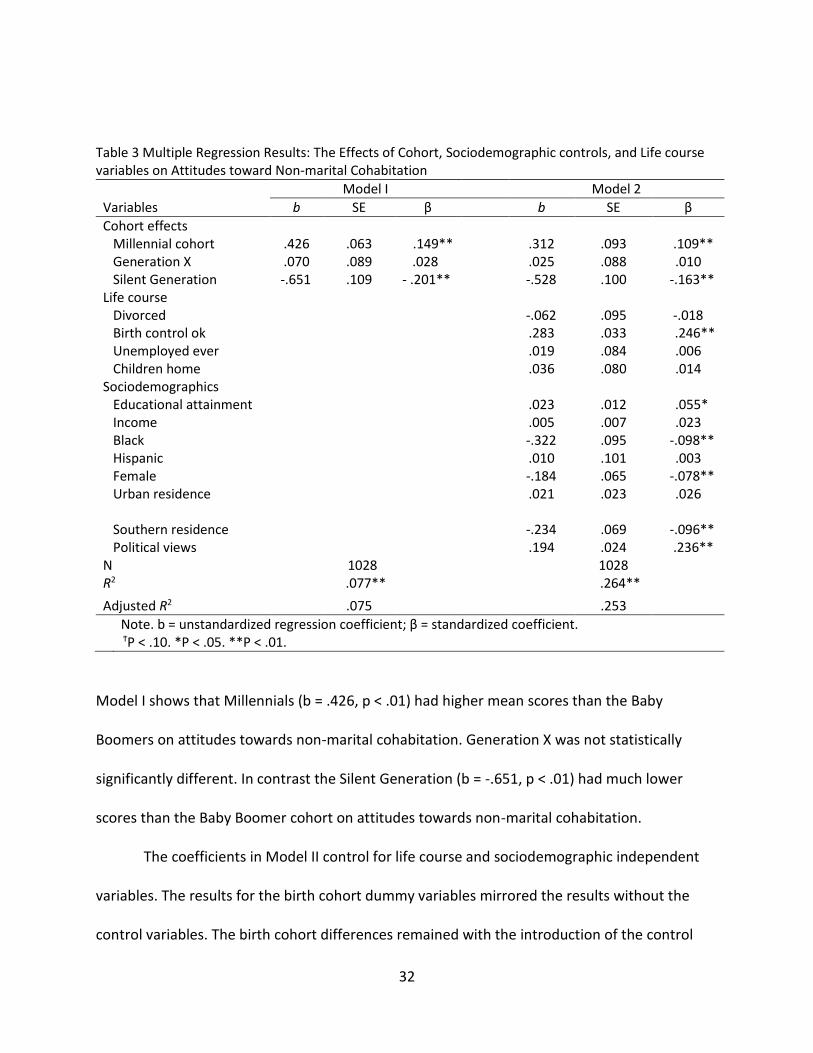
Table 3 Multiple Regression Results: The Effects of Cohort, Sociodemographic controls, and Life course variables on Attitudes toward Non-marital Cohabitation
Model I Model 2
Variables b SE β b SE β
Cohort effects Millennial cohort .426 .063 .149** .312 .093 .109** Generation X .070 .089 .028 .025 .088 .010 Silent Generation -.651 .109 - .201** -.528 .100 -.163** Life course Divorced -.062 .095 -.018 Birth control ok .283 .033 .246** Unemployed ever .019 .084 .006 Children home .036 .080 .014 Sociodemographics Educational attainment .023 .012 .055* Income .005 .007 .023 Black -.322 .095 -.098** Hispanic .010 .101 .003 Female -.184 .065 -.078** Urban residence .021 .023 .026
Southern residence -.234 .069 -.096** Political views .194 .024 .236** N 1028 1028 R2 .077** .264**
Adjusted R2 .075 .253
Note. b = unstandardized regression coefficient; β = standardized coefficient. ϮP < .10. *P < .05. **P < .01.
Model I shows that Millennials (b = .426, p < .01) had higher mean scores than the Baby
Boomers on attitudes towards non-marital cohabitation. Generation X was not statistically
significantly different. In contrast the Silent Generation (b = -.651, p < .01) had much lower
scores than the Baby Boomer cohort on attitudes towards non-marital cohabitation.
The coefficients in Model II control for life course and sociodemographic independent
variables. The results for the birth cohort dummy variables mirrored the results without the
control variables. The birth cohort differences remained with the introduction of the control

33
variables for life course and sociodemographics into the full model. The only significant finding
of the life course variables was that as agreement increases for availability of birth control,
attitudes toward cohabitation become more favorable (b = .283, p < .01).
Sociodemographic control variables displayed trends that were generally consistent
with existent literature. Females were less supportive than male respondents, those with more
liberal political views were more supportive, and Southerners were less supportive than
respondents from other parts of the country.
In addition Blacks (African Americans) were less supportive, and urban residence made
no difference. Those with higher levels of educational attainment were more supportive. This
analysis provided a baseline for cohort differences, and the impact of life course and other
determinants of attitudes towards non-marital cohabitation. All of the cohort differences
remained once the control variables were included in the analysis. This analysis extends existing
literature by analyzing birth cohort attitudes, and life course variables towards non-marital
cohabitation.
34
CHAPTER EIGHT: DISCUSSION
Issues related to romantic relationships will always be studied in society and this study is
able to point to some interesting trends. This study was able to examine attitudes towards non-
marital cohabitation by birth cohort, some determinants of attitudes towards non-marital
cohabitation, and compare the effects utilizing national data. As stated earlier in this study it
was predicted that there would be differences in birth cohort attitude towards non-marital
cohabitation. The results of this study confirm that there are generational differences in
attitudes towards non-marital cohabitation. Millennials are different from other generational
cohorts as they are more favorable of non-marital cohabitation. Table 1 suggest that
Generation X is different from the Silent Generation, although they do not differ a significant
amount from the reference group of the Baby Boomers. Table 2 also shows that those who
have divorced at some point in life are more likely to be less favorable of non-marital
cohabitation. This finding in the data is reflective of findings in previous literature.
The Findings of Table 3 bring are interesting and can spark insightful conversation. The
Baby Boomer cohort being the first group to be widely studied in the cohabitation phenomena
was the first generation to have birth control made available to them. This could have been a
possible reason to choose to cohabit versus marry. Then as Generation X became the age of
family formation Birth control was made more affordable. This would explain the drastic drop-
off in new births and another possible driving force in the choice to cohabitate versus marrying.
35
Also when looking at Table 3 and the sociodemographic and life course indicators
display interesting characteristics as well. For example previous literature stated how
cohabitation was a practice of those with less education. However, this study shows that the
more educated you are the more favorable you look upon non-marital cohabitation. The
prediction that education would have an impact on attitudes towards non-marital cohabitation
were correct. Gender was shown to vary in attitude in this study. Women are less supportive
than men towards non-marital cohabitation. This could be because as stated earlier there is
perceived economic gain in cohabitation for men versus women. With the rise for women in
higher levels of education and earning potential in careers there is less societal pressure to
marry or live with a man.
Finally, the findings that Blacks were less supportive, given what was stated earlier in
the literature review of this study was surprising, considering that earlier studies suggested that
Blacks more frequently participate in non-marital cohabitation experiences. Also, the fact that
urban residence had no statically significant findings on the issue was a surprise.
Limitations
First, this study utilizes a cross-sectional design, and it is somewhat limited as a result.
This study is not able to examine the birth cohorts when they were the same age (e.g., Baby
Boomers and Millennials when they were both in their thirties), this study could not be
conducted longitudinally. The researcher could not follow a cohort over time, and the data
were not available to assess period or time of measure effects. Therefore, a thorough
36
age/period/cohort research design could not be conducted. Nonetheless, the GSS data does
allow the opportunity to assess the relationship between birth cohort and sociodemographic
data and attitudes toward cohabitation. Second, this study was also limited in respect to life
course variables. While the GSS is a rich data source, it primarily examines attitudes of its
respondents and not behaviors. Third, this study was also limited in respect to race, this study
was limited to White respondents, African American or Black respondents, and Hispanic
respondents. Hence, there are a number of different racial and ethnic groups that are not part
of this analysis. Future research should examine comparisons using a more diverse data source.
Despite these limitations this study has important implications. There are differences
between the generations in this data set, specifically between the Millennials and the Silent
Generation. These differences show that not all generations have the same attitude towards
non-marital cohabitation. The significance of Gender, Race, Political Ideology, Residential
Location, and Marital Status (Ever Divorced) in Table 3 also show that different determinants
can affect variance in attitudes. This study (1) supports the theory that different life course and
generation events can affect attitudes toward non-marital cohabitation, and (2) serves as a step
in expanding the literature on Millennial relationships and familial formation.
37
REFERENCES
Bachrach, C. A. (1987). Cohabitation and Reproductive Behavior in the U.S. Demography, 623-
637.
Bulcroft, R. A., & Bulcroft, K. A. (1993). Race Differences in Attitudinal and Motivational Factors
in the Decision to Marry. Journal of Marriage and Family, 338-355.
Bumpass, L. L., & Sweet, J. A. (1989). National estimates of cohabitation. Demography, 289-313.
Bumpass, L. L., Sweet, J. A., & Cherlin, A. (1991). The Role of Cohabitation in Declining Rates of
Marriage. Journal of Marriage and Family, 913-927.
Bumpass, L., & Lu, H.-H. (2000). Trends in Cohabitation and Implications for Children's Family
Contexts in the United States. Population Studies, 29-41.
Casper, L. M., & Cohen, P. N. (2000). How does POSSLQ measure up? Historical estimates of
cohabitation. Demography, 237-245.
Cherlin, A. J. (2010). The marriage-go-round: the state of marriage and family in America. New
York: Vintage.
Clayton, R. R., & Voss, H. L. (1977). Shacking up: Cohabitation in the 1970s. Journal of Marriage
and Family, 273-283.
Coupland, D. (1991). Generation X: Tales for an accelerated culture. New York: McMillian.
38
Duvander, A.-Z. E. (1999). The Transition From Cohabitation to Marriage: A Longitudinal Study
of the Propensity to Marry in Sweden in the Early 1990s. Journal of Family issues, 698-
717.
Eggebeen, D. J. (2005). Cohabitation and exchange of support. Social Forces, 1097-1110.
Elder Jr, G. H. (1985). Perspectives on the life course. In Life Course Dynamics: Trajectories and
Transitions 1960-1980 (pp. 23-49). Ithica, NY: Cornell University Press.
Elder, G. H. (1994). Time, Human Agency, and Social Change: Perspectives on the Life Course.
Social Psychology Quarterly, 4-15.
Fry, R., & Cohn, D. (2011). Prevalence and Growth of Cohabitation. Washington, DC: Pew
research Center.
Garza, S. C. (2005). Common Law Marriage: A Proposal for the Revival of a Dying Doctrine. New
Eng Law Review, 541.
Glick, P. C., & Norton, A. J. (1977). Marrying, divorcing, and living together in the US today. .
Population Bulletin, 5.
Guzzo, K. B. (2006). The relationship between life course events and union formation . Social
Science Research, 384-408.
Hareven, T. (1994). Aging and Generational Relations: A Historical and Life Course Perspective.
Annual Review of Sociology, 437-461.
39
Hareven, T. K., & Masaoka, K. (1988). TURNING POINTS AND TRANSITIONS: PERCEPTIONS OF
THE LIFE COURSE. Journal of Family History, 271-289.
Howe, N., & Strauss, W. (2000). Millennials Rising the next great generation. New York: Vintage
Books.
Landale, N. S., & Forste, R. (1991). Patterns of Entry into Cohabitation and Marriage Among
Mainland Puerto Rican Women. Demography, 587-607.
Loomis, L. S., & Landale, N. S. (1994). Nonmarital Cohabitation and Childbearing among Black
and White American Women. Journal of Marriage and Family, 949-962.
Lye, D. N., & Waldron, I. (1997). Attitudes toward cohabitation, family, and gender roles:
relationships to values and political ideology. Sociological Perspectives, 199-225.
Macunovich, D. J. (2000). The Baby Boomers. In Encyclopedia of Aging. New York.
Mannheim, K. (1952). The Problem of Generations. In Essays on the Sociology of Knowledge
(pp. 276-322). Oxford university Press.
Manning, W. D., & Lichter, D. T. (1996). Parental Cohabitation and Children's Economic Well-
Being. Journal of Marriage and Family, 998-1010.
McAdam, D. (1999). The biographical impact of activism. In How Social Movements Matter (pp.
119-146). Minneapolis: University of Minesota Press.
40
(2014). Millennials in Adulthood: Detached from Institutions, Networked with Friends. Pew
Research Center.
Mitchell, S. (2003). American Generations Who they are, How they live, What they think . Ithaca:
New Stategist.
Neugerten, B. L., & Datan, N. (1996). The Meanings of Age: Selected Papers. Chicago: University
of Chicago Press.
Newcomb, P. R. (1979). Cohabitation in America: An Assessment of Consequences. Journal of
Marriage and Family, 597-603.
Oppenheimer, V. K. (2003). Cohabiting and marriage during young men’s career-development
process. Demography, 127-149.
Pennington-Gray, L., & Lane, C. W. (2002). Profiling the Silent Generation. Journal of Hospitality
& Leisure Marketing, 73-95.
Riley, M. W. (1978). Aging, Social Change, and the Power of Ideas. Daedalus, 39-52.
Riley, M. W., & Riley Jr, J. W. (1996). Generational relations: A future perspective. Aging and
Generational Relations: Life-course and Cross-cultural perspectives.
Ryder, N. B. (1965). The Cohort as a Concept in the Study of Social Change. American
Sociological Review, 843-861.
41
Smock, P. J. (2000). Cohabitation in the United States: An Appraisal of Research Themes,
Findings, and Implications. Annual Review of Sociology, 1-20.
Smock, P. J., Manning, W. D., & Porter, M. (2005). Everything's there except money: How
money shapes decisions to marry among cohabitors. Journal of Marriage and Family ,
680-696.
Strauss, W., & Howe, N. (1991). Generations: The History of America's future. New York: Quill.
Tanfer, K. (1987). Patterns of Premarital Cohabitation among Never-Married Women in the
United States. Journal of Marriage and Family, 483-497.
Taylor, P. (2014). The Next America and the Looming Generational Showdown. New York: Public
Affairs.
Taylor, P., & Keeter, S. (2011). The generation Gap and the 2012 Election. Washington D.C.: Pew
Research Center.
Thorton, A. (1988). Cohabitation and Marriage in the 1980s. Demography, 497-508.
Trost, J. (1978). A renewed social institution: Non-marital Cohabitation. Acta Sociologica.
Wang, W., & Taylor, P. (2011). For Millennials, Parenthood Trumps Marriage. Pew research
Center.
Whalen, J., & Flacks, R. (1989). Beyond the barricades: The sixties generation grows up.
Philadelphia, PA: Temple University Press.
42
Wilhelm, B. (1988). Changes in Cohabitation across Cohorts: The Influence of Political Activism.
Social Forces, 289-310.
Williams, A., Coupland, J., Folwell, A., & Sparks, L. (1997). Talking about Generation X Defining
Them as They Define Themselves. Journal of Language and Social Psychology, 251-277.