authors: dries bonte1,2, kjell lanckacker1, elisabeth
TRANSCRIPT

1
Web building flexibility of an orb-web spider in a heterogeneous agricultural landscape 1
2
3
Authors: Dries Bonte1,2, Kjell Lanckacker1, Elisabeth Wiersma1 & Luc Lens1 4
5
Affiliations : 6
(1) Ghent University, Dep. Biology, Terrestrial Ecology Unit, K.L. Ledeganckstraat 35, B-9000 7
Ghent, Belgium 8
(2) Würzburg University, Field Station Fabrikschleichach, Glashüttenstrasse 5, DE-96181 9
Rauhenebrach, Germany 10
11
Corresponding author : Dr. Dries Bonte, Ghent University, Dep. Biology, Terrestrial Ecology 12
Unit, K.L. Ledeganckstraat 35, B-9000 Ghent, Belgium. Email: [email protected]; tel: 0032 13
9 264 52 56 14
15
Email co-authors: [email protected]; [email protected]; 16
18
Running title: landscape context of web building 19
20

2
Abstract: 1
Intensification of land-use in agricultural landscapes is responsible for a decline of biodiversity 2
which provide important ecosystem services like pest-control. Changes in landscape composition 3
may also induce behavioural changes of predators in response to variation in the biotic or abiotic 4
environment. By controlling for environmentally confounding factors, we here demonstrate that 5
the orb web spider Araneus diadematus alters its web building behaviour in response to changes 6
in the composition of agricultural landscapes. Thereby, the species increases its foraging 7
efficiency (i.e., investments in silk and web asymmetry) with an increase of agricultural land-use 8
at intermediate spatial scales. This intensification is also related to a decrease in the abundance of 9
larger prey. A negative effect of landscape properties at similar spatial scales on spider fitness 10
was recorded when controlling for relative investments in capture thread length. This study 11
consequently documents the web building flexibility in response to changes in landscape 12
composition, possibly due to changes in prey availability. 13
14
15
16
Key-words: Araneus diadematus, Araneidae, behavioural flexibility, orb web geometry, 17
landscape, model selection, semi-natural habitats 18
19
20
3
Introduction 1
2
In agricultural landscapes, post-war transformation of traditional to modern, high-intensity land-3
use systems in simplified landscapes involves the conversion of perennial habitats to ephemeral 4
arable fields, the destruction of biologically valuable edge habitats, an increasing input of mineral 5
fertilizers and increased use of pesticides. Both land-use (e.g. organic versus intensive farming) 6
and the accompanying scale of landscape conversion (e.g. diversity and landscape configuration 7
of natural habitats) affect biodiversity and the structure of biological communities associated with 8
crops in a mutually non-exclusive way (Tscharntke et al. 2005). In general, arthropod diversity is 9
higher in heterogeneous landscapes (e.g. Östman et al 2001; Rundlof & Smith 2006; Clough et al. 10
2007), especially if it is dominated by generalist species (Batáry et al. 2007). These patterns are 11
mechanistically maintained by enhanced colonization of species that refuge in non-crop habitats 12
(Kremen et al. 2007). Because of strong interspecific variation in dispersal capacity (e.g. Bonte et 13
al. 2003, 2004, Dauber et al. 2005) and subsequent altered colonization probabilities under 14
various scales of landscape heterogeneity (Steffan-Dewenter et al. 2002, Schmidt & Tscharntke 15
2005, Schmidt et al. 2008), a higher arthropod diversity and density is maintained in crops 16
situated in small-scale heterogeneous agricultural landscapes. This is especially true for large, 17
flying arthropods (Beintema et al. 1991; Hendrickx et al. 2007), which are essential prey for orb-18
web spiders (Venner & Casas 2005). 19
20
The design of the orb-web is extremely plastic in response to environmental and physiological 21
variables (Uetz 1992, Sherman 1994, Vollrath et al. 1997), with documented increases in capture 22
area in response to a shortage of prey (Witt 1963, Herberstein et al. 2000) or changes in prey size 23
(Sandoval 1994; Schneider & Vollrath 1998). More-over, asymmetrical webs with a significant 24

4
up/down asymmetry confer to a relatively higher foraging value to sections below the resting 1
place of the spider, central in the web (the hub), because spiders run down faster than up (Rhisiart 2
& Vollrath, 1994). Similarly, prey in the lower half of the web is more quickly detected 3
(Landolfa & Barth 1996), thereby increasing prey-handling efficiency. Consequently, web 4
building in orb-web spiders provides a unique tool to study behavioural flexibility because it 5
allows the quantification of foraging by measuring the investments in web building (Uetz 1992). 6
Changes in web area, number, density of spirals and capture thread length comprise functional 7
responses towards higher prey capture; changes in web asymmetry a response towards prey 8
handling efficiency (Heiling & Herberstein 2000). 9
10
Because (i) previous empirical work has provided evidence of functional behavioural responses 11
in relation to prey limitation and (ii) because changes in land-use are known to induce changes in 12
prey availability, we hypothesised higher investments in web-building through increased 13
asymmetry in intensively used (homogeneous) crop landscapes where essential prey are limited. 14
We additionally inferred the spatial scale at which changes in behaviour are prevalent and 15
questioned whether changes in behaviour are accompanied by changes in fitness costs. 16
17

5
Material and Methods 1
2
Model species 3
Araneus diadematus is a native species from the Palaearctic and Nearctic region. The species 4
mostly lives in shrub or tree dominated habitats (Dahl 1931; Hänggi et al. 1995) where plenty of 5
attachment sites for the scaffolding of the orb-web are available. The female is the largest sex and 6
reaches a length of 10 to 18 mm (Roberts 1995). Adulthood is reached in late-summer-autumn 7
and the female dies a few days after the deposition of the eggsacs (Dahl 1931). Offspring emerge 8
in spring, disperse through ballooning and settle in a new location till adulthood (Foelix 1982; 9
Preston-Mathan & Preston-Mathan 1996). The web consists of energetic-costly proteins and is 10
therefore recycled (eaten) every day (Sherman 1994). The species’ web design variability and 11
functionality is well documented (e.g. Witt 1963, Vollrath 1986, Rhisisart & Vollrath 1994, 12
Vollrath et al. 1997, Schneider & Vollrath 1998; Zschokke 2002). In agricultural landscapes, 13
webs are preferentially located in trees in field margins (Dahl 1931; Ludy 2007). Its prey-14
spectrum on field margins is dominated by larger Diptera (Ludy 2007 and references here-in). 15
Herbivorous pest species like Sternorrhyncha including aphids are also caught in large numbers 16
(Ludy 2007). 17
18
Assessment of prey availability: 19
Prey abundance in relation to landscape composition was independently assessed with 37 white-20
colored pan traps that were located randomly within the landscape. Diameter of the traps was 5 21
cm and filled with a formaldehyde-water-detergent fixative. All traps were placed at a height 1.2-22
1.5 meter above the ground surface and attached on solitary trees. By using these traps, we are 23
able to assess activity pattern of flying arthropods that are the main prey for A. diadematus in 24

6
agricultural landscapes (Diptera; Ludy 2007). Although these traps consist of an activity-based 1
sampling methodology, activity levels reflect patterns in abundance (Saint-Germain et al. 2007). 2
Traps were operational from September 20th till October 15th. The numbers of prey were counted 3
in the lab and their size was approximated by measuring body length and body width (Sample et 4
al. 1993). 5
6
Assessment of web building behaviour and fecundity 7
A total of 155 female A. diadematus were located in solitary trees in September-November 2006 8
during 21 days within a heterogeneous agricultural landscape in the proximity of Ghent (see 9
further). Of each individual web, we measured the following web geometrical features: web and 10
capture area width (geometrical radius in 4 sectors), number of sticky spirals (sensu Zschokke 11
1999) counted along a primary radius (i.e. a radial thread; Zschokke 1999) in the capture area, 12
web orientation, web inclination and web height. Distance to the nearest vegetation was measured 13
as the closed distance to plant branches perpendicular to the web. Hub diameter and the hub 14
spiral density were measured because they may, like special web decorations, reduce predation 15
risk due to a decreased visibility towards predators or attract potential prey (Herberstein et al. 16
2000). From these, we calculated web asymmetry (lower vertical web geometrical radius minus 17
upper vertical geometrical radius) and the total capture thread length 18
19
))((16 .... hihovivohv DDDDNNCTL ++++=π (eq.1) 20
21
according to Venner et al. (2001). Here N depict the number of vertical (Nv) and horizontal (Nh) 22
sticky spirals as counted along respectively the vertical and horizontal primary radii, while Do 23

7
and Di denote respectively the outermost (from one outermost spiral to the opposite outermost 1
spiral) and innermost (corresponding to the free zone around the hub without spiral turns) 2
diameter of the capture area (for horizontal and vertical positions). Because web-building appears 3
to be plastic in response to daily changes in meteorological conditions, the species’ phenological 4
state and the size of the spider (e.g. Vollrath et al. 1997), on average 7.8 occupied webs (by 5
female spiders) were randomly located within the entire region at the same day. We measured 6
web design parameters in situ; cephalothorax width of the collected spider (preserved in 80% 7
ethanol) was measured under a binocular microscope as a surrogate for body size. Size and the 8
number of eggs were assessed after dissection of the abdomen. Total reproductive output was 9
calculated as total number of eggs x average egg size. For spiders collected in the period prior to 10
their eggsac deposition, no eggs could be counted or measured because they were completely 11
imbedded in abdominal tissues. 12
13
Landscape composition 14
The study area was situated in the alluvial planes of the river Scheldt near Ghent (Belgium). It is 15
a heterogeneous landscape, consisting of intensively used agricultural fields and biologically 16
valuable habitats like marshes, elder bush and hayfields. All fields were conventionally treated 17
with herbicides, fungicides, insecticides and fertilizers in summer. Cattle on intensively used 18
pastures were treated with ivermectin, which is known to have a lethal effect on coprophilic 19
arthropods (Madsen et al. 1990). The study site is approximately 12 km², which is within the 20
range of the species’ dispersal capacity through ballooning (Johannesen & Toft 2002, Thomas et 21
al. 2003), consequently assuring sufficient gene mixing and the presence of a panmictic 22
population (Johannesen & Toft 2002). Web-design properties, body size and fecundity were 23
related to landscape composition (proportion of specific habitat types) at five landscape scales 24

8
with radii 25, 50, 100, 250 and 500 meters around each target individual. As prey are known to 1
be negatively affected by the amount of intensively used agricultural area (being maize and 2
winter wheat crops and heavily fertilized pastures in the study area) and positively affected by the 3
amount of biologically valuable habitat (flower rich pastures, hedges, forests and marshes) (e.g. 4
reviews in Vickery et al. 2001; Tscharntke et al. 2005), we calculated the percentage of crops, 5
intensively grazed pastures and biologically valuable habitat (here-after abbreviated as BVH) 6
from recent digital biological value maps (De Saeger et al. 2006) within the predefined radii 7
around the position of each focal spider. 8
9
As in other methodologically similar studies (Steffan-Dewenter et al. 2002; Schmidt et al. 2008), 10
landscape properties within the distinguished radii were highly intercorrelated. The within-11
habitat-type correlations between the smallest and the largest scale had coefficients between r = 12
0.51 (% pastures) and r = 0.63 (% BVH). The intercorrelation between different habitat types 13
within predefined radii was significantly negative (r ranging from -0.14 (% BVH – pastures at the 14
25 meter scale) to -0.66 (% crops – pastures at the 250 meter scale)). Intercorrelations between 15
the total amount of BVH and the total amount of arable (intensively managed pastures + crops) 16
habitat showed the strongest correlation (r between -0.75 to -0.87). The area of intensively used 17
crops and BVH ranged from 0-100%, with median values 48 - 69% for crops and 15-20.5 for 18
BVH. 19
20
21

9
Statistical analysis and inference 1
2
Prey availability 3
Number of prey items in relation to the amount of biologically valuable habitat was tested by 4
Poisson-regression (Proc Glimmix, SAS). We tested the size distribution of prey in relation to 5
landscape properties by univariate null models (EcoSim 6.0; Gotelli & Entsminger 2006). By 6
means of this randomization technique, expected patterns with respect to slope of the regression 7
(more large prey with increased amount of natural habitat), shape (points are concentrated in a 8
defined left triangle with increased amount of natural habitat), an the possible presence of an 9
ecological boundary (right-upper corner of the bivariate plot prey size-amount of natural habitat 10
is unusually empty) were tested against the null hypothesis that the observed pattern makes part 11
of a random ordering of the measurements. The observed pattern was compared to the null model 12
by generating 1000 randomizations by reshuffling the observed x and y variables. 13
14
Web building behaviour and fecundity 15
General model structure 16
Linear models were run for web building and fecundity measurements in relation to the 17
proportion of BVH within each of the five predefined radii around the located web as main fixed 18
effect. Because we conducted five analyses simultaneously to infer (instead of testing multiple 19
null-hypotheses; Johnson & Omland 2004) how and on which spatial scale behaviour and 20
fecundity were influenced by landscape composition, we used Akaike-criteria (with corrections 21
for small sample sizes; AICc Burnham & Anderson 1998) for linear models to assess the 22
reliability of the different competing models. We subtracted the minimum AICc-value from each 23
AICc-value and rescaled the resulting values ΔI such that ΔI=0 for the model with minimal AICC. 24

10
Rules of thumb, provided by Burnham & Anderson (1998) suggest that models with ΔI > 7 1
strongly support the model with the smallest ΔI, models with 2 < ΔI < 5 sufficiently support the 2
model with the smallest ΔI and those with ΔI < 2 do not support one single model at all. All 3
analyses were conducted with SAS (proc glm, proc glimmix). 4
5
Model structure for web building behaviour 6
Capture area radius (only lower radius length was analysed due to strong intercorrelation), hub 7
diameter, web location height, distance to the vegetation, inclination, web asymmetry (radius 8
above minus radius under) and capture thread length measurements were analyzed by linear 9
models. Numbers of spirals in the hub and capture area were analyzed with generalized Poisson 10
models, which were corrected for overdispersion. Spiral density within the hub and the capture 11
are was tested by including their width (respectively radius and diameter) as a covariate. 12
Body size, date and meteorological conditions (wind velocity, aerial humidity, precipitation and 13
average temperature the day before sampling) were included as covariates in the full model. 14
Because temperature and date showed negative colinearity (r=-0,45; N=20; p=0,044), we 15
retained the latter in the analysis because Sherman (1994) and Vollrath et al. (1997) showed that 16
phenology (state of fecundity) had larger impacts on web-building behaviour than small changes 17
in temperature. Since covariation of precipitation, aerial humidity and wind velocity were not 18
significant in any model (see results), we retained only body size and date as covariates in the 19
reduced models for different web size traits, web asymmetry and capture thread length. 20
21
Model structure for fecundity 22
Because all fecundity measurements showed a positive relationship with body size, the latter was 23
retained as covariate within all analyses. As for web building traits, linear regressions were 24

11
applied for egg size, clutch size and total reproductive output in relation to the proportion of 1
BVH within the predefined radii. 2
3
4
Results 5
Prey availability 6
Total numbers of prey did not show any relationships with landscape properties at any scale (all 7
F1,36 < 2.11; P>0.05). Prey size, however, showed significant distributional patterns according to 8
the amount of biologically valuable habitat. The regression of the slope was significantly higher 9
than after randomization for the data points at the scales between 25-250 meters (BVH 250 10
meters: observed slope=0.173; expected slope after randomization=0.000). Data points were also 11
significantly distributed in the right triangle at these scales, but boundary effects were only 12
observed at the scale of 250 meters (Table 1). As depicted from Fig. 1, large prey appears to lack 13
from samples which were located in landscapes with biologically valuable habitat beneath 40 14
percent in the 250 meter radius. 15
16
Web building properties 17
18
Covariation among factors 19
The radius of the lower capture area was significantly related to date of sampling (β=-0.110 ± 20
0.003 SE; F1,151=14.28; P=0.0002) and with body size (β=0.659 ± 0.367 SE; F1,151=3.22; 21
P=0.075). The number of spiral threads in the capture area was positively related (β=0.038 ± 22
0.003 SE; F1,152=125.22; P<0.0001) with the radius of the capture area (slope estimates and 23
statistics are average responses for the four web sectors). Capture thread length was positively 24

12
related with body size (β=371.60 ± 115.26 SE; F1,151=10.39; P=0.0015) and negatively with date 1
(β=-32.318 ± 4.76 SE ; F1,150=22.69; P<0.0001). Web asymmetry only showed positive 2
covariation with web diameter (β=0.401 ± 0.06 SE ; F1,151=37.91; P<0.0001). 3
Similar patterns for the number of spiral threads in the hub were found in relation to its diameter 4
(β=0.10 ± 0.02 SE ; F1,150=29.71; P<0.0001), but significant covariation with date was 5
additionally found (β=-0.005 ± 0.001 SE; F1,150=14.52; P=0.0002). The diameter itself showed 6
strong covariation with body size (β=0.351 ± 0.069 SE; F1,151=25.35; P<0.0001), but a positive 7
relationship with sampling date was retrieved for the latter (β=0.021 ± 0.005 SE; F1,151=15.07; 8
P=0.0002). No covariation of precipitation (F1,150<0.01; p<0.92), aerial humidity (F1,151<0.05 9
p<0.82) and wind velocity (F1,149<1.41; p<0.22) were found for any factor. 10
11
Effects of landscape composition on web design at different spatial scales 12
After controlling for above mentioned covariation, negative effects of the proportion of BVH 13
were found for the number of spirals and the geometrical radius of the lower web capture area 14
(Table 2). These effects were significant at the spatial scale of 100 and 250 meters for the number 15
of spirals and at the spatial scale of 25 and 250 meters for capture area radius. Models at these 16
spatial scales are equally reliable according to Akaike criteria (ΔI < 2). No effects for capture area 17
spiral density were found (all F1,152-values < 3.43, P>0.05). 18
Accordingly, similar negative additive effects of the amount of surrounding BVH were observed 19
for capture thread length (controlled for body size; Fig. 2). These effects appeared only 20
significant for the proportion of BVH within 100 and 250 m around each target web, and nearly 21
significant within 25 and 50 m (Table 2). AICc-values were not sufficiently different to 22
distinguish between effects at 25-250m. The model was less reliable (ΔI > 2; P>0.3) at the spatial 23
scale of 500 meter. No effects for the proportion of BVH at any of the considered scales were 24

13
found for height of the web, distance to the nearest vegetation and web inclination (F1,152 ranges 1
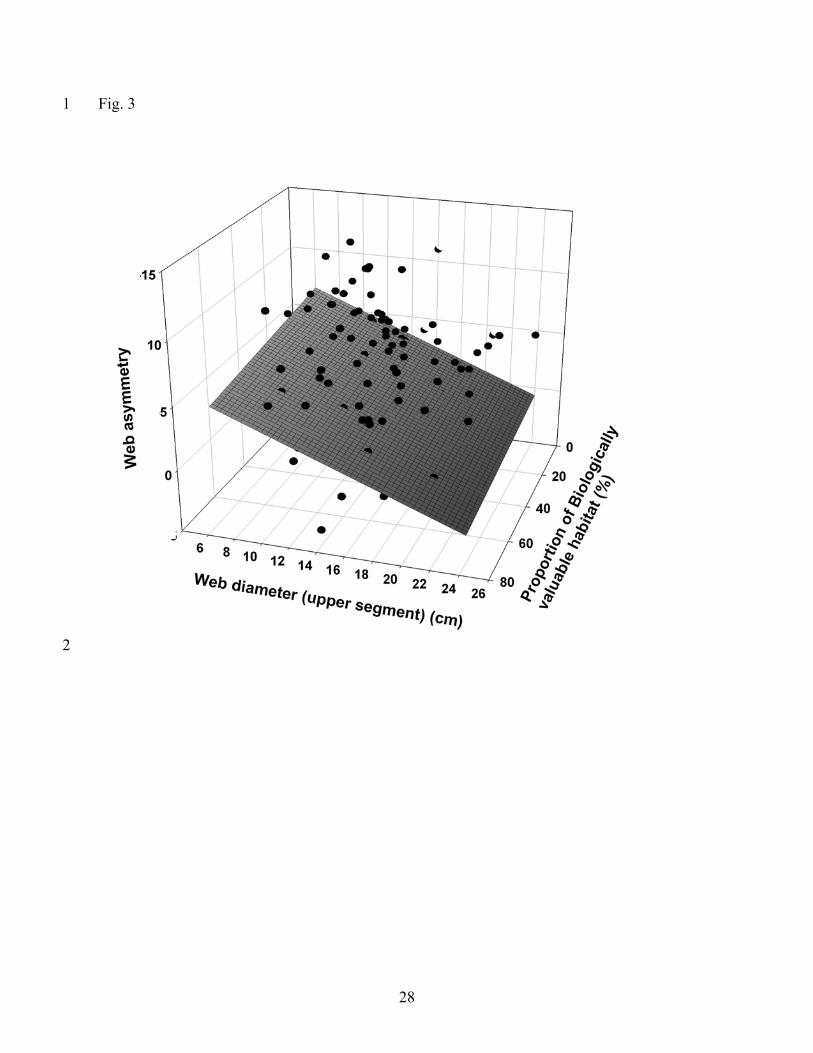
[0.02-2.11], all P>0.05). Negative effects on web asymmetry were pronounced, though only at a 2
radius of 250 meters (Fig. 3; Table 2). According to AICc-values, however, alternative models 3
remain possible, despite non-significant contributions. 4
5
No landscape-scales affected hub diameter (all F1,150<1.49; P>0.05), but negative effects on hub 6
spiral density were found for the proportion of BVH at a radius of 250 and 500 meters (Table 2). 7
Effects at both spatial scales were equally reliable (ΔI < 2) 8
9
In conclusion, web design properties were negatively affected by the proportion of biologically 10
valuable habitat at different spatial scales, but with overall convergence at the spatial scale of 250 11
meters (Table 2). Increased overall investments in capture thread length, especially within the 12
lower web sector and in the central hub are consequently prevalent when the proportion of natural 13
habitat decreases at larger spatial scales. 14
15
Body size and fecundity 16
No effects of landscape properties were found on body size (F1,152 ranges [0.02-4.19], all 17
P>0.05). Relative investments (i.e. controlled for body size) in total number of eggs and 18
reproductive output were positively correlated with investment in capture thread length 19
(r31=0.406; P=0.018 and r31=0.357; P=0.036; Fig. 4), but not with egg size (r31=0.234; P>0.05). 20
Despite this positive relationship, the proportion of BVH within 250 and 500 m scales positively 21
affected reproductive output (corrected for capture thread length and body size; Table 2). 22
23
24

14
1
Discussion 2
3
The common orb web spider A. diadematus adapted its web building strategy to landscape 4
simplification. The availability of potential larger prey also decreases with decreasing availability 5
of biological valuable habitat. The observed functional response in web building is suggested to 6
be adaptive (i.e. beneficial; Gothard & Nylin 1995) towards lower prey availability because (i) 7
foraging investment is increased due to increased silk production in the web capture area and (ii) 8
foraging efficiency is increased due to increased web asymmetry. Subsequent negative effects on 9
fecundity in relation to increased investment in produced silk were recorded. According to model 10
selection criteria, behavioural responses were especially pronounced at median spatial scales. 11
12
Intraspecific variation in dispersal ability and subsequent dispersal limitation at different spatial 13
scales is acknowledged to generate biodiversity loss when agricultural intensification manifests at 14
large spatial scales. Generalist predators like orb web spiders are highly mobile in the early 15
juvenile life phases through aerial dispersal, but largely immobile when adult (Foelix 1982). 16
These organisms possess pest-controlling services in crop-dominated landscapes through direct 17
consumption of pest species and by inducing high levels of wasteful killing of non-food, often 18
smaller, pest species like aphids within webs (Sunderland et al. 1999). For orb web spiders in 19
particular, depletion of prey (especially essential prey like larger Diptera; Venner & Casas 2005, 20
Ludy 2007) are yet empirically documented to induce functional changes in web building 21
behaviour, with increased investments in capture area or foraging efficiency under laboratory 22
conditions (Vollrath et al., 1997). Our results therefore suggest prey deprivation as the underlying 23
mechanisms. However, because the potential spider prey spectrum and quantity does not 24

15
necessarily reflect the actual prey of the spider (Ludy 2007) alternative explanations (e.g. changes 1
in prey quality; Sigsgaard et al. 2001) cannot be excluded. 2
3
For A. diadematus, we found evidence of increased investment in web-building in intensively 4
used agricultural landscapes. Fitness costs suggest that increased investments in silk thread 5
production (Venner & Casas 2005) are not fully compensated, despite the fact that orb webs are 6
recycled on a daily basis (e.g. Sherman 1994). Possibly non-recyclable energetic investments in 7
silk web production and higher energetic losses under web damage cause these patterns, but 8
causes related to changes in prey spectrum and its nutritional quality (Sigsgaard et al. 2001) can 9
again not be excluded. Because fitness consequences are not expressed through changes in clutch 10
or egg size but in total reproductive output within a single panmictic population, 11
environmentally-cued adaptive plasticity is considered to be prevalent. Although this flexibility 12
does not necessarily imply any adaptive functionality, observed shifts towards increased foraging 13
investment (silk length thread) and efficiency (web asymmetry) do indicate beneficial 14
modifications of the species’ behaviour. Only for increased hub spiral density, adaptive 15
underlying mechanisms are uncertain. Although no empirical evidence is available, increased 16
thread density of the spider’s resting place, may provide increased protection against predators 17
due to reduced visibility, as is the case for silk decorations (Herberstein et al. 2000). Mechanistic 18
modifications related to increased lower web areas provide, however, a valuable alternative 19
explanation (Heiling & Herberstein 2000). 20
21
Because shifts in web-building and fitness properties converge in response to the availability of 22
biologically valuable habitat (or inversely to the presence of intensively used arable habitats) at 23
the spatial scale of 250 meter, and because prey limitation appears to be strongest at this scale, we 24

16
propose that environmental properties at intermediate spatial scales, rather than local conditions 1
affect the species’ life history, behaviour and condition. This study subsequently generates new 2
insights that not solely numerical responses of arthropods (e.g. Tscharntke et al. 2005), but also 3
behaviour of species is affected by the spatial structure of the agricultural landscape. The 4
correlative nature of our study, however, requires some precaution with respect to interpretation 5
of the observed patterns since other environmental factors like wind velocity, aerial humidity and 6
temperature may induce plastic responses in web-building as well (Vollrath et al. 1997). Because 7
we collected data on web-building for spiders experiencing both natural and intensively used 8
landscapes on the same day, we were able to control for these potential confounding effects. No 9
relationships with meteorological conditions were found, and neither did we record any 10
differences in microsite selection (height of the web location, orientation and distance to the 11
vegetation) in relation to landscape properties. Correlated responses of microclimate to landscape 12
properties do consequently not attribute to the observed variation. Only a relationship with 13
ambient temperature was detected. However, this is mainly due to collinearity with the species’ 14
phenology, and patterns with respect to landscape structure became clear after correction for the 15
latter. This covariation consequently confirms reduced investment in web-building in relation to 16
the species reproductive state, and timing of eggsac production (Sherman 1994, Heiling & 17
Herberstein 2000) 18
19
In conclusion, changes in the complexity of agricultural landscapes not solely induce shifts in 20
abundances and diversity of arthropods (Kremen et al. 2007), they also influence individual 21
behaviour of predators. Because these changes are here recorded for web building, our results 22
suggest that landscape composition may also affect the functionality of immobile species that are 23
potentially important for pest-controlling services. 24

17
1
Acknowledgement 2
DB holds a post-doc fellowship at the Fund for Scientific Resarch – Flanders (FWO). EW holds a 3
BOF-scholarship from Ghent University. This study was partially funded by the FWO grant 4
G.0202.06. Martin Schmidt provided comments on an earlier version of the manuscript. Three 5
referees provided valuable comments that largely improved an earlier version of the manuscript. 6
7
8
Literature cited 9
10
Batáry, P., Báldi, A., Szél, G., Podlussány, A., Rozner, I. and Erdős, S. 2007. Responses of 11
grassland specialist and generalist beetles to management and landscape complexity . – Divers. 12
Distrib. 13: 196–202. 13
Beintema, A.J., Thissen, J.B., Tensen, D. and Visser, G.H. 1991. Feeding ecology of charadrii 14
from chicks in agricultural grassland. - Ardea 79: 31–44. 15
Bonte, D., Vandenbroecke, N., Lens, L. and Maelfait, J.-P. 2003. Low propensity for aerial 16
dispersal in specialist spiders from fragmented landscapes. - Proc. R. Soc. Lond. B. 270: 1601-17
1607. 18
Bonte, D., Baert, L., Lens, L. and Maelfait, J.P. 2004. Effects of aerial dispersal, habitat 19
specialisation, and landscape structure on spider distribution across fragmented grey dunes. - 20
Ecography 27: 343-349. 21
Burnham, K.P., and Anderson, D.R. 2004. Model selection and inference. A practical 22
information-theoretic approach. Springer, New York. 23

18
Clough, Y., Holzschuh, A., Gabriel, D., Purtauf, T., Kleijn, D., Kruess, A., Steffan-Dewenter, I., 1
and Tscharntke, T. 2007. Alpha and beta diversity of arthropods and plants in organically and 2
conventionally managed wheat fields. - J. Appl. Ecol. 44: 804-812. 3
Dahl, F. (ed.) 1931. Die Tierwelt Deutschlands und der angrenzenden Meeresteile. 23. Teil 4
Spinnentiere oder Arachnoidea. VI Agelenidae-Araneidae. G. Fischer, Jena. 5
Dauber, J., Purtauf, T., Allspach, A., Frisch, J., Voigtlander, K. and Wolters, V. 2005. Local vs. 6
landscape controls on diversity: a test using surface-dwelling soil macroinvertebrates of differing 7
mobility. - Global Ecol. Biogeogr. 14: 213-221. 8
De Saeger, S., Vriens, L. and Paelinckx, D. 2006. Biologische Waarderingskaart, versie 2. 9
Kaartbladen 22. Rapport en digitaal bestand. Instituut voor Natuur- en Bosonderzoek 10
INBO.R2006.04. Brussel. 11
Foelix, R. 1982. Biology of Spiders. Cambridge, Massachusetts: Harvard University Press. 12
Gotelli, N.J. and Entsminger, G.L. 2006. EcoSim: Null models software for ecology. Version 7. 13
acquired Intelligence Inc. & Kesey-Bear. Jericho, VT 05465. 14
http://garyentsminger.com/ecosim.htm. 15
Gothard, K. and Nylin, S. 1995. Adaptive plasticity and plasticity as an adaptation: a selective 16
review of plasticity in animal morphology and life history. - Oikos 74: 3-14. 17
Hänggi, A.; Stöckli, E. and Nentwig, W. 1995: Habitats of Central European spiders. Miscellanea 18
Faunistica Helvetica 4, Centre suisse de cartographie de la faune, Neuchatel (Suisse). 19
Heiling, A.M. and Herberstein, M.E. 2000. Interpretations of orb-web variability: a review of 20
past and current ideas. - Ekologia (Bratislava) 19: 97-116. 21

19
Hendrickx, F., Maelfait, J.-P., Van Wingerden, W., Schweiger, O., Speelmans, M., Aviron, S., 1
Augenstein, I., Billeter, R., Bailey, D., Bukacek, R., Burel, F., Diekoetter, T., Dirksen, J., Herzog, 2
F., Liira, J., Roubalova, M., Vandomme, V. and Bugter, R. 2007. How landscape structure, land-3
use intensity and habitat diversity affect components of total arthropod diversity in agricultural 4
landscapes. – J. Appl. Ecol. 44: 340-351. 5
Herberstein, M.E., Craig, C.L., Coddington, J.A. and Elgar, M.A. 2000. The functional 6
significance of silk decorations of orb-web spiders: a critical review of the empirical evidence. - 7
Biol. Rev. 75: 649-669. 8
Johnson, J.B. and Omland, K.S. 2004. Model selection in ecology and evolution. - Trends Ecol. 9
Evol. 19: 101-108. 10
Kremen, C., Williams, N. M., Aizen, M., Gemmill-Harren, A. B., LeBuhn, G., Minckley, R., 11
Packer, L., Potts, S. G., Roulston, T., Steffan-Dewenter, I., Vazquez, D. P., Winfree, R., Adams, 12
L. , Crone, E.E., Greenlead, S. S., Keitt, T. H., Klein, A. M., Regetz, J.and Ricketts, T.H. 2007. 13
Pollination and other ecosystem services produced by mobile organisms: a conceptual framework 14
for the effects of land-use change. - Ecol. Lett. 10: 299-314. 15
Landolfa, M.A. and Barth, F.G. 1996. Vibrations in the orb-web of the spider Nephila clavipes: 16
cues for discrimination and orientation.- J. Comp. Physiol. 179: 493-508. 17
Ludy, C. 2007. Prey selection of orb-web spiders (Araneidae) on field margins. - Agric., 18
Ecosyst. Env. 119: 368 -372. 19
Madsen, M., Nielsen, B.O., Holter, P., Pedersen, J.B., Vagn Jensen, K.-M., Nansen, P. and 20
Grønvold, J. 1990. Treating cattle with ivermectin: effects on the fauna and decomposition of 21
dung pats. – J. Appl. Ecol. 27: 1-15. 22

20
Östman, O., Ekbom, B., Bengtsson, J., and Weibull, A.C. 2001. Landscape complexity and 1
farming practice influence the condition of polyphagous carabid beetles. - Ecol. Applic. 11: 480-2
488. 3
Preston-Matham, K. and Preston-Matham, R. 1996. The Natural History of Spiders. Ramsbury, 4
Malborough: The Crowood Press Ltd. 5
Rhisiart ,A., and Vollrath, F. 1993. Design features of the orb web spider, Araneus diadematus. - 6
Behav. Ecol. 5: 280-287. 7
Roberts, M.J. 1995. Spiders of Great Britain and Northern Europe. Harper Collins, London. 8
Rundlof, M. and Smith, H.G. 2007. The effect of organic farming on butterfly diversity depends 9
on landscape context. – J. Appl. Ecol. 43: 1121-1127. 10
Saint-Germain M. Buddle, C.M., Larrivée, M., Mercado, A., Motchula, T., Reichert, E., Sackett, 11
T.E., Sylvain, Z. and Webb, A. 2007. Should Biomass be Considered More Frequently as a 12
Currency in Terrestrial Arthropod Community Analysis? - J. Appl. Ecol. 44: 330-339. 13
Sample B.E., Cooper, R.J., Greer, R.D. and Whitmore, R.C. 1993. Estimation of Insect Biomass 14
by Length and Width. - Am. Midl. Nat. 129: 234-240. 15
Sandoval, C.P. 1994. Plasticity in web design in the spider Parawixia bistriata: a response to 16
variable prey type. - Funct. Ecol. 8: 701-707. 17
Schmidt, M., Thies, C., Nentwig, W., and Tscharntke, T. 2007. Contrasting responses of arable 18
spiders to the landscape matrix at different spatial scales. - J. Biogeogr. 35: 157-166. 19
Schmidt, M.H., and Tscharntke, T. 2005. Landscape context of sheetweb spider (Araneae: 20
Linyphiidae) abundance in cereal fields. - J. Biogeogr. 32: 467-473. 21

21
Schneider, J.M., and Vollrath, F. 1998. The effect of prey type on the geometry of the capture 1
web of Araneus diadematus. - Naturwissenschaften 85: 391-394. 2
Sherman, P. M. 1994. The orb-web: an energetic and behavioural estimator of a spider's dynamic 3
foraging and reproductive strategies.- Anim. Beh. 48: 19-34. 4
Sigsgaard, L., Toft, S. and Villareal, S. 2001: Diet-dependant survival, development and 5
fecundity of the spider Atypena formosa (Oi) (Araneae: Linyphiidae) - Implications for 6
biological control in rice. - Biocontrol Sci. Techn. 11: 233-244. 7
Steffan-Dewenter, I., Münzenberg, U., Burger, C., Thies, C., and Tscharntke, T. 2002. Scale-8
dependent effects of landscape context on three pollinatir guilds. - Ecology 83: 1421-1432. 9
Sunderland, K. 1999. Mechanisms underlying the effects of spiders on pest populations. - J. 10
Arachnol. 27: 308-316. 11
Thomas CFG, Brain P & Jepson PC (2003) Aerial activity of linyphiid spiders: modelling 12
dispersal distances from meteorology and behaviour. - J. Appl. Ecol. 40: 912-927. 13
Tscharntke, T., Klein, A.M., Kruess, A., Steffan-Dewenter, I., and C. Thies. 2005. Landscape 14
perspectives on agricultural intensification and biodiversity ecosystem service management. - 15
Ecol. Lett. 8: 857-874. 16
Uetz, G. W. 1992. Foraging strategies of spiders. - Trends Ecol. Evol. 7: 155–159. 17
Venner, S., and Casas, J. 2005. Spider webs designed for rare but life-saving catches. - Proc. R. 18
Soc. Lond. B. 272: 1587-1592 19
Venner, S., Thevenard, L. Pasquet, A., and Leborgne, R. 2001. Estimation of the web's cature 20
thread length in Orb-weaving spiders: determining the most efficient formula. - Ann. Entomol. 21
Soc. Am. 94: 490-496 22

22
Vickery, J.A., Tallowin, J.R., Feber, R.E., Asteraki, E.J., Atkinson, P.W., Fuller, R.J. and Brown, 1
V.K. 2001. The management of lowland neutral grasslands in Britain: effects of agricultural 2
practices on birds and their food resources. - J. Appl. Ecol. 38: 647-664. 3
Vollrath F. 1986. Gravity as orientation guide during web-construction in the orb spider Araneus 4
diadematus. - J. Comp. Physiol. A 159: 275-280 5
Vollrath, F., M. Downes, and Krackow, S. 1997. Design variability in web geometry of an orb-6
weaving spiders. - Physiology and Behavior 62: 735-743. 7
Witt, P.N. 1963. Environment in relation to behaviour of spiders. - Archives of Environmental 8
Health 7: 445-452. 9
Zschokke, S. 2002. Form and function of the orb-web. In: European Arachnology 2000 (Toft, S., 10
and Scharff, N., eds.), Aarhus University Press, Aarhus: 99-106. 11
Zschokke, S. 1999. Nomenclature of the orb-web. - J. Arachnol. 27: 542-546. 12
13

23
Table 1: P-values generated by null model randomization tests (Gotelli and Entsminger 2006) for 1
slope, right triangle shape (concentration of data-points within the shape) and upper-left boundary 2
(are data points significantly sparse in the indicated corner of the bivariate space). 3
4
5
6
7
Radius slope shape boundary
25 m 0.001 0.056 0.063
50 m 0.000 0.007 0.067
100 m 0.000 0.001 0.117
250 m 0.000 0.003 0.012
500 m 0.201 0.095 0.252

24
Table 2: Slope estimates, F-statistics and P-values for general(ized) linear model analyses of the 1
radius and number (N° of spiral threads in the lower web section, capture thread length, web 2
asymmetry, hub spiral thread density and reproductive output (residual values of total number of 3
eggs x average egg size, controlled for body size) in relation to the proportion of Biologically 4
Valuable Habitat in five predefined radii around each focal A. diadematus-web. Grey shading 5
indicates alternative reliable models according to Akaike-criteria (ΔI-values < 2). 6
7
8
Radius Capture Area Under N Capture Area Under Capture thread length
Radius Slope (SE) F 1,150 P Slope (SE) F 1,152 P Slope (SE) F 1,150 P
25 -0.015 (0.009) 4.71 0.031 -0.0006 (0.0004) 2.72 0.092 -3.56 (1.88) 3.57 0.061
50 -0.015 (0.008) 3.58 0.060 -0.0008 (0.0004) 3.86 0.052 -3.89 (2.16) 3.24 0.074
100 -0.018 (0.010) 3.44 0.065 -0.0014 (0.0005) 7.35 0.007 -5.51 (2.58) 4.53 0.034
250 -0.029 (0.013) 5.01 0.026 -0.0017 (0.0006) 6.91 0.009 -6.69 (3.44) 3.97 0.048
500 -0.027 (0.019) 2.02 0.157 -0.0014 (0.0009) 2.23 0.137 -4.44 (5.07) 0.77 0.387
Radius Web asymmetry Hub spiral density Reproductive output
Slope (SE) F 1,151 P Slope (SE) F 1,150 P Slope (SE) F 1,30 P
25 -0.011 (0.006) 3.09 0.081 -0.001 (0.000) 1.64 0.22 0.48 (0.31) 2.29 0.141
50 -0.012 (0.007) 2.74 0.100 -0.001 (0.000) 0.94 0.333 0.63 (0.36) 3.12 0.087
100 -0.015 (0.008) 2.93 0.089 -0.001 (0.000) 3.41 0.062 0.85 (0.43) 3.83 0.059
250 -0.026 (0.011) 5.16 0.024 -0.002 (0.000) 5.78 0.017 1.74 (0.63) 7.67 0.009
500 -0.027 (0.017) 2.58 0.110 -0.002 (0.000) 4.73 0.031 2.52 (0.75) 11.20 0.002
9
10

25
Figure Legends: 1
2
Fig. 1: Distribution of prey size within pan traps in relation to the proportion of biologically 3
valuable habitat in a radius of 250 meters. Null-model parameters by which randomized data 4
distributions were tested (Gotelli and Entsminger 2001) are indicated: slope; right triangle shape 5
(concentration of data-points within the shape) and upper-left boundary (are data points 6
significantly sparse in the indicated corner of the bivariate space?). 7
8
Fig. 2: Estimated investment in capture thread length for web building in relation to the 9
proportion Biologically Valuable Habitat and spider size (CT-width). Because the represented 10
model is corrected for date-effects, observed data cannot be plotted. 11
12
Fig. 3: Observed (dots) and estimated (plain) web asymmetry in relation to the proportion 13
Biologically Valuable Habitat at different spatial scales and web radius. 14
15
Fig. 4: Relationship between fecundity (reproductive output and number of eggs) and CTL-16
length. Due to covariance with body size, residual values are represented. 17

26
Fig 1 1
2
3
4
5

27
Fig. 2 1
2
3
4
28
Fig. 3 1
2

29
Fig. 4 1
2
3
4