biology - s5ee8b77f7f9dee0d.jimcontent.com...1.2 matriculation science programme learning outcomes...
TRANSCRIPT

1
MATRICULATION DIVISION
MINISTRY OF EDUCATION MALAYSIA
BIOLOGY LABORATORY MANUAL
SEMESTER I & II
SB015 & SB025
MINISTRY OF EDUCATION MALAYSIA
MATRICULATION PROGRAMME
ELEVENTH EDITION

2
First Printing, 2003
Second Printing, 2004
Third Printing, 2005 (Sixth Edition)
Fourth Printing, 2006 (Seventh Edition)
Fifth Printing, 2007 (Eighth Edition)
Sixth Printing, 2011 (Ninth Edition)
Seventh Printing, 2013 (Tenth Edition)
Eighth Printing, 2018 (Eleventh Edition)
Copyright © 2017 Matriculation Division
Ministry of Education Malaysia
ALL RIGHTS RESERVED. No part of this publication may be reproduced
or transmitted in any form or by any means, electronic or mechanical,
including photocopying, recording or any information storage and retrieval
system, without the prior written permission from the Director of
Matriculation Division, Ministry of Education Malaysia.
Published in Malaysia by
Matriculation Division
Ministry of Education Malaysia,
Level 6 – 7, Block E15,
Government Complex Parcel E,
Federal Government Administrative Centre,
62604 Putrajaya,
MALAYSIA.
Tel : 603-88844083
Fax : 603-88844028
Website : http://www.moe.gov.my/bmkpm
Printed in Malaysia by
Malaysia National Library Cataloguing-in-Publication Data
Biology Laboratory Manual
Semester I & II
SB015 & SB025
Eleventh Edition
ISBN 978-983-2772-81-1

3
NATIONAL EDUCATION PHILOSOPHY
Education in Malaysia is an on-going effort towards further
developing the potential of individuals in a holistic and
integrated manner, so as to produce individuals who are
intellectually, spiritually and physically balanced and
harmonious based on a firm belief in and devotion to God.
Such an effort is designed to produce Malaysia citizens who
are knowledgeable and competent, who posses high moral
standards and who are responsible and capable of achieving a
high level of personal well-being as well as being able to
contribute to the betterment of the family, society and the
nation at large.
NATIONAL SCIENCE EDUCATION PHILOSOPHY
In consonance with the National Education Philosophy, science
education on Malaysia nurtures a science and technology
culture by focusing on the development of individuals who are
competitive, dynamic, robust and resilient and able to master
scientific knowledge and technological competency.
4
FOREWORD
I am delighted to write the foreword for the third edition of the Ministry
of Education, Two-Year Matriculation Programme Laboratory Manual.
The first edition was published in 2011 which aimed to equip students
with knowledge, skills, and the ability to be competitive undergraduates.
Now, seven years later, the Laboratory Manual has been carefully updated
to be in line with the outcome-based education (OBE) which is an
educational process focused on achieving certain specified outcomes in
terms of individual learning. This means starting with a clear picture of
what is important for all students to be able to do, then organizing
curriculum (outcome), instruction (activity) and assessment to make sure
learning ultimately happens (Spady, 1994:1).
The third edition reflects the guidelines, standards and codes of practice
developed by Malaysian Qualifications Agency (MQA) which inculcate a
strong culture of OBE good practices that translated into the eight
domains of learning outcomes (Malaysian Qualifications Framework,
MQF) in which the Matriculation Programme focuses on five domains.
This Laboratory Manual is written in such a way to emphasize students’
practical skills (MQF LOD 2) and their ability to read and understand
instructions, making assumptions, apply learnt skills and react effectively
in a safe environment. Science process skills such as making accurate
observations, taking measurement in correct manner, using appropriate
measuring apparatus, inferring, hypothesizing, predicting, interpreting
data and controlling variables are further developed during practical
session. Such processes are incorporated to help students to enhance their
Higher Order Thinking Skills such as analytical, critical and creative
thinking skills. These skills are crucial to prepare students to face
upcoming challenges in the 21st century.
The manipulative skills such as handling the instruments, setting up the
apparatus correctly and drawing the diagrams can be advanced through
practical session. The laboratory experiments are designed to encourage
5
students to have enquiry mind. It requires the learners to participate
actively in the science process skills before, during and after the
experiment by preparing the pre-report, making observations, analysing
the results and drawing conclusions. Students are encouraged to apply the
findings to new situation. The experiments in the manual are carefully
scheduled in accordance to the syllabus specification. The learning
objectives are clearly stated at the beginning of each experiment as
guidance. Hence, involving students in the science process skills through
investigation is amongst the best way of teaching.
It is my hope and expectation that this manual will provide an effective
learning experience and referenced resource for all students to equip
themselves with the skills needed to fulfil the prerequisite requirements in
the first-year undergraduate studies.
Dr. BAIDURIAH BINTI YAAKUB Director
Matriculation Division
Ministry of Education
April 2018
iii
CONTENTS
Page
Foreword i
Content iii
Learning Outcomes v
Introduction
viii
SEMESTER I
Experiment Title
1 Basic Techniques In Microscopy
1
2 Plant Tissues
7
3 Transport Across Membrane
14
4 Cell Division – Mitosis
17
5 Inheritance
21
6 Basic Techniques in Isolating DNA
29
iv
SEMESTER II
Experiment Title
7 Diversity of Bacteria
32
8 Plant Diversity – Bryophytes and Pteridophytes 38
9 Biocatalysis
48
10 Cellular Respiration
54
11 Photosynthesis
57
12 Dissection
62
References 76
Acknowledgements 77
v
1.0 Learning Outcomes
1.1 Matriculation Science Programme Educational Objectives
Upon a year of graduation from the programme, graduates are:
1. Knowledgeable and technically competent in science
disciplines in-line with higher educational institution
requirement.
2. Communicate competently and collaborate effectively in group
work to compete in higher education environment.
3. Solve scientific and mathematical problems innovatively and
creatively.
4. Engage in life-long learning with strong commitment to continue
the acquisition of new knowledge and skills.
1.2 Matriculation Science Programme Learning Outcomes
At the end of the programme, students should be able to:
1. Acquire knowledge of science and mathematics fundamental in
higher level education.
(PEO 1, MQF LOD 1)
2. Demonstrate manipulative skills in laboratory work.
(PEO 1, MQF LOD 2)
3. Communicate competently and collaborate effectively in group
work with skills needed for admission in higher education
institutions.
(PEO 2, MQF LOD 5)
4. Apply logical, analytical and critical thinking in scientific studies
and problem solving.
(PEO 3, MQF LOD 6)
5. Independently seek and share information related to science and
mathematics.
(PEO 4, MQF LOD 7)
vi
1.3 Biology 1 Course Learning Outcome
At the end of the course, student should be able to:
1. Explain the basic concepts and theories in cells, biomolecules,
inheritance, genetics and biological development.
(C2, PLO 1, MQF LOD 1)
2. Conduct biology laboratory work on microscopy, biological
molecules, histology and genetics information by applying
manipulative skills. (P3, PLO 2, MQF LOD 2)
3. Solve problems related to cells, biomolecules, inheritance,
genetics and biological development.
(C4, PLO 4, CTPS3, MQF LOD 6)
1.4 Biology 2 Course Learning Outcome
At the end of the course, student should be able to:
1. Explain the basic concepts and theories in transport system
processes, mechanisms for adaptations in living things, ecological
and environmental issues in biology.
(C2, PLO 1, MQF LOD 1)
2. Conduct biology laboratory work on diversity of bacteria
and plant, biocatalysis, cellular respiration,
chromatography and dissecting technics by applying
manipulative skills.
(P3, PLO 2, MQF LOD 2)
3. Solve problems related to transport system processes,
mechanisms for adaptations in living things, ecological and
environmental issues in biology.
(C4, PLO 4, CTPS 3, MQF LOD 6)
vii
1.5 Biology Practical Learning Outcomes
Biology experiment is to give the students a better understanding of
the concepts of Biology through experiments. The aims of the
experiments in this course are to be able to:
know and practice the necessary safety precautions to be
taken.
use the correct techniques of handling apparatus.
plan, understand and carry out the experiment as instructed.
observe, measure and record data consistency, accuracy and
units of the physical quantities.
define, analyse data and information in order to evaluate and
deduce conclusions from the experiments.
discuss data and information logically and critically.
analyse and draw conclusions from biological data.
develop solution to biological problems.
acquire scientific skills in measuring, recording and
analysing data as well as to determine the uncertainties
(error) in various physical quantities obtained in the
experiments.
understand the limitations to the accuracy of observations
and measurements.
viii
INTRODUCTION
A. General Guidelines
Laboratory Regulation
1. Always wear laboratory coats and covered shoes in the lab.
2. Do not eat or drink in the laboratory.
3. Use the apparatus and materials wisely.
4. Do not throw rubbish and residues into the sink. Wrapped and throw
them into the dustbin provided.
5. At the end of the experiment, students must
a) clean the apparatus using the detergent provided.
b) soak the apparatus in acidic solution containing mild
hydrochloric acid.
c) wash the sink and work station.
d) make sure that all the tables are clean and neat.
e) place the materials and apparatus in their respective places.
Sectioning and Staining Plant Tissues
1. Sectioning of plant tissues or parts must be made and stained before they
are examined under the microscope.
2. Use sharp blade or microtome to make a thin slice of the specimen.
3. Clean the blades with water and dry them using tissue paper after being
used.
Preparation for Experiment
1. You are advised to read the manual before carrying out the experiment.
You are also advised to make additional references about the topic.
2. Prepare a rough layout of the experiment that consists of tables, graphs
and space for drawing.
3. Identify the equipments and materials that are going to be used in the
experiment. This will maximise the time used for experiment.
4. Follow strictly the instructions in the manual.
5. Record only what you observe in the experiment.
ix
Laboratory Report and Evaluation
1. Report should contain the following:-
Title
Objective(s)
Introduction (hypothesis/variable/problem statement)
Procedures (in passive voice, past tense, in reporting style)
Observation (tables, graphs, data, drawing)
Analysis / Discussion regarding tables, graphs, data or drawings
Conclusion
Questions
References
2. Reports must be handwritten or typed.
3. Diagrams should be drawn on the blank sheet using a 2B pencil. All
diagrams must be labelled.
4. Metric system must be used in writing numerical data.
5. Data can be presented in the form of graphs, tables, flow charts or
diagrams. Give suitable titles to the graph, table, flow charts and
diagrams.
6. Record the following on the front page of the report.
College’s name:
Student’s name:
Matriculation number:
Practicum group:
Title:
Date:
Tutor’s / lecturer’s name:
7. Submit your report to your lecturer at the end of the practical session.
The report and the attendance for each lab will be evaluated and
included in the assessment.
Scientific Drawing
1. Diagrams drawn must be based on the observation of the specimen and
not copied from books.
2. All parts of the specimens observed must be drawn using the right scale.
3. An overall drawing or plan drawing must be made to show the parts
where the drawings are made.
4. Show clear orientation of the specimen so that the position and the
relationship with other organs can be determined.
5. Use a sharp 2B pencil to draw thin, clear and continuous lines.

x
6. Drawing must not be coloured or shaded to differentiate the systems
from tissues. For this purpose, students are allowed to use various
patterns to differentiate systems.
7. Label all your drawings. All labels must be written on the right and left
side of the diagram. Do not write the labels on or in the diagram. Labels
must be written horizontally. Straight line must be used to connect the
structure.
8. Magnification used in the drawing from observation under the
microscope must be mentioned; e.g.: 40x or 100x actual magnification.
Caring for Plants and Animals
1. Water the plants every day. Make sure the soil is damp and wet.
2. Clean the animal cages every day. Make sure the cages are in good
condition.
3. Feed the animal daily.
B. Introduction to Microscopy
The discovery of microscope started a new era in biology since for the first
time man was able to observe cells, the basic units of life.
The optical properties of lenses have been known for the last 300 years B.C. ,
but these knowledge were not used to the fullest until the seventeenth century
when Antonio Van Leeuwenhoek (1632-1732), a Dutch, and his colleagues
discovered a simple workable microscope. With the discovery of the simple
microscope, many people were able to observe minute living organisms in
great details. One of them was Robert Hooke who in 1665 gave the first
extensive description of his experience in observing cork tissue using the
simple microscope. This marked to the beginning of the study of cells.
Below is the excerpt from the journal Micrographia by Hooke of what he
observed from the cork tissue under the microscope:
“ I could exceedingly plainly perceive it to be all perforated and
porous….. these pores, or cells, ….. were indeed the first microscopical
pores I ever saw, and perhaps, that were ever seen, for I had not met
with any writer or person, who has made any mention of them before
this”.
Although the description by Hooke about the cork tissue might sound
hilarious, you may have described them in the same way had you lived in the
seventeen century when the concept of cell as the fundamental unit of life
was something unknown.
xi
1. What is a Microscope?
Microscopes are precision instruments, and therefore need to be handled
carefully. Many people think that microscopes can only be used to observe
objects in higher magnification. If a microscope can only be used to observe
a magnified image, then its usage is limited. In fact, microscope can be used
to magnify an object, determining the size of an object and observing fine
details of an object, all of which are not discernible to our naked eyes.
Therefore, before one can properly use a microscope, first he has to be
familiar with the microscope and be able to identify the components of the
microscope and their functions.
With the advancement of technology in microscopy, many high-quality
microscopes have been designed for many specific uses. Nowadays, many
microscopes are of the compound types which use two sets of lenses. The
first set of lens constitutes the objective lens which supplies the initial real
magnified image. The second set of lens constitutes the ocular lens which
magnifies further the image formed by the first set of lens and converts the
real image into virtual image which is in turn viewed by the user’s eyes. In
compound microscopes, the actual magnification is calculated as the
magnification of objective lens multiplied by the magnification power of the
ocular lens.
Today there are many types of light microscope, for example the phase-
contrast microscope that allows user to view living cells or specimens
without the use of stains to increase the contrast. Contrast is based on the
differential absorption of light by parts of the specimen. There are compound
microscopes, which employ ultraviolet light as the source of light, making it
possible to view specimens that emit fluorescence. Such microscopes are now
commonly used in diagnostics laboratories and research. There are also other
compound microscopes which use either dark field or light field. Another
type of microscope is compound microscope with inverted objective, called
inverted microscope, which is used to observe living cell cultures.
A microscope is not only capable of producing the image of an object but
also capable of distinguishing between two adjacent points on the object.
This capacity is termed as the resolving power of the lenses or the resolving
power of the microscope. The higher the resolution of the microscope, the
higher is the ability to distinguish details of the object. Microscope quality
depends upon the capacity to resolve, not magnify, objects. Magnification
without resolving power, however, is not worthless in the field of
microscopy.
xii
The resolving power of a light microscope depends upon the wavelength of
light (colour) being used, and not on a value called the numerical aperture (N.
A) of the lens system used. The numerical aperture is derived from a
mathematical expression that relates the light transferred to the specimen by
the condenser to the light received by the objective lens. This relationship is
given by the following expression:
Resolving power = Shortest diameter of the observed structure
= Wavelength ()
Numerical Aperture (N.A)
Thus, the resolving power is increased by reducing the wavelength of the
light used. The shorter the wavelength used, the shorter will the diameter of
the structure being observed, or in other words, the resolving power is
increased. The resolving power cannot be increased substantially because the
light spectrum is narrow (500 nm). However, we can increase the resolving
power by increasing the numerical aperture in the lens system of the
microscope. When the specimen is illuminated with light from direct or
oblique direction, the relationship is given as follows:
Resolving power = Wavelength ()
2 x N.A
where
λ - wavelength of light
N.A - Numerical Aperture
The condenser located below the mechanical stage or slide holder can
transfer oblique and direct light sources to the specimen and this can
approximately double the numerical aperture (N.A). Thus, the resolving
power can be increased. Therefore, the condenser has to be properly focused
to achieve high resolving power.
Light enters the specimen, and some of it will be refracted as it goes through
the air. This light will not enter the objective lens. By placing oil of
immersion in the space between specimen and objective lens, we can reduce
the light refraction and increase the amount of light entering the objective
lens resulting in a brighter and clearer image. The oil of immersion used
should have the same refractive index (R.I) as the glass to reduce refraction.
xiii
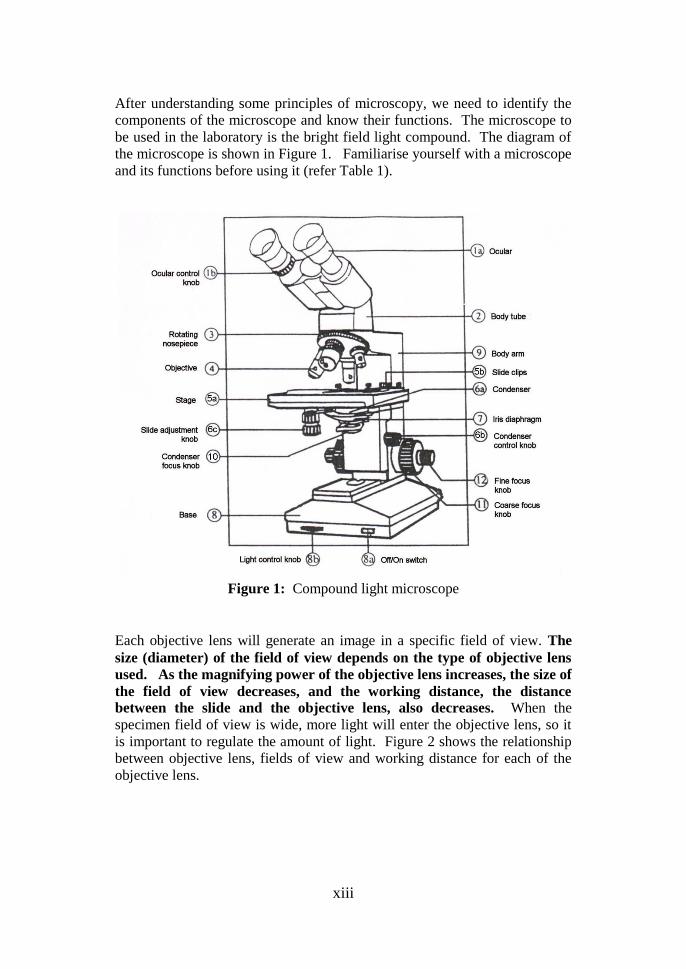
After understanding some principles of microscopy, we need to identify the
components of the microscope and know their functions. The microscope to
be used in the laboratory is the bright field light compound. The diagram of
the microscope is shown in Figure 1. Familiarise yourself with a microscope
and its functions before using it (refer Table 1).
Figure 1: Compound light microscope
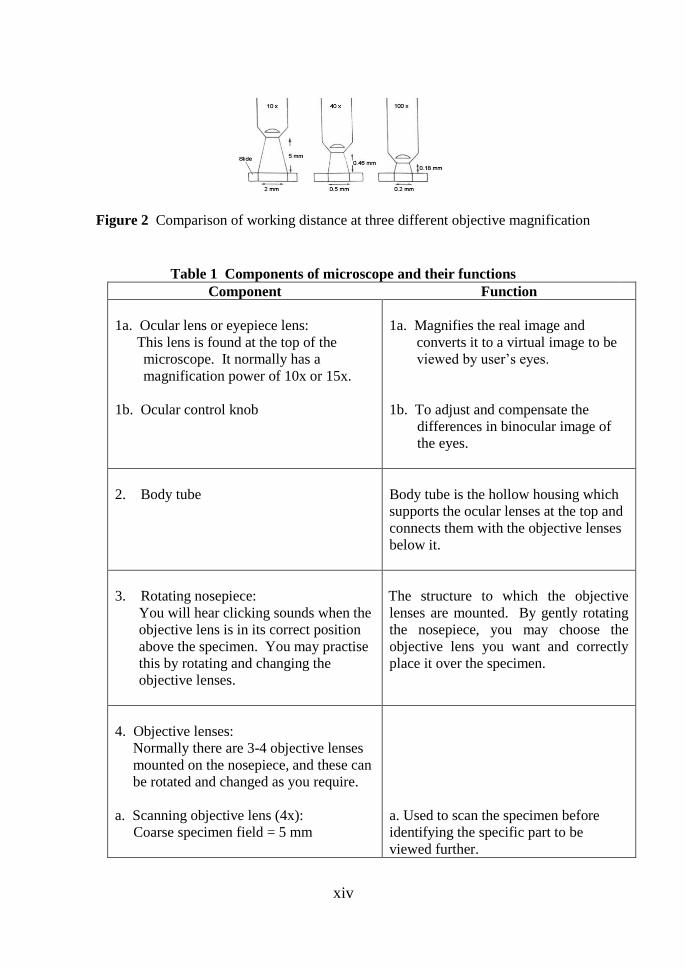
Each objective lens will generate an image in a specific field of view. The
size (diameter) of the field of view depends on the type of objective lens
used. As the magnifying power of the objective lens increases, the size of
the field of view decreases, and the working distance, the distance
between the slide and the objective lens, also decreases. When the
specimen field of view is wide, more light will enter the objective lens, so it
is important to regulate the amount of light. Figure 2 shows the relationship
between objective lens, fields of view and working distance for each of the
objective lens.
xiv
Figure 2 Comparison of working distance at three different objective magnification
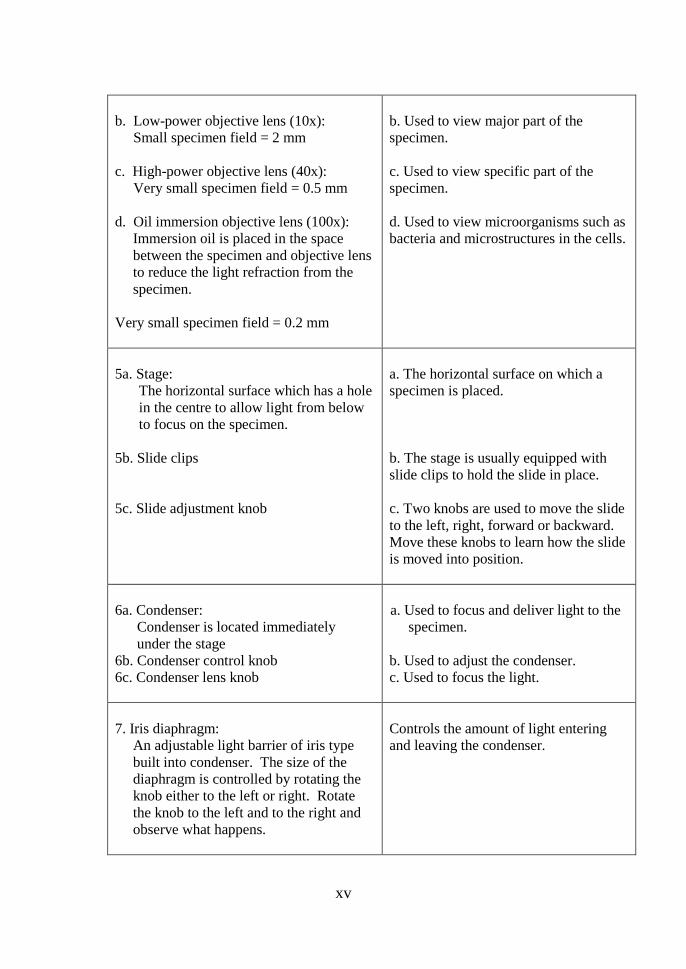
Table 1 Components of microscope and their functions
Component Function
1a. Ocular lens or eyepiece lens:
This lens is found at the top of the
microscope. It normally has a
magnification power of 10x or 15x.
1b. Ocular control knob
1a. Magnifies the real image and
converts it to a virtual image to be
viewed by user’s eyes.
1b. To adjust and compensate the
differences in binocular image of
the eyes.
2. Body tube
Body tube is the hollow housing which
supports the ocular lenses at the top and
connects them with the objective lenses
below it.
3. Rotating nosepiece:
You will hear clicking sounds when the
objective lens is in its correct position
above the specimen. You may practise
this by rotating and changing the
objective lenses.
The structure to which the objective
lenses are mounted. By gently rotating
the nosepiece, you may choose the
objective lens you want and correctly
place it over the specimen.
4. Objective lenses:
Normally there are 3-4 objective lenses
mounted on the nosepiece, and these can
be rotated and changed as you require.
a. Scanning objective lens (4x):
Coarse specimen field = 5 mm
a. Used to scan the specimen before
identifying the specific part to be
viewed further.
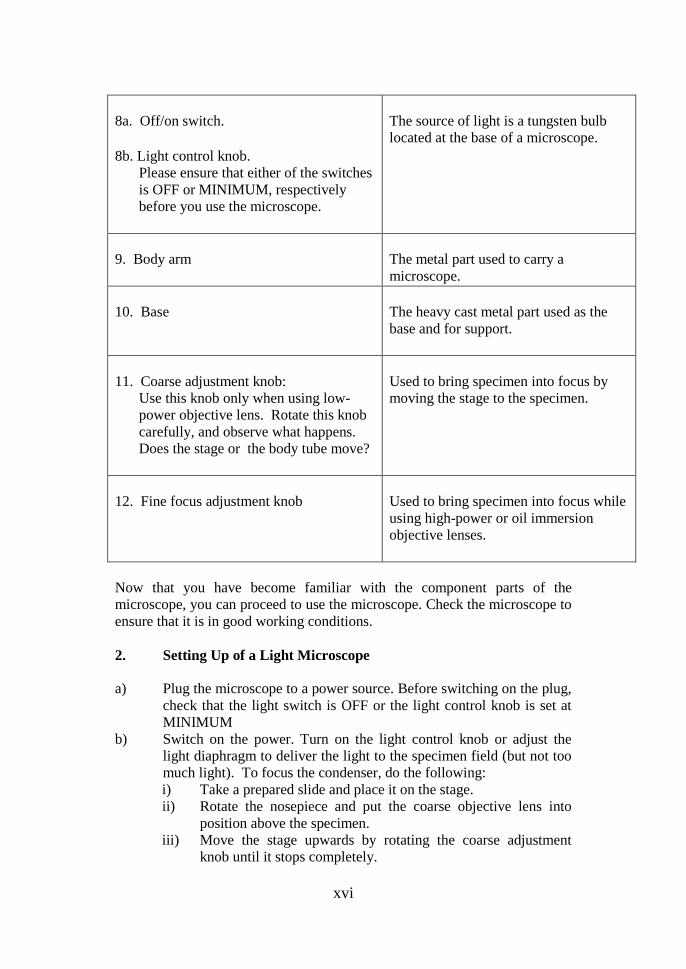
xv
b. Low-power objective lens (10x):
Small specimen field = 2 mm
c. High-power objective lens (40x):
Very small specimen field = 0.5 mm
d. Oil immersion objective lens (100x):
Immersion oil is placed in the space
between the specimen and objective lens
to reduce the light refraction from the
specimen.
Very small specimen field = 0.2 mm
b. Used to view major part of the
specimen.
c. Used to view specific part of the
specimen.
d. Used to view microorganisms such as
bacteria and microstructures in the cells.
5a. Stage:
The horizontal surface which has a hole
in the centre to allow light from below
to focus on the specimen.
5b. Slide clips
5c. Slide adjustment knob
a. The horizontal surface on which a
specimen is placed.
b. The stage is usually equipped with
slide clips to hold the slide in place.
c. Two knobs are used to move the slide
to the left, right, forward or backward.
Move these knobs to learn how the slide
is moved into position.
6a. Condenser:
Condenser is located immediately
under the stage
6b. Condenser control knob
6c. Condenser lens knob
a. Used to focus and deliver light to the
specimen.
b. Used to adjust the condenser.
c. Used to focus the light.
7. Iris diaphragm:
An adjustable light barrier of iris type
built into condenser. The size of the
diaphragm is controlled by rotating the
knob either to the left or right. Rotate
the knob to the left and to the right and
observe what happens.
Controls the amount of light entering
and leaving the condenser.
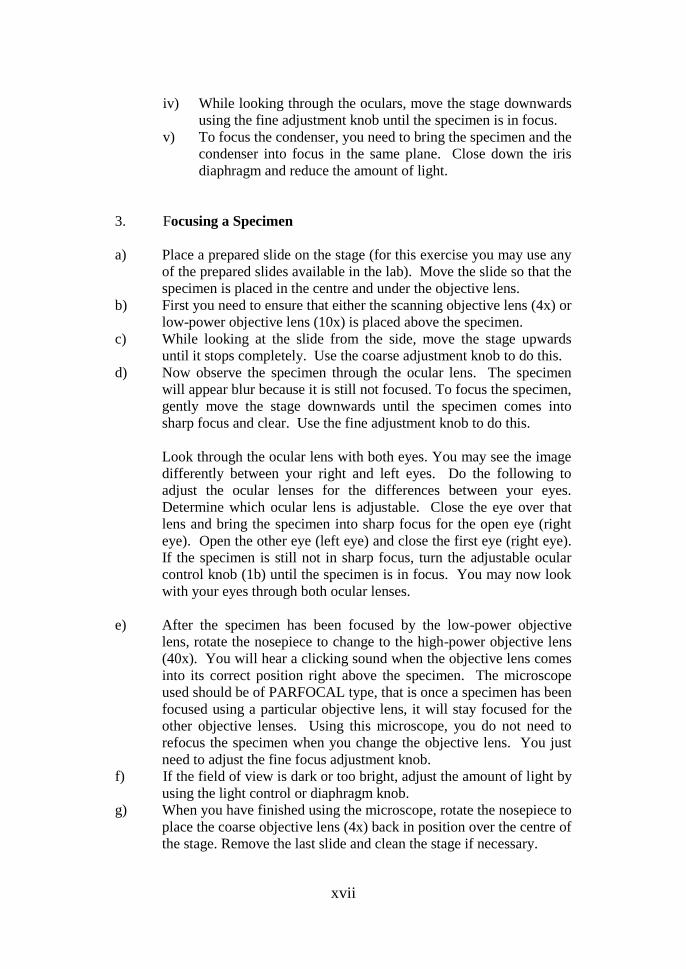
xvi
8a. Off/on switch. 8b. Light control knob.
Please ensure that either of the switches
is OFF or MINIMUM, respectively
before you use the microscope.
The source of light is a tungsten bulb
located at the base of a microscope.
9. Body arm
The metal part used to carry a
microscope.
10. Base
The heavy cast metal part used as the
base and for support.
11. Coarse adjustment knob: Use this knob only when using low-
power objective lens. Rotate this knob
carefully, and observe what happens.
Does the stage or the body tube move?
Used to bring specimen into focus by
moving the stage to the specimen.
12. Fine focus adjustment knob
Used to bring specimen into focus while
using high-power or oil immersion
objective lenses.
Now that you have become familiar with the component parts of the
microscope, you can proceed to use the microscope. Check the microscope to
ensure that it is in good working conditions.
2. Setting Up of a Light Microscope
a) Plug the microscope to a power source. Before switching on the plug,
check that the light switch is OFF or the light control knob is set at
MINIMUM
b) Switch on the power. Turn on the light control knob or adjust the
light diaphragm to deliver the light to the specimen field (but not too
much light). To focus the condenser, do the following:
i) Take a prepared slide and place it on the stage.
ii) Rotate the nosepiece and put the coarse objective lens into
position above the specimen.
iii) Move the stage upwards by rotating the coarse adjustment
knob until it stops completely.
xvii
iv) While looking through the oculars, move the stage downwards
using the fine adjustment knob until the specimen is in focus.
v) To focus the condenser, you need to bring the specimen and the
condenser into focus in the same plane. Close down the iris
diaphragm and reduce the amount of light.
3. Focusing a Specimen
a) Place a prepared slide on the stage (for this exercise you may use any
of the prepared slides available in the lab). Move the slide so that the
specimen is placed in the centre and under the objective lens.
b) First you need to ensure that either the scanning objective lens (4x) or
low-power objective lens (10x) is placed above the specimen.
c) While looking at the slide from the side, move the stage upwards
until it stops completely. Use the coarse adjustment knob to do this.
d) Now observe the specimen through the ocular lens. The specimen
will appear blur because it is still not focused. To focus the specimen,
gently move the stage downwards until the specimen comes into
sharp focus and clear. Use the fine adjustment knob to do this.
Look through the ocular lens with both eyes. You may see the image
differently between your right and left eyes. Do the following to
adjust the ocular lenses for the differences between your eyes.
Determine which ocular lens is adjustable. Close the eye over that
lens and bring the specimen into sharp focus for the open eye (right
eye). Open the other eye (left eye) and close the first eye (right eye).
If the specimen is still not in sharp focus, turn the adjustable ocular
control knob (1b) until the specimen is in focus. You may now look
with your eyes through both ocular lenses.
e) After the specimen has been focused by the low-power objective
lens, rotate the nosepiece to change to the high-power objective lens
(40x). You will hear a clicking sound when the objective lens comes
into its correct position right above the specimen. The microscope
used should be of PARFOCAL type, that is once a specimen has been
focused using a particular objective lens, it will stay focused for the
other objective lenses. Using this microscope, you do not need to
refocus the specimen when you change the objective lens. You just
need to adjust the fine focus adjustment knob.
f) If the field of view is dark or too bright, adjust the amount of light by
using the light control or diaphragm knob.
g) When you have finished using the microscope, rotate the nosepiece to
place the coarse objective lens (4x) back in position over the centre of
the stage. Remove the last slide and clean the stage if necessary.
xviii
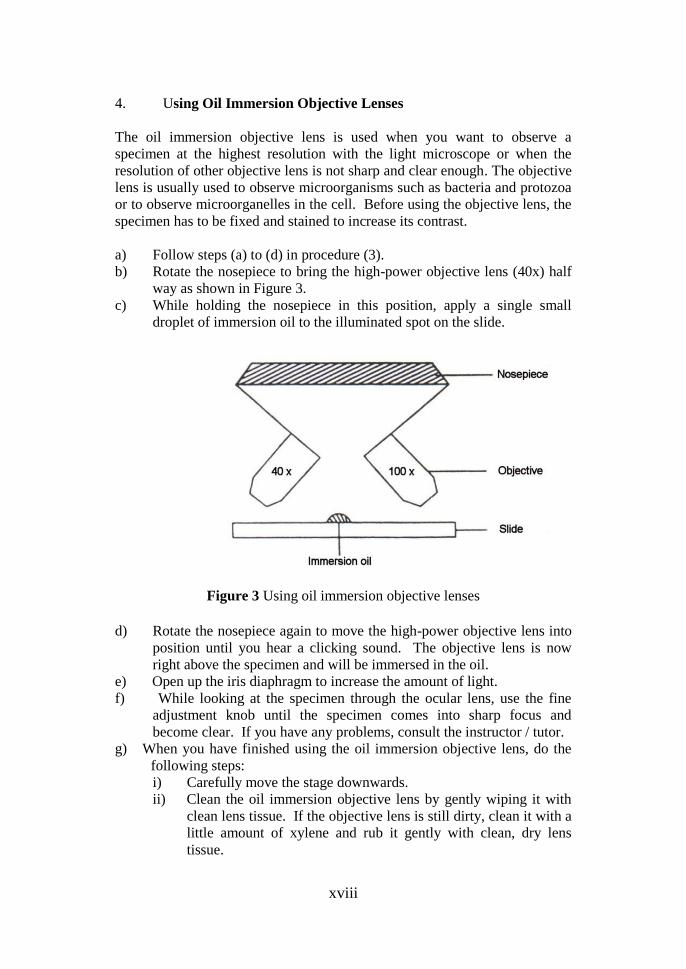
4. Using Oil Immersion Objective Lenses
The oil immersion objective lens is used when you want to observe a
specimen at the highest resolution with the light microscope or when the
resolution of other objective lens is not sharp and clear enough. The objective
lens is usually used to observe microorganisms such as bacteria and protozoa
or to observe microorganelles in the cell. Before using the objective lens, the
specimen has to be fixed and stained to increase its contrast.
a) Follow steps (a) to (d) in procedure (3).
b) Rotate the nosepiece to bring the high-power objective lens (40x) half
way as shown in Figure 3.
c) While holding the nosepiece in this position, apply a single small
droplet of immersion oil to the illuminated spot on the slide.
Figure 3 Using oil immersion objective lenses
d) Rotate the nosepiece again to move the high-power objective lens into
position until you hear a clicking sound. The objective lens is now
right above the specimen and will be immersed in the oil.
e) Open up the iris diaphragm to increase the amount of light.
f) While looking at the specimen through the ocular lens, use the fine
adjustment knob until the specimen comes into sharp focus and
become clear. If you have any problems, consult the instructor / tutor.
g) When you have finished using the oil immersion objective lens, do the
following steps:
i) Carefully move the stage downwards.
ii) Clean the oil immersion objective lens by gently wiping it with
clean lens tissue. If the objective lens is still dirty, clean it with a
little amount of xylene and rub it gently with clean, dry lens
tissue.
xix
iii) Remove the slide off the stage.
iv) Gently rotate the nosepiece again to place the low-power objective
lens back in position over the centre of the stage.
v) If oil is found on the stage, wipe the oil off with lens tissue and
with some alcohol.
5. Storage of Microscopes
When you have finished using the microscope, do the following to store the
microscope.
a) Check that you have not left a slide on the stage.
b) Check that the stage is clean without any trace of water or dust on it. If
there is any water on the stage, wipe it off with dry tissue. If it is oil,
wipe it off with dry tissue with some alcohol.
c) If you use oil immersion objective lens, gently wipe it with clean lens
tissue.
d) Check that the scanning objective lens (4x) is placed back in position
over the centre of the stage.
e) Turn off the light switch or close down the iris diaphragm to reduce the
amount of light to a minimum and then switch off the power.
f) Tie up the power chord below the body arm.
g) Ensure the slide clips are placed on the stage and they are not
protruding.
h) HOLD THE MICROSCOPE WITH BOTH HANDS, that is hold
the body arm of the microscope with one hand and the base of the
microscope with the other hand.
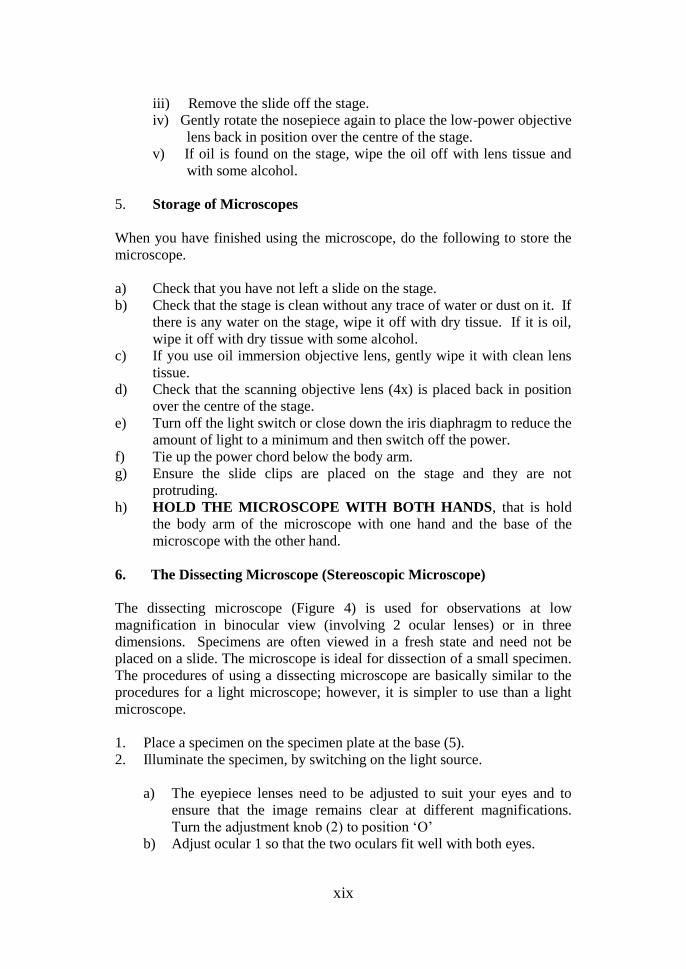
6. The Dissecting Microscope (Stereoscopic Microscope)
The dissecting microscope (Figure 4) is used for observations at low
magnification in binocular view (involving 2 ocular lenses) or in three
dimensions. Specimens are often viewed in a fresh state and need not be
placed on a slide. The microscope is ideal for dissection of a small specimen.
The procedures of using a dissecting microscope are basically similar to the
procedures for a light microscope; however, it is simpler to use than a light
microscope.
1. Place a specimen on the specimen plate at the base (5).
2. Illuminate the specimen, by switching on the light source.
a) The eyepiece lenses need to be adjusted to suit your eyes and to
ensure that the image remains clear at different magnifications.
Turn the adjustment knob (2) to position ‘O’
b) Adjust ocular 1 so that the two oculars fit well with both eyes.
xx
c) Turn the magnification control knob (4) to select the magnification
to 4x.
d) Look through both ocular lens and focus the specimen by turning
the focus knob (8).
e) Change the magnification to 0.8x by turning the control knob (4).
f) Observe the image with your right eye and focus using the
adjustment knob located on the right ocular until the image
becomes clear.
The microscope has now been adjusted to suit your eyes so that you can take
advantage of the stereoscopic effect.
3. Look through the oculars with both eyes. Focus the image by turning
the focus knob (8). Specimen as high as 20 mm may be focused using
the adjustment knob.
4. For specimen higher than 20 mm, the microscope may be focused by
moving its body (3) upwards. This is done by turning the body screw
(7) loose and moving the body upwards or downwards along the stand
(6) as far as the stop screw (9). Tighten the body screw (7) when the
body is at the right position.
5. The stop screw (9) prevents the body of the microscope from crashing
on to the specimen plate at the base.
Figure 4 A dissecting microscope
xxi
7. Electron Microscope
This microscope makes use of the electron beams instead of light source.
Electron beams have very short wavelength of approximately 0.005 mm, and
therefore theoretically, the microscope can resolve objects as small as 0.0025
nm in diameter. The resolution of an electron microscope is usually 1 to 1.2
nm. With electron microscope, magnifications up to 250,000 are commonly
obtained with biological materials. The shorter wavelengths of electrons are
said to have greater resolving power than those of light microscope. There
are two types of electron microscope, namely the transmission electron
microscope and the scanning electron microscope.
In transmission electron microscope, the electron beams are used instead of
light source. An image will be formed on a photographic film screen. The
microscope uses an electromagnetic lens as a condenser and the electron
source is focused by the condenser lens through the specimen. The image is
then magnified by the objective lens and the projector lens. An image taken
from the electron microscope is called a transmission electron micrograph. In
transmission electron microscope (TEM), only very thin sections of specimen
of < 30 nm are used for microscopic observation. They are placed on a
copper grid used for support. Electrons cannot be seen with the human eye,
so the image is made visible by shinning the electrons on to a fluorescent
screen. This will only produce black-and-white pictures. The electron
microscope can be used only for dead tissue materials because they are
viewed in vacuum.
In scanning electron microscope, specimens are coated with a heavy metal
such as gold. Electron beams will not be focused through the specimen, and
when the electron beams collide with the specimen, some electrons will be
absorbed while some are deflected or scattered. Those parts of the specimen
which are denser will absorb more electrons and will appear darker in the
final pictures. Density differences are due to differences in the contour of the
coated surfaces of the specimen. The image produced will be in three
dimensions, and the pictures are called scanning electron micrograph (SEM).

BIOLOGY 1
SB015
1
EXPERIMENT 1: BASIC TECHNIQUES IN MICROSCOPY
Course Learning Objective: Conduct biology laboratory work on
microscopy, biological molecules, histology and genetics information by
applying manipulative skills.
(P3, CLO 2, PLO 2, MQF LOD 2)
Learning Outcomes: At the end of this lesson, students should be able to:
i. To obtain accurate images
ii. To determine the depth of field
iii. To determine the field of view
iv. To calculate the actual magnification
v. To apply the use of oil immersion with high magnification
(oil immersion lens)
Student Learning Time (SLT):
Face-to-face Non face-to-face
2 hour 0
Before doing the following exercises, you must read and understand
the basic techniques of using a microscope.
Exercise 1.1: Images, Depth of Fields and Field of View of the
Microscope
Apparatus
Compound light microscope
Materials
‘e’ prepared slide
Crossthreads prepared slide (3 colours eg: yellow, red and blue)
Transparent ruler (10 mm size) or graph paper prepared slide
2
Procedures and Observation
1.1.1 Images under the microscope
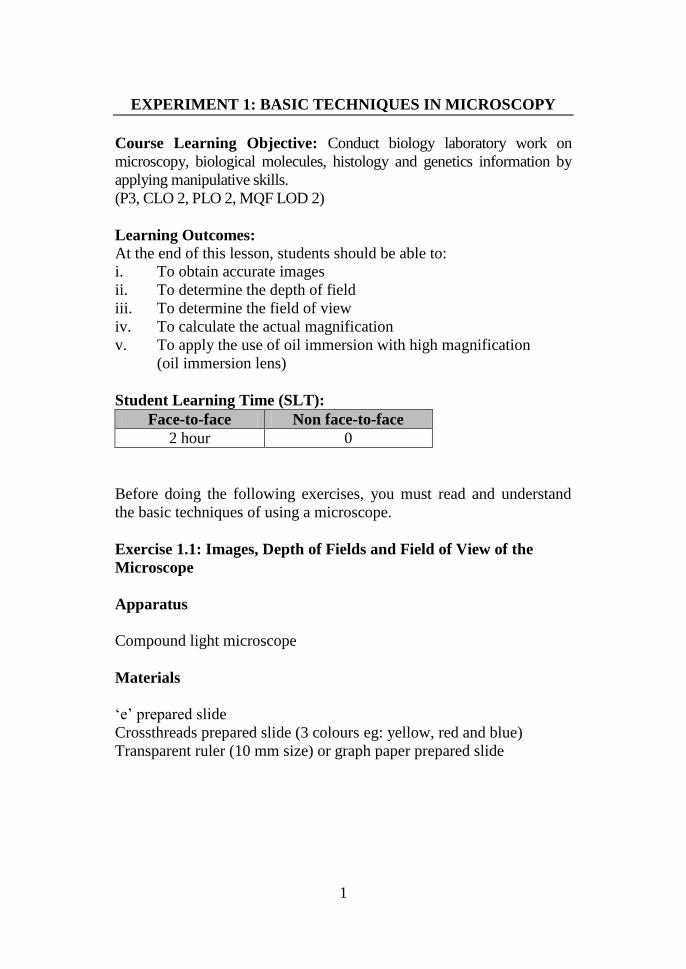
1. Observe the ‘e’ prepared slide using the 4x objective lens.
2. What do you observe using the 4x objective lens? Draw what you
have observed.
3. Determine the position of ‘e’ (inverted/original position)
(Figure 1.1).
Figure 1.1: Letter ‘e’ to be observed under microscope
1.1.2 The depth of field
The depth of field refers to the thickness of the plane of focus. With a
large depth of field, all of the threads can be in focused at the same
time. With a smaller or narrower depth of field, only one thread or a
part of one thread can be focused, everything else will be out of focus.
In order to view the other threads, you must focus downward to view
the ones underneath and upward view the ones that are above.
Do the following exercises to determine the depth of field of
microscope.
1. Observe the position of the thread on the slide with your naked
eyes. Identify the colour of thread
a) at the top
b) in the middle
c) at the bottom
2. Observe the crossthreads under the microscope using 4x and 10x
objective lens.
3. Determine what happens to the depth of field when the power of
objective lens increases.

3
Figure 1.2 :Cross thread prepared slide
1.1.3 The field of view
The simplest method of estimating linear dimension is to compare the
size of the image to the diameter of the field of view. You can make a
rough estimate of the field diameter by focusing on the millimetre
scale of a transparent ruler using the lowest power objective. To
calculate the field of view, use this formula:
Do the following exercises to determine the diameter of the field of
view for each of the objective lens on your microscope.
1. Place a transparent ruler on the stage.
2. Observe the transparent rulerusing the 4x, 10x and 40x objective
lenses. (Increase the amount of light by adjusting the control knob
to the maximum).
3. What do you observe using the 4x objective lens? Draw what you
have observed.
Diameter of field of view under low
magnification power
Diameter of field of view under high
magnification power
High magnification power
Low magnification power =
Bottom: Yellow
Middle: Red
Top: Blue
4
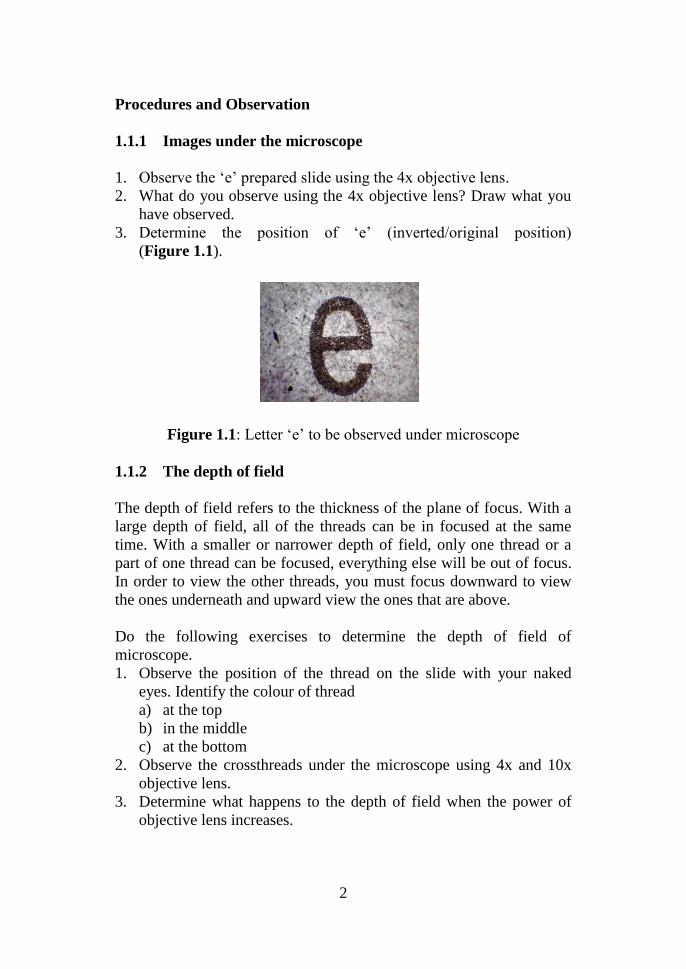
Figure 1.3 : Diameter field of view
The diameter of field of view for the 4x objective lens is mm or m.
Determine the diameter of field of view for the 10x and 40x objective
lens in mm or m.
The diameter of field of view for the 10x = ____ mm = ____ m.
The diameter of field of view for the 40x = ____ mm = ____ m.
4. Using 40x objective lens, determine the size of a cell from a piece
of cork tissue with approximately 20 cells in horizontal position
and 10 cells in vertical position.
Exercise 1.2: Magnification
Procedures and Observation
1. Determine the actual magnification of a specimen by using the
formula below.
Actual magnification =
2. Calculate the actual magnification in Table 1.1.
Table 1.1 Actual magnification of a specimen
Actual magnification
Magnification
power of ocular
lens
Magnification power of objective lens
4x 10x 40x 100x
10x
Magnification power
of objective lens
Magnification
power
of ocular lens
x
a
g
n
i
f
i
c
a
t
i
o
n
p
o
w
e
r
5
Exercise 1.3: Oil Immersion Objective Lens
Apparatus
Compound microscope
Materials
Prepared slide of bacteria
Lens tissue papers
Immersion oil
Methylated spirit (only for specific use)
Procedures and Observation
1. Observe the prepared slide under the microscope.
(Caution: Use immersion oil only for 100x objective lens).
2. Draw your observation.
(Caution: Draw only the bacteria and not artifacts such as
air bubbles, dust, fibre, etc.)
(Refer to the method in Introduction to Microscopy)
Questions
A) For questions 1 to 7, choose the correct answer from the following
list:
A Scanning objective lens (4x)
B Low-power objective lens (10x)
C High-power objective lens (40x)
D Oil immersion objective lens (100x)
1. Which is the shortest objective lens?
2. Which objective lens should you use when you begin to focus a
specimen?
3. Which objective lens should be in position before you store a
microscope?
4. Which objective lens will deliver the highest amount of light?
5. Which objective lens requires immersion oil to fill up the space
between the specimen and the lens?
6
6. Which objective lens will still remain in focus when placed at the
longest working distance from the specimen?
7. When using an ocular lens with 10x magnification power, which
objective lens should be used to obtain the following actual
magnification?
(a) 100 times of its diameter
(b) 1000 times of its diameter
B) Answer the following questions.
1. Based on laboratory practices, what do you use to clean the
microscope lenses?
2. While observing a moving microorganism under a microscope,
you found that the organism has moved out of the field of view
to the right. In order to keep observing the microorganism, which
direction do you move your slide (right/left)?
3. How do you adjust the slide when the specimen is out of the field
of view to the top?
C) Complete the following sentences.
1. A microscope is called a compound microscope when it consists
of more than one set of …………………………………
2. Condenser and iris diaphragm are useful to
coordinate…………………………………………...
7
EXPERIMENT 2: PLANT TISSUES
Course Learning Objective: Conduct biology laboratory work on
microscopy, biological molecules, histology and genetics information by
applying manipulative skills.
(P3, CLO 2, PLO 2, MQF LOD 2)
Learning Outcomes: At the end of this lesson, students should be able to:
i. To identify different types of plant tissues
ii. To compare the structure and distribution of tissues in
monocots and dicots
Student Learning Time (SLT):
Face-to-face Non face-to-face
2 hour 0
Introduction
Plant tissues are divided into two types: meristematic tissues and
permanent tissues.
Meristematic tissues are located in the apical meristem, or zone of
active cell division. The division of cells on apical meristems, located
at the tips of the roots and shoots, cause elongation of the root or the
shoot, known as primary growth. The cells are smaller in size, with
large nucleus, thin walls, large amount of cytoplasm and without inter-
cellular space.
Permanent tissues consist of mature cells that have specialized
structure and functions. Permanent tissues can be divided into three:
dermal tissues (epidermal and peridermal), ground tissues
(parenchyma, sclerenchyma, collenchyma and endodermis) and
vascular tissues (xylem and phloem).
8
Apparatus
Compound light microscope
Materials
Prepared slides of cross sections of monocot stem and root
Prepared slides of cross sections of dicot stem and root
Procedures and Observation
1. Examine the prepared slides of cross sections of dicot and
monocotstems and roots using the 4x objective lens.
2. Identify the distribution of the tissues (epidermis, parenchyma,
collenchyma, sclerenchyma, phloem, xylem and cambium).
3. Draw the arrangement of the tissues. Note the differences in the
following characteristics: cell size, shape, wall thickness and
stained parts.
4. Select a section and observe it under 40x objective lens. Draw
and label the section showing the different tissues (epidermis,
parenchyma, collenchyma, sclerenchyma, phloem, xylem and
cambium). Use the figures provided to assist you in your tissue
investigation.
9
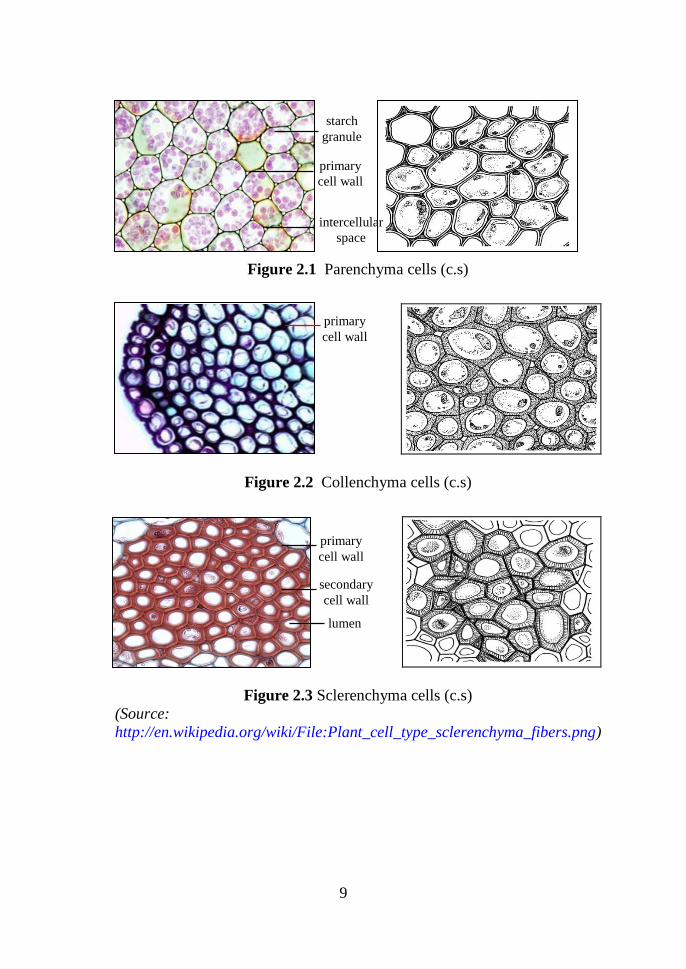
Figure 2.1 Parenchyma cells (c.s)
Figure 2.2 Collenchyma cells (c.s)
Figure 2.3 Sclerenchyma cells (c.s)
(Source:
http://en.wikipedia.org/wiki/File:Plant_cell_type_sclerenchyma_fibers.png)
starch
granule
primary
cell wall
intercellular
space
primary
cell wall
primary
cell wall
secondary
cell wall
lumen
10
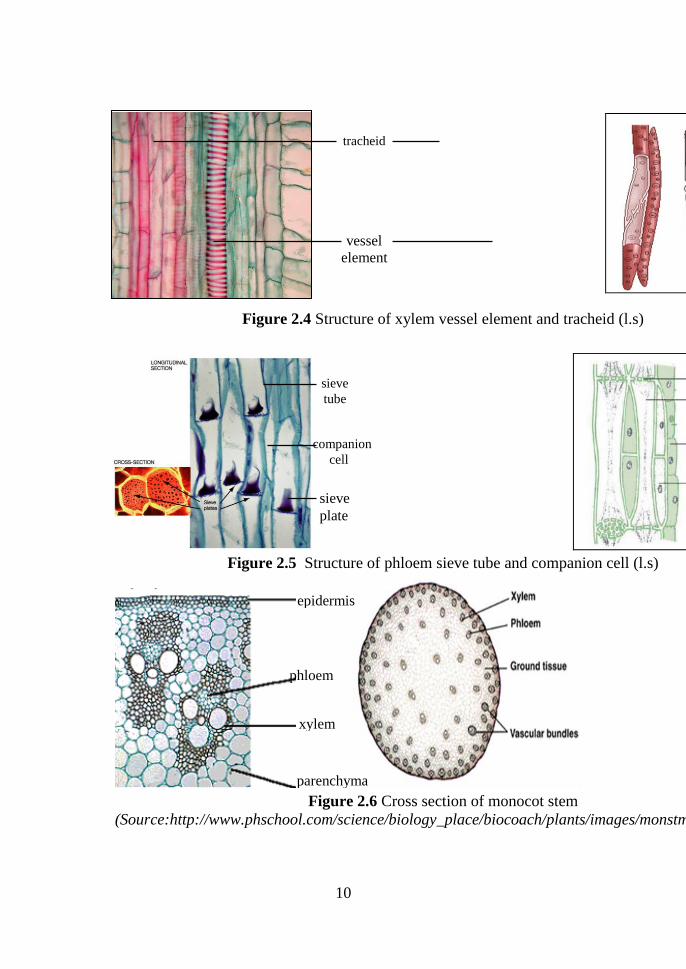
Figure 2.4 Structure of xylem vessel element and tracheid (l.s)
Figure 2.5 Structure of phloem sieve tube and companion cell (l.s)
Figure 2.6 Cross section of monocot stem
(Source:http://www.phschool.com/science/biology_place/biocoach/plants/images/monstmlb.gif)
tracheid
vessel
element
sieve
tube
companion
cell
sieve
plate
epidermis
phloem
parenchyma
xylem
11
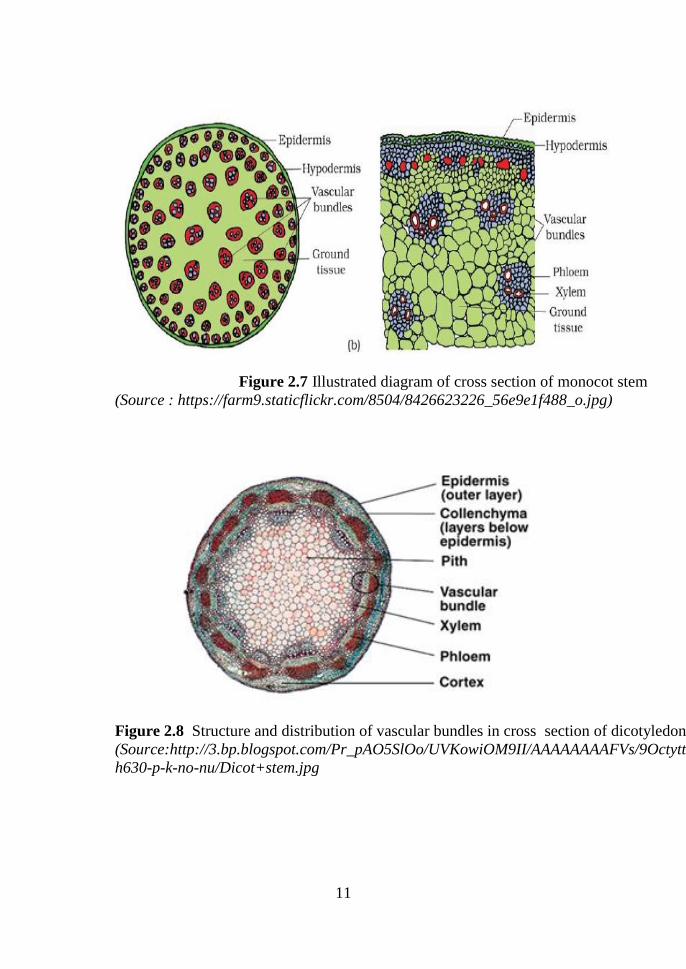
Figure 2.7 Illustrated diagram of cross section of monocot stem
(Source : https://farm9.staticflickr.com/8504/8426623226_56e9e1f488_o.jpg)
Figure 2.8 Structure and distribution of vascular bundles in cross section of dicotyledon stem
(Source:http://3.bp.blogspot.com/Pr_pAO5SlOo/UVKowiOM9II/AAAAAAAAFVs/9OctyttLZy8/w1200-
h630-p-k-no-nu/Dicot+stem.jpg
12
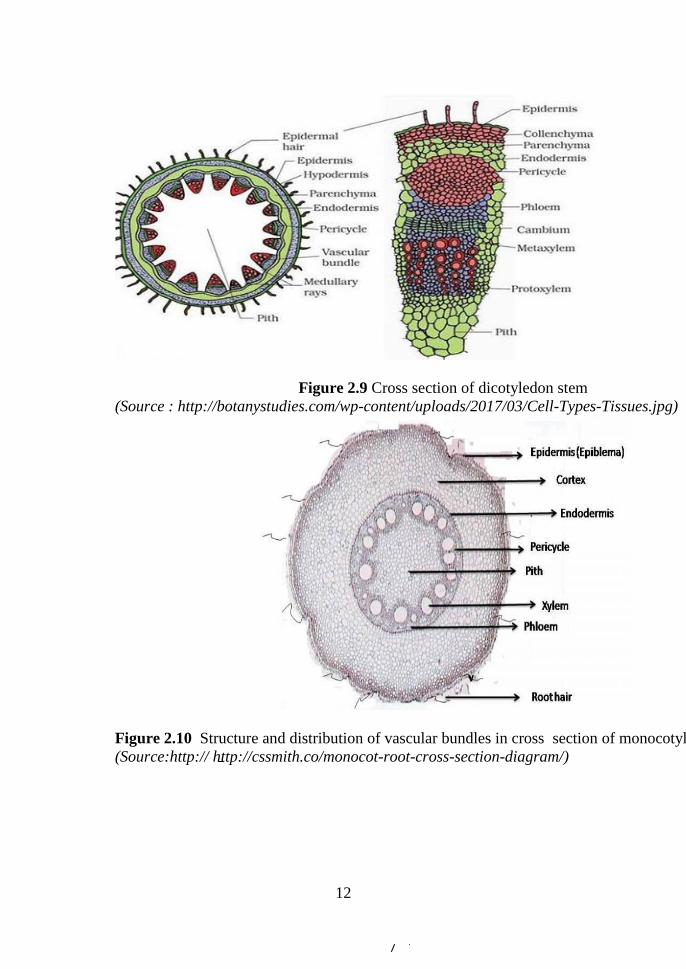
Figure 2.9 Cross section of dicotyledon stem
(Source : http://botanystudies.com/wp-content/uploads/2017/03/Cell-Types-Tissues.jpg)
Figure 2.10 Structure and distribution of vascular bundles in cross section of monocotyledon root
(Source:http:// http://cssmith.co/monocot-root-cross-section-diagram/)

13
Figure 2.11 Structure and distribution of vascular bundles in cross section of dicotyledon root
Questions
1. You are given two slides of cross sections of Angiosperms stems
and roots. How would you differentiate between the following?
(a) the stems of monocot and dicot plants
(b) the roots of monocot and dicot plants
2. Explain the structures and functions of parenchyma, collenchyma
and sclerenchyma cells.
14
EXPERIMENT 3: TRANSPORT ACROSS MEMBRANE
Course Learning Objective: Conduct biology laboratory work on
microscopy, biological molecules, histology and genetics information by
applying manipulative skills.
(P3, CLO 2, PLO 2, MQF LOD 2)
Learning Outcomes: At the end of this lesson, students should be able to:
i. To determine the sucrose concentration which is isotonic to
potato cells
ii. To determine the osmotic pressure of potato cells in
atmospheric unit
Student Learning Time (SLT):
Face-to-face Non face-to-face
2 hour 0
Introduction
The cell membrane is a selective permeable structure because only
selected materials can pass through it. Water molecules can easily pass
through the membrane and the movement of water is called osmosis.
The direction of movement of water molecules is determined by the
concentration of the solutes of both sides of the membrane. The water
potential inside and outside of the cell is said to be isotonic, that is the
movement of water molecules in both direction is at the same rate. The
vacuolar membrane is also a selective structure and the condition in the
vacuole is isotonic to the cell environment.
In a hypertonic environment, water molecules will move out of the
cell and the cell shrinks. The shrinking of cell is due to the hypertonic
environment outside the plant and animal cells. The shrinking of plant
cell is called plasmolysis while the shrinking of animal cell is called
crenation.
When a plant cell is in a hypotonic environment, it will expand but the
increase in size is restricted by the cell wall (turgid). On the other
hand, animal cells which are in the hypotonic environment will expand
and burst and this is called lysis or haemolysis.

15
Apparatus
Boiling tube
Beaker
Cork borer
Electronic balance
Forceps
Measuring cylinder (25 ml)
Petri dish
Pipette (10 ml)
Materials
Distilled water
Filter paper
Fresh potato tuber
Graph paper
Labelling paper
Razor blade
Ruler
Sucrose solutions 1.0 M (40 ml per student)
Tile
Procedures and Observation
Exercise: Osmotic pressure of potato cells
1. Prepare 20 ml of sucrose solution with different molarities in
boiling tubes using the dilution method. The molarities required
are 0.1M, 0.2M, 0.3M, 0.4M and 0.5M. Record in Table 3.1 the
volumes of sucrose solution (1M) and the distilled water used in
preparing the sucrose solutions.
Table 3.1 Determination of molarities of sucrose solutions using
dilution method
Final molarity of the sucrose solutions
0.1 M 0.2 M 0.3 M 0.4 M 0.5 M
Volume of 1.0 M
sucrose (ml)
Volume of distilled
water (ml)
16
2. Prepare 15 pieces of potato strips using cork borer to have 3
replicates for each concentration. The length of each strip is 4
cm.
3. For every concentration, take 3 potato strips, record their average
weight in a table.
4. Put all potato strips into the boiling tubes containing different
sucrose concentrations.
5. After 30 minutes, remove the three strips from the boiling tube,
wipe and immediately record their average weight.
6. Based on your results, draw a graph to show the changes in
weight of the potato strips against the molarities of the sucrose
solutions.
7. From the graph obtained in step 6, determine the sucrose
concentration which is isotonic to potato cells.
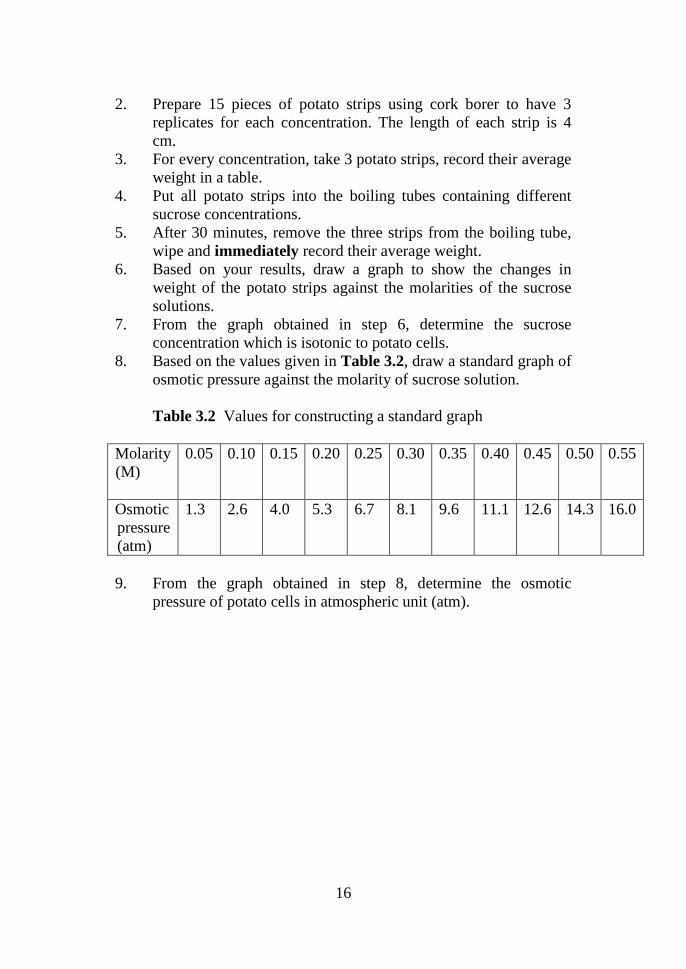
8. Based on the values given in Table 3.2, draw a standard graph of
osmotic pressure against the molarity of sucrose solution.
Table 3.2 Values for constructing a standard graph
Molarity
(M)
0.05 0.10 0.15 0.20 0.25 0.30 0.35 0.40 0.45 0.50 0.55
Osmotic
pressure
(atm)
1.3 2.6 4.0 5.3 6.7 8.1 9.6 11.1 12.6 14.3 16.0
9. From the graph obtained in step 8, determine the osmotic
pressure of potato cells in atmospheric unit (atm).
17
EXPERIMENT 4: CELL DIVISION - MITOSIS
Course Learning Objective: Conduct biology laboratory work on
microscopy, biological molecules, histology and genetics information by
applying manipulative skills.
(P3, CLO 2, PLO 2, MQF LOD 2)
Learning Outcomes: At the end of this lesson, students should be able to:
i. To prepare onion root tip slides
ii. To identify stages in mitosis
Student Learning Time (SLT):
Face-to-face Non face-to-face
2 hour 0
Introduction
In most tissues, new cells are formed as a result of mitosis. If the
chromosomes of such cells are selectively stained with a dye such as
aceto-orcein, stages in mitosis can be observed. An example of a tissue
that undergoes mitosis is the meristematic tissue. This tissue is located
in the cell division zone of the apical meristem at the root tip and shoot
apex.
Apparatus
Compound light microscope
Beakers
Blades
Needle
Prepared slides of various stages of mitosis
Slides and cover slips
Watch glass
Water bath
18
Materials
Filter paper
Tissue paper
1M hydrochloric acid (HCl)
Onion root tips (3-4 days old)
Acetic alcohol (3 parts of absolute alcohol:1 part of acetic acid, freshly
prepared)
Aceto–orcein (Freshly prepared. Heat 45 mL 70% acetic acid and
when the acid is hot, add 2g of orcein. Allow the solution to cool and
dilute with 55 mL of distilled water. Filter the solution prior to use.)
Procedures and Observation
Exercise 4.1: Prepared slides of mitosis
1. Examine the prepared slides of various stages of mitosis.
2. Draw and label the stages of mitosis observed.
Exercise 4.2: Preparation of onion root tips slide
1. Rest onion bulb on the rim of a container of water. Leave until
the roots develop for 3 to 4 days.
2. Cut off the root tips 1 - 2 cm long. Put them in a small volume of
acetic alcohol for 10 minutes.
3. Wash root tips in ice cold water for 4 - 5 minutes, then dry them
on filter paper.
4. Transfer root tips to pre-heated 1M HCl at 60°C for 5 minutes.
Repeat step 3.
Caution - they will be very fragile.
5. Transfer two root tips onto a clean microscope slide. Cut each
root tip about 1 mm from the growing tip. Keep the tips, discard
the rest.
6. Tease the root tips with a mounted needle. Add one small drop of
aceto–orcein stain for 2 minutes.
7. Cover with a cover slip, and blot firmly with several layers of
tissue or filter paper and press gently to spread root tips.
8. View under the microscope using 40x objective lens and observe
the chromosome behaviour in the mitotic stages.
19
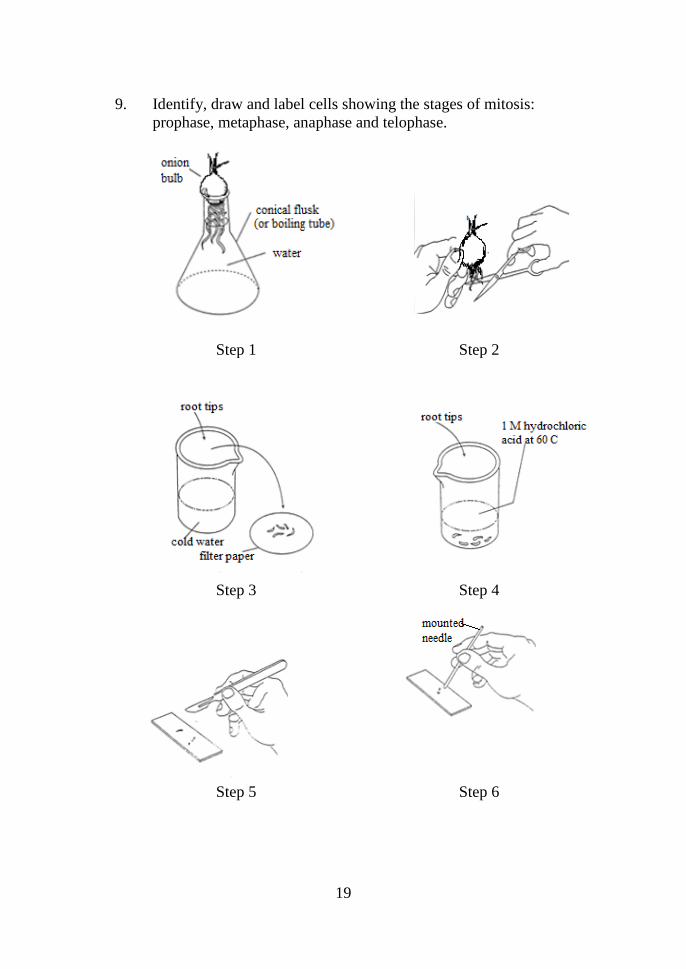
9. Identify, draw and label cells showing the stages of mitosis:
prophase, metaphase, anaphase and telophase.
Step 1 Step 2
Step 3 Step 4
Step 5 Step 6
20
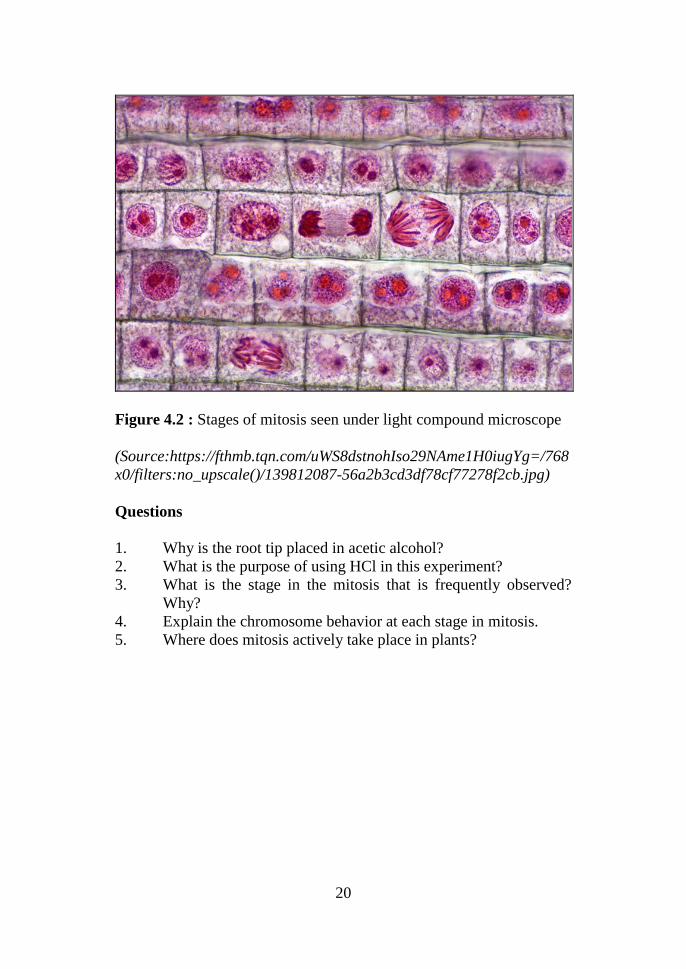
Figure 4.2 : Stages of mitosis seen under light compound microscope
(Source:https://fthmb.tqn.com/uWS8dstnohIso29NAme1H0iugYg=/768
x0/filters:no_upscale()/139812087-56a2b3cd3df78cf77278f2cb.jpg)
Questions
1. Why is the root tip placed in acetic alcohol?
2. What is the purpose of using HCl in this experiment?
3. What is the stage in the mitosis that is frequently observed?
Why?
4. Explain the chromosome behavior at each stage in mitosis.
5. Where does mitosis actively take place in plants?
21
EXPERIMENT 5: INHERITANCE
Course Learning Objective:
Conduct biology laboratory work on microscopy, biological molecules,
histology and genetics information by applying manipulative skills
(P3, PLO 2, MQF LOD 2)
Learning Outcomes: At the end of this lesson, students should be able to:
i. To determine the inheritance of genetic traits controlled by
single genes in human
ii. To determine the inheritance of ABO blood groups
Student Learning Time (SLT):
Face-to-face Non face-to-face
2 hour 0
Introduction
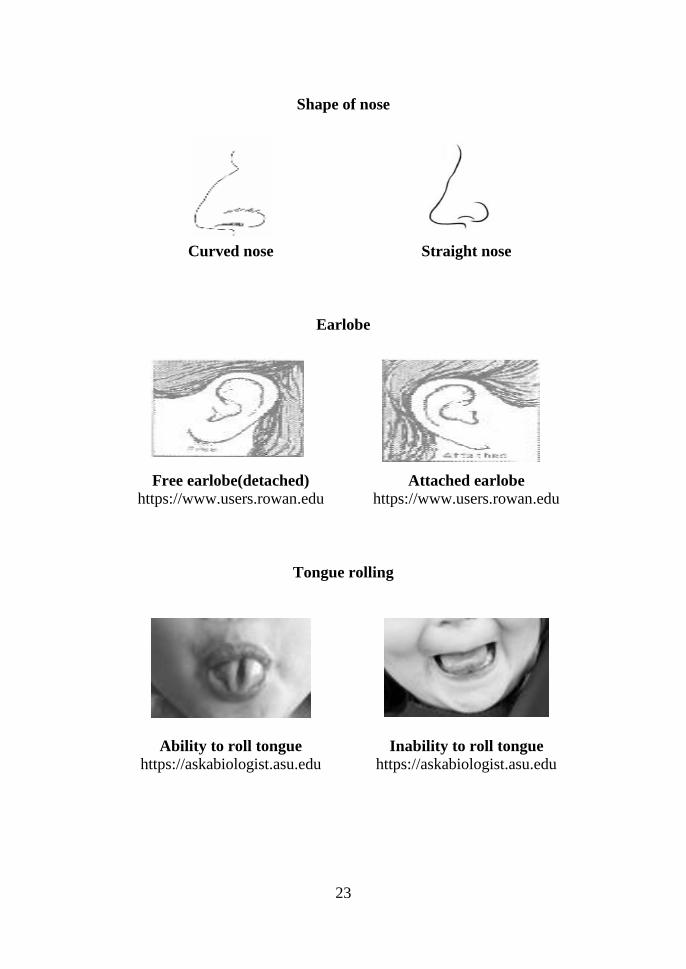
A number of human characteristics are determined by single genes.
These characteristics include the shape of nose, earlobe, the ability of
tongue rolling, the presence of dimple and left-handed (Figure 5.1). A
single gene also determines pigmentation of iris and the ability to taste
phenylthiocarbamide (PTC).
Procedures and Observation
Exercise 5.1: Inheritance of genetic traits in human
1. The exercise will require information to be gathered from every
student in the class.
2. Below are six inherited characteristics in human:
(i) Shape of nose :
Straight nose (E_) is dominant to curved nose (ee).
(ii) Earlobe :
Free earlobe (P_) is dominant to attached earlobe (pp).
(iii) Tongue Rolling :
Ability of tongue rolling into “U” shape (C_) is dominant
to inability of tongue rolling into “U” shape (cc).
22
(iv) Dimple :
Individual with are genotypically(D_) dominant compared
to those without dimple (dd).
(v) Left-handed :
The right-handed characteristic (H_) is dominant to left-
handed (hh).
(vi) Hitch hiker thumb:
The ability to bend thumb at 60 angle or more are
genotypically(tt) recessive compared to normal thumb-
bending (T_).
3. Based on the above characteristics, fill in the information below
in Table 5.1.
(i) Determine your genotype for each of the six
characteristics.
(ii) Calculate the observed and expected frequencies for each
of the six characteristics.
23
Shape of nose
Curved nose
Straight nose
Earlobe
Free earlobe(detached)
Attached earlobe
https://www.users.rowan.edu https://www.users.rowan.edu
Tongue rolling
Ability to roll tongue https://askabiologist.asu.edu
Inability to roll tongue
https://askabiologist.asu.edu

24
Dimple
With dimple
https://www.news.makemeheal.com
Without dimple
https://www.sharewhy.com
Left-handed
Left handed Right handed
http://www.edquest.ca http://www.edquest.ca
Hitch hiker thumb
Normal thumb https://askabiologist.asu.edu
Hitch hiker thumb https://askabiologist.asu.edu
Figure 5.1 The six inherited characteristics in human
25
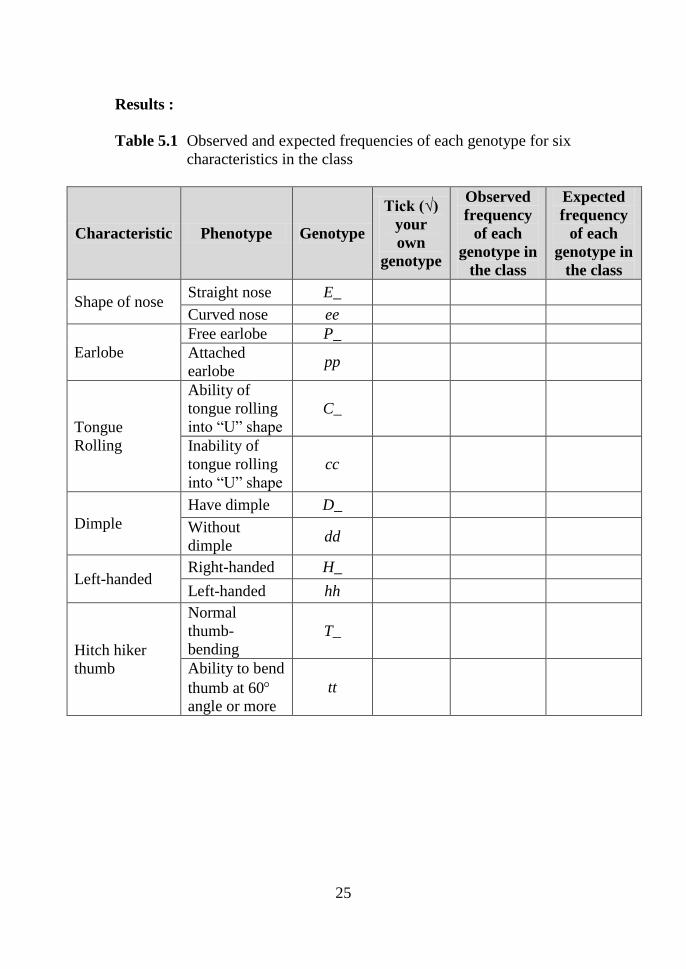
Results :
Table 5.1 Observed and expected frequencies of each genotype for six
characteristics in the class
Characteristic Phenotype Genotype
Tick (√)
your
own
genotype
Observed
frequency
of each
genotype in
the class
Expected
frequency
of each
genotype in
the class
Shape of nose Straight nose E_
Curved nose ee
Earlobe
Free earlobe P_
Attached
earlobe pp
Tongue
Rolling
Ability of
tongue rolling
into “U” shape
C_
Inability of
tongue rolling
into “U” shape
cc
Dimple
Have dimple D_
Without
dimple dd
Left-handed Right-handed H_
Left-handed hh
Hitch hiker
thumb
Normal
thumb-
bending
T_
Ability to bend
thumb at 60
angle or more
tt

26
Questions
1. Individuals with certain heterozygous characteristics are usually
called a carrier. What does a carrier mean?
2. A student inherited left handedness from parents who are both
right handed. Explain the pattern of inheritance.
3. What is the expected frequency for a person having tongue
rolling ability and attached earlobe?
4. What is the expected frequency for a person to have all six
recessive characteristics?
Exercise 5.2: ABO blood group inheritance
ABO blood groups in human are examples of multiple alleles of a
single gene and also codominant alleles. Each individual inherited any
one of four blood types, i.e. A, B, AB or O. Type A groups are
determined by the presence of antigen A found on the surface of red
blood cells (erythrocytes), while the blood plasma contains B antibody
which agglutinates type B blood. Individuals with type B blood have
antigen B and antibody A which agglutinates type A blood. Individuals
with type AB blood have both antigen A and antigen B but without
antibodies A or B. Finally, individuals with type O blood have
antibody A and antibody B but without any antigen. Table 5.2 shows
individual characteristics for all ABO blood groups.
Table 5.2Individual characteristics for all ABO blood groups
B
lood
group
(phenotypes)
Antigen
present
on
erythrocytes
Antibodies present
in blood plasma
(serum)
Agglutinated
blood group
A A Anti-B B
B B Anti-A A
AB A and B none none
O none Anti-A and
Anti-B A and B
27
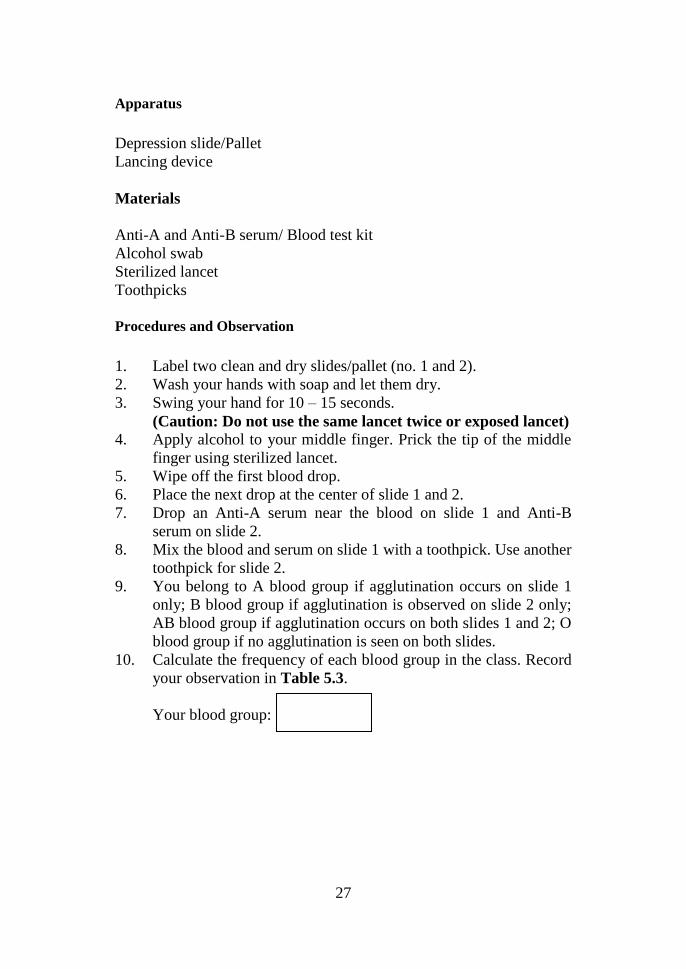
Apparatus
Depression slide/Pallet
Lancing device
Materials
Anti-A and Anti-B serum/ Blood test kit
Alcohol swab
Sterilized lancet
Toothpicks
Procedures and Observation
1. Label two clean and dry slides/pallet (no. 1 and 2).
2. Wash your hands with soap and let them dry.
3. Swing your hand for 10 – 15 seconds.
(Caution: Do not use the same lancet twice or exposed lancet)
4. Apply alcohol to your middle finger. Prick the tip of the middle
finger using sterilized lancet.
5. Wipe off the first blood drop.
6. Place the next drop at the center of slide 1 and 2.
7. Drop an Anti-A serum near the blood on slide 1 and Anti-B
serum on slide 2.
8. Mix the blood and serum on slide 1 with a toothpick. Use another
toothpick for slide 2.
9. You belong to A blood group if agglutination occurs on slide 1
only; B blood group if agglutination is observed on slide 2 only;
AB blood group if agglutination occurs on both slides 1 and 2; O
blood group if no agglutination is seen on both slides.
10. Calculate the frequency of each blood group in the class. Record
your observation in Table 5.3.
Your blood group:

28
Table 5.3Frequency of blood group in the class
Blood group Possible genotypes Frequency of each
blood group
A
B
AB
O
Questions
1. Why do you swing your hand for 10 to15 seconds before
pricking the tip of your middle finger?
2. Why can’t you use the same lancet twice?
3. Why do you need to wipe off the first blood drop?
4. Why do you need different toothpicks to mix the blood and
serum on slides 1 and 2?
5. Can an individual with O blood group donates his blood to an A
blood group person? Give reason to your answer.
6. A mother with O blood group gave birth to a baby girl having the
same blood group. However, she is not convinced that the baby
belongs to her because her husband has AB blood group. She
claimed there might be swapping of babies in the nursery.
Explain.

29
EXPERIMENT 6: BASIC TECHNIQUES IN ISOLATING DNA
Course Learning Objective: Conduct biology laboratory work on
microscopy, biological molecules, histology and genetics information by
applying manipulative skills.
(P3, CLO 2, PLO 2, MQF LOD 2)
Learning Outcomes: At the end of this lesson, students should be able to:
i. To isolate DNA from plant tissue.
Student Learning Time (SLT):
Face-to-face Non face-to-face
2 hour 0
Introduction
Each chromosome is a single thread-like structure made up of long
molecules of DNA combined with histone protein. The DNA molecule
is made up of many small sections called genes. Shortly before cell
division occurs, each DNA molecule replicates itself. So one thread of
the chromosome becomes two identical chromatids. As the two
chromatids are identical, they will have identical genes. These identical
genes are known as allele. In this experiment, you will rupture fruit
cells, thus releasing their contents such as protein, DNA, RNA, lipids,
ribosomes and various small molecules. DNA is then suspended by
alcohol as supernatant layer.
The purity of DNA will require further steps. After the isolation of
nucleic acids, the solution is still contaminated with proteins which can
be removed. To check the success of the removal, a purity
determination is performed, which is based on the different absorption
characteristics of the proteins and the nucleic acids using UV
spectrophotometer.
30
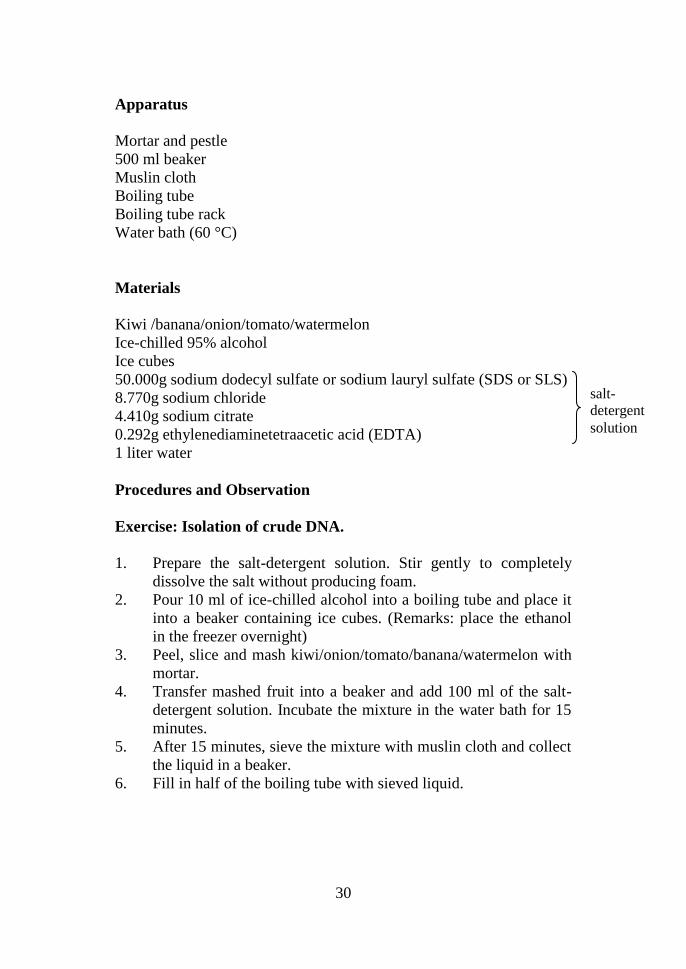
Apparatus
Mortar and pestle
500 ml beaker
Muslin cloth
Boiling tube
Boiling tube rack
Water bath (60 °C)
Materials
Kiwi /banana/onion/tomato/watermelon
Ice-chilled 95% alcohol
Ice cubes
50.000g sodium dodecyl sulfate or sodium lauryl sulfate (SDS or SLS)
8.770g sodium chloride
4.410g sodium citrate
0.292g ethylenediaminetetraacetic acid (EDTA)
1 liter water
Procedures and Observation
Exercise: Isolation of crude DNA.
1. Prepare the salt-detergent solution. Stir gently to completely
dissolve the salt without producing foam.
2. Pour 10 ml of ice-chilled alcohol into a boiling tube and place it
into a beaker containing ice cubes. (Remarks: place the ethanol
in the freezer overnight)
3. Peel, slice and mash kiwi/onion/tomato/banana/watermelon with
mortar.
4. Transfer mashed fruit into a beaker and add 100 ml of the salt-
detergent solution. Incubate the mixture in the water bath for 15
minutes.
5. After 15 minutes, sieve the mixture with muslin cloth and collect
the liquid in a beaker.
6. Fill in half of the boiling tube with sieved liquid.
salt-
detergent
solution

31
7. Very carefully pour 10ml of ice-chilled alcohol into the side of
the boiling tube (at flat angle). (Remark: make sure both liquid
do not mix and alcohol form a separate layer on top of the sieved
liquid)
8. Put the boiling tube into a rack and observe it. Observe the
extracted DNA between alcohol and the sieved liquid. Crude
DNA should be found in between the alcohol and sieved liquid.
Questions
1. What is the purpose of using the following?
(a) salt-detergent solution
(b) ice chilled alcohol
(c) water bath
2. Why do we need to mash the fruits?

BIOLOGY 2
SB025
32
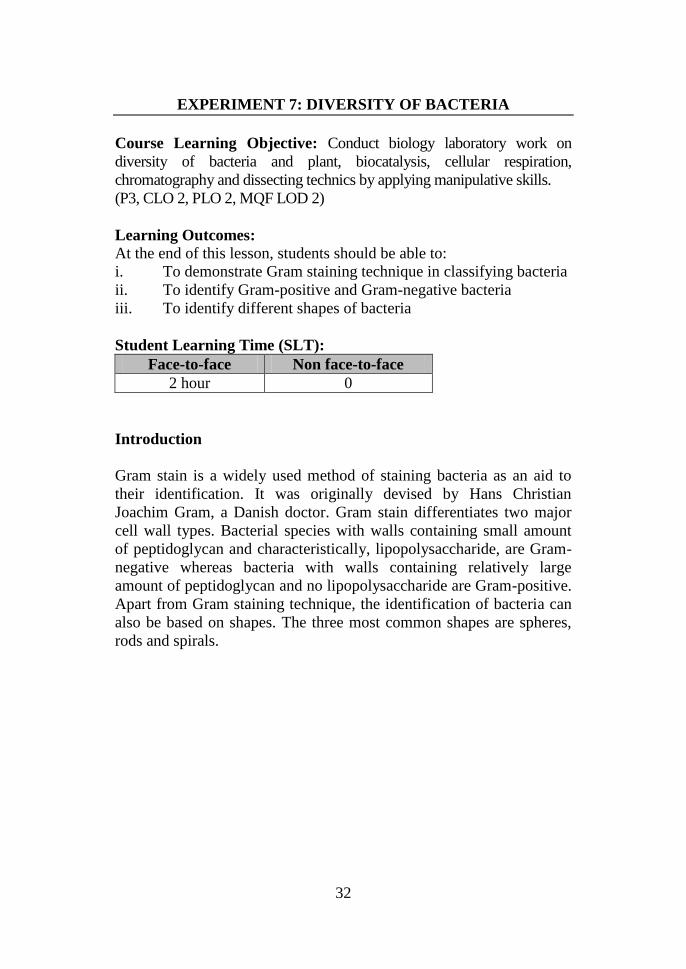
EXPERIMENT 7: DIVERSITY OF BACTERIA
Course Learning Objective: Conduct biology laboratory work on
diversity of bacteria and plant, biocatalysis, cellular respiration,
chromatography and dissecting technics by applying manipulative skills.
(P3, CLO 2, PLO 2, MQF LOD 2)
Learning Outcomes: At the end of this lesson, students should be able to:
i. To demonstrate Gram staining technique in classifying bacteria
ii. To identify Gram-positive and Gram-negative bacteria
iii. To identify different shapes of bacteria
Student Learning Time (SLT):
Face-to-face Non face-to-face
2 hour 0
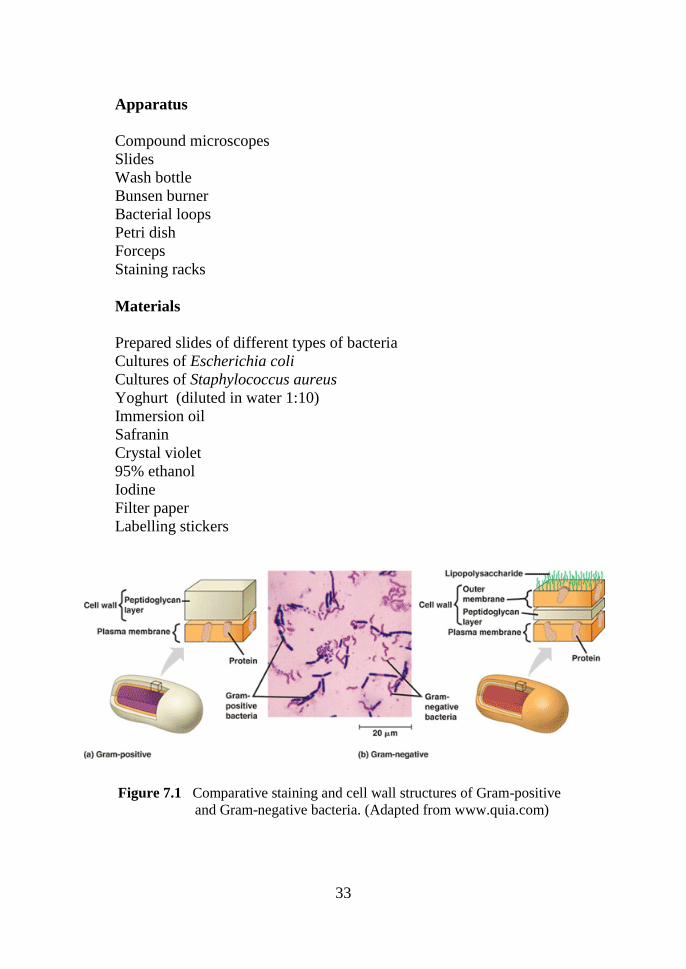
Introduction
Gram stain is a widely used method of staining bacteria as an aid to
their identification. It was originally devised by Hans Christian
Joachim Gram, a Danish doctor. Gram stain differentiates two major
cell wall types. Bacterial species with walls containing small amount
of peptidoglycan and characteristically, lipopolysaccharide, are Gram-
negative whereas bacteria with walls containing relatively large
amount of peptidoglycan and no lipopolysaccharide are Gram-positive.
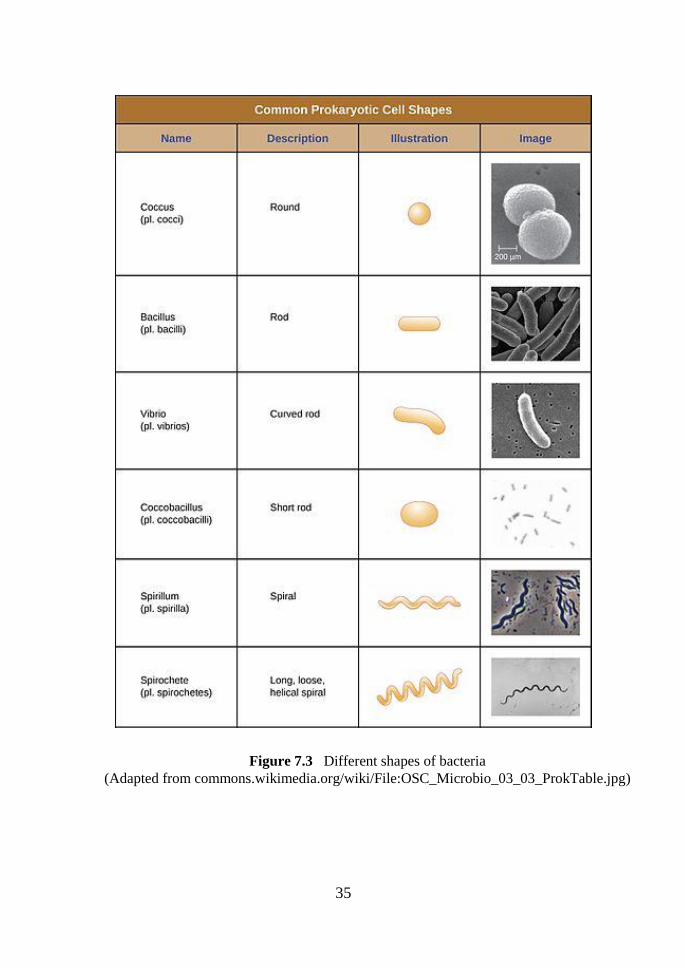
Apart from Gram staining technique, the identification of bacteria can
also be based on shapes. The three most common shapes are spheres,
rods and spirals.
33
Apparatus
Compound microscopes
Slides
Wash bottle
Bunsen burner
Bacterial loops
Petri dish
Forceps
Staining racks
Materials
Prepared slides of different types of bacteria
Cultures of Escherichia coli
Cultures of Staphylococcus aureus
Yoghurt (diluted in water 1:10)
Immersion oil
Safranin
Crystal violet
95% ethanol
Iodine
Filter paper
Labelling stickers
Figure 7.1 Comparative staining and cell wall structures of Gram-positive
and Gram-negative bacteria. (Adapted from www.quia.com)
34
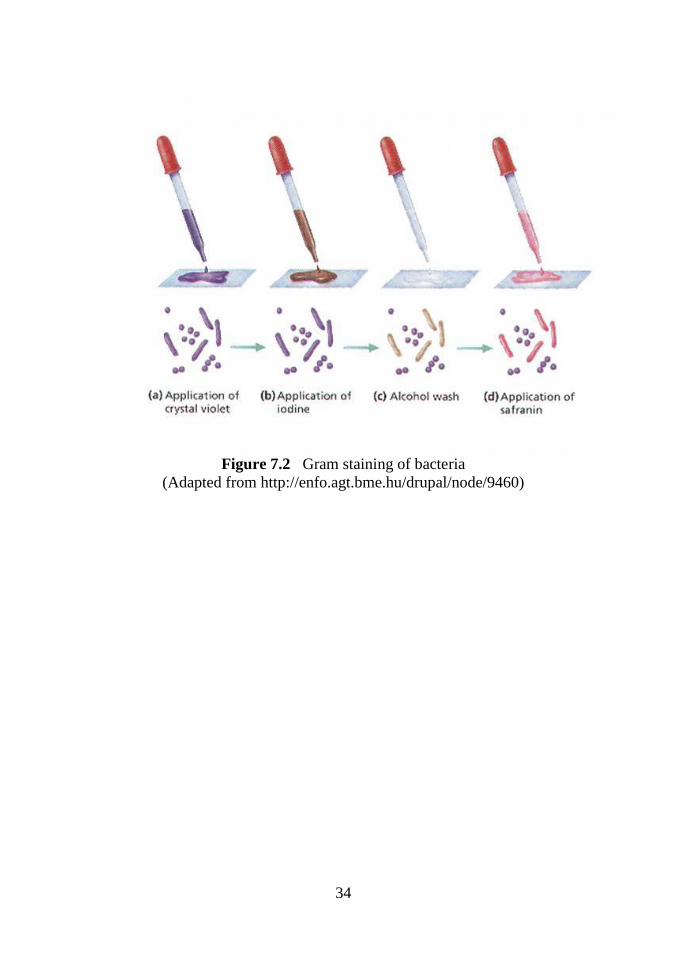
Figure 7.2 Gram staining of bacteria
(Adapted from http://enfo.agt.bme.hu/drupal/node/9460)
35
Figure 7.3 Different shapes of bacteria
(Adapted from commons.wikimedia.org/wiki/File:OSC_Microbio_03_03_ProkTable.jpg)
36
Procedures and Observation
1. Put a slide into the petri dish. Pour 95% alcohol and soak for
about 30 seconds. Then use forceps to take out the slide. Let the
slide dry and heat it by placing above the flame.
2. Place a loop of sterile distilled water on the slide and put a little
bit of bacterial colony.
3. Gently heat the slide to fix the bacteria onto the slide.
4. Place the slide on the staining rack. Cover the smear with single
drop of crystal violet and wait for 30 seconds to one minute.
5. Gently, rinse the slide with slow running water.
6. Cover smear with 2 drops of iodine. Rotate and tilt the slides to
allow the iodine to drain. Then, cover again with iodine for 30
seconds to one minute. Since the iodine does not mix well with
water, this procedure ensures that the iodine will be in contact
with the cell walls of the bacteria on the slide.
7. Rinse the slide with water as in step 6.
8. Place several drops of 95% alcohol (decolouriser) evenly over
the smears, rotate and tilt the slide. Continue to add alcohol until
most of the excess stain is removed and the alcohol running from
the slide appears clear.
This is the most critical step of the procedures! If the smears
are too thick, or if the alcohol is kept on the slide for too long or
too short a time, the results will not be accurate. Although there
is no recommended time for this step, it usually takes 10-20
seconds to decolourise if exposed to a sufficient amount of
decolouriser.
9. Add few drops of safranin on the bacterial smear and leave it for
approximately 30-45 seconds.
Colourless Gram-negative cell will readily accept the light
red safranin stain, while the already dark coloured Gram-
positive cell will undergo no change at all.
10. Rinse off with water and blot dry with filter paper.
11. Observe the slide under oil immersion magnification and
describe your observation in terms of types of bacteria, shape,
colour and determine whether it is Gram-positive or Gram-
negative.
12. Repeat steps 2-11 for microorganisms found in yoghurt.
37
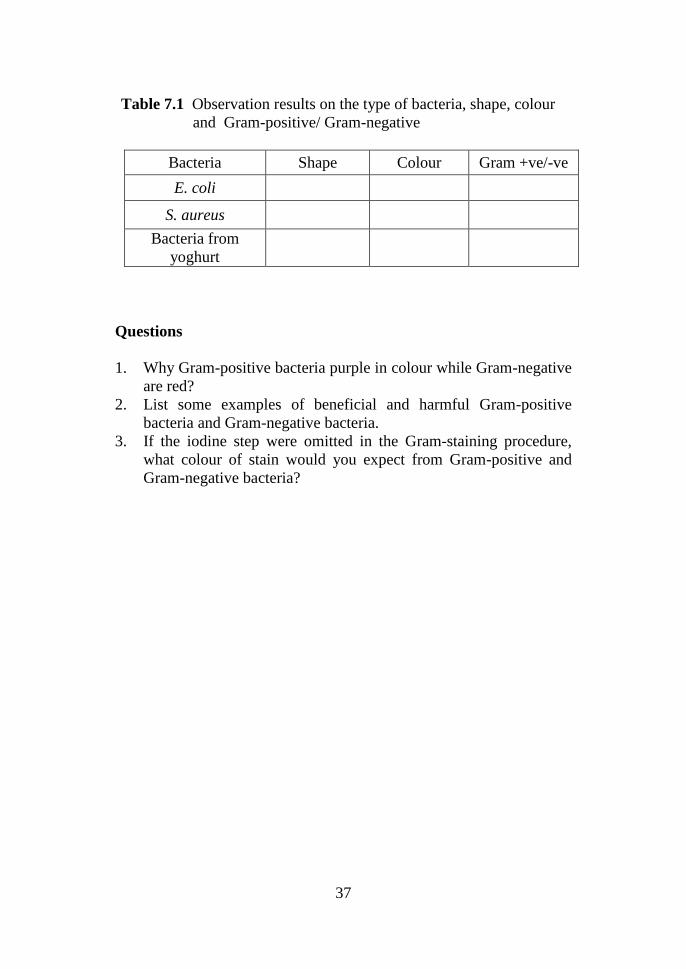
Table 7.1 Observation results on the type of bacteria, shape, colour
and Gram-positive/ Gram-negative
Bacteria Shape Colour Gram +ve/-ve
E. coli
S. aureus
Bacteria from
yoghurt
Questions
1. Why Gram-positive bacteria purple in colour while Gram-negative
are red?
2. List some examples of beneficial and harmful Gram-positive
bacteria and Gram-negative bacteria.
3. If the iodine step were omitted in the Gram-staining procedure,
what colour of stain would you expect from Gram-positive and
Gram-negative bacteria?
38
EXPERIMENT 8: PLANT DIVERSITY - BRYOPHYTES AND
PTERIDOPHYTES
Course Learning Objective: Conduct biology laboratory work on
diversity of bacteria and plant, biocatalysis, cellular respiration,
chromatography and dissecting technics by applying manipulative skills.
(P3, CLO 2, PLO 2, MQF LOD 2)
Learning Outcomes: At the end of this lesson, students should be able to:
i. To observe the diversity of species in bryophytes and
pteridophytes.
ii. To construct scientific drawing of bryophytes and
pteridophytes.
Student Learning Time (SLT):
Face-to-face Non face-to-face
2 hour 0
Introduction
Bryophytes and pteridophytes are two large groups of spore producing
terrestrial plants. Compared to the flowering plants, they have a longer
history of evolution.
Bryophytes
There are three main divisions of bryophytes, namely Bryophyta
(mosses), Hepatophyta (liverworts), and Anthocerophyta (hornworts).
Bryophytes are the most primitive among the terrestrial plants. They
are non-vascular and are confined to moist areas because they lack
well developed tissues for transporting water and nutrients. Bryophytes
have a root-like structure, which is called rhizoid and have no true
stem and leaves. Bryophytes are characterized by clear alternation of
generation in its life cycle where the gametophyte generation is
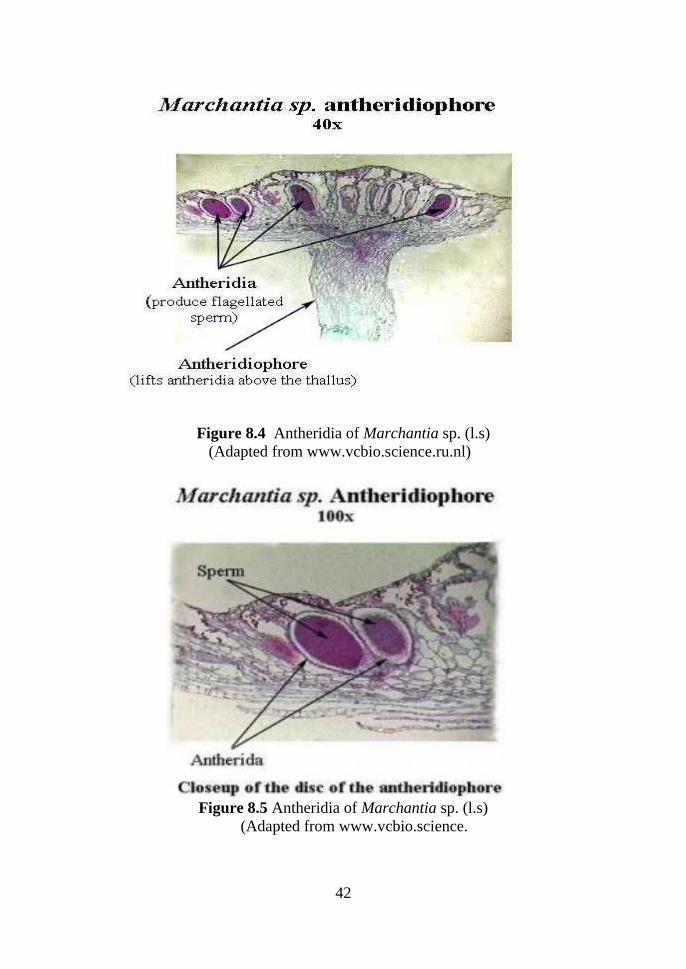
dominant. The male reproductive organ is called antheridium and
produces flagellated sperms (antherozoids). The sperm fertilizes the
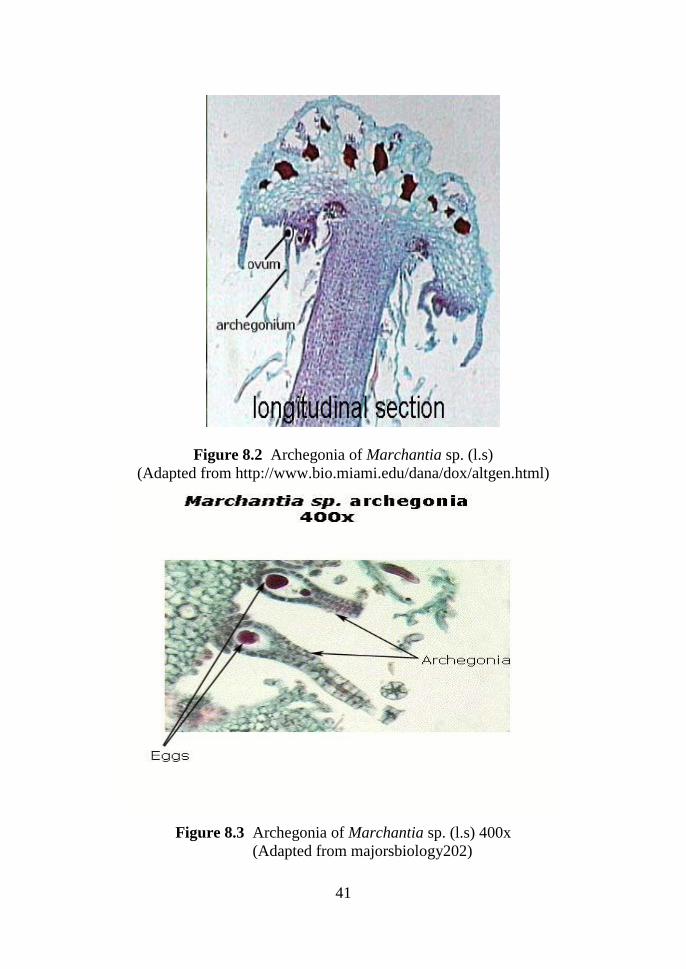
egg (oosphere), which is produced by the archegonium that is the
female reproductive organ.
39
After fertilization, the zygote develops in the archegonium to produce
sporophyte, which grows out from the gametophyte. The sporophyte
produces haploid spores, which will eventually give rise to mature
gametophytes.
Pteridophytes
Pteridophytes are the only non-flowering seedless plants possessing
vascular tissues – xylem and phloem. This enables pteridophytes to
achieve larger sizes than the bryophytes. In the tropics, ferns may grow
up to 18 m (60 ft). A major difference between pteridophytes and
bryophytes is that the diploid sporophyte generation is dominant in
pteridophytes. The gametophyte generation retains two traits that are
reminiscent of the bryophyte. Firstly, the small gametophytes lack
conducting vessels. Secondly, as in bryophytes, the flagellated sperms
(antherozoids) require water medium to reach the egg (oosphere), so
pteridophytes still depend on the presence of water for sexual
reproduction. Pteridophytes have true stems with vascular tissues, and
also true roots and leaves.
Exercise 8.1 Bryophytes
Apparatus
Compound microscope
Materials
Prepared slides
Marchantia sp. - capsule l.s
Marchantia sp. - male gametophyte (antheridium) l.s
Marchantia sp. - female gametophyte (archegonium) l.s
Polytrichum sp. - capsule l.s
40
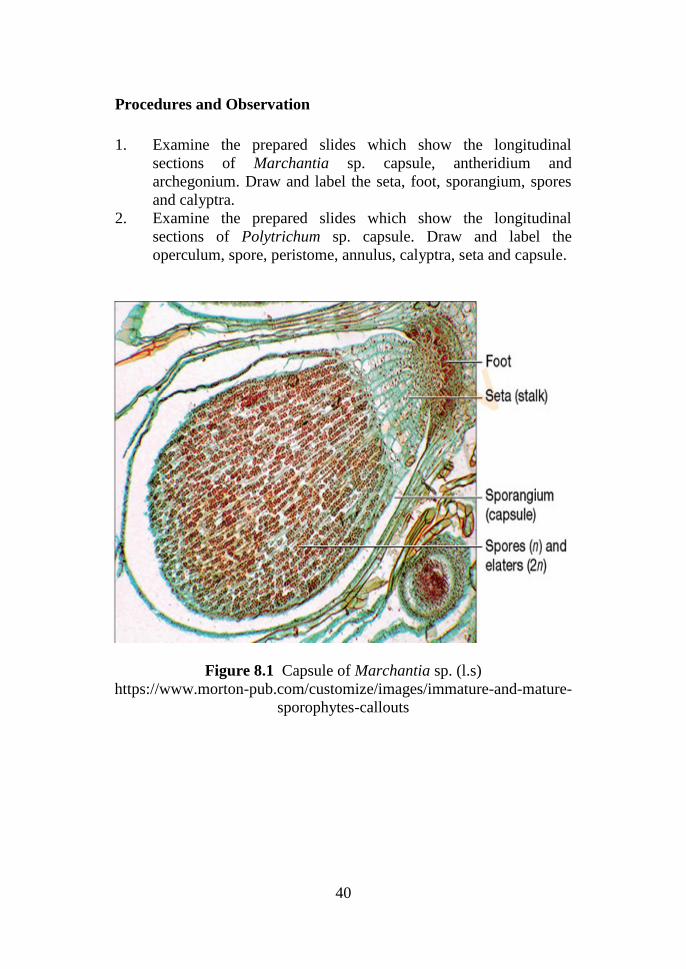
Procedures and Observation
1. Examine the prepared slides which show the longitudinal
sections of Marchantia sp. capsule, antheridium and
archegonium. Draw and label the seta, foot, sporangium, spores
and calyptra.
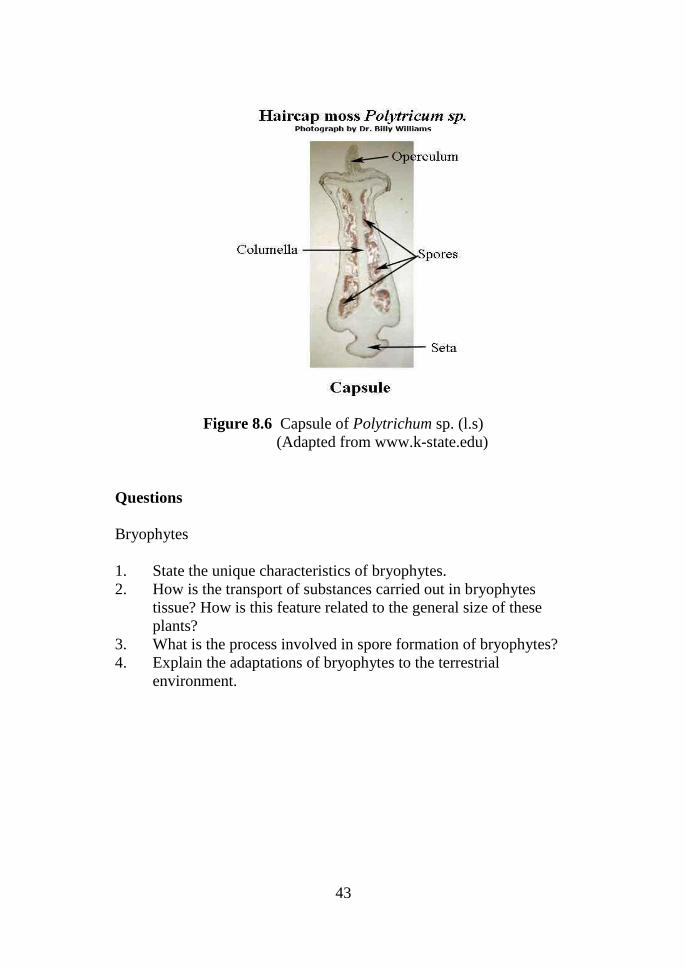
2. Examine the prepared slides which show the longitudinal
sections of Polytrichum sp. capsule. Draw and label the
operculum, spore, peristome, annulus, calyptra, seta and capsule.
Figure 8.1 Capsule of Marchantia sp. (l.s)
https://www.morton-pub.com/customize/images/immature-and-mature-
sporophytes-callouts
41
Figure 8.2 Archegonia of Marchantia sp. (l.s)
(Adapted from http://www.bio.miami.edu/dana/dox/altgen.html)
Figure 8.3 Archegonia of Marchantia sp. (l.s) 400x
(Adapted from majorsbiology202)
42
Figure 8.4 Antheridia of Marchantia sp. (l.s)
(Adapted from www.vcbio.science.ru.nl)
Figure 8.5 Antheridia of Marchantia sp. (l.s)
(Adapted from www.vcbio.science.
43
Figure 8.6 Capsule of Polytrichum sp. (l.s)
(Adapted from www.k-state.edu)
Questions
Bryophytes
1. State the unique characteristics of bryophytes.
2. How is the transport of substances carried out in bryophytes
tissue? How is this feature related to the general size of these
plants?
3. What is the process involved in spore formation of bryophytes?
4. Explain the adaptations of bryophytes to the terrestrial
environment.
44
Exercise 8.2 Pteridophytes
Apparatus
Compound microscope
Dissecting microscope
Magnifying glass
Razor blade
Tiles
Materials
Fresh specimens:
Selaginella sp. (Division Lycopodiophyta)
Dryopteris sp. (Division Pteridophyta)
Prepared slides:
Lycopodium sp. – strobilus l.s
Selaginella sp. – strobilus l.s
Procedures and Observation
1. Examine the specimens of Selaginella sp. Observe the
dichotomous branching, types and arrangement of sporophyll and
strobilus.
2. Examine the specimens of Dryopteris sp. Draw and label the
rhizome, rhizoid, rachis, frond, pinna and sorus.
3. Examine the prepared slides showing longitudinal sections of the
strobilus of Lycopodium sp. and Selaginella sp. Draw and label
sporophyll, sporangium and spore (homosporous or
heterosporous).
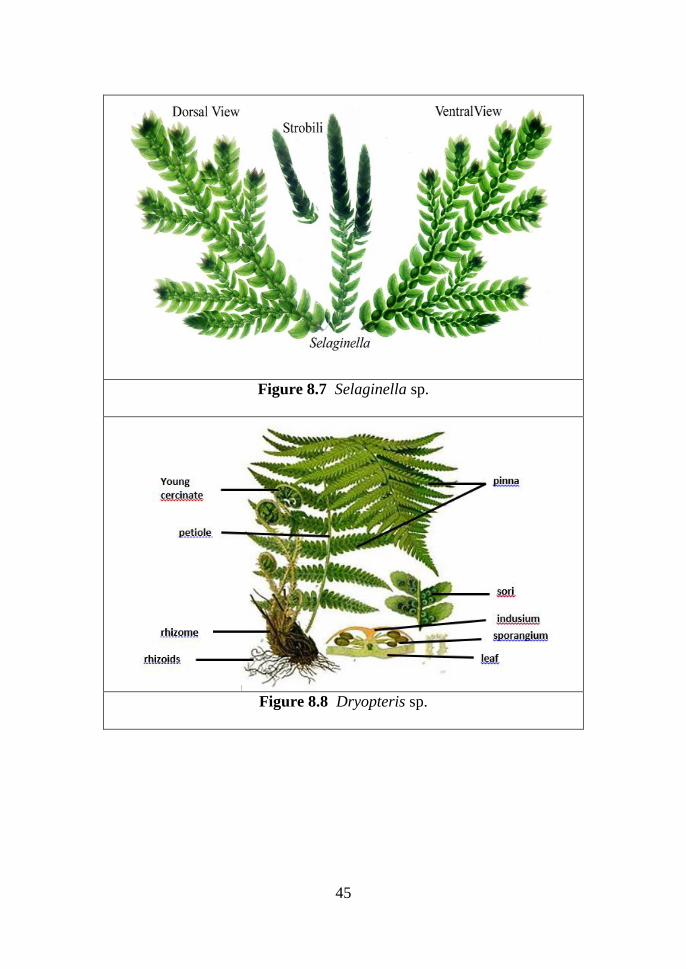
45
Figure 8.7 Selaginella sp.
Figure 8.8 Dryopteris sp.
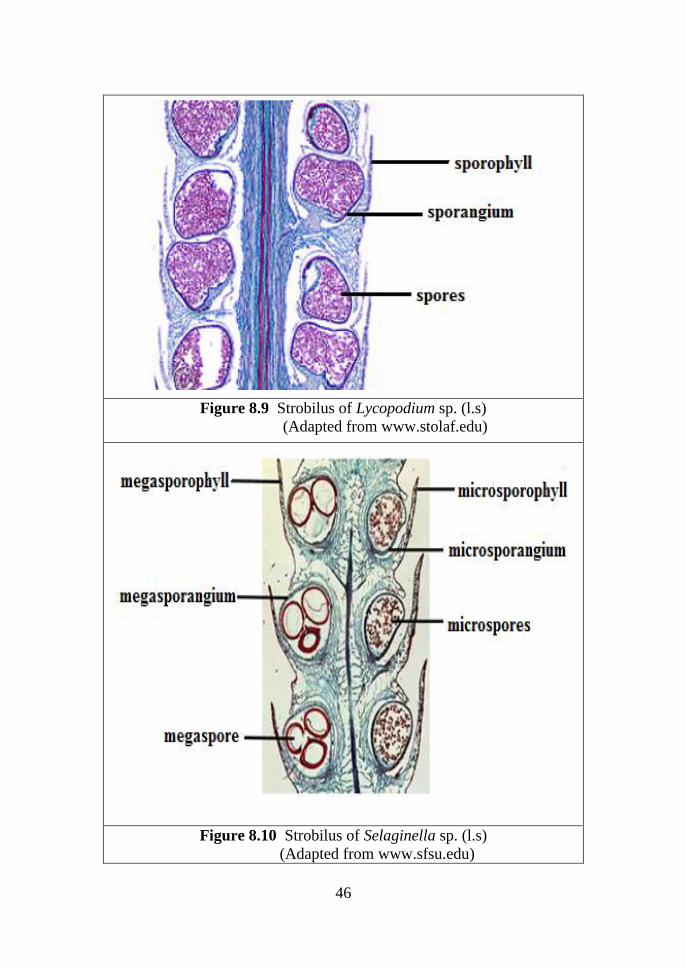
46
Figure 8.9 Strobilus of Lycopodium sp. (l.s)
(Adapted from www.stolaf.edu)
Figure 8.10 Strobilus of Selaginella sp. (l.s)
(Adapted from www.sfsu.edu)

47
Questions
Pteridophytes
1. State the unique characteristics of pteridophytes.
2. Fern sporophytes have an underground stem called rhizomes. How
do you distinguish that rhizomes are stems and not roots?
3. Compare the spores of Lycopodium sp. and Selaginella sp.
4. Division Pteridophyta is considered to be more advanced than
Division Lycopodiophyta. Explain the advanced characteristic of
Division Pteridophyta.
48
EXPERIMENT 9: BIOCATALYSIS
Course Learning Objective: Conduct biology laboratory work on
diversity of bacteria and plant, biocatalysis, cellular respiration,
chromatography and dissecting technics by applying manipulative skills.
(P3, CLO 2, PLO 2, MQF LOD 2)
Learning Outcomes: At the end of this lesson, students should be able to:
i. To extract catalase from liver tissue
ii. To observe the qualitative activity of catalase.
iii. To measure the quantitative activity of catalase.
iv. To determine the factors affecting the catalase activity.
Student Learning Time (SLT):
Face-to-face Non face-to-face
2 hour 0
Introduction
Enzymes are biological catalysts, normally proteins, synthesized by
living organisms. Enzymes speed up reactions by lowering the
activation energy. Enzymes are normally very specific. An enzyme
catalyses a single reaction that involves one or two specific molecules
called substrates. Each enzyme has evolved to function optimally at a
particular pH, temperature and salt concentration. Some require the
presence of other molecules called coenzymes, derived from water-
soluble vitamins, for its function. The rate of reaction also depends on
the amount of enzymes present.
In this experiment, the enzyme to be extracted and tested is catalase,
which present in almost all cells especially in the liver and red blood
cells. The substrate for this enzyme is hydrogen peroxide (H2O2). The
accumulation of hydrogen peroxide in the body is toxic. Catalase
renders the hydrogen peroxide harmless by breaking it down to water
and oxygen.
catalase
2H2O2 2H2O + O2
49
The chemical properties of catalase resembles most those of the
enzymes.
(Note: The success of this experiment depends on the amount of
catalase present in the prepared extract. The results of the catalase
reaction can be observed clearly if the amount of enzyme in the extract
is large. Use a boiling test tube to avoid spillage during the reaction).
Apparatus
Beakers (250 ml & 1000 ml)
Glass rod
Boiling tube
Boiling tube rack
Blade
Dropper
Filter funnel
Measuring cylinder (10 ml)
Mortar and pestle
Muslin cloth
Labelling stickers
Retort stand
Rubber stopper
Syringe (1 ml)
Thermometer
Tile
Tissue paper
Waterbath
Materials
Fresh liver of a cow/chicken
Distilled water
3 % H2O2 solution
1 M H2SO4
1 % KMnO4 solution
Ice cubes
Phosphate buffer solutions (pH 5, pH 7, pH 9 and pH 11)
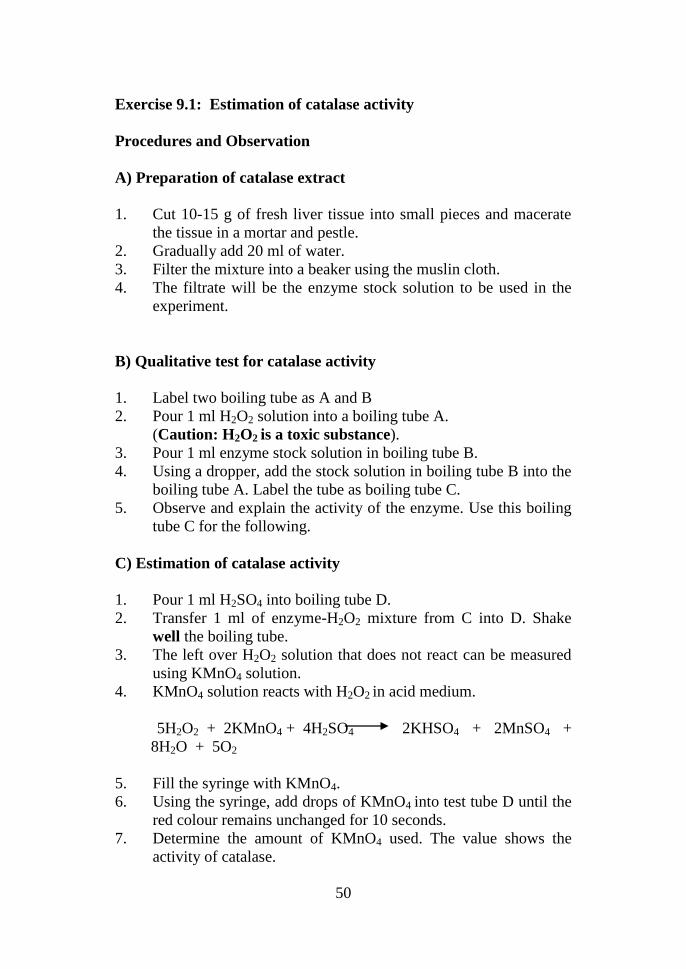
50
Exercise 9.1: Estimation of catalase activity
Procedures and Observation
A) Preparation of catalase extract
1. Cut 10-15 g of fresh liver tissue into small pieces and macerate
the tissue in a mortar and pestle.
2. Gradually add 20 ml of water.
3. Filter the mixture into a beaker using the muslin cloth.
4. The filtrate will be the enzyme stock solution to be used in the
experiment.
B) Qualitative test for catalase activity
1. Label two boiling tube as A and B
2. Pour 1 ml H2O2 solution into a boiling tube A.
(Caution: H2O2 is a toxic substance).
3. Pour 1 ml enzyme stock solution in boiling tube B.
4. Using a dropper, add the stock solution in boiling tube B into the
boiling tube A. Label the tube as boiling tube C.
5. Observe and explain the activity of the enzyme. Use this boiling
tube C for the following.
C) Estimation of catalase activity
1. Pour 1 ml H2SO4 into boiling tube D.
2. Transfer 1 ml of enzyme-H2O2 mixture from C into D. Shake
well the boiling tube.
3. The left over H2O2 solution that does not react can be measured
using KMnO4 solution.
4. KMnO4 solution reacts with H2O2 in acid medium.
5H2O2 + 2KMnO4 + 4H2SO4 2KHSO4 + 2MnSO4 +
8H2O + 5O2
5. Fill the syringe with KMnO4.
6. Using the syringe, add drops of KMnO4 into test tube D until the
red colour remains unchanged for 10 seconds.
7. Determine the amount of KMnO4 used. The value shows the
activity of catalase.
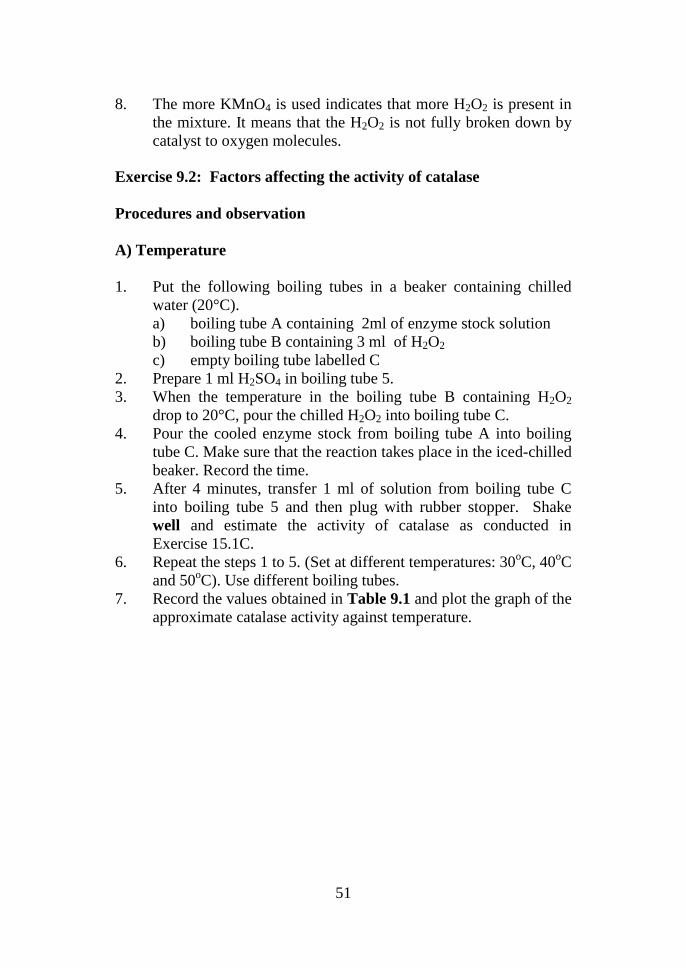
51
8. The more KMnO4 is used indicates that more H2O2 is present in
the mixture. It means that the H2O2 is not fully broken down by
catalyst to oxygen molecules.
Exercise 9.2: Factors affecting the activity of catalase
Procedures and observation
A) Temperature
1. Put the following boiling tubes in a beaker containing chilled
water (20°C).
a) boiling tube A containing 2ml of enzyme stock solution
b) boiling tube B containing 3 ml of H2O2
c) empty boiling tube labelled C
2. Prepare 1 ml H2SO4 in boiling tube 5.
3. When the temperature in the boiling tube B containing H2O2
drop to 20°C, pour the chilled H2O2 into boiling tube C.
4. Pour the cooled enzyme stock from boiling tube A into boiling
tube C. Make sure that the reaction takes place in the iced-chilled
beaker. Record the time.
5. After 4 minutes, transfer 1 ml of solution from boiling tube C
into boiling tube 5 and then plug with rubber stopper. Shake
well and estimate the activity of catalase as conducted in
Exercise 15.1C.
6. Repeat the steps 1 to 5. (Set at different temperatures: 30oC, 40
oC
and 50oC). Use different boiling tubes.
7. Record the values obtained in Table 9.1 and plot the graph of the
approximate catalase activity against temperature.
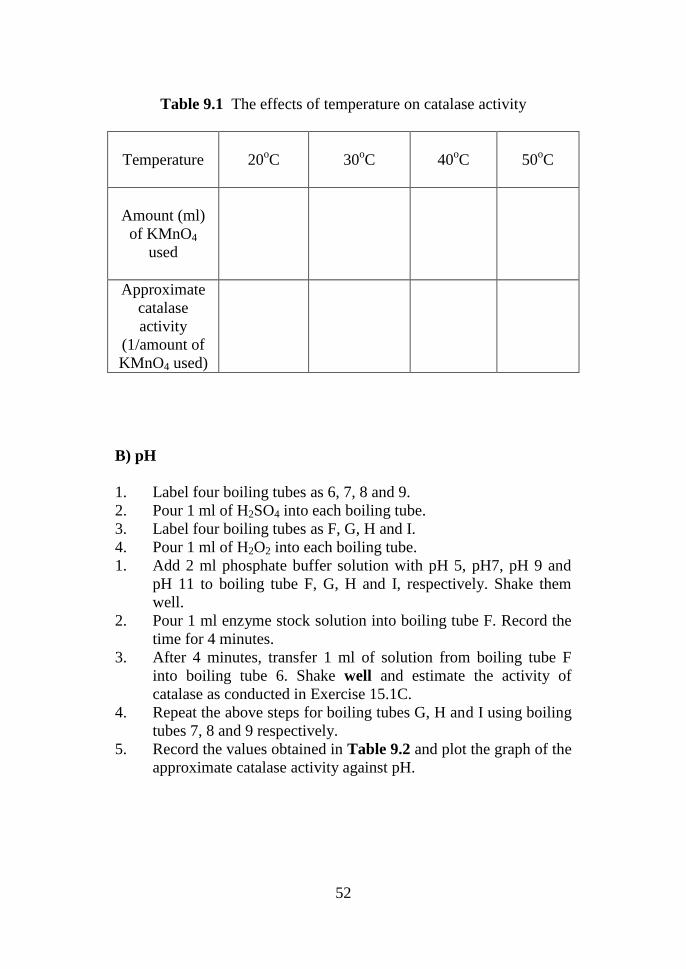
52
Table 9.1 The effects of temperature on catalase activity
Temperature
20oC
30oC
40oC
50oC
Amount (ml)
of KMnO4
used
Approximate
catalase
activity
(1/amount of
KMnO4 used)
B) pH
1. Label four boiling tubes as 6, 7, 8 and 9.
2. Pour 1 ml of H2SO4 into each boiling tube.
3. Label four boiling tubes as F, G, H and I.
4. Pour 1 ml of H2O2 into each boiling tube.
1. Add 2 ml phosphate buffer solution with pH 5, pH7, pH 9 and
pH 11 to boiling tube F, G, H and I, respectively. Shake them
well.
2. Pour 1 ml enzyme stock solution into boiling tube F. Record the
time for 4 minutes.
3. After 4 minutes, transfer 1 ml of solution from boiling tube F
into boiling tube 6. Shake well and estimate the activity of
catalase as conducted in Exercise 15.1C.
4. Repeat the above steps for boiling tubes G, H and I using boiling
tubes 7, 8 and 9 respectively.
5. Record the values obtained in Table 9.2 and plot the graph of the
approximate catalase activity against pH.

53
Table 9.2 The effects of pH on catalase activity
pH
5
7
9
11
Amount (ml) of
KMnO4 used
Approximate
catalase activity
(1/amount of
KMnO4 used)
Notes:
1. Ensure all apparatus are clean, in order to obtain accurate results.
2. Measure precisely the volume of the solutions used.
Questions
1. What is the role of H2SO4 in the reaction?
2. Explain the effects of the following factors on the enzymatic
reaction:
(a) temperature
(b) pH
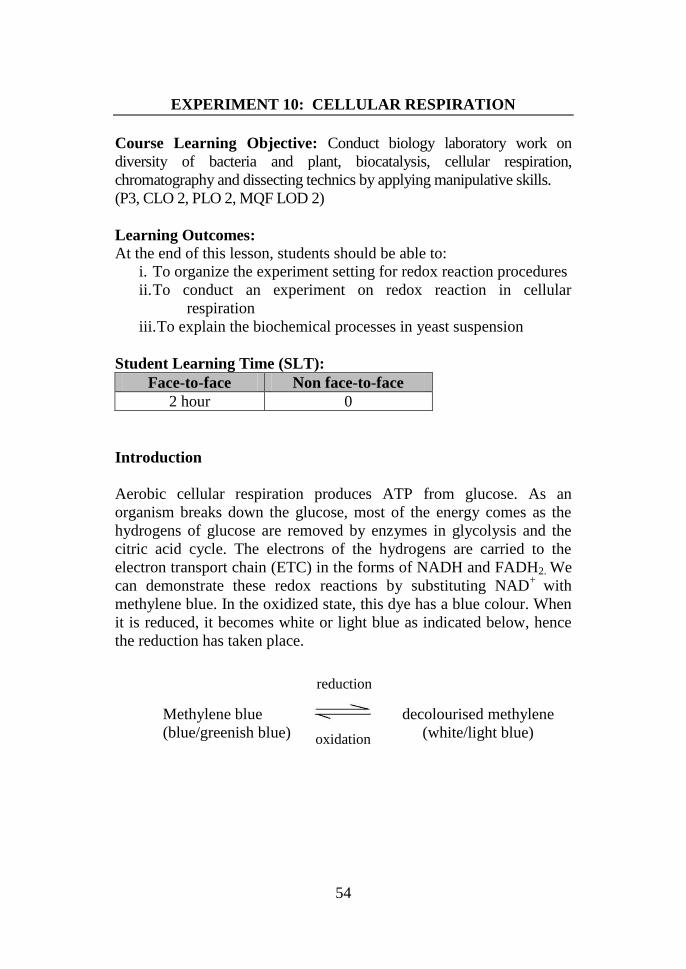
54
EXPERIMENT 10: CELLULAR RESPIRATION
Course Learning Objective: Conduct biology laboratory work on
diversity of bacteria and plant, biocatalysis, cellular respiration,
chromatography and dissecting technics by applying manipulative skills.
(P3, CLO 2, PLO 2, MQF LOD 2)
Learning Outcomes: At the end of this lesson, students should be able to:
i. To organize the experiment setting for redox reaction procedures
ii. To conduct an experiment on redox reaction in cellular
respiration
iii. To explain the biochemical processes in yeast suspension
Student Learning Time (SLT):
Face-to-face Non face-to-face
2 hour 0
Introduction
Aerobic cellular respiration produces ATP from glucose. As an
organism breaks down the glucose, most of the energy comes as the
hydrogens of glucose are removed by enzymes in glycolysis and the
citric acid cycle. The electrons of the hydrogens are carried to the
electron transport chain (ETC) in the forms of NADH and FADH2. We
can demonstrate these redox reactions by substituting NAD+
with
methylene blue. In the oxidized state, this dye has a blue colour. When
it is reduced, it becomes white or light blue as indicated below, hence
the reduction has taken place.
Methylene blue decolourised methylene
(blue/greenish blue) (white/light blue)
reduction
oxidation
55
Apparatus
Beaker (250 mL)
Boiling tubes
Bunsen burner
Cork or rubber stopper
Dropper
Labelling paper
Measuring cylinder (10 mL)
Pasteur pipette
Stopwatch
Thermometer
Tripod stand
Water bath (380C – 42
0C)
Materials
Methylene blue 0.1%
Yeast suspension (5%) added to 1% glucose (freshly prepared)
Procedures and Observation
1. Label 3 boiling tubes as A, B and C.
2. Fill in tube with 10 mL of yeast suspension.
3. Heat tube C in boiling water for 5 minutes.
4. Add 5 drops of methylene blue into each of the tubes using
Pasteur pipette. Shake gently to ensure the colour is evenly
distributed.
5. Incubate all tubes in the water bath (40oC) for 15 minutes.
6. Observe the colour changes in all tubes.
7. Heat tube B in boiling water for 5 minutes.
8. Plug tube A, B and C with cork or rubber stopper. Press it with
your thumb and shake the tube vigorously for 30 seconds.
Observe the colour changes. Remove the stopper and incubate all
tubes in water bath (40oC) for 15 minutes.
9. Observe the colour of the yeast suspension precipitate in each
tube.
Note: Observations are based on the colour changes.
10. Record your observations in Table 10.1.
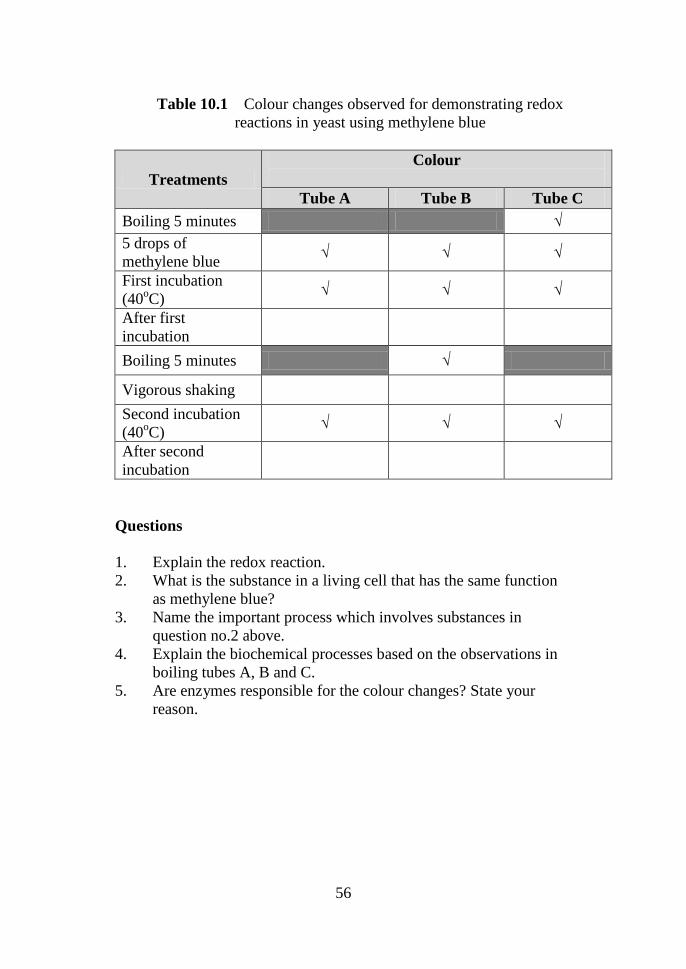
56
Table 10.1 Colour changes observed for demonstrating redox
reactions in yeast using methylene blue
Treatments
Colour
Tube A Tube B Tube C
Boiling 5 minutes √
5 drops of
methylene blue √ √ √
First incubation
(40oC)
√ √ √
After first
incubation
Boiling 5 minutes √
Vigorous shaking
Second incubation
(40oC)
√ √ √
After second
incubation
Questions
1. Explain the redox reaction.
2. What is the substance in a living cell that has the same function
as methylene blue?
3. Name the important process which involves substances in
question no.2 above.
4. Explain the biochemical processes based on the observations in
boiling tubes A, B and C.
5. Are enzymes responsible for the colour changes? State your
reason.
57
EXPERIMENT 11: PHOTOSYNTHESIS
Course Learning Objective: Conduct biology laboratory work on
diversity of bacteria and plant, biocatalysis, cellular respiration,
chromatography and dissecting technics by applying manipulative skills.
(P3, CLO 2, PLO 2, MQF LOD 2)
Learning Outcomes: At the end of this lesson, students should be able to:
i. To demonstrate chromatography technique to separate the
photosynthetic pigments
ii. To calculate Rf value
Student Learning Time (SLT):
Face-to-face Non face-to-face
2 hour 0
Introduction
The chloroplasts in green plants contain many pigments such as
chlorophyll a, chlorophyll b, carotene, phaeophytin and xanthophylls.
These pigments have different solubility in certain solvent and they can
be separated by chromatography.
Paper chromatography is a useful technique for separating and
identifying pigments and other molecules from cell extracts that
contain a complex mixture of molecules. Typically, a drop of the
sample is applied as a spot to a sheet of chromatography paper. The
solvent moves up the paper by capillary action, which occurs as a
result of the attraction of solvent molecules to the paper and the
attraction of solvent molecules to one another. As the solvent moves up
the paper, it carries along any substances dissolved in it. The pigments
are carried along at different rates because they are attracted to
different degrees, to the fibres in the paper through the formation of
intermolecular bonds, such as hydrogen bonds. Another factor that is
taken into account is molecular size.
58
Apparatus
Beaker (100 mL)
Blade
Boiling tube rack
Boiling tube with cork stopper
Chromatography paper strip (Whatman No. 3) with pointed end
Dissecting pin
Filter funnel
Forceps
Hair dryer
Labelling paper
Measuring cylinder
Mortar and pestle
Muslin cloth
Spatula
Materials
Fresh leaves:
i. Sauropus sp. (Cekur manis)
ii. Pandanus sp. (Pandan)
iii. Erythrina sp. (Dedap)
iv. Coleus sp. (Ati-ati)
Solvent (mixture of ether petroleum-acetone at 9:1, freshly prepared)
Acetone 80% (Should be handled in fume cupboard, do not inhale the
fume)
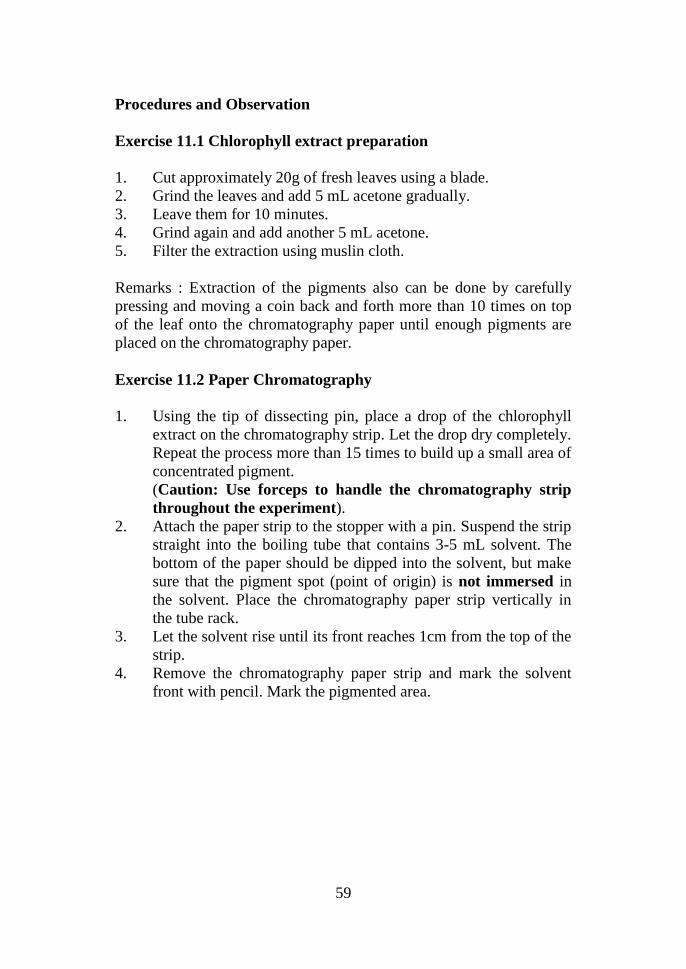
59
Procedures and Observation
Exercise 11.1 Chlorophyll extract preparation
1. Cut approximately 20g of fresh leaves using a blade.
2. Grind the leaves and add 5 mL acetone gradually.
3. Leave them for 10 minutes.
4. Grind again and add another 5 mL acetone.
5. Filter the extraction using muslin cloth.
Remarks : Extraction of the pigments also can be done by carefully
pressing and moving a coin back and forth more than 10 times on top
of the leaf onto the chromatography paper until enough pigments are
placed on the chromatography paper.
Exercise 11.2 Paper Chromatography
1. Using the tip of dissecting pin, place a drop of the chlorophyll
extract on the chromatography strip. Let the drop dry completely.
Repeat the process more than 15 times to build up a small area of
concentrated pigment.
(Caution: Use forceps to handle the chromatography strip
throughout the experiment).
2. Attach the paper strip to the stopper with a pin. Suspend the strip
straight into the boiling tube that contains 3-5 mL solvent. The
bottom of the paper should be dipped into the solvent, but make
sure that the pigment spot (point of origin) is not immersed in
the solvent. Place the chromatography paper strip vertically in
the tube rack.
3. Let the solvent rise until its front reaches 1cm from the top of the
strip.
4. Remove the chromatography paper strip and mark the solvent
front with pencil. Mark the pigmented area.
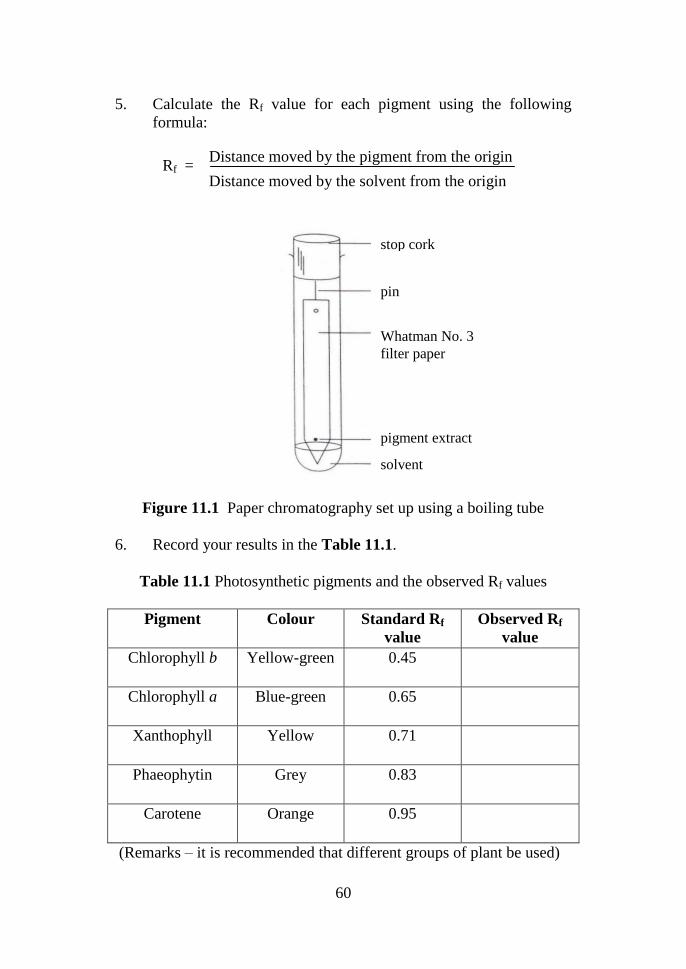
60
5. Calculate the Rf value for each pigment using the following
formula:
Figure 11.1 Paper chromatography set up using a boiling tube
6. Record your results in the Table 11.1.
Table 11.1 Photosynthetic pigments and the observed Rf values
Pigment Colour Standard Rf
value
Observed Rf
value
Chlorophyll b Yellow-green 0.45
Chlorophyll a Blue-green 0.65
Xanthophyll Yellow 0.71
Phaeophytin Grey 0.83
Carotene Orange 0.95
(Remarks – it is recommended that different groups of plant be used)
stop cork
pin
Whatman No. 3
filter paper
pigment extract
solvent
Rf = Distance moved by the pigment from the origin
Distance moved by the solvent from the origin
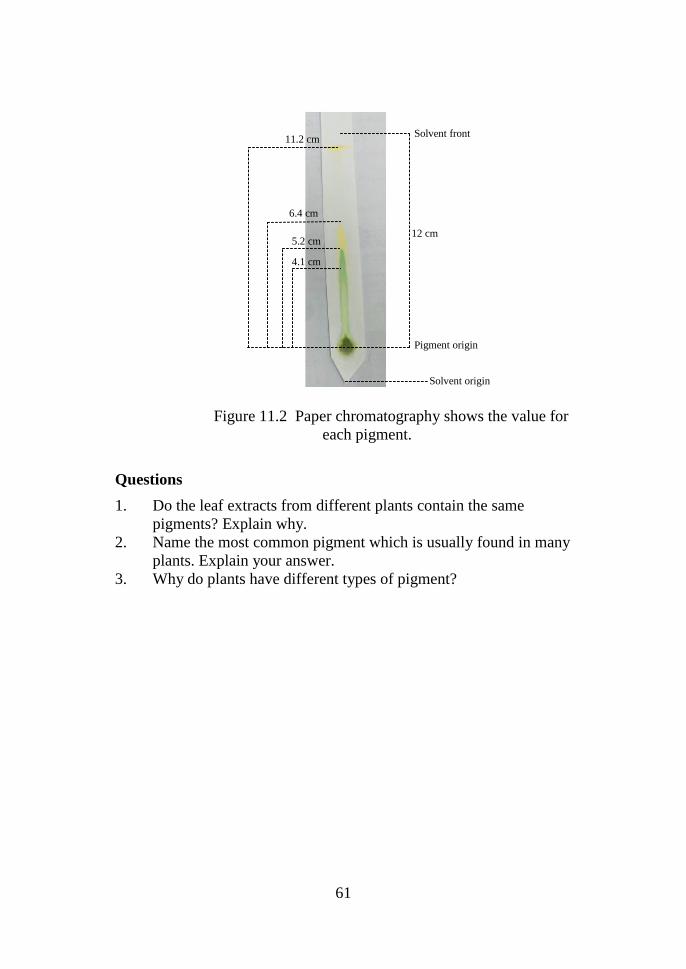
61
Figure 11.2 Paper chromatography shows the value for
each pigment.
Questions
1. Do the leaf extracts from different plants contain the same
pigments? Explain why.
2. Name the most common pigment which is usually found in many
plants. Explain your answer.
3. Why do plants have different types of pigment?
Solvent front
12 cm
Pigment origin
Solvent origin
4.1 cm
5.2 cm
6.4 cm
11.2 cm
62
EXPERIMENT 12: MAMMAL ORGAN SYSTEM
Course Learning Objective: Conduct biology laboratory work on
diversity of bacteria and plant, biocatalysis, cellular respiration,
chromatography and dissecting technics by applying manipulative skills.
(P3, CLO 2, PLO 2, MQF LOD 2)
Learning Outcomes: At the end of this lesson, students should be able to:
i. To demonstrate dissecting skill.
ii. To examine the organ systems in mammal: Digestive,
Circulatory, Respiratory, Urogenital and Nervous System.
Student Learning Time (SLT):
Face-to-face Non face-to-face
2 hour 0
Introduction
An organ system is a group of anatomical structures that work
together to perform a specific function or task. Although we learn
about each organ system as a distinct entity, the functions of the body's
organ systems overlap considerably, and your body could not function
without the cooperation of all of its organ systems. In fact, the failure
of even one organ system could lead to severe disability or even death.
A mammallian body is composed of different organ systems which
include the following:
Integumentary
Muscular
Skeletal
Nervous
Circulatory
Lymphatic
Respiratory
Endocrine
Urinary/excretory
Reproductive
Digestive
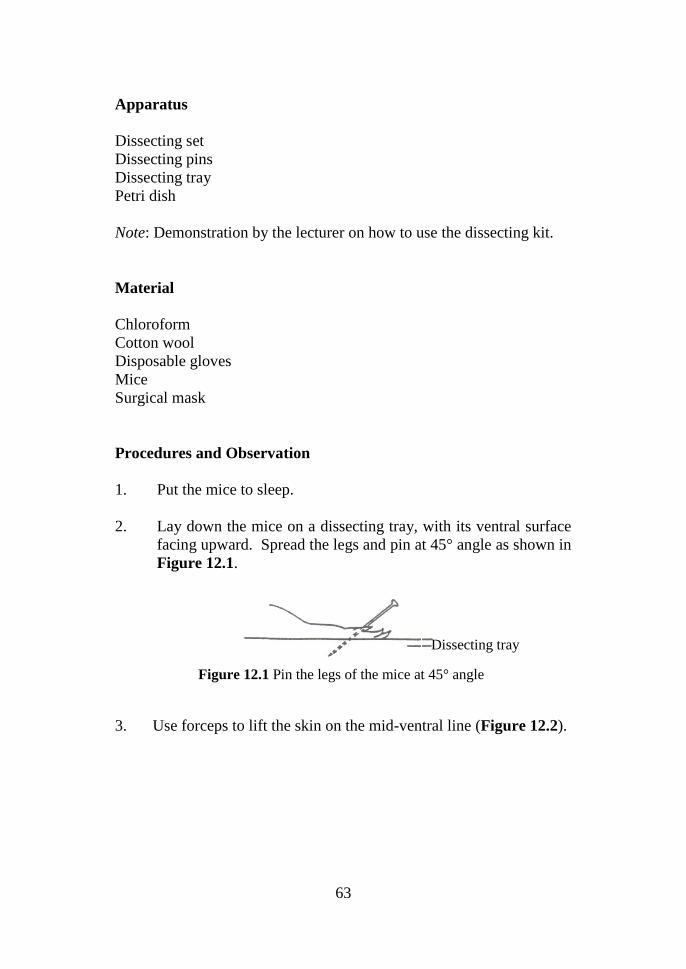
63
Apparatus
Dissecting set
Dissecting pins
Dissecting tray
Petri dish
Note: Demonstration by the lecturer on how to use the dissecting kit.
Material
Chloroform
Cotton wool
Disposable gloves
Mice
Surgical mask
Procedures and Observation
1. Put the mice to sleep.
2. Lay down the mice on a dissecting tray, with its ventral surface
facing upward. Spread the legs and pin at 45° angle as shown in
Figure 12.1.
3. Use forceps to lift the skin on the mid-ventral line (Figure 12.2).
Dissecting tray
Figure 12.1 Pin the legs of the mice at 45° angle
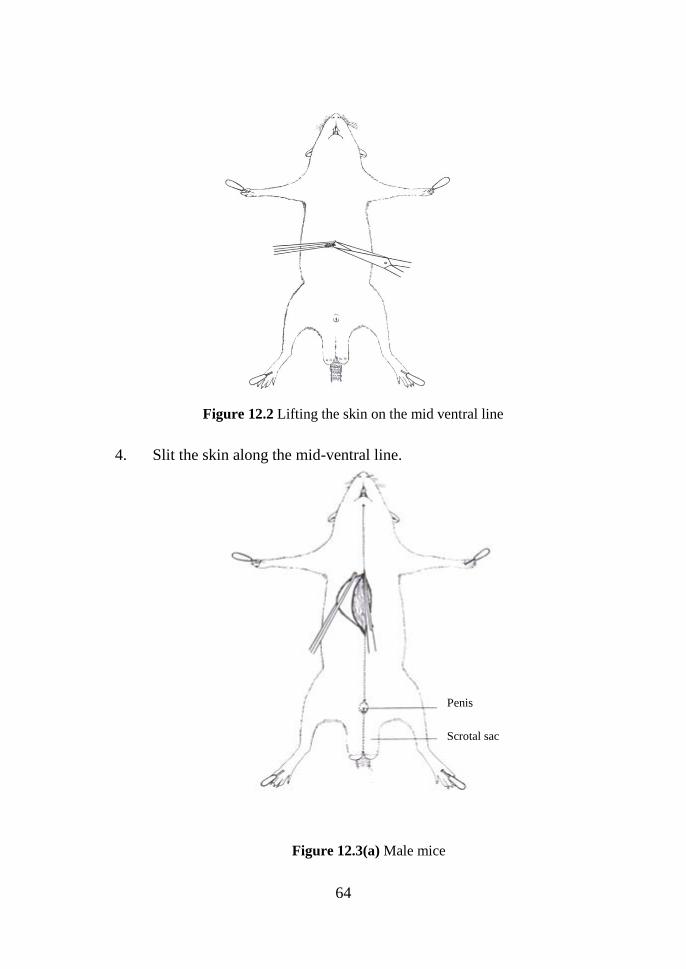
64
4. Slit the skin along the mid-ventral line.
Figure 12.2 Lifting the skin on the mid ventral line
Figure 12.3(a) Male mice
Penis
Scrotal sac
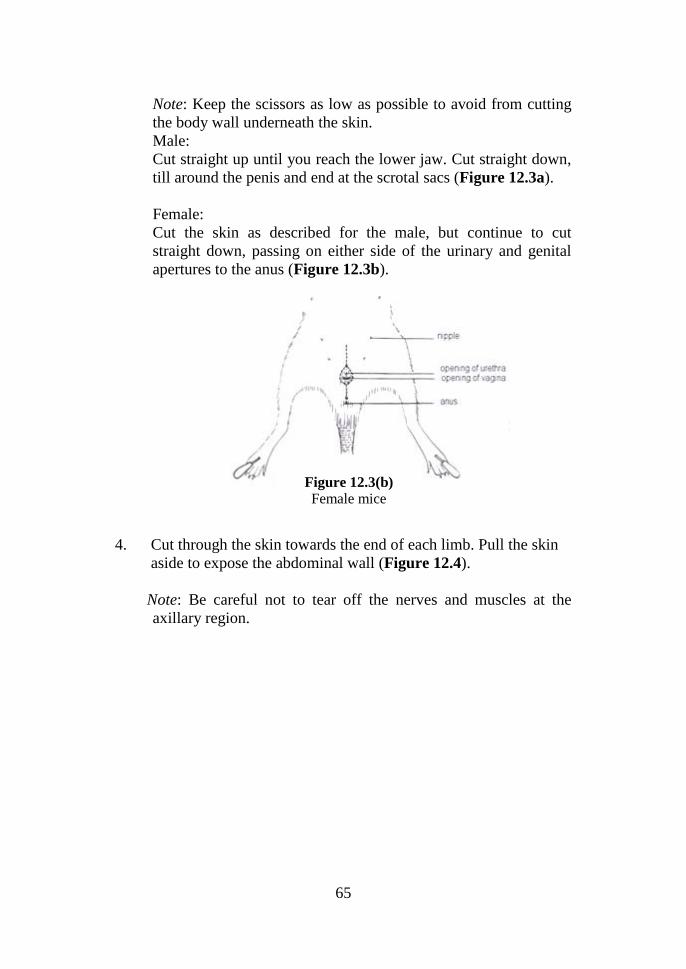
65
Note: Keep the scissors as low as possible to avoid from cutting
the body wall underneath the skin.
Male:
Cut straight up until you reach the lower jaw. Cut straight down,
till around the penis and end at the scrotal sacs (Figure 12.3a).
Female:
Cut the skin as described for the male, but continue to cut
straight down, passing on either side of the urinary and genital
apertures to the anus (Figure 12.3b).
4. Cut through the skin towards the end of each limb. Pull the skin
aside to expose the abdominal wall (Figure 12.4).
Note: Be careful not to tear off the nerves and muscles at the
axillary region.
Figure 12.3(b)
Female mice
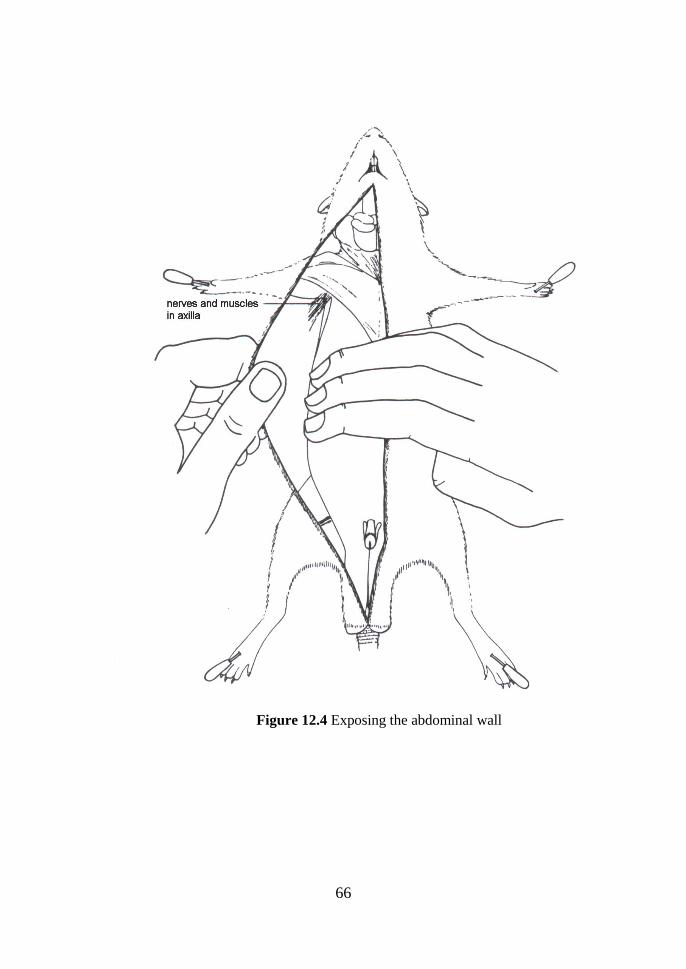
66
Figure 12.4 Exposing the abdominal wall
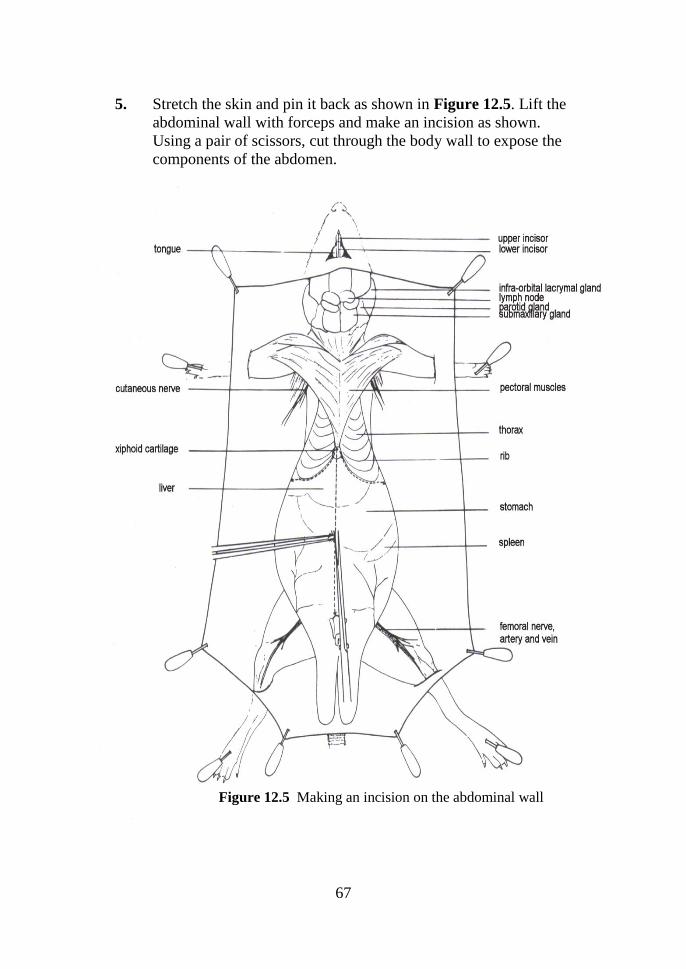
67
5. Stretch the skin and pin it back as shown in Figure 12.5. Lift the
abdominal wall with forceps and make an incision as shown.
Using a pair of scissors, cut through the body wall to expose the
components of the abdomen.
Figure 12.5 Making an incision on the abdominal wall
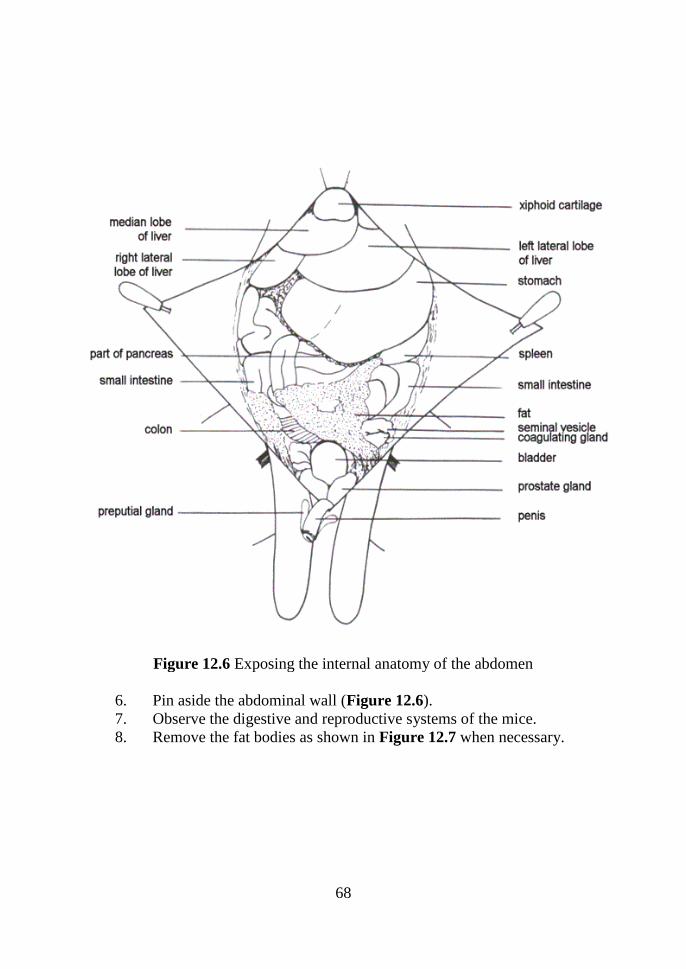
68
6. Pin aside the abdominal wall (Figure 12.6).
7. Observe the digestive and reproductive systems of the mice.
8. Remove the fat bodies as shown in Figure 12.7 when necessary.
Figure 12.6 Exposing the internal anatomy of the abdomen
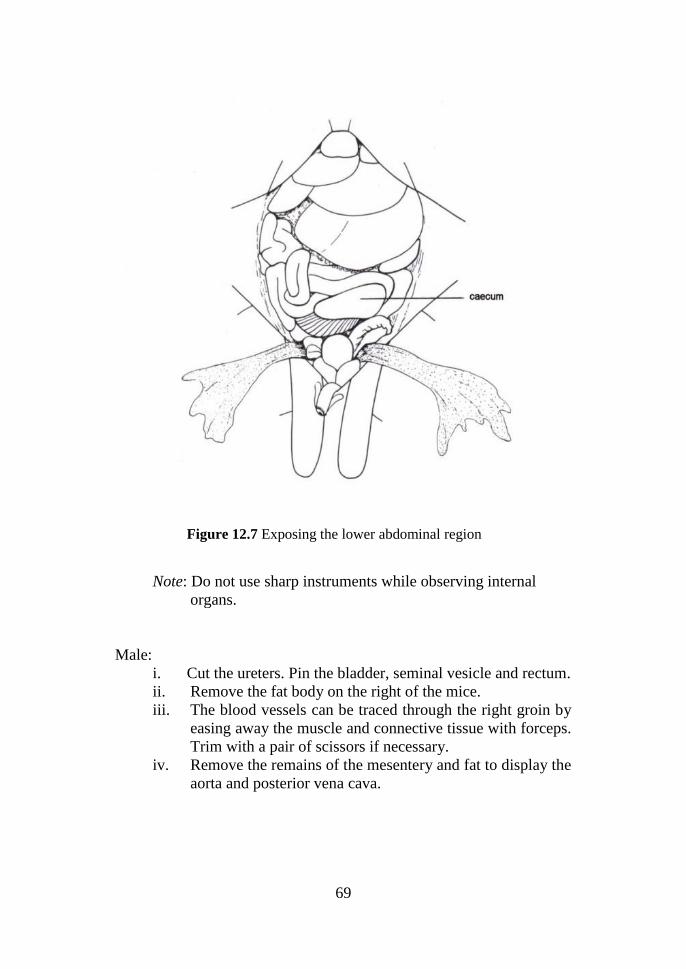
69
Note: Do not use sharp instruments while observing internal
organs.
Male:
i. Cut the ureters. Pin the bladder, seminal vesicle and rectum.
ii. Remove the fat body on the right of the mice.
iii. The blood vessels can be traced through the right groin by
easing away the muscle and connective tissue with forceps.
Trim with a pair of scissors if necessary.
iv. Remove the remains of the mesentery and fat to display the
aorta and posterior vena cava.
Figure 12.7 Exposing the lower abdominal region

70
Female:
i. Cut the ureters.
ii. Pin the rectum.
iii. Lay aside the vagina and bladder as shown and pin it if
necessary.
iv. The blood vessels can be traced through the right groin by
easing away the muscle and connective tissue with forceps.
Trim with a pair of scissors if necessary.
v. Remove the remains of the mesentery and fat to display the
aorta and posterior vena cava.
vi. Cut through the side wall of the thorax along the line
indicated as shown in Figure 12.8.
9. Continue the cut to the apex by turning the ventral part of the
thoracic wall aside and pull it slightly to avoid cutting the heart.
Repeat on the other side to remove the ventral part of the
thoracic wall entirely. Remove the loose parts of the pleura (refer
to Figure 12.8).
Figure: 12.8 Exposing the thoracic cavity
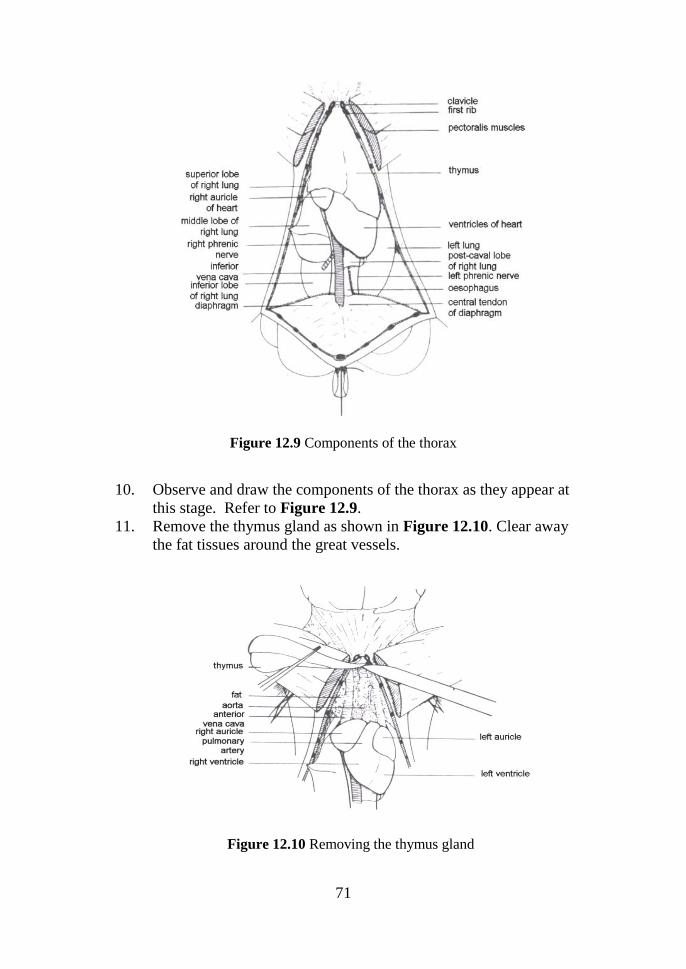
71
10. Observe and draw the components of the thorax as they appear at
this stage. Refer to Figure 12.9.
11. Remove the thymus gland as shown in Figure 12.10. Clear away
the fat tissues around the great vessels.
Figure 12.9 Components of the thorax
Figure 12.10 Removing the thymus gland Figure 12.10 Removing the thymus gland
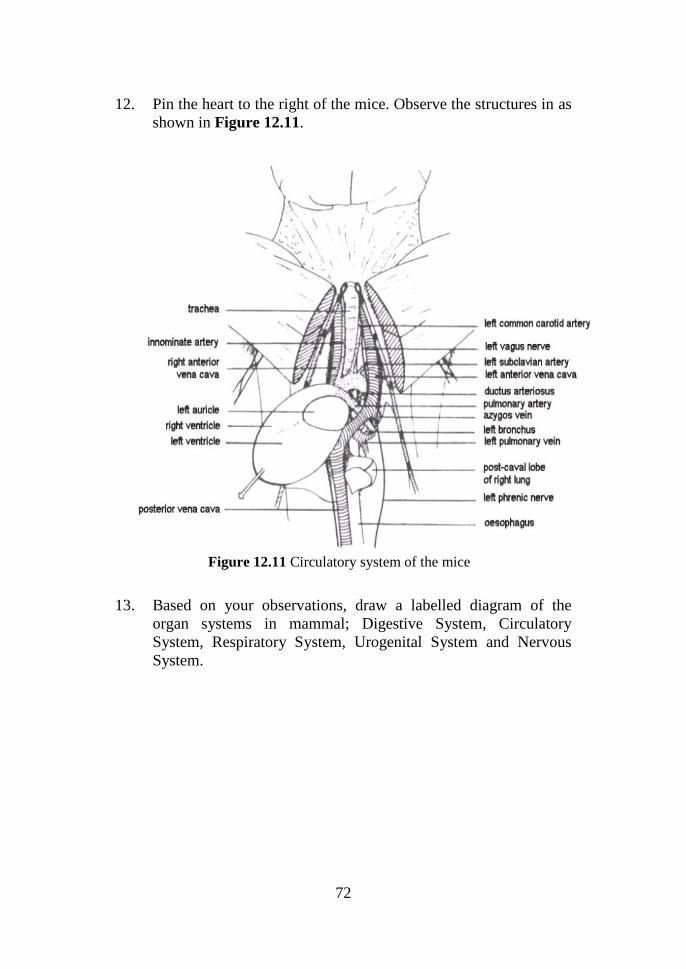
72
12. Pin the heart to the right of the mice. Observe the structures in as
shown in Figure 12.11.Fig
13. .11.
13. Based on your observations, draw a labelled diagram of the
organ systems in mammal; Digestive System, Circulatory
System, Respiratory System, Urogenital System and Nervous
System.
Figure 12.11 Circulatory system of the mice
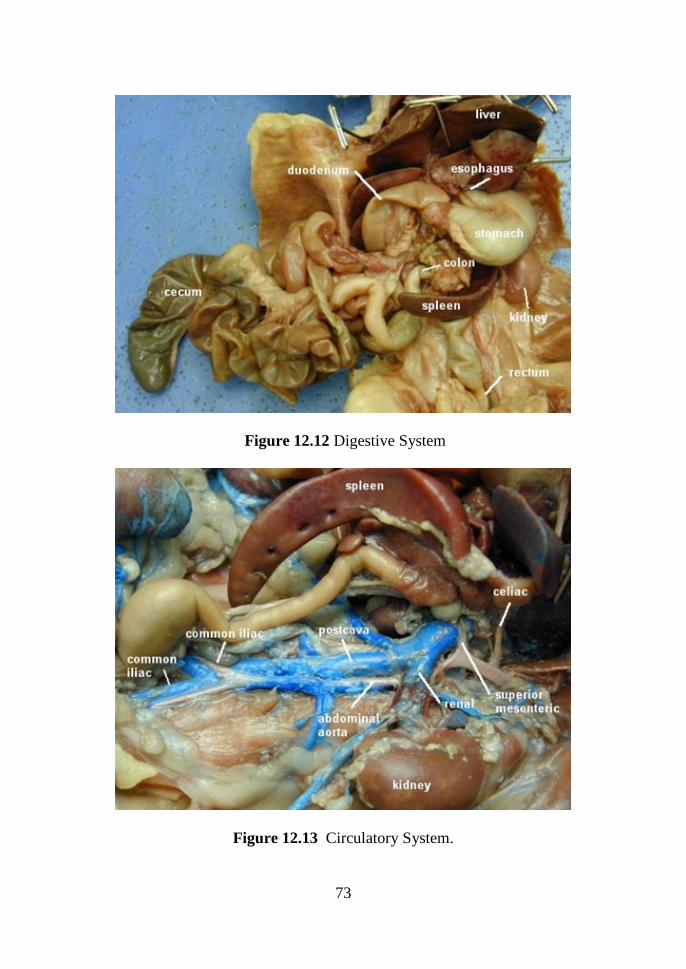
73
Figure 12.12 Digestive System
Figure 12.13 Circulatory System.
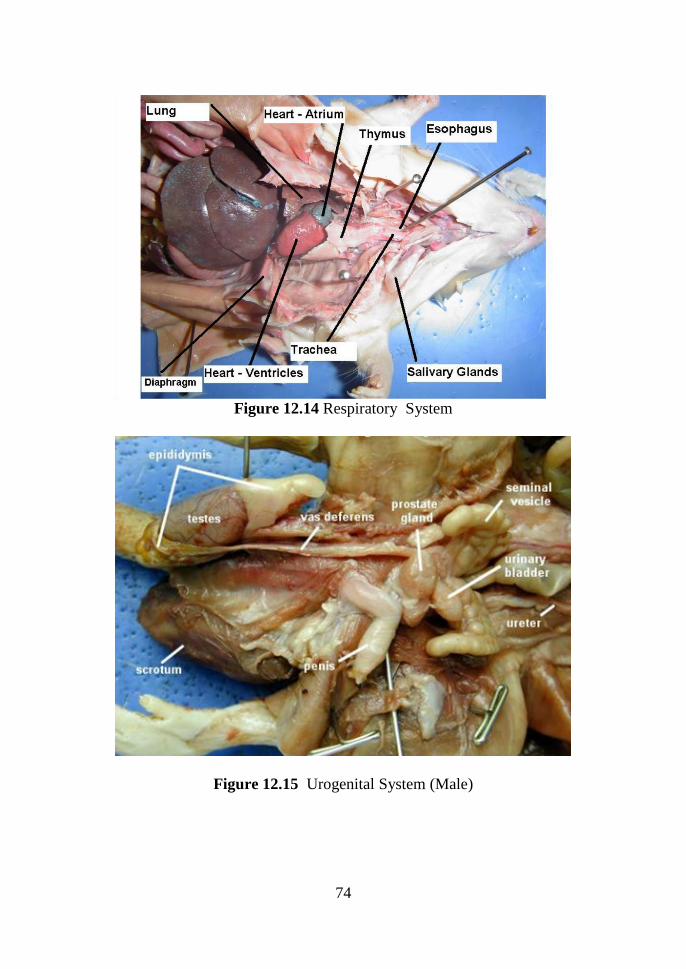
74
Figure 12.14 Respiratory System
Figure 12.15 Urogenital System (Male)
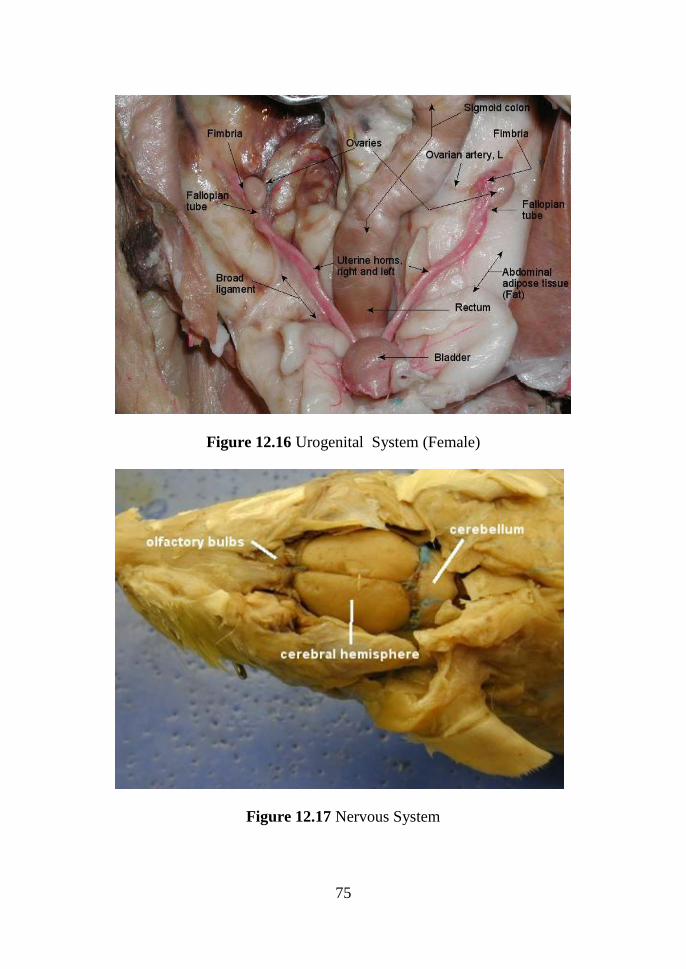
75
Figure 12.16 Urogenital System (Female)
Figure 12.17 Nervous System
76
REFERENCES
Campbell, N. A., Reece, J. B., Urry, L. A., Cain, M. L., Wassermen, S. A.,
Minorsky, P. V. & Jackson, R. B. (2016). Biology. (11th
Ed.). Pearson
Benjamin Cummings. USA.
Lawrence, E. (2016). Henderson’s Dictionary of Biological Terms (16th Ed.),
Prentice Hall.
Solomon, E. P., Berg, L. R. & Martin, D. W. (2018). Biology. (11th Ed.).
Nelson Education, Ltd, Canada.
Morgan J. G & Carter M. E. B & Stout (2015). Investigating Biology:
Laboratory Manual (8rd
Edition), Pearson Education Limited.
www.bio.miami.edu
www.crochetspot.com
www.k-state.edu
www.math.arizona.edu
www.news.makemeheal.com
www.pc.maricopa.edu
www.quia.com
www.sci.waikato.ac.nz
www.sfsu.edu
www.sharewhy.com
www.sols.unlv.edu
www.stolaf.edu
www.users.rowan.edu
www.vcbio.science.ru.nl
www.wikispace.psu.edu
77
ACKNOWLEDGEMENT
The Matriculation Division wishes to extend heartfelt thanks and utmost
gratitude to the following individuals who have actively participated in
marking the review a success. We are grateful for the support and guidance
provided by those involved, namely:
Dr. Baiduriah binti Yaakub Director of Matriculation Division,
Ministry of Education
Mr. Azman bin Abd. Karim Deputy Director,
Matriculation Division
Dr. Shah Jahan bin Assanarkutty Principal Assistant Director,
Matriculation Division
Dr. Saharawati binti Shahar Senior Assistant Director,
Matriculation Division
Prof. Dr. Shahrul Hisham bin Zainal Ariffin Universiti Kebangsaan Malaysia
Prof. Dr. Aziz bin Arshad Universiti Putra Malaysia,
Prof. Dr. Mahmud bin Tengku Muda Universiti Putra Malaysia,
Mohamed
Mdm. Salbiah binti Mohd. Som Selangor Matriculation College,
Mr. Roslan bin Abu Bakar Selangor Matriculation College,
Mdm. Hajjah Hanita binti Ghazali Selangor Matriculation College,
Mdm. Mushitah binti Abu Penang Matriculation College,
Miss Norhayati binti Othman Penang Matriculation College,
Miss Hjh. Zuraidah binti Mohamed Kelantan Matriculation College,
Mr. Abdul Aziz bin Abdul Kadir Malacca Matriculation College,
Mdm. Rohana binti Hassan Malacca Matriculation College,
Mdm. Michelle Mariam binti Abu Bakar Malacca Matriculation College,
Mdm. Nizaha binti Zulkifli Negeri Sembilan Matriculation College,
Mdm. Fariza binti Zakaria Perak Matriculation College,
Mdm. Lena Maizura binti Basaruddin Perak Matriculation College,
Mdm. Rudziah binti Umar Selangor Matriculation College
Miss Siti Khadijah binti Ahmad Khairi Selangor Matriculation College
Mdm. Rohaiza binti Rozali Assistant Director,
Matriculation Division
Mr. Ruslan bin Achok Assistant Director,
Matriculation Division