board of county commissioners - columbia county · board of county commissioners special meeting...
TRANSCRIPT

Board of County Commissioners
Special Meeting
Thursday, May 25, 2017
9:00 A.M.
School Board Administrative Complex
1

Workshop Goals and Objectives
Review Budget Process
Review County Debt/Finances
Discuss Both “Long” and “Short” Term Overview of Major
Budgetary Impacts
Receive “Next Steps” Direction from the Board of County
Commissioners
2
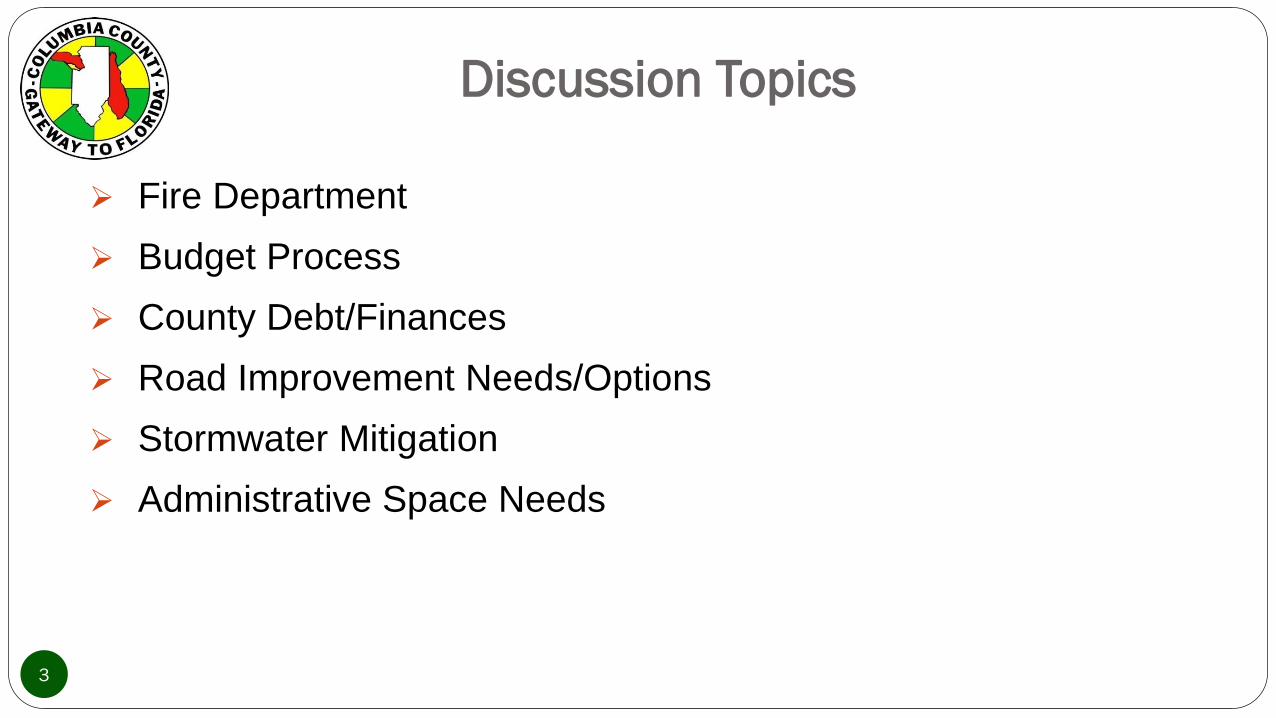
Discussion Topics
Fire Department
Budget Process
County Debt/Finances
Road Improvement Needs/Options
Stormwater Mitigation
Administrative Space Needs
3
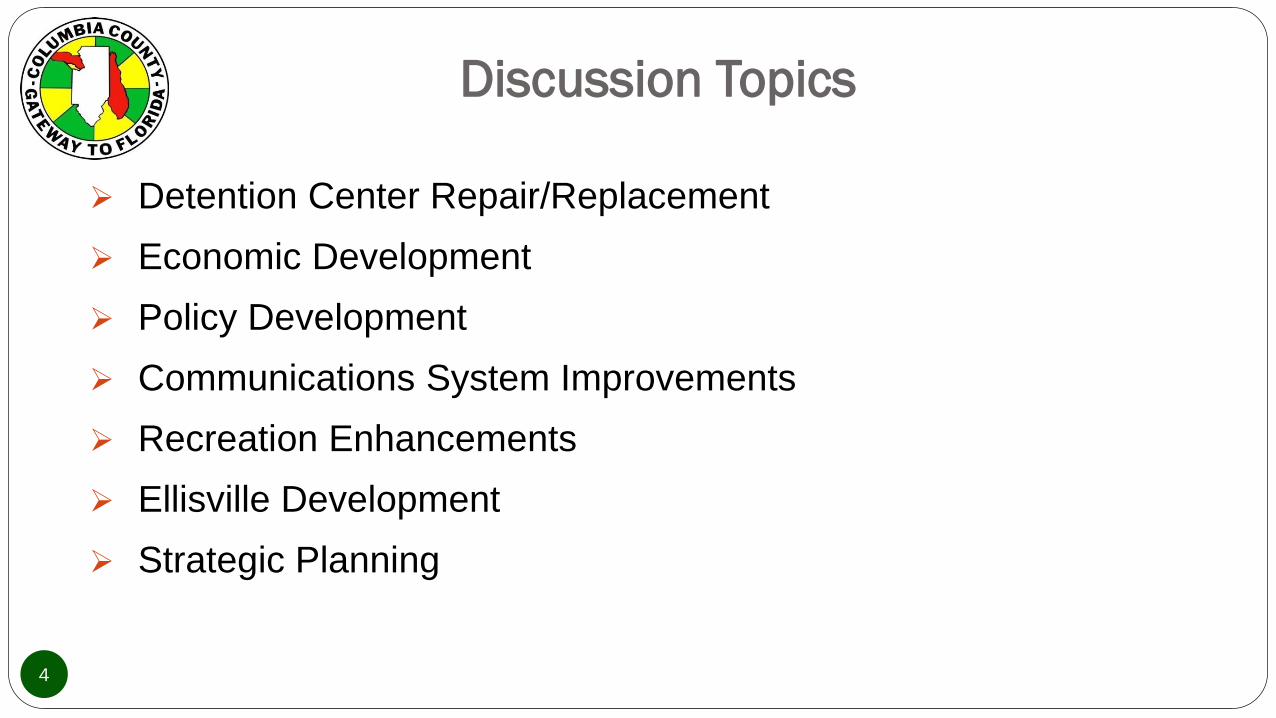
Discussion Topics
Detention Center Repair/Replacement
Economic Development
Policy Development
Communications System Improvements
Recreation Enhancements
Ellisville Development
Strategic Planning
4
Fire Department
5
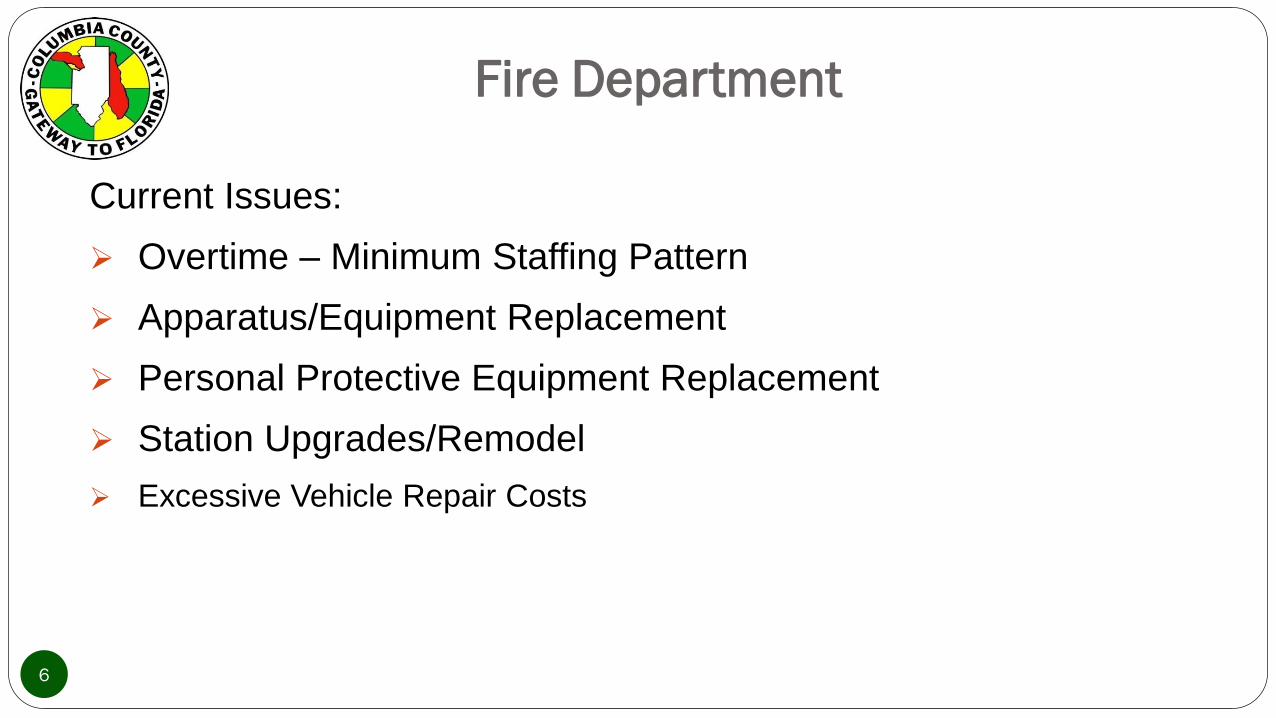
Fire Department
Current Issues:
Overtime – Minimum Staffing Pattern
Apparatus/Equipment Replacement
Personal Protective Equipment Replacement
Station Upgrades/Remodel
Excessive Vehicle Repair Costs
6
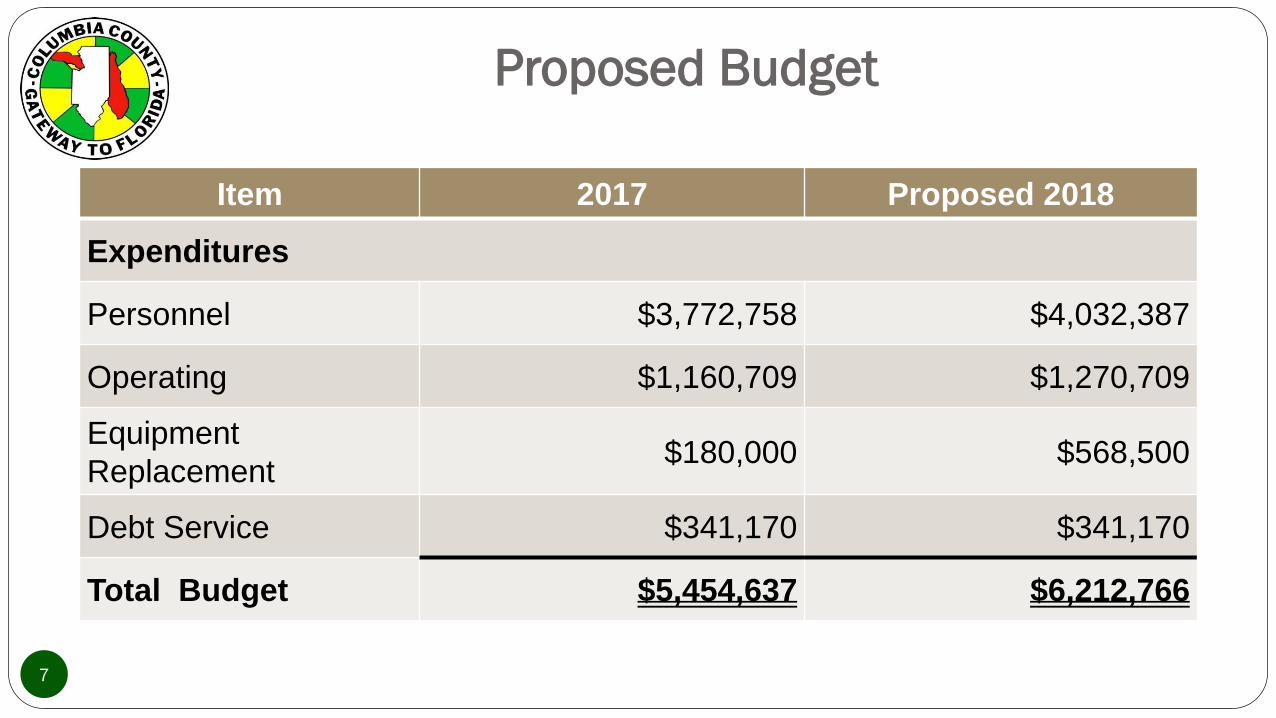
Proposed Budget
7
Item 2017 Proposed 2018
Expenditures
Personnel $3,772,758 $4,032,387
Operating $1,160,709 $1,270,709
Equipment
Replacement$180,000 $568,500
Debt Service $341,170 $341,170
Total Budget $5,454,637 $6,212,766
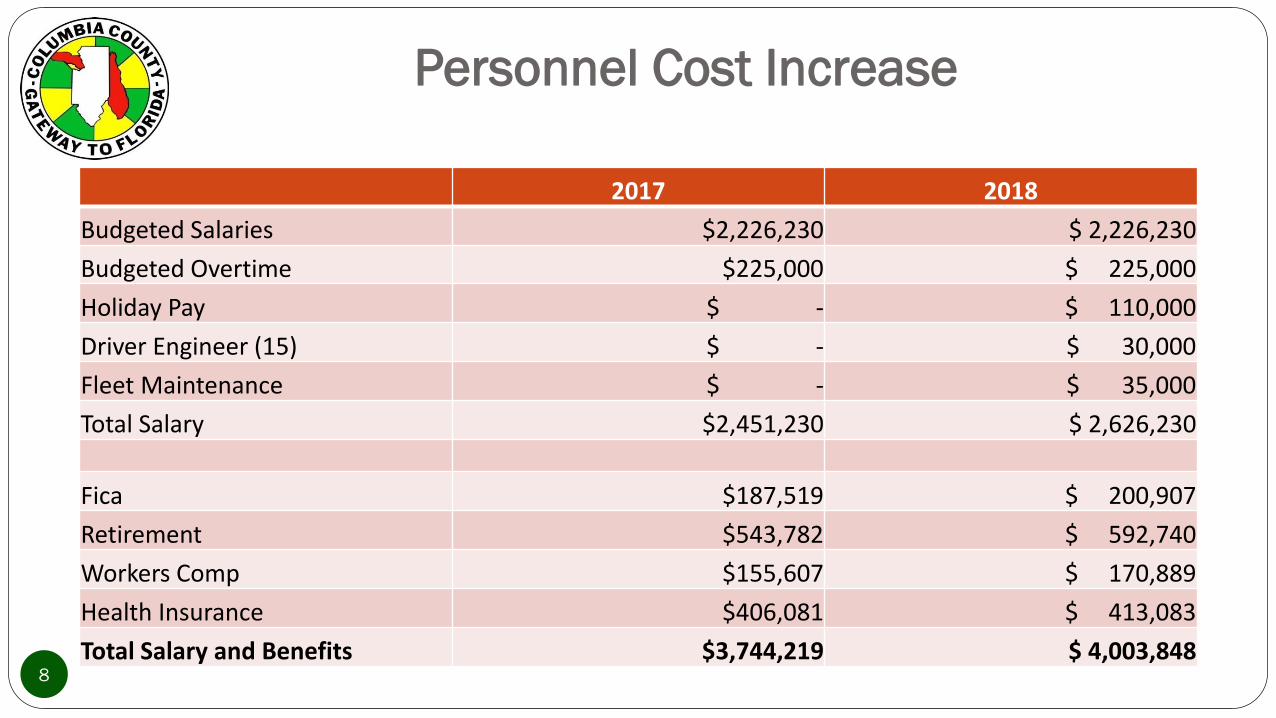
Personnel Cost Increase
8
2017 2018
Budgeted Salaries $2,226,230 $ 2,226,230
Budgeted Overtime $225,000 $ 225,000
Holiday Pay $ - $ 110,000
Driver Engineer (15) $ - $ 30,000
Fleet Maintenance $ - $ 35,000
Total Salary $2,451,230 $ 2,626,230
Fica $187,519 $ 200,907
Retirement $543,782 $ 592,740
Workers Comp $155,607 $ 170,889
Health Insurance $406,081 $ 413,083
Total Salary and Benefits $3,744,219 $ 4,003,848
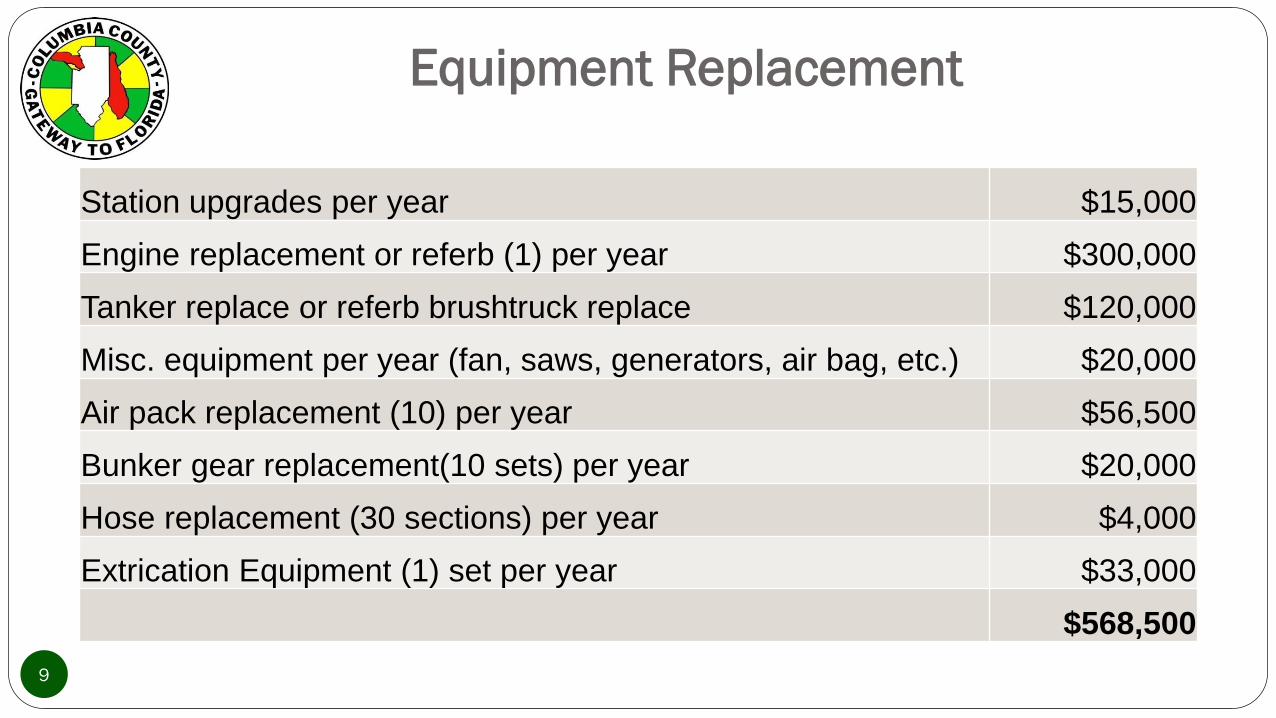
Equipment Replacement
9
Station upgrades per year $15,000
Engine replacement or referb (1) per year $300,000
Tanker replace or referb brushtruck replace $120,000
Misc. equipment per year (fan, saws, generators, air bag, etc.) $20,000
Air pack replacement (10) per year $56,500
Bunker gear replacement(10 sets) per year $20,000
Hose replacement (30 sections) per year $4,000
Extrication Equipment (1) set per year $33,000
$568,500
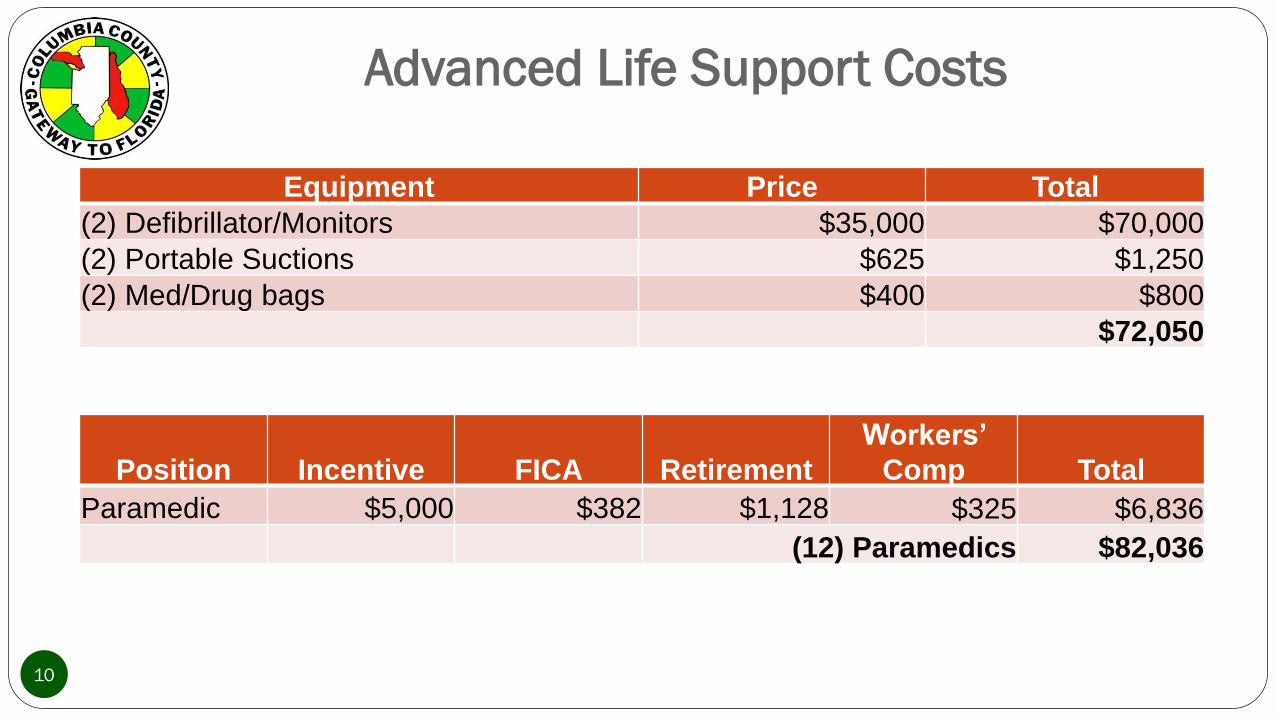
Equipment Price Total
(2) Defibrillator/Monitors $35,000 $70,000
(2) Portable Suctions $625 $1,250
(2) Med/Drug bags $400 $800
$72,050
Advanced Life Support Costs
10
Position Incentive FICA Retirement
Workers’
Comp Total
Paramedic $5,000 $382 $1,128 $325 $6,836
(12) Paramedics $82,036
11
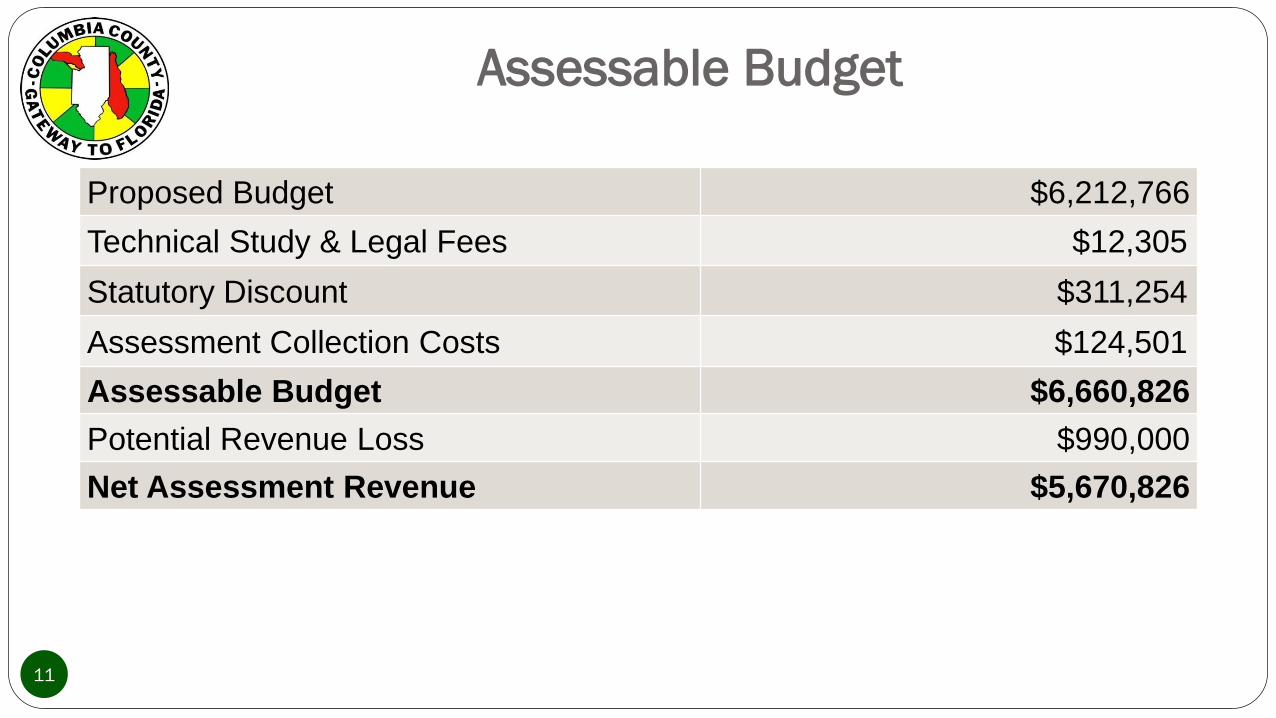
Proposed Budget $6,212,766
Technical Study & Legal Fees $12,305
Statutory Discount $311,254
Assessment Collection Costs $124,501
Assessable Budget $6,660,826
Potential Revenue Loss $990,000
Net Assessment Revenue $5,670,826
Assessable Budget
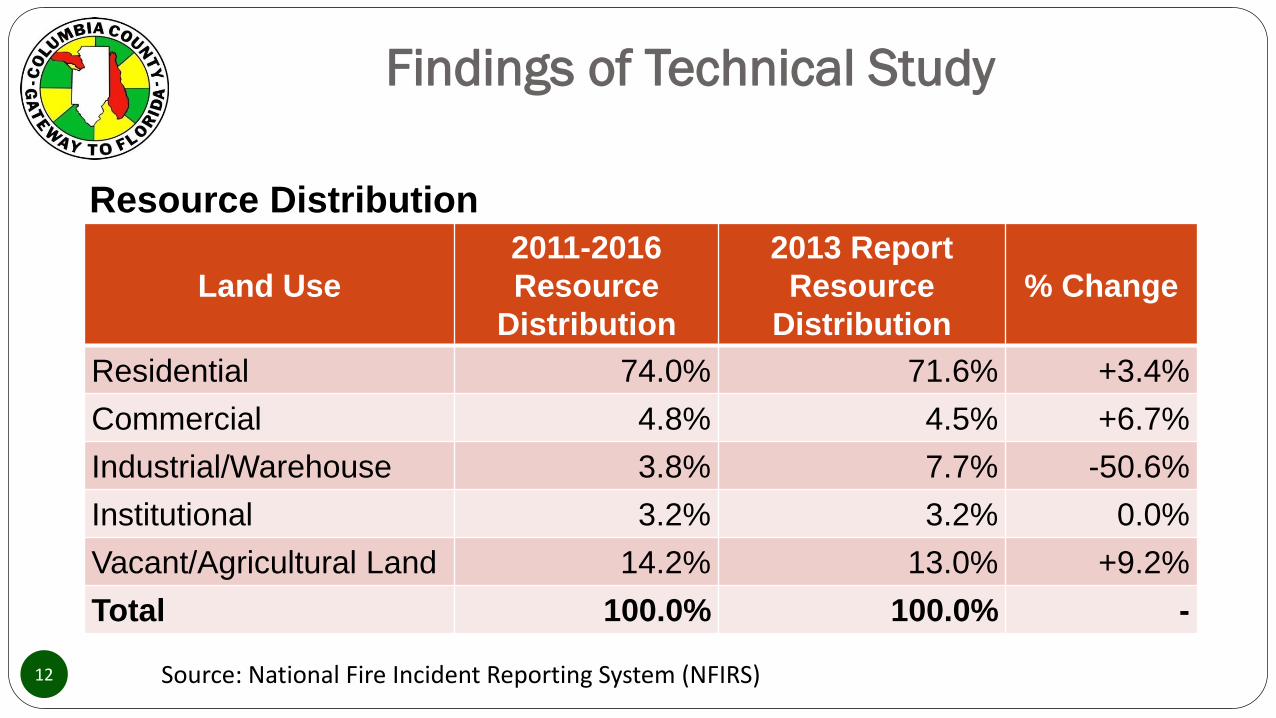
Resource Distribution
12
Land Use
2011-2016
Resource
Distribution
2013 Report
Resource
Distribution
% Change
Residential 74.0% 71.6% +3.4%
Commercial 4.8% 4.5% +6.7%
Industrial/Warehouse 3.8% 7.7% -50.6%
Institutional 3.2% 3.2% 0.0%
Vacant/Agricultural Land 14.2% 13.0% +9.2%
Total 100.0% 100.0% -
Source: National Fire Incident Reporting System (NFIRS)
Findings of Technical Study

Unit Count Summary
13
Land Use UnitTotal Units
2017 Study
Total Units
2013 Study
%
Change
Residential Dwelling unit 22,628 22,290 +1.5%
Commercial Square feet 3,991,930 3,882,180 +2.8%
Industrial/Warehouse Square feet 3,716,155 3,498,815 +6.2%
Institutional Square feet 2,738,976 2,608,452 +5.0%
Vacant/Agricultural Land Parcel 13,976 13,805 +1.2%
Source: Columbia County Tax Collector and the Columbia County Property Appraiser Database
Findings of Technical Study

14
Calculated Assessment Rates
Land Use UnitBudget
Allocation
Calculated
Rate
Residential Dwelling unit $4,929,012 $221.10
Multi-Family Dwelling unit $123.29
Commercial Square feet $319,720 $0.0801
Industrial/Warehouse Square feet $253,111 $0.0681
Institutional Square feet $213,146 $0.0778
Vacant/Agricultural Land Parcel $945,837 $60.91
Acres over 160 Per Acre $0.5738
Total $6,660,826
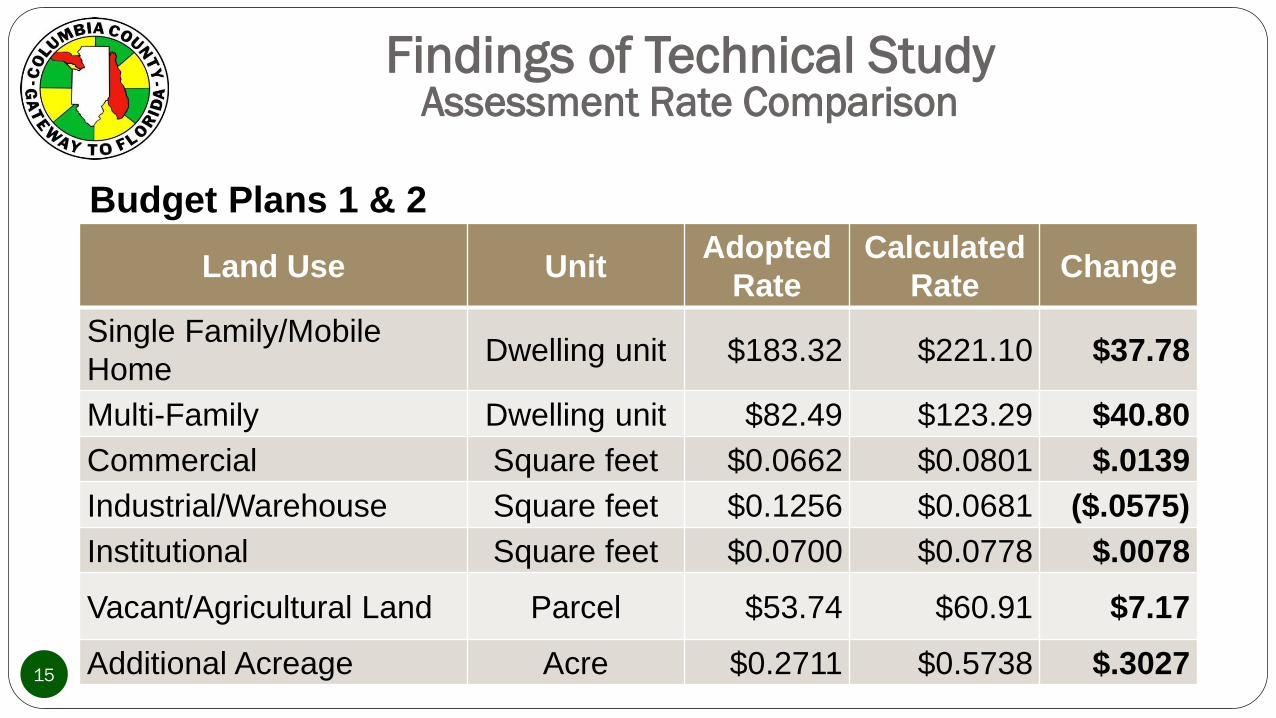
Budget Plans 1 & 2
15
Findings of Technical StudyAssessment Rate Comparison
Land Use UnitAdopted
Rate
Calculated
RateChange
Single Family/Mobile
HomeDwelling unit $183.32 $221.10 $37.78
Multi-Family Dwelling unit $82.49 $123.29 $40.80
Commercial Square feet $0.0662 $0.0801 $.0139
Industrial/Warehouse Square feet $0.1256 $0.0681 ($.0575)
Institutional Square feet $0.0700 $0.0778 $.0078
Vacant/Agricultural Land Parcel $53.74 $60.91 $7.17
Additional Acreage Acre $0.2711 $0.5738 $.3027

Next Steps
Board Input Requested:
Adopt Plan 1 or 2
Approve Proceeding With Finalizing Assessment Rates
16
Questions? Comments? Motions?
Fire Department
17
Budget Process
No Additional Information or Updates
18

Fund Balance
19

Fund Balance
20
No Additional Information or Updates

Questions? Comments? Motions?
21
Fund Balance

County Debt/Finances
22
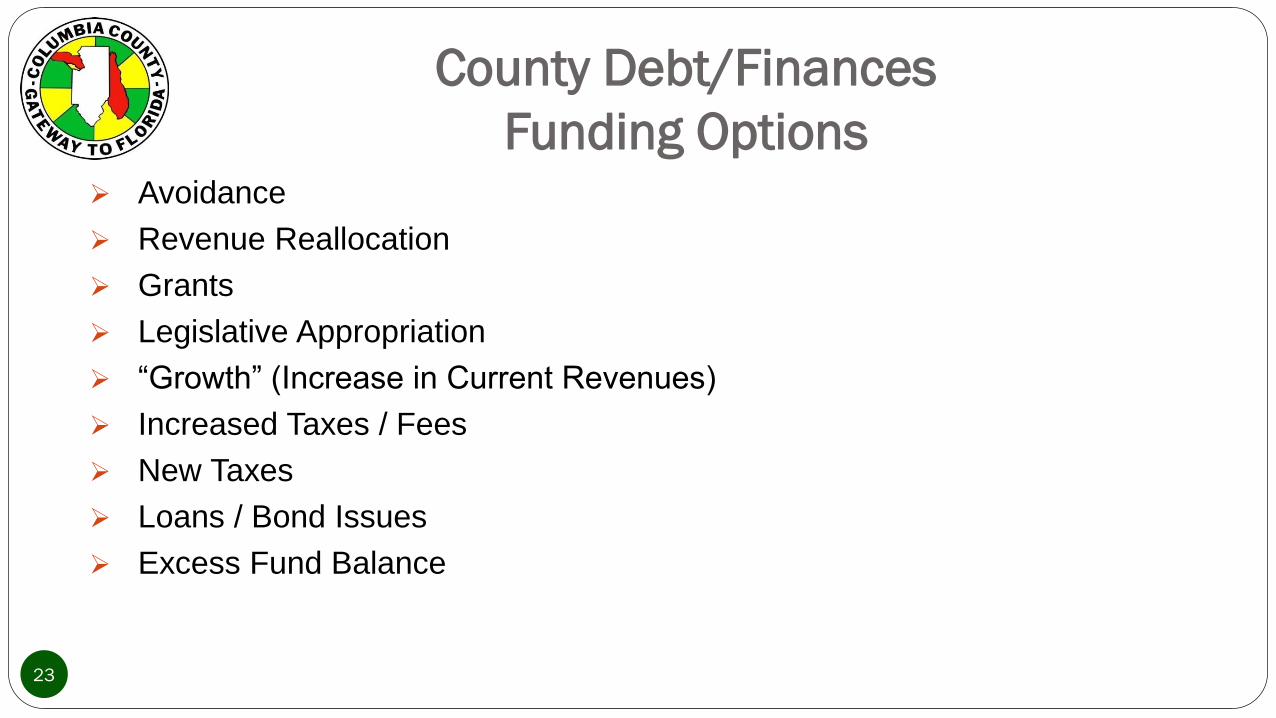
County Debt/Finances
Funding Options Avoidance
Revenue Reallocation
Grants
Legislative Appropriation
“Growth” (Increase in Current Revenues)
Increased Taxes / Fees
New Taxes
Loans / Bond Issues
Excess Fund Balance
23
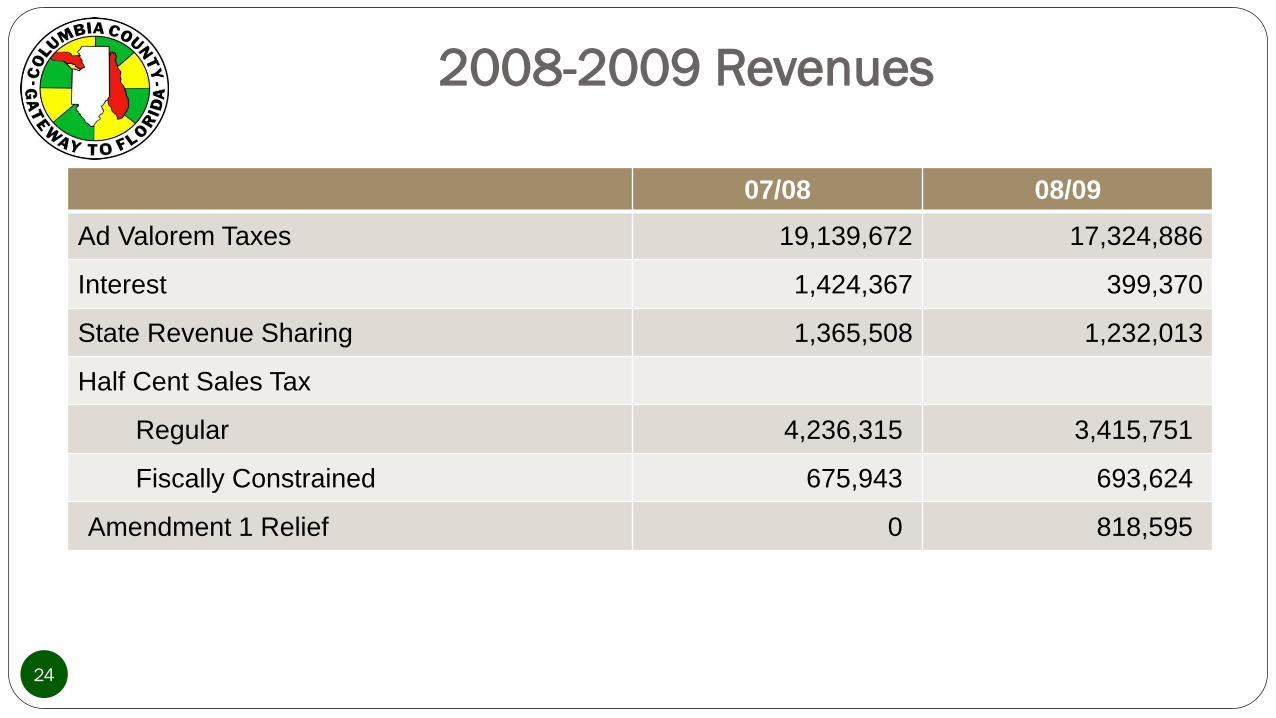
2008-2009 Revenues
07/08 08/09
Ad Valorem Taxes 19,139,672 17,324,886
Interest 1,424,367 399,370
State Revenue Sharing 1,365,508 1,232,013
Half Cent Sales Tax
Regular 4,236,315 3,415,751
Fiscally Constrained 675,943 693,624
Amendment 1 Relief 0 818,595
24
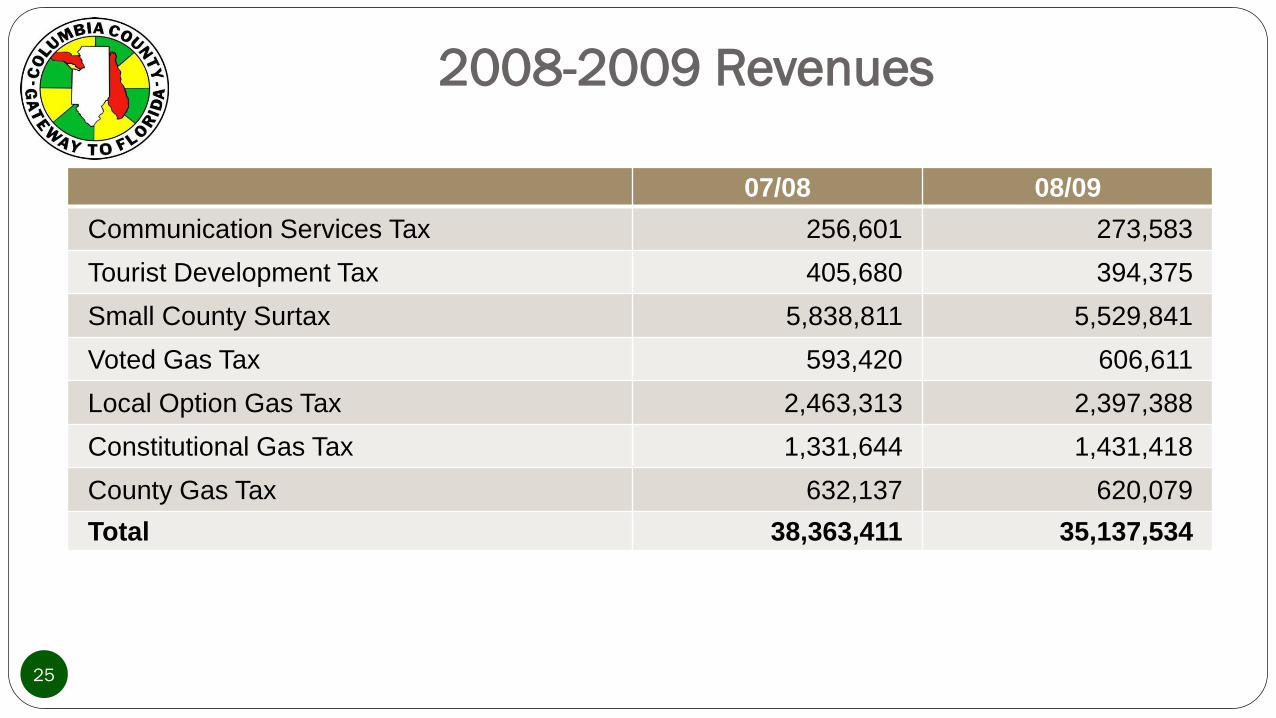
2008-2009 Revenues
07/08 08/09
Communication Services Tax 256,601 273,583
Tourist Development Tax 405,680 394,375
Small County Surtax 5,838,811 5,529,841
Voted Gas Tax 593,420 606,611
Local Option Gas Tax 2,463,313 2,397,388
Constitutional Gas Tax 1,331,644 1,431,418
County Gas Tax 632,137 620,079
Total 38,363,411 35,137,534
25

Historical Millage Rates
Tax Year Rate
Change From
Previous YearTotal Taxable Value Ad Valorem Taxes
2006 0.008864 0.000000 $2,322,144,290 $20,583,487
2007 0.007977 -0.000887 $2,625,181,297 $20,941,071
2008 0.008015 0.000038 $2,564,084,245 $20,551,135
2009 0.008015 0.000000 $2,547,547,990 $20,418,597
2010 0.008015 0.000000 $2,446,401,713 $19,607,910
2011 0.008015 0.000000 $2,261,716,683 $18,127,659
2012 0.008015 0.000000 $2,211,416,344 $17,724,502
2013 0.008015 0.000000 $2,225,505,761 $17,837,429
2014 0.008015 0.000000 $2,284,703,454 $18,311,898
2015 0.008015 0.000000 $2,308,305,124 $18,501,066
2016 0.008015 0.000000 $2,342,422,850 $18,774,519 26
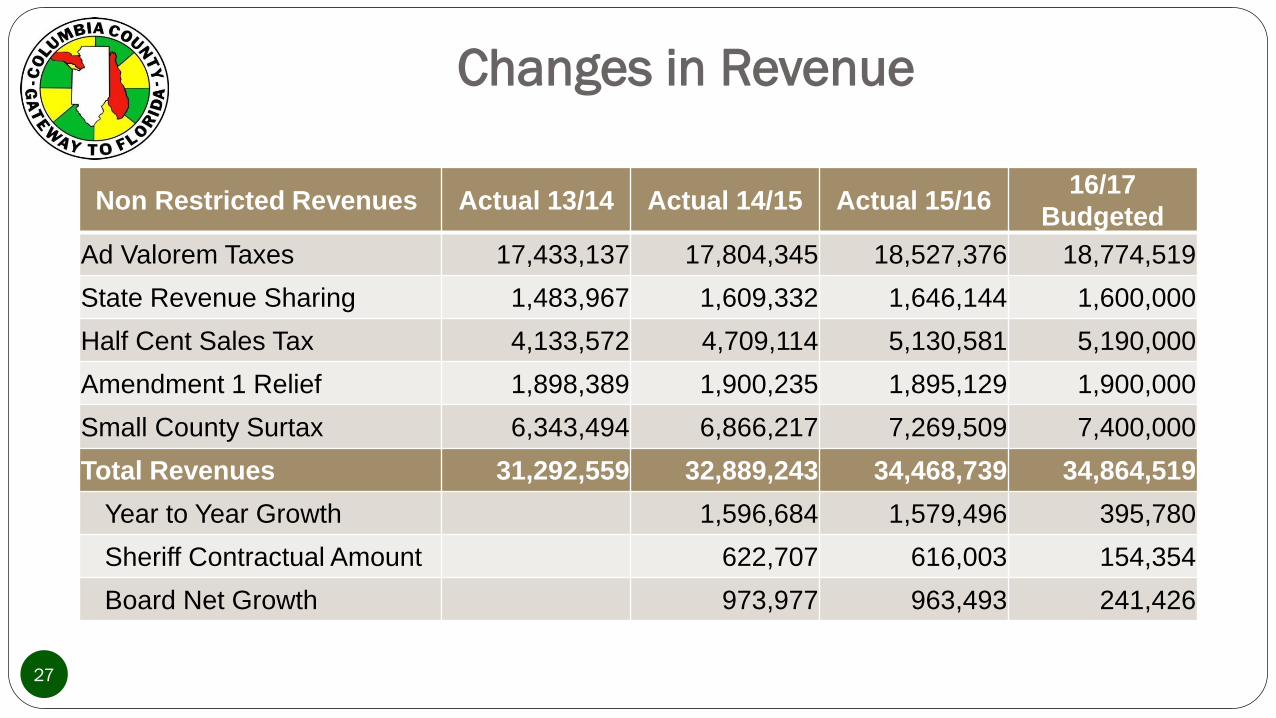
Changes in Revenue
27
Non Restricted Revenues Actual 13/14 Actual 14/15 Actual 15/1616/17
Budgeted
Ad Valorem Taxes 17,433,137 17,804,345 18,527,376 18,774,519
State Revenue Sharing 1,483,967 1,609,332 1,646,144 1,600,000
Half Cent Sales Tax 4,133,572 4,709,114 5,130,581 5,190,000
Amendment 1 Relief 1,898,389 1,900,235 1,895,129 1,900,000
Small County Surtax 6,343,494 6,866,217 7,269,509 7,400,000
Total Revenues 31,292,559 32,889,243 34,468,739 34,864,519
Year to Year Growth 1,596,684 1,579,496 395,780
Sheriff Contractual Amount 622,707 616,003 154,354
Board Net Growth 973,977 963,493 241,426
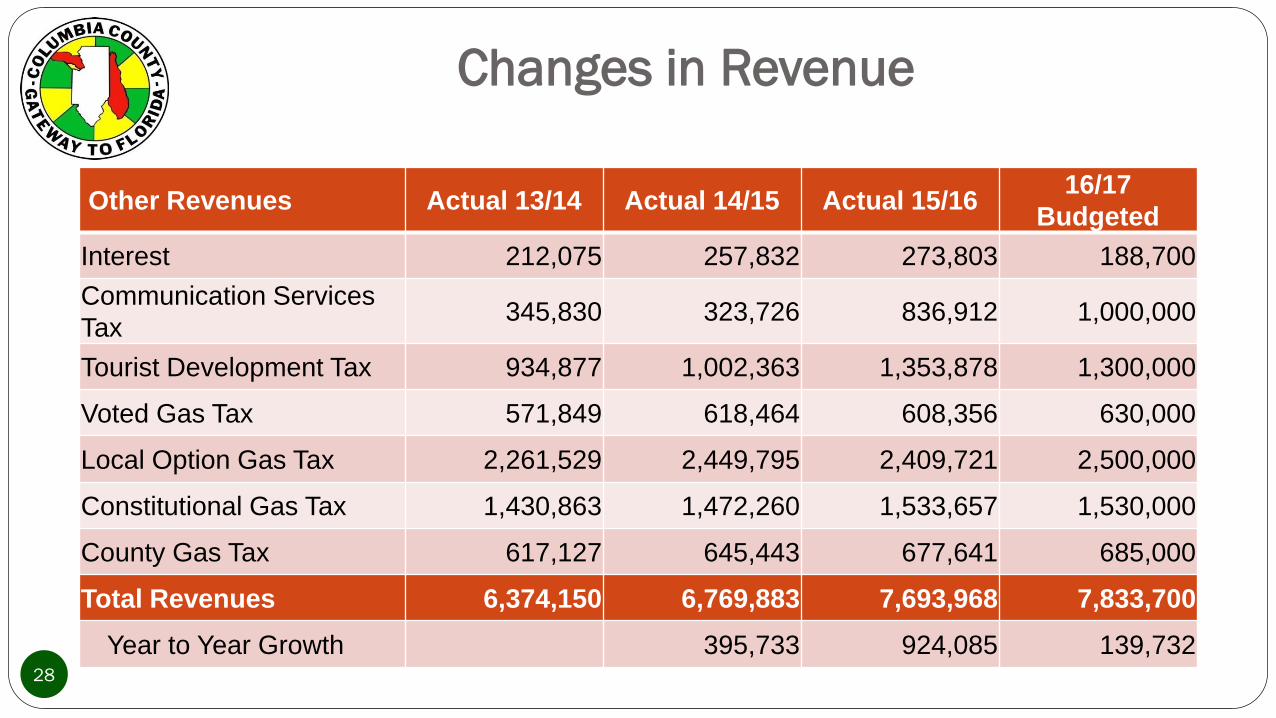
Changes in Revenue
Other Revenues Actual 13/14 Actual 14/15 Actual 15/1616/17
Budgeted
Interest 212,075 257,832 273,803 188,700
Communication Services
Tax345,830 323,726 836,912 1,000,000
Tourist Development Tax 934,877 1,002,363 1,353,878 1,300,000
Voted Gas Tax 571,849 618,464 608,356 630,000
Local Option Gas Tax 2,261,529 2,449,795 2,409,721 2,500,000
Constitutional Gas Tax 1,430,863 1,472,260 1,533,657 1,530,000
County Gas Tax 617,127 645,443 677,641 685,000
Total Revenues 6,374,150 6,769,883 7,693,968 7,833,700
Year to Year Growth 395,733 924,085 139,73228
County Debt/Finances
Funding OptionsRevenue “Growth” Projections
Legislature approved a voter referendum to allow an additional $25,000
homestead exemption on the values between $100,000 - $125,000
Future increases will depend on property values and new construction
29
County Debt/Finances
Funding OptionsRevenue “Growth” Projections
Target
Ad Valorem exemption expires 2018. Will be added to 2019 tax roll.
Estimated revenue: $362,730 - 2017 Working Values.
US Cold Storage
Ad Valorem exemption expires 2023. Will be added to 2024 tax roll.
Estimated revenue: $101,678 - 2017 Working Values.
30
County Debt/Finances
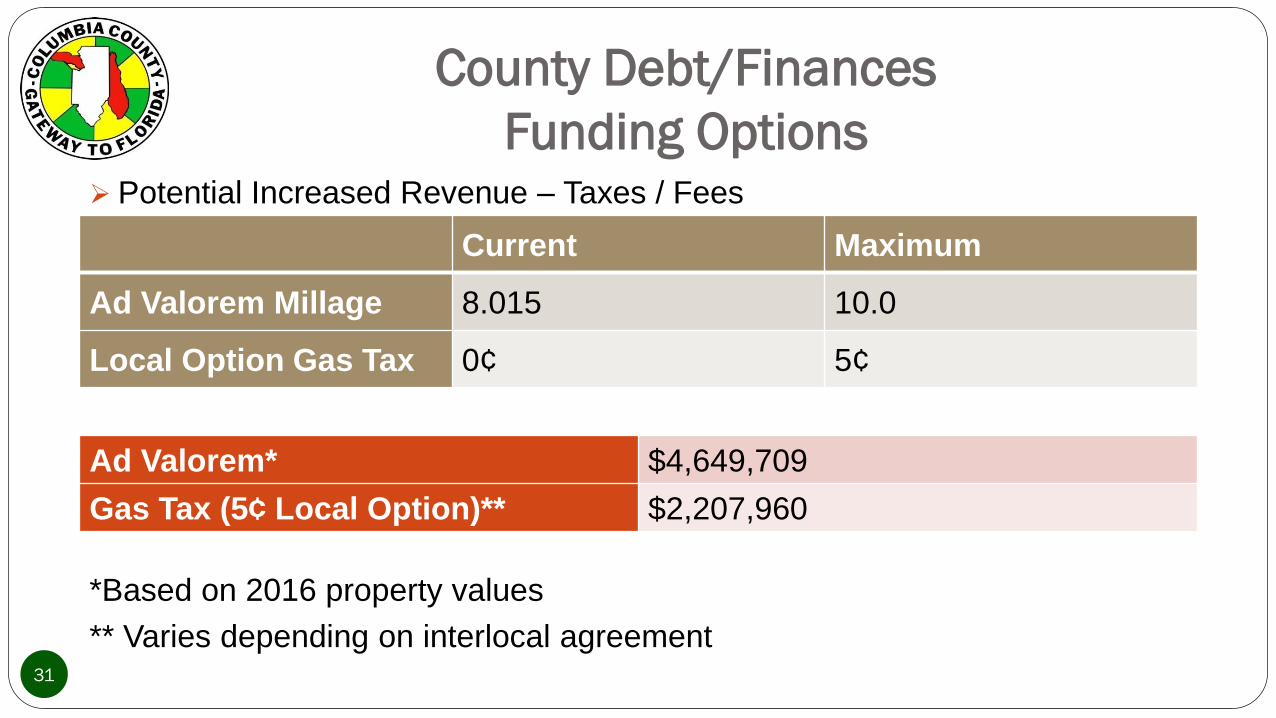
Funding Options Potential Increased Revenue – Taxes / Fees
*Based on 2016 property values
** Varies depending on interlocal agreement31
Current Maximum
Ad Valorem Millage 8.015 10.0
Local Option Gas Tax 0¢ 5¢
Ad Valorem* $4,649,709
Gas Tax (5¢ Local Option)** $2,207,960
County Debt/Finances
Funding Options
Increased Taxes/Fees
Special Assessments
Primarily regulated by case law. Can only be used for services that benefit
property. New study for FY 2017-2018 suggests a rate increase.
32

County Debt/Finances
Funding Options
Loan / Bond Issues –
Pledgable revenue is often the issue –
Ad Valorem cannot be pledged without referendum approval
Pledgable revenues:
Operational Revenue (i.e. utility revenue)
County Revenue Sharing
Half-cent Sales Tax
Gas Taxes
33

County Debt/Finances
Funding Options
Columbia County
Long Term Liabilities
34
County Debt/Finances
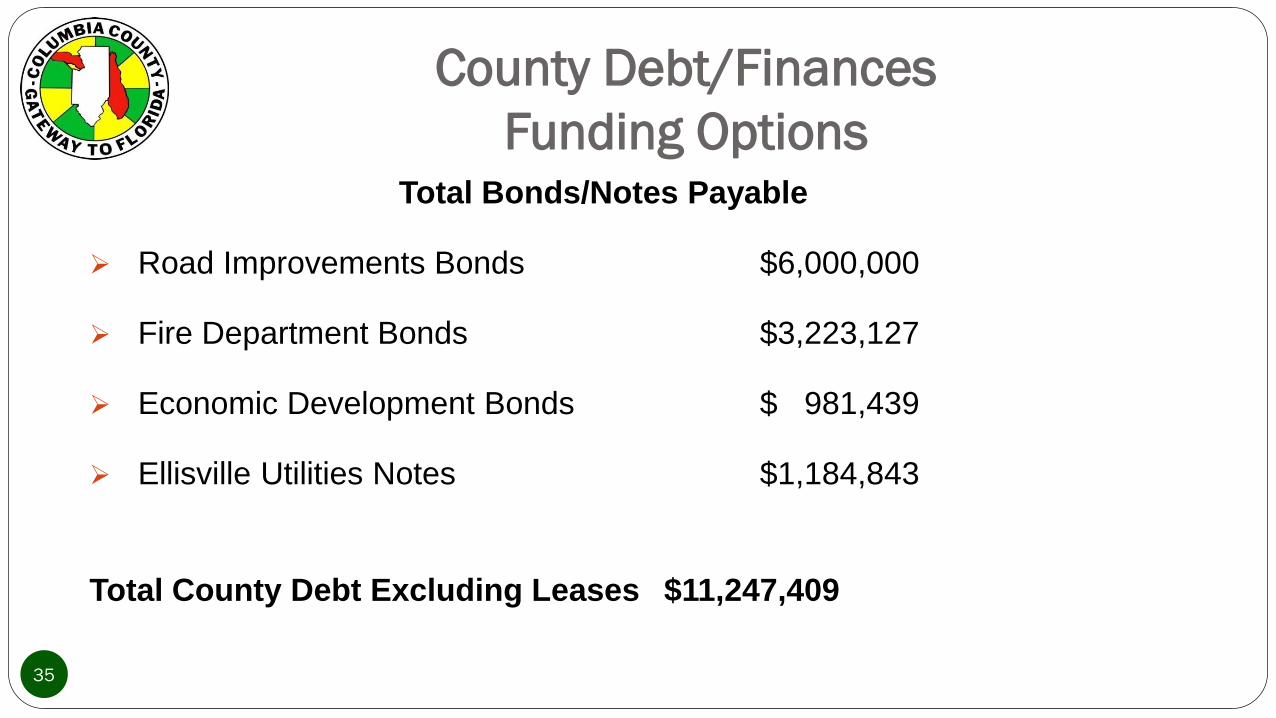
Funding OptionsTotal Bonds/Notes Payable
Road Improvements Bonds $6,000,000
Fire Department Bonds $3,223,127
Economic Development Bonds $ 981,439
Ellisville Utilities Notes $1,184,843
Total County Debt Excluding Leases $11,247,409
35

Schedule for Additional Debt Service
Payments
36
Economic
DevelopmentUtility A Utility B Utility C Fire Road
Principal Balance $981,439 $161,332 $576,888 $446,623 $3,223,127 $6,000,000
Debt Service Principal & Interest
2017 $489,798 $13,568 $86,140 $35,812 $341,000 $647,000
2018 $489,798 $13,568 $86,140 $35,812 $341,000 $647,000
2019 $37,646 $142,619 $401,660 $35,812 $341,000 $647,000
2020 $33,135 $352,606 $513,508 $647,000
2021 $830,000 $647,000
2022 $830,000 $647,000
2023 $244,933 $1,136,000
2024 $1,136,000
2025 $268,795

County Debt/Finances
Funding OptionsCapital Leases
The County currently has several pieces of equipment under guaranteed
lease buyback plans. Principal balance as of 9/30/16 - $1,610,194
These lease are secured by the equipment and repaid through funding within
the department which purchased the equipment.
The leases are typically for 5 years with a balloon payment equaling the
buyback amount.
Interest rates vary depending on the market at the time of lease.
37
Motor Grader
Lease vs. PurchaseKevin Kirby
Assistant County Manager - Operations
Thursday, May 25, 2017
School Board Administrative Complex
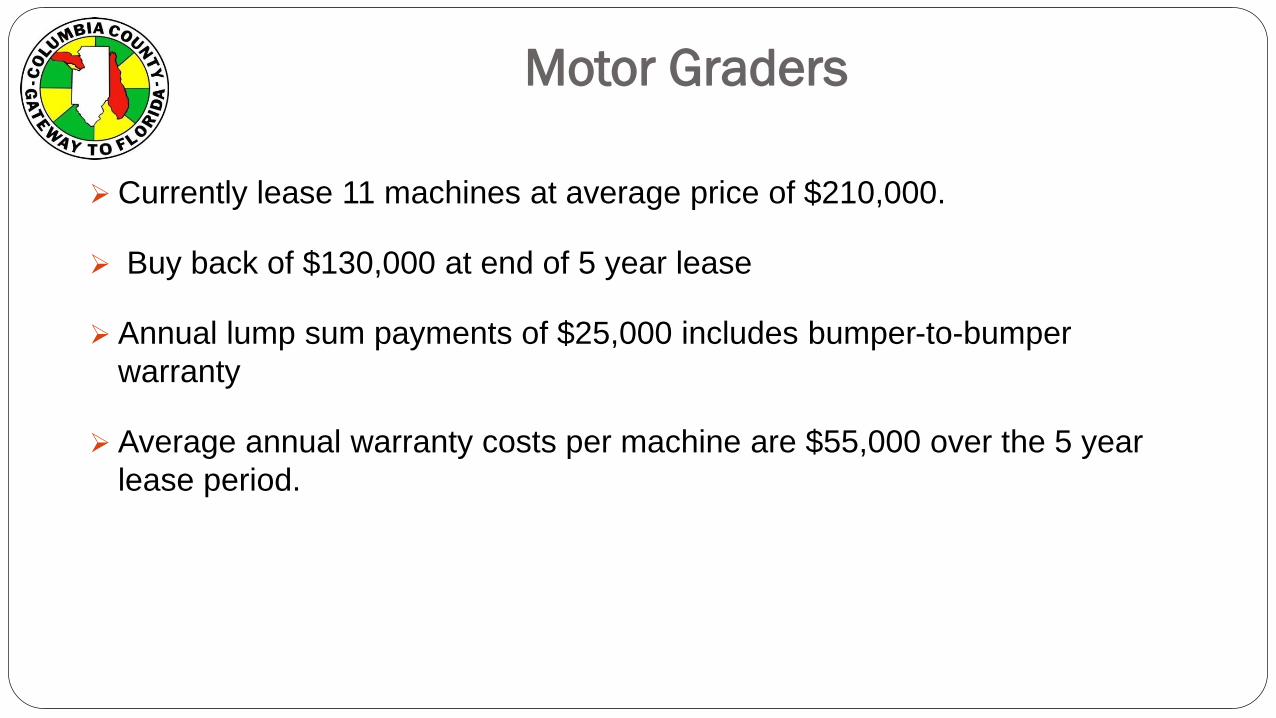
Motor Graders
Currently lease 11 machines at average price of $210,000.
Buy back of $130,000 at end of 5 year lease
Annual lump sum payments of $25,000 includes bumper-to-bumper
warranty
Average annual warranty costs per machine are $55,000 over the 5 year
lease period.
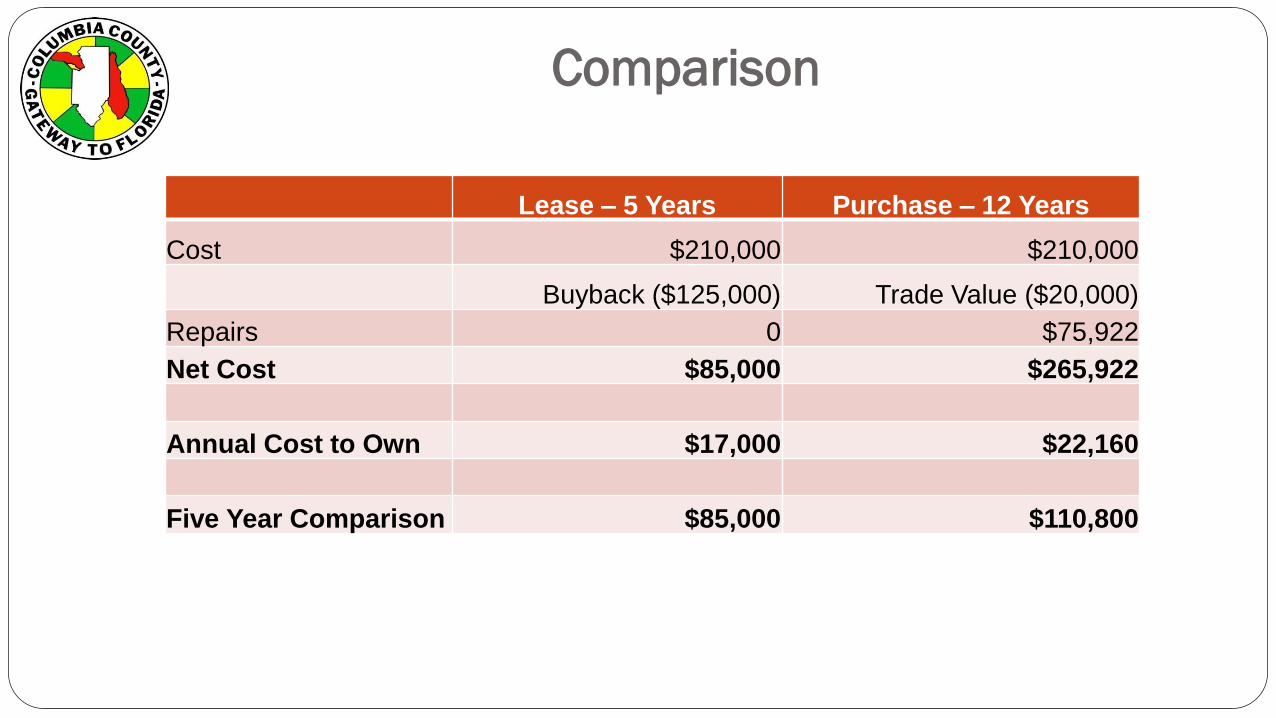
Comparison
Lease – 5 Years Purchase – 12 Years
Cost $210,000 $210,000
Buyback ($125,000) Trade Value ($20,000)
Repairs 0 $75,922
Net Cost $85,000 $265,922
Annual Cost to Own $17,000 $22,160
Five Year Comparison $85,000 $110,800

Advantages
Little Down Time
Require Skilled Mechanics
Machine Totally Warranted
Lease Net Cost $85,000
Buyback $125,000 vs $20,000 Trade In
Budget Effects
Questions? Comments? Motions?
42
County Debt/Finances

Road Improvement
Needs/Options
43
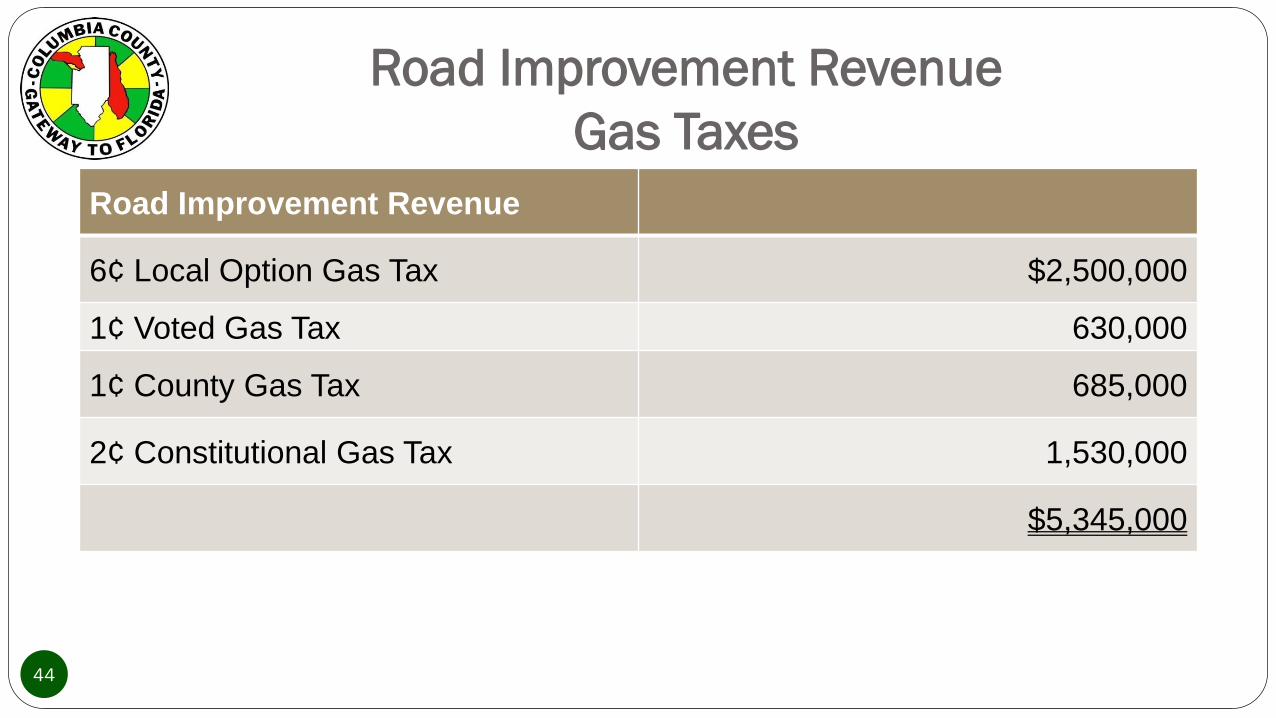
Road Improvement Revenue
Gas Taxes
44
Road Improvement Revenue
6¢ Local Option Gas Tax $2,500,000
1¢ Voted Gas Tax 630,000
1¢ County Gas Tax 685,000
2¢ Constitutional Gas Tax 1,530,000
$5,345,000

Road Improvement Needs/Options
Road Improvement Expenses
45
Transportation Trust $8,848,106
Road Improvement* 16,650,146
Road Improvement Debt Service 648,000
$26,146,252
Gas Tax Revenue 5,345,000
Difference $20,801,252
*Not grant funded

Road Improvement Needs/Options
Where does the revenue, other than the gas taxes, come from?
46
Small County Surtax 1,900,000
National forest regular distribution 110,000
Half-cent sales tax-regular 1,500,000
Half-cent sales tax-fiscally constrained 640,000
Fuel decal user fee 2,000
Motor fuel tax rebate 45,000
F.D.O.T. lighting agreement 110,000
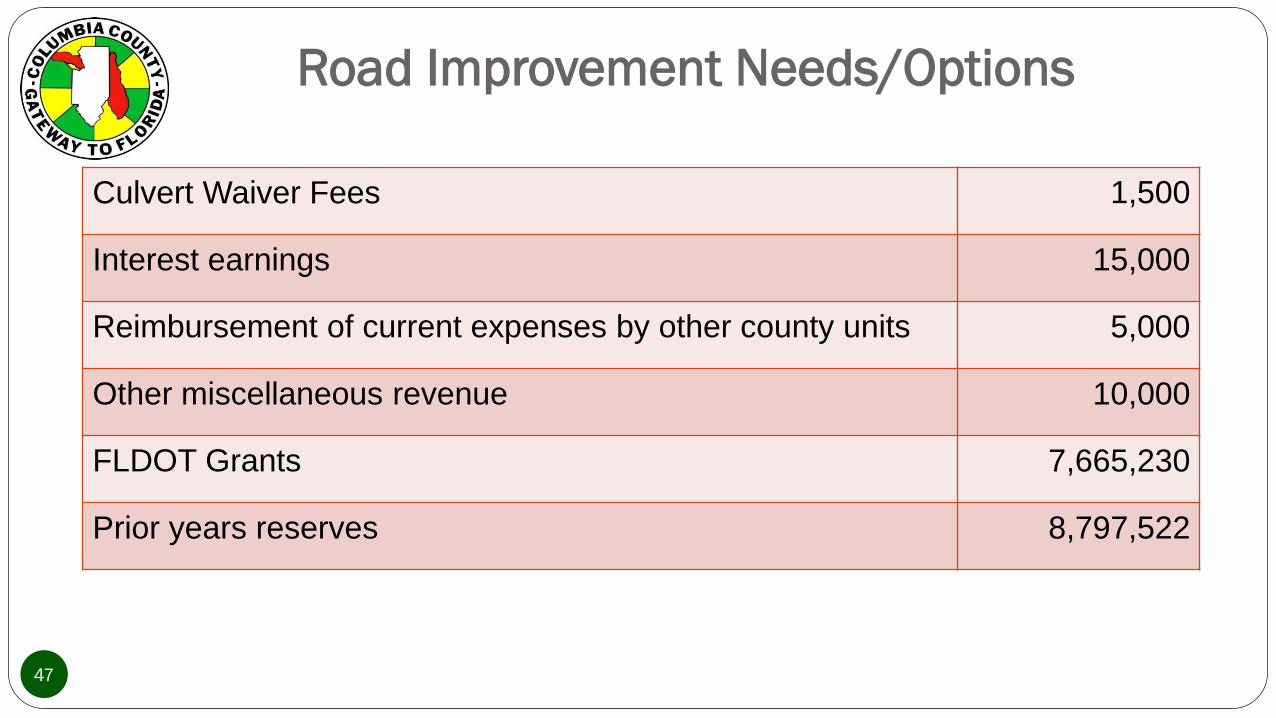
Road Improvement Needs/Options
47
Culvert Waiver Fees 1,500
Interest earnings 15,000
Reimbursement of current expenses by other county units 5,000
Other miscellaneous revenue 10,000
FLDOT Grants 7,665,230
Prior years reserves 8,797,522
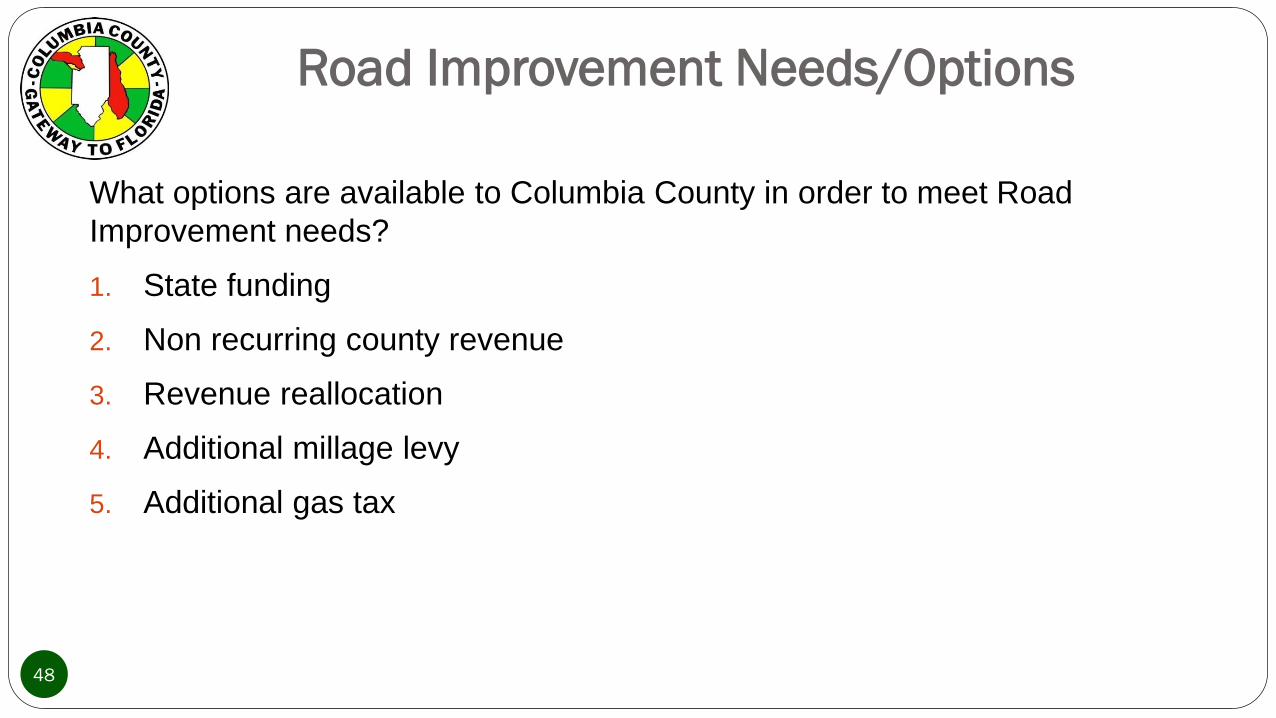
Road Improvement Needs/Options
What options are available to Columbia County in order to meet Road
Improvement needs?
1. State funding
2. Non recurring county revenue
3. Revenue reallocation
4. Additional millage levy
5. Additional gas tax
48

Road Improvement Needs/Options
Comparison of Local Option Gas Taxes of Surrounding Counties
49
Columbia 7¢ Hamilton 7¢
Alachua 12¢ Lafayette 7¢
Baker 7¢ Levy 7¢
Bradford 7¢ Madison 12¢
Clay 7¢ Marion 12¢
Dixie 7¢ Suwannee 12¢
Gilchrist 7¢ Union 7¢
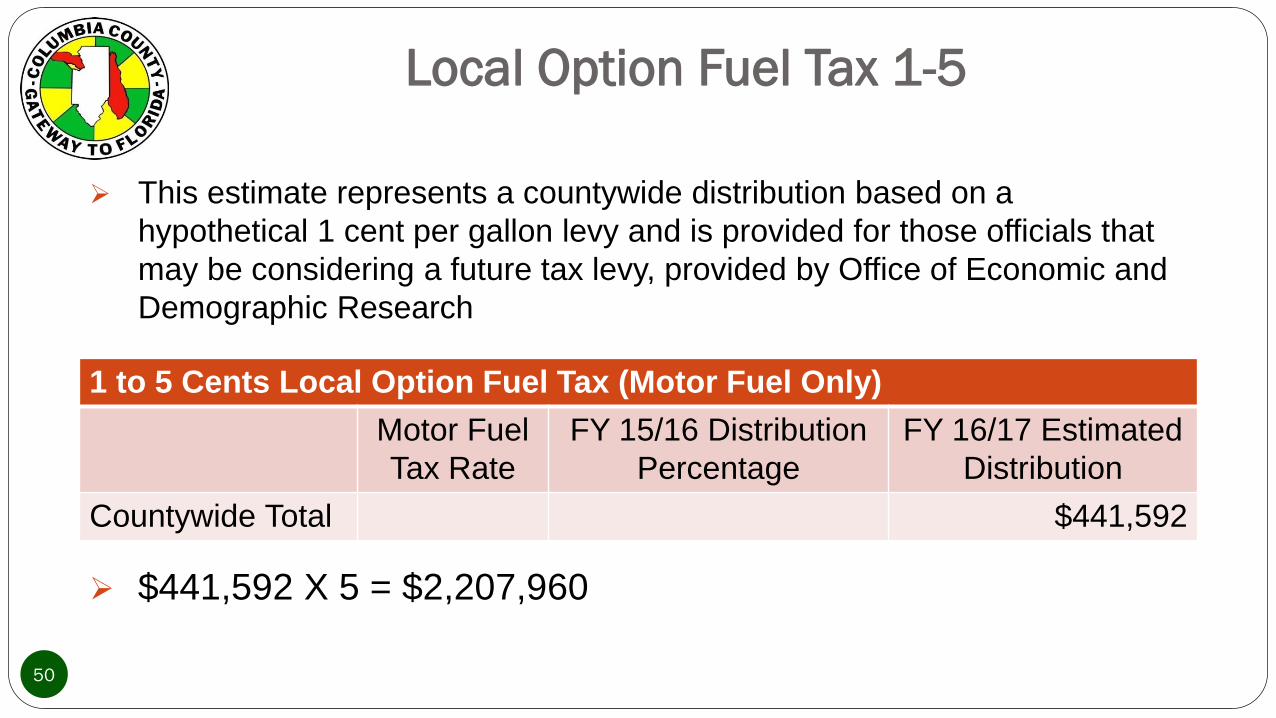
Local Option Fuel Tax 1-5
This estimate represents a countywide distribution based on a
hypothetical 1 cent per gallon levy and is provided for those officials that
may be considering a future tax levy, provided by Office of Economic and
Demographic Research
$441,592 X 5 = $2,207,960
50
1 to 5 Cents Local Option Fuel Tax (Motor Fuel Only)
Motor Fuel
Tax Rate
FY 15/16 Distribution
Percentage
FY 16/17 Estimated
Distribution
Countywide Total $441,592
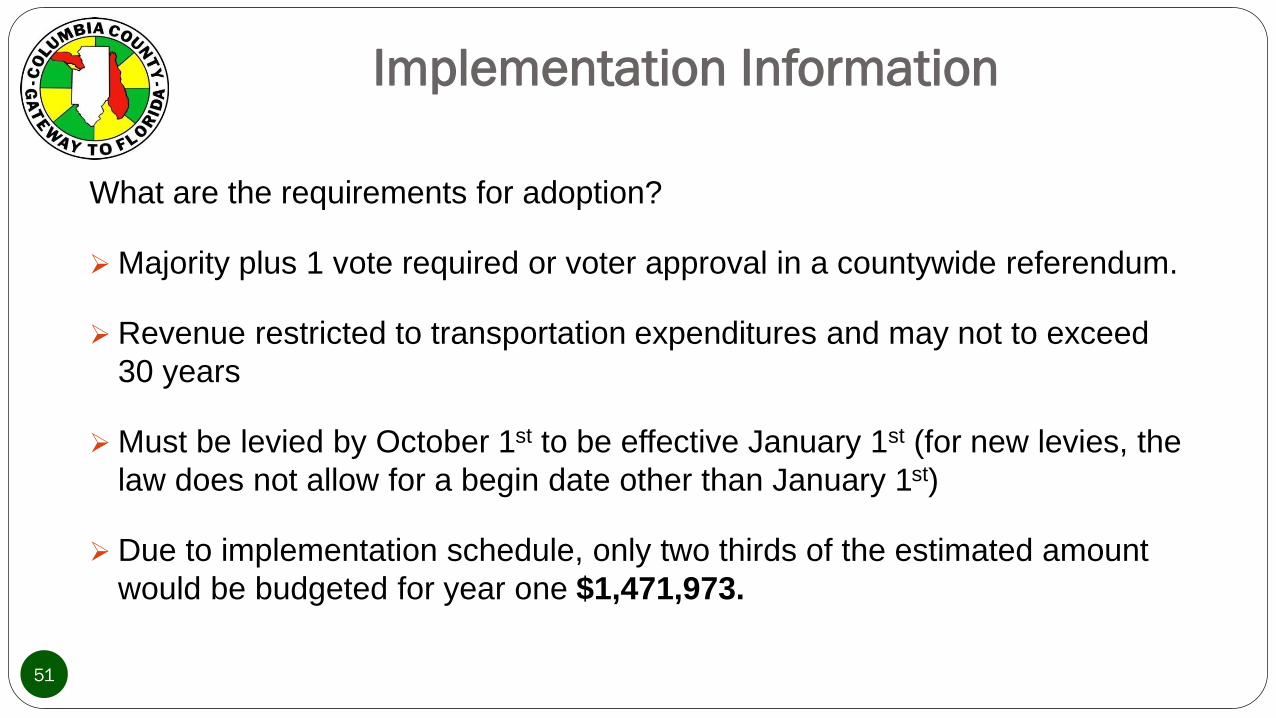
Implementation Information
What are the requirements for adoption?
Majority plus 1 vote required or voter approval in a countywide referendum.
Revenue restricted to transportation expenditures and may not to exceed
30 years
Must be levied by October 1st to be effective January 1st (for new levies, the
law does not allow for a begin date other than January 1st)
Due to implementation schedule, only two thirds of the estimated amount
would be budgeted for year one $1,471,973.
51

Implementation Information
During the 2016-17 local fiscal year, the 31 counties levying this tax will
realize an estimated $230 million in revenue. The 41 counties not currently
levying this tax at the maximum rate will allow an estimated $188 million to
go unrealized.*
*Provided by Office of Economic and Demographic Research
52
Road Prioritization/Funding
Kevin Kirby
Assistant County Manager - Operations
Thursday, May 25, 2017
School Board Administrative Complex
53
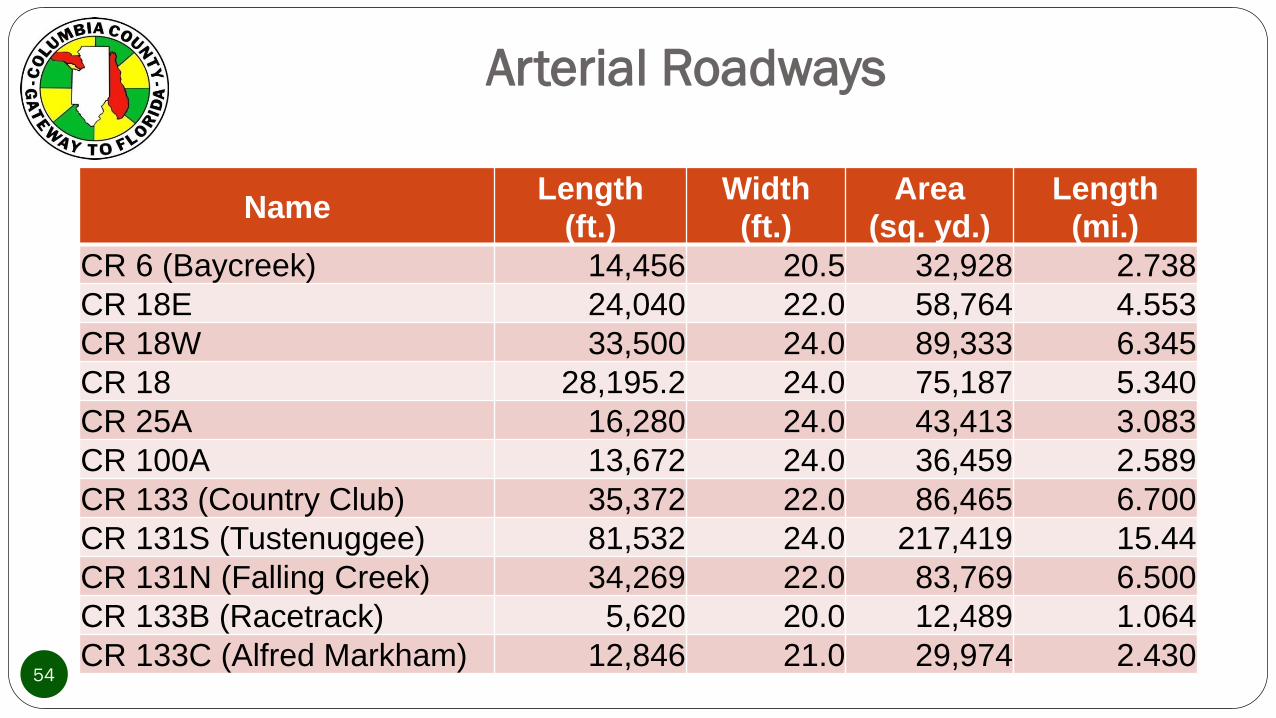
Arterial Roadways
NameLength
(ft.)
Width
(ft.)
Area
(sq. yd.)
Length
(mi.)
CR 6 (Baycreek) 14,456 20.5 32,928 2.738
CR 18E 24,040 22.0 58,764 4.553
CR 18W 33,500 24.0 89,333 6.345
CR 18 28,195.2 24.0 75,187 5.340
CR 25A 16,280 24.0 43,413 3.083
CR 100A 13,672 24.0 36,459 2.589
CR 133 (Country Club) 35,372 22.0 86,465 6.700
CR 131S (Tustenuggee) 81,532 24.0 217,419 15.44
CR 131N (Falling Creek) 34,269 22.0 83,769 6.500
CR 133B (Racetrack) 5,620 20.0 12,489 1.064
CR 133C (Alfred Markham) 12,846 21.0 29,974 2.43054

Arterial Roadways
NameLength
(ft.)
Width
(ft.)
Area
(sq. yd.)
Length
(mi.)
CR135 (Noegel) 23,440 22.0 57,298 4.439
CR138 33,880 24.0 90,347 6.417
CR 238 (Elim Church) 45,331 22.0 110,809 8.585
CR 238 A (Itchnetucknee) 26,816 22.0 65,550 5.079
CR 240 (Myrtis) 7,300 22.0 17,844 1.383
CR 240 62,454 24.0 166,544 11.83
CR 240E (Family) 14,195 20.0 31,544 2.688
CR 241 10,902 18.0 21,804 2.065
CR 242 30,412.8 22.0 74,342 5.760
CR 242E (CR 242 A) 11,395 22.0 27,854 2.160
CR 242W 43,546 22.0 106,446 8.25055
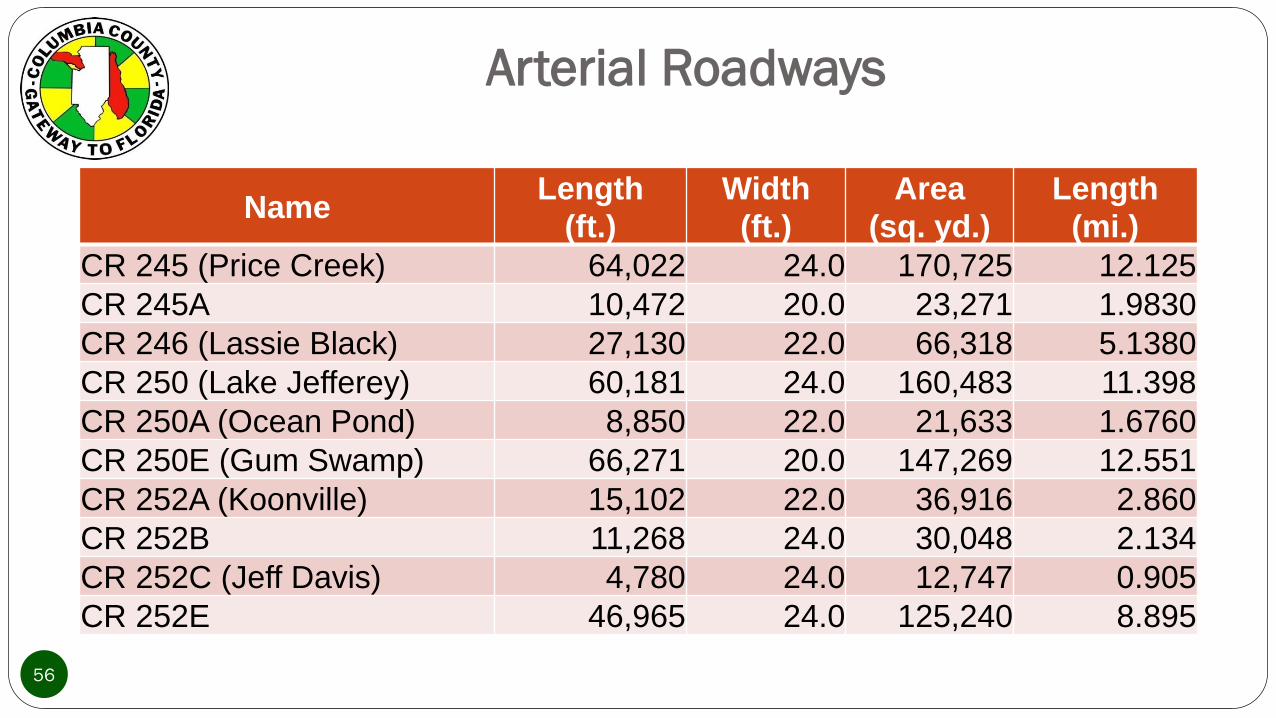
Arterial Roadways
NameLength
(ft.)
Width
(ft.)
Area
(sq. yd.)
Length
(mi.)
CR 245 (Price Creek) 64,022 24.0 170,725 12.125
CR 245A 10,472 20.0 23,271 1.9830
CR 246 (Lassie Black) 27,130 22.0 66,318 5.1380
CR 250 (Lake Jefferey) 60,181 24.0 160,483 11.398
CR 250A (Ocean Pond) 8,850 22.0 21,633 1.6760
CR 250E (Gum Swamp) 66,271 20.0 147,269 12.551
CR 252A (Koonville) 15,102 22.0 36,916 2.860
CR 252B 11,268 24.0 30,048 2.134
CR 252C (Jeff Davis) 4,780 24.0 12,747 0.905
CR 252E 46,965 24.0 125,240 8.895
56

Arterial Roadways
NameLength
(ft.)
Width
(ft.)
Area
(sq. yd.)
Length
(mi.)
CR 252 W (Pinemount) 31,134 24.0 83,024 5.897
CR 341 (Sister's Welcome) 25,165 24.0 67,107 4.766
CR 341 (Dyal) 5,850 20.0 13,000 1.108
CR 349 27,714 24.0 73,904 5.249
CR 778 18,866 24.0 50,309 3.573
Bascom Norris 29,422 24.0 78,459 5.580
Totals 1,062,646 2,697,035 201.276
Total ($) $47,111,666.94
Lifespan (years) 15
Cost per year $3,140,777.80
57

Major Collector
58
NameLength
(ft.)
Width
(ft.)
Area
(sq. yd.)
Length
(mi.)
Academic 5,535 24.0 14,760 1.048
Arlington 2,815 14.0 4,379 0.533
Arrowhead 3,980 21.0 9,287 0.754
Birley 27,006 21.0 63,014 5.110
Bishop 8,530 24.0 22,747 1.616
Brown 20,840 20.0 46,311 3.947
Callahan 3,000 19.0 6,333 0.570
Cannon Creek 5,540 19.0 11,696 1.049
Herlong 21,162 24.0 56,432 4.008
Hope Henry 6,895 22.0 16,854 1.306
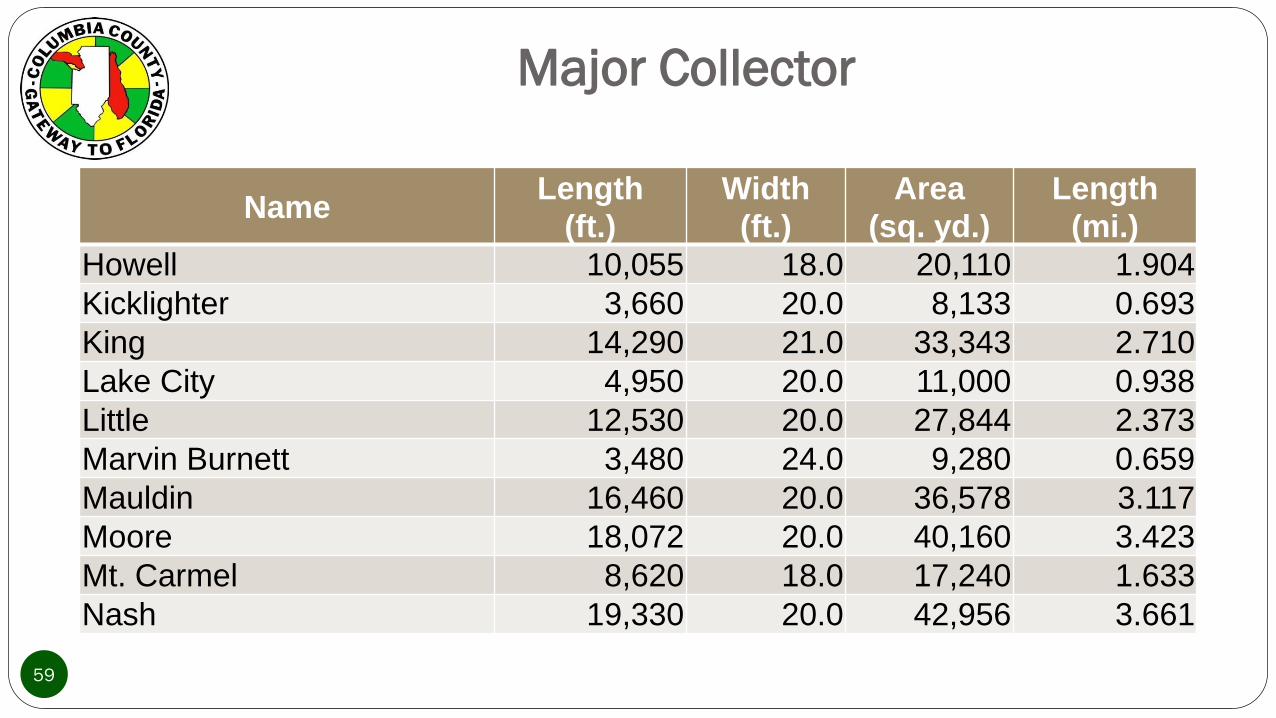
Major Collector
59
NameLength
(ft.)
Width
(ft.)
Area
(sq. yd.)
Length
(mi.)
Howell 10,055 18.0 20,110 1.904
Kicklighter 3,660 20.0 8,133 0.693
King 14,290 21.0 33,343 2.710
Lake City 4,950 20.0 11,000 0.938
Little 12,530 20.0 27,844 2.373
Marvin Burnett 3,480 24.0 9,280 0.659
Mauldin 16,460 20.0 36,578 3.117
Moore 18,072 20.0 40,160 3.423
Mt. Carmel 8,620 18.0 17,240 1.633
Nash 19,330 20.0 42,956 3.661
Major Collector
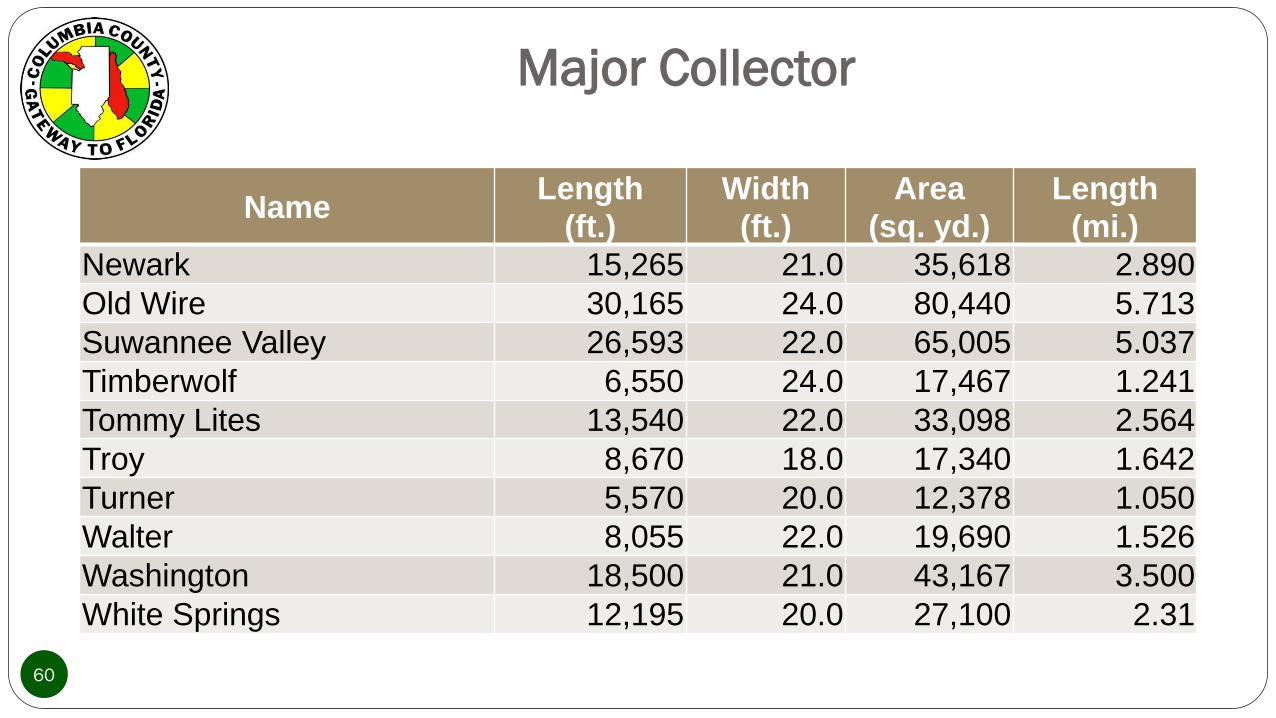
60
NameLength
(ft.)
Width
(ft.)
Area
(sq. yd.)
Length
(mi.)
Newark 15,265 21.0 35,618 2.890
Old Wire 30,165 24.0 80,440 5.713
Suwannee Valley 26,593 22.0 65,005 5.037
Timberwolf 6,550 24.0 17,467 1.241
Tommy Lites 13,540 22.0 33,098 2.564
Troy 8,670 18.0 17,340 1.642
Turner 5,570 20.0 12,378 1.050
Walter 8,055 22.0 19,690 1.526
Washington 18,500 21.0 43,167 3.500
White Springs 12,195 20.0 27,100 2.31
Major Collector
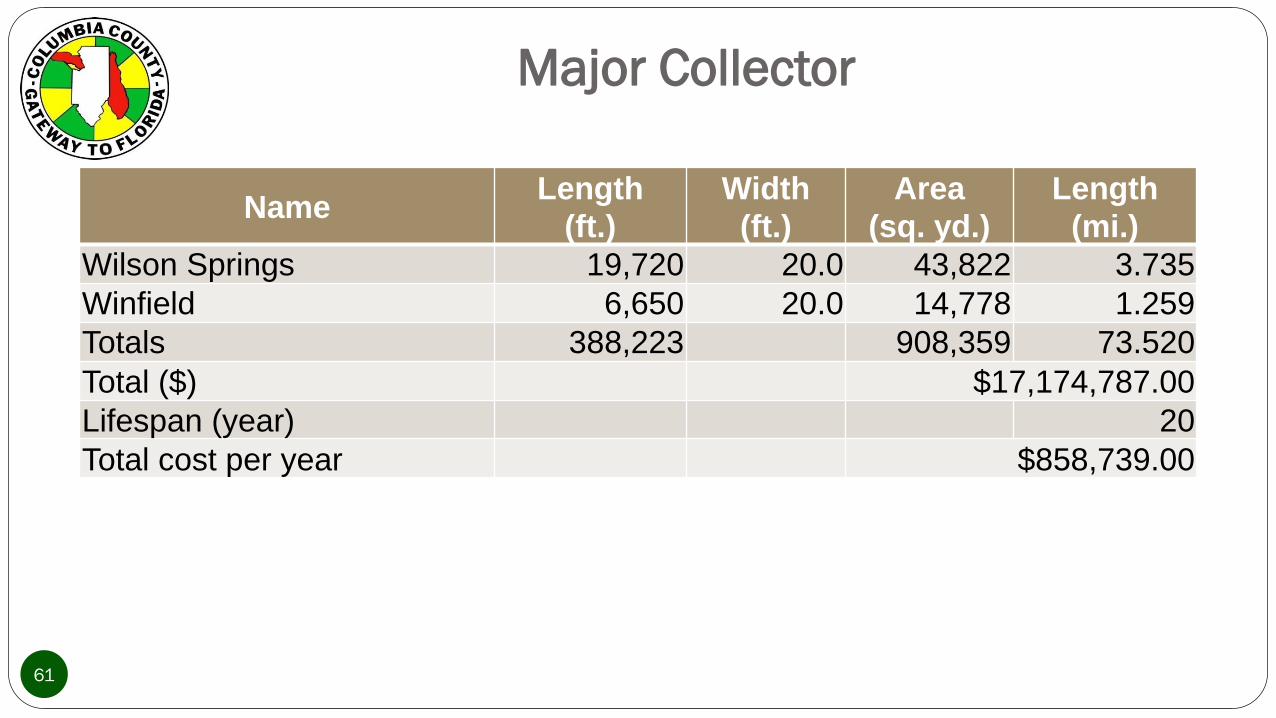
61
NameLength
(ft.)
Width
(ft.)
Area
(sq. yd.)
Length
(mi.)
Wilson Springs 19,720 20.0 43,822 3.735
Winfield 6,650 20.0 14,778 1.259
Totals 388,223 908,359 73.520
Total ($) $17,174,787.00
Lifespan (year) 20
Total cost per year $858,739.00

Minor Collector
62
NameLength
(ft.)
Width
(ft.)
Area
(sq. yd.)
Length
(mi.)
Amanda 3,905 20.0 8,678 0.740
Ash 5,645 20.0 12,544 1.069
Barwick 5,591 19.0 11,803 1.059
Battlehill 2,495 20.0 5,544 0.473
Baughn 7,775 19.0 16,414 1.473
Bert 3,970 20.0 8,822 0.752
Bethlehem 6,700 20.0 14,889 1.269
Bunn 4,882 20.0 10,849 0.925
Business Pt 10,815 24.0 28,840 2.048
Combs 11,160 20.0 24,800 2.114
Minor Collector
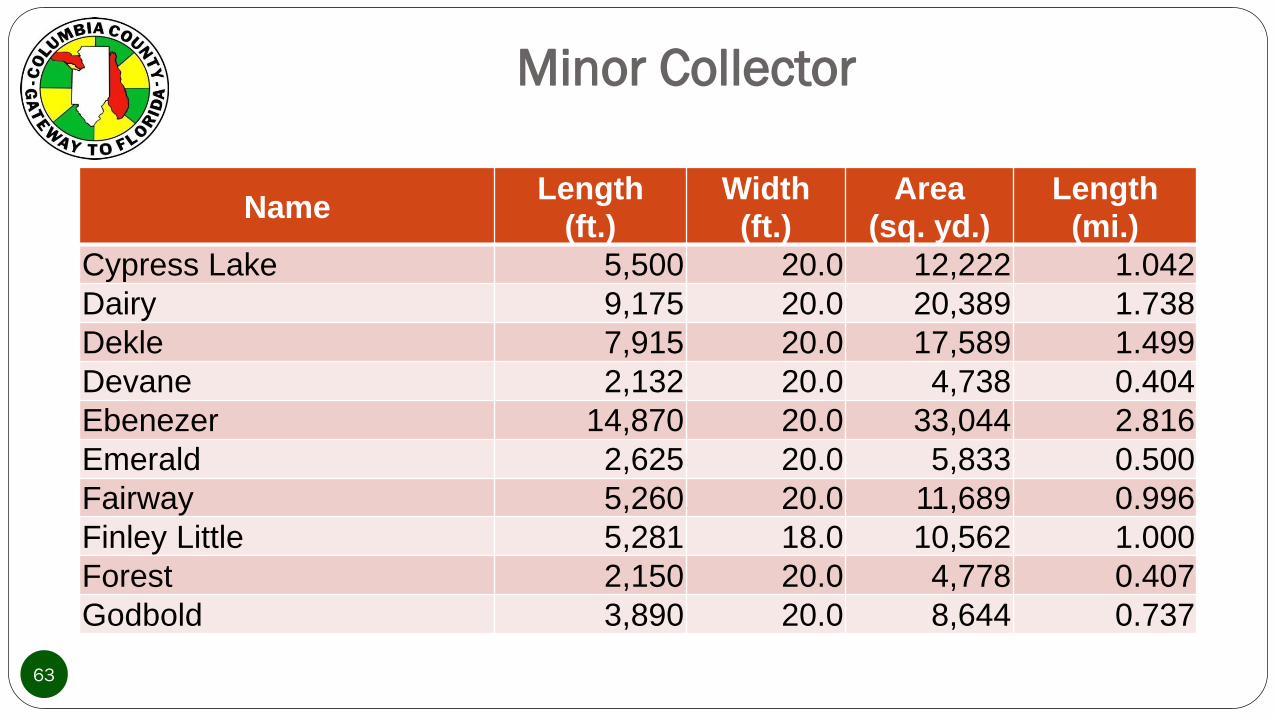
63
NameLength
(ft.)
Width
(ft.)
Area
(sq. yd.)
Length
(mi.)
Cypress Lake 5,500 20.0 12,222 1.042
Dairy 9,175 20.0 20,389 1.738
Dekle 7,915 20.0 17,589 1.499
Devane 2,132 20.0 4,738 0.404
Ebenezer 14,870 20.0 33,044 2.816
Emerald 2,625 20.0 5,833 0.500
Fairway 5,260 20.0 11,689 0.996
Finley Little 5,281 18.0 10,562 1.000
Forest 2,150 20.0 4,778 0.407
Godbold 3,890 20.0 8,644 0.737
Minor Collector
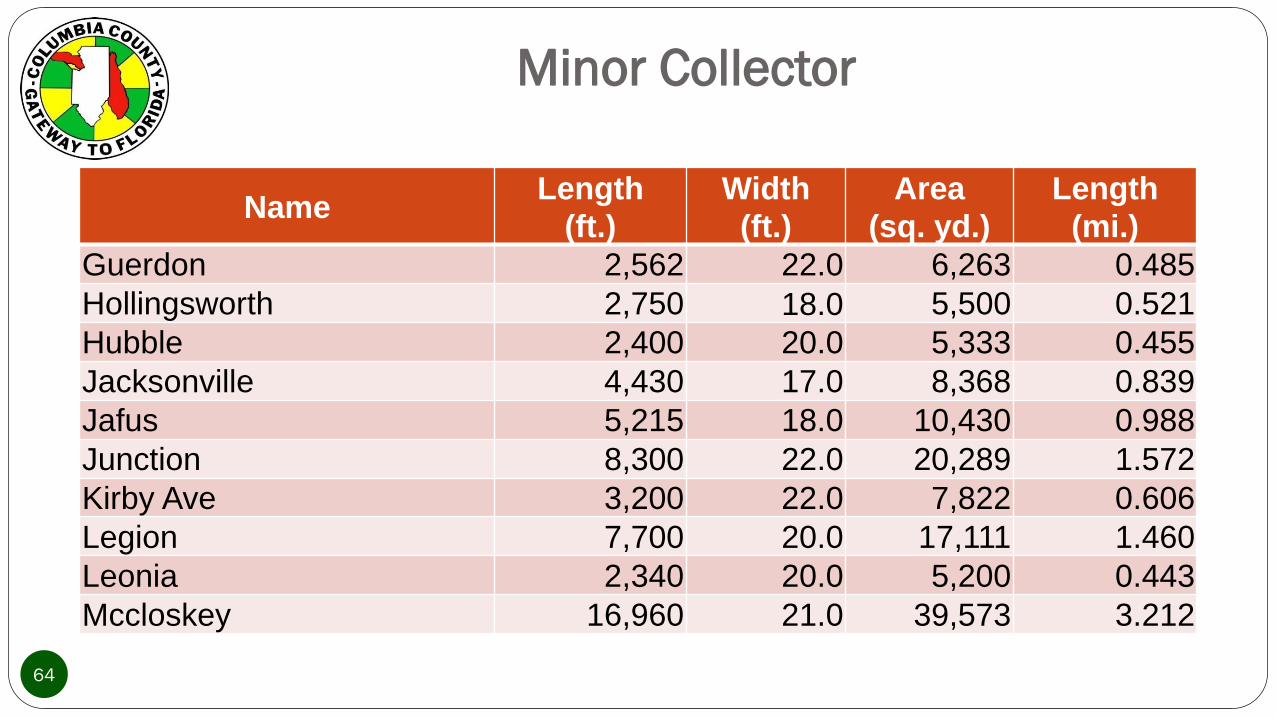
64
NameLength
(ft.)
Width
(ft.)
Area
(sq. yd.)
Length
(mi.)
Guerdon 2,562 22.0 6,263 0.485
Hollingsworth 2,750 18.0 5,500 0.521
Hubble 2,400 20.0 5,333 0.455
Jacksonville 4,430 17.0 8,368 0.839
Jafus 5,215 18.0 10,430 0.988
Junction 8,300 22.0 20,289 1.572
Kirby Ave 3,200 22.0 7,822 0.606
Legion 7,700 20.0 17,111 1.460
Leonia 2,340 20.0 5,200 0.443
Mccloskey 16,960 21.0 39,573 3.212
Minor Collector
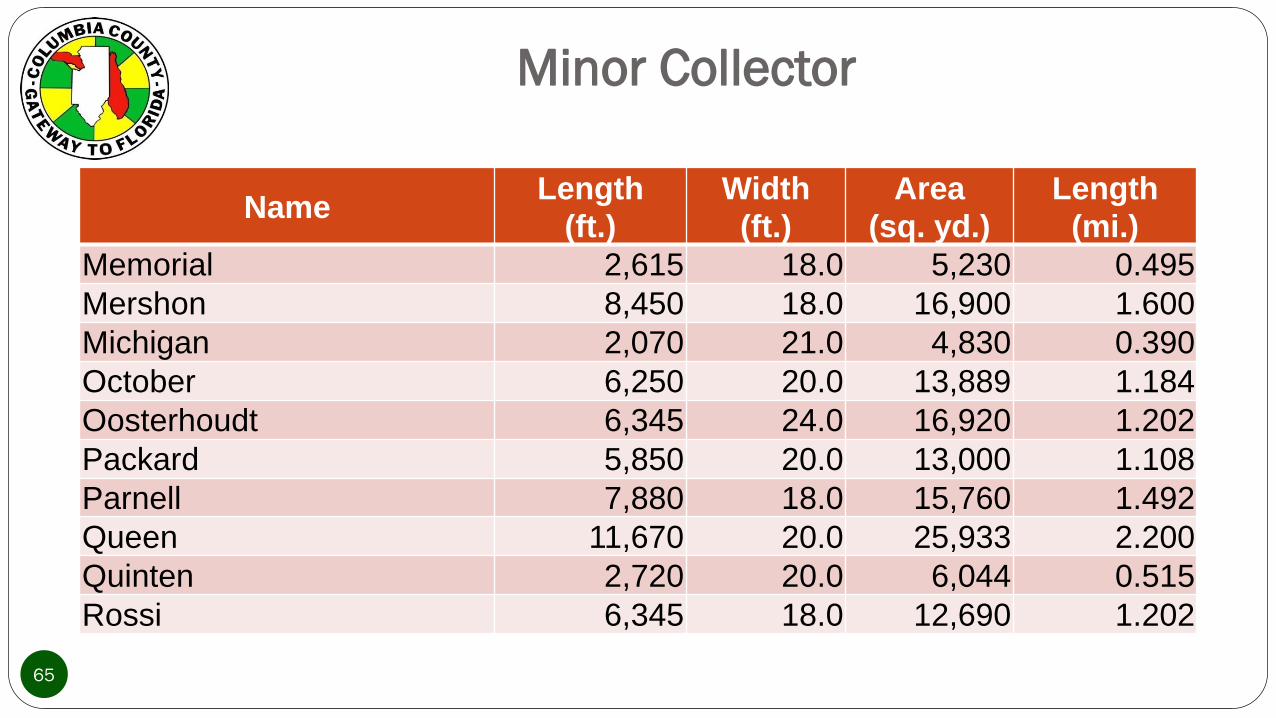
65
NameLength
(ft.)
Width
(ft.)
Area
(sq. yd.)
Length
(mi.)
Memorial 2,615 18.0 5,230 0.495
Mershon 8,450 18.0 16,900 1.600
Michigan 2,070 21.0 4,830 0.390
October 6,250 20.0 13,889 1.184
Oosterhoudt 6,345 24.0 16,920 1.202
Packard 5,850 20.0 13,000 1.108
Parnell 7,880 18.0 15,760 1.492
Queen 11,670 20.0 25,933 2.200
Quinten 2,720 20.0 6,044 0.515
Rossi 6,345 18.0 12,690 1.202
Minor Collector
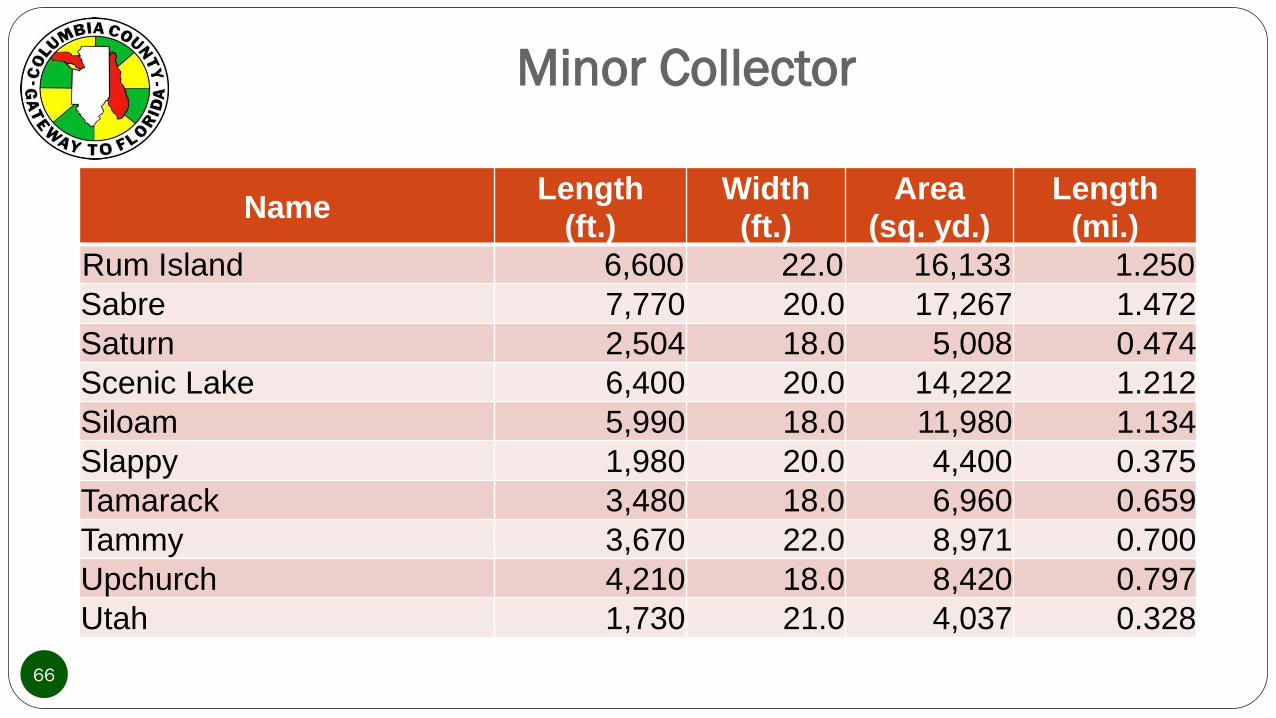
66
NameLength
(ft.)
Width
(ft.)
Area
(sq. yd.)
Length
(mi.)
Rum Island 6,600 22.0 16,133 1.250
Sabre 7,770 20.0 17,267 1.472
Saturn 2,504 18.0 5,008 0.474
Scenic Lake 6,400 20.0 14,222 1.212
Siloam 5,990 18.0 11,980 1.134
Slappy 1,980 20.0 4,400 0.375
Tamarack 3,480 18.0 6,960 0.659
Tammy 3,670 22.0 8,971 0.700
Upchurch 4,210 18.0 8,420 0.797
Utah 1,730 21.0 4,037 0.328
Minor Collector
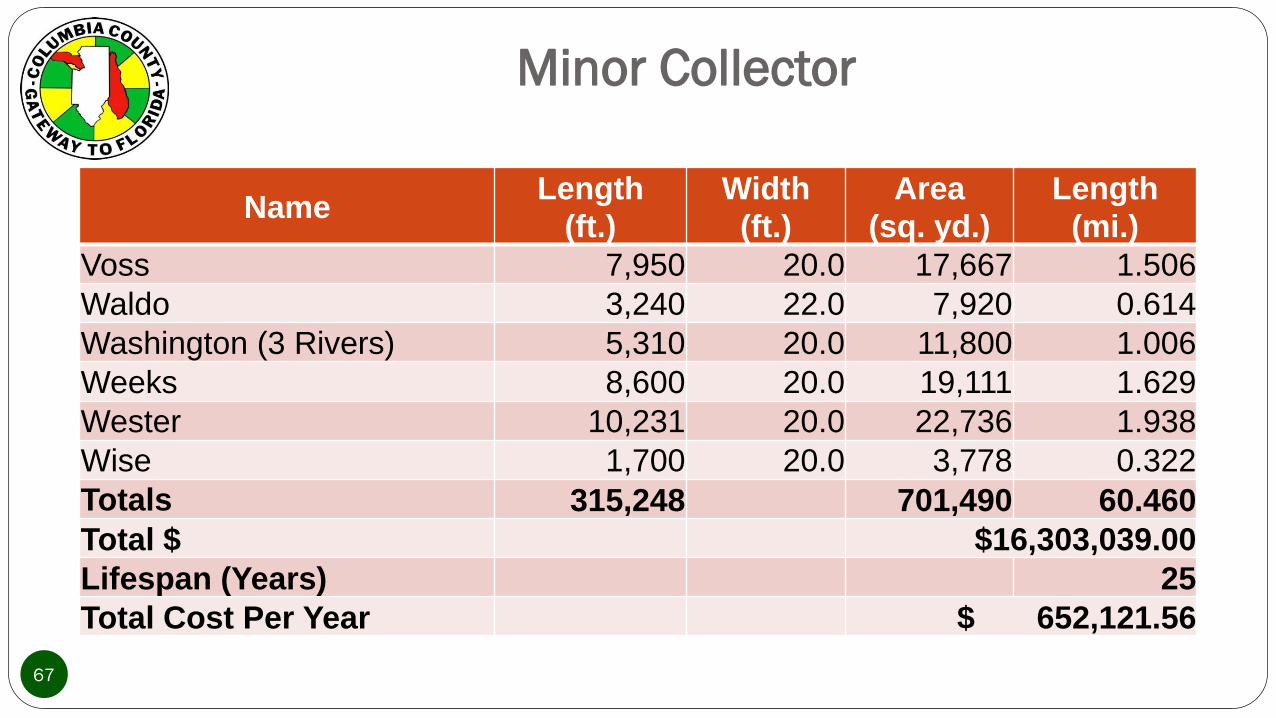
67
NameLength
(ft.)
Width
(ft.)
Area
(sq. yd.)
Length
(mi.)
Voss 7,950 20.0 17,667 1.506
Waldo 3,240 22.0 7,920 0.614
Washington (3 Rivers) 5,310 20.0 11,800 1.006
Weeks 8,600 20.0 19,111 1.629
Wester 10,231 20.0 22,736 1.938
Wise 1,700 20.0 3,778 0.322
Totals 315,248 701,490 60.460
Total $ $16,303,039.00
Lifespan (Years) 25
Total Cost Per Year $ 652,121.56
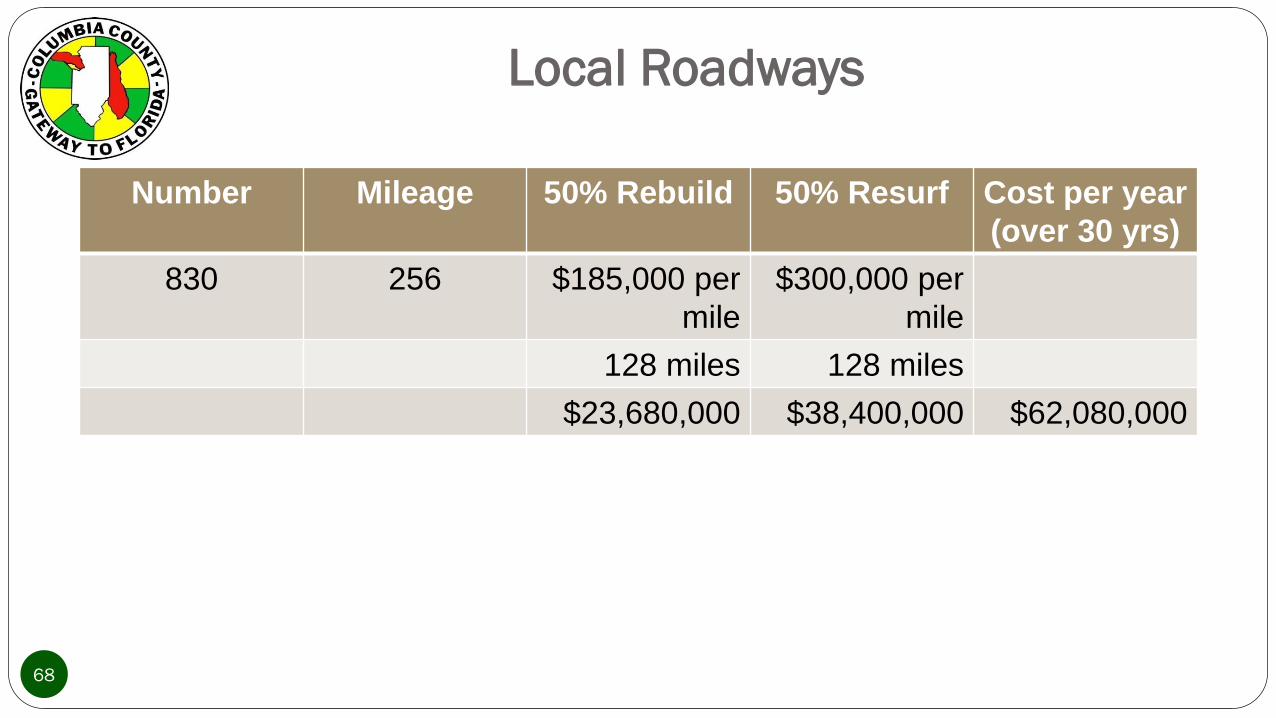
Local Roadways
Number Mileage 50% Rebuild 50% Resurf Cost per year
(over 30 yrs)
830 256 $185,000 per
mile
$300,000 per
mile
128 miles 128 miles
$23,680,000 $38,400,000 $62,080,000
68
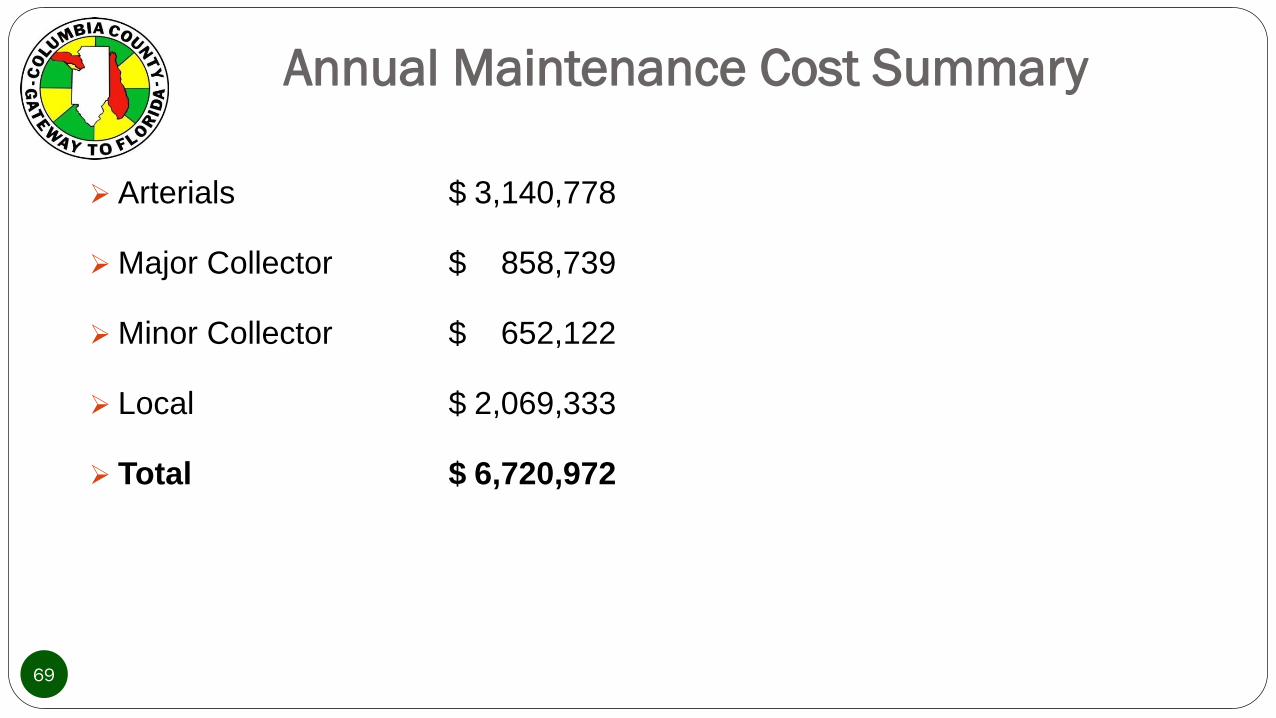
Arterials $ 3,140,778
Major Collector $ 858,739
Minor Collector $ 652,122
Local $ 2,069,333
Total $ 6,720,972
Annual Maintenance Cost Summary
69
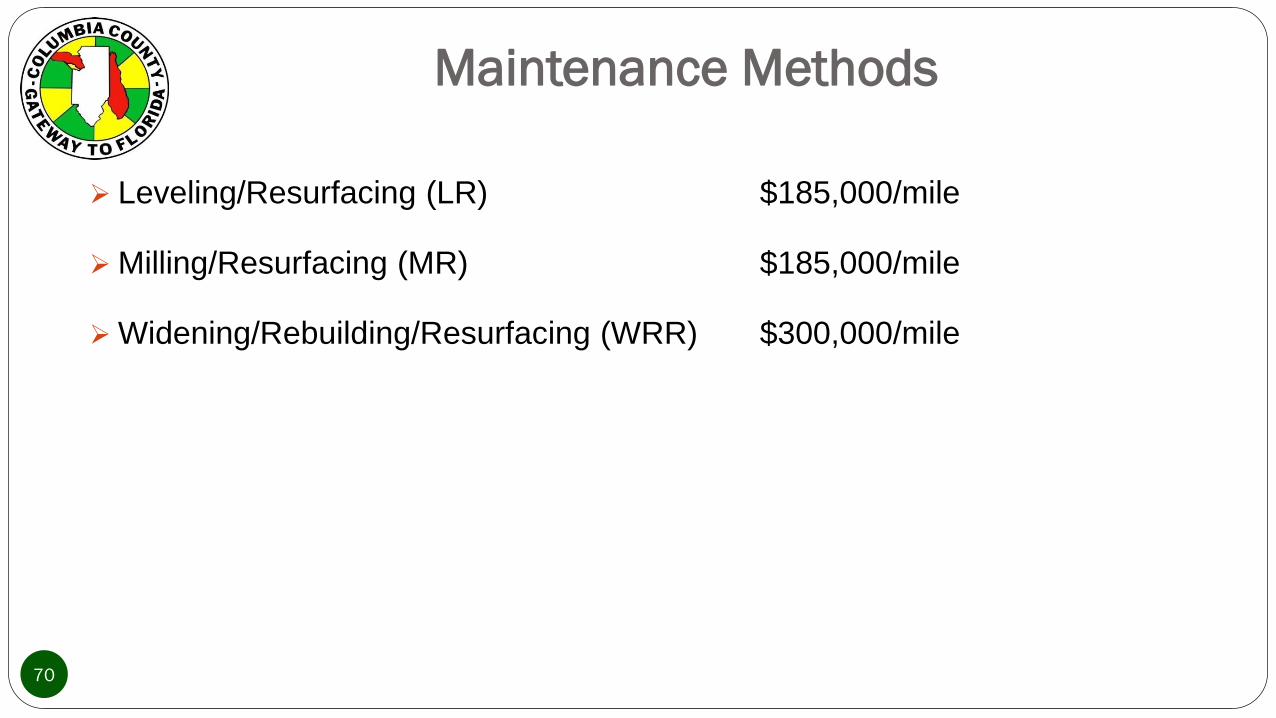
Maintenance Methods
70
Leveling/Resurfacing (LR) $185,000/mile
Milling/Resurfacing (MR) $185,000/mile
Widening/Rebuilding/Resurfacing (WRR) $300,000/mile
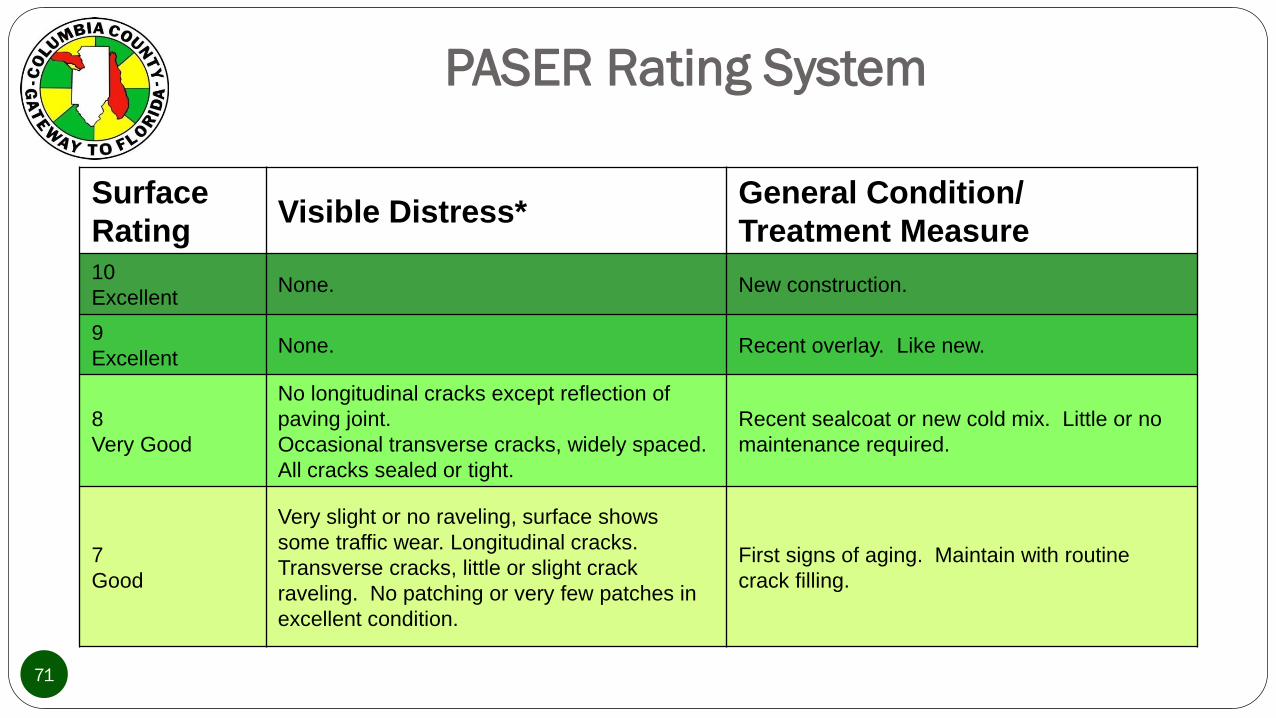
PASER Rating System
71
Surface
RatingVisible Distress*
General Condition/
Treatment Measure
10
ExcellentNone. New construction.
9
ExcellentNone. Recent overlay. Like new.
8
Very Good
No longitudinal cracks except reflection of
paving joint.
Occasional transverse cracks, widely spaced.
All cracks sealed or tight.
Recent sealcoat or new cold mix. Little or no
maintenance required.
7
Good
Very slight or no raveling, surface shows
some traffic wear. Longitudinal cracks.
Transverse cracks, little or slight crack
raveling. No patching or very few patches in
excellent condition.
First signs of aging. Maintain with routine
crack filling.

PASER Rating System
Surface
RatingVisible Distress*
General Condition/
Treatment Measure
6
Good
Slight raveling and traffic wear. Longitudinal
cracks. First sign of block cracking. Slight to
moderate flushing or polishing. Occasional
patching in good condition.
Shows signs of aging. Sound structural
condition. Could extend life with sealcoat.
5
Fair
Moderate to severe raveling. Longitudinal
and transverse cracks show first signs of
slight raveling and secondary cracks. First
signs of longitudinal cracks near pavement
edge. Block cracking up to 50% of surface.
Extensive to severe flushing or polishing.
Some patching or edge wedging in good
condition.
Surface aging. Sound structural condition.
Needs sealcoat or thin non-structural overlay.
72

PASER Rating System
Surface
RatingVisible Distress*
General Condition/ Treatment
Measure
4
Fair
Severe surface raveling. Multiple longitudinal
and transverse cracking with slight raveling.
Longitudinal cracking with wheel path. Block
cracking. Patching in fair condition. Slight
rutting or distortions.
Significant aging and first signs of need of
strengthening. Would benefit from a structural
overlay.
3
Poor
Closely spaced longitudinal and transverse
cracks often showing raveling and crack
erosion. Severe block cracking. Some
alligator cracking. Patches in fair to poor
condition. Moderate rutting or distortion.
Occasional potholes.
Needs patching and repair prior to major
overlay. Milling and removal of deterioration
extends the life of overlay.
73
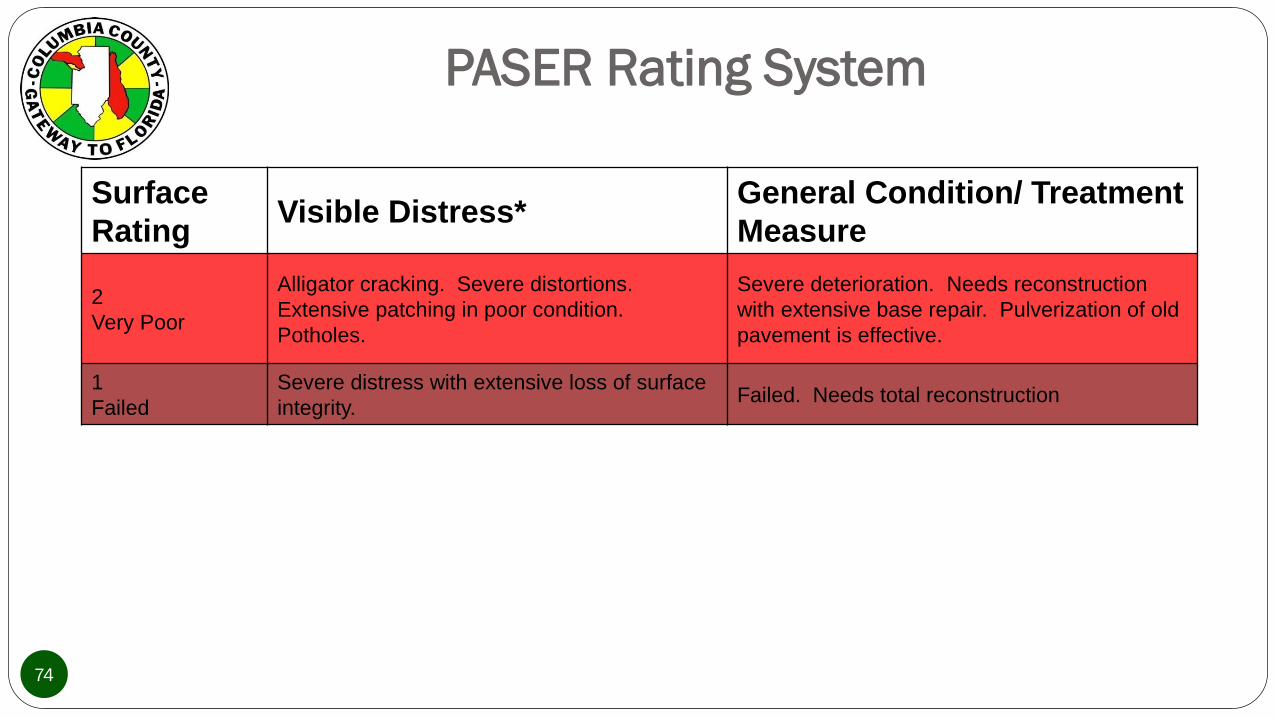
PASER Rating System
74
Surface
RatingVisible Distress*
General Condition/ Treatment
Measure
2
Very Poor
Alligator cracking. Severe distortions.
Extensive patching in poor condition.
Potholes.
Severe deterioration. Needs reconstruction
with extensive base repair. Pulverization of old
pavement is effective.
1
Failed
Severe distress with extensive loss of surface
integrity. Failed. Needs total reconstruction
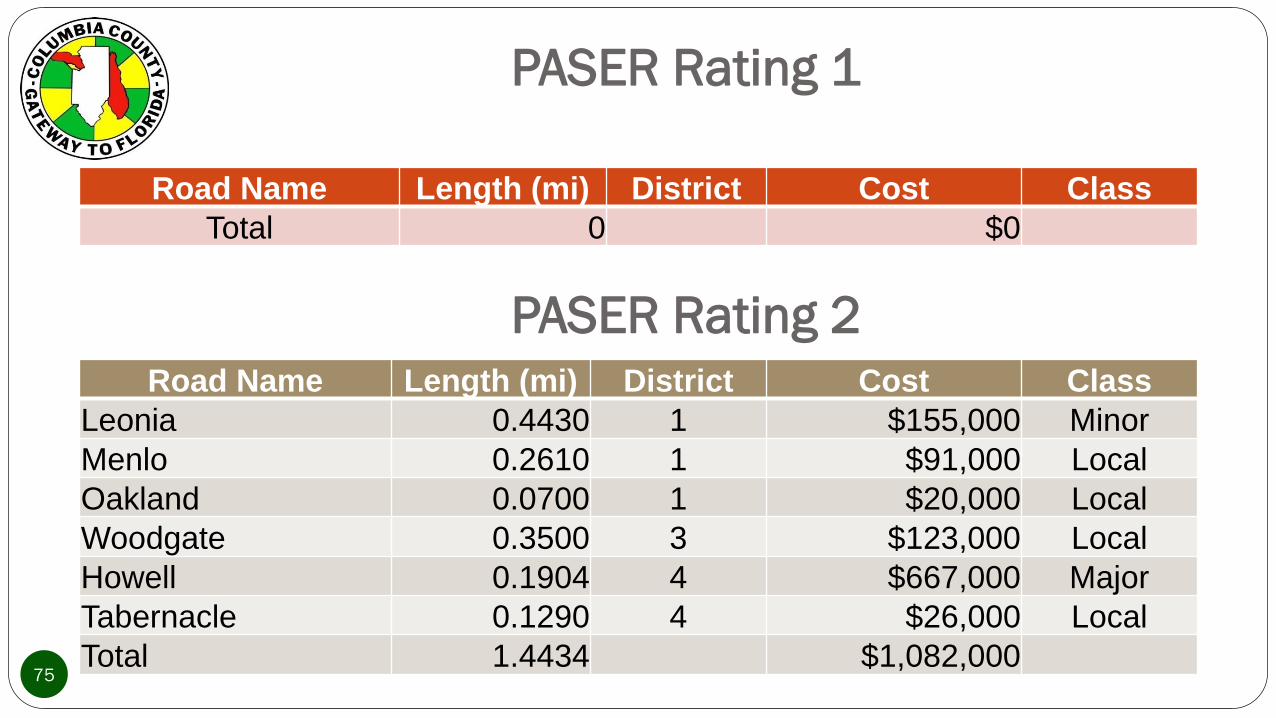
Road Name Length (mi) District Cost Class
Total 0 $0
PASER Rating 1
75
Road Name Length (mi) District Cost Class
Leonia 0.4430 1 $155,000 Minor
Menlo 0.2610 1 $91,000 Local
Oakland 0.0700 1 $20,000 Local
Woodgate 0.3500 3 $123,000 Local
Howell 0.1904 4 $667,000 Major
Tabernacle 0.1290 4 $26,000 Local
Total 1.4434 $1,082,000
PASER Rating 2

Road Name Legth (mi) District Cost Class
Moore 3.400 1 $1,027,000 Major
Jacksonville Loop 0.800 1 $294,000 Minor
SR 6 2.738 1 $958,000 Arterial
Josephine 1.031 1 $361,000 Local
Quinten 0.515 1 $155,000 Minor
Kobie 0.127 1 $38,000 Local
Tweedale 0.102 1 $31,000 Local
Voss 1.506 1 $452,000 Minor
Cheshire 1.080 1 $216,000 Local
Birley 0.720 2 $252,000 Major
Callahan 0.189 3 $66,000 Major
PASER Rating 3
76
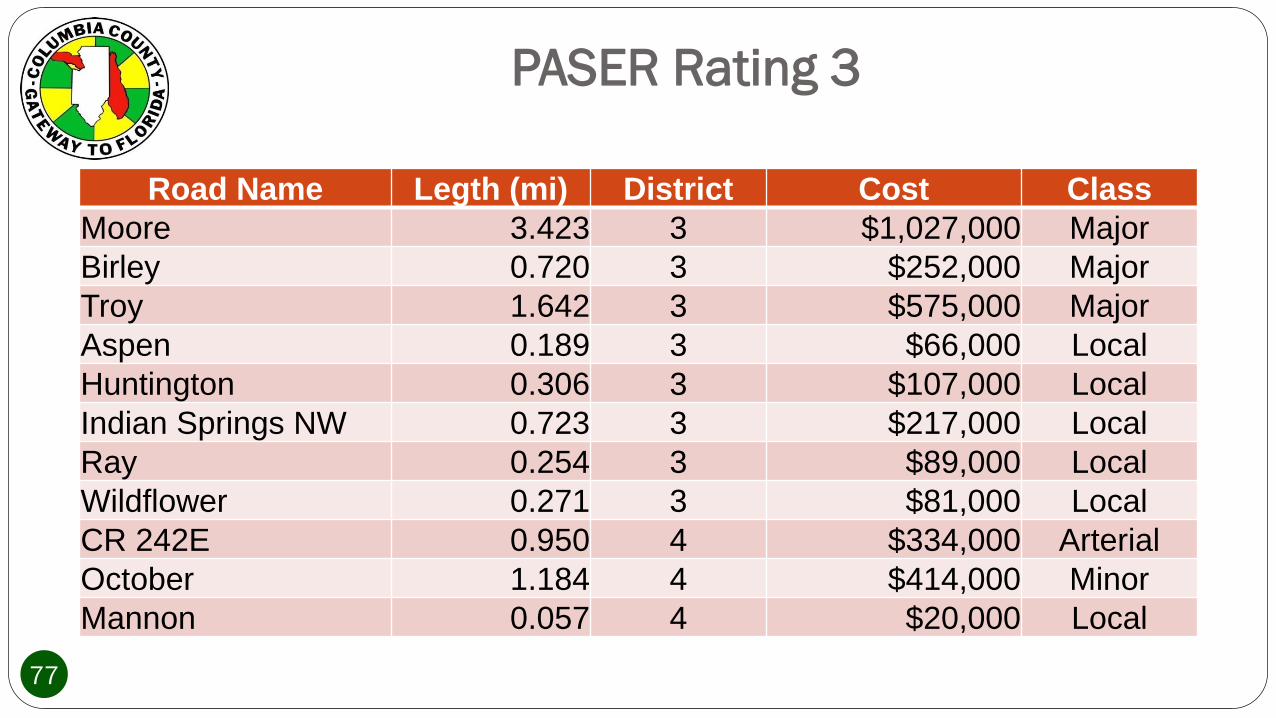
Road Name Legth (mi) District Cost Class
Moore 3.423 3 $1,027,000 Major
Birley 0.720 3 $252,000 Major
Troy 1.642 3 $575,000 Major
Aspen 0.189 3 $66,000 Local
Huntington 0.306 3 $107,000 Local
Indian Springs NW 0.723 3 $217,000 Local
Ray 0.254 3 $89,000 Local
Wildflower 0.271 3 $81,000 Local
CR 242E 0.950 4 $334,000 Arterial
October 1.184 4 $414,000 Minor
Mannon 0.057 4 $20,000 Local
PASER Rating 3
77

Road Name Length (mi) District Cost Class
Adams 1.383 4 $484,000 Local
Olustee 0.508 4 $150,000 Local
Voss 1.506 4 $452,000 Minor
Hillcrest SW 0.596 4 $208,000 Local
CR 131S 1.042 4 $365,000 Arterial
Clubhouse 0.325 4 $65,000 Local
Bedenbaugh 0.707 4 $212,000 Local
Armor 0.107 4 $37,000 Local
Finley Little 1.000 5 $300,000 Minor
Total 29.101 $9,305,000
PASER Rating 3
78
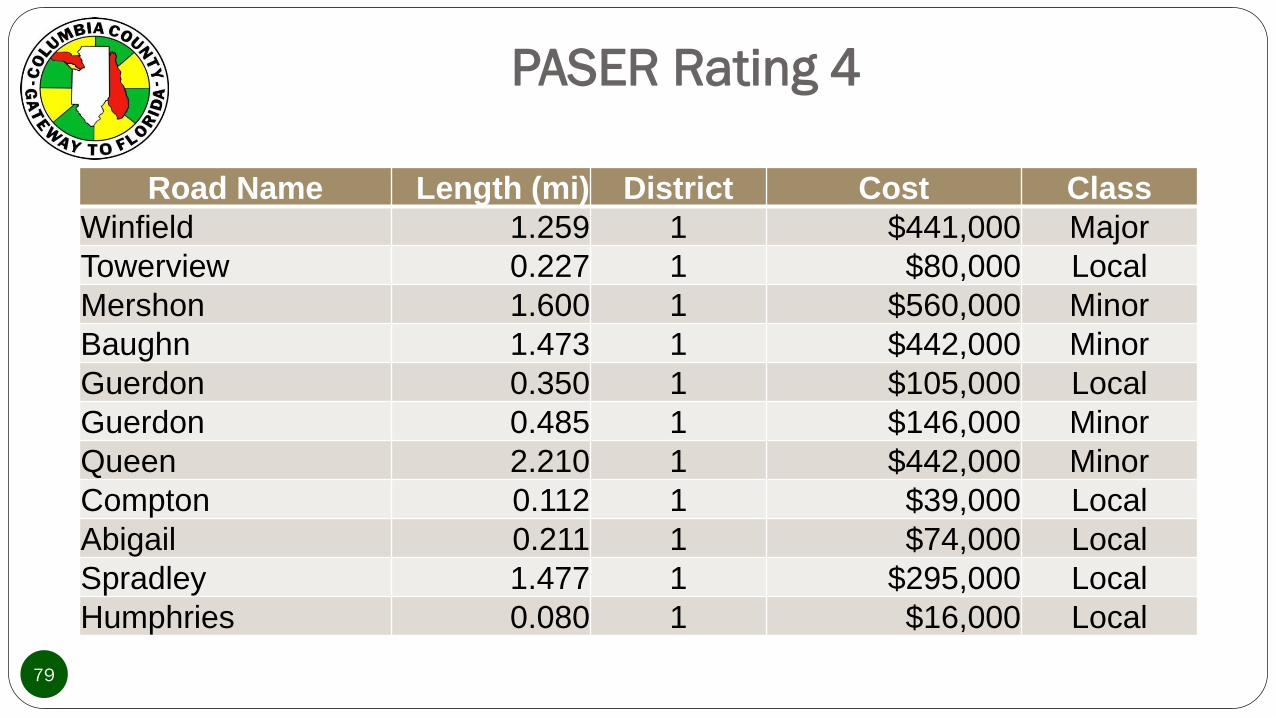
PASER Rating 4
79
Road Name Length (mi) District Cost Class
Winfield 1.259 1 $441,000 Major
Towerview 0.227 1 $80,000 Local
Mershon 1.600 1 $560,000 Minor
Baughn 1.473 1 $442,000 Minor
Guerdon 0.350 1 $105,000 Local
Guerdon 0.485 1 $146,000 Minor
Queen 2.210 1 $442,000 Minor
Compton 0.112 1 $39,000 Local
Abigail 0.211 1 $74,000 Local
Spradley 1.477 1 $295,000 Local
Humphries 0.080 1 $16,000 Local
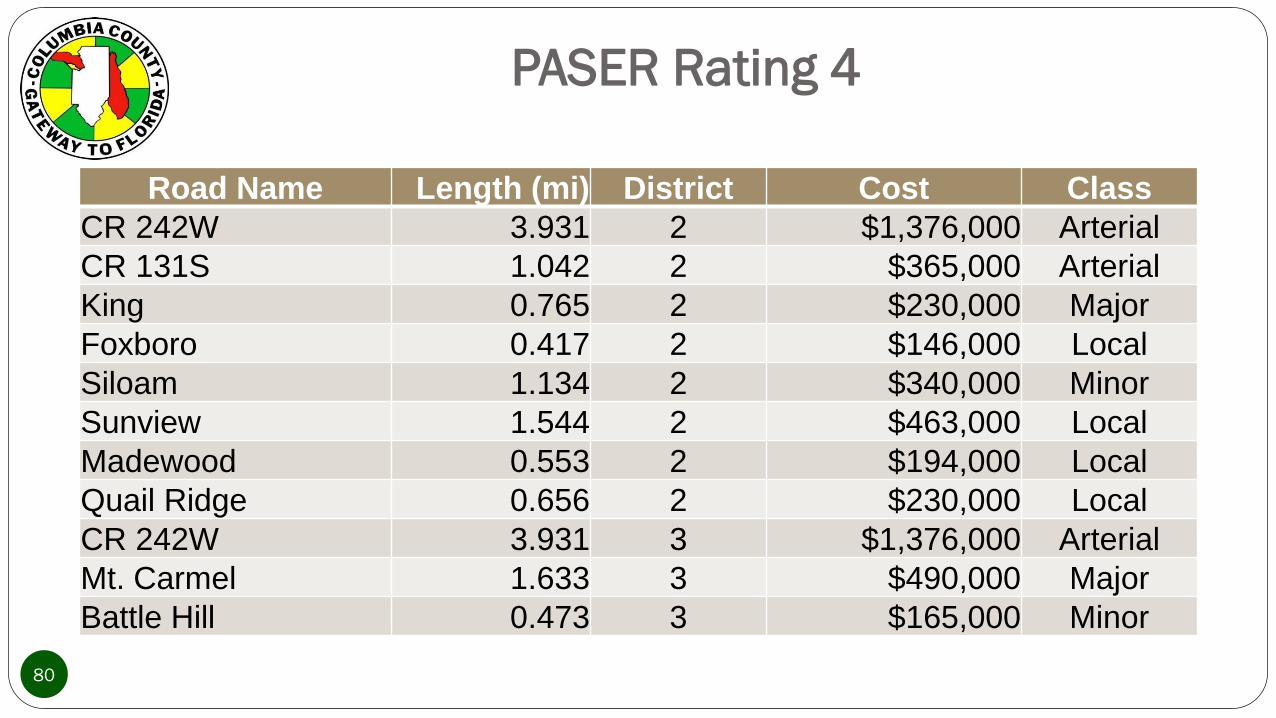
PASER Rating 4
80
Road Name Length (mi) District Cost Class
CR 242W 3.931 2 $1,376,000 Arterial
CR 131S 1.042 2 $365,000 Arterial
King 0.765 2 $230,000 Major
Foxboro 0.417 2 $146,000 Local
Siloam 1.134 2 $340,000 Minor
Sunview 1.544 2 $463,000 Local
Madewood 0.553 2 $194,000 Local
Quail Ridge 0.656 2 $230,000 Local
CR 242W 3.931 3 $1,376,000 Arterial
Mt. Carmel 1.633 3 $490,000 Major
Battle Hill 0.473 3 $165,000 Minor
PASER Rating 4
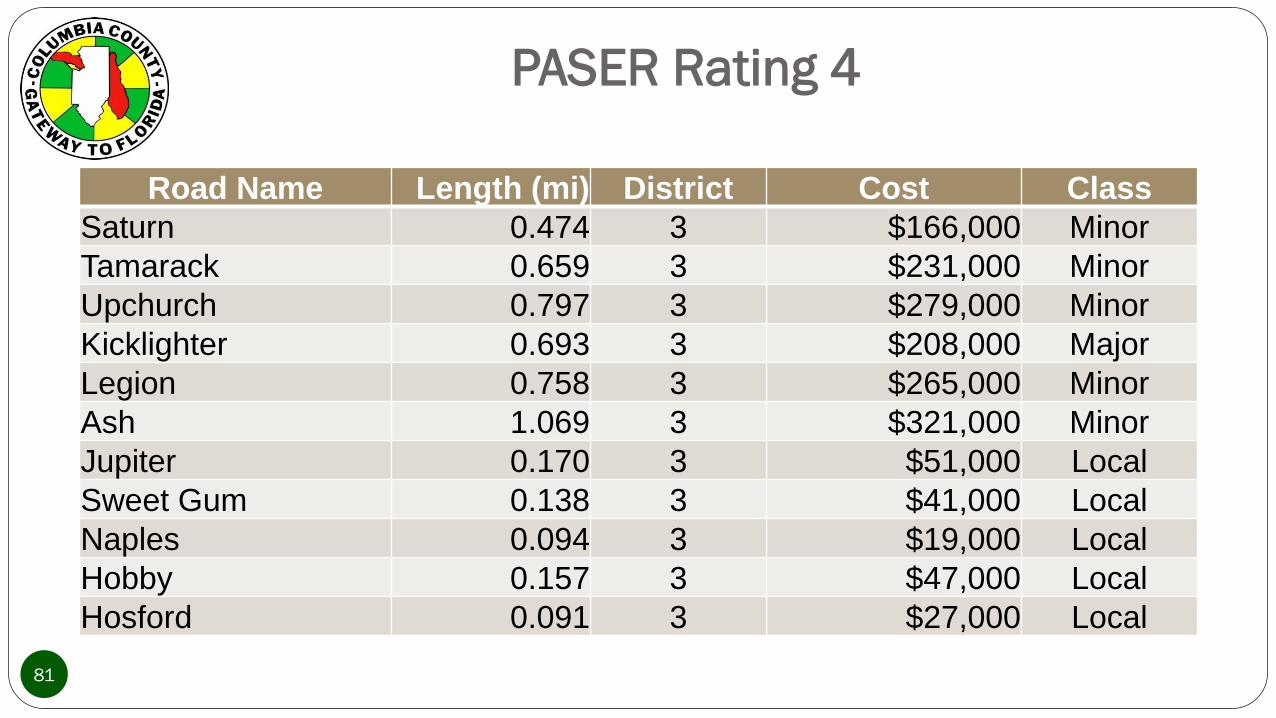
81
Road Name Length (mi) District Cost Class
Saturn 0.474 3 $166,000 Minor
Tamarack 0.659 3 $231,000 Minor
Upchurch 0.797 3 $279,000 Minor
Kicklighter 0.693 3 $208,000 Major
Legion 0.758 3 $265,000 Minor
Ash 1.069 3 $321,000 Minor
Jupiter 0.170 3 $51,000 Local
Sweet Gum 0.138 3 $41,000 Local
Naples 0.094 3 $19,000 Local
Hobby 0.157 3 $47,000 Local
Hosford 0.091 3 $27,000 Local

PASER Rating 4
82
Road Name Length (mi) District Cost Class
Melon 0.167 3 $58,000 Local
Jack 0.206 3 $62,000 Local
Edenfield 0.090 3 $31,000 Local
Hemloch 0.047 3 $9,000 Local
Wilks 0.126 3 $25,000 Local
Marlane 0.140 3 $28,000 Local
Crossbow 0.218 3 44,000 Local
Shady Oak 0.184 3 37,000 Local
Irene 0.445 3 $89,000 Local
Justin 0.188 3 $38,000 Local
Live Oak 0.184 3 $37,000 Local
PASER Rating 4
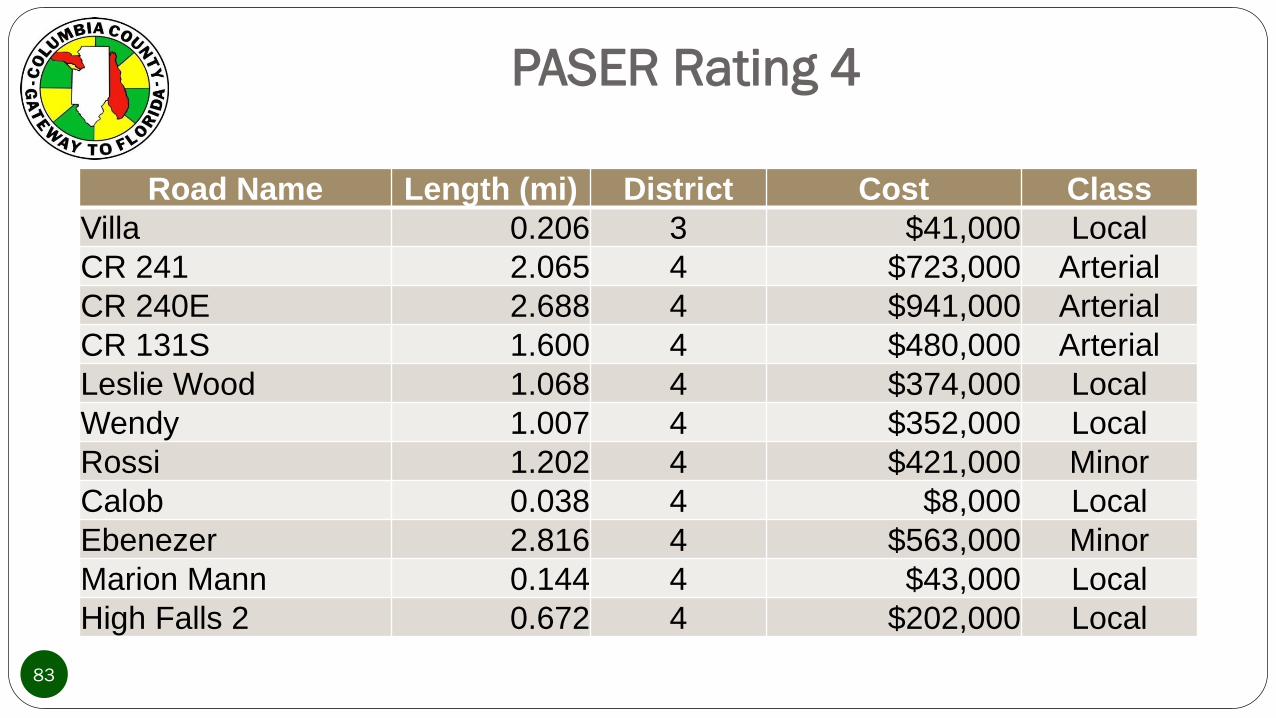
83
Road Name Length (mi) District Cost Class
Villa 0.206 3 $41,000 Local
CR 241 2.065 4 $723,000 Arterial
CR 240E 2.688 4 $941,000 Arterial
CR 131S 1.600 4 $480,000 Arterial
Leslie Wood 1.068 4 $374,000 Local
Wendy 1.007 4 $352,000 Local
Rossi 1.202 4 $421,000 Minor
Calob 0.038 4 $8,000 Local
Ebenezer 2.816 4 $563,000 Minor
Marion Mann 0.144 4 $43,000 Local
High Falls 2 0.672 4 $202,000 Local

PASER Rating 4
84
Road Name Length (mi) District Cost Class
High Falls 1 0.540 4 $108,000 Local
Doretha 0.629 4 $189,000 Local
Hillcrest SE 0.445 4 $134,000 Local
Gabe 1.435 4 $430,000 Local
Britt 0.184 4 $55,000 Local
Rowand 0.053 4 $11,000 Local
April 0.746 4 $149,000 Local
Horace Witt 0.242 4 $48,000 Local
Arlington 0.533 5 $107,000 Major
CR 131S 1.000 5 $480,000 Arterial
Bunn 0.925 5 $324,000 Minor

PASER Rating 4
85
Road Name Length (mi) District Cost Class
High 0.169 5 $51,000 Local
Faith 0.224 5 $67,000 Local
King 0.765 5 $230,000 Major
Wester 1.938 5 $581,000 Minor
Vermont 0.124 5 $25,000 Local
Tina 0.379 5 $114,000 Local
Meadow 0.487 5 $146,000 Local
Benz 0.189 5 $38,000 Local
Bellmont 0.352 5 $106,000 Local
Butzer 0.731 5 $146,000 Local
Briarbrooke 0.237 5 $71,000 Local
PASER Rating 4
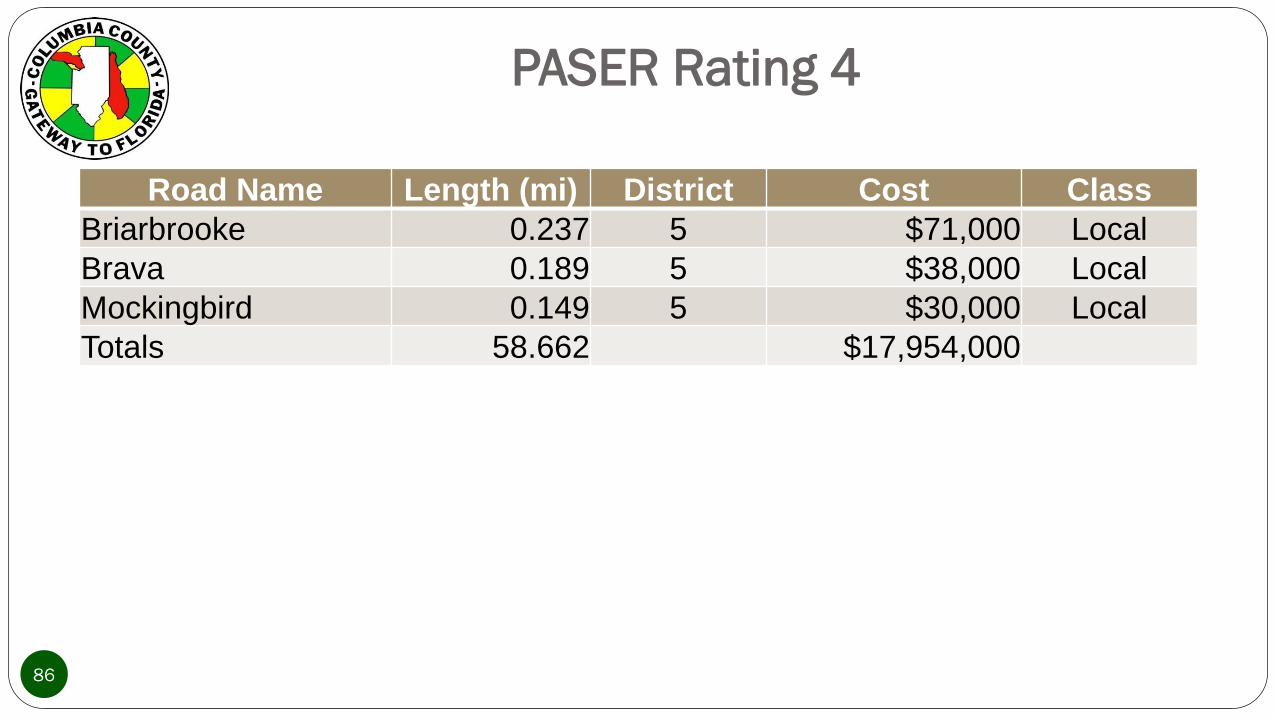
86
Road Name Length (mi) District Cost Class
Briarbrooke 0.237 5 $71,000 Local
Brava 0.189 5 $38,000 Local
Mockingbird 0.149 5 $30,000 Local
Totals 58.662 $17,954,000
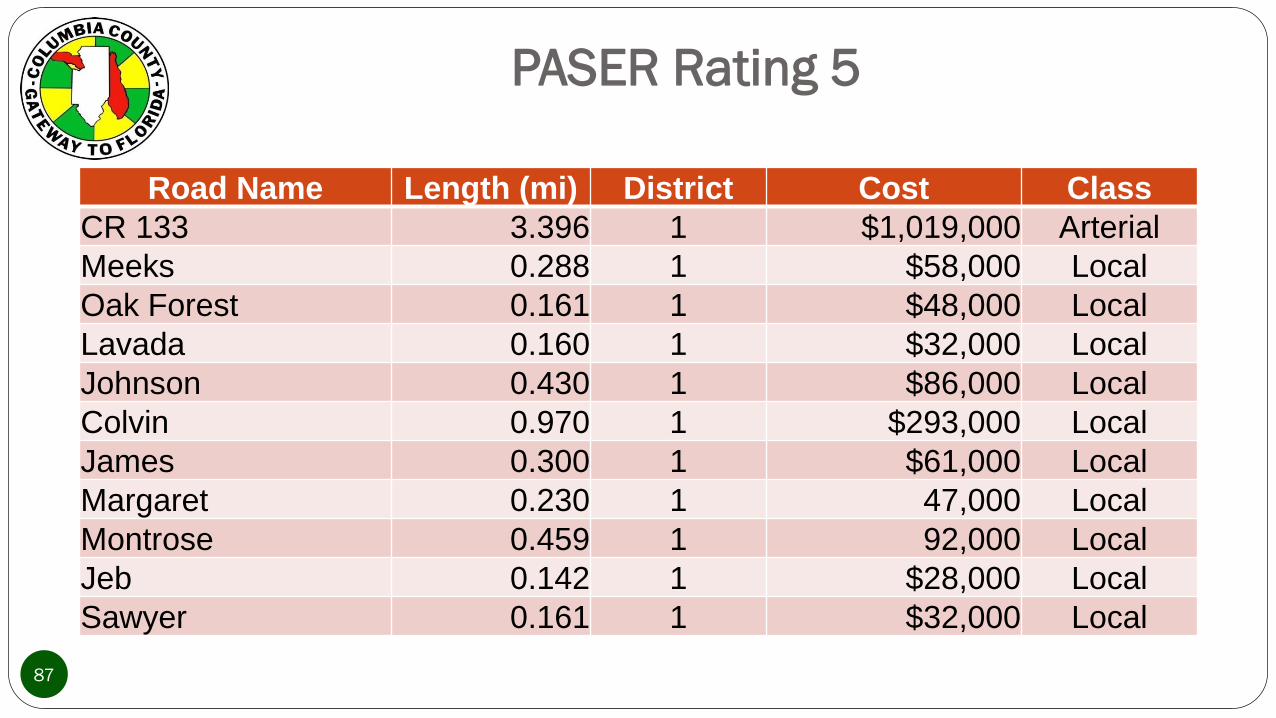
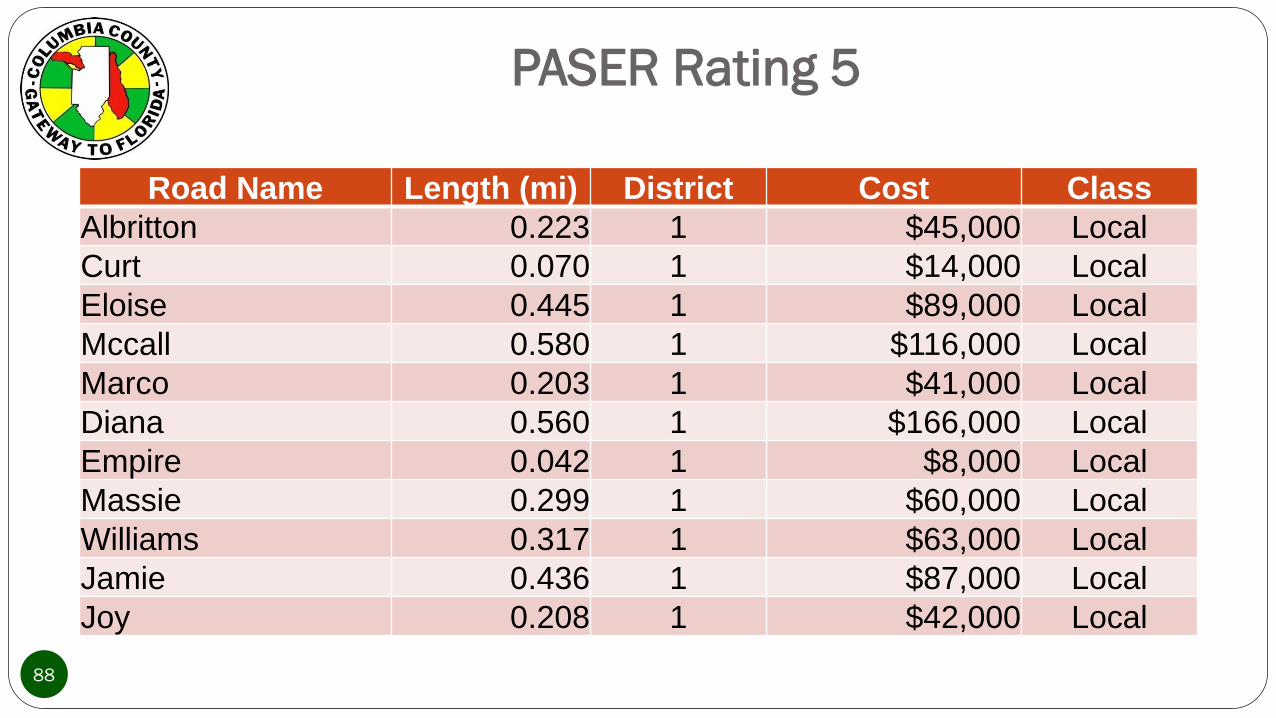
PASER Rating 5
87
Road Name Length (mi) District Cost Class
CR 133 3.396 1 $1,019,000 Arterial
Meeks 0.288 1 $58,000 Local
Oak Forest 0.161 1 $48,000 Local
Lavada 0.160 1 $32,000 Local
Johnson 0.430 1 $86,000 Local
Colvin 0.970 1 $293,000 Local
James 0.300 1 $61,000 Local
Margaret 0.230 1 47,000 Local
Montrose 0.459 1 92,000 Local
Jeb 0.142 1 $28,000 Local
Sawyer 0.161 1 $32,000 Local
PASER Rating 5
88
Road Name Length (mi) District Cost Class
Albritton 0.223 1 $45,000 Local
Curt 0.070 1 $14,000 Local
Eloise 0.445 1 $89,000 Local
Mccall 0.580 1 $116,000 Local
Marco 0.203 1 $41,000 Local
Diana 0.560 1 $166,000 Local
Empire 0.042 1 $8,000 Local
Massie 0.299 1 $60,000 Local
Williams 0.317 1 $63,000 Local
Jamie 0.436 1 $87,000 Local
Joy 0.208 1 $42,000 Local

PASER Rating 5
89
Road Name Length (mi) District Cost Class
Clara 0.258 1 $52,000 Local
Desi 0.102 1 $20,000 Local
Parnell 1.492 1 $298,000 Minor
Corinth 0.233 1 $70,000 Local
Trunk 0.052 1 $10,000 Local
Stephen Foster 0.616 1 $123,000 Local
Austin 0.154 1 $31,000 Local
Cansa 0.677 1 $135,000 Local
Morrell 1.136 1 $227,000 Local
Nye Hunter 0.422 1 $42,000 Local
Oakland 0.157 1 $31,000 Local
PASER Rating 5
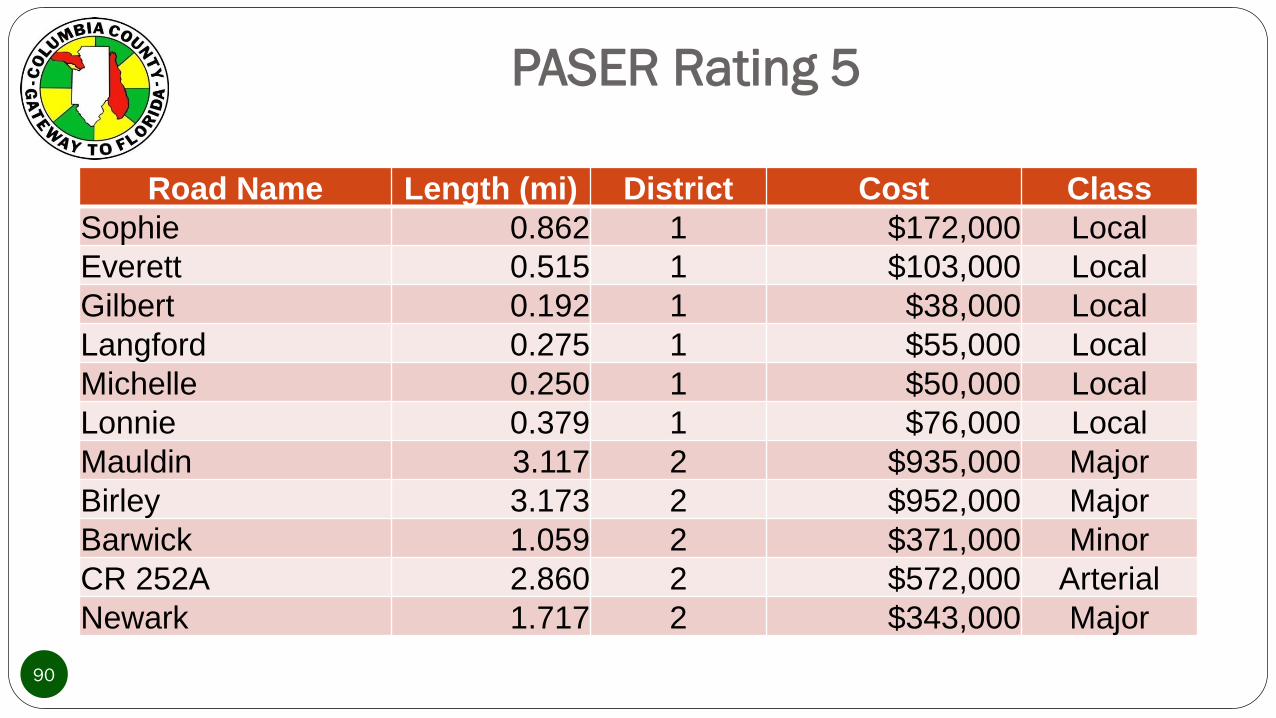
90
Road Name Length (mi) District Cost Class
Sophie 0.862 1 $172,000 Local
Everett 0.515 1 $103,000 Local
Gilbert 0.192 1 $38,000 Local
Langford 0.275 1 $55,000 Local
Michelle 0.250 1 $50,000 Local
Lonnie 0.379 1 $76,000 Local
Mauldin 3.117 2 $935,000 Major
Birley 3.173 2 $952,000 Major
Barwick 1.059 2 $371,000 Minor
CR 252A 2.860 2 $572,000 Arterial
Newark 1.717 2 $343,000 Major
PASER Rating 5
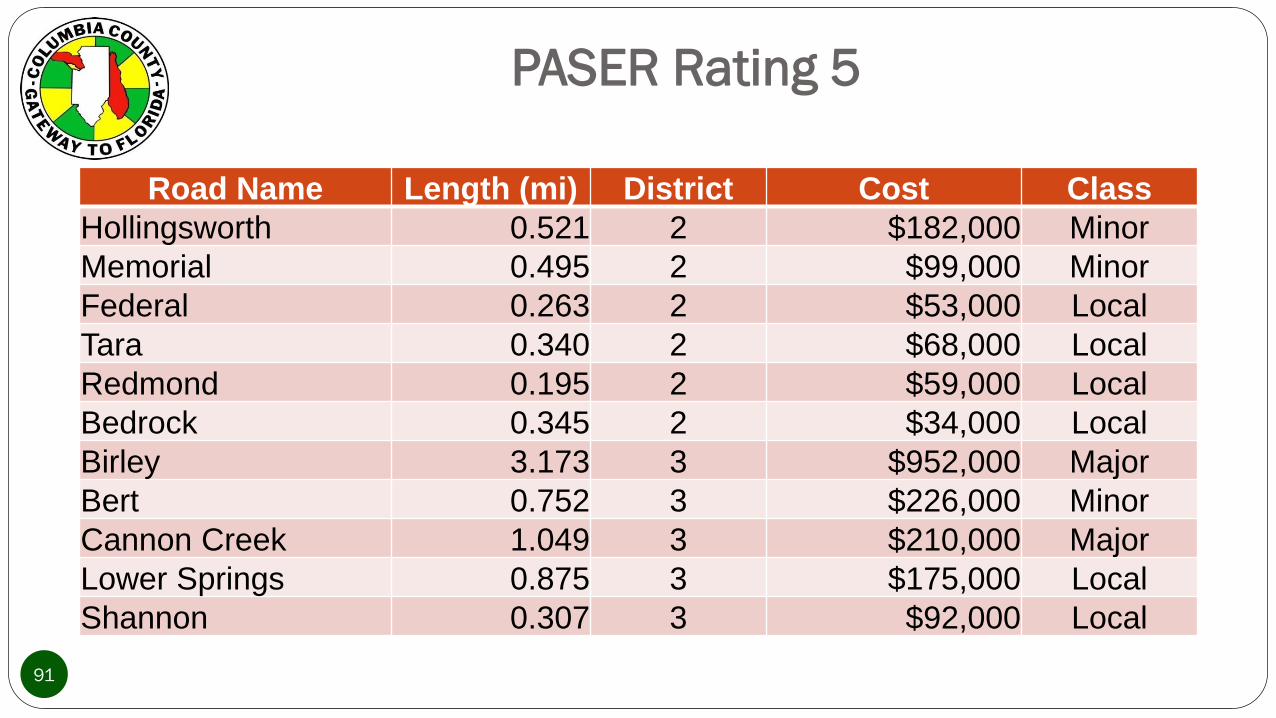
91
Road Name Length (mi) District Cost Class
Hollingsworth 0.521 2 $182,000 Minor
Memorial 0.495 2 $99,000 Minor
Federal 0.263 2 $53,000 Local
Tara 0.340 2 $68,000 Local
Redmond 0.195 2 $59,000 Local
Bedrock 0.345 2 $34,000 Local
Birley 3.173 3 $952,000 Major
Bert 0.752 3 $226,000 Minor
Cannon Creek 1.049 3 $210,000 Major
Lower Springs 0.875 3 $175,000 Local
Shannon 0.307 3 $92,000 Local
PASER Rating 5
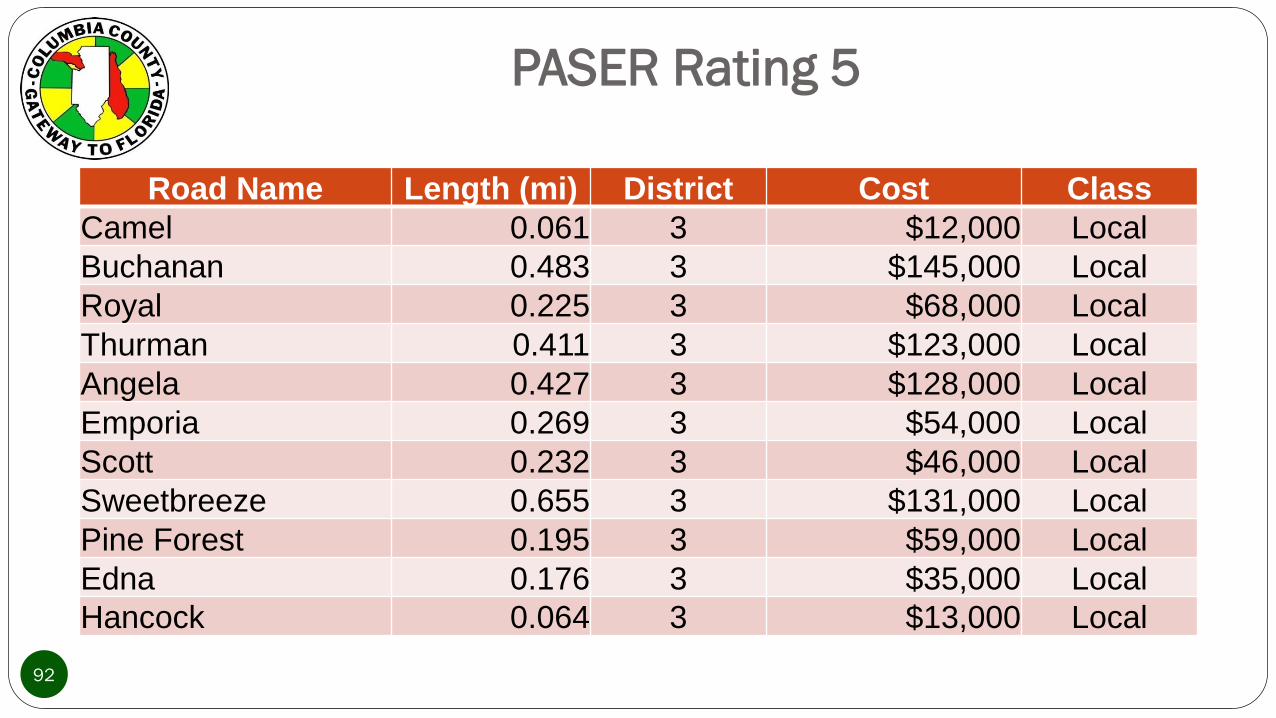
92
Road Name Length (mi) District Cost Class
Camel 0.061 3 $12,000 Local
Buchanan 0.483 3 $145,000 Local
Royal 0.225 3 $68,000 Local
Thurman 0.411 3 $123,000 Local
Angela 0.427 3 $128,000 Local
Emporia 0.269 3 $54,000 Local
Scott 0.232 3 $46,000 Local
Sweetbreeze 0.655 3 $131,000 Local
Pine Forest 0.195 3 $59,000 Local
Edna 0.176 3 $35,000 Local
Hancock 0.064 3 $13,000 Local

PASER Rating 5
93
Road Name Length (mi) District Cost Class
Dunn 0.184 3 $37,000 Local
Fabian 0.184 3 $37,000 Local
Prestige 0.184 3 $37,000 Local
Dalmation 0.203 3 $71,000 Local
Loblolly 0.263 3 $53,000 Local
Shady 0.438 3 $88,000 Local
Riddle 0.426 3 $85,000 Local
Kenmore 0.239 3 $48,000 Local
Carol 0.173 3 $35,000 Local
Stanley 0.180 3 $36,000 Local
Vernon 0.170 3 $34,000 Local

PASER Rating 5
94
Road Name Length (mi) District Cost Class
Blackpine 0.326 3 $65,000 Local
Daytona 0.097 3 $19,000 Local
Gremlin 0.161 3 $32,000 Local
Vista 0.280 3 $56,000 Local
Carr 0.572 3 $114,000 Local
Ridgeview 0.393 3 $79,000 Local
Green Acres 0.314 3 $63,000 Local
Fulton 0.180 3 $36,000 Local
Lapaz 0.289 3 $58,000 Local
Lynwood 0.453 3 $45,000 Local
CR 18E 4.553 4 $1,366, Arterial

PASER Rating 5
95
Road Name Length (mi) District Cost Class
CR 133C 1.844 4 $369,000 Arterial
CR 133 3.396 4 $1,019,000 Arterial
Llewellyn 0.256 4 $51,000 Local
CR 133 0.752 4 $150,000 Arterial
Golf Club 0.321 4 $64,000 Local
Oakmont 0.235 4 $47,000 Local
Haven 0.106 4 $32,000 Local
Suzanne 0.197 4 $59,000 Local
Tom Bullock 0.182 4 $55,000 Local
Carob 0.133 4 $27,000 Local
Wilderness 0.157 4 $31,000 Local

PASER Rating 5
96
Road Name Length (mi) District Cost Class
Kiwi 0.192 4 $38,000 Local
Dekle 0.095 4 $19,000 Local
Oak Hill 0.221 4 $42,000 Local
Butler 0.066 4 $23,000 Local
Stanford 0.184 4 $55,000 Local
Williams 0.214 4 $43,000 Local
Stiles 0.603 4 $121,000 Local
Mayhall 0.717 4 $215,000 Local
Smart 0.340 4 $102,000 Local
Brandon 0.558 4 $56,000 Local
Feagle 0.988 4 $198,000 Local
PASER Rating 5
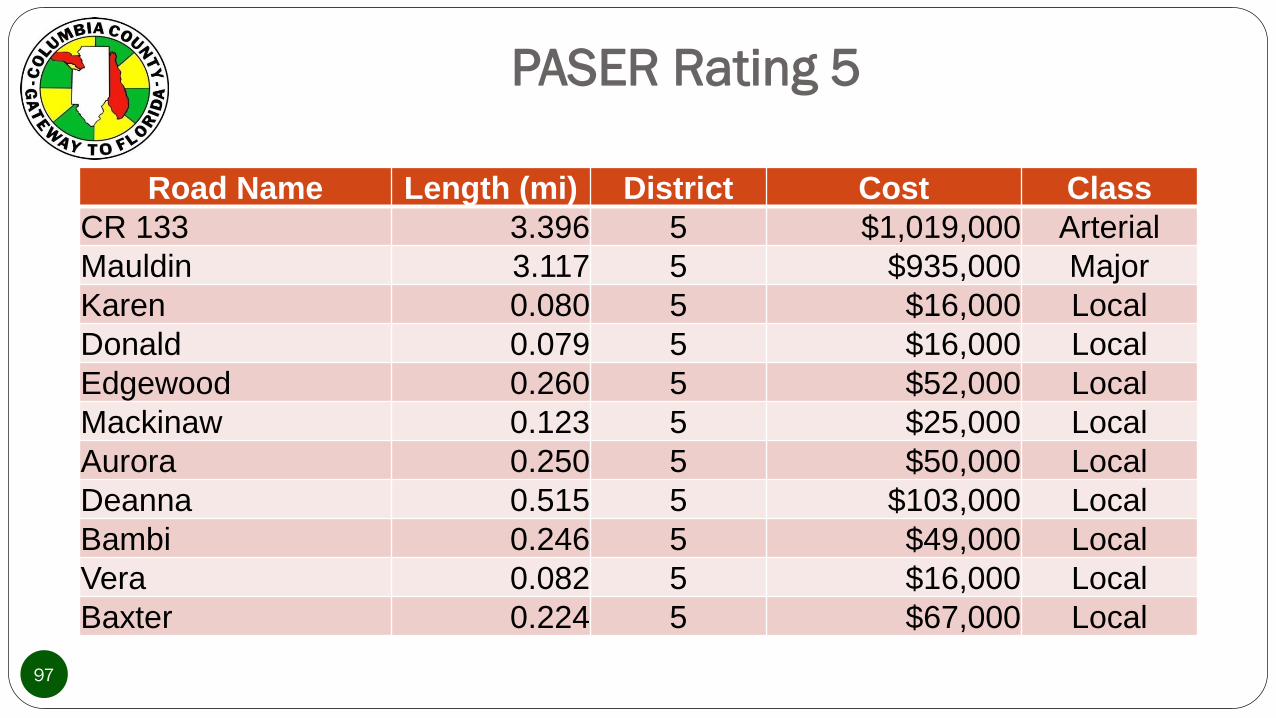
97
Road Name Length (mi) District Cost Class
CR 133 3.396 5 $1,019,000 Arterial
Mauldin 3.117 5 $935,000 Major
Karen 0.080 5 $16,000 Local
Donald 0.079 5 $16,000 Local
Edgewood 0.260 5 $52,000 Local
Mackinaw 0.123 5 $25,000 Local
Aurora 0.250 5 $50,000 Local
Deanna 0.515 5 $103,000 Local
Bambi 0.246 5 $49,000 Local
Vera 0.082 5 $16,000 Local
Baxter 0.224 5 $67,000 Local

PASER Rating 5
98
Road Name Length (mi) District Cost Class
Bream 0.254 5 $51,000 Local
Ace 0.393 5 $79,000 Local
Cromwell 0.076 5 $15,000 Local
Tempy 0.076 5 $8,000 Local
Michael 0.257 5 $51,000 Local
Milkweed 0.061 5 $12,000 Local
Southwood 0.097 5 $19,000 Local
Brookwood 0.485 5 $97,000 Local
Ring 0.409 5 $123,000 Local
Pebble Creek 0.258 5 $52,000 Local
Arvid 0.081 5 $16,000 Local
PASER Rating 5
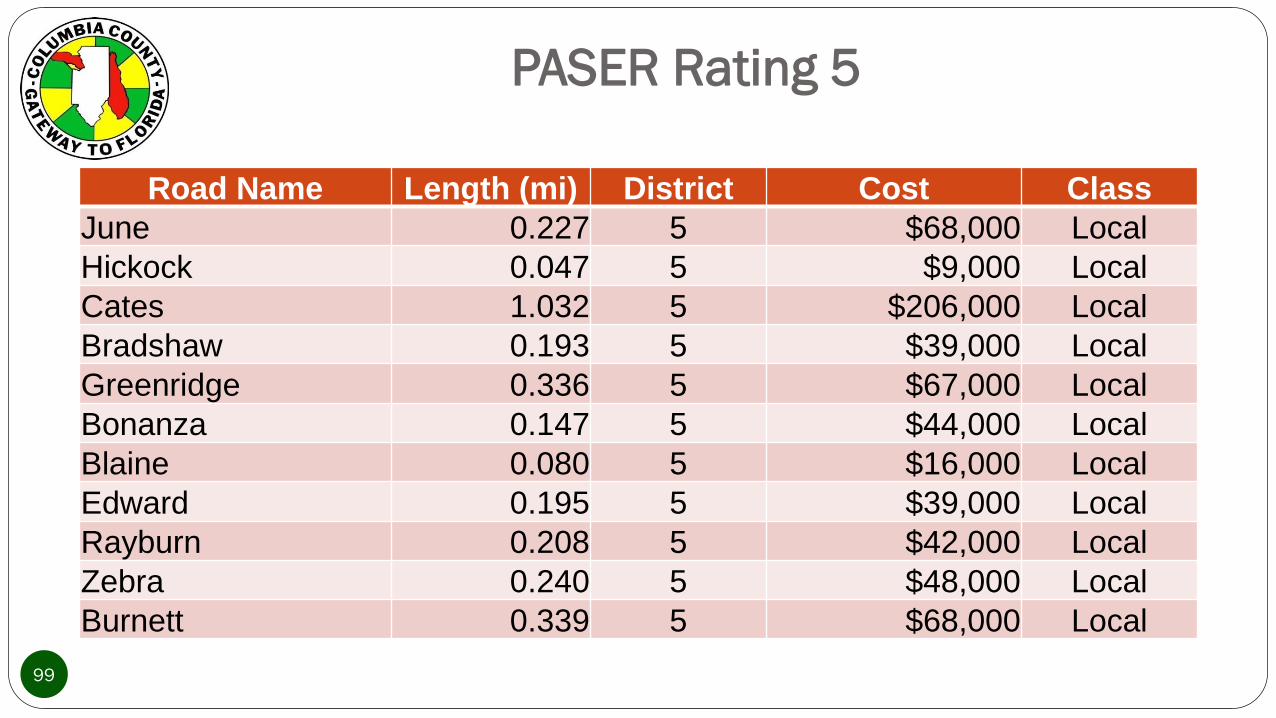
99
Road Name Length (mi) District Cost Class
June 0.227 5 $68,000 Local
Hickock 0.047 5 $9,000 Local
Cates 1.032 5 $206,000 Local
Bradshaw 0.193 5 $39,000 Local
Greenridge 0.336 5 $67,000 Local
Bonanza 0.147 5 $44,000 Local
Blaine 0.080 5 $16,000 Local
Edward 0.195 5 $39,000 Local
Rayburn 0.208 5 $42,000 Local
Zebra 0.240 5 $48,000 Local
Burnett 0.339 5 $68,000 Local
PASER Rating 5
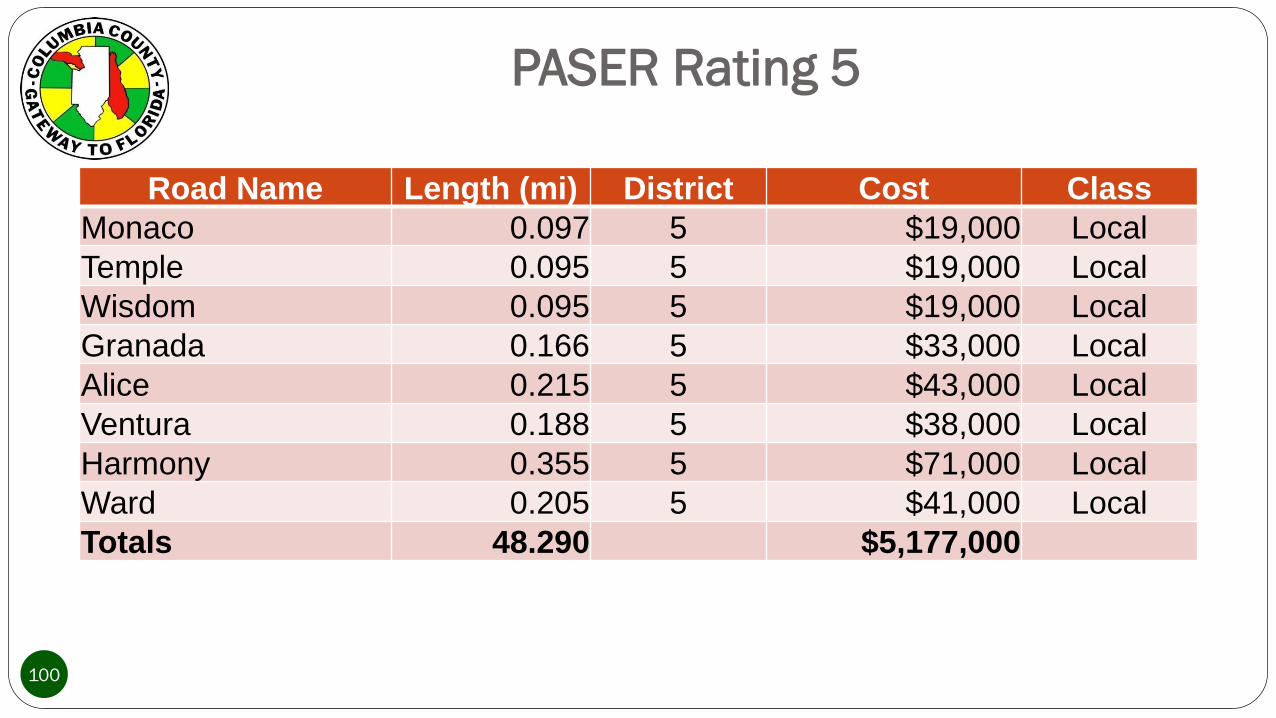
100
Road Name Length (mi) District Cost Class
Monaco 0.097 5 $19,000 Local
Temple 0.095 5 $19,000 Local
Wisdom 0.095 5 $19,000 Local
Granada 0.166 5 $33,000 Local
Alice 0.215 5 $43,000 Local
Ventura 0.188 5 $38,000 Local
Harmony 0.355 5 $71,000 Local
Ward 0.205 5 $41,000 Local
Totals 48.290 $5,177,000

FDOT Funding Programs
SCRAP – Small County Road Assistance Program
100% Funding
SCOP – Small County Outreach Program
75% Funding
CIGP – County Incentive Grant Program
50% Funding
TAP – Transportation Alternative Program
101
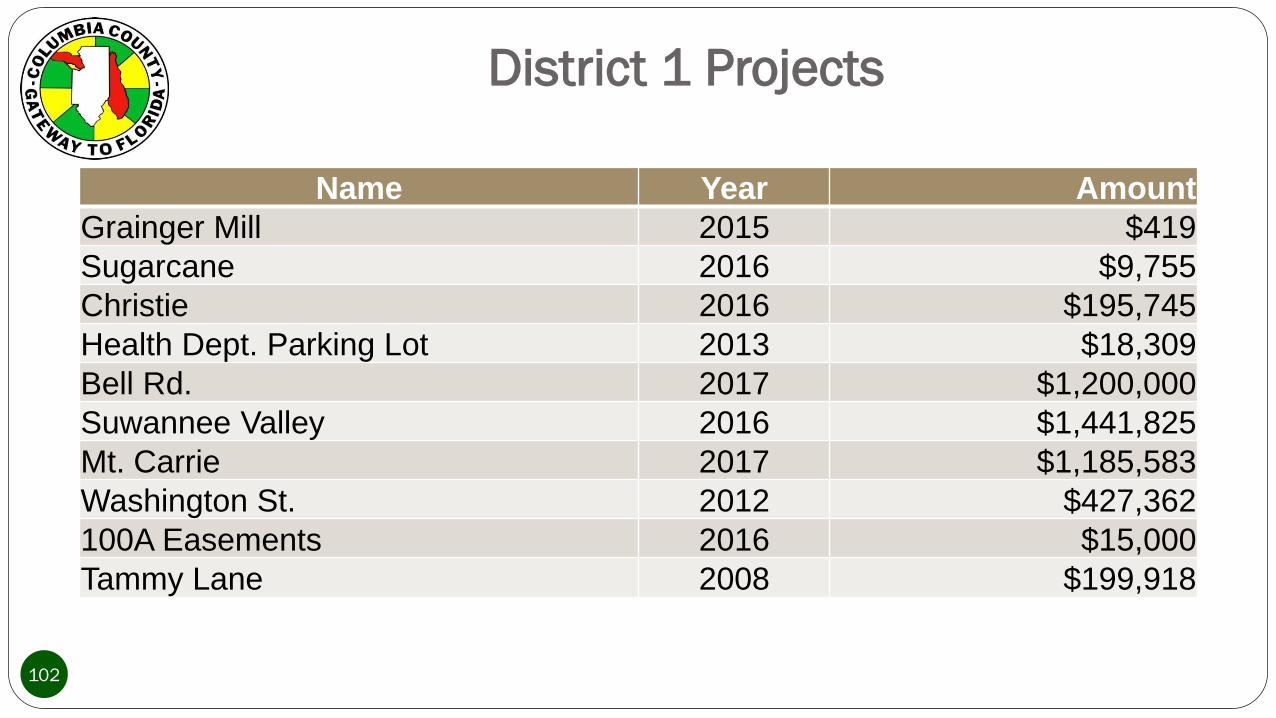
District 1 Projects
102
Name Year Amount
Grainger Mill 2015 $419
Sugarcane 2016 $9,755
Christie 2016 $195,745
Health Dept. Parking Lot 2013 $18,309
Bell Rd. 2017 $1,200,000
Suwannee Valley 2016 $1,441,825
Mt. Carrie 2017 $1,185,583
Washington St. 2012 $427,362
100A Easements 2016 $15,000
Tammy Lane 2008 $199,918
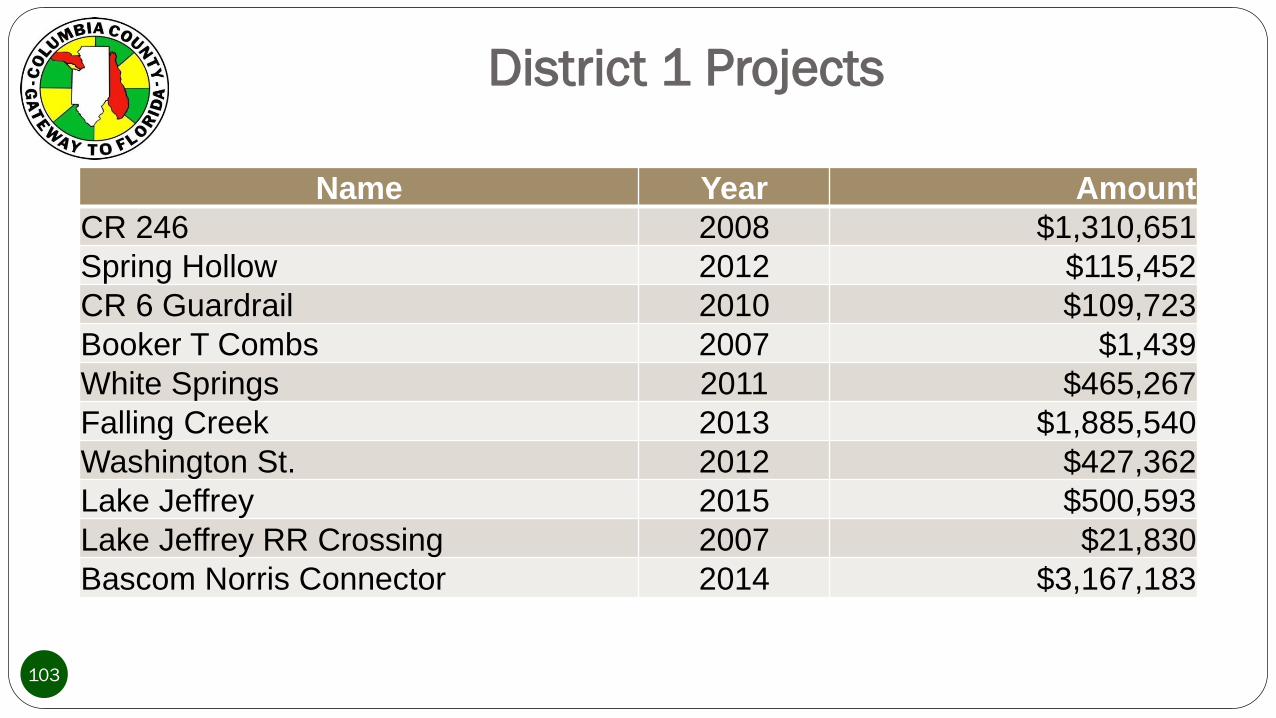
District 1 Projects
103
Name Year Amount
CR 246 2008 $1,310,651
Spring Hollow 2012 $115,452
CR 6 Guardrail 2010 $109,723
Booker T Combs 2007 $1,439
White Springs 2011 $465,267
Falling Creek 2013 $1,885,540
Washington St. 2012 $427,362
Lake Jeffrey 2015 $500,593
Lake Jeffrey RR Crossing 2007 $21,830
Bascom Norris Connector 2014 $3,167,183
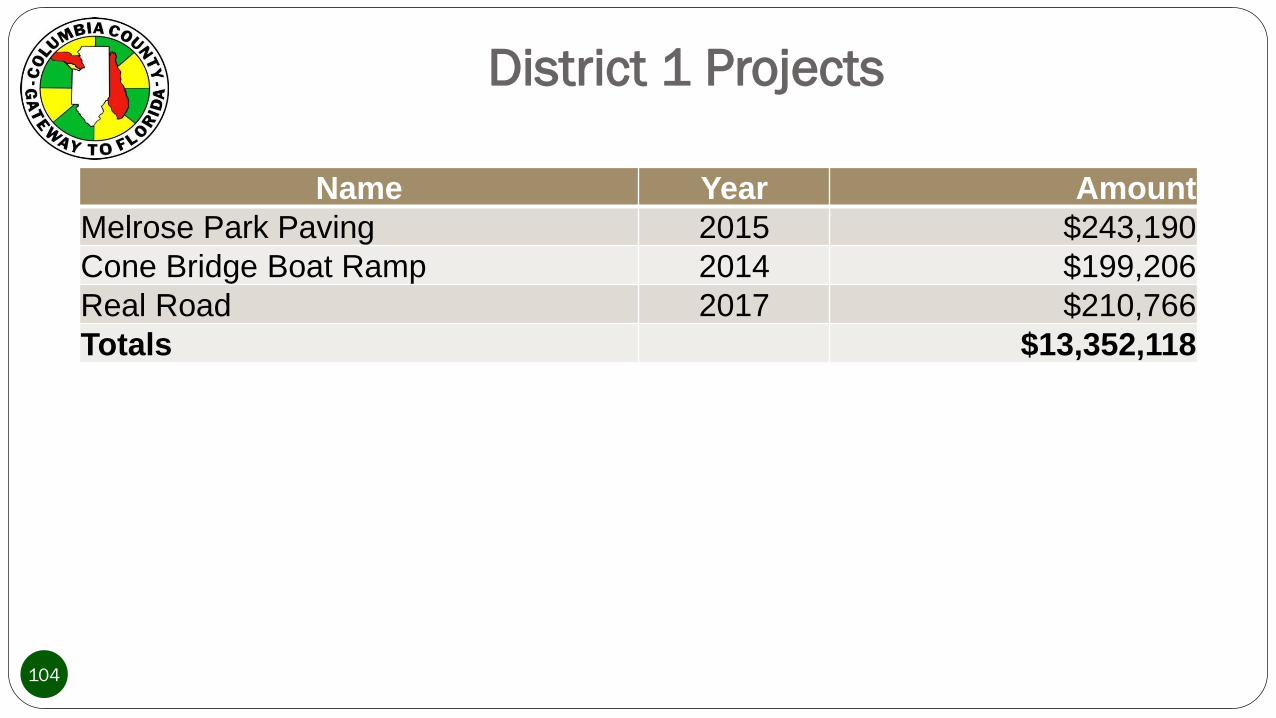
District 1 Projects
104
Name Year Amount
Melrose Park Paving 2015 $243,190
Cone Bridge Boat Ramp 2014 $199,206
Real Road 2017 $210,766
Totals $13,352,118
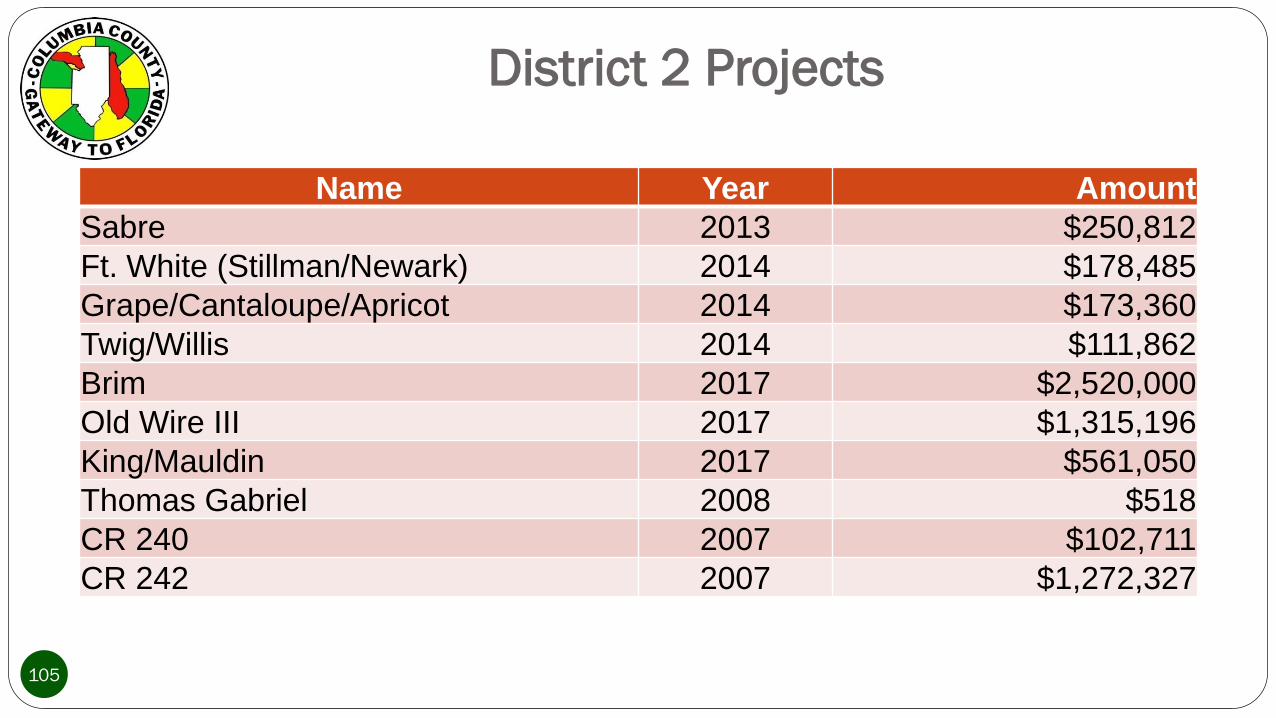
District 2 Projects
105
Name Year Amount
Sabre 2013 $250,812
Ft. White (Stillman/Newark) 2014 $178,485
Grape/Cantaloupe/Apricot 2014 $173,360
Twig/Willis 2014 $111,862
Brim 2017 $2,520,000
Old Wire III 2017 $1,315,196
King/Mauldin 2017 $561,050
Thomas Gabriel 2008 $518
CR 240 2007 $102,711
CR 242 2007 $1,272,327
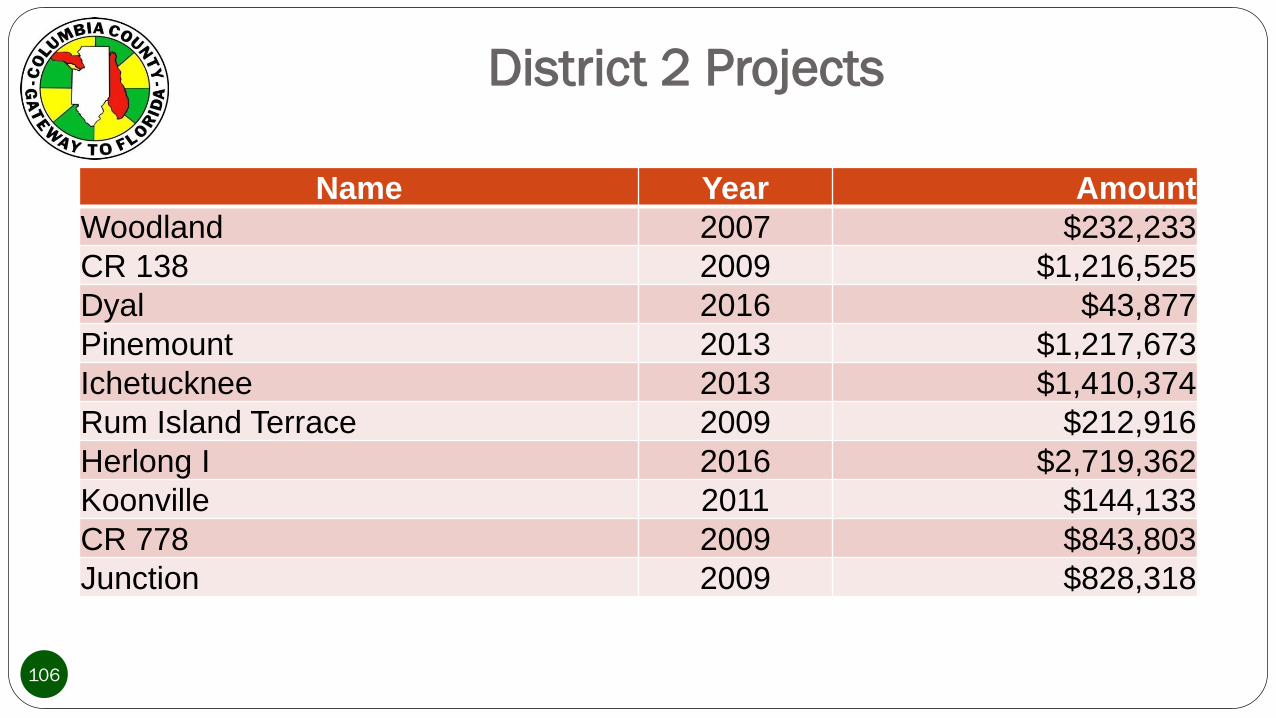
District 2 Projects
106
Name Year Amount
Woodland 2007 $232,233
CR 138 2009 $1,216,525
Dyal 2016 $43,877
Pinemount 2013 $1,217,673
Ichetucknee 2013 $1,410,374
Rum Island Terrace 2009 $212,916
Herlong I 2016 $2,719,362
Koonville 2011 $144,133
CR 778 2009 $843,803
Junction 2009 $828,318
District 2 Projects
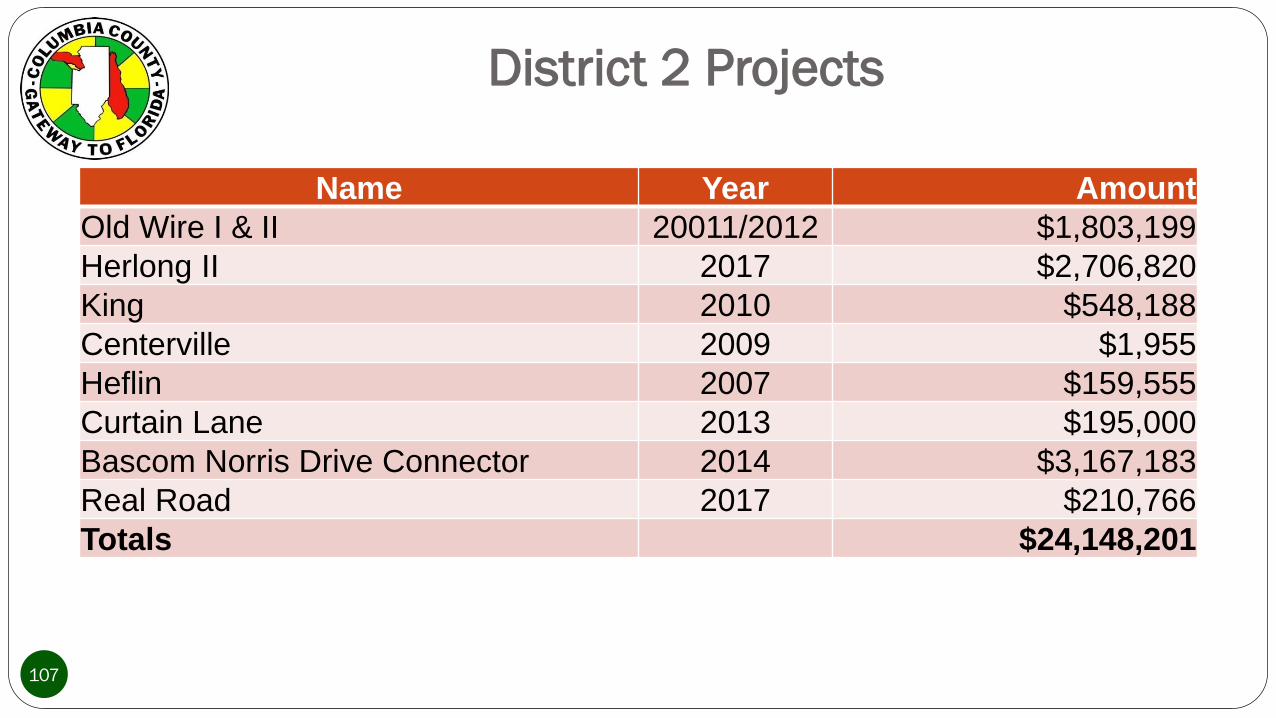
107
Name Year Amount
Old Wire I & II 20011/2012 $1,803,199
Herlong II 2017 $2,706,820
King 2010 $548,188
Centerville 2009 $1,955
Heflin 2007 $159,555
Curtain Lane 2013 $195,000
Bascom Norris Drive Connector 2014 $3,167,183
Real Road 2017 $210,766
Totals $24,148,201
District 3 Projects
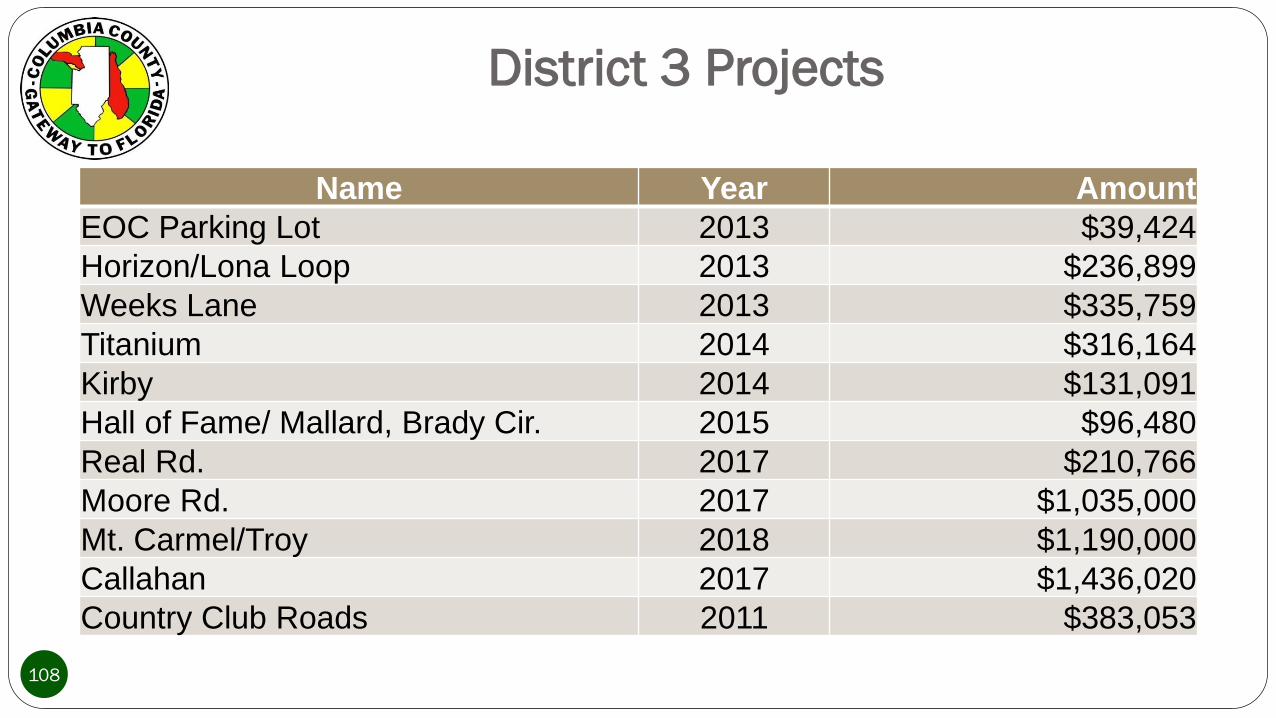
108
Name Year Amount
EOC Parking Lot 2013 $39,424
Horizon/Lona Loop 2013 $236,899
Weeks Lane 2013 $335,759
Titanium 2014 $316,164
Kirby 2014 $131,091
Hall of Fame/ Mallard, Brady Cir. 2015 $96,480
Real Rd. 2017 $210,766
Moore Rd. 2017 $1,035,000
Mt. Carmel/Troy 2018 $1,190,000
Callahan 2017 $1,436,020
Country Club Roads 2011 $383,053

District 3 Projects
109
Name Year Amount
Sisters Welcome 2016 $593,088
Kirby Rd. Drainage 2008 $870
Turner Rd. 2009 $770,070
Brown Rd 2008 $779,744
Pinemount 2013 $166,046
Nash 2010 $916,172
Emerald Forest 2009 $43,823
Emerald Lakes 2009 $181,309
Woodborough 2010 $124,907
Noegel CR 135 2009 $566,201
CR 250 Lake Jeffrey 2015 $1,883,182

District 3 Projects
110
Name Year Amount
District 3 Resurfacing 2013 $736,505
Health Dept. Parking Lot 2013 $18,309
Hope Henry 2013 $127,738
Lake City Ave. 2013 $237,813
Bacom Norris Drive Connector 2014 $3,167,183
Totals $15,723,616
District 4 Projects
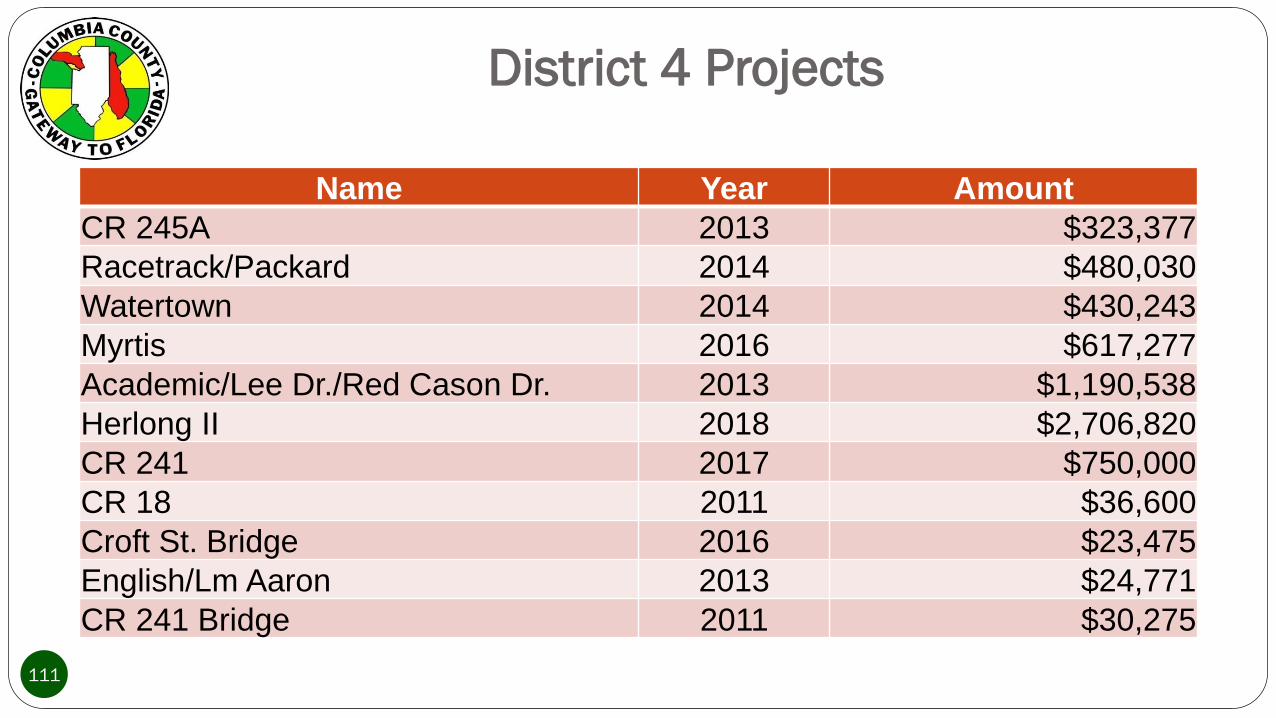
111
Name Year Amount
CR 245A 2013 $323,377
Racetrack/Packard 2014 $480,030
Watertown 2014 $430,243
Myrtis 2016 $617,277
Academic/Lee Dr./Red Cason Dr. 2013 $1,190,538
Herlong II 2018 $2,706,820
CR 241 2017 $750,000
CR 18 2011 $36,600
Croft St. Bridge 2016 $23,475
English/Lm Aaron 2013 $24,771
CR 241 Bridge 2011 $30,275
District 4 Projects
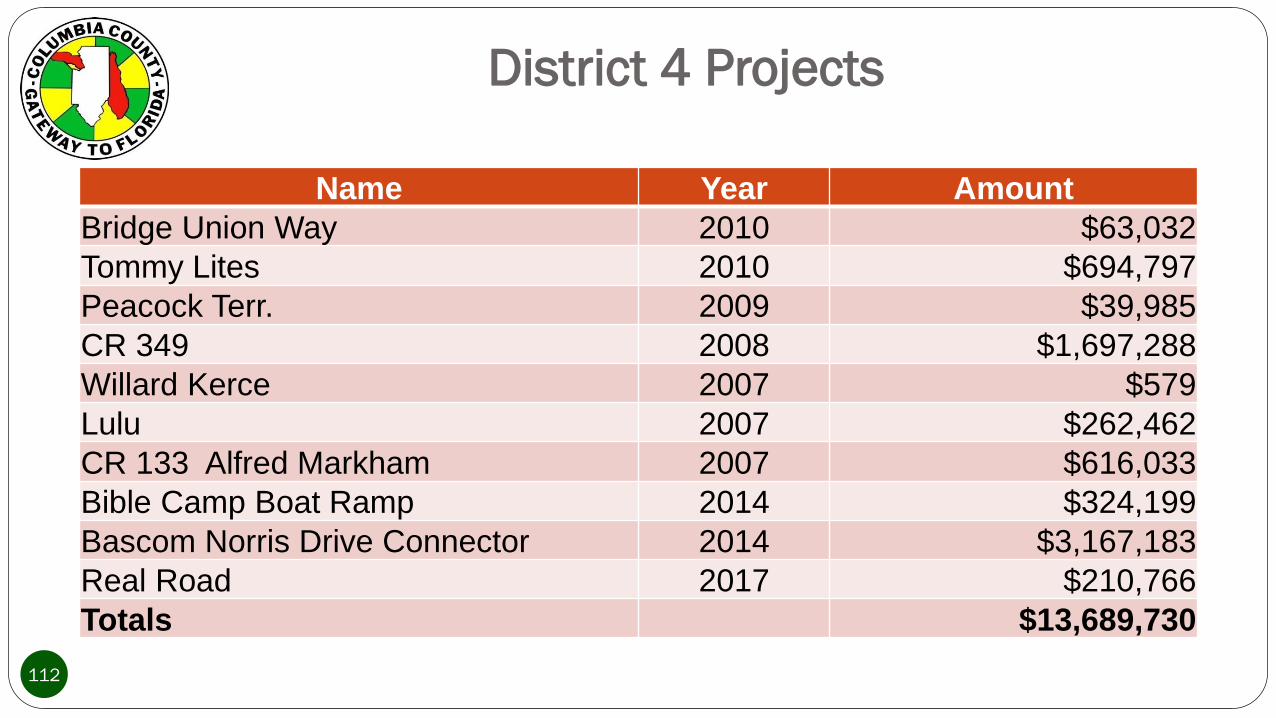
112
Name Year Amount
Bridge Union Way 2010 $63,032
Tommy Lites 2010 $694,797
Peacock Terr. 2009 $39,985
CR 349 2008 $1,697,288
Willard Kerce 2007 $579
Lulu 2007 $262,462
CR 133 Alfred Markham 2007 $616,033
Bible Camp Boat Ramp 2014 $324,199
Bascom Norris Drive Connector 2014 $3,167,183
Real Road 2017 $210,766
Totals $13,689,730
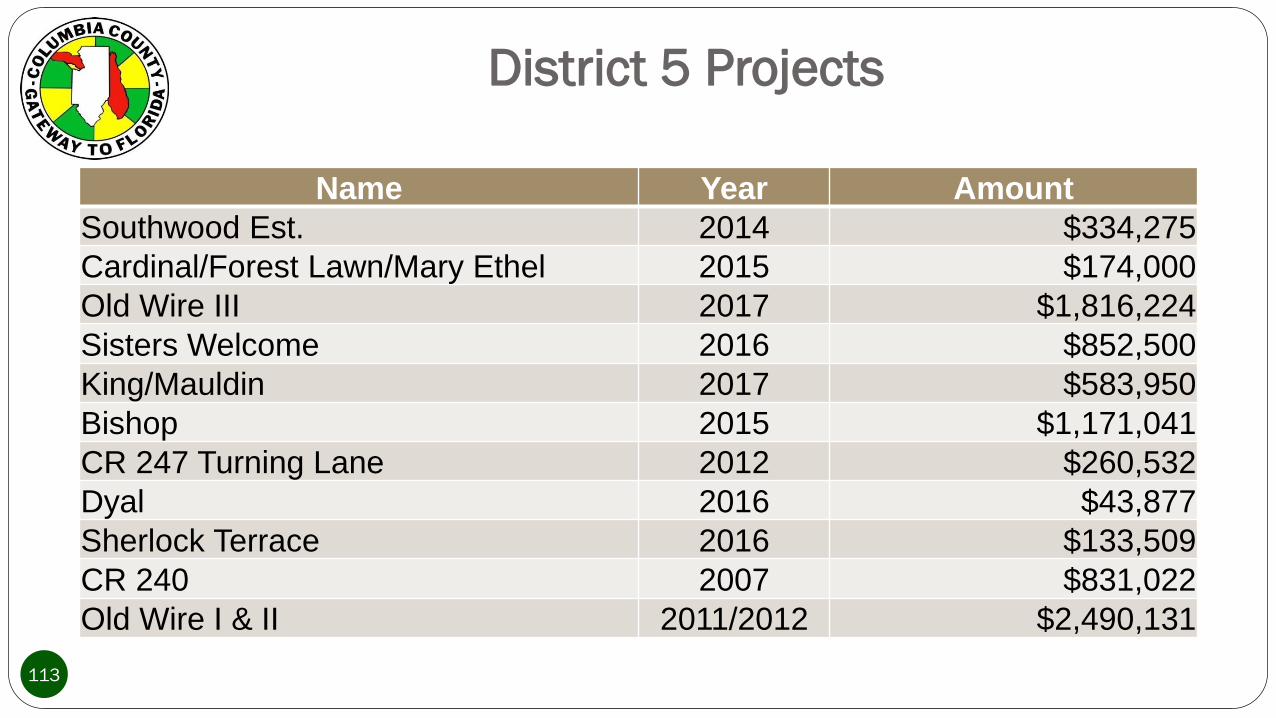
District 5 Projects
113
Name Year Amount
Southwood Est. 2014 $334,275
Cardinal/Forest Lawn/Mary Ethel 2015 $174,000
Old Wire III 2017 $1,816,224
Sisters Welcome 2016 $852,500
King/Mauldin 2017 $583,950
Bishop 2015 $1,171,041
CR 247 Turning Lane 2012 $260,532
Dyal 2016 $43,877
Sherlock Terrace 2016 $133,509
CR 240 2007 $831,022
Old Wire I & II 2011/2012 $2,490,131

District 5 Projects
114
Name Year Amount
Walter 2009 $352,020
LC Middle School 2010 $13,737
CHS Access Rd. 2013 $437,941
Stewart Cir. 2007 $11,250
King 2010 $548,188
Bascom Norris Drive Connector 2014 $3,167,183
Real Road 2017 $210,766
Totals $13,432,126

Project NameProject
Estimate2017 2018 2019 2020 2021
Herlong II $2,706,820 Q1
Old Wire III $3,131,420 Q2
Bell $1,200,000 Q3
Real $1,053,830 Underway
King/Mauldin $1,145,000 Q2
Moore Rd $1,035,000 Q2
CR 241 $750,000 Q3
Mt Carmel/Troy $1,190,000 Q2
Callahan $1,436,020 Q2
Five Year Work Plan
FDOT Funded Projects
115
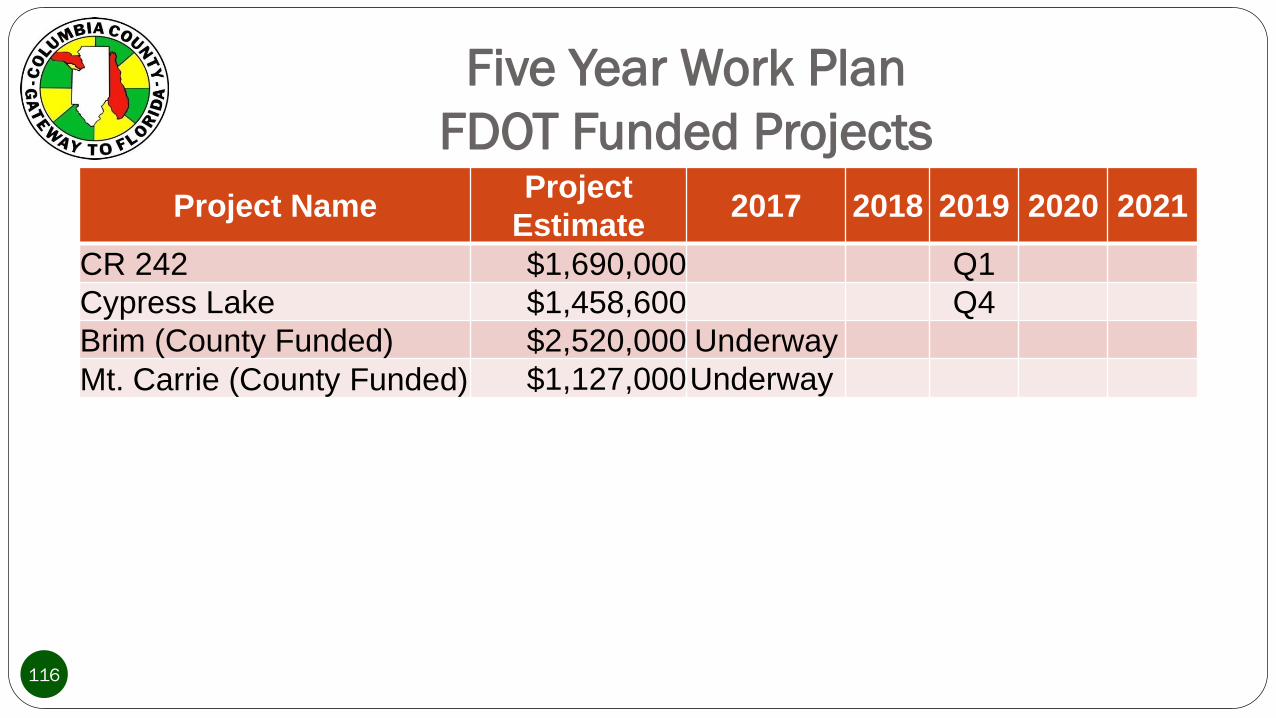
Project NameProject
Estimate2017 2018 2019 2020 2021
CR 242 $1,690,000 Q1
Cypress Lake $1,458,600 Q4
Brim (County Funded) $2,520,000 Underway
Mt. Carrie (County Funded) $1,127,000Underway
Five Year Work Plan
FDOT Funded Projects
116
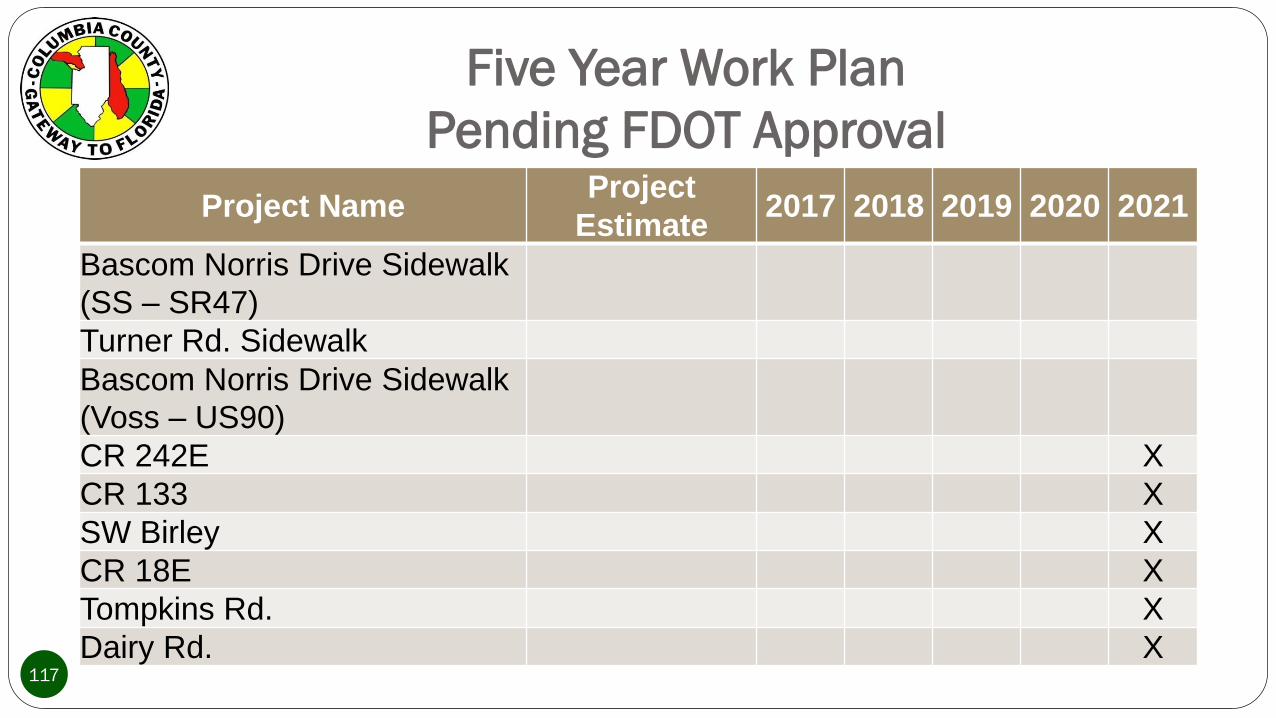
Project NameProject
Estimate2017 2018 2019 2020 2021
Bascom Norris Drive Sidewalk
(SS – SR47)
Turner Rd. Sidewalk
Bascom Norris Drive Sidewalk
(Voss – US90)
CR 242E X
CR 133 X
SW Birley X
CR 18E X
Tompkins Rd. X
Dairy Rd. X
Five Year Work Plan
Pending FDOT Approval
117

District 1 Priorities
118
Winfield $441,000
Queen $442,000
Leonia $155,000
Cheshire $216,000
Jacksonville Loop $294,000
Josephine $361,000
Total $1,909,000
District 2 Priorities
Have not been finalized pending a dedicated funding source
119
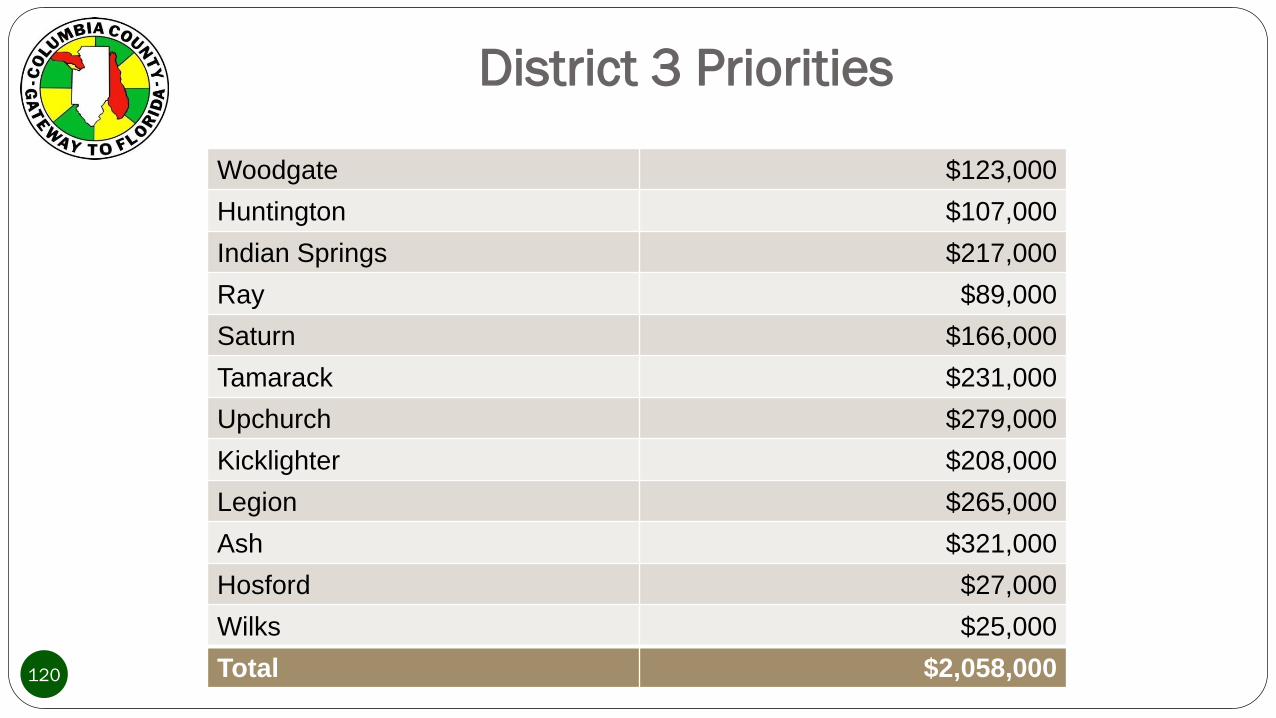
District 3 Priorities
120
Woodgate $123,000
Huntington $107,000
Indian Springs $217,000
Ray $89,000
Saturn $166,000
Tamarack $231,000
Upchurch $279,000
Kicklighter $208,000
Legion $265,000
Ash $321,000
Hosford $27,000
Wilks $25,000
Total $2,058,000
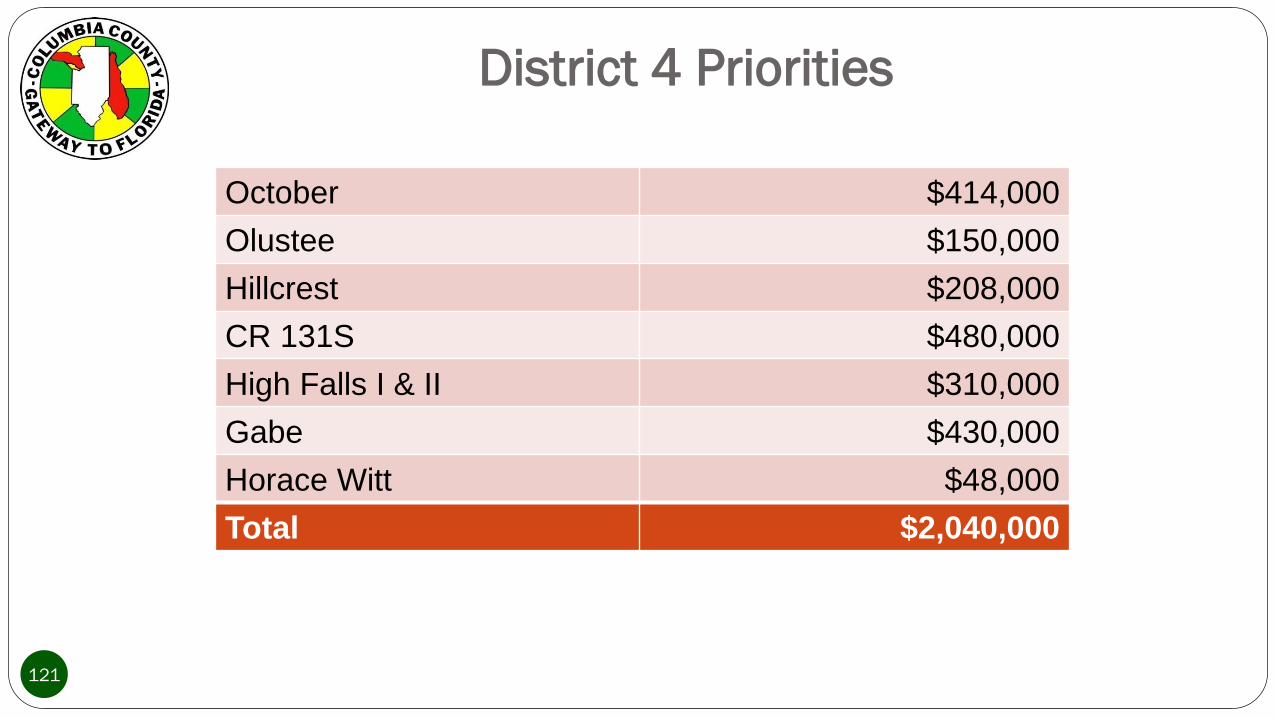
District 4 Priorities
121
October $414,000
Olustee $150,000
Hillcrest $208,000
CR 131S $480,000
High Falls I & II $310,000
Gabe $430,000
Horace Witt $48,000
Total $2,040,000
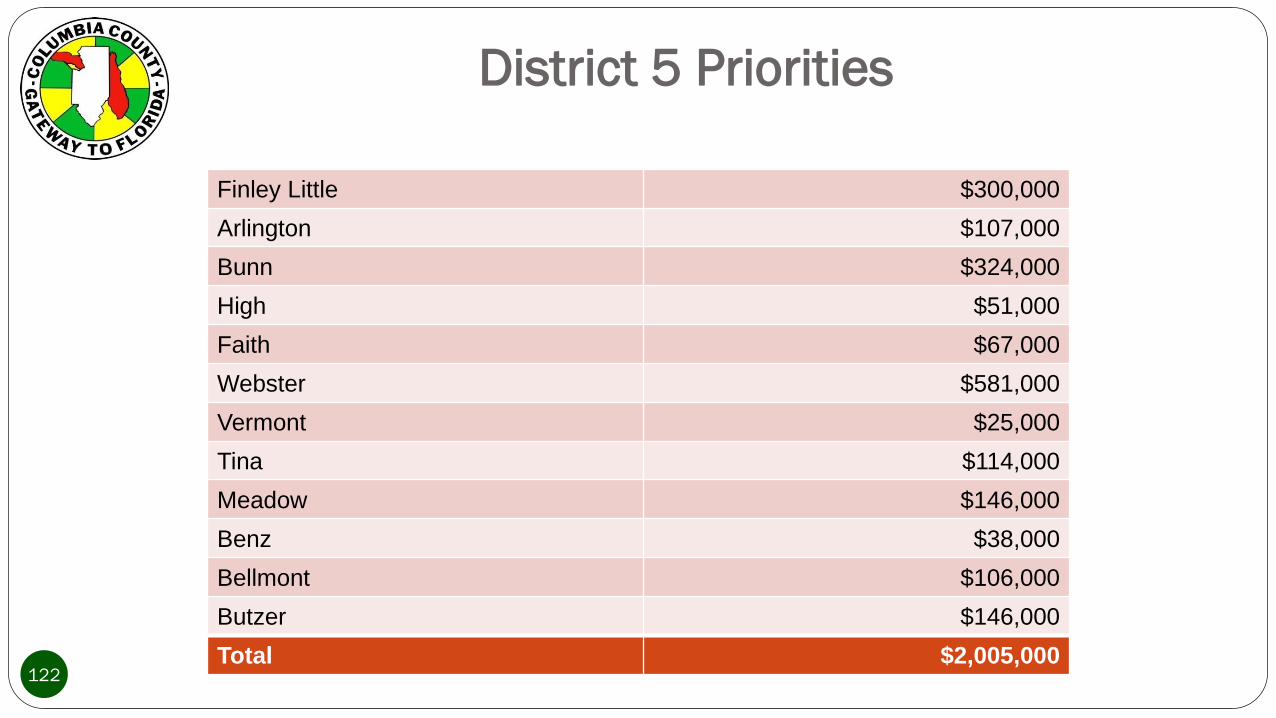
District 5 Priorities
122
Finley Little $300,000
Arlington $107,000
Bunn $324,000
High $51,000
Faith $67,000
Webster $581,000
Vermont $25,000
Tina $114,000
Meadow $146,000
Benz $38,000
Bellmont $106,000
Butzer $146,000
Total $2,005,000

Summary
Annual Maintenance $6.7 Million
Current Deficit $33.5 Million
Without a dedicated funding source deficits will increase
123

Road Improvement Needs/Options
Funding Options
Avoidance
Revenue Reallocation
Grants
“Growth” (Increase in Current Revenues)
Increased Taxes / Fees
New Taxes
Loans / Bond Issues
Excess Fund Balance
124
Road Improvement Needs/Options
Questions? Comments? Motions?
125

Stormwater Mitigation
126
Stormwater Mitigation
No Additional Information or Updates
127
Administrative Space Needs
128
Administrative Space Needs
Board Input Requested: continue to lease, purchase, or begin planning to
build new administrative offices.
129
Administrative Space Needs
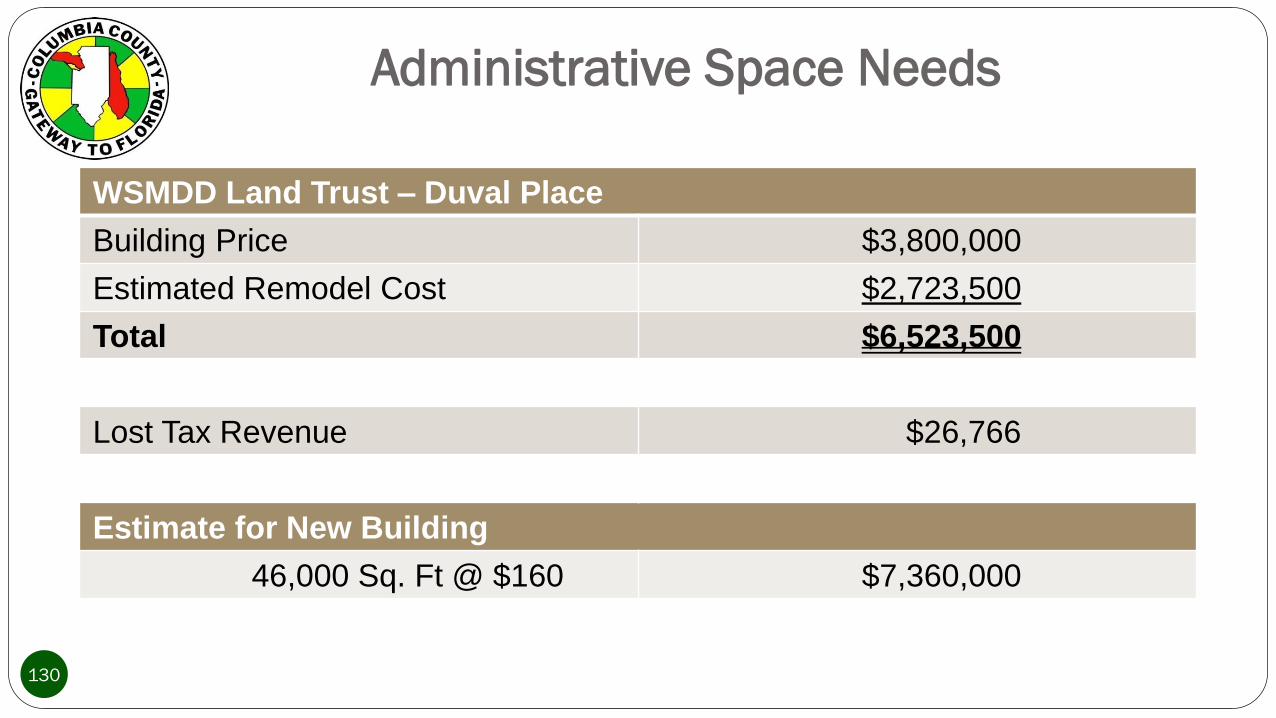
WSMDD Land Trust – Duval Place
Building Price $3,800,000
Estimated Remodel Cost $2,723,500
Total $6,523,500
Lost Tax Revenue $26,766
Estimate for New Building
46,000 Sq. Ft @ $160 $7,360,000
130

New Building Funding
15 Year Loan for $7,500,000 at 3.5%
Annual Debt Service Amount $641,525
Available for Debt Service
Additional Revenue from Target Beginning 2019 $363,000
Current Space Lease Payments $280,000
Total $643,000
131

Administrative Space Needs
Funding Options
Avoidance
Revenue Reallocation
“Growth” (Increase in Current Revenues)
Increased Taxes / Fees
New Taxes
Loans / Bond Issues
Excess Fund Balance
133
Detention Center
Repair/Replacement
134

Detention Center
Repair/Replacement
The Columbia County Detention Center was completed in 1987.
The facility has been maintained by a combination of inmate and
county staff. Renovations approved for the facility have included
roof repair of the administrative building, replacement of electric
door locks in maximum security and substantial HVAC repairs.
135

STAND ALONEVIDEO VISIT
COMMTOWER
WETLANDBOUNDRY
NEW PUBLIC PARKING AREA
NEW CRIME
LAB ACCESS DRIVE
AREA OF REFUGE
STORAGEUNITSIMPOUND
YARDAREA
NEW256 BED
HOUSING POD
NEW128 BED
HOUSING POD
FUTURE128 BED
HOUSING POD
NEWK-9
AREA
EXISTINGSHERIFF’S
OFFICE
KITCHENSERVICE
AREA
NEWCRIME
LAB
NEWCRIME
LABEGRESS DRIVE
136

137
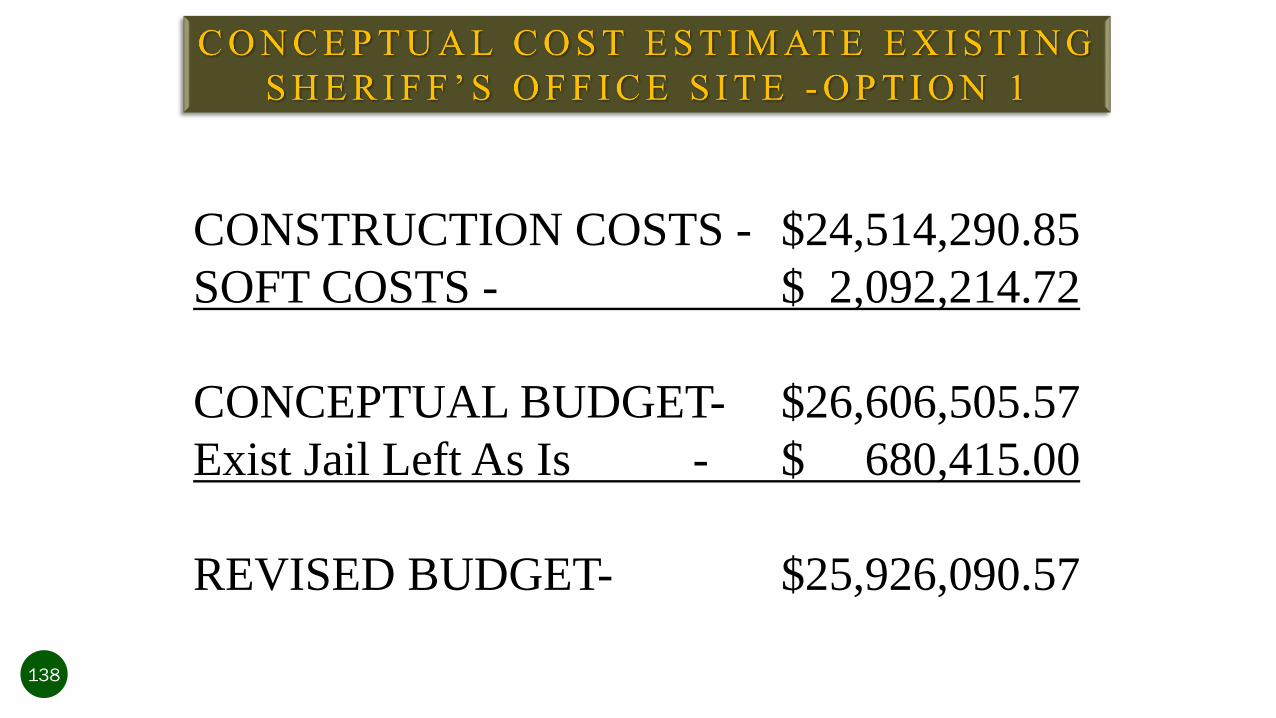
CONSTRUCTION COSTS - $24,514,290.85
SOFT COSTS - $ 2,092,214.72
CONCEPTUAL BUDGET- $26,606,505.57
Exist Jail Left As Is - $ 680,415.00
REVISED BUDGET- $25,926,090.57
138
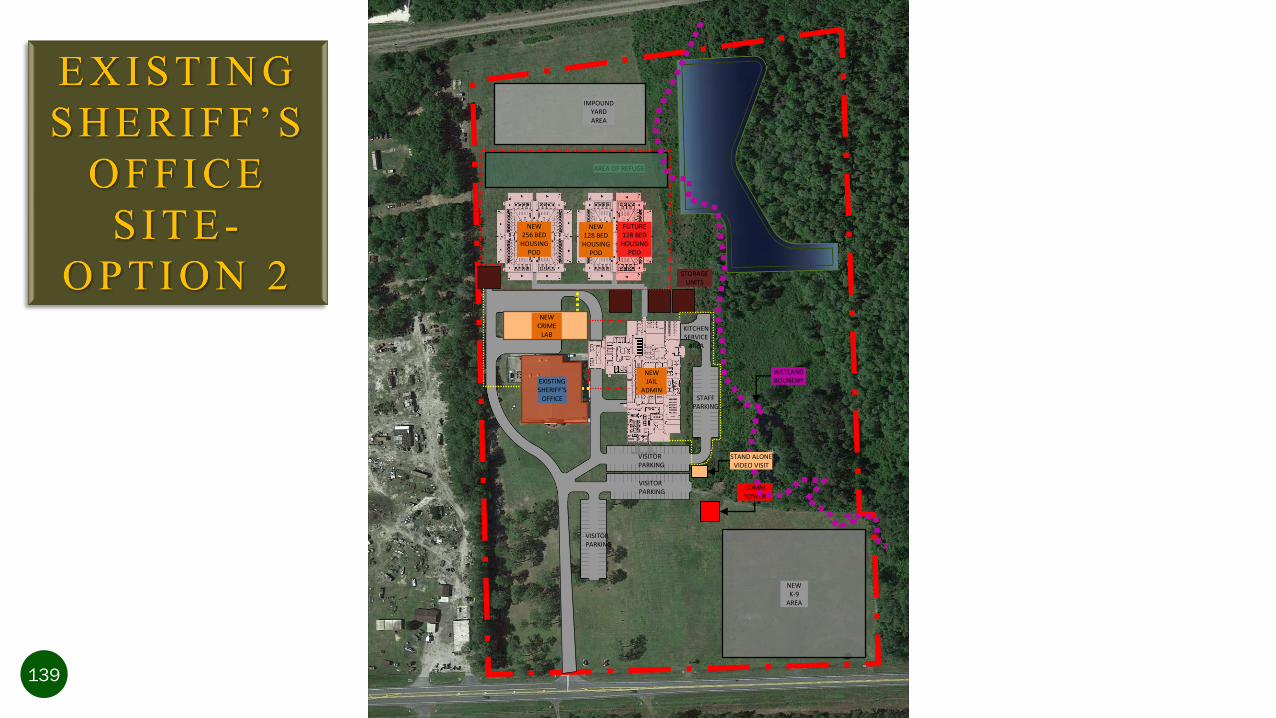
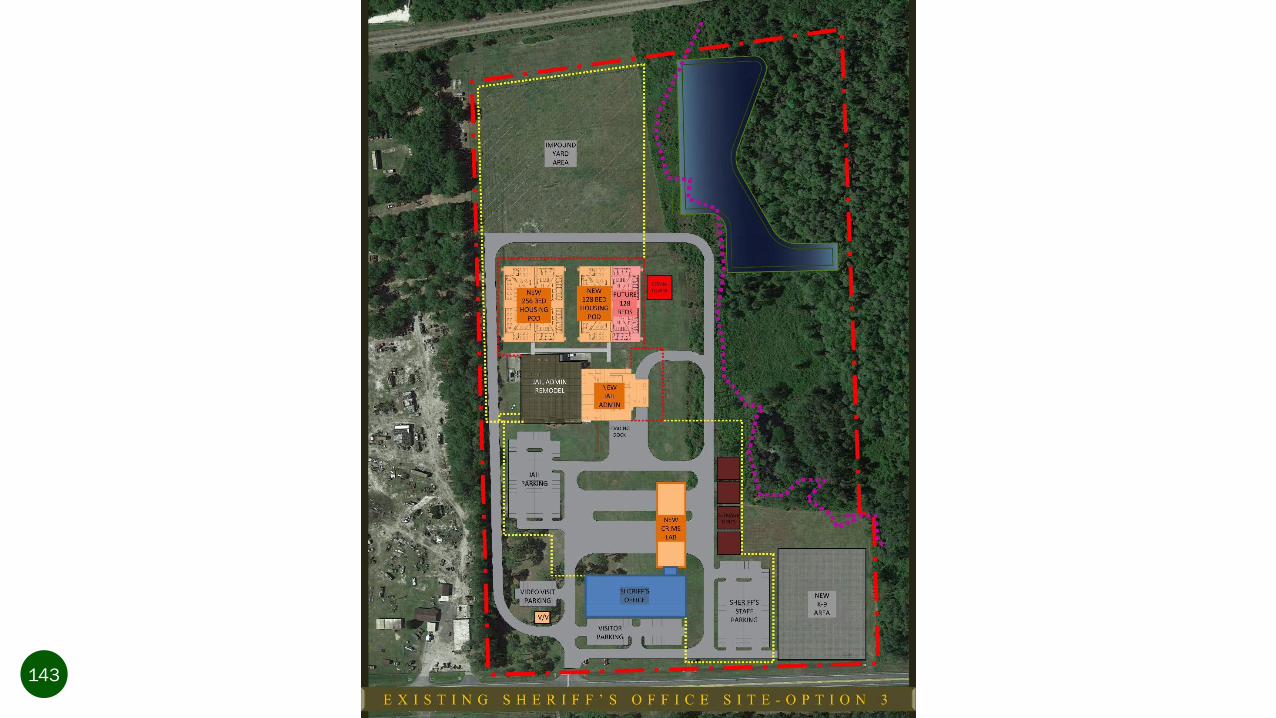
AREA OF REFUGE
STORAGEUNITS
COMMTOWER
WETLANDBOUNDRY
NEWK-9
AREA
IMPOUND YARDAREA
VISITORPARKING
VISITORPARKING
VISITORPARKING
STAFFPARKING
NEW256 BED
HOUSING POD
NEW128 BED
HOUSING POD
FUTURE128 BED
HOUSING POD
EXISTINGSHERIFF’S
OFFICE
NEWJAIL
ADMIN
NEWCRIME
LABKITCHENSERVICE
AREA
STAND ALONEVIDEO VISIT
139

140

CONSTRUCTION COSTS - $24,506,870.85
SOFT COSTS - $ 2,091,584.02
CONCEPTUAL BUDGET- $26,598,454.87
Exist Jail Left As Is - $ 680,415.00
REVISED BUDGET- $25,918,039.87
141
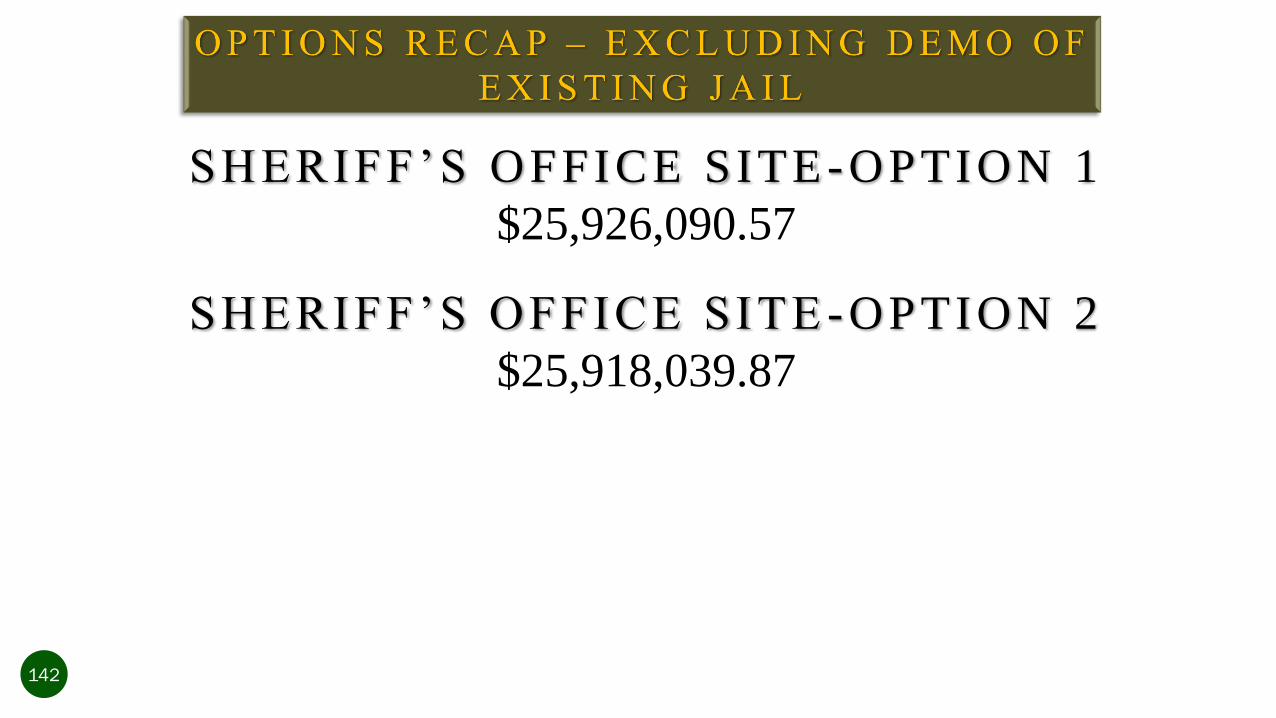
SHERIFF’S OFFICE SITE-OPTION 1
$25,926,090.57
SHERIFF’S OFFICE SITE -OPTION 2
$25,918,039.87
142
143
144
145
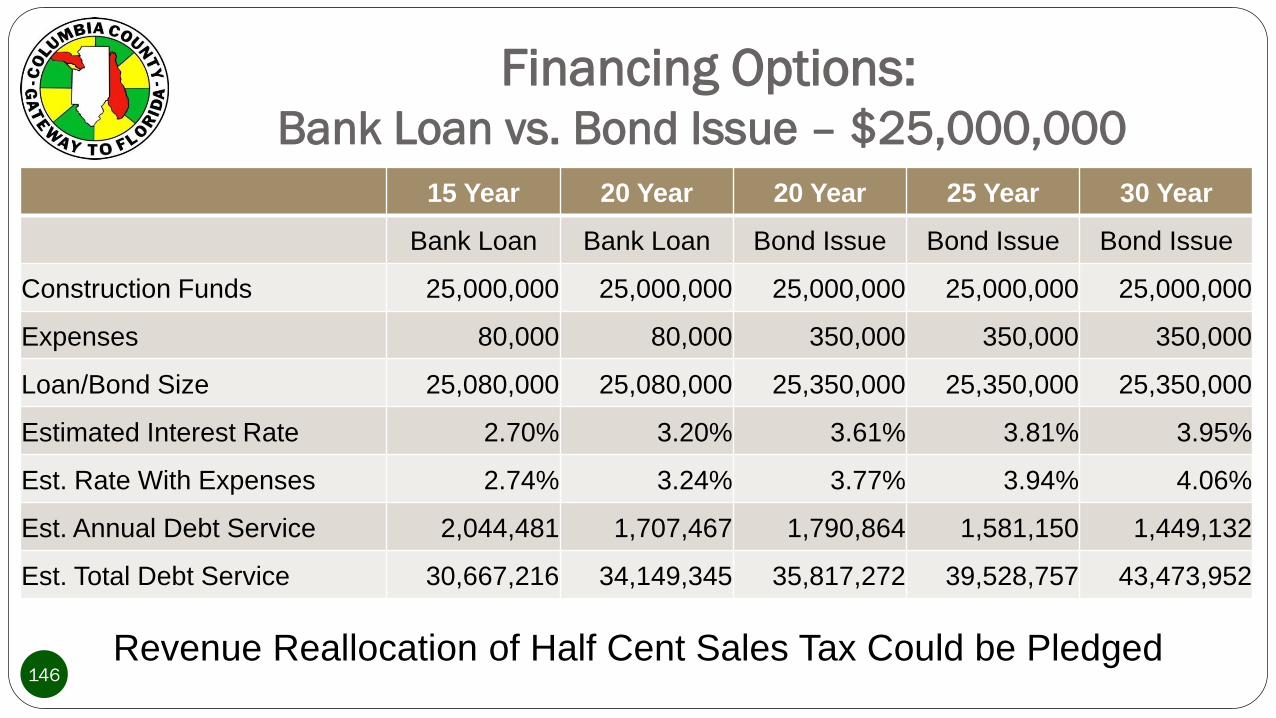
Financing Options: Bank Loan vs. Bond Issue – $25,000,000
15 Year 20 Year 20 Year 25 Year 30 Year
Bank Loan Bank Loan Bond Issue Bond Issue Bond Issue
Construction Funds 25,000,000 25,000,000 25,000,000 25,000,000 25,000,000
Expenses 80,000 80,000 350,000 350,000 350,000
Loan/Bond Size 25,080,000 25,080,000 25,350,000 25,350,000 25,350,000
Estimated Interest Rate 2.70% 3.20% 3.61% 3.81% 3.95%
Est. Rate With Expenses 2.74% 3.24% 3.77% 3.94% 4.06%
Est. Annual Debt Service 2,044,481 1,707,467 1,790,864 1,581,150 1,449,132
Est. Total Debt Service 30,667,216 34,149,345 35,817,272 39,528,757 43,473,952
146Revenue Reallocation of Half Cent Sales Tax Could be Pledged
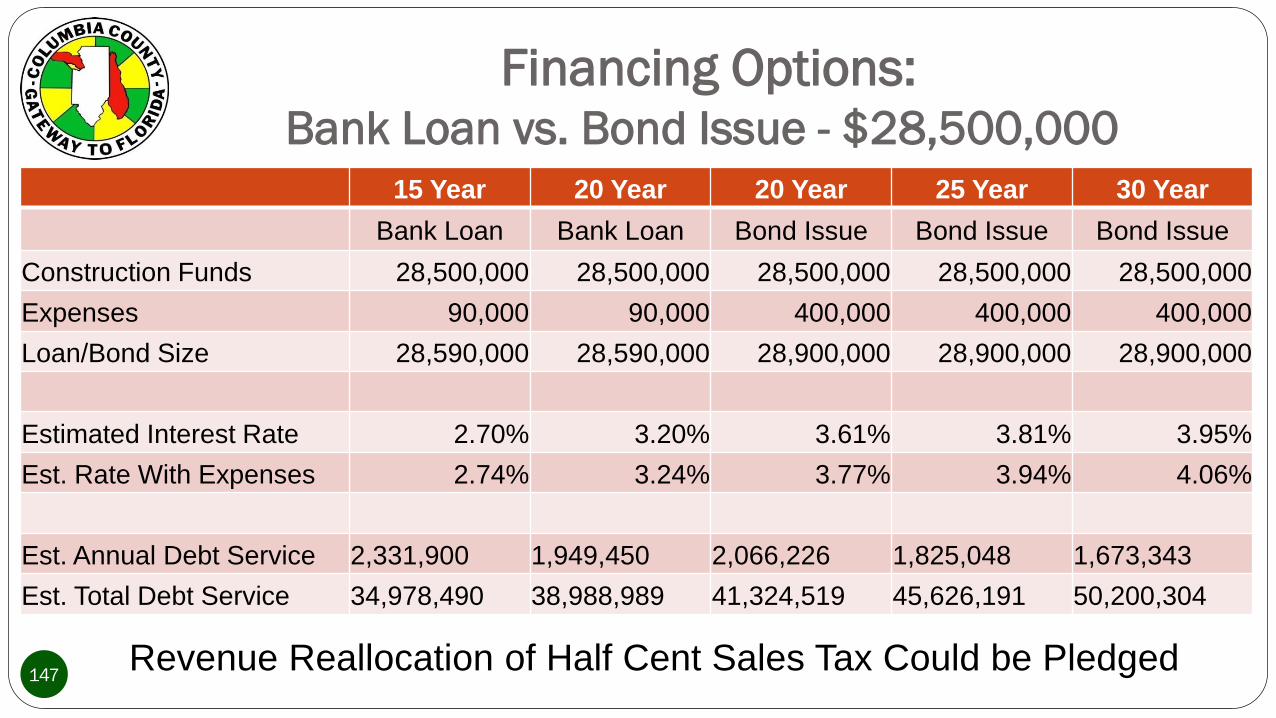
Financing Options: Bank Loan vs. Bond Issue - $28,500,000
15 Year 20 Year 20 Year 25 Year 30 Year
Bank Loan Bank Loan Bond Issue Bond Issue Bond Issue
Construction Funds 28,500,000 28,500,000 28,500,000 28,500,000 28,500,000
Expenses 90,000 90,000 400,000 400,000 400,000
Loan/Bond Size 28,590,000 28,590,000 28,900,000 28,900,000 28,900,000
Estimated Interest Rate 2.70% 3.20% 3.61% 3.81% 3.95%
Est. Rate With Expenses 2.74% 3.24% 3.77% 3.94% 4.06%
Est. Annual Debt Service 2,331,900 1,949,450 2,066,226 1,825,048 1,673,343
Est. Total Debt Service 34,978,490 38,988,989 41,324,519 45,626,191 50,200,304
147Revenue Reallocation of Half Cent Sales Tax Could be Pledged
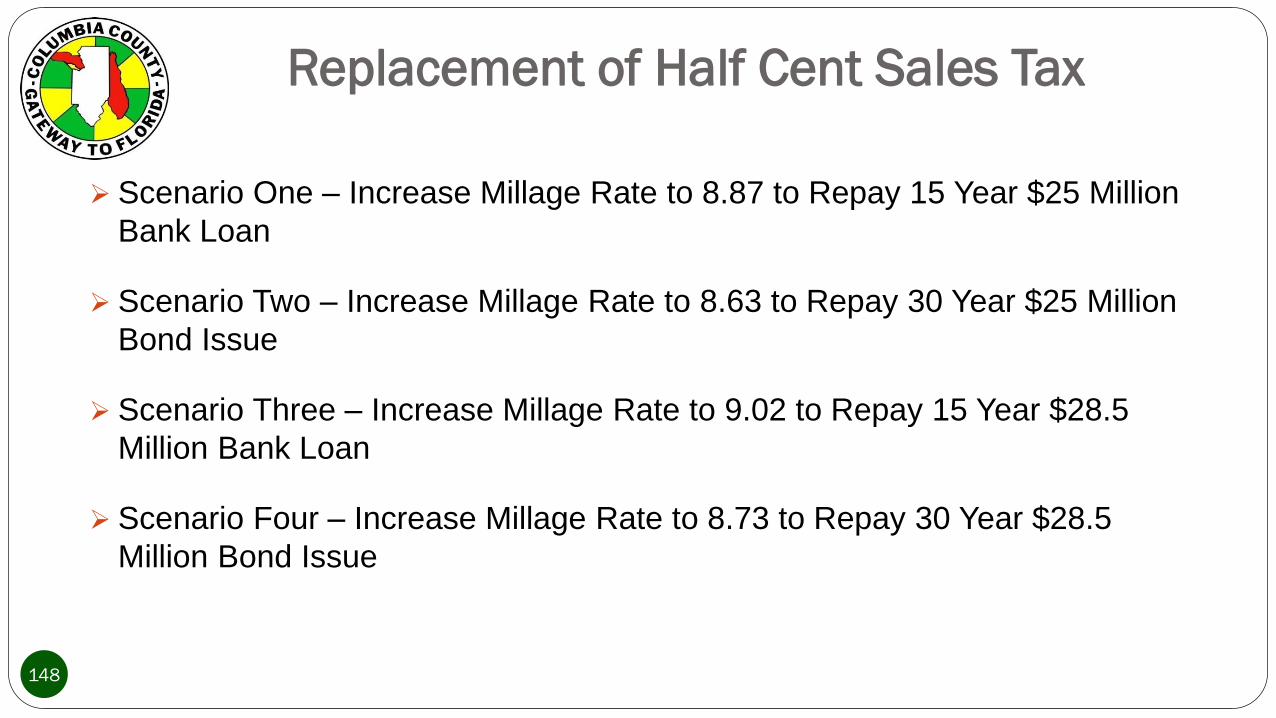
Replacement of Half Cent Sales Tax
Scenario One – Increase Millage Rate to 8.87 to Repay 15 Year $25 Million
Bank Loan
Scenario Two – Increase Millage Rate to 8.63 to Repay 30 Year $25 Million
Bond Issue
Scenario Three – Increase Millage Rate to 9.02 to Repay 15 Year $28.5
Million Bank Loan
Scenario Four – Increase Millage Rate to 8.73 to Repay 30 Year $28.5
Million Bond Issue
148
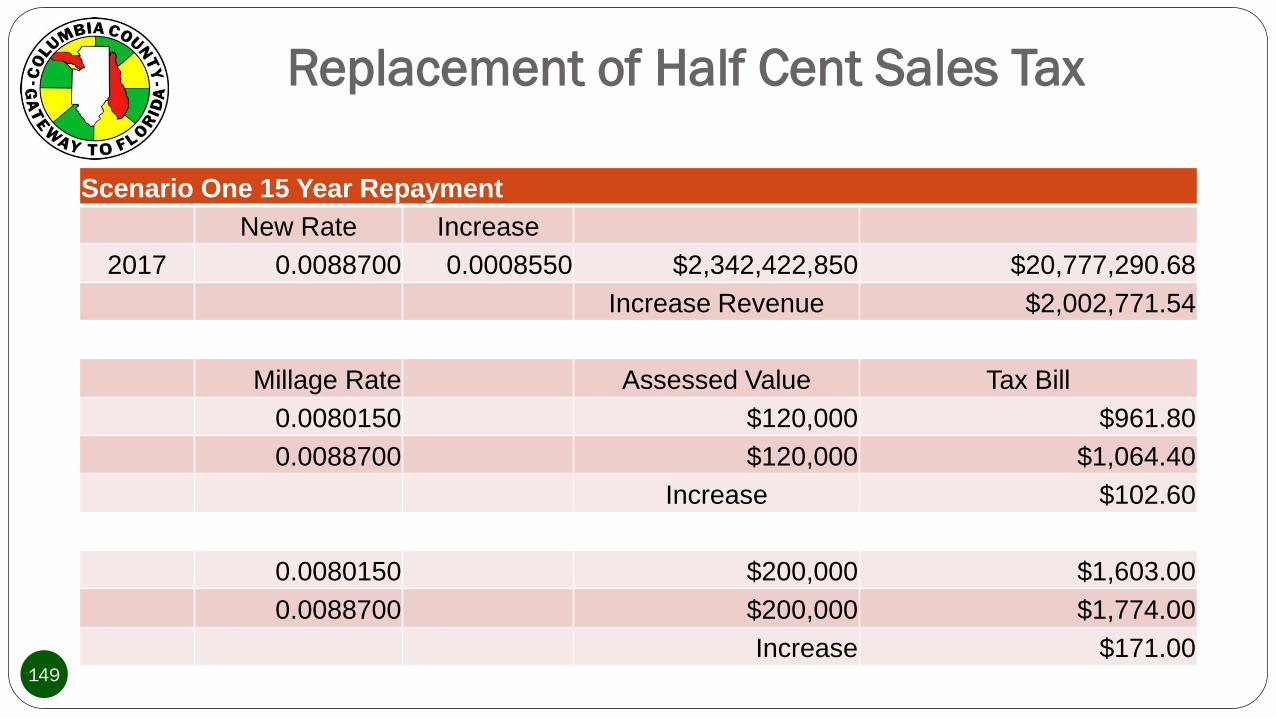
Replacement of Half Cent Sales Tax
Scenario One 15 Year Repayment
New Rate Increase
2017 0.0088700 0.0008550 $2,342,422,850 $20,777,290.68
Increase Revenue $2,002,771.54
Millage Rate Assessed Value Tax Bill
0.0080150 $120,000 $961.80
0.0088700 $120,000 $1,064.40
Increase $102.60
0.0080150 $200,000 $1,603.00
0.0088700 $200,000 $1,774.00
Increase $171.00 149

Replacement of Half Cent Sales Tax
Scenario Two 30 Year Repayment
New Rate Increase
2017 0.0086300 0.0006150 $2,342,422,850 $20,215,109.20
Increase Revenue $1,440,590.05
Millage Rate Assessed Value Tax Bill
0.0080150 $120,000 $961.80
0.0086300 $120,000 $1,035.60
Increase $73.80
0.0080150 $200,000 $1,603.00
0.0086300 $200,000 $1,726.00
Increase $123.00 150
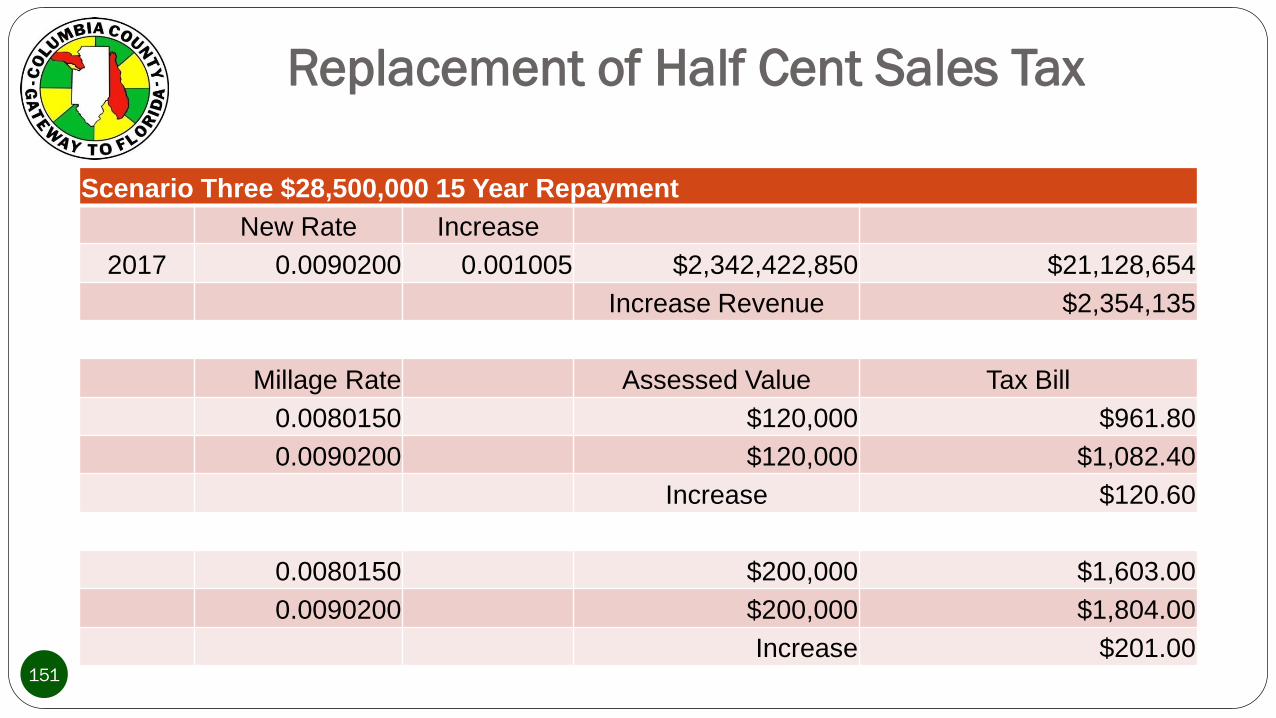
Replacement of Half Cent Sales Tax
Scenario Three $28,500,000 15 Year Repayment
New Rate Increase
2017 0.0090200 0.001005 $2,342,422,850 $21,128,654
Increase Revenue $2,354,135
Millage Rate Assessed Value Tax Bill
0.0080150 $120,000 $961.80
0.0090200 $120,000 $1,082.40
Increase $120.60
0.0080150 $200,000 $1,603.00
0.0090200 $200,000 $1,804.00
Increase $201.00 151
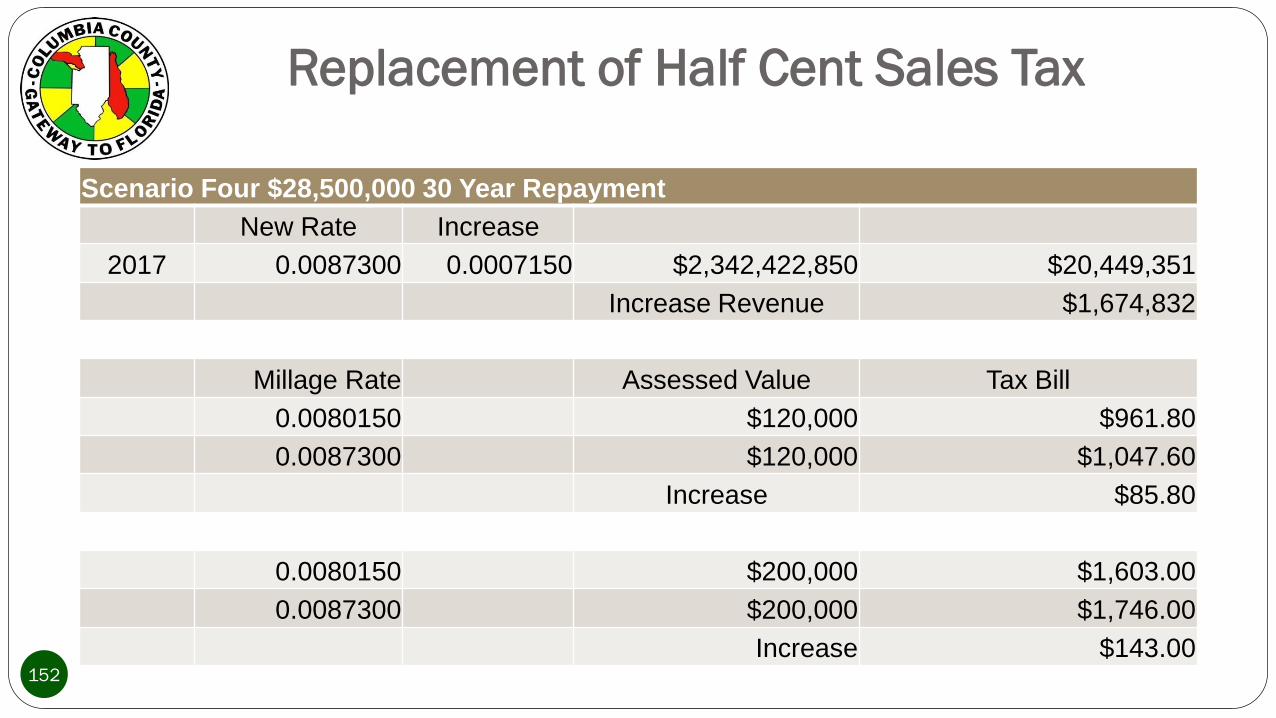
Replacement of Half Cent Sales Tax
Scenario Four $28,500,000 30 Year Repayment
New Rate Increase
2017 0.0087300 0.0007150 $2,342,422,850 $20,449,351
Increase Revenue $1,674,832
Millage Rate Assessed Value Tax Bill
0.0080150 $120,000 $961.80
0.0087300 $120,000 $1,047.60
Increase $85.80
0.0080150 $200,000 $1,603.00
0.0087300 $200,000 $1,746.00
Increase $143.00 152
Detention Center
Repair/ReplacementFunding Options
Avoidance
Revenue Reallocation
Grants
Legislative Appropriation
“Growth” (Increase in Current Revenues)
Increased Taxes / Fees
New Taxes
Loans / Bond Issues
Excess Fund Balance
153
Detention Center
Repair/Replacement
Questions? Comments? Motions?
154
Economic Development
155
Economic Development
County is only responsible for rail spur into County Property. Only location
this is an issue is the industrial park on SR 100.
No Additional Information or Updates
156
Economic Development
Questions? Comments? Motions?
157
Policy Development
158

Policy Development
Staff is recommending the development of an Equipment Replacement
Program
(Draft policy provided under separate cover)
159
Planned Replacement Year
Description Cost Useful LifeAnnual
Depreciation17/18 18/19 19/20 20/21 21/22
9-1-1 Communications Center
160
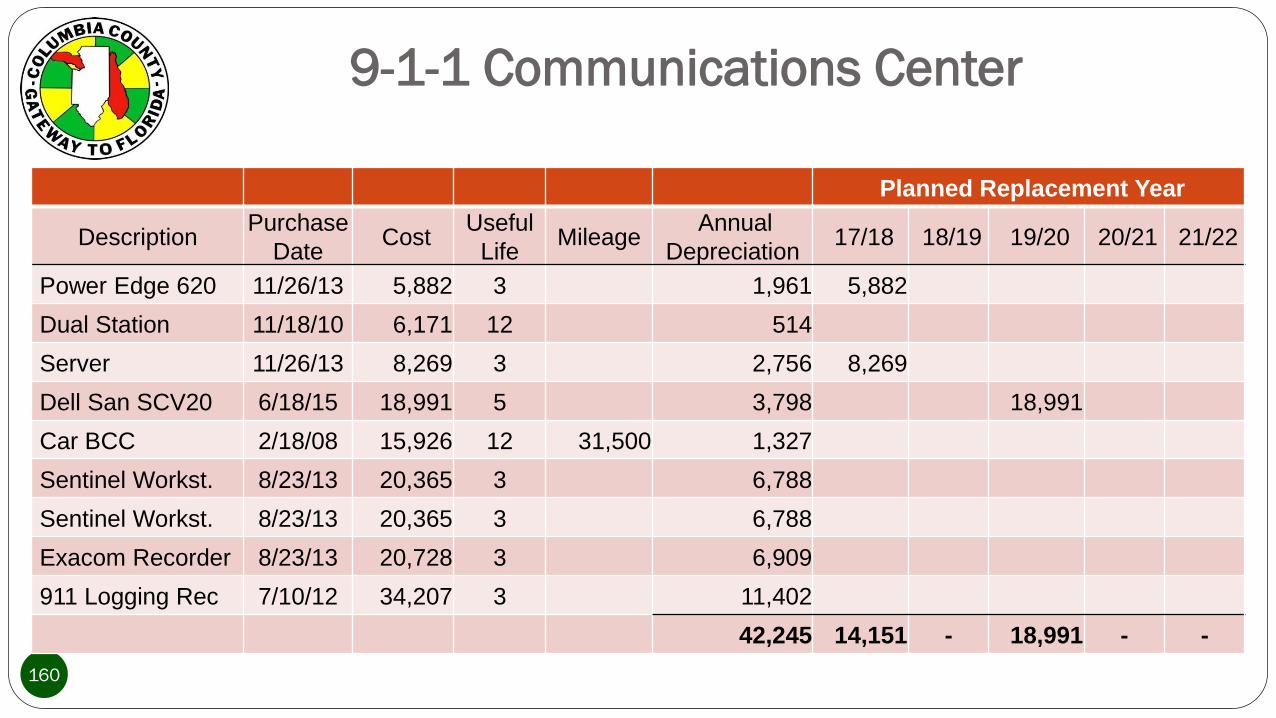
Planned Replacement Year
DescriptionPurchase
DateCost
Useful
LifeMileage
Annual
Depreciation 17/18 18/19 19/20 20/21 21/22
Power Edge 620 11/26/13 5,882 3 1,961 5,882
Dual Station 11/18/10 6,171 12 514
Server 11/26/13 8,269 3 2,756 8,269
Dell San SCV20 6/18/15 18,991 5 3,798 18,991
Car BCC 2/18/08 15,926 12 31,500 1,327
Sentinel Workst. 8/23/13 20,365 3 6,788
Sentinel Workst. 8/23/13 20,365 3 6,788
Exacom Recorder 8/23/13 20,728 3 6,909
911 Logging Rec 7/10/12 34,207 3 11,402
42,245 14,151 - 18,991 - -

Summary
202
FundAnnual
Depreciation 2017-2018 2018-2019 2019-2020 2020-2021 2021-2022
General
911 42,245 14,151 - 18,991 - -
Addressing 5,831 4,223 - - - -
BCC 25,881 34,409 48,919 - 20,266 -
Central Communications 3,070 26,366 - - - -
Code Enforcement 3,811 22,000 22,000 22,000 - -
EMG 12,659 - - - - 28,000
Facilities Management 36,750 125,000 160,000 - 65,000 -
Landscape 121,252 313,400 123,000 144,500 3,000 149,500
Mosquito Control 22,500 105,000 - - 15,000 -
Total General Fund 644,549 353,919 185,491 103,266 177,500
Currently Budgeted 201,000 201,000 201,000 201,000 201,000
Variance 443,549 152,919 -15,509 -97,734 -23,500
Summary
203
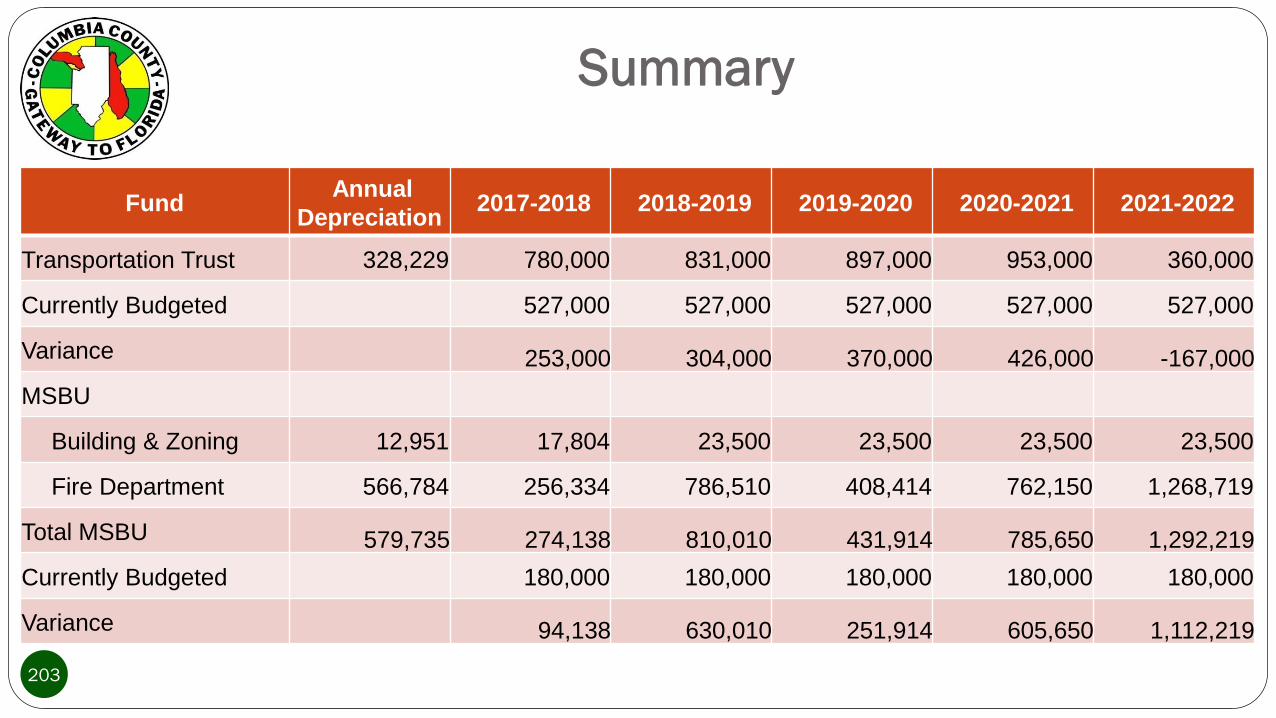
FundAnnual
Depreciation 2017-2018 2018-2019 2019-2020 2020-2021 2021-2022
Transportation Trust 328,229 780,000 831,000 897,000 953,000 360,000
Currently Budgeted 527,000 527,000 527,000 527,000 527,000
Variance 253,000 304,000 370,000 426,000 -167,000
MSBU
Building & Zoning 12,951 17,804 23,500 23,500 23,500 23,500
Fire Department 566,784 256,334 786,510 408,414 762,150 1,268,719
Total MSBU 579,735 274,138 810,010 431,914 785,650 1,292,219
Currently Budgeted 180,000 180,000 180,000 180,000 180,000
Variance 94,138 630,010 251,914 605,650 1,112,219
Summary
204
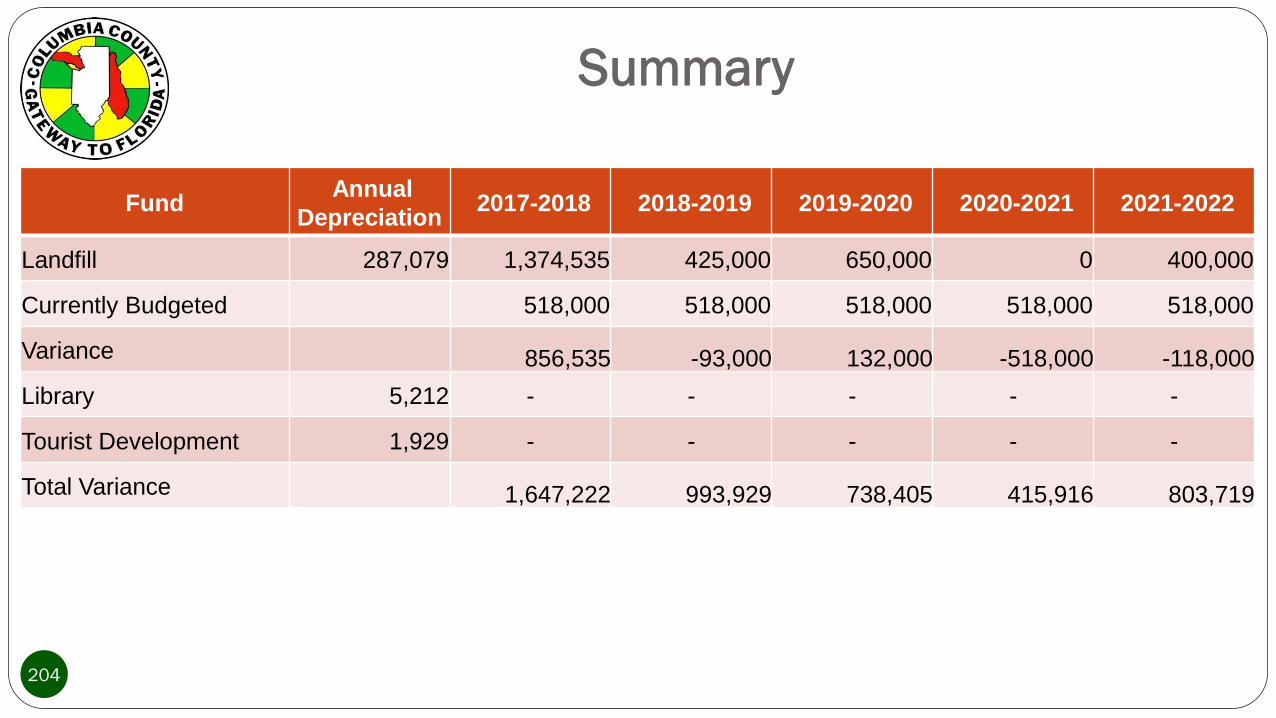
FundAnnual
Depreciation 2017-2018 2018-2019 2019-2020 2020-2021 2021-2022
Landfill 287,079 1,374,535 425,000 650,000 0 400,000
Currently Budgeted 518,000 518,000 518,000 518,000 518,000
Variance 856,535 -93,000 132,000 -518,000 -118,000
Library 5,212 - - - - -
Tourist Development 1,929 - - - - -
Total Variance 1,647,222 993,929 738,405 415,916 803,719
Policy Development
Questions? Comments? Motions?
205
Communication Improvements
206
Communication Improvements
No Additional Information or Updates
207
Communication Improvements
Questions? Comments? Motions?
208
Recreation Enhancements
209

Recreation Enhancements
210
No Additional Information or Updates
Ellisville Development
211
Ellisville Development
212
No Additional Information or Updates
Strategic Planning
213
Strategic Planning
Interviews conducted Tuesday, May 23, 2017
214
Strategic Planning
Questions? Comments? Motions?
215

Next Steps - Directions from Board
Next Scheduled Workshop June 26th
216