borders group: pricing earnings - ekonomika · accrual accounting and valuation: pricing earnings...
TRANSCRIPT

Accrual Accounting and Valuation: Pricing Earnings – Chapter 6 p. 135
CHAPTER SIX
Accrual Accounting and Valuation: Pricing Earnings
Concept Questions
C6.1. Analysts typically forecast eps and eps growth without consideration for how
earnings are affected by payout. That is, they forecast ex-dividend growth, not cum-
dividend growth. Investors value ex-dividend earnings growth, but they also value
additional earnings to be earned from the reinvestment of dividends.
C6.2. The historical 8.5% growth rate that is often quoted is the ex-dividend growth
rate. It ignores the fact that earnings were also earned by investors from reinvesting
dividends (in the S&P 500 stocks, for example) that were typically 40% of earnings.
The cum-dividend rate is about 12%. See Box 6.x.
C6.3. This formula capitalizes earnings at the ex-dividend earnings growth rate, g.
This ignores growth that comes from reinvesting dividends. Further, if earnings are
expected to grow at a rate equal to the required return, r, then the growth should not
be valued , and forward earnings should be capitalized at the rate, r, not r – g. Only
growth in excess on the required rate should be recognized.
The formula also has mathematical problems. If g = r, then the denominator is
zero and the value is infinite. If g is greater than r (which is necessary for growth to
have value), the denominator is negative.

p. 136 Solutions Manual to accompany Financial Statement Analysis and Security Valuation
C6.4. The trailing P/E is normal: 1.12/0.12 = 9.33. The forward P/E is also normal:
1/0.12 = 8.33.
C6.5. The difference is that, for the trailing P/E, one more years of earnings are
involved (the current year). The trailing P/E can be interpreted as paying for the value
of forward earnings (at the multiple for forward earnings) plus a dollar for every
dollar of current earnings.
C6.6. Cum-dividend earnings growth incorporates earnings that are earned from the
reinvestment of dividends, and investors value those earnings. Ex-dividend growth
rates are affected by dividends: dividends reduce assets which then earn lower
earnings. As cum-dividend growth rates reflect the earnings from dividends, they are
not affected by dividends. Cum-dividend growth rates are effectively the rates that
firms would have if they did not pay dividends.
C6.7. Correct. See Box 6.x.
C6.8. Incorrect. As the normal (forward) P/E ratio is the inverse of the required
return and the required return for a bond is (usually) lower than that for a stock, the
normal P/E ratio for a bond is greater than that for a stock. However, a bond cannot
deliver growth, so the P/E ratio for a growth stock might well be greater than that for
a bond.
C6.9. Yes, she could. One expects the earnings yield on a stock to be greater than the
bond yield because a stock is riskier and thus has a higher required return.
Accrual Accounting and Valuation: Pricing Earnings – Chapter 6 p. 137
C6.10. A PEG ratio is the ratio of the P/E to one-year-ahead expected earnings
growth (in percentage terms). As the P/E anticipates earnings growth, the PEG ratio
should be 1.0 if the market is anticipating growth appropriately. However, more than
one year of growth is involved in assessing P/E ratios, so the measure should only be
used as a first-pass check on the P/E ratio.
C6.11. Intrinsic P/E ratios are determined by the cost of capital and earnings growth
expectations. So P/E ratios might have been low in the 1970s because the market did
not see much earnings growth in the future for the typical firm, and saw considerable
growth in the 1960s and 1990s. Or the cost of capital increased in the 1970s (and fell
in the 1960s and 1990s). The interest rate is one component of the cost of capital, and
interest rates were higher in the 1970s (particularly the late 1970s) than in the 1960s
and 1990s.
The traded P/E ratios may also reflect market inefficiency: the market might
have priced earnings too low in the 1970s and too high in the 1960s and 1990s. That
turned out to be the case (after the fact) in the 1960s and 1970s (as P/E ratios and
prices fell after the 1960s but increased after the 1970s).
C6.12. Earnings-to-price ratios -- the inverse of price/earnings ratios -- are driven by
three things:
(1) The required equity return
(2) Expected growth
(3) Market inefficiency in pricing the required return and expected growth.
p. 138 Solutions Manual to accompany Financial Statement Analysis and Security Valuation
The argument assumes that factors (2) and (3) do not explain the change in the
earnings-to-price ratio. Were growth expectations higher in the 1990s than in the
1970s? Were S&P 500 stocks overpriced?
C6.13. Comparing the 10% growth rate in earnings with a 4% rate for GNP, compares
a cum-dividend growth rate (after reinvesting dividends) with an "ex-dividend"
growth rate: the GNP is the income for the economy (as measured) but much of the
annual income is consumed ("withdrawn" as a "dividend") rather than reinvested in
production.
C6.14. The trailing P/E, based on current earnings, is affected by transitory earnings.
The forward P/E based on next years' forecasted earnings is less likely to be so
affected, and so is a better base for growth. (But the analyst does have to forecast
next year's earnings).
C6.15. Yes; eps growth can be increased with investment, but the investment may
earn only the required return, and thus not add value. A firm can also increase its
expected earnings growth through accounting methods, but not add value.
Exercises
E6.1. Valuation From Forecasting Abnormal Earnings Growth
This exercise complements Exercise 5.1 in Chapter 5, using the same forecasts. The
question asks you to convert a pro forma to a valuation using abnormal earnings

Accrual Accounting and Valuation: Pricing Earnings – Chapter 6 p. 139
growth methods. First complete the pro forma by forecasting cum-dividend earnings
and normal earnings. Then calculate abnormal earnings growth and value the firm.
2004E 2005E 2006E 2007E
2008E
Earnings 388.0 570.0 599.0 629.0
660.45
Dividends 115.0 160.0 349.0 367.0
385.40
Reinvested dividends 11.5 16.0 34.9
36.70
Cum-div earnings 581.5 615.0 663.9
697.15
Normal earnings 426.8 627.0 658.9
691.90
Abnormal earn growth 154.7 -12.0 5.0
5.25
Growth rates:
Earnings growth 46.91% 5.09% 5.00%
5.00%
Cum-div earn growth (AEG) 49.87% 7.89% 10.83%
10.83%
Growth in AEG
5.0%
Discount rate 1.100 1.210
PV of AEG 140.64 -9.92
Note that the AEG for 2005 and 2006 are discounted back to the end of 2004.
a. Forecasted abnormal earnings growth (AEG) is given in the pro forma above.
AEG is the difference between cum-dividend earnings and normal earnings.
So, for 2005,
AEG = 581.5 – 426.8 = 154.7.
Cum-dividend earnings is earnings plus prior year’s dividend reinvested at the
required rate of return. So, for 2005,
Cum-dividend earnings = 570.0 + (115 × 10%) = 581.

p. 140 Solutions Manual to accompany Financial Statement Analysis and Security Valuation
Normal earnings is prior year’s earnings growing at the required rate. So, for
2005,
Normal earnings = 388 × 1.10 = 426.8
Abnormal earnings growth can also be calculated as
AEG = (cum-div growth rate – required rate) × prior year’s earnings
So, for 2005,
AEG = (0.4987 – 0.10) × 388 = 154.7
b. The growth rates are given in the pro forma.
c. The growth rate of AEG after 2006 is 5%. Assuming this rate will continue
into the future, the valuation runs as follows:
Forward earnings, 2004 388.00
Total present value of AEG for 2005-2006 130.72
(140.64 – 9.92 = 130.73)
Continuing value (CV), 200605.110.1
5
= 100.00
Present value of CV 210.1
0.100 82.64
601.36
Capitalization rate 0.10
Value of the equity10.0
36.601 6,013.6
Value per share on 1,380 million shares 4.36
This is a Case 2 valuation. If you worked exercise E5.1 using residual earnings
methods, compare you value calculation with the one here.
d. The forward P/E = 6,013.6/388 =15.5. The normal P/E is 1/0.10 = 10.
E6.2. Abnormal Earnings Growth and Value
Accrual Accounting and Valuation: Pricing Earnings – Chapter 6 p. 141
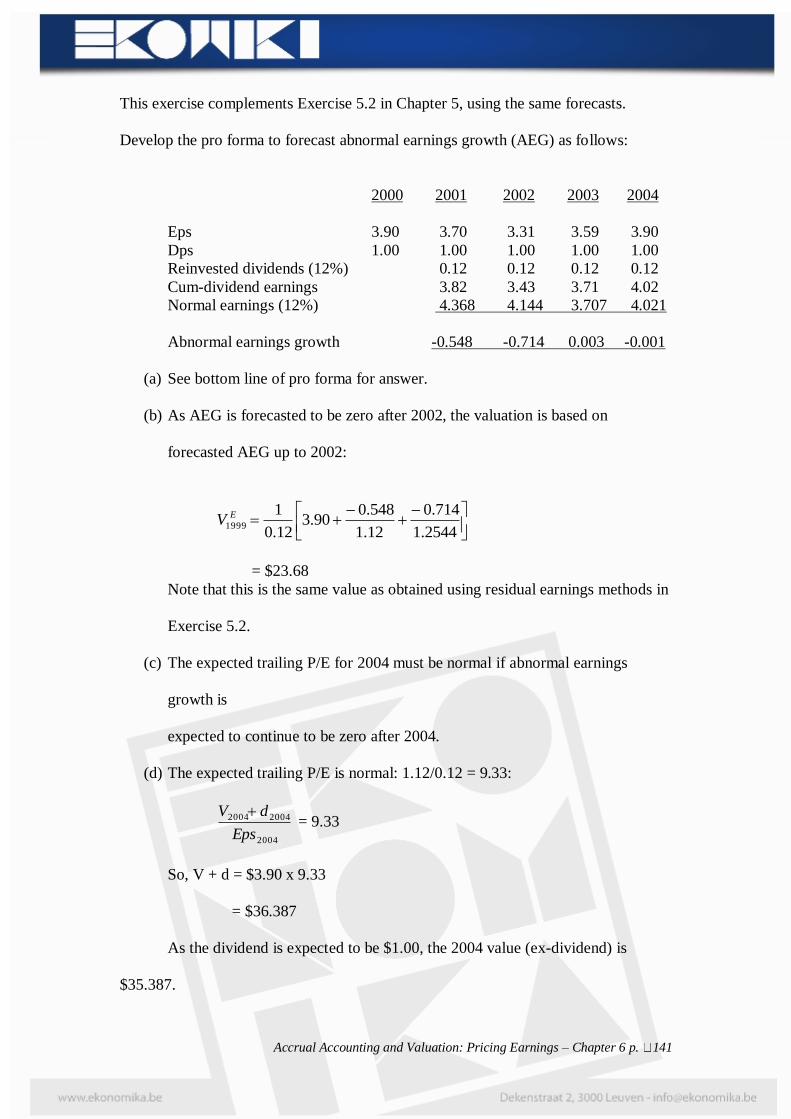
This exercise complements Exercise 5.2 in Chapter 5, using the same forecasts.
Develop the pro forma to forecast abnormal earnings growth (AEG) as follows:
2000 2001 2002 2003 2004
Eps 3.90 3.70 3.31 3.59 3.90
Dps 1.00 1.00 1.00 1.00 1.00
Reinvested dividends (12%) 0.12 0.12 0.12 0.12
Cum-dividend earnings 3.82 3.43 3.71 4.02
Normal earnings (12%) 4.368 4.144 3.707 4.021
Abnormal earnings growth -0.548 -0.714 0.003 -0.001
(a) See bottom line of pro forma for answer.
(b) As AEG is forecasted to be zero after 2002, the valuation is based on
forecasted AEG up to 2002:
2544.1
714.0
12.1
548.090.3
12.0
11999
EV
= $23.68
Note that this is the same value as obtained using residual earnings methods in
Exercise 5.2.
(c) The expected trailing P/E for 2004 must be normal if abnormal earnings
growth is
expected to continue to be zero after 2004.
(d) The expected trailing P/E is normal: 1.12/0.12 = 9.33:
2004
20042004
Eps
dV = 9.33
So, V + d = $3.90 x 9.33
= $36.387
As the dividend is expected to be $1.00, the 2004 value (ex-dividend) is
$35.387.

p. 142 Solutions Manual to accompany Financial Statement Analysis and Security Valuation
E6.3. Calculating Cum-dividend Earnings Growth: Nike
The pro forma is as follows:
2003 2004
Eps 2.77 3.13
Dps 0.55
Reinvestment of 2003 dividend at 10% 0.055
Cum-dividend eps 3.185
Cum-dividend eps growth rate (3.185/2.77 –1) 14.98%
Ex-dividend eps growth rate (3.13/2.77 - 1) 13.0%
E6.4. Calculating Cum-dividend Earnings: General Motors
Year
Eps
Dps
Earnings on prior
year’s reinvested
dividends
Cum-
dividend eps
1994 5.22 0.80
1995 7.28 1.10 0.08 7.36
1996 6.06 1.60 0.11 6.17
1997 8.70 2.00 0.16 8.86
1998 4.26 2.00 0.20 4.46
E6.5. Dividend Displacement and Value
(a) Firm B will have higher earnings in 2002 because it will pay no
dividend in 2002. Firm A’s 2002 earnings will be displaced by its 2001 dividend.
Dividend in 2001 for Firm A = 0.6 × 16.60 = 9.96
Reduced 2002 earnings for Firm A = 9.96 × 11% = 1.10
Therefore, B’s earnings (without the displacement) = 17.80 + 1.10
= 18.90

Accrual Accounting and Valuation: Pricing Earnings – Chapter 6 p. 143
(Assumes retained earnings are invested at the cost of capital.)
(b) Anticipated future dividends don’t affect current price (unless payment
reduces investment in value-generating projects). Firm A’s shareholders expect to
earn the earnings of Firm B’s shareholders by reinvesting the dividend at the cost of
capital. So cum-dividend earnings are the same for both firms.
E6.6. Using Analysts’ Forecasts to Calculate PEG Ratios and Evaluate Stock
Prices: General Motors
The pro forma is as follows:
2003 2004
Eps 4.62 6.77
Dps 2.00
Reinvestment of 2003 dividend (at 12%) 0.24
Cum-dividend eps 7.01
(a) Cum-dividend expected eps for 2004 = $7.01
Cum-dividend growth rate for 2004 = 7.01/4.62 – 1.0 = 51.73%
(b) Cum-dividend for 2004 7.01
Normal earnings for 2004 = 4.62 x 1.12 = 5.1744
AEG, 2004 1.8356
Alternative calculation:
AEG = (Cum-div growth rate, 2004 – required return) x eps, 2003
= (0.5173 – 0.12) x 4.62
= 1.8355 (allow for rounding error)
(c) Forward P/E = 39/4.62 = 8.44
PEG = Forward P/E for 2003/Growth rate for 2004
= 8.44/51.73
= 0.16

p. 144 Solutions Manual to accompany Financial Statement Analysis and Security Valuation
The simplistic interpretation of the ratio says that, if the ratio is less than 1.0,
the stock is a BUY: the P/E is underpricing subsequent earnings growth.
However, as the ratio prices only one year of growth, it can be misleading.
That is certainly the case here: GM cannot maintain a 51.73% growth rate. A
growth rate of 8.44% would yield a PEG of 1.0.
(d) If the market saw GM’s earnings growing at 12% (the required return) after
2003,
it would give GM a normal P/E of 1/0.12 = 8.33, approximately the 8.44 P/E it
actually gave the firm. So the market forecasts no growth over the required
rate (that is, no abnormal growth) in the long run. So it must see the large
forecasted AEG in 2004 declining after 2004.
E6.7. Forward P/E Ratios and Implied Earnings Growth: Hewlett-Packard
a. At a price of $12 and forward (one-year-ahead) earnings of $1.19 per share,
the forward P/E is 12/1.19 = 10.08.
b. If the cost of capital (required return) is 10%, the normal forward P/E is 1/0.10
= 10. This normal P/E is appropriate if one forecasts cum-dividend earnings
growth of 10%. So, at a P/E of about 10, the market is forecasting cum-
dividend eps growth of 10% per year after the forward year, 2003.
c. As cum-dividend earnings are expected to grow at a rate equal to the cost of
capital, no abnormal earnings growth is forecasted.
d. Forecasted cum-dividend eps for 2004, at 10% growth rate: $1.19 x 1.10 =
$1.309
Earnings of 2003 dividend during 2004: $0.32 x 0.10
0.032

Accrual Accounting and Valuation: Pricing Earnings – Chapter 6 p. 145
Ex-dividend eps, 2004
1.277
Ex-dividend growth rate = 1.277/1.19 = 1.073 (a 7.3% rate)
E6.8 Using Earnings Growth Forecasts to Challenge a Stock Price: Toro
Company
a. With a required return of 10%, the value from capitalizing forward earnings is
Value2002 = $5.30/0.10 = $53
With a view to part d of the question, forward earnings explain most of the current
market price of $55. If one can forecast growth after the forward year, one would be
willing to pay more that $53.
b. First forecast the ex-dividend earnings based of analysts’ growth rate of 12%. Then
add the earnings from reinvesting dividends at 10%.
2003 2004 2005 2006 2007
2008
Eps growing at 12% 5.30 5.936 6.648 7.446 8.340
9.340
Dividends 0.53 0.594 0.665 0.745 0.834
0.934
Dividends reinvested at 10% 0.053 0.059 0.067 0.075
0.083
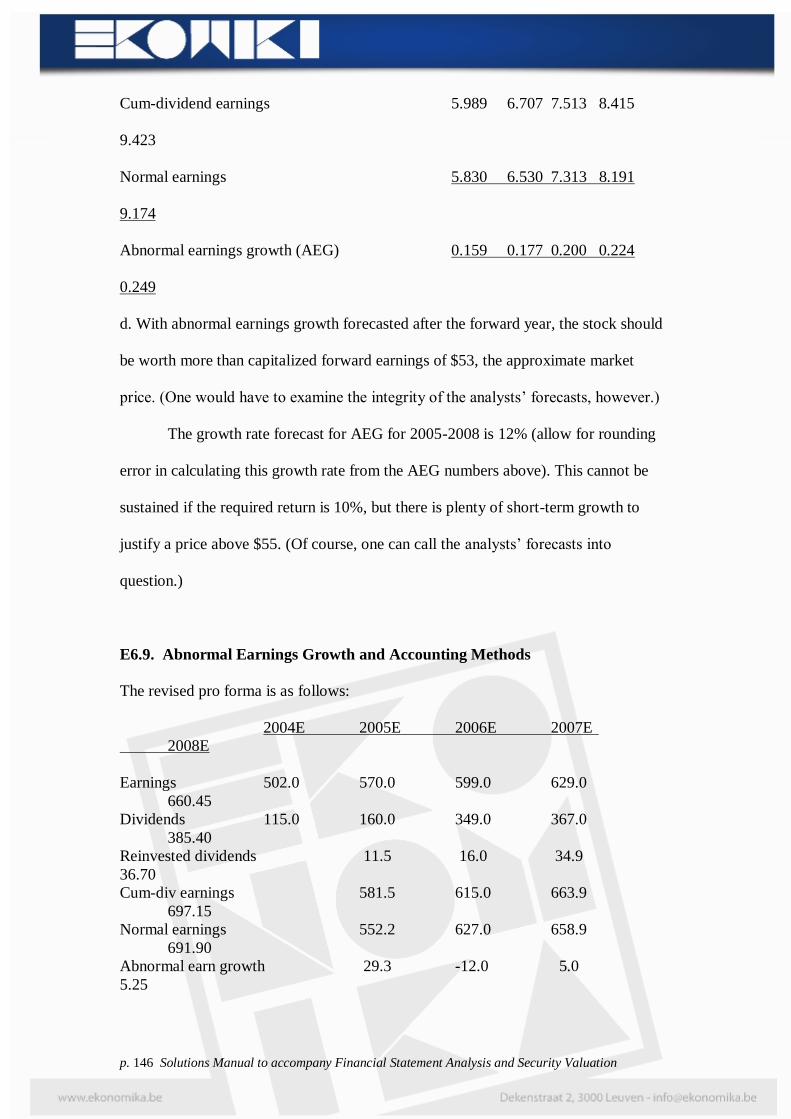
Cum-dividend earnings 5.989 6.707 7.513 8.415
9.423
c. Abnormal earnings growth (AEG) is cum-dividend earnings minus normal growth
earnings. Normal earnings is earnings growing at the required return of 10%:
p. 146 Solutions Manual to accompany Financial Statement Analysis and Security Valuation
Cum-dividend earnings 5.989 6.707 7.513 8.415
9.423
Normal earnings 5.830 6.530 7.313 8.191
9.174
Abnormal earnings growth (AEG) 0.159 0.177 0.200 0.224
0.249
d. With abnormal earnings growth forecasted after the forward year, the stock should
be worth more than capitalized forward earnings of $53, the approximate market
price. (One would have to examine the integrity of the analysts’ forecasts, however.)
The growth rate forecast for AEG for 2005-2008 is 12% (allow for rounding
error in calculating this growth rate from the AEG numbers above). This cannot be
sustained if the required return is 10%, but there is plenty of short-term growth to
justify a price above $55. (Of course, one can call the analysts’ forecasts into
question.)
E6.9. Abnormal Earnings Growth and Accounting Methods
The revised pro forma is as follows:
2004E 2005E 2006E 2007E
2008E
Earnings 502.0 570.0 599.0 629.0
660.45
Dividends 115.0 160.0 349.0 367.0
385.40
Reinvested dividends 11.5 16.0 34.9
36.70
Cum-div earnings 581.5 615.0 663.9
697.15
Normal earnings 552.2 627.0 658.9
691.90
Abnormal earn growth 29.3 -12.0 5.0
5.25

Accrual Accounting and Valuation: Pricing Earnings – Chapter 6 p. 147
Growth rates:
Earnings growth 13.55% 5.09% 5.00%
5.0%
Cum-div earn growth (AEG) 15.84% 7.89% 10.83%
10.83%
Growth in AEG
5.0%
Discount rate 1.100 1.210
PV of AEG 26.64 -9.92
(a) Forecasted earnings for 2004 increase by $114 million, to $502 million,
because of the lower cost of good sold. (This assumes that the write-down has
no effect on forecasted revenues on which forecasts for other years are based:
it is often the case the an inventory write-down means that the firm will have
more trouble selling its inventory.)
(b) The valuation based on the revised pro forma is:
Forward earnings, 2004 502.00
Total present value of AEG for 2005-2006 16.72
(26.64 – 9.92 = 16.72)
Continuing value (CV), 200605.110.1
5
= 100.00
Present value of CV 210.1
0.100 82.64
601.36
Capitalization rate 0.10
Value of the equity10.0
36.601 6,013.6
Value per share on 1,380 million shares 4.36
The valuation is the same at that is Exercise 6.1.
(c) As the additional earnings of $114 million in 2004 will incur a tax of $39.9
million, they will be lower by that amount, that is $462.1 million. However,

p. 148 Solutions Manual to accompany Financial Statement Analysis and Security Valuation
the lower earnings provide a lower base for calculating AEG for 2005, so
AEG in 2005 is higher than that in the pro forma in (a). The net effect is to
leave the valuation unchanged. (This assumes forecasts for other years are
already after tax.)
E6.10. Normal Trailing and Forward P/E Ratios: Whirlpool Corporation
(a) If Whirlpool’s shares are to trade at a normal forward P/E, the pro forma should
show zero expected abnormal earnings after the forward year, 1995. The following
calculations show that 1996 and 1997 abnormal earnings growth, based on the
analyst’s forecasts, is indeed approximately zero:
1996 1997
Eps forecast 5.08 5.44
Dps for 1995 reinvested at 10% 0.128
Dps for 1996 reinvested at 10% 0.134
Cum-dividend eps 5.208 5.574
Normal earnings 5.225 5.588
Abnormal earnings growth -0.017 -0.014
(b) If Whirlpool is to trade at a normal trailing P/E, the pro forma must forecast zero
abnormal earnings growth for 1995 (the forward year) as well as for 1996 and 1997.
This is indeed the case:
Eps forecast for 1995 4.75
Dps for 1994 ($1.22) reinvested at 10% 0.122
Cum-dividend eps for 1995 4.872
Normal earnings (4.43 x 1.10) 4.873
Abnormal earnings growth -0.001
At a market price of $47, Whirlpool actually did trade at (close to) a normal P/E:
Trailing P/E = 88.1043.4
22.147
The normal P/E for a required return of 10% is 11.

Accrual Accounting and Valuation: Pricing Earnings – Chapter 6 p. 149
E6.11. Is a Normal Forward P/E Ratio Appropriate? Maytag Corporation
a. Normal forward P/E for a 10% cost of capital = 1/0.10 = 10.0.
Actual traded forward P/E = $28.80/$2.94 = 9.80.
The firm was trading below a normal P/E, so the market was forecasting
negative abnormal earnings growth after 2003.
b. A five-year pro forma with a 3.1% eps growth rate after 2004 and forecasted
dps that maintains the payout ratio in 2003:
2003 2004 2005 2006 2007
Eps 2.94 3.03 3.12 3.22 3.32
Dps 0.72 0.74 0.76 0.79 0.81
Dps reinvested at 10% 0.072 0.074 0.076 0.079
Cum-dividend earnings 3.102 3.194 3.296 3.399
Normal earnings at 10% 3.324 3.333 3.432 3.542
Abnormal earnings growth -0.222 -0.139 -0.136 -0.143
An AEG valuation based on just these five years of forecasts is:
4641.1
143.0
331.1
136.0
21.1
139.0
10.1
222.094.2
10.0
12002
EV
= $24.23
So, even if abnormal earnings growth were expected to recover to zero after
2007, the current price of $28.80 is too high.
E6.12. Residual Earnings and Abnormal Earnings Growth
The pro forma for the forecast is as follows:
2002 2003 2004 2005 2006 2007
Eps 4.32 5.03 5.58 6.20 6.88
Dps 0.60 0.67 0.74 0.83 0.92
Bps 13.85 17.57 21.93 26.77 32.14 38.10
Reinvested dividends at 12% 0.072 0.080 0.089 0.100
Cum-dividend earnings 5.102 5.660 6.289 6.980
Normal earnings 4.838 5.634 6.250 6.944
Abnormal earnings growth 0.264 0.026 0.039 0.036

p. 150 Solutions Manual to accompany Financial Statement Analysis and Security Valuation
Residual earnings 2.658 2.922 2.948 2.987 3.023
Change in residual earnings 0.264 0.026 0.039 0.036
The answers to parts a, b and c of the question are in the last three lines of the pro
forma.

Accrual Accounting and Valuation: Pricing Earnings – Chapter 6 p. 151
E6.13. Normal P/E Ratios
The normal trailing P/E ratio is returnequity required
returnequity required1
The normal forward P/E is the trailing P/E – 1.0
The schedule for the trailing P/E is as follows. Subtract 1.0 to get the forward P/E.
8% 13.50
9% 12.11
10% 11.00
11% 10.09
12% 9.33
13% 8.69
14% 8.14
15% 7.67
16% 7.25
E6.14. Calculating an Intrinsic P/E Ratio: Maytag Corporation
The pro forma from the forecast develops as follows:
1993A 1994A 1995E 1996E 1997E 1998E
Eps 1.40 1.55 1.65 1.76 1.88
Dps 0.50 0.56 0.59 0.63 0.69
Bps 5.50 6.82 7.81 8.87 10.00 11.19
0.86 0.87 0.87 0.87 0.88Residual earnings (10%)
Abnormal earnings growth 0.00 0.00 0.00

p. 152 Solutions Manual to accompany Financial Statement Analysis and Security Valuation
This pro forma uses a growth rate in (ex-dividend) eps of 7% after
1996 (mid-point of the range given by the analyst). The dividend is forecasted
to maintain the 1995 payout of 36% of earnings.
In this pro forma, abnormal earnings growth is calculated as the change
in residual earnings (as it always must be).
(a) As abnormal earnings growth is forecasted to be zero after the forward
year (1995), the P/E must be normal. For the required equity return of
10%, the normal P/E is 10.0
1 = 10. The value of the equity at the end
of 1994 is:
Value of equity = $1.55 x 10
= $15.50
(b) The P/E is normal for a 10% required equity return.
(c) Expected earnings must grow cum-dividend at the required return of
10%.
Accrual Accounting and Valuation: Pricing Earnings – Chapter 6 p. 153
Minicases
M6.1. Borders Group: Reverse Engineering with Earnings Forecasts
Introduction
This case asks the student to test a market price with little information: just two years
of earnings forecasts. So, with no forecasts for subsequent years, the valuation is
going to be incomplete. However, students should be impressed about how far one
can get in answering the question.
The case demonstrates the mechanics of using the abnormal earnings growth
model and the use of reverse engineering in investing.
Working the Case
The forward P/E is 17/1.28 = 13.3. So the question is one of asking whether a
forward P/E of 13.3 is appropriate. That question turns on whether subsequent growth
beyond 2002 warrants a forward P/E of 13.3. The normal forward P/E for a cost of
capital of 10% is 1/0.10 = 10, so we have so see some abnormal earnings growth to
justify a P/E of 13.3. Alternatively stated, we have to see (cum-dividend) earnings
growth at a rate greater that the cost of capital of 10%.
With only two years of earnings forecasts, we do not know analysts’ earnings
growth rate into the future. But we can apply reverse engineering techniques and ask
what growth rate is required for a price of $17.
First calculate abnormal earnings growth (AEG) for 2003:
2001 2002 2003
Price 17
Earnings Forecast 1.28 1.44
Normal Earnings, 2003: 1.28 1.10 1.408
Abnormal earnings growth, 2003 0.032
Normal earnings for 2003 is 2002 earnings growing at 10%. Cum-dividend earnings
for 2003 is the forecasted earnings (with no reinvestment of dividends) because
p. 154 Solutions Manual to accompany Financial Statement Analysis and Security Valuation
Borders pays no dividends. AEG is the difference between earnings and normal
earnings. Note that AEG could have been calculated as cum-dividend earnings growth
minus normal earnings growth, that is, as (1.44 – 1.28) – 1.28 x 0.10 = 0.032.
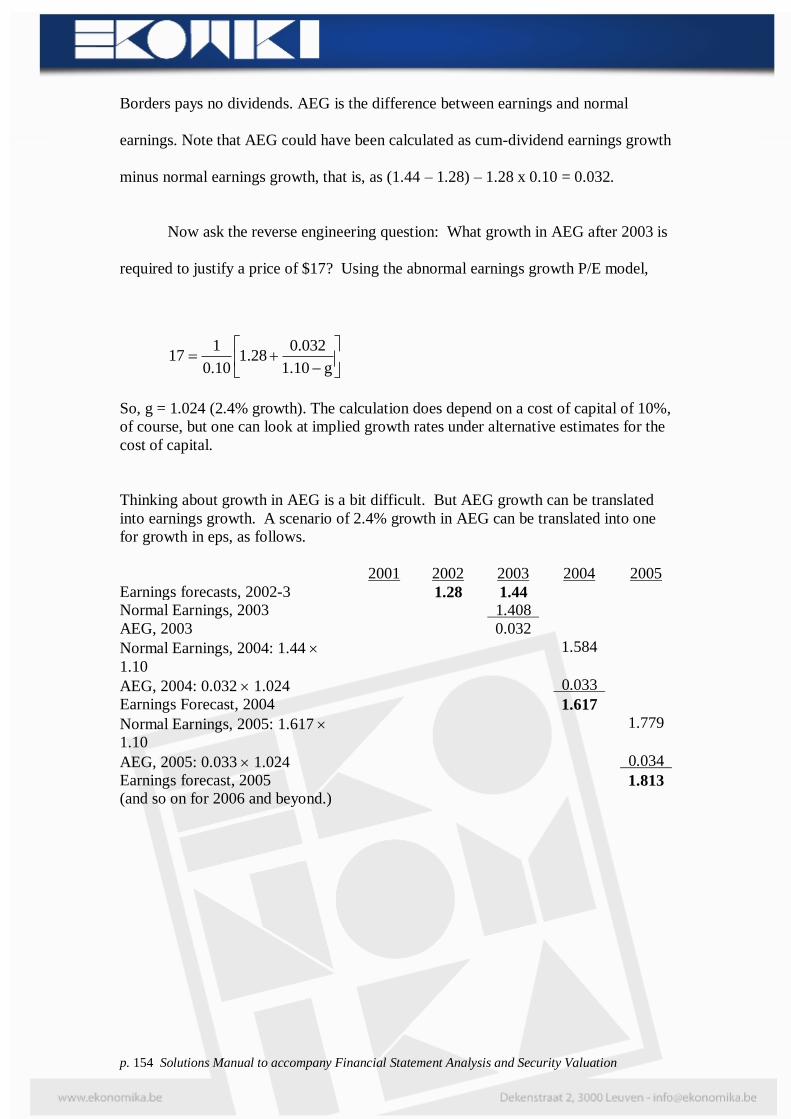
Now ask the reverse engineering question: What growth in AEG after 2003 is
required to justify a price of $17? Using the abnormal earnings growth P/E model,
g10.1
032.028.1
10.0
117
So, g = 1.024 (2.4% growth). The calculation does depend on a cost of capital of 10%,
of course, but one can look at implied growth rates under alternative estimates for the
cost of capital.
Thinking about growth in AEG is a bit difficult. But AEG growth can be translated
into earnings growth. A scenario of 2.4% growth in AEG can be translated into one
for growth in eps, as follows.
2001 2002 2003 2004 2005
Earnings forecasts, 2002-3 1.28 1.44
Normal Earnings, 2003 1.408
AEG, 2003 0.032
Normal Earnings, 2004: 1.44
1.10
1.584
AEG, 2004: 0.032 1.024 0.033
Earnings Forecast, 2004 1.617
Normal Earnings, 2005: 1.617
1.10
1.779
AEG, 2005: 0.033 1.024 0.034
Earnings forecast, 2005 1.813
(and so on for 2006 and beyond.)

Accrual Accounting and Valuation: Pricing Earnings – Chapter 6 p. 155
The numbers in bold here are the earnings forecasts for future years.
2002 2003 2004 2005
Earnings Forecasts 1.28 1.44 1.62 1.81
The question of whether $17 is a reasonable price is answered by asking whether
these eps forecasts are reasonable: can you justify eps growth from 1.28 in 2002 to
1.81 in 2005? Note that the implied growth in (cum-dividend) eps is 12.5% per year,
compared with a 10% normal growth for the cost of capital.
The analysis in Parts II and III of the book is designed to forecasts growth rates. The
analysis here is one that can be applied in absence of any further analysis.
Taking the Case a Bit Further
You may choose to introduce the alternative form of the AEG model developed in the
later chapter on P/E ratios.
If one expects AEG to grow at a constant rate from year 2 ahead onwards, the
model is
gρ
AEGEarn
1ρ
1V
E
21
E
0E
as stated above. This can be restated as
gρ
gg
1ρ
EarnV
E
2
E
10E
where g is, as before, one plus the long-term growth rate of AEG and g2 is one plus
the growth rate forecasted for cum-dividend eps in year 2 ahead. For Borders,
analysts’ expected growth rate for eps in year 2 (2003), g2, is 1.44/1.28 = 1.125
(12.5%). So, for a 2.4% long-term AEG growth rate, the $17 price for Borders can be
calculated as:

p. 156 Solutions Manual to accompany Financial Statement Analysis and Security Valuation
17$
024.110.1
024.1125.1
10.0
28.1VE
2000
So the model can be seen as building in a short-term growth rate (g2) and a
long-term growth rate, g. Often short term expected growth rates are high and not
indicative of long-term growth. But one wants to value short-term growth as well as
long-term growth. Firms with high expected growth in the short term should be
valued higher, for the same long-term growth. So, think of this variant of the model
as forecasting a short-term growth rate, but recognizing that the short-term growth
typically falls off to a long-term level. What might that long-term level be? Well, a
starting point is typical growth in GDP (4%), or typical growth for the industry.
M6.2. Dell Computer Corporation: Pricing Earnings Forecasts with
Sensitivity Analysis
Accrual Accounting and Valuation: Pricing Earnings – Chapter 6 p. 157
Introduction
This short case applies reverse engineering and introduces sensitivity analysis.
Intrinsic
value calculations are not precise exercises – we cannot get the true intrinsic value.
Valuation models develop approximations. But the models can be utilized to
understand our uncertainty a little better. Sensitivity analysis is the tool. Typically we
are most uncertain about long-run growth rates and the cost of capital. Sensitivity
analysis yields valuations for different estimates of long-run growth and the cost of
capital. If the price falls out of the bounds of reasonable estimates for these two
inputs, we are more confident that the stock is mispriced.
We develop sensitivity analysis further is later chapters. This case is an
introduction.
Working the Case
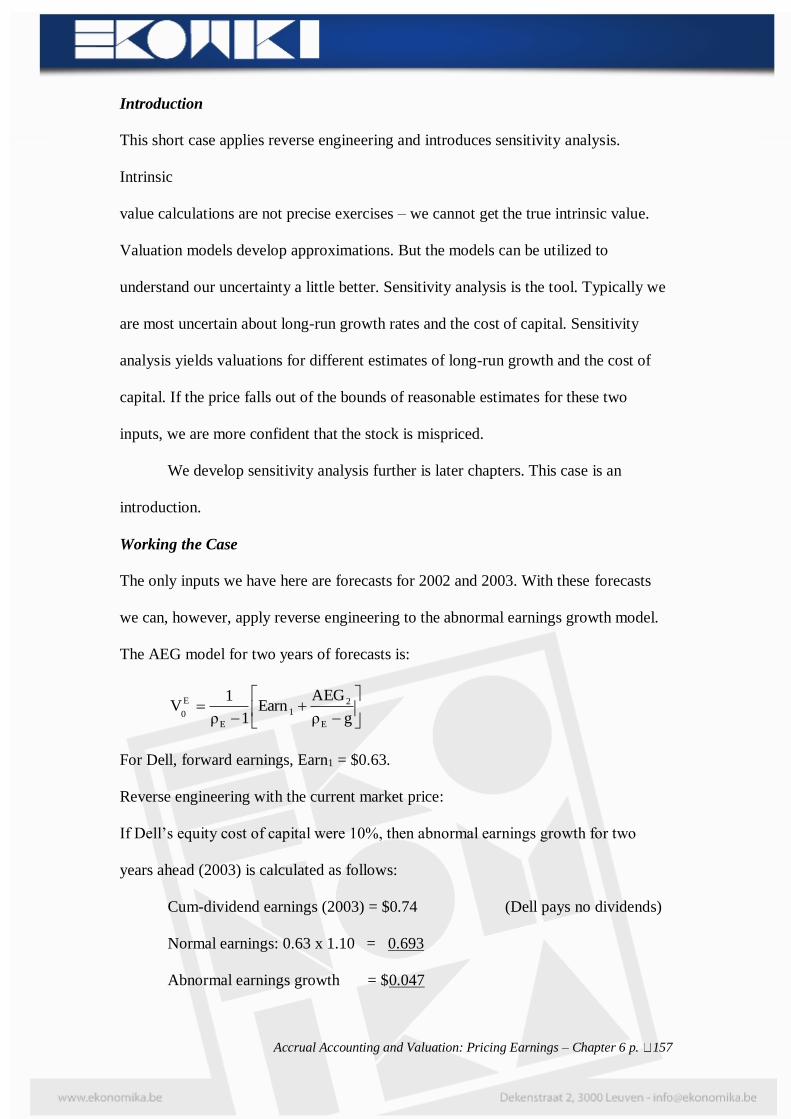
The only inputs we have here are forecasts for 2002 and 2003. With these forecasts
we can, however, apply reverse engineering to the abnormal earnings growth model.
The AEG model for two years of forecasts is:
gρ
AEGEarn
1ρ
1V
E
21
E
E
0
For Dell, forward earnings, Earn1 = $0.63.
Reverse engineering with the current market price:
If Dell’s equity cost of capital were 10%, then abnormal earnings growth for two
years ahead (2003) is calculated as follows:
Cum-dividend earnings (2003) = $0.74 (Dell pays no dividends)
Normal earnings: 0.63 x 1.10 = 0.693
Abnormal earnings growth = $0.047
p. 158 Solutions Manual to accompany Financial Statement Analysis and Security Valuation
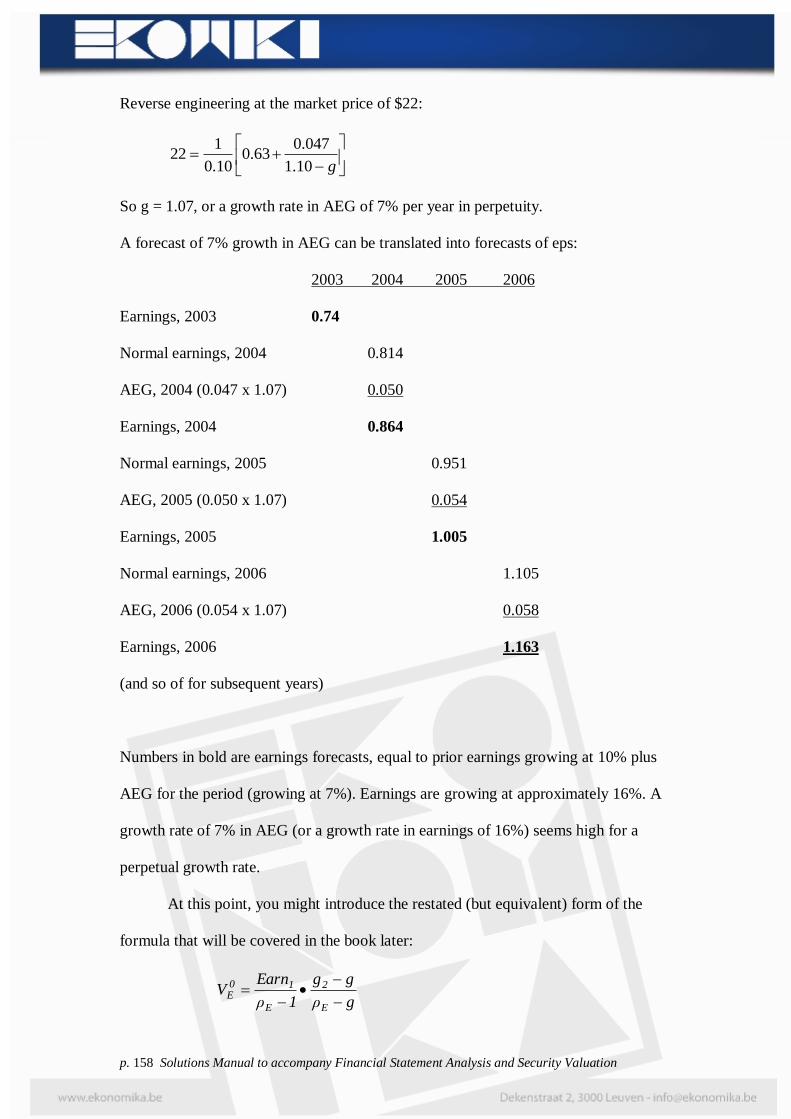
Reverse engineering at the market price of $22:
g10.1
047.063.0
10.0
122
So g = 1.07, or a growth rate in AEG of 7% per year in perpetuity.
A forecast of 7% growth in AEG can be translated into forecasts of eps:
2003 2004 2005 2006
Earnings, 2003 0.74
Normal earnings, 2004 0.814
AEG, 2004 (0.047 x 1.07) 0.050
Earnings, 2004 0.864
Normal earnings, 2005 0.951
AEG, 2005 (0.050 x 1.07) 0.054
Earnings, 2005 1.005
Normal earnings, 2006 1.105
AEG, 2006 (0.054 x 1.07) 0.058
Earnings, 2006 1.163
(and so of for subsequent years)
Numbers in bold are earnings forecasts, equal to prior earnings growing at 10% plus
AEG for the period (growing at 7%). Earnings are growing at approximately 16%. A
growth rate of 7% in AEG (or a growth rate in earnings of 16%) seems high for a
perpetual growth rate.
At this point, you might introduce the restated (but equivalent) form of the
formula that will be covered in the book later:
gρ
gg
1ρ
EarnV
E
2
E
10E

Accrual Accounting and Valuation: Pricing Earnings – Chapter 6 p. 159
The short-term growth rate, g2 is growth in two-year ahead cum-dividend earnings
from
one year ahead. For Dell this is 0.74/0.63 = 1.1746, a 17.5% growth rate. Thus, for a
7% long-term growth rate for AEG of 7%,
07.110.1
07.1175.1
10.0
63.02001
EV
= $22
Sensitivity analysis
Sensitivity analysis calculates values for different estimates of the cost of capital and
growth rates. The analyst inputs all conceivable estimates, to get bounds on a
valuation, but in his own mind weights those he feels are more reasonable. If a 7%
growth rate is high to him and the required return is no less than 10%, he puts $22 at
the top end of the range of estimates, so puts the stock into a “maybe sell” category
rather than a “strong buy.”
The calculations for the sensitivity analysis are much easier if you use the
restated form of the model above, for then you do not have to recalculate the AEG for
changes in the cost of capital. Forward earnings of $0.63 for Dell and the two-year
ahead growth rate of 17.5% are the same in each calculation.
Here are valuations of Dell for different costs of capital and growth rates:
Cost of Capital Growth Rate
_______________________________________
0.0% 2.0% 4.0% 5.0% 6.0% 7.0%
9.0% 13.61 15.50 18.90 21.88 26.83 36.75
10.0 11.03 12.21 14.18 15.75 18.11 22.05
11.0 9.11 9.86 11.05 11.93 13.17 15.03
p. 160 Solutions Manual to accompany Financial Statement Analysis and Security Valuation
You see that the current price can be supported if the cost of capital is around 9% and
the growth rate is 5%; or if the cost of capital is 10% and the growth rate is 7%. If we
were to forecast a long-term growth rate of 4%, equal to the typical GDP growth rate,
the value is $18.90 per share for a cost of capital of 9%, less for a higher cost of
capital. If we use the CAPM to estimate a cost of capital, it would be 10.2% with the
risk-free 5-year rate at the time of 4.2% and a 6% market risk premium. So you see
how one plays with different scenarios to get a feel for the reasonableness of the
valuation.
Looking at this grid, the analyst might conclude that $22 is expensive for this
stock. She might prepare a grid for many stocks and decide which stocks to tilt her
portfolio towards, or which to avoid (or sell). That is, she would weight stocks in a
portfolio according to the information from these grids.
The validity of this analysis depends, of course, of the reliability of analysts’
forecasts for the two years ahead. The forecasts here are consensus forecasts over a
number of analysts. One could potentially expand the grid for the spread of analysts’
forecasts around the consensus.
Of course, one could also do some pro forma financial statement analysis and
model the future of the firm, and so produce ones own forecasts and long-term growth
rates. This is the topic of Parts Two and Three of the book.
Extensions
Give Dell’s current share price to students, along with consensus forecasts for the next
two years (from Yahoo Finance Research page for Dell, for example), and ask them to
challenge the current price. Also give them the 5-year eps growth rate that analysts
are forecasting to see if a reverse engineering like that above yields the growth rate
that analysts are forecasting.

Accrual Accounting and Valuation: Pricing Earnings – Chapter 6 p. 161
M6.3 Should Cendant Corporation Buy Back its Own Shares?
Introduction
This case is designed to show the student how one can get a good rough cut at a
valuation from the little information supplied. It also touches on the issue (raised in
Chapter 3) of how (and when) share repurchases generate value for shareholders You
might work the short exercises, E3.11 and E3.12 in Chapter 3 as an introduction to
this case.
The Information in the Case
Bps(2001) $8.61
Eps(2001) $0.42
Dps(2001) $0.00

p. 162 Solutions Manual to accompany Financial Statement Analysis and Security Valuation
Forward Eps (2002) $1.27
Two-year forward eps (2003) $1.59
Price per share, October, 2002 10.00
Price-to-book 1.16
Trailing P/E (10.00/0.42) 23.8
Forward P/E (2002) (10.00/1.27) 7.9
Forward P/E (2003) (10.00/1.59) 6.3
Question A
The benchmark rule for stock repurchases says that repurchases at fair value do not
generate value for shareholders. The following example demonstrates.
Cendant had 1,040 million shares outstanding in October, 2002 with a market
capitalization (at $10 per share) of $10.4 billion. Suppose the $10 per share is a fair
value (intrinsic value). If Cendant buys back 100 million shares at $10 each, market
capitalization falls to $9.4 billion. But as there are now only 940 million shares
outstanding, the value per share is still $10. The share repurchase had not added value
to holding a share.
In discussing this benchmark case, note the following:
Students might note that share repurchases increase earnings per share
and earnings growth (as commentators argue). They might then imply
that higher eps and eps growth warrant higher valuations. Stock
repurchases do indeed increase eps and eps growth, but the effect is a
leverage effect that does not add value, (although commentators argue
otherwise). This is demonstrated in Chapter 13. The reasoning: the
required return increases to reflect the increase in leverage, leaving
value unchanged even though higher eps is forecasted.

Accrual Accounting and Valuation: Pricing Earnings – Chapter 6 p. 163
Stock repurchases might function as a signal (of inside information
about higher value), and so will increase the stock price. But this can
only be the case if management buys back stock when it is
undervalued: the signal is a signal that management thinks the stock is
underpriced.
Stock repurchases may be desirable if the firm does not have
investment projects in which to invest. Rather than investing excess
cash in T-bills, a zero value-added investment, pass it out to
shareholders who may have better investment opportunities. See the
Chrysler case in Chapter 5. Note that, in this case, stock repurchases
could be a “signal,” but a negative signal: the firm does not have
investment opportunities.
Stock repurchases at fair value do not add value, but stock repurchases at less
than fair value do. Shareholders can buy the stock cheaply, but so can the firm on
their behalf. So, Cendant might buy back its own stock if indeed it feels that, at $10
per share, its stock is underpriced. Question 2 of the case investigates.
An historical note: Stock repurchases at prices greater than fair value destroy
shareholder value (by the same argument). During the stock market bubble of the
l990s, there were many large stock repurchases, financed by borrowings. Stock prices
were high (as any rough calculation of fair value would have indicated), so value was
destroyed for shareholders. The legacy for many firms was a high debt load (from the
borrowings) that became difficult to service in 2001-03. Share issues (to raise cash to
buy down the debt) became problematical because share prices were much lower (and
firms should not issue shares when they are underpriced!). Firms resorted to assets

p. 164 Solutions Manual to accompany Financial Statement Analysis and Security Valuation
sales to get cash, so upsetting their ability to generate value from operations. Share
repurchases of overpriced stock indeed destroys value.
Question B
Challenge the current price of $10 using the valuation frameworks in Chapters 5 and
6.
The following pro forma incorporates the information in the case and also forecasts
residual earnings and abnormal earnings growth. A 12% required return for Cendant’s
equity is used:
2001A 2002E 2003E
Eps 0.42 1.27 1.59
Dps 0 0 0
Bps 8.61 9.88 11.47
Residual Earnings (RE) 0.2368 0.4044
Abnormal Earnings Growth (AEG) 0.167
The residual earnings calculation for 2002E is:
RE2002 = $1.27 – (0.12 x 8.61) = $0.2368
The residual earnings calculation for 2003E is:
RE2003 = $1.59 – (0.12 x 9.88) = $0.4044
The abnormal earnings growth calculation for 2003E is:
Cum-dividend earnings growth (1.59 – 1.27) = 0.320 (there are no
dividends)
Normal earnings growth (1.27 x 0.12) = 0.153
AEG2003 0.167
The 12% required return is used judiciously. With the (risk-free) rate on 10-year US
Treasuries of 3.61% at the time, a 12% rate ascribes a risk premium of 8.39% to

Accrual Accounting and Valuation: Pricing Earnings – Chapter 6 p. 165
Cendant’s equity, a hefty amount. So we are probably overstating the required return.
Accordingly, an estimated price (as below) is biased downwards; we are getting a
floor valuation. With a lower required return we would estimate a higher price. This
suits our purpose, for we are testing whether the $10 price is too low, so need a
number for which we can say that the value is at least that number.
Challenging the price with residual earnings methods
The traded P/B ratio is 1.16. Does the information here indicate that this P/B is too
low?
The pro forma shows that growth in RE is expected from 2002 to 2003. Suppose that
one expected no growth in RE after 2002, that is, RE is forecasted to be constant from
2002 onwards, rather than growing.. The RE valuation would then be
V2001 = Book Value2001 + RE2002 capitalized as a perpetuity
So,
58.10$12.0
2368.061.82001 V
That is, on the assumption of no growth in RE, the stock is worth more than $10. And
this is a valuation where we are charging a high required return (of 12%). If we
charge 10% as a required return, the value is $12.40. Based on the pro forma that
indicates growth, the stock is cheap.
We have to be careful, of course, for we have only a 2-year pro forma. But we
have focused our questioning: to argue that $10 is too expensive, we have to forecast
a considerable decline in residual earnings after 2003.
Challenging the price with abnormal earning growth methods
With a required return if 12%, the stock is worth a normal forward P/E of 1/0.12 =
8.33 if we expect no abnormal earnings growth (AEG) after the 2002 forward year.
The traded forward P/E is 7.9, so the market is implicitly forecasting negative AEG
p. 166 Solutions Manual to accompany Financial Statement Analysis and Security Valuation
after 2002. But the pro forma indicates positive (and substantial) AEG for 2003. Put
another way, capitalizing forward earnings at 12%, the estimated value is $1.27/0.12
= 10.33, more than the actual price of $10 and, in addition, analysts see AEG of 0.167
in 2003 that adds further value.
Further, these calculations use a high required return. If the required return is
10%, the value from forward earnings is $1.27/0.10 = $12.70 and there is extra value
from AEG is 2003 of $0.320 – (0.10 x 1.27) = $0.193.
To suggest that the stock is fairly (or overpriced) one would have to forecast
considerable negative AEG in years 2004 and beyond.
Accrual Accounting and Valuation: Pricing Earnings – Chapter 6 p. 167
Question C
The PEG ratio is the ratio of the forward P/E (for 2002 here) to the subsequent one-
year forecasted growth rate (for 2003):
2003
2002/
Growth
EPPEG
So, with a 2003 eps growth rate of 1.59/1.27 – 1.0 = 25.2%,
PEG = 7.9/25.2 = 0.31
This is low against the benchmark of 1.0. The PEG suggests that the P/E of 7.9 is
undervaluing subsequent growth. But, we have to be careful. The P/E evaluates long-
term growth, and the 2003 growth rate may not continue. At the time, analysts were
forecasting a five-year growth rate of 14%. With this rate in the denominator, the PEG
ratio is still only 0.56.
Using Analysts Forecasts
Using both the RE and AEG approaches, we establish a case for underpricing
by the market (and a case for a stock repurchase). However, we have based our
analysis on sell-side analysts’ consensus forecasts and our analysis is only as good as
those forecasts. If we doubt those forecasts, we have a doubtful analysis. We might
then substitute our own forecasts (developed after further analysis in the book).
One must always be concerned about the quality of sell-side analysts’
forecasts. After all, they come for free and what comes for free must be questioned.
During the bubble, there was strong suspicion of bias in these forecasts, brought on by
over enthusiasm (at best) and deliberate misleading of retail investors (at worse) in the
pursuit of investment banking clients.
One could add further information to an analysis like the one here by bringing
in the 3- or 5-year eps growth rates that analysts forecast. In 2002, analysts were
forecasting a 5-year eps growth rate of 14% for Cendant. As the firm pays no

p. 168 Solutions Manual to accompany Financial Statement Analysis and Security Valuation
dividends, this is the cum-dividend growth rate. Even with a required return of 12%,
this rate is excess of the required rate, so further AEG is forecasted for 2004 onwards
(further reinforcing the impression that the shares are underpriced at $10). But, these
“long-term” growth rates are often not very reliable, so should be treated with care.

Accrual Accounting and Valuation: Pricing Earnings – Chapter 6 p. 169
M6.4. Evaluation of an Equity Research Report on Kmart
Corporation
Evaluate an equity research report in three steps:
1. Ask what the analyst is relying on to make the recommendation. What is
his “model”? Is it a good basis for assessing the worth of a stock?
2. Ask whether the recommendation follows from the analysis particularly
from the forecasts that have been made.
3. Ask whether the analysis is logically consistent. Are “good analysis”
principles violated?
An analysts’ task is to develop forecasts (of payoffs) and then to make
inferences about the valuation from the forecasts. Some analysts are good at
forecasting, but not at converting the forecast to a valuation and a recommendation.
Yet others are good at gathering information about a firm, but not at converting the
information to a forecast. And others feel very strongly about a recommendation, but
don’t support the recommendation with detailed information gathering or forecasting.
Always ask: What is the model in the analyst’s mind in getting a valuation? A
poor research report will not give you a clear answer to this question.
The Kmart report is a case in point.
1. What is the analyst relying on to make the recommendation?
The forecast of the P/E ratio is central to the recommendation. But there is no
apparent model behind the P/E. The analyst refers to the average P/E he sees for
other discount retailers. But is this average multiple justified? He has just introduced
the method of comparables (and we have seen the dangers of this in Chapter 3). He
does not indicate at all how one arrives at the correct P/E, or even if he understands

p. 170 Solutions Manual to accompany Financial Statement Analysis and Security Valuation
what a P/E is. And, we see below, his estimate of the P/E is inconsistent with his
other forecasts.
2. Does the recommendation follow from the analysis?
The current price is $17 per share. Based on the analyst’s forecast of eps of
$1.41 in 2001, a forecasted P/E of 20 in 2001 gives a forecasted 2001 price of $28.20.
So, the stock return that he is forecasting over two years (on the current price
of $17) is:
Anticipated stock return = 17.0
17.0 - 28.20
= 65.9% return
The required return over two years (at 12% p.a.) is 25.4%, so this forecast does indeed
imply a BUY. But is the analysis sound?
3. Is the analysis logically consistent?
(a) The analyst forecasts a P/E of 20 for 2001, yielding a forecasted price
of $28.20, but forecasts a P/B ratio of 1.38, yielding a forecasted price (on a
forecasted bps of $15.43) of $21.30. The two prices differ. The $21.30 price implies
anticipated return of
Anticipated return = 17.0
17.0 - 21.30 = 25.3%,
which is the required two-year return. A HOLD is implied.
(b) The bps forecasts are incorrect given the eps forecasts. It must
be that bps (2000) = bps (1999) + eps (2000) – dps (2000). As
there are no dividends (and the shares outstanding numbers
indicate there are no anticipated stock issues or repurchases),
bps (2000) = 12.12 + 1.23 = 13.35
Accrual Accounting and Valuation: Pricing Earnings – Chapter 6 p. 171
and
bps (2001) = 13.35 + 1.41 = 14.76
If the forecasted P/B ratio in 2001 is applied to this correct number, price in
2001 is $20.37. This price implies a SELL.
(c) The analyst forecasts earnings to grow at 6% per year after 2001. (We
will see later in the book that) when earnings are forecasted to grow at less than the
required return, the earnings yield is greater than the required return and the P/E is
less than the inverse of the required return. The intuition is that, if the firm is to grow
earnings at less than the required return on price, the price will be lower per dollar of
earnings than if it were to grow at the required return. So, as the required return is
12%, the E/P should be greater than 12% and the P/E should be less than 9.33. So the
analyst’s P/E forecast of 20 is inconsistent with his earnings forecast.
(d) The recommendation is inconsistent with the forecast of free cash flow
growing at 6%:
DebtFCFin growth -return required
2000for flowcash FreeVE
1999
= 706,26% - %12
06.1632
= $8,459 or $17.14 per share (on 493.4 million shares)
With the current price at $17, this calculation implies a HOLD.
A cost of capital of 12% is assumed here for simplicity. A cost of capital for
operations should be calculated (see Chapter 13).
(e) An analysis of forecasted earnings yields implies a SELL:
Two-year yield = %53.1517.00
1.41 23.1

p. 172 Solutions Manual to accompany Financial Statement Analysis and Security Valuation
(Note: there are no dividends to reinvest.) This is less than the required two-year
return of 25.4%. So, SELL. Adding additional years of earnings (growing at 6%)
will not change this conclusion. The conclusion will change if the anticipated change
in premium is incorporated using the price in 2001 from the forecasted P/E of 20. But
not by using the forecasted P/B (applied to the bps) in 2001.

Accrual Accounting and Valuation: Pricing Earnings – Chapter 6 p. 173