the valuation of earnings components by the capital
TRANSCRIPT

Documento de Trabajo 2003-02
Facultad de Ciencias Económicas y Empresariales
Universidad de Zaragoza
The Valuation of Earnings Components by The Capital Markets. An International Comparison
Susana Callao Gastón, Beatriz Cuéllar Fernández, José Ignacio Jarne Jarne and
José Antonio Laínez Gadea
Department of Accounting and Finance, University of Zaragoza
Abstract. Over the last decade we have witnessed an increasing process of globalisation in economic activity, in which the capital markets have inevitably been involved. Against this background, this paper presents a comparative study of the relevance of earnings and their components (operating, financial and extraordinary income) in 36 countries that are representative of different regions, levels of market development, accounting systems, etc.
The results of our research confirm those obtained from earlier studies, providing evidence of the relevance of earnings figures for valuation purposes, regardless of the market analysed. Nevertheless, the importance of this information differs between countries.
We have also established that the disaggregation of earnings into the component parts of the income statement provides the investor with incremental information regarding the market value of the company in question.
Keywords: capital markets, accounting information, value relevance, international comparison.
JEL Classification: G10, M41.
Address: Beatriz Cuéllar Fernández. Departamento de Contabilidad y Finanzas. Facultad de Ciencias Económicas y Empresariales. Universidad de Zaragoza. Gran Vía, 2, 50005 Zaragoza. España. Tfno.: 976 761000 Ext. 4634. Fax: 976 761769. E-mail: [email protected]

DTECONZ 2003-02 S. Callao, B. Cuéllar, J.I. Jarne and J.A. Laínez
1
1. Introduction
The relevance of accounting disclosures to the formation of share prices is a field of
study that has attracted great interest from moment accounting research first began to
focus on capital markets1. From the early days to the present, numerous efforts have
been made to explain the relationship between share prices (or returns) and accounting
earnings (or changes in earnings) and define the key factors involved.
One approach seeks to improve the explanatory power of the econometric models
used for the empirical analysis of this relationship by disaggregating earnings figures
into their component parts.
Since the pioneering work of Lipe (1986), numerous components have been
proposed as deserving analysis. Thus, disaggregation has been based on the persistence
or transience of earnings (Booth et al. 1997), differentiation between cash flows and
accruals (Livnat and Zarowin, 1990 and McLeay et al., 1997), and on the various parts
of the income statement.
In the latter case, the components defined are sometimes specific lines, such as
pension costs, general and administration expenses, depreciation, etc. (Barth et al., 1992
and Wild, 1992, among others), or the different levels of earnings, differentiating
between ordinary and extraordinary items, net income, sales revenues, etc. (Strong and
Walker, 1993, Booth et al., 1997 and Giner and Reverte, 1999).
In general, the evidence obtained from such research indicates that not all earnings
components explain prices and price movements to the same extent, while
disaggregation provides investors with incremental information relevant for the
purposes of company valuation.
At the international level, it can be clearly seen how the existence of characteristic
financial disclosure requirements in different countries affect the relevance of the
information to the markets. Thus, Ali and Hwang (2000) note that the significance of
earnings components is lower in countries where business is largely financed by banks
(as opposed to the stock market), the private sector has little say in accounting
regulation, tax issues have a major impact on accounting policy and external audit costs
are low. Clearly, these features (particularly the first three) distinguish continental
European accounting models from those of the English-speaking world (USA and UK). 1 A review of research in the field is to be found in Kothari (2001).

DTECONZ 2003-02 S. Callao, B. Cuéllar, J.I. Jarne and J.A. Laínez
2
The existence of differences between accounting systems is an obvious fact, and is
widely documented in the international literature. These are the result of the diversity of
economic and financial environments in which the process of preparing and interpreting
business information takes place. Numerous factors affect this environment, though the
most significant are related with the political and legal system, the providers of finance,
national bias, business organisation, the development of stock markets, cultural factors,
users, the tax structure and the state of the accounting profession2.
Although the impact of these factors on the development of financial disclosure has
largely been examined “a priori”3, it is evident that the specific form taken by
accounting requirements in different countries and regions is a factor to be taken into
account in any analysis of the relevance of such information to users and, in particular,
to the stock markets.
In this context, a number of studies have been carried out over the last decade with
the objective of making a comparative analysis of the relevance of accounting
disclosures to the capital markets in different geographical regions. Once again,
attention has largely focused on the earnings variable.
Representative contributions in this field include papers by Pownall (1994) and
Hall et al. (1994) for the United States and Japan, Alford et al. (1993), whose research
covered 17 countries, and Ball et al. (1997), who group the countries included in their
study depending on whether they use an Anglo-American or continental European type
accounting system.
Work confined to a strictly European scope includes papers by Joss and Lang
(1994), who consider the markets of Germany, France and the United Kingdom, and a
study of 11 European Union countries by García-Ayuso et al. (2000).
The main conclusion to be drawn from this body of research is that the reaction of
share prices and stock market returns to accounting information continues to differ
substantially despite the increasing interdependence of national capital markets. Indeed,
2 This can be appreciated in the main work published in this field, such as Belkaoui (1985),
Amenkhienan (1986), Nobes and Parker (1991b), AlNajjar (1992), Choi and Mueller (1992), Radebaugh and Gray (1993) and Doupnik and Salter (1995).
3 Empirical studies analysing this impact do, however, exist. Research includes papers by Choi (1974), Frank (1979), Amenkhienan (1986), Belkaoui and Picur (1991), Salter and Doupnik (1992) and Laínez and Jarne (1999).

DTECONZ 2003-02 S. Callao, B. Cuéllar, J.I. Jarne and J.A. Laínez
3
such differences persist even between countries that have undergone harmonisation of
accounting disclosures, as is the case in the EU.
In view of the relevance of accounting earnings to market price formation and the
impact of environmental factors on the process, as explained above, we believe it is
necessary to build up the explanatory power of this variable at the international level.
Our current work takes this approach, and this paper presents a comparative study
of the relevance of earnings and their components in 36 countries that are representative
of different regions, levels of market development, accounting and legal systems,
cultural traits, economies, etc.
This work has a threefold objective:
- to analyse whether the relevance of net income on price formation is comparable
in the various markets considered in the study,
- to assess whether earnings figures provide investors with incremental
information based on the disaggregation of components, and
- to test whether the main components into which earnings may be broken down
affect prices to the same extent.
By achieving these objectives, we are able to throw light on investors’ perception of
the importance of specific accounting information in a wide range of countries, many of
which have never before been included in studies of this kind. At the same time, our
comparative analysis reveals whether investors hold similar perceptions of the relevance
of earnings and their main components, and respond in a similar manner at the
international level.
In the following section, we describe the sample, working hypotheses and models
employed in the study. The subsequent three sections present our results in relation to
each of the three objectives referred to above. Finally, we present our main conclusions
and findings.
2. Empirical Design
Sample
The sample used has been taken from the WORLDSCOPE® data base. We have
selected those countries for which accounting and stock market data were available for

DTECONZ 2003-02 S. Callao, B. Cuéllar, J.I. Jarne and J.A. Laínez
4
at least 50 local companies listed on national stock markets during the period 1995 to
1999.
On this basis, we identified 36 countries in various geographical regions4, with
different levels of economic development (despite the predominance of industrialised
nations, other countries with a lower level of development are also included such as
Chile, India, Indonesia, Malaysia and Turkey), accounting systems (from typically
Anglo-American models such as those used in the United States, United Kingdom and
Australia to eminently European models as in the case of France, Germany and Spain),
and levels of stock market development (from emerging markets, as in Central Europe
and certain Asian countries, to highly developed markets, starting with the United
States).
The final sample comprises a total of 77,255 observations. New Zealand is the
country with the smallest quantity of data (245 observation) with the United States at
the opposite extreme (25,540 observations).
Hypotheses and methodology
In order to cover the objectives referred to above, we have defined the following
null hypotheses:
H01: Net income for the year are not relevant to securities market price formation.
H02: The disaggregation of net income for the period does not provide a better
overall explanation of share prices.
H03: The components of net income for the year are not relevant to securities
market price.
These hypotheses are examined for the sample companies in each country
considered on an individual basis. We have also performed a comparative analysis of
results for each country in order to draw conclusions as to the relevance of accounting
information at the international level.
The empirical comparisons have been made using a regression analysis, allowing us
to establish a relationship between share prices and accounting earnings. This analysis is 4 Australia, Austria, Belgium, Brazil, Canada, Chile, China, Denmark, Finland, France, Germany,
Greece, Hong Kong, India, Indonesia, Ireland, Japan, Korea, Malaysia, Mexico, Netherlands, New Zealand, Norway, Philippines, Poland, Portugal, Singapore, South Africa, Spain, Sweden, Switzerland, Thailand, Turkey, United Kingdom and the United States

DTECONZ 2003-02 S. Callao, B. Cuéllar, J.I. Jarne and J.A. Laínez
5
based on models such as that applied by Joos and Lang (1994), among others, to
measure the relevance of accounting figures.
These “pricing models” establish the market value of a company based on earnings
for the year and book value of equity. The latter variable provides a gauge of company
size and is included to measure variables at different levels, thereby avoiding problems
of heterocedasticity in residuals resulting from the wide range of values in which they
are distributed. The papers published by Ohlson (1995) and Feltham and Ohlson (1995)
provide a conceptual basis for the application of these models.
In the present case, we wish to analyse the relevance and components of net
income, and the earnings variable is therefore defined as net income for the year
(NETI), or is disaggregated into the following components: operating income (OPI),
financial income (FINI), extraordinary income (EXTI) and the income tax expense
(TAX).
The descriptive statistics are presented in Table 1, together with the market price of
shares for the sample of companies from the 36 countries included in the study. All
atypical observations, defined as data falling outside the interval comprising the average
value of the variable plus/minus three times the standard deviation, have been
eliminated.
Accordingly, we shall apply the transversal cut-off model described in the
following regression (Model 1) to the sample of companies for each country and the
period t to test the first of the null hypotheses:
ititititit eNETIBP +++= − 211 ββα [1]
where Pit is the market price of a company i which is representative of the mean
share price over a period of 12 months from the prior month of March until the close of
accounts (the 3 month grace period is intended to ensure that information is available to
all investors); Bit-1 is the opening net book value of the company i for the period; and
NETIit represents net income for the year. Both earnings and other accounting figures
are expressed as the amount per share.
To test the remaining two null hypotheses, we have redefined model 1, replacing
the NETI variable by each of its four main components (Model 2):
itititititititit eTAXEXTIFINIOPIBP ++++++= − 543211 βββββα [2]

DTECONZ 2003-02 S. Callao, B. Cuéllar, J.I. Jarne and J.A. Laínez
6
All variables are as defined above.
We have regressed expression [1] by Ordinary Least Squares (OLS), pooling the
time series and cross-section data. To reduce the presence of heteroscedasticity in the
residual due to the existence of cross-sectional correlation, the variables have been
divided by the number of shares in circulation. Furthermore, the t-student statistics of
the explanatory variables have been obtained from a covariance matrix consistent with
White’s form of heteroscedasticity.
Since inter-period correlations between the variables are more than likely,
potentially introducing bias into (overstating) the significance of variables, we have
calculated the regression equations for models 1 and 2 for each of the years from 1995
until 1999. This enables us to check the relationships observed are stable over time.
The presence of multicolinearity is a further matter requiring consideration in the
calculation of these models. In view of the values taken by the correlation coefficients
for the explanatory variables (see Table 2), a strong relationship appears to exist
between them in the majority of countries, which would affect the resulting estimates.
In order to resolve this difficulty, the following procedure has been used to make
calculations. As a first step, we calculated the regression equation in which each
independent variable is explained by another with which it is closely correlated. The
explanatory variables subsequently included in the verification equation (models 1 and
2) were those considered independent as a result of the first step together with the
residuals from these models. In this way, we are able to check the explanatory power of
the variables in question at the same time as establishing what part of the remaining
variables are independent. If we assume a high correlation between the variables B and
NETI in model 1, the process, as expressed analytically, would consist of the following:
itititit
it
eBPBNETINETI
+++=−−=⇒++=
−
ε
it211
1-it21itit1-it21it
RES ˆˆRES B
ββααααα
[3]
In order to verify hypotheses 1 and 3, we base our analysis on the significance of
the β coefficients estimated as described in the preceding paragraphs. Thus, if the
coefficients take statistical values other than zero, we may affirm that the accounting
variables described are relevant for valuation purposes and reject the relevant null
hypotheses.

DTECONZ 2003-02 S. Callao, B. Cuéllar, J.I. Jarne and J.A. Laínez
7
The second hypothesis can be verified by comparing the determination coefficients
resulting from the calculation of models 1 and 2. Thus, if R2 in model 2 exceeds R2 in
model 1, we may reject the null hypothesis, which means that the components of the
result have greater explanatory power than the NETI variable.
3. Analysis of results
Relevance of net income
Table 3 presents the values of the coefficients obtained as a result of the regression
described in model 1 for each country, taking into consideration the whole period from
1995 to 1999. The Table also shows the degree of significance of these coefficients in
each case.
In the first place, we should explain that we have worked with the national currency
of each country in all of the models, and as a result the value of the independent term is
not comparable by markets.
In general terms, the results obtained clearly show that a high degree of relevance is
attributed to the two variables (net book value and accounting earnings) considered in
the regression. Both may be considered significant for price formation, since they are so
in all of the countries analysed in the case of net book value and in more than 97% of
cases where net income are considered. The only case where the latter is not significant
is, in fact, Brazil. Consequently, we may reject the first working hypothesis (H01),
affirming that the two accounting figures considered are important to investors.
The coefficients associated with these variables are positive in all cases, which
implies that a direct relationship exists between the variables and market value, as might
indeed be assumed a priori. Nevertheless, significant oscillations are observable
between the values taken by the coefficients for the variables from country to country.
This suggests that the importance assigned to accounting disclosures for the purposes of
price formation differs at the international level.
For example, the coefficient establishing the relevance of book value of equity
varies between 0.143 in China and 2.4 in Japan, while the range of variation associated
with net income is much wider, from 0.141 in Korea to 9.281 in Ireland and 11.679 in
Japan. This reveals that investors’ perceptions of net income are more mixed from

DTECONZ 2003-02 S. Callao, B. Cuéllar, J.I. Jarne and J.A. Laínez
8
country to county than is the case with book value of equity, although this sharp
fluctuation may be because the former is a more volatile variable than the latter.
We may now lower the sights of our analysis in order to establish whether this
heterogeneity of the coefficients is maintained or diminshes in different regions,
accounting systems and more or less developed capital markets.
Differentiating geographically, there seems to be no observable association between
the values taken by the coefficients for the two variables included in the regression and
the region to which each country belongs.
Thus, differences observed in the coefficients for Europe, as already noted by Joos
and Lang (1993) and García-Ayuso et al. (2000) on the basis of evidence from different
time intervals to our own, are in line with the results obtained for the sample of
countries taken as a whole. In our study, this may be extended to other areas, resulting
in one region (Asia) where both maximum and minimum coefficients are found for the
two variables, and others where dispersion is less acute. This is the case of the two
North American countries, where book value of equity coefficients are practically
identical.
Following Ali and Hwang (2000), differences between accounting systems may be
a further factor to some extent explaining differences between capital markets. In the
context of our study, however, it does not seem possible to make this inference and
draw a basic distinction between Anglo-American and European accounting practices.
Thus, substantial differences in the size of the coefficients for both variables are
observable among the English-speaking countries (e.g. Ireland, Australia, the United
States, the United Kingdom and New Zealand). This is also the case with the countries
that use the European accounting model, such as Germany, France, Spain and Portugal.
Finally, there seems to be no evidence of analogies in the behaviour of countries
based on the level of development of their markets, since both countries with high stock
market capitalisation (United States, Japan and the United Kingdom) and emerging
markets (Poland, Malaysia and Indonesia) all present very different coefficients with
regard either to book value equity or to earnings, or indeed to both.
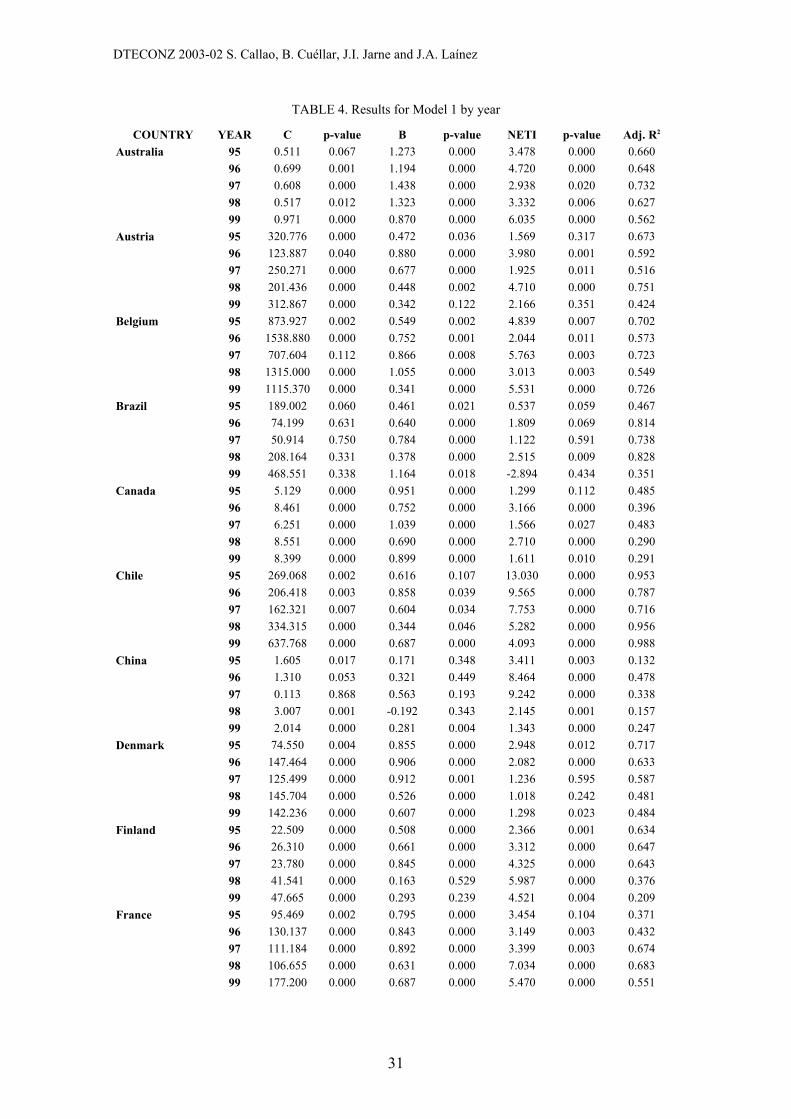
To complete our analysis of the relevance of net income, Table 4 presents the
values obtained from calculating the regression equation described in [1] by year, in

DTECONZ 2003-02 S. Callao, B. Cuéllar, J.I. Jarne and J.A. Laínez
9
order to observe whether relationships between prices and accounting variables remain
stable over time.
The book value of equity coefficient is observed to be significant in each of the five
years analysed for the majority of countries, except Portugal, Austria, Chile, Spain,
Finland and India where the book value of equity of companies was not significant for
the share price in one or more of the periods considered.
However, the book value equity coefficient is, in general, fairly stable over time.
The countries showing the greatest fluctuations are Turkey and Greece, followed by
Italy and the Philippines. The most stable countries are France, the United Kingdom and
Portugal.
The net income coefficient is also significant in the majority of the years analysed,
although in a smaller number of cases than the book value equity variable. In fifteen
countries, net income were significant in each of the five years studied.
The value of the coefficient for the net income variable is also less stable over time
than book value equity. The countries in which the coefficient oscillates the most over
time are Turkey, the Philippines, Greece and Poland.
The opposite is the case in Korea, India, Norway, Canada and Denmark, where the
value taken by the earnings coefficient is highly stable throughout the five year period.
Explanatory power of the models (Net income versus Components)
The model reflected in expression [2] has been applied in order to test the second
working hypothesis –breaking net income down into components provides a better
explanation of securities prices at the international level. We have compared the
determination coefficients obtained as a result with those generated for model [1].
As shown in Table 5, which includes the determination coefficients of the models
for each country, the disaggregation of earnings does in fact increase the explanatory
power of the models in the majority of cases.
However, in light of the size of differences between the coefficients for models [1]
and [2], there appear to be certain countries in which it is not evident that explicit
knowledge of the lines making up the net income figure significantly changes the
explanatory power of the model. This is the case for Germany, Australia, Canada,
China, Finland, Malaysia and Mexico.

DTECONZ 2003-02 S. Callao, B. Cuéllar, J.I. Jarne and J.A. Laínez
10
In those countries that follow the general trend, it is interesting to note that where a
two-digit increase in the determination coefficient appears (9 countries), the majority of
the countries concerned (7) are continental European nations. The clearest cases are
Spain, Greece, Italy and Portugal, with Austria, Belgium and Switzerland close behind.
The opposite effect also appears in cases where the disaggregation of results not
only does not improve the model’s fit but actually lowers the determination coefficients.
This is so in Chile and the Netherlands, and to a lesser extent in France and South
Africa.
Relevance of the main earnings components
Having established that breaking down earnings figures provides a clearer
explanation of prices in the majority of cases, our last objective is to examine the
relevance of each of the main components of net income for valuation purposes. Tables
6 and 7 show the coefficients resulting from the calculation of model [2] together with
the individual statistical significance of each for the overall model and annual
differentiation, respectively.
In outline, it can be seen that all of the components (OPI, FINI, EXTI and TAX) are
significant taken as a whole in 6 out of the 36 countries included in the sample (Austria,
Korea, the United States, India, Portugal and the United Kingdom). If the tax
component is left out, the number of cases where the remaining variables increases to
take in almost 50% of the sample.
If each of the components into which we have segmented earnings is considered in
isolation, operating income appears most frequently as a relevant item. In fact, it is a
significant variable in all of the countries analysed except Brazil.
The relationship between operating income and the market value of shares is direct
in all cases in which OPI appears as a significant variable. Nevertheless, there are large
differences in the value taken by the coefficient of operating income as an independent
variable, with variations falling within a range of 8.377 in Ireland at one extreme and
0.432 in Korea. As mentioned above, these oscillations are usual in coefficients
associated with flow-type variables.
It is interesting to note that the remaining variables also appear relevant in the
majority of cases. Thus, financial income is relevant in 63% of cases and extraordinary
income in 69%. Since extraordinary items are by definition likely to prove erratic, our

DTECONZ 2003-02 S. Callao, B. Cuéllar, J.I. Jarne and J.A. Laínez
11
observations in this case are at odds with other evidence of a positive link between the
explanatory power of earnings and their persistence over time (Kormendi and Lipe,
1987, and Collins and Kothari, 1989). This result should, however, be interpreted with
some reserve, since the statistical significance of this variable drops considerably in the
annual analyses, as explained below. Also, sharp annual fluctuations in the size of the
coefficient are observable.
The relationship between prices and the financial component of earnings is positive
except in the case of Korea. This is also the case for extraordinary income, which is in
an inverse relationship only in the cases of Brazil and the United States, and may be a
consequence, among other matters, of differences in the accounting treatment of
extraordinary items. Alternatively, it could be due to a perception of poor earnings
quality on the part of investors faced with a high volume of extraordinary income.
Finally, the variable that measures the tax component of the earnings figure appears
less relevant than the rest and is only significant in 36% of cases. It may be, then, that
the part of taxation that is not linked to the rest of earnings is an important component
for investor decision-making, although to lesser degree than other components. This
would coincide with the evidence obtained for the Spanish market by Giner and Reverte
(1999).
The relationship between the tax variable and market value is positive in the
majority (83%) of cases in which the component is significant, which suggests that it
indirectly reflects an additional assessment of the size of the company’s earnings in
addition to the information provided by the other components.
Finally, in the annual analysis presented in Table 6, the frequency with which the B
and OPI variables appear as significant is very similar to the results obtained in the
overall analysis. Thus, B is significant in 97.22% of cases in the overall analysis, falling
to 93.33% in the annual disaggregation, while OPI is relevant in 97.22% of cases in the
former and 88.89% in the latter.
This similarity does not occur for the remaining earnings components, however, for
which significant cases are fewer in percentage terms in the annual analysis than was
observed when all of the years were examined together. As mentioned above, the
decrease is as much as 29% in the case of extraordinary income.

DTECONZ 2003-02 S. Callao, B. Cuéllar, J.I. Jarne and J.A. Laínez
12
Having established that the variables are significant in a greater number of cases in
the overall model, it may be of interest to establish the extent to which the results of the
overall analysis are stable when the study is segmented in time.
Comparison of the values shown in Tables 6 and 7 shows that in countries where a
given explanatory variable is significant, it will also be significant in the majority of the
years analysed taken individually. This behaviour is uniform in the case of the B and
OPI variables. For the other components, however, certain cases may be observed
where discrepancies arise, such as Sweden for the financial and extraordinary variables,
Portugal for the financial and tax variables and Japan for the tax variable.
Finally, we analysed the changes arising in the coefficients associated with the
explanatory variables in each country in annual regressions. The most striking feature is
that the stability of the coefficients is once again broken except in the case of the B1 and
OPI components. Meanwhile, in the overall model the coefficients associated with each
variable in each country are close to the average values taken by the same coefficients
in the annual analysis.
4. Conclusions
Based on financial and stock market data for 15,452 companies in 36 countries over
the period from 1995 to 1999, we have analysed the relationship between accounting
earnings and the main components thereof, and quoted share prices on the developed
stock markets.
Our study confirms the results obtained from earlier research, providing evidence of
the relevance of earnings figures for valuation purposes. In our study, we have also
established that this is a generalised case, regardless of the market analysed.
Nevertheless, the importance of this information differs at the international level,
since the earnings-price relationship is direct in every case, though the associated
coefficients present mixed values. A further point is the absence of any clearly
observable link between the relevance of this information and variables that might, a
priori, cause differences to appear between countries, such as the nature of accounting
practices, the region or the level of development of local markets.

DTECONZ 2003-02 S. Callao, B. Cuéllar, J.I. Jarne and J.A. Laínez
13
The disaggregation of earnings into the component parts of the income statement in
the various countries (operating income, financial income, extraordinary income and
taxation) provides the investor with incremental information regarding the market value
of the company.
The most relevant line is clearly operating income, which reflects the importance of
disclosures concerning the ordinary activity of the company. This is usually the main
source of income and provides an appropriate basis on which to assess the situation and
outlook of the business.
Though significant, the remaining components, particularly financial income and
taxation, throw up widely differing estimated coefficients for each year, which makes it
difficult to reach any clear conclusions regarding their relationship with share prices.
This may be because there is little persistence in such results, especially in the case of
extraordinary items.
We believe the results of this study may be of use in clarifying two currently
controversial issues. Firstly, in view of the globalisation of the economy, and
specifically of stock markets, international investors are likely to find that information
they consider relevant for decision-making purposes in their home markets remains
relevant in the majority of overseas capital markets, at least as variations on a theme.
On the other hand, despite the questions raised about the utility of conventional
financial information in the new economic and social context, our results show that
commonly used accounting variables such as earnings remain relevant in the majority of
capital markets. Nevertheless, we are aware of the need to meet new information needs
as they arise, both by adapting traditional accounting disclosures and including new
dimensions in the figures.
Finally, one of the possible limitations of this study is its failure to clarify the
relationship between the specific features of the different countries and the relevance of
accounting information. We believe this is a matter that would repay further research,
including analysis not only of the factors referred to above but others that are not
directly linked to countries but to the conduct of business, such as specific accounting
principles established in the domestic accounting regulations of each country and the
manner in which they are actually applied by companies.

DTECONZ 2003-02 S. Callao, B. Cuéllar, J.I. Jarne and J.A. Laínez
14
References
Alford, A.; Jones J.; Leftwich R. and R. Zmijewski (1993): “The relative
informativeness of accounting disclosures in different countries” Journal Accounting
Research, vol. 31, (supplement), pp. 183-223.
Alnajjar, F. (1992): "International Accounting Standards and the Environment: a
Proposal". Paper presented at the XV European Accounting Association Congress,
Madrid.
Amenkhienan, F. (1986): Accounting in Developing Countries: a Framework for
Standard Setting. U.M.I. Research Press, Michigan.
Ball, R.; Kothari, S.P. and A. Robin (1997): "The effect of institutional factors on
properties of accounting earnings: International evidence” Working paper, University of
Rochester.
Barth, M.; Beaver, W. and W. Landsman (1992): "The market valuation implications of
net periodic pension cost components". Journal of Accounting and Economics, vol. 15,
pp. 1-34.
Belkaoui, A. (1985): International Accounting. Issues and Solutions. Quorum Books,
Westport.
Belkaoui, A. y Picur, R. (1991): "Cultural Determinism and the Perception of
Accounting Concepts". The International Journal of Accounting, vol. 26, nº 2, pp. 118-
130.
Booth, G.G.; Kallunki, J. and T. Martikainen (1997): "Delayed price response to the
announcements of earnings and its components in Finland". European Accounting
Review, vol. 6, nº 3, pp. 377-392.
Choi, F. (1974): "European Disclosure: the Competitive Disclosure Hypothesis".
Journal of International Business Studies, fall, pp. 15-23.
Choi, F. and G. Mueller (1992): International Accounting. Prentice Hall, New Jersey.
Doupnik, T. and S. Salter (1995): "External Environment, Culture and Accounting
Practice: a Preliminary Test of a General Model of International Accounting
Development". The International Journal of Accounting, vol. 30, nº 3, pp. 189-207.

DTECONZ 2003-02 S. Callao, B. Cuéllar, J.I. Jarne and J.A. Laínez
15
Feltham, G. and J. Ohlson (1995): "Valuation and clean surplus accounting for
operating and financial activities". Contemporary Accounting Research, spring, pp. 689-
731.
Frank, W. (1979): "An Empirical Analysis of International Accounting Principles".
Journal of Accounting Research, vol. 17, nº 2, autumn, pp. 593-605.
García-Ayuso, M.; Monterrey, J. and C. Pineda (2000): "Un análisis comparado de la
relevancia de la información contable para la formación de los precios en los mercados
de capitales de la Unión Europea". Revista Española de Financiación y Contabilidad,
vol. 29, nº 104, pp. 483-509.
Giner, B. and C. Reverte (1999): "Value relevance of earnings disaggregation in Spain".
European Accounting Review, vol. 8, nº 4, pp. 609-629
Hall, C; Hamao, Y. and T. Harris (1994): "A comparison of relations between security
market prices, returns and accounting measures in Japan and the United States". Journal
of International Financial Management and Accounting, vol. 5, pp. 47-73.
Joos, P. and M. Lang (1994): "The effects of accounting diversity: Evidence from the
European Union" Journal of Accounting Research, vol. 32 (supplement), pp. 141-175.
Kothari, S.P. (2001): "Capital Markets Research in Accounting". Journal of Accounting
and Economics, vol. 31, pp. 105-231.
Laínez, J.A. and J.I. Jarne (1999): «El entorno como variable discriminante en la
diferenciación internacional de sistemas contables». Revista de Contabilidad, vol. 2, nº
3, pp. 73-102.
Lipe, R. (1986): "The information contained in the components of earnings". Journal of
Accounting Research, vol. 24 (supplement), pp. 37-64.
Livnat, J. and P. Zarowin (1990): "The incremental information content of cash-flow
components". Journal of Accounting and Economics, vol. 13, pp. 25-46.
McLeaand, S; Kassab, J. and M. Helan (1997): "The incremental information content of
accruals: evidence based on the exponential smoothing of levels and trends in the pre-
tax earnings, fund flows and cash flow". Journal of Business Finance and Accounting,
vol. 24, nº 7, pp. 1147-1165.

DTECONZ 2003-02 S. Callao, B. Cuéllar, J.I. Jarne and J.A. Laínez
16
Nobes, C. and R. Parker (1991a): Comparative International Accounting. Prentice Hall
International Ltd., London.
Nobes, C. and R. Parker (1991b): "Introduction, and causes of differences". Included in
Nobes and Parker, 1991a, pp. 3-22.
Ohlson, J.A. (1995): "Earnings, book values and dividends in securitand valuation".
Contempory Accounting Research, vol. 11, pp. 661-687.
Pownall, G. (1994): "Discussion of the relative informativeness of accounting
disclosures in different countries". Journal of Accounting Research, vol. 32
(supplement), pp. 224-229.
Radebaugh, L. and S. Gray (1993): International Accounting and Multinational
Enterprises. John Wileand & Sons, Inc., New ANDork.
Salter, S. and T. Doupnik (1992): "The Relationship between Legal Sandstems and
Accounting Practices: a Classification Exercise". Advances in International Accounting,
vol. 5, pp. 3-22.
Strong, N.C. and M. Walker (1993): "The explanatorand power of earnings for stock
returns". Accounting Review, vol. 68, pp. 385-399.
Wild, J.J. (1992): "Stock price informativeness of accounting numbers: evidence on
earnings, book values and their components". Journal of Accounting and Public Policy,
vol. 11, pp. 119-154.

DTECONZ 2003-02 S. Callao, B. Cuéllar, J.I. Jarne and J.A. Laínez
17
TABLE 1. Descriptive statistics
P B NETI OPI EXTI FINI TAX Australia Mean 3.164 1.622 0.150 0.234 0.043 -0.040 0.081 Standard Deviations 3.107 1.490 0.254 0.377 0.192 0.069 0.109 Skewness 2.006 1.521 -0.046 1.525 2.447 -2.097 1.346 Kurtosis 4.960 2.400 8.142 9.705 20.327 11.436 2.959 Quartile 1 1.079 0.519 0.019 0.009 -0.004 -0.067 0.001 Median 2.223 1.214 0.117 0.171 0.009 -0.018 0.047 Quartile 3 4.127 2.206 0.250 0.378 0.062 0.002 0.126 Quartile 4 18.648 8.190 1.286 3.709 1.933 0.320 0.560 Observations 1270 Austria Mean 583.196 463.556 43.167 19.964 65.763 -11.785 16.047 Standard Deviations 540.763 560.172 92.679 114.688 131.737 33.360 29.387 Skewness 2.018 2.813 3.730 0.697 4.304 -1.806 1.709 Kurtosis 5.162 9.378 30.263 10.174 22.716 5.899 7.224 Quartile 1 212.500 128.594 9.324 -8.956 8.758 -15.809 1.068 Median 464.846 324.861 26.689 17.421 24.458 -4.615 7.964 Quartile 3 710.456 560.156 61.614 46.462 68.896 2.002 21.566 Quartile 4 3285.000 3842.481 898.755 663.110 1071.117 89.952 166.085 Observations 370 Belgium Mean 3279.011 2061.260 209.967 172.771 218.625 -51.709 115.839 Standard Deviations 3577.024 2952.779 353.987 416.599 469.342 178.676 250.661 Skewness 2.478 3.408 2.432 0.945 1.400 0.377 2.297 Kurtosis 6.815 14.758 11.197 9.517 16.251 7.041 9.817 Quartile 1 1089.547 351.046 30.146 11.370 12.670 -84.570 7.959 Median 2198.333 1173.942 112.952 90.145 82.172 -31.956 39.033 Quartile 3 4014.324 2488.324 299.463 251.995 262.196 -1.871 122.498 Quartile 4 21633.125 21589.287 2668.774 2461.948 3598.743 742.111 1580.295 Observations 470 Brazil Mean 2558.883 2020.915 -178.300 218.008 49.019 -268.894 -4.800 Standard Deviations 10028.732 7969.576 4648.849 1765.094 765.336 1776.065 1378.690 Skewness 6.389 10.348 -8.013 -0.052 10.611 -14.936 6.048 Kurtosis 46.485 153.242 188.574 62.922 138.252 255.144 202.141 Quartile 1 5.458 12.676 -3.127 -0.050 -2.545 -43.025 -0.573 Median 46.097 91.431 0.912 3.011 -0.019 -1.271 0.029 Quartile 3 683.333 1199.182 17.563 66.193 2.959 0.144 3.535 Quartile 4 106428.571 133654.155 46857.070 20170.738 10855.239 566.262 24703.673 Observations 1440 Canada Mean 13.713 7.410 0.472 1.347 -0.020 -0.308 0.460 Standard Deviations 13.551 7.825 1.453 2.176 0.619 0.542 0.891 Skewness 1.893 2.461 -0.355 2.196 -0.402 -2.057 2.739 Kurtosis 4.952 13.896 7.362 13.457 14.919 5.213 18.109 Quartile 1 3.896 1.995 -0.082 -0.008 -0.030 -0.445 0.000 Median 9.715 5.153 0.384 0.813 0.000 -0.098 0.187 Quartile 3 18.943 10.451 1.080 2.080 0.041 0.007 0.685 Quartile 4 95.300 89.134 8.901 23.060 3.503 1.987 10.082 Observations 2525 2525.000

DTECONZ 2003-02 S. Callao, B. Cuéllar, J.I. Jarne and J.A. Laínez
18
P B NETI OPI EXTI FINI TAX
Chile Mean 1251.699 1006.729 111.155 184.972 3.978 -14.759 13.599 Standard Deviations 4801.135 8921.908 843.327 1787.841 38.693 29.012 70.193 Skewness 10.484 16.807 16.241 17.265 0.337 -3.310 15.727 Kurtosis 123.474 284.840 276.603 302.727 17.064 13.690 266.538 Quartile 1 118.688 94.838 4.877 5.608 -2.937 -19.484 0.414 Median 312.212 236.104 20.151 29.800 0.750 -4.414 2.793 Quartile 3 838.833 553.813 70.062 88.683 8.079 -0.308 12.178 Quartile 4 60000.000 151746.238 14541.996 31479.136 261.521 28.976 1203.148 Observations 375 China Mean 3.188 2.600 0.160 0.198 0.082 -0.075 0.043 Standard Deviations 2.559 1.399 0.348 0.348 0.170 0.101 0.065 Skewness 1.746 0.974 -1.627 0.242 1.732 -1.368 2.983 Kurtosis 3.105 0.186 7.686 4.253 13.532 2.695 13.791 Quartile 1 1.307 1.494 0.044 0.045 0.003 -0.116 0.008 Median 2.403 2.255 0.152 0.149 0.040 -0.045 0.025 Quartile 3 3.860 3.332 0.305 0.332 0.118 -0.013 0.057 Quartile 4 15.300 6.657 1.421 1.767 1.064 0.169 0.481 Observations 435 Denmark Mean 330.721 232.461 20.682 25.911 11.285 -5.292 8.355 Standard Deviations 293.556 244.599 52.004 39.993 53.324 15.138 18.179 Skewness 2.438 1.898 4.404 0.576 8.822 -1.263 -0.255 Kurtosis 8.313 4.933 47.579 4.773 107.964 15.211 12.997 Quartile 1 141.146 63.359 6.098 7.527 0.000 -8.468 1.001 Median 256.246 151.714 14.734 20.642 2.104 -2.405 5.601 Quartile 3 415.468 323.604 29.972 38.527 8.764 0.186 12.716 Quartile 4 2095.636 1666.798 631.492 250.096 751.181 98.132 90.625 Observations 685 Finland Mean 77.402 42.781 6.186 8.042 2.536 -1.736 2.761 Standard Deviations 58.098 36.404 6.708 7.983 4.893 2.758 2.740 Skewness 1.200 1.231 1.324 0.766 1.347 -0.873 1.703 Kurtosis 1.080 1.951 3.202 1.789 3.621 1.032 3.409 Quartile 1 34.533 18.719 1.768 2.770 0.165 -3.342 0.899 Median 62.400 31.021 4.535 6.484 0.979 -1.182 1.991 Quartile 3 103.663 60.838 9.406 12.550 3.732 0.057 3.735 Quartile 4 306.111 201.179 34.650 38.258 23.181 4.247 13.589 Observations 580 France Mean 334.900 159.131 17.533 24.480 14.636 -4.871 13.570 Standard Deviations 520.987 303.717 43.783 62.646 30.267 16.866 34.033 Skewness 5.589 4.517 2.434 3.890 4.194 -1.242 5.771 Kurtosis 40.411 30.289 19.352 29.007 38.680 10.725 46.619 Quartile 1 92.068 33.956 2.641 2.783 -0.346 -9.907 0.952 Median 200.726 97.503 10.520 14.561 2.447 -2.980 5.775 Quartile 3 390.221 224.281 23.545 35.718 11.419 -0.004 14.716 Quartile 4 5930.000 3731.137 410.238 677.866 406.471 93.281 395.201 Observations 3080

DTECONZ 2003-02 S. Callao, B. Cuéllar, J.I. Jarne and J.A. Laínez
19
P B NETI OPI EXTI FINI TAX
Germany Mean 109.559 52.103 2.889 -0.299 10.699 -2.121 2.997 Standard Deviations 157.364 75.654 22.678 50.625 23.122 7.021 6.069 Skewness 2.767 2.538 -1.136 22.848 3.319 -2.563 2.653 Kurtosis 8.450 8.791 34.144 823.690 20.016 19.380 11.014 Quartile 1 26.081 8.882 0.206 -1.962 1.166 -2.373 0.166 Median 47.173 20.151 1.817 0.931 3.237 -0.675 1.113 Quartile 3 111.354 61.179 4.818 4.614 11.021 0.047 3.148 Quartile 4 1062.668 725.901 253.298 1767.654 215.652 34.729 47.464 Observations 3295 Greece Mean 2441.859 910.459 96.674 131.648 52.966 -43.530 55.461 Standard Deviations 2634.377 1372.781 198.857 282.051 140.957 108.264 81.677 Skewness 1.866 3.701 0.070 1.599 3.194 -4.617 2.842 Kurtosis 3.874 17.836 24.677 18.371 19.058 29.740 9.610 Quartile 1 567.991 205.982 19.323 18.655 0.827 -51.016 9.500 Median 1482.083 444.476 52.850 62.089 20.688 -13.098 26.338 Quartile 3 3462.422 1050.641 125.406 157.026 69.895 -1.557 65.502 Quartile 4 15936.458 12085.509 1505.314 2319.750 1038.045 206.188 521.552 Observations 920 Hong Kong Mean 2.814 2.885 0.161 0.230 -0.034 -0.046 0.027 Standard Deviations 4.623 4.592 0.776 0.470 0.380 0.131 0.165 Skewness 3.017 3.544 -1.098 2.140 -2.770 -2.944 2.875 Kurtosis 9.936 17.984 29.221 7.610 23.433 19.222 37.187 Quartile 1 0.470 0.547 -0.022 0.007 -0.025 -0.060 -0.002 Median 1.088 1.221 0.083 0.110 0.000 -0.014 0.009 Quartile 3 2.603 3.153 0.262 0.297 0.021 0.002 0.044 Quartile 4 31.933 47.406 7.051 2.864 1.888 0.524 2.097 Observations 1475 India Mean 141.997 86.100 8.610 18.331 5.214 -8.780 2.844 Standard Deviations 322.179 170.066 34.232 67.231 16.823 24.953 5.540 Skewness 11.420 14.594 -4.493 18.960 8.201 -18.153 6.291 Kurtosis 194.137 273.653 145.601 454.279 95.463 458.462 68.714 Quartile 1 16.446 33.296 1.925 4.071 0.374 -10.088 0.019 Median 54.167 60.135 7.551 11.827 1.614 -4.442 0.973 Quartile 3 164.500 99.853 14.956 21.427 4.796 -0.953 3.803 Quartile 4 6860.096 3791.453 424.197 1796.915 283.060 21.683 89.938 Observations 1465 Indonesia Mean 1568.853 1084.692 -161.801 409.877 -339.095 -150.845 72.215 Standard Deviations 2294.071 1765.359 1630.567 906.763 1447.910 405.471 220.626 Skewness 3.090 1.352 -5.285 5.150 -5.836 -4.232 7.559 Kurtosis 10.304 12.468 41.086 39.746 43.388 21.274 83.533 Quartile 1 370.313 255.113 -31.322 42.382 -114.904 -125.055 0.185 Median 773.333 689.990 51.906 137.780 -9.565 -29.005 15.876 Quartile 3 1566.933 1458.037 176.999 406.992 11.264 -0.366 67.468 Quartile 4 13275.000 14600.205 6249.508 9567.584 4678.746 616.432 2879.491 Observations 585

DTECONZ 2003-02 S. Callao, B. Cuéllar, J.I. Jarne and J.A. Laínez
20
P B NETI OPI EXTI FINI TAX
Ireland Mean 2.158 1.038 0.141 0.219 0.006 -0.037 0.036 Standard Deviations 2.880 1.216 0.196 0.283 0.063 0.061 0.051 Skewness 2.870 2.090 1.215 2.128 -0.355 -2.001 1.497 Kurtosis 9.931 4.767 3.327 6.387 9.247 4.250 3.510 Quartile 1 0.468 0.245 0.002 0.012 0.000 -0.051 0.000 Median 1.159 0.599 0.115 0.149 0.002 -0.015 0.015 Quartile 3 2.394 1.370 0.226 0.326 0.016 0.000 0.057 Quartile 4 18.596 6.684 0.890 1.605 0.336 0.072 0.248 Observations 300 Italy Mean 7581.163 3778.465 337.252 452.607 402.500 -116.227 366.216 Standard Deviations 8120.320 3148.673 590.646 917.912 683.204 254.653 497.951 Skewness 3.146 1.611 -0.954 -0.122 2.481 -1.767 2.545 Kurtosis 15.196 3.046 12.107 5.711 10.576 5.312 10.000 Quartile 1 2385.618 1589.983 67.172 -4.121 35.027 -167.366 59.958 Median 5323.604 2922.055 273.741 316.274 183.449 -60.043 210.612 Quartile 3 9984.950 4850.981 560.550 886.100 532.399 55.000 482.676 Quartile 4 64282.550 19187.078 3433.099 4974.130 5316.004 487.799 3993.234 Observations 745 Japan Mean 1002.324 619.652 18.178 68.512 -8.067 -18.637 29.940 Standard Deviations 1602.013 600.339 86.234 107.254 87.381 252.844 47.451 Skewness 6.137 4.242 -13.045 1.257 -15.475 -33.022 3.218 Kurtosis 53.694 38.440 503.735 45.527 954.372 1151.515 26.546 Quartile 1 307.000 257.438 1.294 15.801 -11.468 -13.323 4.010 Median 554.333 470.054 13.800 42.520 -1.476 -5.536 15.564 Quartile 3 1050.792 813.543 40.013 92.994 4.630 -0.994 40.605 Quartile 4 23944.167 9834.385 220.000 1267.109 550.000 143.160 577.601 Observations 11000 Korea Mean 13629.255 19166.501 -1974.441 3871.332 -1440.627 -5796.486 582.884 Standard Deviations 16954.861 31268.400 20427.179 10113.564 11645.218 8696.536 2118.164 Skewness 3.161 0.997 -2.585 0.898 -3.821 -2.615 0.204 Kurtosis 13.419 6.608 36.885 17.676 55.176 8.046 59.259 Quartile 1 3797.738 5970.888 -687.636 456.511 -1076.046 -6485.707 0.000 Median 8408.615 12816.994 353.109 2138.832 -60.108 -2639.253 214.293 Quartile 3 15850.298 26954.530 1252.017 5578.218 569.492 -844.466 756.422 Quartile 4 153054.642 207107.116 169860.825 90924.552 116965.957 14741.892 28213.347 Observations 2900 Malaysia Mean 4.198 2.065 0.085 0.252 -0.024 -0.072 0.061 Standard Deviations 4.095 1.628 0.552 0.442 0.263 0.161 0.137 Skewness 2.852 1.572 -2.059 0.454 -4.088 -2.365 1.292 Kurtosis 13.325 4.257 13.148 5.117 39.680 10.059 9.772 Quartile 1 1.552 0.980 -0.008 0.034 0.000 -0.107 0.000 Median 2.900 1.668 0.116 0.198 0.004 -0.032 0.029 Quartile 3 5.452 2.786 0.288 0.433 0.021 0.005 0.100 Quartile 4 39.604 12.750 2.423 2.608 2.110 0.693 1.106 Observations 1680

DTECONZ 2003-02 S. Callao, B. Cuéllar, J.I. Jarne and J.A. Laínez
21
P B NETI OPI EXTI FINI TAX
Mexico Mean 12.730 9.449 0.958 1.777 0.527 -1.441 0.566 Standard Deviations 12.456 10.539 2.589 2.650 2.327 2.595 1.086 Skewness 1.491 2.592 2.979 2.032 1.250 -2.985 3.955 Kurtosis 1.757 9.453 24.928 6.328 5.438 12.428 23.764 Quartile 1 3.759 3.248 0.031 0.369 -0.207 -1.792 0.056 Median 8.539 6.347 0.599 0.953 0.106 -0.512 0.167 Quartile 3 16.920 11.796 1.477 2.389 0.862 -0.130 0.626 Quartile 4 57.175 79.186 25.804 15.712 11.060 3.374 10.042 Observations 540 Netherlands Mean 55.298 29.193 3.679 5.741 0.405 -0.800 1.661 Standard Deviations 62.880 55.127 5.841 7.613 0.860 2.143 2.081 Skewness 8.142 8.406 5.747 5.733 2.204 4.276 1.830 Kurtosis 92.235 87.634 95.382 76.466 7.525 60.634 6.696 Quartile 1 27.924 8.018 1.337 2.046 0.000 -1.256 0.350 Median 44.235 18.253 2.917 4.259 0.116 -0.350 1.190 Quartile 3 65.717 32.534 5.072 8.029 0.486 0.009 2.385 Quartile 4 865.000 703.138 92.413 116.111 5.107 26.429 13.645 Observations 710 New Zealand Mean 3.121 1.938 0.218 0.365 0.030 -0.071 0.087 Standard Deviations 2.052 1.498 0.177 0.372 0.168 0.102 0.090 Skewness 0.746 1.274 1.075 1.913 3.150 -2.543 1.238 Kurtosis -0.138 1.343 1.997 10.373 26.866 10.688 2.938 Quartile 1 1.605 0.813 0.097 0.164 0.000 -0.094 0.017 Median 2.705 1.462 0.188 0.287 0.008 -0.047 0.067 Quartile 3 4.363 2.691 0.313 0.501 0.042 -0.015 0.143 Quartile 4 9.348 7.496 1.011 2.629 1.271 0.159 0.535 Observations 245 Norway Mean 74.924 49.715 4.325 4.935 2.111 -2.467 1.345 Standard Deviations 84.305 62.578 14.391 12.486 7.652 4.551 3.973 Skewness 2.673 2.190 2.529 1.832 1.252 -2.560 3.169 Kurtosis 9.721 5.597 28.216 12.178 8.510 8.608 33.720 Quartile 1 22.060 8.713 -0.100 0.015 -0.147 -3.110 0.001 Median 48.227 23.540 2.133 2.421 0.388 -1.091 0.523 Quartile 3 97.151 69.159 6.222 7.760 3.428 -0.095 1.824 Quartile 4 656.750 380.413 147.638 98.907 44.022 8.042 43.013 Observations 650 Philippines Mean 8.778 7.430 0.234 0.598 0.049 -0.253 0.153 Standard Deviations 17.901 17.408 1.698 2.500 0.436 0.711 0.499 Skewness 3.484 5.622 -3.302 -1.918 4.116 -4.135 0.348 Kurtosis 14.064 40.238 33.027 45.650 41.181 20.018 17.146 Quartile 1 0.828 0.916 -0.022 0.006 0.000 -0.190 0.000 Median 1.826 1.937 0.108 0.183 0.004 -0.023 0.039 Quartile 3 6.108 5.080 0.380 0.595 0.082 0.006 0.166 Quartile 4 128.349 163.924 5.142 17.117 3.835 0.428 2.346 Observations 315

DTECONZ 2003-02 S. Callao, B. Cuéllar, J.I. Jarne and J.A. Laínez
22
P B NETI OPI EXTI FINI TAX
Poland Mean 26.273 18.324 1.830 2.013 0.856 -0.142 1.268 Standard Deviations 25.529 15.955 2.902 5.009 1.638 1.886 1.552 Skewness 1.867 1.294 0.306 -0.890 2.551 -0.017 2.501 Kurtosis 4.262 2.980 5.950 10.023 9.223 11.300 10.423 Quartile 1 8.277 6.792 0.535 0.356 0.106 -0.626 0.233 Median 18.344 14.196 1.522 1.882 0.374 -0.064 0.870 Quartile 3 35.046 24.927 2.945 3.878 0.925 0.419 1.790 Quartile 4 152.208 87.479 15.965 20.051 9.531 9.735 11.412 Observations 280 Portugal Mean 1503.690 1365.880 76.269 109.090 68.197 -63.622 32.725 Standard Deviations 1284.617 1321.488 172.266 234.759 135.520 85.610 46.786 Skewness 1.575 1.598 1.028 2.638 2.143 -1.734 1.934 Kurtosis 3.619 2.623 7.578 18.303 4.970 3.340 3.575 Quartile 1 524.260 371.899 15.596 4.931 4.615 -93.977 0.736 Median 1115.333 1009.523 49.535 79.002 25.756 -32.988 12.392 Quartile 3 2259.772 1840.250 117.686 181.324 88.284 -6.612 46.755 Quartile 4 8285.587 6202.839 1099.153 1925.632 613.364 76.346 222.443 Observations 310 Singapore Mean 1.419 1.165 0.052 0.093 0.006 -0.014 0.021 Standard Deviations 1.841 1.458 0.163 0.195 0.061 0.051 0.049 Skewness 2.965 2.367 0.310 2.875 -1.530 -0.915 2.096 Kurtosis 10.701 6.848 10.022 21.270 31.783 22.672 10.511 Quartile 1 0.392 0.267 0.005 0.010 -0.001 -0.020 0.000 Median 0.717 0.562 0.028 0.043 0.001 -0.005 0.008 Quartile 3 1.610 1.452 0.093 0.136 0.009 0.001 0.027 Quartile 4 12.553 10.165 0.988 2.094 0.437 0.411 0.344 Observations 940 South Africa Mean 8.062 7.617 0.896 1.385 0.135 -0.134 0.376 Standard Deviations 13.739 11.933 2.014 2.878 0.892 0.591 0.994 Skewness 2.708 2.999 3.982 4.429 0.874 -1.633 2.572 Kurtosis 7.629 11.536 25.881 35.687 15.218 12.978 18.356 Quartile 1 0.670 0.777 0.021 0.034 -0.004 -0.265 0.004 Median 2.265 2.972 0.251 0.374 0.033 -0.021 0.080 Quartile 3 7.888 8.653 1.018 1.578 0.214 0.100 0.446 Quartile 4 82.342 94.638 19.876 37.217 6.459 2.805 8.359 Observations 2055 Spain Mean 1780.408 1207.737 125.537 146.589 61.151 -27.737 50.462 Standard Deviations 1446.949 1371.273 201.257 189.083 118.236 50.537 82.016 Skewness 1.390 3.024 3.013 1.475 2.524 -1.290 1.952 Kurtosis 1.933 12.720 43.832 4.959 10.015 3.474 8.077 Quartile 1 795.208 432.305 42.811 30.660 3.616 -49.964 3.885 Median 1390.216 847.149 91.281 102.170 26.653 -16.397 29.976 Quartile 3 2422.140 1451.604 163.496 210.801 71.971 -0.363 71.590 Quartile 4 7399.740 9892.407 2191.912 1145.644 815.168 102.611 482.455 Observations 375

DTECONZ 2003-02 S. Callao, B. Cuéllar, J.I. Jarne and J.A. Laínez
23
P B NETI OPI EXTI FINI TAX
Sweden Mean 83.917 36.679 4.665 6.293 1.711 -1.211 1.899 Standard Deviations 60.852 31.886 6.996 8.504 4.072 2.089 2.331 Skewness 0.921 1.083 0.793 0.831 2.382 -1.292 1.154 Kurtosis 0.554 0.960 2.449 1.531 10.548 2.598 2.579 Quartile 1 35.358 9.662 0.479 0.633 0.000 -2.021 0.144 Median 72.875 29.645 3.690 4.397 0.383 -0.628 1.279 Quartile 3 120.083 54.523 8.194 11.077 1.961 0.010 2.949 Quartile 4 331.583 164.189 37.371 41.575 26.733 4.502 14.165 Observations 1090 Switzerland Mean 721.372 449.231 43.471 59.686 19.610 -9.779 18.339 Standard Deviations 746.265 481.750 64.260 83.697 51.606 26.911 28.384 Skewness 1.992 1.661 1.156 1.725 2.144 -1.881 1.856 Kurtosis 4.752 2.677 6.197 4.342 8.247 8.510 5.036 Quartile 1 220.104 104.952 8.282 9.292 0.100 -13.476 2.262 Median 491.354 267.690 26.033 35.296 4.720 -3.655 8.736 Quartile 3 965.833 634.837 65.155 85.440 19.570 0.122 22.829 Quartile 4 4904.250 2651.669 409.019 462.197 304.655 101.041 179.302 Observations 705 Thailand Mean 34.222 28.711 2.455 4.596 2.204 -3.049 1.158 Standard Deviations 42.693 32.269 11.138 9.045 8.632 4.767 2.772 Skewness 2.740 1.755 0.833 1.574 5.173 -2.858 3.716 Kurtosis 9.946 6.355 9.781 7.003 36.954 10.672 29.331 Quartile 1 8.171 10.108 -0.754 0.328 0.011 -3.806 0.000 Median 18.333 21.018 1.433 2.441 0.625 -1.686 0.304 Quartile 3 43.167 39.303 5.563 7.054 2.225 -0.503 1.481 Quartile 4 338.500 212.414 75.021 55.599 82.724 6.237 32.687 Observations 950 Turkey Mean 6884.418 1462.056 391.780 797.127 62.978 -197.741 232.980 Standard Deviations 8131.227 1673.110 699.529 1158.940 271.684 543.599 312.120 Skewness 2.402 2.792 1.581 2.055 0.593 -2.293 1.456 Kurtosis 6.567 9.871 7.648 6.151 4.367 9.447 3.940 Quartile 1 1815.161 478.909 93.603 159.194 -32.864 -295.880 37.654 Median 3838.751 838.357 221.163 454.023 23.749 -82.570 117.087 Quartile 3 8866.796 1842.759 529.794 1047.489 108.263 52.686 309.762 Quartile 4 48000.000 10835.006 4039.650 6692.689 1262.189 781.418 1458.029 Observations 350 United Kingdom Mean 2.036 0.873 0.104 0.185 -0.002 -0.024 0.054 Standard Deviations 2.191 1.251 0.225 0.332 0.117 0.054 0.074 Skewness 2.038 3.072 0.273 8.135 -0.413 -2.162 1.774 Kurtosis 5.632 14.336 8.950 283.711 17.301 8.625 5.575 Quartile 1 0.496 0.166 0.003 0.017 -0.008 -0.035 0.002 Median 1.305 0.479 0.076 0.123 0.000 -0.010 0.031 Quartile 3 2.806 1.111 0.188 0.286 0.013 0.001 0.083 Quartile 4 20.383 12.242 2.034 11.446 0.904 0.245 0.522 Observations 6605

DTECONZ 2003-02 S. Callao, B. Cuéllar, J.I. Jarne and J.A. Laínez
24
P B NETI OPI EXTI FINI TAX
United States Mean 15.433 6.295 0.300 1.180 -0.130 -0.325 0.380 Standard Deviations 14.460 7.546 2.774 2.509 1.332 1.332 0.785 Skewness 2.726 3.291 -20.359 2.384 -25.485 -23.146 2.288 Kurtosis 21.965 33.426 1029.926 69.486 1388.155 1101.968 32.778 Quartile 1 5.206 1.757 -0.197 -0.024 -0.081 -0.352 0.001 Median 11.141 4.387 0.364 0.770 0.000 -0.049 0.207 Quartile 3 21.261 8.623 1.038 2.006 0.014 0.029 0.609 Quartile 4 302.344 165.471 39.044 63.465 28.577 31.969 11.983 Observations 25540

DTECONZ 2003-02 S. Callao, B. Cuéllar, J.I. Jarne and J.A. Laínez
25
TABLE 2. Correlation matrixes between explanatory variables by countries
Australia B OPI EXTI FINI TAX B 1.000 OPI 0.627 1.000 EXTI 0.206 -0.177 1.000 FINI -0.477 -0.445 -0.140 1.000 TAX 0.602 0.808 0.128 -0.300 1.000 Austria B OPI EXTI FINI TAX B 1.000 OPI 0.120 1.000 EXTI 0.725 -0.297 1.000 FINI -0.438 -0.047 -0.505 1.000 TAX 0.437 0.283 0.514 0.000 1.000 Belgium B OPI EXTI FINI TAX B 1.000 OPI 0.165 1.000 EXTI 0.440 -0.296 1.000 FINI -0.201 -0.303 -0.336 1.000 TAX 0.396 0.589 0.250 -0.359 1.000 Brazil B OPI EXTI FINI TAX B 1.000 OPI 0.671 1.000 EXTI -0.193 -0.228 1.000 FINI -0.363 -0.365 -0.364 1.000 TAX -0.149 0.097 0.271 0.158 1.000 Canada B OPI EXTI FINI TAX B 1.000 OPI 0.509 1.000 EXTI 0.100 0.127 1.000 FINI -0.403 -0.432 -0.102 1.000 TAX 0.446 0.771 0.275 -0.241 1.000 Chile B OPI EXTI FINI TAX B 1.000 OPI 0.721 1.000 EXTI -0.167 -0.220 1.000 FINI -0.614 -0.370 0.097 1.000 TAX 0.511 0.716 0.105 -0.138 1.000 China B OPI EXTI FINI TAX B 1.000 OPI 0.203 1.000 EXTI 0.028 -0.147 1.000 FINI -0.304 -0.115 0.058 1.000 TAX 0.287 0.684 0.096 -0.071 1.000 Denmark B OPI EXTI FINI TAX B 1.000 OPI 0.339 1.000 EXTI 0.163 -0.062 1.000 FINI -0.330 -0.117 -0.108 1.000 TAX 0.105 0.514 0.161 0.088 1.000

DTECONZ 2003-02 S. Callao, B. Cuéllar, J.I. Jarne and J.A. Laínez
26
Finland B OPI EXTI FINI TAX B 1.000 OPI 0.338 1.000 EXTI 0.450 -0.028 1.000 FINI -0.205 -0.289 -0.006 1.000 TAX 0.521 0.754 0.421 0.022 1.000 France B OPI EXTI FINI TAX B 1.000 OPI 0.497 1.000 EXTI 0.080 -0.048 1.000 FINI -0.179 -0.296 -0.040 1.000 TAX 0.495 0.821 0.298 -0.161 1.000 Germany B OPI EXTI FINI TAX B 1.000 OPI -0.115 1.000 EXTI 0.490 -0.529 1.000 FINI -0.200 0.171 -0.246 1.000 TAX 0.442 0.285 0.241 -0.131 1.000 Greece B OPI EXTI FINI TAX B 1.000 OPI 0.445 1.000 EXTI 0.448 -0.131 1.000 FINI -0.585 -0.341 -0.381 1.000 TAX 0.704 0.711 0.316 -0.352 1.000 Hong Kong B OPI EXTI FINI TAX B 1.000 OPI 0.447 1.000 EXTI -0.037 0.115 1.000 FINI -0.179 -0.087 0.114 1.000 TAX 0.025 0.310 0.041 0.048 1.000 India B OPI EXTI FINI TAX B 1.000 OPI 0.870 1.000 EXTI 0.237 0.004 1.000 FINI -0.830 -0.845 -0.117 1.000 TAX 0.540 0.603 0.332 -0.315 1.000 Indonesia B OPI EXTI FINI TAX B 1.000 OPI 0.556 1.000 EXTI 0.001 -0.205 1.000 FINI -0.164 -0.313 0.566 1.000 TAX 0.481 0.681 0.078 -0.011 1.000 Ireland B OPI EXTI FINI TAX B 1.000 OPI 0.822 1.000 EXTI 0.110 0.003 1.000 FINI -0.598 -0.709 0.047 1.000 TAX 0.431 0.609 0.303 -0.278 1.000

DTECONZ 2003-02 S. Callao, B. Cuéllar, J.I. Jarne and J.A. Laínez
27
Italy B OPI EXTI FINI TAX B 1.000 OPI 0.387 1.000 EXTI 0.516 -0.190 1.000 FINI 0.307 -0.032 -0.041 1.000 TAX 0.721 0.653 0.518 0.071 1.000 Japan B OPI EXTI FINI TAX B 1.000 OPI 0.655 1.000 EXTI -0.116 -0.155 1.000 FINI -0.091 -0.289 0.062 1.000 TAX 0.708 0.901 -0.042 -0.116 1.000 Korea B OPI EXTI FINI TAX B 1.000 OPI 0.386 1.000 EXTI 0.029 0.022 1.000 FINI -0.137 -0.265 0.110 1.000 TAX 0.316 0.396 0.146 -0.029 1.000 Malaysia B OPI EXTI FINI TAX B 1.000 OPI 0.335 1.000 EXTI -0.006 0.039 1.000 FINI -0.030 0.140 0.211 1.000 TAX 0.271 0.594 0.027 0.126 1.000 Mexico B OPI EXTI FINI TAX B 1.000 OPI 0.714 1.000 EXTI 0.119 0.183 1.000 FINI -0.626 -0.676 -0.400 1.000 TAX 0.404 0.520 0.319 -0.352 1.000 Netherlands B OPI EXTI FINI TAX B 1.000 OPI 0.524 1.000 EXTI 0.276 0.115 1.000 FINI -0.398 -0.248 -0.073 1.000 TAX 0.476 0.872 0.145 -0.065 1.000 New Zealand B OPI EXTI FINI TAX B 1.000 OPI 0.540 1.000 EXTI -0.003 0.048 1.000 FINI -0.479 -0.542 -0.011 1.000 TAX 0.328 0.581 0.050 -0.183 1.000 Norway B OPI EXTI FINI TAX B 1.000 OPI 0.404 1.000 EXTI 0.186 -0.119 1.000 FINI -0.318 -0.127 -0.166 1.000 TAX 0.292 0.700 0.172 0.067 1.000

DTECONZ 2003-02 S. Callao, B. Cuéllar, J.I. Jarne and J.A. Laínez
28
Philippines B OPI EXTI FINI TAX B 1.000 OPI 0.457 1.000 EXTI 0.220 0.036 1.000 FINI -0.219 -0.341 0.172 1.000 TAX 0.529 0.879 0.126 -0.083 1.000 Poland B OPI EXTI FINI TAX B 1.000 OPI 0.372 1.000 EXTI -0.135 -0.567 1.000 FINI 0.135 -0.004 0.012 1.000 TAX 0.463 0.657 -0.094 0.308 1.000 Portugal B OPI EXTI FINI TAX B 1.000 OPI 0.828 1.000 EXTI 0.232 -0.349 1.000 FINI -0.247 0.091 -0.509 1.000 TAX 0.151 0.460 0.209 -0.086 1.000 Singapore B OPI EXTI FINI TAX B 1.000 OPI 0.460 1.000 EXTI 0.272 0.032 1.000 FINI -0.184 -0.102 0.102 1.000 TAX 0.326 0.674 0.156 -0.031 1.000 South Africa B OPI EXTI FINI TAX B 1.000 OPI 0.642 1.000 EXTI 0.183 0.154 1.000 FINI -0.078 -0.034 -0.036 1.000 TAX 0.325 0.767 0.180 0.074 1.000 Spain B OPI EXTI FINI TAX B 1.000 OPI 0.508 1.000 EXTI 0.402 -0.201 1.000 FINI -0.179 -0.160 -0.024 1.000 TAX 0.515 0.665 0.335 0.110 1.000 Sweden B OPI EXTI FINI TAX B 1.000 OPI 0.585 1.000 EXTI 0.426 -0.008 1.000 FINI -0.420 -0.397 -0.183 1.000 TAX 0.610 0.818 0.202 -0.276 1.000 Switzerland B OPI EXTI FINI TAX B 1.000 OPI 0.556 1.000 EXTI 0.380 -0.001 1.000 FINI -0.142 -0.257 -0.097 1.000 TAX 0.499 0.707 0.337 -0.014 1.000

DTECONZ 2003-02 S. Callao, B. Cuéllar, J.I. Jarne and J.A. Laínez
29
Thailand B OPI EXTI FINI TAX B 1.000 OPI 0.504 1.000 EXTI -0.038 0.040 1.000 FINI -0.001 -0.044 -0.422 1.000 TAX 0.360 0.464 0.144 -0.008 1.000 Turkey B OPI EXTI FINI TAX B 1.000 OPI 0.872 1.000 EXTI 0.222 0.344 1.000 FINI -0.214 -0.166 -0.218 1.000 TAX 0.741 0.835 0.369 0.173 1.000 United Kingdom B OPI EXTI FINI TAX B 1.000 OPI 0.618 1.000 EXTI 0.059 0.001 1.000 FINI -0.384 -0.456 -0.027 1.000 TAX 0.465 0.788 0.154 -0.207 1.000 United States B OPI EXTI FINI TAX B 1.000 OPI 0.440 1.000 EXTI 0.011 0.017 1.000 FINI -0.188 -0.423 0.340 1.000 TAX 0.408 0.636 0.181 -0.140 1.000

DTECONZ 2003-02 S. Callao, B. Cuéllar, J.I. Jarne and J.A. Laínez
30
TABLE 3. Results for Model 1
COUNTRY C p-value B p-value NETI p-value Adj. R2 Australia 0.682 0.000 1.240 0.000 3.836 0.000 0.638 Austria 275.937 0.000 0.579 0.000 1.889 0.005 0.554 Belgium 1235.670 0.000 0.701 0.000 3.916 0.000 0.597 Brazil 377.032 0.015 0.594 0.000 0.289 0.832 0.472 Canada 7.607 0.000 0.847 0.000 2.057 0.000 0.345 Chile 567.651 0.000 0.400 0.000 5.474 0.000 0.941 China 2.105 0.000 0.143 0.032 2.332 0.000 0.164 Denmark 139.366 0.000 0.709 0.000 1.498 0.002 0.532 Finland 36.258 0.000 0.527 0.000 3.869 0.000 0.375 France 131.314 0.000 0.776 0.000 4.556 0.000 0.566 Germany 29.420 0.000 1.766 0.000 1.003 0.000 0.600 Greece 1753.950 0.000 0.885 0.000 4.646 0.000 0.344 Hong Kong 31.259 0.000 0.863 0.000 3.463 0.008 0.582 India 52.460 0.000 0.785 0.000 3.806 0.000 0.299 Indonesia 1039.000 0.000 0.427 0.000 0.200 0.003 0.126 Ireland 0.555 0.000 1.694 0.000 9.281 0.000 0.718 Italy 2571.540 0.034 1.354 0.000 3.028 0.002 0.336 Japan 148.055 0.066 2.405 0.000 11.679 0.002 0.561 Korea 16960.800 0.000 0.389 0.000 0.141 0.000 0.336 Malaysia 2.916 0.000 0.486 0.000 2.683 0.000 0.167 Mexico 8.019 0.000 0.521 0.000 2.052 0.000 0.407 Netherlands 0.847 0.000 0.749 0.000 2.723 0.000 0.546 New Zealand 1.171 0.000 0.372 0.001 5.648 0.000 0.456 Norway 31.692 0.000 0.802 0.000 1.990 0.004 0.565 Philippines 2.783 0.005 0.769 0.001 4.223 0.057 0.478 Poland 12.434 0.000 0.314 0.010 4.540 0.000 0.338 Portugal 779.491 0.000 0.336 0.000 2.558 0.008 0.360 Singapore 0.569 0.000 0.543 0.000 4.482 0.000 0.439 South Africa 4.129 0.000 0.480 0.000 4.796 0.000 0.528 Spain 918.623 0.000 0.416 0.043 3.608 0.015 0.380 Sweden 45.457 0.000 0.813 0.000 2.543 0.000 0.398 Switzerland 250.712 0.000 0.748 0.000 3.969 0.000 0.449 Thailand 21.493 0.000 0.310 0.000 1.052 0.000 0.172 Turkey 4044.180 0.000 1.839 0.002 1.625 0.088 0.264 United Kingdom 1.195 0.000 0.544 0.000 4.481 0.000 0.392 United States 10.286 0.000 0.875 0.000 1.194 0.000 0.275
DTECONZ 2003-02 S. Callao, B. Cuéllar, J.I. Jarne and J.A. Laínez
31
TABLE 4. Results for Model 1 by year
COUNTRY YEAR C p-value B p-value NETI p-value Adj. R2 Australia 95 0.511 0.067 1.273 0.000 3.478 0.000 0.660 96 0.699 0.001 1.194 0.000 4.720 0.000 0.648 97 0.608 0.000 1.438 0.000 2.938 0.020 0.732 98 0.517 0.012 1.323 0.000 3.332 0.006 0.627 99 0.971 0.000 0.870 0.000 6.035 0.000 0.562 Austria 95 320.776 0.000 0.472 0.036 1.569 0.317 0.673 96 123.887 0.040 0.880 0.000 3.980 0.001 0.592 97 250.271 0.000 0.677 0.000 1.925 0.011 0.516 98 201.436 0.000 0.448 0.002 4.710 0.000 0.751 99 312.867 0.000 0.342 0.122 2.166 0.351 0.424 Belgium 95 873.927 0.002 0.549 0.002 4.839 0.007 0.702 96 1538.880 0.000 0.752 0.001 2.044 0.011 0.573 97 707.604 0.112 0.866 0.008 5.763 0.003 0.723 98 1315.000 0.000 1.055 0.000 3.013 0.003 0.549 99 1115.370 0.000 0.341 0.000 5.531 0.000 0.726 Brazil 95 189.002 0.060 0.461 0.021 0.537 0.059 0.467 96 74.199 0.631 0.640 0.000 1.809 0.069 0.814 97 50.914 0.750 0.784 0.000 1.122 0.591 0.738 98 208.164 0.331 0.378 0.000 2.515 0.009 0.828 99 468.551 0.338 1.164 0.018 -2.894 0.434 0.351 Canada 95 5.129 0.000 0.951 0.000 1.299 0.112 0.485 96 8.461 0.000 0.752 0.000 3.166 0.000 0.396 97 6.251 0.000 1.039 0.000 1.566 0.027 0.483 98 8.551 0.000 0.690 0.000 2.710 0.000 0.290 99 8.399 0.000 0.899 0.000 1.611 0.010 0.291 Chile 95 269.068 0.002 0.616 0.107 13.030 0.000 0.953 96 206.418 0.003 0.858 0.039 9.565 0.000 0.787 97 162.321 0.007 0.604 0.034 7.753 0.000 0.716 98 334.315 0.000 0.344 0.046 5.282 0.000 0.956 99 637.768 0.000 0.687 0.000 4.093 0.000 0.988 China 95 1.605 0.017 0.171 0.348 3.411 0.003 0.132 96 1.310 0.053 0.321 0.449 8.464 0.000 0.478 97 0.113 0.868 0.563 0.193 9.242 0.000 0.338 98 3.007 0.001 -0.192 0.343 2.145 0.001 0.157 99 2.014 0.000 0.281 0.004 1.343 0.000 0.247 Denmark 95 74.550 0.004 0.855 0.000 2.948 0.012 0.717 96 147.464 0.000 0.906 0.000 2.082 0.000 0.633 97 125.499 0.000 0.912 0.001 1.236 0.595 0.587 98 145.704 0.000 0.526 0.000 1.018 0.242 0.481 99 142.236 0.000 0.607 0.000 1.298 0.023 0.484 Finland 95 22.509 0.000 0.508 0.000 2.366 0.001 0.634 96 26.310 0.000 0.661 0.000 3.312 0.000 0.647 97 23.780 0.000 0.845 0.000 4.325 0.000 0.643 98 41.541 0.000 0.163 0.529 5.987 0.000 0.376 99 47.665 0.000 0.293 0.239 4.521 0.004 0.209 France 95 95.469 0.002 0.795 0.000 3.454 0.104 0.371 96 130.137 0.000 0.843 0.000 3.149 0.003 0.432 97 111.184 0.000 0.892 0.000 3.399 0.003 0.674 98 106.655 0.000 0.631 0.000 7.034 0.000 0.683 99 177.200 0.000 0.687 0.000 5.470 0.000 0.551

DTECONZ 2003-02 S. Callao, B. Cuéllar, J.I. Jarne and J.A. Laínez
32
COUNTRY YEAR C p-value B p-value NETI p-value Adj. R2
Germany 95 123.618 0.000 1.758 0.000 0.950 0.151 0.592 96 139.726 0.000 1.569 0.000 1.224 0.002 0.582 97 120.045 0.000 1.902 0.000 3.408 0.000 0.662 98 104.307 0.000 1.781 0.000 3.040 0.000 0.626 99 87.774 0.000 2.018 0.000 6.363 0.000 0.560 Greece 95 200.021 0.022 1.177 0.003 4.609 0.006 0.721 96 97.283 0.158 0.931 0.000 3.849 0.009 0.616 97 501.329 0.000 0.600 0.001 4.405 0.005 0.459 98 4059.520 0.000 0.266 0.017 3.154 0.000 0.204 99 1800.830 0.000 3.559 0.004 13.309 0.007 0.357 Hong Kong 95 1.834 0.000 0.759 0.000 7.563 0.000 0.746 96 0.998 0.000 1.077 0.000 4.966 0.000 0.668 97 2.212 0.000 0.693 0.000 1.705 0.003 0.438 98 0.404 0.039 0.584 0.000 2.494 0.000 0.576 99 0.649 0.000 0.870 0.000 5.456 0.000 0.566 India 95 35.727 0.008 0.651 0.051 3.985 0.086 0.325 96 43.391 0.000 0.437 0.134 4.242 0.049 0.341 97 79.269 0.000 -0.021 0.904 4.813 0.001 0.262 98 115.700 0.000 -0.099 0.507 4.163 0.000 0.163 99 119.880 0.002 0.836 0.000 3.968 0.004 0.321 Indonesia 95 875.905 0.000 0.507 0.000 3.595 0.000 0.441 96 807.919 0.000 0.821 0.000 8.055 0.000 0.602 97 442.462 0.000 0.616 0.003 1.016 0.013 0.204 98 508.632 0.000 0.254 0.068 0.241 0.001 0.132 99 803.511 0.000 0.675 0.020 5.249 0.001 0.397 Ireland 95 0.313 0.011 1.481 0.000 8.795 0.000 0.809 96 0.500 0.015 1.573 0.000 9.686 0.000 0.837 97 0.251 0.503 2.532 0.000 12.555 0.011 0.713 98 0.274 0.353 2.359 0.000 8.348 0.005 0.745 99 1.201 0.005 1.649 0.000 9.484 0.002 0.631 Italy 95 2085.700 0.000 0.657 0.000 2.644 0.001 0.600 96 2412.250 0.000 0.786 0.000 1.904 0.003 0.382 97 3096.180 0.000 0.985 0.000 3.495 0.011 0.483 98 3103.980 0.000 1.349 0.000 7.963 0.000 0.581 99 3632.620 0.114 2.022 0.000 9.137 0.002 0.375 Japan 95 52.479 0.431 1.933 0.000 5.711 0.000 0.622 96 83.264 0.192 1.523 0.000 4.856 0.000 0.591 97 137.134 0.000 1.478 0.000 2.006 0.109 0.564 98 132.560 0.024 2.357 0.000 5.276 0.013 0.515 99 329.033 0.222 2.631 0.000 8.753 0.000 0.496 Korea 95 29786.100 0.000 0.709 0.000 0.851 0.253 0.531 96 21787.500 0.000 0.512 0.000 0.634 0.046 0.552 97 10534.000 0.000 0.237 0.000 0.068 0.413 0.250 98 16221.300 0.000 0.202 0.000 0.083 0.002 0.224 99 9012.960 0.000 0.146 0.000 0.263 0.006 0.198 Malaysia 95 4.168 0.000 1.277 0.000 6.663 0.002 0.196 96 3.744 0.000 1.513 0.000 8.505 0.000 0.313 97 1.435 0.000 0.434 0.000 0.826 0.054 0.112 98 1.329 0.000 0.476 0.000 1.182 0.000 0.297 99 1.345 0.000 0.877 0.000 4.861 0.000 0.347

DTECONZ 2003-02 S. Callao, B. Cuéllar, J.I. Jarne and J.A. Laínez
33
COUNTRY YEAR C p-value B p-value NETI p-value Adj. R2
Mexico 95 6.126 0.004 1.009 0.005 3.504 0.000 0.585 96 11.621 0.000 0.325 0.060 2.321 0.070 0.339 97 4.976 0.000 1.102 0.000 1.612 0.020 0.543 98 8.255 0.000 0.439 0.009 1.844 0.003 0.428 99 5.087 0.019 0.569 0.078 1.691 0.177 0.378 Netherlands 95 16.992 0.000 1.054 0.000 5.055 0.000 0.937 96 32.199 0.000 0.897 0.000 7.532 0.000 0.707 97 39.288 0.000 0.982 0.000 6.266 0.000 0.993 98 39.288 0.000 0.474 0.000 0.868 0.614 0.153 99 49.986 0.000 0.512 0.006 4.424 0.000 0.271 New Zealand 95 0.954 0.020 0.985 0.000 4.562 0.321 0.456 96 1.197 0.014 1.156 0.000 3.229 0.214 0.423 97 1.693 0.000 0.759 0.000 9.758 0.029 0.512 98 1.378 0.000 0.794 0.000 3.386 0.026 0.424 99 2.183 0.000 0.459 0.014 8.792 0.002 0.471 Norway 95 34.947 0.000 0.765 0.000 1.440 0.104 0.542 96 23.283 0.022 1.458 0.000 1.611 0.189 0.685 97 18.870 0.000 1.110 0.000 2.836 0.021 0.758 98 29.425 0.001 0.630 0.008 1.599 0.339 0.444 99 34.986 0.000 0.729 0.000 1.991 0.000 0.648 Philippines 95 -1.117 0.381 -0.126 0.758 22.674 0.000 0.917 96 6.825 0.000 0.639 0.102 8.585 0.027 0.616 97 6.323 0.000 1.118 0.010 2.126 0.142 0.553 98 7.780 0.000 0.786 0.025 4.193 0.011 0.540 99 3.649 0.000 1.361 0.000 10.232 0.000 0.808 Poland 95 4.615 0.373 1.323 0.015 11.702 0.074 0.744 96 12.014 0.020 1.241 0.000 10.392 0.000 0.700 97 7.539 0.075 0.971 0.003 1.522 0.597 0.284 98 13.497 0.001 0.327 0.070 2.048 0.047 0.292 99 19.512 0.000 0.326 0.058 5.843 0.046 0.855 Portugal 95 661.778 0.000 0.218 0.043 2.470 0.002 0.296 96 659.543 0.002 0.503 0.000 3.873 0.000 0.553 97 813.861 0.000 0.302 0.001 3.888 0.001 0.440 98 893.438 0.000 0.323 0.109 2.539 0.272 0.227 99 919.411 0.000 0.345 0.045 0.640 0.747 0.220 Singapore 95 0.696 0.000 1.219 0.000 6.917 0.010 0.567 96 0.358 0.008 1.337 0.000 8.005 0.003 0.643 97 0.250 0.002 0.763 0.000 1.755 0.215 0.473 98 0.461 0.000 0.499 0.000 2.799 0.002 0.499 99 0.634 0.000 0.745 0.000 5.815 0.003 0.344 South Africa 95 9.217 0.000 1.372 0.000 4.976 0.166 0.547 96 7.323 0.001 1.386 0.000 8.125 0.000 0.706 97 6.787 0.000 0.805 0.003 5.561 0.001 0.430 98 5.379 0.000 0.603 0.000 3.809 0.000 0.394 99 2.548 0.000 1.099 0.000 3.598 0.000 0.629 Spain 95 329.720 0.009 0.414 0.079 3.710 0.005 0.563 96 647.749 0.000 0.407 0.051 4.005 0.006 0.516 97 1303.030 0.000 0.456 0.223 1.414 0.748 0.238 98 938.844 0.000 0.152 0.538 8.287 0.003 0.606 99 1062.030 0.000 0.006 0.982 7.352 0.000 0.379

DTECONZ 2003-02 S. Callao, B. Cuéllar, J.I. Jarne and J.A. Laínez
34
COUNTRY YEAR C p-value B p-value NETI p-value Adj. R2
Sweden 95 25.636 0.000 0.824 0.000 1.686 0.046 0.559 96 43.265 0.000 0.649 0.000 4.257 0.001 0.606 97 34.343 0.000 1.178 0.000 2.688 0.002 0.526 98 46.331 0.000 0.550 0.000 4.222 0.000 0.463 99 56.501 0.000 0.820 0.000 2.919 0.010 0.274 Switzerland 95 214.185 0.000 0.812 0.000 4.183 0.092 0.504 96 254.415 0.000 0.903 0.000 5.188 0.000 0.565 97 194.698 0.000 1.188 0.000 1.411 0.441 0.548 98 287.526 0.000 1.157 0.000 2.391 0.137 0.438 99 428.859 0.000 1.270 0.000 6.065 0.001 0.386 Thailand 95 33.291 0.000 0.827 0.000 9.036 0.000 0.351 96 13.628 0.000 0.753 0.000 5.718 0.000 0.316 97 13.921 0.000 0.308 0.000 1.065 0.000 0.301 98 17.218 0.000 0.309 0.000 0.537 0.000 0.275 99 11.550 0.000 0.569 0.000 1.426 0.000 0.371 Turkey 95 978.599 0.000 1.997 0.000 3.062 0.000 0.847 96 338.406 0.215 4.690 0.000 1.022 0.105 0.877 97 1541.450 0.083 2.951 0.000 7.459 0.046 0.379 98 5243.310 0.026 1.625 0.000 2.394 0.007 0.443 99 6853.700 0.273 7.303 0.024 10.646 0.180 0.393 United Kingdom 95 1.008 0.000 0.626 0.000 4.585 0.000 0.520 96 1.037 0.000 0.674 0.000 5.250 0.000 0.527 97 0.950 0.000 0.597 0.000 5.594 0.000 0.537 98 1.165 0.000 0.463 0.000 4.455 0.000 0.401 99 1.667 0.000 0.394 0.000 3.551 0.000 0.188 United States 95 8.609 0.000 0.971 0.000 2.757 0.000 0.469 96 9.687 0.000 0.948 0.000 1.928 0.000 0.432 97 9.063 0.000 1.055 0.000 1.423 0.000 0.396 98 11.153 0.000 0.755 0.000 0.346 0.385 0.167 99 11.722 0.000 0.578 0.000 2.278 0.000 0.168

DTECONZ 2003-02 S. Callao, B. Cuéllar, J.I. Jarne and J.A. Laínez
35
TABLE 5. Adjusted R2 for models 1 and 2
COUNTRY MODEL 1 MODEL 2 Australia 0.638 0.640 Austria 0.554 0.659 Belgium 0.597 0.705 Brazil 0.472 0.710 Canada 0.345 0.365 Chile 0.941 0.829 China 0.164 0.181 Denmark 0.532 0.585 Finland 0.375 0.391 France 0.566 0.537 Germany 0.600 0.598 Greece 0.344 0.45 Hong Kong 0.546 0.607 India 0.299 0.376 Indonesia 0.126 0.221 Ireland 0.718 0.783 Italy 0.336 0.464 Japan 0.561 0.595 Korea 0.336 0.426 Malaysia 0.167 0.175 Mexico 0.407 0.401 Netherlands 0.582 0.323 New Zealand 0.456 0.538 Norway 0.565 0.6 Philippines 0.478 0.722 Poland 0.338 0.388 Portugal 0.36 0.513 Singapore 0.439 0.498 South Africa 0.528 0.478 Spain 0.380 0.535 Sweden 0.398 0.428 Switzerland 0.449 0.55 Thailand 0.172 0.226 Turkey 0.264 0.31 United Kingdom 0.392 0.49 United States 0.275 0.359

DTECONZ 2003-02 S. Callao, B. Cuéllar, J.I. Jarne and J.A. Laínez
36
TABLE 6. Results for Model 2
COUNTRY C p-value B p-value OPI p-value EXTI p-value FINI p-value TAX p-value Adj. R2
Australia 0.691 0.000 1.604 0.000 3.119 0.000 2.755 0.000 3.364 0.069 2.107 0.304 0.640 Austria 269.968 0.000 0.815 0.000 1.487 0.001 2.386 0.000 5.792 0.000 4.292 0.050 0.659 Belgium 750.261 0.000 0.971 0.000 4.263 0.000 2.153 0.000 3.791 0.009 -0.512 0.557 0.705 Brazil 168.460 0.208 0.610 0.000 0.778 0.486 -3.028 0.071 1.311 0.190 -3.635 0.105 0.710 Canada 7.565 0.000 1.060 0.000 1.904 0.000 2.067 0.002 0.561 0.614 2.130 0.079 0.365 Chile -107.812 0.298 1.911 0.000 7.099 0.000 5.259 0.000 -2.510 0.493 -18.801 0.144 0.829 China 2.333 0.000 0.167 0.078 2.215 0.000 3.899 0.018 5.402 0.000 1.854 0.567 0.181 Denmark 123.424 0.000 0.777 0.000 1.522 0.000 1.688 0.000 3.209 0.000 -1.325 0.236 0.585 Finland 44.753 0.000 0.847 0.000 2.277 0.000 1.668 0.171 4.209 0.004 3.947 0.169 0.391 France 162.353 0.000 0.942 0.000 1.849 0.000 2.589 0.001 5.648 0.000 -2.361 0.103 0.537 Germany 30.430 0.000 1.443 0.000 0.807 0.007 1.707 0.002 0.971 0.395 3.563 0.003 0.598 Greece 1573.860 0.000 0.853 0.000 3.444 0.000 3.664 0.005 -0.253 0.892 12.684 0.000 0.450 Hong Kong 31.374 0.000 0.675 0.000 2.715 0.000 0.235 0.891 -0.052 0.984 6.504 0.193 0.323 India 79.271 0.000 0.985 0.000 5.256 0.000 3.967 0.040 3.004 0.042 13.131 0.012 0.376 Indonesia 996.284 0.000 0.505 0.000 1.115 0.048 0.223 0.234 0.049 0.916 2.569 0.375 0.221 Ireland 0.588 0.021 1.522 0.000 8.377 0.000 1.819 0.473 5.563 0.178 3.222 0.375 0.783 Italy 1437.830 0.295 1.061 0.004 2.443 0.000 3.271 0.001 3.873 0.011 -1.767 0.265 0.464 Japan 207.492 0.028 1.988 0.000 4.887 0.000 2.115 0.004 2.361 0.290 6.798 0.009 0.595 Korea 9209.060 0.000 0.434 0.000 0.432 0.000 0.138 0.038 -0.393 0.000 1.445 0.001 0.426 Malaysia 3.293 0.000 0.343 0.000 3.864 0.000 1.135 0.005 2.189 0.002 0.184 0.856 0.175 Mexico 9.097 0.000 0.566 0.000 1.434 0.000 -0.023 0.964 2.124 0.004 0.651 0.499 0.401 Netherlands 1.079 0.000 0.705 0.000 5.665 0.000 0.934 0.156 6.601 0.000 -3.611 0.029 0.607 New Zealand 1.892 0.000 0.749 0.000 4.262 0.000 -1.171 0.537 3.389 0.115 3.385 0.283 0.538 Norway 34.294 0.000 0.961 0.000 2.017 0.002 1.551 0.008 3.158 0.019 1.110 0.610 0.600 Philippines 3.267 0.015 0.400 0.157 3.902 0.000 -0.093 0.961 1.075 0.445 19.290 0.058 0.722 Poland 13.589 0.000 0.630 0.000 2.950 0.000 4.676 0.000 1.043 0.527 3.267 0.312 0.388 Portugal 842.148 0.000 0.459 0.000 2.552 0.000 2.871 0.000 1.835 0.048 6.303 0.006 0.513 Singapore 0.574 0.000 0.807 0.000 5.693 0.000 4.259 0.007 7.356 0.001 -4.975 0.101 0.498 South Africa 6.183 0.000 1.132 0.000 4.110 0.000 1.279 0.259 4.278 0.101 -2.194 0.221 0.478 Spain 856.365 0.000 0.963 0.000 3.725 0.000 5.428 0.000 3.847 0.025 -2.198 0.303 0.535 Sweden 44.581 0.000 1.157 0.000 2.583 0.000 1.296 0.062 3.722 0.008 0.998 0.549 0.428 Switzerland 236.878 0.000 1.172 0.000 4.585 0.000 0.980 0.173 4.293 0.000 -4.088 0.002 0.550 Thailand 21.755 0.000 0.414 0.000 1.713 0.000 0.260 0.199 1.930 0.000 1.357 0.118 0.226 Turkey 5602.390 0.000 3.008 0.002 2.594 0.000 4.802 0.005 3.392 0.044 -3.012 0.105 0.310 United Kingdom 1.375 0.000 0.907 0.000 5.799 0.000 1.280 0.000 4.862 0.000 3.342 0.001 0.490 United States 9.233 0.000 0.569 0.000 1.780 0.000 -0.759 0.000 0.896 0.000 3.763 0.000 0.359

DTECONZ 2003-02 S. Callao, B. Cuéllar, J.I. Jarne and J.A. Laínez
37
TABLE 7. Results for Model 2 by year
COUNTRY YEAR C p-value B p-value OPI p-value EXTI p-value FINI p-value TAX p-value Adj. R2
Australia 95 0.636 0.013 1.525 0.000 3.583 0.000 3.751 0.017 -0.340 0.946 3.116 0.514 0.699 96 0.911 0.000 1.576 0.000 3.405 0.000 1.756 0.223 1.781 0.530 0.505 0.907 0.662 97 0.523 0.001 1.789 0.000 2.406 0.018 0.256 0.798 -0.282 0.944 10.212 0.027 0.749 98 0.475 0.011 1.596 0.000 3.345 0.000 3.541 0.001 7.612 0.098 -0.041 0.988 0.632 99 0.739 0.002 1.690 0.000 3.289 0.000 4.384 0.001 10.439 0.009 -3.933 0.409 0.573 Austria 95 297.956 0.000 0.825 0.000 0.301 0.685 1.860 0.039 5.366 0.021 8.636 0.015 0.813 96 307.527 0.000 0.922 0.000 3.703 0.003 6.111 0.001 12.476 0.000 -3.340 0.444 0.654 97 233.023 0.000 0.936 0.000 1.137 0.040 1.962 0.002 2.936 0.550 11.878 0.000 0.700 98 196.094 0.000 0.892 0.000 2.713 0.001 3.368 0.007 4.997 0.084 3.016 0.605 0.694 99 207.650 0.004 0.821 0.000 1.701 0.048 3.993 0.009 3.014 0.410 0.767 0.809 0.730 Belgium 95 255.154 0.262 0.628 0.002 3.675 0.000 4.877 0.010 2.675 0.124 -3.400 0.186 0.864 96 927.417 0.011 1.003 0.000 2.860 0.001 1.457 0.201 3.202 0.477 -3.124 0.351 0.579 97 265.057 0.365 0.934 0.002 7.249 0.000 3.777 0.069 9.941 0.011 -2.586 0.053 0.878 98 1141.280 0.034 1.093 0.001 6.116 0.012 2.807 0.003 6.207 0.183 3.065 0.480 0.610 99 720.266 0.022 0.509 0.041 5.178 0.003 3.848 0.026 0.983 0.797 -2.775 0.309 0.629 Brazil 95 154.400 0.125 0.470 0.001 0.688 0.181 -1.306 0.505 1.548 0.157 -0.683 0.918 0.717 96 -188.628 0.323 0.691 0.000 -1.996 0.409 -0.828 0.619 1.322 0.392 -3.953 0.532 0.901 97 28.709 0.907 0.871 0.032 1.693 0.424 0.949 0.742 0.265 0.874 9.169 0.449 0.628 98 -4.095 0.992 0.420 0.000 0.163 0.938 -2.657 0.175 2.244 0.069 -7.808 0.001 0.824 99 1136.850 0.018 1.354 0.000 5.055 0.001 -7.763 0.000 -2.172 0.061 -10.905 0.003 0.986 Canada 95 4.883 0.000 1.085 0.000 0.953 0.031 0.190 0.796 4.111 0.003 -2.474 0.049 0.535 96 7.778 0.000 1.183 0.000 2.596 0.000 0.722 0.520 1.617 0.514 -1.242 0.143 0.373 97 4.720 0.000 1.375 0.000 3.700 0.000 -0.205 0.722 3.351 0.012 -0.150 0.925 0.614 98 8.393 0.000 0.833 0.000 3.139 0.000 1.714 0.200 0.261 0.894 3.717 0.167 0.349 99 10.673 0.000 1.031 0.000 1.071 0.010 5.535 0.002 -2.608 0.354 3.410 0.169 0.313 Chile 95 59.933 0.307 2.193 0.000 10.199 0.000 8.685 0.000 -5.431 0.374 -13.107 0.180 0.969 96 26.930 0.585 2.028 0.000 6.222 0.000 6.297 0.013 0.441 0.921 -13.826 0.081 0.839 97 33.140 0.382 1.324 0.000 3.911 0.035 5.273 0.269 -2.474 0.761 -12.251 0.427 0.724 98 -257.966 0.048 1.586 0.000 3.211 0.000 6.366 0.017 0.103 0.975 -2.884 0.756 0.717 99 -332.841 0.057 1.928 0.000 7.043 0.002 4.155 0.089 -10.699 0.127 20.119 0.253 0.903 China 95 1.976 0.038 0.559 0.112 -0.183 0.916 2.136 0.471 9.426 0.052 -7.443 0.641 0.033 96 1.139 0.089 1.455 0.004 3.328 0.032 15.880 0.003 23.041 0.001 -2.810 0.856 0.497 97 0.919 0.219 0.795 0.099 4.318 0.013 14.704 0.002 10.461 0.013 9.501 0.457 0.385 98 2.751 0.001 -0.049 0.795 1.965 0.001 2.627 0.181 4.584 0.023 11.433 0.086 0.200 99 1.499 0.108 0.528 0.030 1.377 0.077 3.069 0.416 5.217 0.267 -10.846 0.231 0.178 Denmark 95 77.127 0.000 1.003 0.000 1.425 0.089 1.569 0.182 4.076 0.017 0.364 0.901 0.739 96 169.473 0.000 0.839 0.000 1.045 0.146 2.025 0.007 1.902 0.290 -3.726 0.239 0.608 97 118.832 0.000 0.725 0.001 2.721 0.087 2.636 0.356 4.225 0.104 1.480 0.742 0.670 98 101.515 0.000 0.373 0.000 3.253 0.000 4.072 0.000 5.024 0.007 -3.747 0.080 0.570 99 135.565 0.000 0.585 0.000 1.639 0.000 1.617 0.046 2.542 0.203 -1.626 0.261 0.534
Finland 95 24.560 0.000 0.534 0.002 1.771 0.014 2.104 0.089 3.592 0.055 -0.712 0.846 0.606
96 25.330 0.000 0.652 0.001 2.551 0.009 1.586 0.151 1.153 0.112 -0.888 0.720 0.606
97 37.827 0.000 1.146 0.000 2.509 0.056 1.538 0.162 1.237 0.709 11.183 0.007 0.637
98 58.625 0.000 0.637 0.004 4.048 0.001 3.281 0.018 9.877 0.005 -4.904 0.489 0.334
99 87.771 0.001 0.709 0.008 4.256 0.001 -0.633 0.711 5.316 0.230 6.805 0.470 0.185
France 95 68.717 0.177 1.110 0.000 2.548 0.083 2.816 0.110 4.937 0.233 -3.015 0.321 0.608
96 137.750 0.000 0.784 0.000 1.490 0.011 6.775 0.116 5.151 0.145 -2.165 0.555 0.402
97 162.999 0.000 0.984 0.000 2.591 0.017 3.042 0.132 8.443 0.031 -0.395 0.912 0.643
98 183.891 0.000 0.744 0.000 3.094 0.000 2.552 0.080 6.254 0.002 -3.319 0.175 0.481
99 216.911 0.000 0.939 0.000 3.358 0.000 2.109 0.040 5.247 0.064 -2.629 0.102 0.558

DTECONZ 2003-02 S. Callao, B. Cuéllar, J.I. Jarne and J.A. Laínez
38
COUNTRY YEAR C p-value B p-value OPI p-value EXTI p-value FINI p-value TAX p-value Adj. R2
Germany 95 40.803 0.000 1.140 0.000 0.542 0.413 1.245 0.158 1.684 0.491 7.962 0.005 0.659 96 23.237 0.024 1.405 0.000 1.076 0.040 1.908 0.035 -0.644 0.768 1.057 0.672 0.574 97 34.543 0.000 1.648 0.000 -1.003 0.329 0.245 0.872 1.166 0.629 3.191 0.162 0.635 98 25.746 0.005 1.479 0.000 1.106 0.076 2.561 0.008 1.593 0.432 2.165 0.381 0.647 99 38.903 0.000 1.568 0.000 2.379 0.028 0.112 0.955 2.368 0.493 6.847 0.029 0.584
Greece 95 275.747 0.000 1.441 0.000 4.575 0.000 5.126 0.008 1.013 0.616 17.738 0.002 0.773
96 162.094 0.002 1.318 0.000 4.364 0.000 0.611 0.264 2.038 0.042 14.039 0.000 0.821
97 542.087 0.000 1.087 0.000 4.813 0.001 0.362 0.857 2.401 0.403 4.123 0.549 0.486
98 4849.980 0.000 0.171 0.385 2.547 0.026 1.100 0.372 -0.035 0.984 7.244 0.036 0.266
99 1851.420 0.000 1.033 0.000 16.741 0.011 3.952 0.001 -7.490 0.585 21.981 0.132 0.591
Hong Kong 95 2.469 0.000 0.594 0.000 9.257 0.000 4.406 0.263 11.751 0.004 -7.056 0.095 0.748
96 1.354 0.000 0.829 0.000 7.109 0.000 -0.425 0.546 10.358 0.000 -8.302 0.013 0.689
97 0.488 0.001 0.910 0.000 5.573 0.000 -0.349 0.647 2.332 0.326 -2.962 0.397 0.582
98 0.558 0.001 0.530 0.000 3.461 0.002 0.857 0.117 4.345 0.015 -4.015 0.055 0.605
99 1.619 0.000 0.669 0.000 6.471 0.000 3.365 0.035 13.681 0.003 -6.271 0.048 0.561
India 95 51.012 0.000 1.212 0.000 4.801 0.000 1.363 0.301 2.218 0.235 11.180 0.000 0.518
96 26.071 0.055 1.246 0.000 4.097 0.000 2.997 0.057 3.503 0.063 16.151 0.002 0.533
97 21.088 0.098 1.165 0.000 6.612 0.000 4.431 0.000 5.400 0.000 16.701 0.005 0.471
98 92.048 0.000 0.505 0.001 4.800 0.000 1.607 0.309 1.637 0.031 19.959 0.000 0.265
99 84.088 0.055 0.982 0.000 3.856 0.000 2.653 0.084 3.966 0.690 -3.581 0.474 0.709
Indonesia 95 879.816 0.000 0.565 0.001 2.483 0.000 4.207 0.306 7.595 0.077 -10.886 0.239 0.453
96 689.612 0.000 1.141 0.000 8.058 0.000 4.126 0.287 11.083 0.000 1.291 0.761 0.712
97 592.753 0.000 0.806 0.005 4.348 0.004 1.219 0.271 0.075 0.976 5.488 0.478 0.363
98 715.800 0.006 0.496 0.016 0.409 0.306 0.136 0.291 -0.113 0.841 0.865 0.663 0.221
99 388.052 0.080 0.522 0.137 5.469 0.003 -1.066 0.628 0.876 0.777 -1.283 0.821 0.561
Ireland 95 0.316 0.013 1.402 0.000 7.260 0.001 8.543 0.029 -2.151 0.819 -4.493 0.206 0.841
96 0.236 0.304 1.901 0.000 9.297 0.003 5.636 0.439 6.212 0.590 0.337 0.971 0.827
97 0.132 0.752 2.600 0.000 13.291 0.005 7.726 0.270 29.717 0.221 -37.654 0.121 0.782
98 0.119 0.688 2.511 0.000 9.003 0.001 3.454 0.598 1.402 0.892 -10.741 0.103 0.712
99 0.678 0.000 0.388 0.252 12.088 0.000 -7.712 0.148 17.366 0.001 -4.419 0.373 0.849
Italy 95 1896.420 0.000 0.716 0.000 1.775 0.001 1.225 0.015 2.312 0.073 -1.343 0.356 0.591
96 2325.310 0.001 0.805 0.000 1.378 0.027 0.791 0.153 2.262 0.154 -1.958 0.291 0.372
97 3162.690 0.000 1.000 0.000 2.269 0.006 1.449 0.103 2.447 0.278 -2.697 0.235 0.474
98 3610.550 0.000 1.305 0.000 4.355 0.000 2.251 0.016 7.953 0.026 -9.085 0.003 0.555
99 1879.460 0.314 1.999 0.000 2.351 0.000 2.001 0.096 4.299 0.697 -3.351 0.503 0.597
Japan 95 259.230 0.000 1.555 0.000 4.664 0.000 2.018 0.066 -0.353 0.891 5.540 0.219 0.669
96 236.113 0.050 1.707 0.000 4.136 0.000 2.525 0.259 0.464 0.876 6.786 0.114 0.636
97 102.456 0.000 1.878 0.000 3.991 0.000 2.131 0.155 -0.994 0.821 8.406 0.208 0.838
98 136.839 0.001 2.229 0.000 4.931 0.000 3.382 0.008 -0.852 0.779 4.327 0.233 0.611
99 101.335 0.005 1.982 0.000 3.553 0.000 3.985 0.005 -0.782 0.861 6.558 0.153 0.755
Korea 95 11849.900 0.000 0.746 0.000 1.247 0.000 1.965 0.082 -0.731 0.020 -2.339 0.104 0.677
96 9243.740 0.000 0.507 0.000 0.280 0.274 0.572 0.320 -0.660 0.012 1.118 0.493 0.571
97 5442.420 0.000 0.281 0.000 0.266 0.081 -0.090 0.658 0.132 0.493 1.557 0.067 0.302
98 10625.000 0.000 0.246 0.000 0.269 0.000 0.087 0.025 -0.086 0.268 0.929 0.025 0.318
99 9419.620 0.000 0.233 0.016 0.999 0.090 0.114 0.579 -0.071 0.844 0.514 0.729 0.219

DTECONZ 2003-02 S. Callao, B. Cuéllar, J.I. Jarne and J.A. Laínez
39
COUNTRY YEAR C p-value B p-value OPI p-value EXTI p-value FINI p-value TAX p-value Adj. R2
Malaysia 95 4.479 0.000 1.079 0.009 5.039 0.021 -7.985 0.446 8.229 0.077 -1.911 0.707 0.116
96 4.214 0.000 1.147 0.000 7.193 0.010 -5.941 0.561 3.769 0.316 3.306 0.570 0.203
97 1.631 0.000 0.341 0.000 1.700 0.005 -0.605 0.644 1.865 0.082 3.410 0.134 0.137
98 1.465 0.000 0.448 0.000 1.705 0.000 0.787 0.004 2.022 0.001 0.692 0.580 0.314
99 1.351 0.000 0.935 0.000 4.030 0.000 2.561 0.078 -1.321 0.431 -3.379 0.159 0.414
Mexico 95 10.556 0.002 0.517 0.494 3.909 0.017 -2.553 0.304 0.777 0.710 2.266 0.691 0.628
96 11.847 0.000 0.591 0.000 3.709 0.000 -2.142 0.251 3.231 0.090 3.816 0.014 0.604
97 6.603 0.000 0.847 0.000 3.053 0.000 -0.819 0.409 3.499 0.049 1.521 0.453 0.579
98 8.039 0.000 0.433 0.010 1.623 0.201 1.253 0.130 1.744 0.334 -2.311 0.478 0.322
99 4.311 0.110 0.895 0.005 2.491 0.000 -4.417 0.119 0.783 0.675 -0.995 0.279 0.386
Netherlands 95 21.582 0.000 0.742 0.000 3.195 0.000 0.281 0.905 1.486 0.465 0.411 0.893 0.548
96 29.664 0.000 1.010 0.000 5.269 0.000 1.312 0.615 5.599 0.033 -4.176 0.174 0.656
97 32.657 0.000 0.981 0.000 3.772 0.000 1.470 0.533 7.341 0.003 -2.526 0.474 0.993
98 41.315 0.000 0.519 0.001 1.145 0.202 -2.097 0.585 -1.147 0.793 13.321 0.013 0.254
99 43.423 0.000 0.441 0.001 2.755 0.003 1.513 0.583 2.171 0.753 -3.471 0.620 0.126
New Zealand 95 0.985 0.058 0.685 0.086 5.624 0.024 -8.352 0.036 7.562 0.325 -4.985 0.685 0.457
96 2.258 0.000 0.541 0.099 4.279 0.017 -14.060 0.163 5.063 0.342 -3.986 0.708 0.435
97 1.090 0.001 1.319 0.000 9.909 0.000 4.133 0.340 4.561 0.239 -14.643 0.027 0.795
98 1.482 0.000 0.729 0.000 3.236 0.000 -2.844 0.011 1.377 0.661 3.195 0.257 0.623
99 2.609 0.000 0.635 0.018 6.562 0.000 3.709 0.001 5.111 0.498 -7.129 0.334 0.448
Norway 95 36.199 0.001 0.978 0.000 0.039 0.967 0.392 0.635 6.868 0.112 -6.045 0.475 0.592
96 17.314 0.004 1.757 0.000 2.596 0.008 2.828 0.056 7.817 0.001 -0.479 0.799 0.863
97 25.948 0.006 1.367 0.000 3.331 0.083 1.260 0.332 7.170 0.168 -0.057 0.986 0.742
98 26.873 0.000 0.546 0.002 3.048 0.000 0.514 0.738 3.255 0.081 12.510 0.000 0.721
99 35.483 0.000 0.794 0.000 2.159 0.011 1.174 0.215 -1.777 0.361 2.286 0.639 0.628 Philippines 95 -0.038 0.972 0.710 0.066 12.855 0.012 -28.501 0.475 10.655 0.183 24.929 0.575 0.814 96 -0.936 0.675 -1.394 0.153 14.754 0.000 42.805 0.003 17.298 0.002 -17.500 0.040 0.770 97 -1.264 0.620 1.128 0.098 6.628 0.059 -3.070 0.572 8.758 0.100 -1.634 0.951 0.920 98 3.821 0.012 -0.066 0.835 4.371 0.001 -5.235 0.060 0.617 0.663 7.753 0.276 0.656 99 0.386 0.576 0.262 0.348 10.293 0.000 13.370 0.039 -10.559 0.007 9.858 0.158 0.987 Poland 95 12.147 0.440 0.740 0.489 0.030 0.993 11.617 0.503 0.461 0.876 -7.173 0.352 0.643 96 10.905 0.009 1.333 0.000 6.566 0.000 2.984 0.495 7.552 0.047 2.057 0.755 0.679 97 5.219 0.275 1.206 0.001 -0.703 0.761 2.416 0.283 5.284 0.042 7.150 0.544 0.403 98 12.149 0.003 0.381 0.007 1.857 0.070 4.875 0.125 -3.073 0.170 2.818 0.623 0.467 99 18.846 0.000 0.454 0.054 3.017 0.091 5.746 0.082 1.658 0.743 9.410 0.528 0.275 Portugal 95 634.670 0.000 0.298 0.001 1.788 0.001 1.582 0.147 0.792 0.542 2.870 0.458 0.512 96 899.541 0.001 0.363 0.076 1.619 0.055 4.738 0.032 2.316 0.296 -0.033 0.994 0.552 97 584.528 0.000 0.622 0.000 3.165 0.090 3.424 0.007 -1.201 0.726 2.401 0.705 0.500 98 792.224 0.000 0.596 0.000 4.354 0.003 3.332 0.035 1.226 0.650 -0.408 0.948 0.441 99 1033.750 0.000 0.466 0.010 2.744 0.098 4.658 0.108 -2.519 0.700 11.603 0.085 0.617 Singapore 95 0.445 0.026 1.061 0.030 6.691 0.006 -2.939 0.832 11.657 0.044 5.644 0.469 0.606 96 0.303 0.064 1.053 0.077 6.734 0.005 -0.725 0.949 18.655 0.036 -18.940 0.023 0.681 97 0.331 0.000 0.644 0.000 6.345 0.000 14.452 0.003 0.540 0.883 -1.868 0.517 0.702 98 0.426 0.001 0.603 0.000 3.329 0.003 2.737 0.135 4.236 0.060 -4.581 0.240 0.531 99 0.639 0.010 1.111 0.000 14.051 0.000 2.516 0.551 4.605 0.562 -3.240 0.700 0.431 South Africa 95 7.657 0.000 1.528 0.000 5.878 0.000 1.787 0.753 12.456 0.007 -9.460 0.145 0.851 96 4.846 0.000 1.870 0.000 3.696 0.005 1.921 0.646 3.310 0.362 -7.362 0.002 0.759 97 6.589 0.001 1.155 0.000 1.017 0.376 3.274 0.228 8.548 0.078 -2.348 0.566 0.423 98 8.190 0.000 0.553 0.000 4.194 0.001 3.558 0.065 0.095 0.976 2.282 0.495 0.369 99 2.395 0.028 1.299 0.000 3.354 0.001 0.006 0.995 3.359 0.191 0.734 0.820 0.588

DTECONZ 2003-02 S. Callao, B. Cuéllar, J.I. Jarne and J.A. Laínez
40
COUNTRY YEAR C p-value B p-value OPI p-value EXTI p-value FINI p-value TAX p-value Adj. R2
Spain 95 339.214 0.001 0.868 0.000 1.534 0.053 4.390 0.004 1.683 0.176 0.615 0.737 0.690 96 728.296 0.000 0.848 0.001 3.229 0.020 4.479 0.001 0.281 0.266 -0.005 0.998 0.521 97 699.156 0.004 1.303 0.000 4.134 0.000 9.833 0.000 6.356 0.120 -7.622 0.171 0.663 98 1201.050 0.000 0.799 0.000 6.488 0.000 6.050 0.000 -7.174 0.194 -9.110 0.013 0.736 99 1231.590 0.000 0.897 0.000 7.262 0.000 4.662 0.218 -3.371 0.581 -9.193 0.010 0.392 Sweden 95 29.566 0.000 1.059 0.000 1.824 0.002 -2.543 0.140 3.426 0.250 -2.977 0.024 0.608 96 42.357 0.000 1.318 0.000 3.484 0.000 0.118 0.939 3.276 0.140 -5.742 0.155 0.675 97 36.877 0.000 1.469 0.000 4.563 0.000 1.081 0.379 4.408 0.179 8.949 0.082 0.634 98 48.822 0.000 0.940 0.000 3.809 0.001 3.652 0.098 3.297 0.332 -0.365 0.938 0.436 99 59.022 0.000 1.092 0.000 3.790 0.000 2.618 0.118 5.198 0.324 5.832 0.262 0.292 Switzerland 95 208.928 0.000 0.846 0.000 5.486 0.000 -0.702 0.759 5.301 0.115 -6.990 0.229 0.600 96 204.301 0.000 1.067 0.000 3.844 0.000 2.467 0.136 3.702 0.151 -5.143 0.220 0.606 97 188.034 0.000 1.197 0.000 2.946 0.028 -2.974 0.123 2.698 0.181 -7.751 0.091 0.655 98 225.532 0.000 1.287 0.000 4.002 0.002 0.416 0.835 1.705 0.568 -2.958 0.329 0.537 99 382.057 0.000 1.306 0.000 6.242 0.000 1.526 0.235 3.705 0.074 -4.553 0.046 0.453 Thailand 95 64.040 0.000 0.913 0.000 7.248 0.000 3.721 0.129 11.719 0.002 0.879 0.871 0.375 96 15.579 0.000 0.708 0.000 4.695 0.000 -1.166 0.382 5.705 0.011 -1.322 0.746 0.264 97 13.529 0.000 0.369 0.000 1.338 0.000 1.389 0.000 0.597 0.189 -0.321 0.636 0.343 98 16.385 0.000 0.321 0.000 0.890 0.000 0.334 0.141 1.298 0.000 0.478 0.539 0.379 99 9.334 0.000 0.626 0.000 1.648 0.001 -0.244 0.663 1.518 0.115 1.972 0.344 0.473 Turkey 95 708.676 0.003 1.410 0.000 1.416 0.005 3.866 0.000 2.894 0.012 -1.593 0.370 0.852 96 1217.890 0.004 2.788 0.000 1.108 0.009 0.650 0.224 0.051 0.955 6.287 0.002 0.949 97 1704.380 0.019 2.935 0.197 1.431 0.699 7.372 0.042 8.848 0.236 -3.294 0.817 0.478 98 4126.820 0.029 1.813 0.042 0.459 0.609 3.762 0.052 3.273 0.119 -2.617 0.111 0.438 99 5471.660 0.518 6.126 0.244 4.655 0.632 13.542 0.309 5.067 0.756 22.651 0.654 0.094 United Kingdom 95 1.124 0.000 1.076 0.000 6.323 0.000 0.481 0.494 6.176 0.000 5.418 0.062 0.673 96 1.190 0.000 1.203 0.000 7.068 0.000 1.023 0.028 6.836 0.000 4.645 0.059 0.647 97 1.192 0.000 1.071 0.000 6.552 0.000 1.053 0.078 4.138 0.021 1.520 0.454 0.627 98 1.511 0.000 0.658 0.000 4.950 0.000 2.149 0.001 5.926 0.000 1.371 0.493 0.446 99 1.786 0.000 0.771 0.000 5.133 0.000 1.031 0.225 2.472 0.304 4.181 0.099 0.261 United States 95 8.591 0.000 0.652 0.000 2.947 0.000 -1.102 0.123 2.438 0.023 3.264 0.026 0.479 96 8.880 0.000 0.689 0.000 2.579 0.001 -0.900 0.145 0.372 0.776 2.560 0.340 0.522 97 8.603 0.000 0.707 0.000 2.676 0.000 -2.323 0.000 0.716 0.319 4.694 0.000 0.521 98 10.378 0.000 0.474 0.000 2.262 0.000 -0.473 0.079 0.254 0.612 3.589 0.000 0.282 99 11.904 0.000 0.349 0.000 2.605 0.000 0.118 0.821 2.878 0.000 5.793 0.000 0.191

DTECONZ 2003-02 S. Callao, B. Cuéllar, J.I. Jarne and J.A. Laínez
41
Documentos de Trabajo
Facultad de Ciencias Económicas y Empresariales. Universidad de Zaragoza
2002-01: “Evolution of Spanish Urban Structure During the Twentieth Century”. Luis Lanaspa, Fernando Pueyo y Fernando Sanz. Department of Economic Analysis, University of Zaragoza.
2002-02: “Una Nueva Perspectiva en la Medición del Capital Humano”. Gregorio Giménez y Blanca Simón. Departamento de Estructura, Historia Económica y Economía Pública, Universidad de Zaragoza.
2002-03: “A Practical Evaluation of Employee Productivity Using a Professional Data Base”. Raquel Ortega. Department of Business, University of Zaragoza.
2002-04: “La Información Financiera de las Entidades No Lucrativas: Una Perspectiva Internacional”. Isabel Brusca y Caridad Martí. Departamento de Contabilidad y Finanzas, Universidad de Zaragoza.
2003-01: “Las Opciones Reales y su Influencia en la Valoración de Empresas”. Manuel Espitia y Gema Pastor. Departamento de Economía y Dirección de Empresas, Universidad de Zaragoza.
2003-02: “The Valuation of Earnings Components by the Capital Markets. An International Comparison”. Susana Callao, Beatriz Cuéllar, José Ignacio Jarne and José Antonio Laínez. Departament of Accounting and Finance, University of Zaragoza.