c d n.s. - nature · supplementary figure 2: cellular ampk and antioxidant enzymes. (a) immunoblot...
TRANSCRIPT
an.s.
dc
b
n.s.
n.s.
n.s.
Supplementary Figure 1
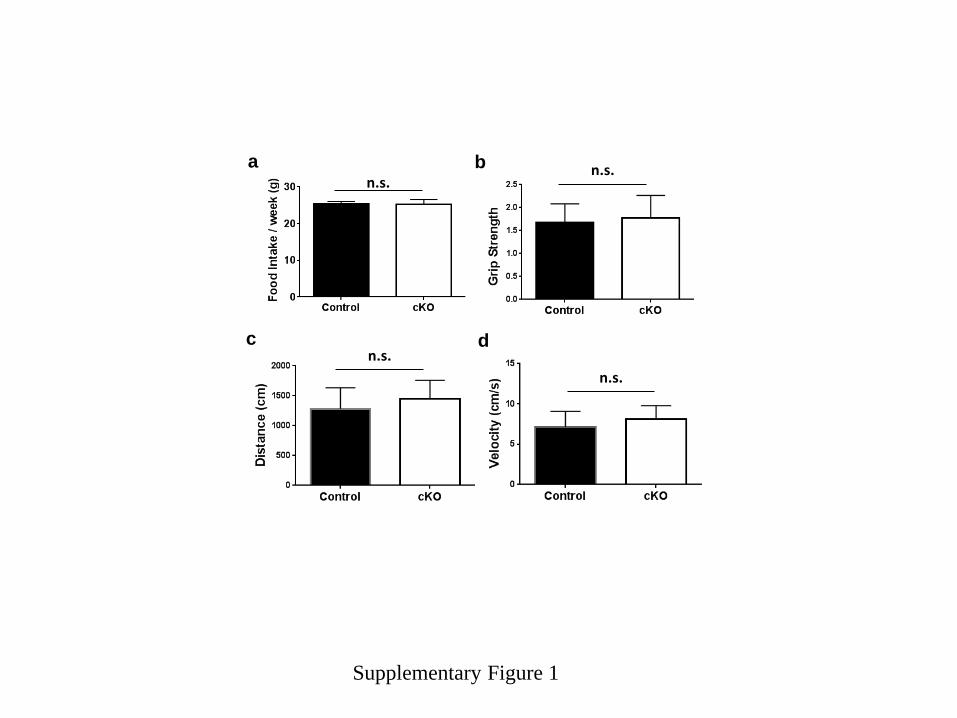
Supplementary figure 1: Food intake and physical capacities. (a) Amount of food intake
weekly (n=20, t-test, error bars=s.d.). (b) Grip strength (n=6, t-test, error bars=s.d.). (c) Total
running distance (n=6, t-test, error bars=s.d.). (d) Running velocity (n=6, t-test, error bars=s.d.).

Supplementary Figure 2
AMPK
p-AMPK
GAPDH
Control cKOa
b Control cKO
50
kDa
50
37
60
kDa
26
50

Supplementary figure 2: Cellular AMPK and antioxidant enzymes. (a) Immunoblot analysis
for total AMPK, phosphorylated AMPK and GAPDH expression in liver lysates. (b) Immunoblot
analysis for catalase, superoxide dismutase 2 (SOD2), and β-actin expression in liver lysates.
Supplementary Figure 3
a b
d
c
Ox
yg
en
flu
x
(pm
olO
2/S
*mg
mit
oc
ho
nd
ria
l p
rote
in)
S+R+O M M M M M
Control
cKO
e
15
kDa
37
15
n.s.
**
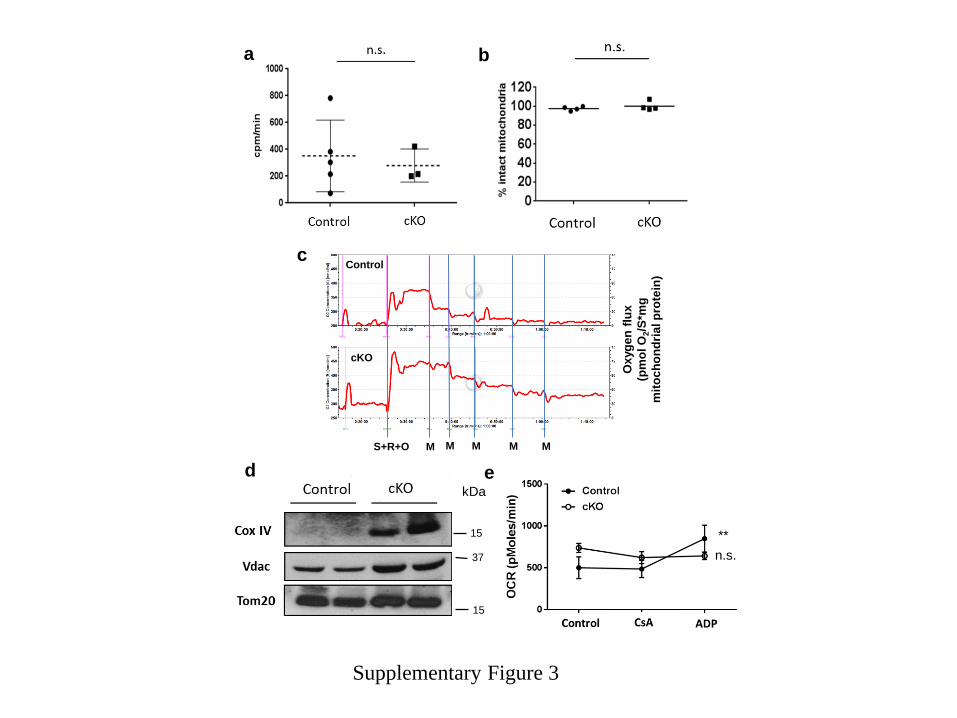
Supplementary figure 3: Inner/outer membrane integrity and respiration measurement in
Ant2-deleted liver mitochondria. (a) Pyruvate uptake capacity measured by [14C]Pyruvate
uptake in isolated liver mitochondria (n=3~5, t-test, error bars=s.d.). (b) Oxidation of reduced
cytochrome c in isolated liver mitochondria (n=4, t-test, error bars=s.d.). (c) Representative traces
of oxygen flux of liver mitochondria assessed with the Oroboros O2k respirometer in the presence
of succinate, rotenone, and oligomycin (S+R+O), and malonate (M) (n=4). (d) Immunoblot
analysis in isolated mitochondria for cytochrome c oxidase (Cox) IV, voltage dependent anion
channel (Vdac), and Tom20. (e) Mitochondrial OCR assessed with XF24 extracellular flux
analyzer (Seahorse) under sequential treatment of CsA and ADP (n=4; **P<0.01 by one-way
ANOVA, error bars=s.d.).

Supplementary Figure 4
**
Control Ucp2 cKOAnt2 Ucp2 double cKO
a
c
ControlAnt2 Ucp2 double cKOb

Supplementary figure 4: Phenotypes of Ucp2 cKO liver and mitochondria. (a) qRT-PCR
analysis for Ucp2 mRNA expression in the liver (n=3; **P<0.01 by t-test, error bars=s.d.). (b)
Multiphoton microscopy analysis after the liver was perfused with Rhodamine-123 (n=3). Scale
bar; 20 µm. (c) Liver gross appearance under a high fat/high fructose diet (8 weeks) (n>4).

Control CATR treatmenta
Control CATR+
*
cbControl
CATR+
Supplementary Figure 5

Supplementary figure 5: Systemic CATR treatment a high fat and high fructose diet. Wild
type C57BL6 mice were subjected to a high fat (40%)/high fructose (20%) diet for 8 weeks. During
the last two weeks, CATR (1 mg/kg) or vehicle (PBS) (Control) was administered daily by
intraperitoneal injection. (a) Liver gross appearance. (b) Liver histology analysis with H&E
staining. Scale bars; 100 µm (left panels) and 20 µm (right panels). (c) Total triglyceride levels in
the liver (*P<0.05 by t-test, error bars=s.d.).

a b
Supplementary Figure 6
Control cKO SK
Ant1
37
25
kDa
Control cKO K
37
25
Ant2
20
15
kDa
Tom20

Supplementary figure 6: Uncropped scan of critical immunoblots. Original uncropped scan
data of Fig. 1b (a) and Fig. 2d (b) are shown here.

Blood Chemistry Control Ant2cKO
ALT (U/L) 58.8 ± 16.4 69.1 ± 29.9
AST (U/L) 235.8 ± 124.1 241.9 ± 102.4
Albumin (g/dL) 3.9 ± 0.3 3.8 ± 0.3
Bilirubin (mg/dL) 0.5 ± 0.2 0.6 ± 0.2
Total Protein (g/dL) 6.2 ± 0.3 5.7 ± 0.5
Lactate (mM) 6.3 ± 1.7 6.7 ± 2
Glucose** (mg/dL) 212.6 ± 103.7 125.2 ± 9
Cholesterol** (mg/dL) 130.0 ± 29.1 81.8 ± 16.2
Insulin** (ng/ml) 1071 ± 251 470 ± 99
Ketone Body*** (µM) 111.2 ± 49.4 325.2 ± 128.0
Urea* (mM) 6.1 ± 1.2 5.0 ± 1.2
Supplementary Table 1: Blood chemistry of control and Ant2 cKO mice (16-18 weeks old, n>10) *P < 0.05, **p<0.01, ***p<0.001