cannington water pollution control plant - durham...cannington water pollution control plant annual...
TRANSCRIPT
Cannington Water Pollution Control Plant Annual Performance Report 2015
Cannington Water Pollution Control Plant
Annual Performance Report 2015

Cannington Water Pollution Control Plant Annual Performance Report 2015
The Regional Municipality of Durham
Cannington Water Pollution Control Plant 2015 Annual Performance Report Environmental Compliance Approval (ECA): 8730-8CYU2X Dated June 28, 2012 The Cannington Water Pollution Control Plant (WPCP) Performance Report provides staff, stakeholders and customers an overview of the performance of the Cannington WPCP in 2015. Further, this report fulfills the annual reporting requirements of the Ontario Ministry of the Environment and Climate Change (MOECC). The performance report demonstrates the commitment of ensuring that the WPCP continues to deliver wastewater services to our customers in an environmentally responsible manner. For a description of terms and abbreviations used in this report, refer to the glossary at the end of the report.
Water Pollution Control Plant Process Description
General The Cannington WPCP is owned and operated by the Regional Municipality of Durham in accordance with the terms and conditions of the ECA. The plant is located in the Community of Cannington in the Township of Brock. This MOECC Class One wastewater treatment plant is designed to treat wastewater at rated capacity of 1,068 cubic metres per day (m3/d) and utilizes two seasonal retention facultative waste stabilization lagoons. The Cannington WPCP has a service population of 2,100 residents.The treated effluent is discharged to the Beaver River in accordance with the conditions listed in the ECA.
Raw Influent Wastewater is collected in approximately 12.6 km of sanitary sewers in the Cannington service area and is conveyed to the treatment facility by a single sanitary sewage pumping station located on Laidlaw Street. Aluminum sulphate is added at the station to enhance the settling of solids and phosphorus removal.
Lagoon Treatment The Cannington WPCP is a seasonal wastewater stabilization lagoon facility consisting of a two cell lagoon system that is operated as a seasonal retention facultative waste stabilization pond providing a retention time of 190 days. Flow to the Cannington WPCP is distributed to each cell through an influent distribution chamber. Each cell is equipped with an outlet chamber and outfall pipe. The ECA permits for two seasonal discharge periods per year. Spring discharge is from March 1st to May 31st and fall discharge is from October 1st to December 31st. Prior to and during discharging to the Beaver River, samples are collected to verify the effluent will meet the limits established in the ECA.
Environmental Compliance Approval Under Condition 9 (4) of ECA #8730-8CYU2X the Region of Durham must produce an annual report that must contain the following information:
Page 2 of 14

Cannington Water Pollution Control Plant Annual Performance Report 2015
a) Summary and interpretation of all monitoring data and a comparison to the effluent limits outlined in Condition 5, including an overview of the success and adequacy of the works
The raw wastewater flowing into the Cannington WPCP is analyzed for its chemical and physical composition. Monitoring of the raw wastewater is performed in accordance with the conditions in the ECA. Table 2 summarizes the raw wastewater characteristics during the reporting period. The Cannington WPCP effluent was determined to be compliant with the approval limits during the reporting period. The plant operated at 76.2% of its rated capacity and received a maximum daily flow of 1573 m3/d on June 30th, 2015. An Inflow and Infiltration study is planned for 2017. The total treated effluent discharged to the Beaver River in 2015 was calculated to be 269,477 m3. Table 4 provides a tabulation of effluent results. b) Description of any operating problems encountered and corrective actions taken: No operating problems were encountered in 2015. c) Maintenance of major equipment Jetting was performed on the Laidlaw Street pumping station dry well discharge line and the first 10 feet of the forcemain toward the lagoon system. d) Summary of any effluent quality assurance or control measures In-house lab test results are compared to the results of the Regional Environmental Laboratory on comparable samples to determine the in-house accuracy. Results were found to be in a comparable range. e) Summary of the calibration and maintenance carried out on all effluent monitoring
equipment • Calibration of the influent flow meter located at Laidlaw Street Pumping Station occurred in
April and September, 2015. • Temperature and pH are monitored in the field, all other routine process control tests are
performed at the Lake Simcoe WPCP laboratory in Beaverton. All monitoring and laboratory equipment is calibrated and maintained according to manufacturer’s specifications.
f) Estimate of sludge settling capacity of the lagoon and annual depletion The annual depletion of the sludge settling capacity is negligible. There was no removal of biosolids during the reporting period. g) Efforts made and results achieved in meeting the effluent objectives • The Regional Municipality of Durham strives to achieve the best effluent quality at all times
consistently remaining well below ECA limits. • The annual average daily flow did not exceed the rated capacity of 1,068m3/d during the
reporting period. • The objective for CBOD5 was exceeded twice during spring discharge on April 7th and 8th. • The maximum objective for pH was exceeded twice during spring discharge on April 20th
and May 25th, and once during fall discharge on October 19th. • Best efforts will continue to be applied to maintain results below objectives.
Page 3 of 14
Cannington Water Pollution Control Plant Annual Performance Report 2015
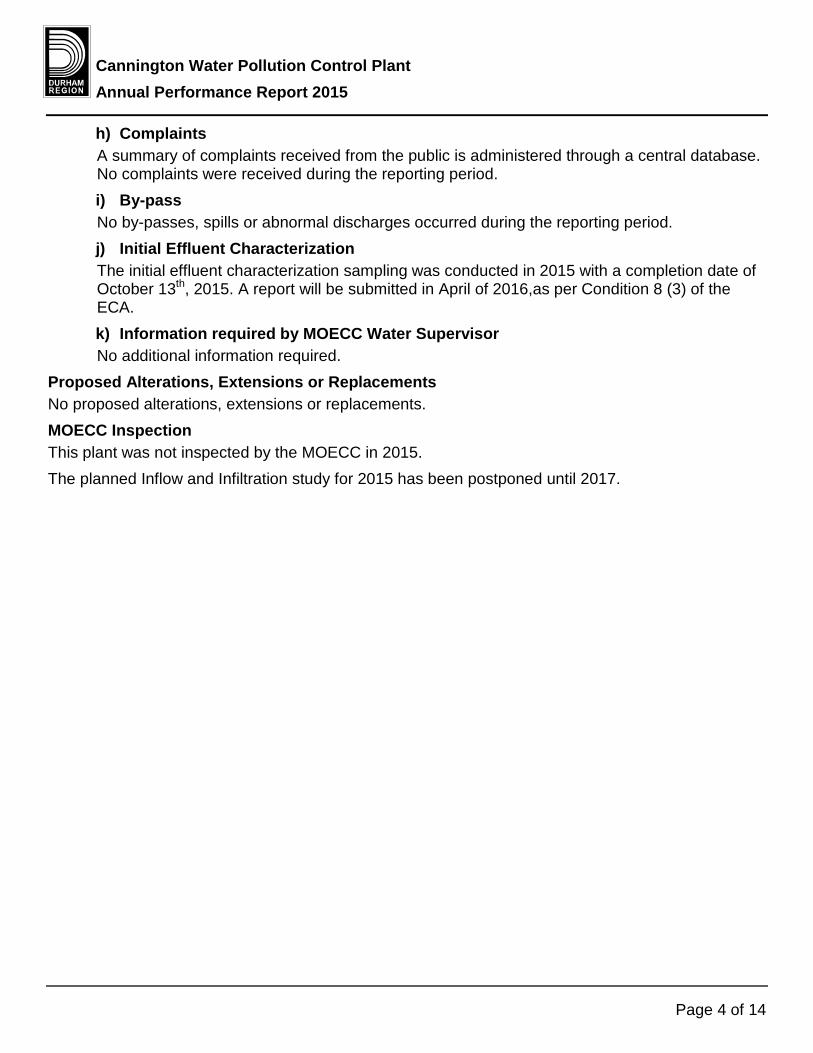
h) Complaints A summary of complaints received from the public is administered through a central database. No complaints were received during the reporting period. i) By-pass No by-passes, spills or abnormal discharges occurred during the reporting period. j) Initial Effluent Characterization The initial effluent characterization sampling was conducted in 2015 with a completion date of October 13th, 2015. A report will be submitted in April of 2016,as per Condition 8 (3) of the ECA. k) Information required by MOECC Water Supervisor No additional information required.
Proposed Alterations, Extensions or Replacements No proposed alterations, extensions or replacements. MOECC Inspection This plant was not inspected by the MOECC in 2015. The planned Inflow and Infiltration study for 2015 has been postponed until 2017.
Page 4 of 14

Cannington Water Pollution Control Plant Annual Performance Report 2015
Summary of Tables Table 1 Raw Influent Flows
Month
Total Flow to Plant -metered at the Laidlaw
Street Pumping Station m3
Average Daily Flow m3/d
Maximum Daily Flow m3/d
Minimum Daily Flow m3/d
January 27,370 883 1,124 733
February 19,568 699 760 653
March 29,283 945 1,321 633
April 40,027 1,334 1,529 1,067
May 28,711 926 1,094 785
June 32,212 1,074 1,573 784
July 26,678 861 1,237 656
August 20,049 847 791 486
September 16,295 543 616 300
October 16,261 525 617 450
November 19,447 648 765 494
December 22,008 710 860 607
Total 297,909 N/A N/A N/A
Annual Average 24,826 814 N/A N/A
Minimum 16,261 N/A N/A 300
Maximum 40,027 N/A 1,573 N/A
ECA Requirement N/A 1,068* N/A N/A
Met Compliance N/A Yes N/A N/A *Annual Average

Cannington Water Pollution Control Plant Annual Performance Report 2015
Table 2 Raw Influent Analyses
Month
CBOD5 avg.
conc. mg/L
CBOD5 loading
kg/d
BOD5 avg.
conc. mg/L
BOD5 loading
kg/d
TSS avg.
conc. mg/L
TSS loading
kg/d
TP avg.
conc. mg/L
TP loading
kg/d
January 109 96 148 131 200 177 5.0 4.4
February 135 94 156 109 198 138 5.0 3.5
March 125 118 155 146 209 198 4.4 4.2
April 106 141 165 220 231 308 6.0 8.0
May 94 87 111 103 148 137 3.6 3.3
June 68 73 87 93 97 104 2.9 3.1
July 84 72 116 100 177 152 3.8 3.3
August 127 108 167 141 253 214 5.9 5.0
September 211 115 379 206 530 288 8.2 4.5
October 142 75 186 98 237 124 7.7 4.0
November 178 115 265 172 348 226 7.7 5.0
December 93 66 128 91 163 116 6.2 4.4
Average 123 100 172 140 233 189 5.5 4.5
Minimum 68 66 87 91 97 104 2.9 3.1
Maximum 211 141 379 220 530 308 8.2 8.0
Sampling Frequency Requirement Met
Yes N/A Yes N/A Yes N/A Yes N/A
Page 6 of 14

Cannington Water Pollution Control Plant Annual Performance Report 2015
Table 2 Raw Influent Analyses continued
Month DP
avg. conc. mg/L
TKN avg.
conc. mg/L
TKN loading
kg/d
TAN avg.
conc. mg/L
TAN loading
kg/d
pH min.
pH max.
Temp. Degrees Celsius
Min
Temp. Degrees Celsius
Max January 2.45 39.73 35 26.10 23 7.26 7.90 7.3 11.2
February 2.45 39.90 28 24.30 17 7.27 8.20 4.8 8.7
March 1.80 32.58 31 22.30 21 6.72 7.90 7.8 8.7
April 2.38 30.65 41 15.00 20 7.23 7.70 8.1 9.1
May 1.81 31.88 30 21.50 20 7.50 7.90 10.2 12.9
June 1.37 25.62 28 17.20 18 6.87 8.04 15.0 25.0
July 1.99 34.40 30 25.90 22 7.15 7.80 14.6 16.6
August 2.93 47.70 40 33.00 28 7.50 7.90 15.8 18.3
September 4.13 70.18 38 38.00 21 7.25 7.80 16.3 17.8
October 4.01 68.93 36 45.50 24 7.58 8.46 11.9 16.6
November 3.98 65.00 42 39.30 25 7.30 8.32 7.1 16.4
December 3.16 50.58 36 33.80 24 7.47 8.33 9.0 12.5
Average 2.71 44.76 36 28.49 23 N/A N/A N/A N/A
Minimum 1.37 25.62 28 15.00 17 6.72 N/A 4.8 N/A
Maximum 4.13 70.18 42 45.50 28 N/A 8.46 N/A 25.0
Sampling Frequency Requirement Met
N/A N/A N/A Yes N/A Yes Yes Yes Yes
Page 7 of 14

Cannington Water Pollution Control Plant Annual Performance Report 2015
Table 3 Calculated Effluent Flows
Month Calculated
Effluent Flow m3
January N/D
February N/D
March N/D
April 127,454
May 13,778
June N/D
July N/D
August N/D
September N/D
October 75,308
November 52,937
December N/D
Total 269,477
Annual Average 67,369
Minimum 13,778
Maximum 127,454
Page 8 of 14

Cannington Water Pollution Control Plant Annual Performance Report 2015
Table 4 Final Effluent Analyses
Month
CBOD5 avg.
conc. mg/L
CBOD5 loading
kg/d
BOD5 avg.
conc. mg/L
BOD5 loading
kg/d
TSS avg.
conc. mg/L
TSS loading
kg/d
TP avg.
conc. mg/L
TP loading
kg/d
TP loading
kg/month
January N/D N/D N/D N/D N/D N/D N/D N/D N/D
February N/D N/D N/D N/D N/D N/D N/D N/D N/D
March N/D N/D N/D N/D N/D N/D N/D N/D N/D
April 11.30 77 16.80 114 7.30 49.7 0.08 0.5 10.2
May 3.90 5 4.20 6 8.90 11.8 0.17 0.2 2.3
June N/D N/D N/D N/D N/D N/D N/D N/D N/D
July N/D N/D N/D N/D N/D N/D N/D N/D N/D
August N/D N/D N/D N/D N/D N/D N/D N/D N/D
September N/D N/D N/D N/D N/D N/D N/D N/D N/D
October 1.40 6 1.60 7 3.00 0.1 0.06 0.3 4.5
November 3.60 32 3.70 33 5.10 44.9 0.15 1.3 7.9
December N/D N/D N/D N/D N/D N/D N/D N/D N/D
Total N/A N/A N/A N/A N/A N/A N/A N/A 24.9*
Average 5.05 26 6.58 33 6.08 30.8 0.12 0.6 3.0
Minimum 1.40 5 1.60 6 3.00 0.1 0.06 0.2 2.3
Maximum 11.30 77 16.80 114 8.90 49.7 0.17 1.3 10.2
ECA Limit 25** N/A N/A N/A 30** N/A N/A N/A 117*
ECA Objective 15 N/A N/A N/A 20 N/A 0.5 N/A N/A
LSPRS N/A N/A N/A N/A N/A N/A 0.25** N/A 97* Within Compliance Yes N/A N/A N/A Yes N/A Yes N/A Yes
Sampling Frequency Requirement Met
Yes N/A Yes N/A Yes N/A Yes N/A N/A
*Total Annual Loading, kg/year **Annual Average Concentration
Page 9 of 14
Cannington Water Pollution Control Plant Annual Performance Report 2015
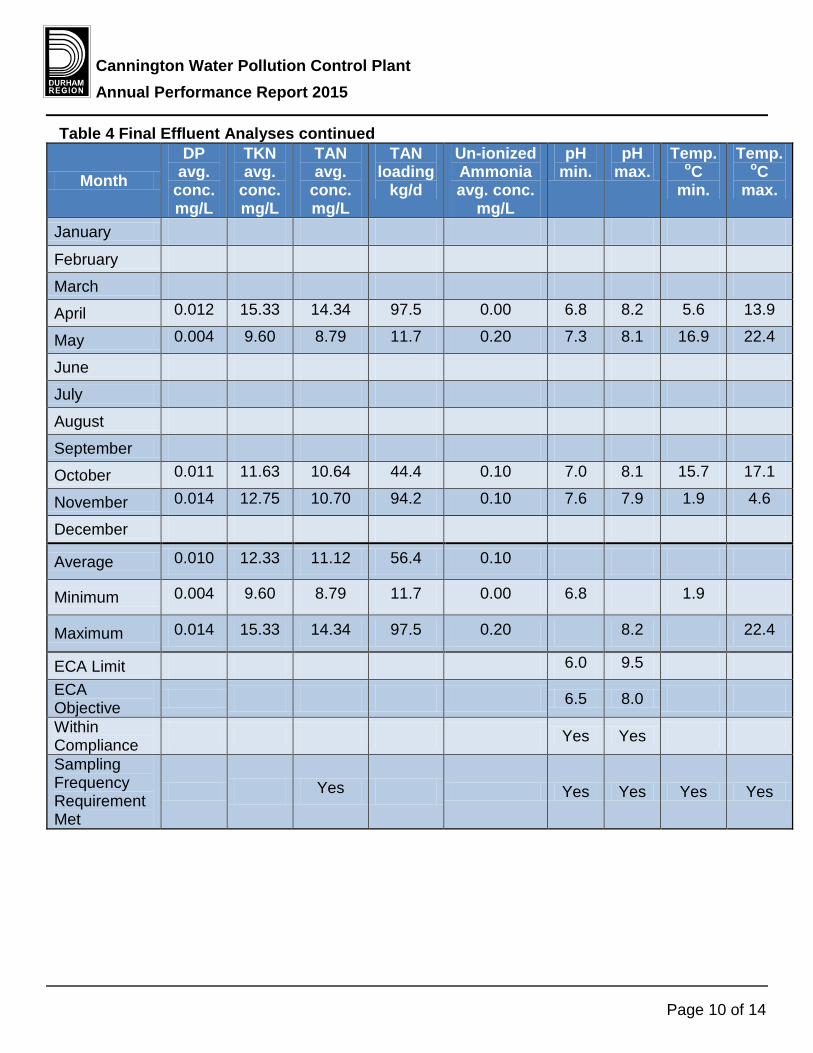
Table 4 Final Effluent Analyses continued
Month DP
avg. conc. mg/L
TKN avg.
conc. mg/L
TAN avg.
conc. mg/L
TAN loading
kg/d
Un-ionized Ammonia avg. conc.
mg/L
pH min.
pH max.
Temp. oC
min.
Temp. oC
max.
January N/D N/D N/D N/D N/D N/D N/D N/D N/D
February N/D N/D N/D N/D N/D N/D N/D N/D N/D
March N/D N/D N/D N/D N/D N/D N/D N/D N/D
April 0.012 15.33 14.34 97.5 0.00 6.8 8.2 5.6 13.9
May 0.004 9.60 8.79 11.7 0.20 7.3 8.1 16.9 22.4
June N/D N/D N/D N/D N/D N/D N/D N/D N/D
July N/D N/D N/D N/D N/D N/D N/D N/D N/D
August N/D N/D N/D N/D N/D N/D N/D N/D N/D
September N/D N/D N/D N/D N/D N/D N/D N/D N/D
October 0.011 11.63 10.64 44.4 0.10 7.0 8.1 15.7 17.1
November 0.014 12.75 10.70 94.2 0.10 7.6 7.9 1.9 4.6
December N/D N/D N/D N/D N/D N/D N/D N/D N/D
Average 0.010 12.33 11.12 56.4 0.10 N/A N/A N/A N/A
Minimum 0.004 9.60 8.79 11.7 0.00 6.8 N/A 1.9 N/A
Maximum 0.014 15.33 14.34 97.5 0.20 N/A 8.2 N/A 22.4
ECA Limit N/A N/A N/A N/A N/A 6.0 9.5 N/A N/A
ECA Objective N/A N/A N/A N/A N/A 6.5 8.0 N/A N/A
Within Compliance
N/A N/A N/A N/A N/A Yes Yes N/A N/A
Sampling Frequency Requirement Met
N/A N/A Yes N/A N/A Yes Yes Yes Yes
Page 10 of 14

Cannington Water Pollution Control Plant Annual Performance Report 2015
Table 5 Chemical Usage
Month Aluminum Sulphate
(litres) January 15,134 February 9,161 March 7,067 April 22,407 May 16,914 June 3,975 July 0 August 8,538 September 5,782 October 12,432 November 8,818 December 15,496 Total 125,724
Page 11 of 14

Cannington Water Pollution Control Plant Annual Performance Report 2015
Glossary of Terms Annual Average Concentration
An arithmetic mean of the seasonal average concentrations of a contaminant in the effluent calculated for any particular year.
Annual Average Loading The value obtained by multiplying the seasonal average concentration of a contaminant by the Average Daily Flow over the same calendar year.
Average Daily Flow The cumulative total sewage flow to the sewage works during a calendar year divided by the number of days during which sewage was flowing to the sewage works that year.
BOD5 Five Day Biochemical Oxygen Demand (also known as total BOD5) means five day biochemical oxygen demand measured in an unfiltered sample and includes carbonaceous and nitrogenous oxygen demand.
By-pass Any discharge from any portion of the works other than in accordance with the conditions of the ECA.
CBOD5 -Five Day Carbonaceous Biochemical Oxygen Demand Means a five day carbonaceous (nitrification inhibited) biochemical oxygen demand measured in an unfiltered sample..
Conc. Concentration The abundance of a constituent divided by the total volume of a mixture.
Daily Concentration Means the concentration of a contaminant in the effluent discharged over any single day, as measured by a composite or grab sample, whichever is required.
DP – Dissolved Phosphorus This is the soluble form of phosphorus present in the wastewater.
ECA Environmental Compliance Approval The primary regulatory instrument for each water pollution control plant.
E. coli - (Escherichia coli) Refers to the thermally tolerant forms of Escherichia that can survive at 44.5 degrees Celsius.
Final Effluent Means sewage discharge via the water pollution control plant outfall after undergoing the full train of unit processes as listed in the Environmental Compliance Approval.
Geometric Mean Density Is the nth root of the product of multiplication of the results of n number of samples over the period specified.
Grab Sample A single sample taken at a specific moment in time, when tested provides a snapshot of the conditions at the time the sample was retrieved.
kg - kilogram Basic unit of mass in the metric system
kg/d – kilogram per day LSPRS - Lake Simcoe Phosphorus Reduction Strategy
The ECA issued on June 28, 2012 introduced additional phosphorus objectives to comply with the requirements of the Lake Simcoe Phosphorus Reduction Strategy (2010) prepared under the Lake Simcoe Protection Plan (2009).
Page 12 of 14
Cannington Water Pollution Control Plant Annual Performance Report 2015
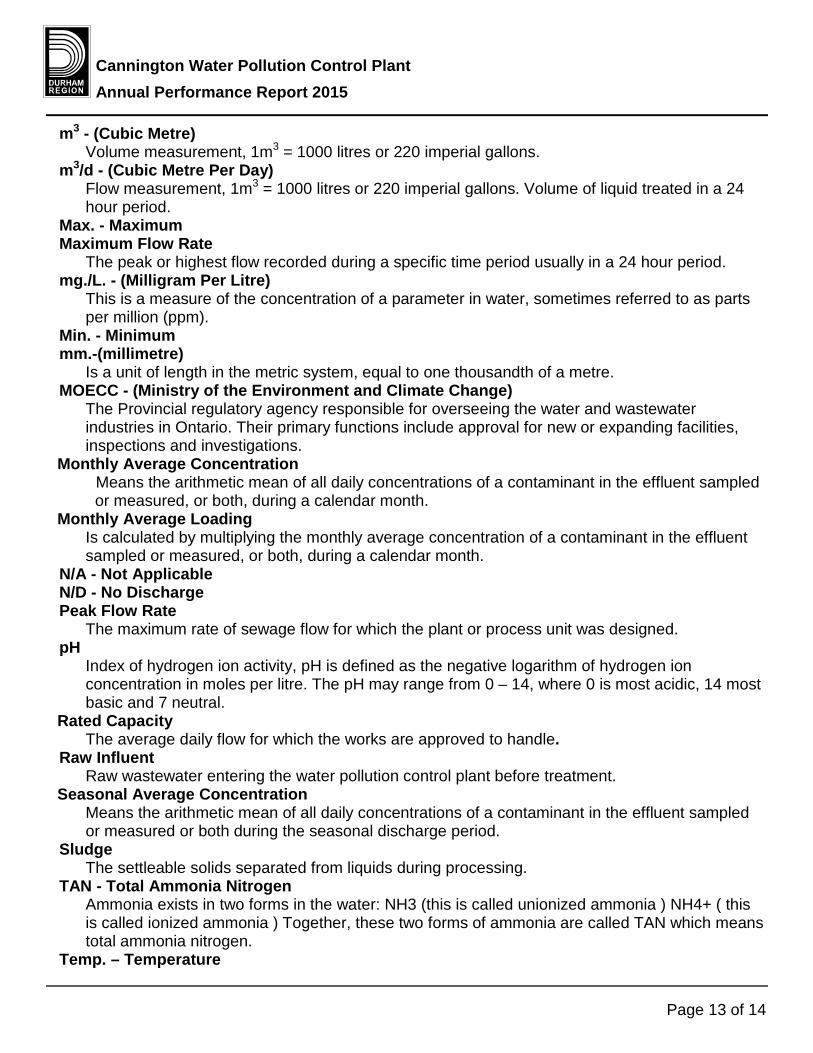
m3 - (Cubic Metre) Volume measurement, 1m3 = 1000 litres or 220 imperial gallons.
m3/d - (Cubic Metre Per Day) Flow measurement, 1m3 = 1000 litres or 220 imperial gallons. Volume of liquid treated in a 24 hour period.
Max. - Maximum Maximum Flow Rate
The peak or highest flow recorded during a specific time period usually in a 24 hour period. mg./L. - (Milligram Per Litre)
This is a measure of the concentration of a parameter in water, sometimes referred to as parts per million (ppm).
Min. - Minimum mm.-(millimetre)
Is a unit of length in the metric system, equal to one thousandth of a metre. MOECC - (Ministry of the Environment and Climate Change)
The Provincial regulatory agency responsible for overseeing the water and wastewater industries in Ontario. Their primary functions include approval for new or expanding facilities, inspections and investigations.
Monthly Average Concentration Means the arithmetic mean of all daily concentrations of a contaminant in the effluent sampled or measured, or both, during a calendar month.
Monthly Average Loading Is calculated by multiplying the monthly average concentration of a contaminant in the effluent sampled or measured, or both, during a calendar month.
N/A - Not Applicable N/D - No Discharge Peak Flow Rate
The maximum rate of sewage flow for which the plant or process unit was designed. pH
Index of hydrogen ion activity, pH is defined as the negative logarithm of hydrogen ion concentration in moles per litre. The pH may range from 0 – 14, where 0 is most acidic, 14 most basic and 7 neutral.
Rated Capacity The average daily flow for which the works are approved to handle.
Raw Influent Raw wastewater entering the water pollution control plant before treatment.
Seasonal Average Concentration Means the arithmetic mean of all daily concentrations of a contaminant in the effluent sampled or measured or both during the seasonal discharge period.
Sludge The settleable solids separated from liquids during processing.
TAN - Total Ammonia Nitrogen Ammonia exists in two forms in the water: NH3 (this is called unionized ammonia ) NH4+ ( this is called ionized ammonia ) Together, these two forms of ammonia are called TAN which means total ammonia nitrogen.
Temp. – Temperature
Page 13 of 14
Cannington Water Pollution Control Plant Annual Performance Report 2015
Total Annual Loading Is calculated by summarizing the total monthly loadings within a calendar year.
Total Monthly Loading Is calculated by multiplying the total monthly flow by the monthly average concentration.
TP - Total Phosphorus A laboratory analyses to determine the total amount of non-soluble and soluble phosphorus present in the wastewater.
TSS - Total Suspended Solids A laboratory analyses to measure particles that are larger than 2 microns found in the wastewater.
TS - Total Solids Is a measure of the suspended and dissolved solids in the wastewater and in biosolids.
Unionized Ammonia Nitrogen Un-ionized ammonia refers to all forms of ammonia in water with the exception of the ammonium ion (NH4 +).
WPCP - Water Pollution Control Plant A facility composed of a variety of treatment processes that collectively treat wastewater
If this information is required in an accessible format, please contact 1-800-372-1102 extension 3488
Page 14 of 14

Corbett Creek Water Pollution Control Plant Annual Performance Report 2015
Corbett Creek Water Pollution Control Plant
Annual Performance Report 2015

Corbett Creek Water Pollution Control Plant Annual Performance Report 2015
Page 2 of 16
The Regional Municipality of Durham
Corbett Creek Water Pollution Control Plant 2015 Annual Performance Report Environmental Compliance Approval (ECA): 7560-9PPRJC Dated November 12, 2014 Environmental Compliance Approval (Air): 1581-9URJFE Dated May 13, 2015 The Corbett Creek Water Pollution Control Plant (WPCP) Performance Report provides staff, stakeholders and customers a performance overview of the Corbett Creek WPCP in 2015. Further, this report fulfills the annual reporting requirements of the Ontario Ministry of the Environment and Climate Change (MOECC). The performance report demonstrates the commitment of ensuring that the WPCP continues to deliver wastewater services to our customers in an environmentally responsible manner. For a description of terms and abbreviations used in this report, refer to the glossary at the end of the report.
Water Pollution Control Plant Process Description
General The Corbett Creek WPCP is owned and operated by the Regional Municipality of Durham in accordance with the terms and conditions of the ECA. The plant is located in the Town of Whitby. Corbett Creek WPCP treats wastewater from the Whitby, Brooklin and Oshawa service areas. The Corbett Creek WPCP services approximately 147,805 residents.
The Corbett Creek WPCP is designed to treat wastewater at an average daily flow rate of 84,350 cubic metres per day (m3/d) as noted in the ECA. The plant is an MOECC Class Four conventional activated sludge treatment plant that utilizes the following processes to treat wastewater:
• raw influent pumping, • preliminary treatment, • primary treatment, • phosphorus removal system • secondary treatment, • disinfection (chlorination/dechlorination), • solids treatment.
Raw Influent Pumping Wastewater is collected through approximately 450 km of sanitary sewers in the Town of Whitby, the Brooklin urban area, and the City of Oshawa. It is conveyed to the plant by gravity and by several sanitary sewage pumping stations located in the collection system.
Preliminary Treatment Screening: Two automatic, mechanically cleaned screens remove paper products and large material that could harm pumps and process equipment. Screenings removed in this process are compacted for landfill disposal.
Corbett Creek Water Pollution Control Plant Annual Performance Report 2015
Page 3 of 16
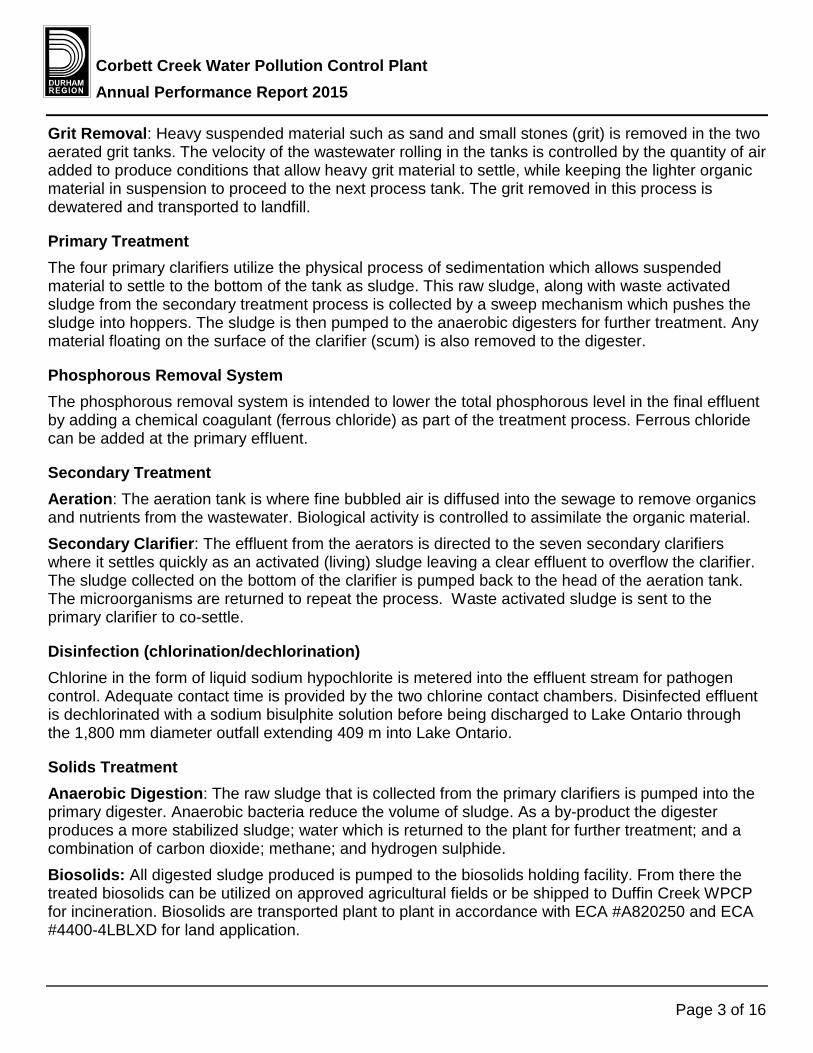
Grit Removal: Heavy suspended material such as sand and small stones (grit) is removed in the two aerated grit tanks. The velocity of the wastewater rolling in the tanks is controlled by the quantity of air added to produce conditions that allow heavy grit material to settle, while keeping the lighter organic material in suspension to proceed to the next process tank. The grit removed in this process is dewatered and transported to landfill.
Primary Treatment The four primary clarifiers utilize the physical process of sedimentation which allows suspended material to settle to the bottom of the tank as sludge. This raw sludge, along with waste activated sludge from the secondary treatment process is collected by a sweep mechanism which pushes the sludge into hoppers. The sludge is then pumped to the anaerobic digesters for further treatment. Any material floating on the surface of the clarifier (scum) is also removed to the digester.
Phosphorous Removal System The phosphorous removal system is intended to lower the total phosphorous level in the final effluent by adding a chemical coagulant (ferrous chloride) as part of the treatment process. Ferrous chloride can be added at the primary effluent.
Secondary Treatment Aeration: The aeration tank is where fine bubbled air is diffused into the sewage to remove organics and nutrients from the wastewater. Biological activity is controlled to assimilate the organic material. Secondary Clarifier: The effluent from the aerators is directed to the seven secondary clarifiers where it settles quickly as an activated (living) sludge leaving a clear effluent to overflow the clarifier. The sludge collected on the bottom of the clarifier is pumped back to the head of the aeration tank. The microorganisms are returned to repeat the process. Waste activated sludge is sent to the primary clarifier to co-settle.
Disinfection (chlorination/dechlorination) Chlorine in the form of liquid sodium hypochlorite is metered into the effluent stream for pathogen control. Adequate contact time is provided by the two chlorine contact chambers. Disinfected effluent is dechlorinated with a sodium bisulphite solution before being discharged to Lake Ontario through the 1,800 mm diameter outfall extending 409 m into Lake Ontario.
Solids Treatment Anaerobic Digestion: The raw sludge that is collected from the primary clarifiers is pumped into the primary digester. Anaerobic bacteria reduce the volume of sludge. As a by-product the digester produces a more stabilized sludge; water which is returned to the plant for further treatment; and a combination of carbon dioxide; methane; and hydrogen sulphide. Biosolids: All digested sludge produced is pumped to the biosolids holding facility. From there the treated biosolids can be utilized on approved agricultural fields or be shipped to Duffin Creek WPCP for incineration. Biosolids are transported plant to plant in accordance with ECA #A820250 and ECA #4400-4LBLXD for land application.

Corbett Creek Water Pollution Control Plant Annual Performance Report 2015
Page 4 of 16
Environmental Compliance Approval Under Condition 10 (6) of ECA #7560-9PPRJC the Region of Durham must produce an annual report that contains the following information:
a) Summary and interpretation of all monitoring data and a comparison to the effluent limits
The Corbett Creek WPCP effluent was determined to be compliant with the ECA approval limits during the reporting period. The plant operated at an average of 59% of its rated capacity and received a maximum daily flow of 114,684 m3/d on April 9. See tables for effluent results. b) Description of any operating problems encountered and corrective actions taken: • A high flow event caused a by-pass on June 23rd. All corrective actions were taken as per
the ECA. • High strength influent was received from a local industry causing some elevated effluent
TSS. The plant process was modified biologically to adapt to the additional organic material.
c) Maintenance of major equipment Major maintenance items in 2015 included:
• Replaced secondary clarifier bridges #5 and #6 gearboxes, • Replaced building ‘M’ groundwater pumps, • Rebuilt raw sludge pumps #2, 3, 4, and standby, • Rebuild primary clarifier scum troughs, • Rebuilt primary clarifier #1 and #2 scraper arms, • Replaced primary clarifier #1 and secondary clarifier #7 gear boxes, • Removed corner sweeps from secondary clarifier #10, • Rebuilt corner sweeps on secondary clarifier #7, • Installed new radar level control on primary digester #2, • Rebuilt south plant chlorine pumps, • Rebuilt final effluent sodium bisulphate pumps, • Installed bisulfate exhaust and alarm in chemical containment building, • Installed new heating unit in building ‘B’, • Installed new gearbox in screenings rag packer, • Conducted maintenance on Turblex blowers. d) Summary of any effluent quality assurance or control measures • In-house lab test results are compared to the results of the Regional Environmental
Laboratory on comparable samples to determine the in-house accuracy. Results were found to be in a comparable range.
• On-line instrumentation is verified by WPCP operators using various field or laboratory test equipment
e) Summary of the calibration and maintenance carried out • Calibration of the effluent flow meter and the secondary clarifier flow meter occurred on
May, June, and October 2015. • Calibration of the AutoCat 9000 chlorine analyzer was conducted on July 25th 2015.

Corbett Creek Water Pollution Control Plant Annual Performance Report 2015
Page 5 of 16
• Calibration of the in-house lab pH meter is conducted regularly. • On-line instrumentation is verified by WPCP operators using various field or laboratory test
equipment. f) Effluent Objectives The Regional Municipality of Durham strives to achieve the best effluent quality at all times, remaining below the ECA compliance limits. The annual average daily flow did not exceed the rated capacity of 84,350 m3/d. The total suspended solids objective of 15.0 mg/L was exceeded in 33 of 413 samples (8%). These exceedances were the result of an upstream industrial discharge causing issues at the plant during the first six months of 2015. Total phosphorus objective of 0.8 mg/L was exceeded in 33 of 303 samples (11%). This corresponded primarily with the issues causing the total suspended solids exceedances noted above. The total ammonia nitrogen objective of 8.0 mg/L during the summer months was exceeded on six occasions out of 250 samples (2.4%). Two exceedances were the result of low dissolved oxygen events and four were the result of low biomass in two of the seven aeration tanks for a brief period. The total chlorine residual objective of “non-detect” was exceeded in 40 of 363 samples (11%). Results were consistently low but detectable by our instrument. Best efforts and process adjustments will continue to be applied to maintain results below objectives. g) Biosolids Production:
Tabulation of Volume of Sludge Generated: The volume of sludge removed from Corbett Creek WPCP in 2015 was 85,389 m3. Outline of Anticipated Volumes to be Generated in the next Reporting Period: There is no increase of sludge volume expected in the next reporting period. Summary of Locations to Where Sludge is Disposed: Duffin Creek WPCP – 46,837 m3 or 54.8% Agricultural Fields – 38,552 m3 or 45.2%
h) Summary of Complaints and Steps Taken to Address the Complaint:
One odour complaint was received in January from a local business owner. The concern was investigated and identified as odour from a local industry. i) By-passes and Spills
One primary by-pass of 153 m3 occurred on June 23rd. This event was due to extremely high flows caused by heavy rains. All sampling and testing was conducted as per the ECA. The MOECC was notified and an incident number 124312 was received.
Corbett Creek Water Pollution Control Plant Annual Performance Report 2015
Page 6 of 16
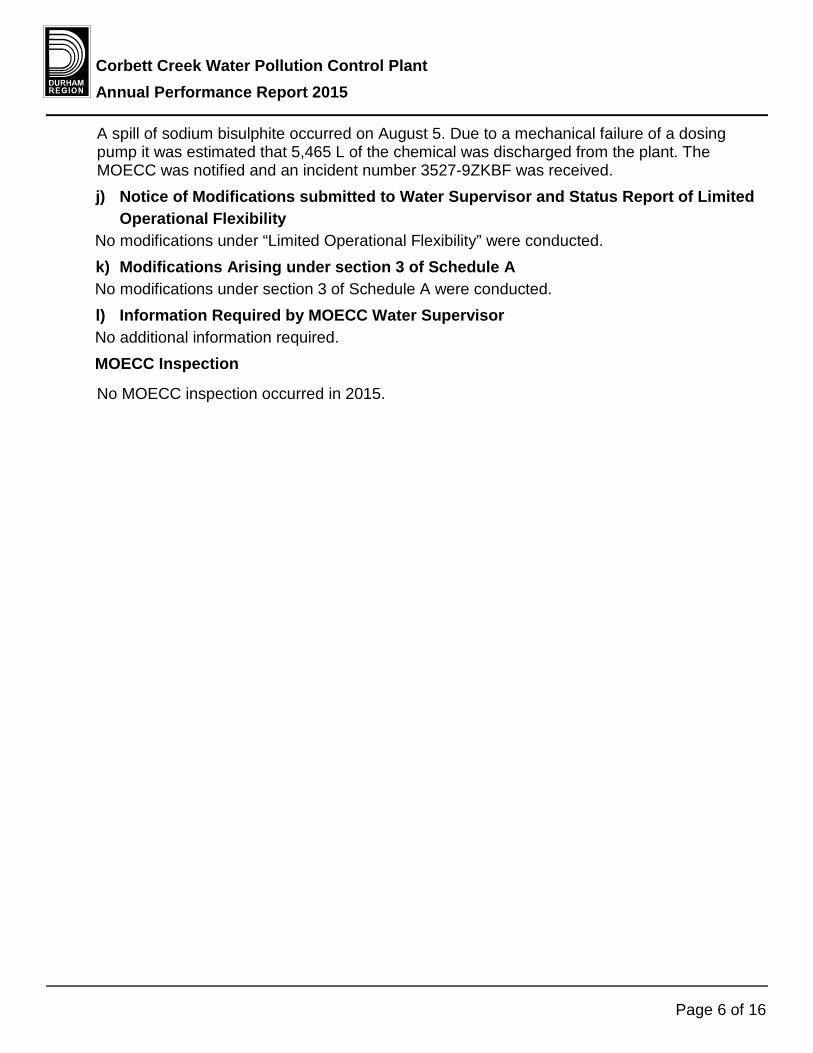
A spill of sodium bisulphite occurred on August 5. Due to a mechanical failure of a dosing pump it was estimated that 5,465 L of the chemical was discharged from the plant. The MOECC was notified and an incident number 3527-9ZKBF was received. j) Notice of Modifications submitted to Water Supervisor and Status Report of Limited
Operational Flexibility No modifications under “Limited Operational Flexibility” were conducted. k) Modifications Arising under section 3 of Schedule A No modifications under section 3 of Schedule A were conducted. l) Information Required by MOECC Water Supervisor No additional information required. MOECC Inspection
No MOECC inspection occurred in 2015.

Corbett Creek Water Pollution Control Plant Annual Performance Report 2015
Table 1 Raw Influent Flows
Month
Total Flow to Plant -metered at the final effluent
m3
Average Daily Flow m3/d
Maximum Daily Flow m3/d
January 1,517,232 48,943 61,350
February 1,264,042 45,144 53,974
March 1,520,282 49,041 58,398
April 1,777,100 48,314 97,228
May 1,497,729 48,314 55,845
June 1,810,696 60,357 114,684
July 1,561,459 50,370 68,133
August 1,440,189 46,458 55,838
September 1,358,040 45,268 54,017
October 1,494,930 48,224 102,991
November 1,475,921 49,197 57,494
December 1,411,249 45,524 53,465
Average 1,510,739 49,668* N/A Maximum N/A N/A 114,684 ECA Limit N/A 84,350 N/A Met Compliance N/A Yes N/A
*Annual Average Daily Flow

Corbett Creek Water Pollution Control Plant Annual Performance Report 2015
Page 8 of 16
Table 2 Raw Influent Analyses
Month
CBOD5 avg.
conc. mg/L
CBOD5 loading
kg/d
BOD5 avg.
conc. mg/L
BOD5 loading
kg/d
TSS avg. conc. mg/L
TSS loading
kg/d
TP avg. conc. mg/L
TP loading
kg/d
January 105 5,143 144 7,066 121 5,916 4.1 201
February 123 5,553 152 6,873 112 5,035 5.3 239
March 122 5,997 145 7,113 102 5,007 4.3 212
April 94 4,526 131 6,322 107 5,150 3.6 173
May 139 6,716 178 8,600 200 9,664 4.6 221
June 96 5,787 129 7,772 166 10,014 3.0 180
July 156 7,870 181 9,117 152 7,638 3.9 198
August 131 6,074 159 7,375 185 8,577 4.4 204
September 95 4,321 121 5,462 136 6,160 3.5 158
October 65 3,145 80 3,840 95 4,588 3.4 166
November 77 3,808 102 5,030 100 4,897 4.0 196
December 89 4,071 127 5,782 131 5,978 3.6 166
Average 108 5,354 137 6,823 134 6,645 4.0 198
Minimum 65 3,145 80 3,840 95 4,588 3.0 158
Maximum 156 7,870 181 9,117 200 10,014 5.3 239
Sampling Frequency Requirement Met
N/A N/A Yes N/A Yes N/A Yes N/A

Corbett Creek Water Pollution Control Plant Annual Performance Report 2015
Page 9 of 16
Table 2 Raw Influent Analyses continued
Month
DP avg. conc. mg/L
TKN avg.
conc. mg/L
TAN avg.
conc. mg/L
TAN loading
kg/d
pH min.
pH max.
January 2.18 34.28 24 1,186 7.40 8.20
February 2.42 39.75 25 1,145 7.40 8.30
March 1.98 33.78 23 1,124 7.02 8.10
April 1.76 30.72 24 1,145 6.88 8.30
May 1.96 36.85 24 1,151 7.00 8.01
June 1.20 27.40 16 989 7.25 7.91
July 1.48 39.10 21 1,064 6.70 7.91
August 1.23 31.73 19 889 6.90 7.93
September 1.44 32.80 22 991 7.20 7.96
October 1.76 28.73 18 861 6.80 7.74
November 1.92 36.38 23 1,135 6.80 7.80
December 1.89 35.77 26 1,184 7.30 7.74
Average 1.77 33.94 22 1,099 N/A N/A
Minimum 1.20 27.40 16 861 6.70 N/A
Maximum 2.42 39.75 26 1,186 N/A 8.30
Sampling Frequency Requirement Met
N/A Yes Yes N/A Yes Yes

Corbett Creek Water Pollution Control Plant Annual Performance Report 2015
Page 10 of 16
Table 3 Final Effluent Analyses
Month
CBOD5 avg.
conc. mg/L
CBOD5 loading
kg/d
TSS avg.
conc. mg/L
TSS loading
kg/d
TP avg.
conc. mg/L
TP loading
kg/d
TAN avg.
conc. mg/L
summer
TAN avg.
conc. mg/L
winter
TAN loading
kg/d
January 4.3 208 7.8 383 0.70 34.3 N/A 0.69 33.9
February 5.4 245 8.9 402 0.66 30.0 N/A 1.54 69.5
March 4.6 226 8.6 423 0.66 32.4 N/A 1.55 76.1
April 4.3 206 12.9 625 0.52 25.2 N/A 1.65 79.9
May 4.6 220 12.7 612 0.65 31.3 2.25 N/A 108.6
June 4.7 283 11.6 697 0.57 34.7 3.31 N/A 199.5
July 3.0 150 7.5 377 0.44 22.0 1.14 N/A 57.2
August 2.0 95 6.9 322 0.42 19.6 0.66 N/A 30.5
September 1.6 70 4.8 218 0.50 22.8 0.88 N/A 39.6
October 2.6 125 7.5 360 0.43 20.6 0.51 N/A 24.5
November 2.7 134 8.6 421 0.48 23.4 N/A 0.35 17.2
December 2.2 100 5.8 264 0.58 26.3 N/A 1.06 48.3
Average 3.5 173 8.6 429 0.55 27.4 1.45 1.14 65.4
Minimum 1.6 70 4.8 218 0.42 19.6 0.35 0.51 17.2
Maximum 5.4 283 12.9 697 0.70 34.7 1.65 3.31 199.5
ECA Requirement 25 N/A 25 N/A 1.0 N/A 16 24 N/A
ECA Objective 15 N/A 15 N/A 0.8 N/A 8 18 N/A
Within Compliance Yes N/A Yes N/A Yes N/A Yes Yes N/A
Sampling Frequency Requirement Met
Yes N/A Yes N/A Yes N/A Yes Yes N/A
Corbett Creek Water Pollution Control Plant Annual Performance Report 2015
Page 11 of 16
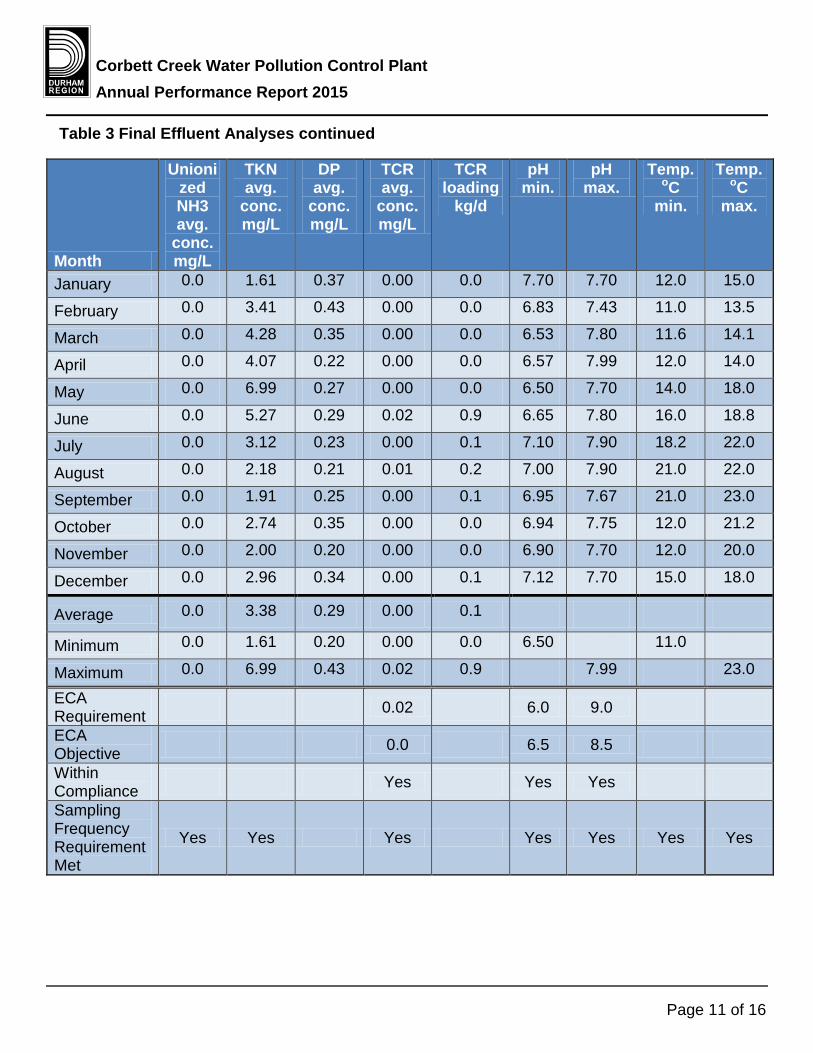
Table 3 Final Effluent Analyses continued
Month
Unionized NH3 avg.
conc. mg/L
TKN avg.
conc. mg/L
DP avg.
conc. mg/L
TCR avg.
conc. mg/L
TCR loading
kg/d
pH min.
pH max.
Temp. oC
min.
Temp. oC
max.
January 0.0 1.61 0.37 0.00 0.0 7.70 7.70 12.0 15.0
February 0.0 3.41 0.43 0.00 0.0 6.83 7.43 11.0 13.5
March 0.0 4.28 0.35 0.00 0.0 6.53 7.80 11.6 14.1
April 0.0 4.07 0.22 0.00 0.0 6.57 7.99 12.0 14.0
May 0.0 6.99 0.27 0.00 0.0 6.50 7.70 14.0 18.0
June 0.0 5.27 0.29 0.02 0.9 6.65 7.80 16.0 18.8
July 0.0 3.12 0.23 0.00 0.1 7.10 7.90 18.2 22.0
August 0.0 2.18 0.21 0.01 0.2 7.00 7.90 21.0 22.0
September 0.0 1.91 0.25 0.00 0.1 6.95 7.67 21.0 23.0
October 0.0 2.74 0.35 0.00 0.0 6.94 7.75 12.0 21.2
November 0.0 2.00 0.20 0.00 0.0 6.90 7.70 12.0 20.0
December 0.0 2.96 0.34 0.00 0.1 7.12 7.70 15.0 18.0
Average 0.0 3.38 0.29 0.00 0.1 N/A N/A N/A N/A
Minimum 0.0 1.61 0.20 0.00 0.0 6.50 N/A 11.0 N/A
Maximum 0.0 6.99 0.43 0.02 0.9 N/A 7.99 N/A 23.0
ECA Requirement
N/A N/A N/A 0.02 N/A 6.0 9.0 N/A N/A
ECA Objective
N/A N/A N/A 0.0 N/A 6.5 8.5 N/A N/A
Within Compliance
N/A N/A N/A Yes N/A Yes Yes N/A N/A
Sampling Frequency Requirement Met
Yes Yes N/A Yes N/A Yes Yes Yes Yes

Corbett Creek Water Pollution Control Plant Annual Performance Report 2015
Page 12 of 16
Table 4 Escherichia Coliform Sampling
Month
Number of Samples
Geometric Mean
Density January 4 29
February 4 16
March 4 6
April 5 4
May 4 19
June 5 18
July 4 22
August 4 36
September 5 21
October 4 71
November 4 56
December 5 32
ECA Requirement N/A 200
ECA Objective N/A 150
Within Compliance N/A Yes
Sampling Frequency Requirement Met
Yes N/A

Corbett Creek Water Pollution Control Plant Annual Performance Report 2015
Page 13 of 16
Table 6 Energy and Chemical Usage
Month
Total Plant Flow
(cubic metres)
Ferrous Chloride (litres)
Sodium Hypochlorite (kilograms as
chlorine)
Sodium Bisulphite
(Litres)
Hydro (kWh)
Natural Gas
(cubic metres)
January 1,517,232 180,310 8,191 26,287 773,111 66,617
February 1,264,042 179,610 7,339 23,470 741,334 48,512
March 1,520,282 201,400 7,949 30,977 778,617 56,436
April 1,777,100 183,340 9,835 22,863 733,864 51,914
May 1,497,729 167,640 8,885 12,991 728,253 39,295
June 1,810,696 167,640 14,239 10,495 706,049 30,301
July 1,561,459 182,910 12,116 8,869 763,183 29,813
August 1,440,189 193,300 12,483 18,708 730,439 23,337
September 1,358,040 181,150 12,238 15,240 703,958 23,394
October 1,494,930 196,800 10,719 14,785 721,971 28,077
November 1,475,921 177,270 8,059 14,656 676,536 37,074
December 1,411,249 174,680 6,763 14,885 687,689 38,846
Total 18,128,869 2,186,050 118,816 214,226 8,745,004 473,616
Corbett Creek Water Pollution Control Plant Annual Performance Report 2015
Page 14 of 16
Glossary of Terms Aeration Tank
A vessel in which a biological process is carried out which involves bacterial organisms or biochemically active substances derived from such organisms. This encompasses a combination of aerobic, and anoxic processes.
Anaerobic Digestion Is a series of biological processes in which microorganisms break down biodegradable material in the absence of oxygen.
Average Daily Flow The cumulative total sewage flow to the sewage works during a calendar year divided by the number of days during which sewage was flowing to the sewage works that year.
Biosolids Organic material recovered from wastewater sludge.
BOD5 Five Day Biochemical Oxygen Demand (also known as totalBOD5) means five day biochemical oxygen demand measured in an unfiltered sample and includes carbonaceous and nitrogenous oxygen demand.
By-pass A diversion of sewage around one or more unit processes within the Sewage Treatment Plant with the diverted sewage flows being returned to the Sewage Treatment Plant treatment train upstream of the Final effluent sampling location, and discharging to the environment through the Sewage Treatment Plant outfall.
CBOD5 -Five day Carbonaceous Biochemical Oxygen Demand A five day carbonaceous (nitrification inhibited) biochemical oxygen demand measured in an unfiltered sample.
Conc. - Concentration DP – Dissolved Phosphorus
This is the soluble form of phosphorus present in the wastewater. ECA - Environmental Compliance Approval
The primary regulatory instrument for each WPCP. E. coli - (Escherichia coli)
Refers to the thermally tolerant forms of Escherichia that can survive at 44.5 degrees Celsius. Final Effluent
Sewage discharge via the WPCP outfall after undergoing the full train of unit processes as listed in the Environmental Compliance Approval.
Geometric Mean Density Is the nth root of the product of multiplication of the results of n number of samples over the period specified.
Grab Sample A single sample taken at a specific moment in time, a snapshot of the conditions at the time the sample was retrieved.

Corbett Creek Water Pollution Control Plant Annual Performance Report 2015
Page 15 of 16
m3 - (Cubic Metre) Volume measurement, 1m3 = 1000 litres or 220 imperial gallons.
m3/d - (Cubic Metres Per Day) Flow measurement, 1m3 = 1000 litres or 220 imperial gallons. Volume of liquid treated in a 24 hour period.
Max. – Maximum Maximum Flow Rate
The peak or highest flow recorded during a specific time period usually in a twenty-four (24) period.
mg/L - (Milligram Per Litre) This is a measure of the concentration of a parameter in water or wastewater, sometimes referred to as parts per million (ppm).
Min. – Minimum mm - (millimetre)
Is a unit of length in the metric system, equal to one thousandth of a metre. MOECC - (Ministry of the Environment and Climate Change)
The Provincial regulatory agency responsible for overseeing the water and wastewater industries in Ontario. Their primary functions include approval for new or expanding facilities, inspections and investigations.
Monthly Average Concentration The arithmetic mean of all daily concentrations of a contaminant in the effluent sampled or measured, or both, during a calendar month.
Monthly Average Loading Calculated by multiplying the monthly average concentration of a contaminant in the effluent sampled or measured, or both, during a calendar month.
N/A - Not Applicable pH
Index of hydrogen ion activity, pH is defined as the negative logarithm of hydrogen ion concentration in moles per litre. The pH may range from 0 – 14, where 0 is most acidic, 14 most basic and 7 neutral.
Raw Influent Raw wastewater entering the water pollution control plant before treatment.
Septage Partially treated sludge from a septic tank.
Sludge The settleable solids separated from liquids during processing.
TAN -Total Ammonia Nitrogen Ammonia exists in two forms in the water: NH3 (this is called unionized ammonia ) NH4+ ( this is called ionized ammonia ) Together, these two forms of ammonia are called TAN which means total ammonia nitrogen.

Corbett Creek Water Pollution Control Plant Annual Performance Report 2015
Page 16 of 16
TCR -Total Chlorine Residual The total amount of chlorine in water, including the combined chlorine and the free available chlorine.
Temp. – Temperature TP -Total Phosphorus
A laboratory analyses to determine the total amount of particulate and soluble phosphorus present in the wastewater.
TSS -Total Suspended Solids A laboratory analyses to measure particles that are larger than 2 microns found in the wastewater.
TS -Total Solids Is a measure of the suspended and dissolved solids in the wastewater and in biosolids.
Unionized Ammonia Nitrogen Un-ionized ammonia refers to all forms of ammonia in water with the exception of the ammonium ion (NH4 +).
WPCP - Water Pollution Control Plant Is typically a facility composed of a variety of treatment processes that collectively treat the wastewater.
If this information is required in an accessible format, please contact 1-800-372-1102 extension 3488

Courtice Water Pollution Control Plant Annual Performance Report 2015
Courtice Water Pollution Control Plant
Annual Performance Report 2015

Courtice Water Pollution Control Plant Annual Performance Report 2015
Page 2 of 17
The Regional Municipality of Durham
Courtice Water Pollution Control Plant 2015 Annual Performance Report Environmental Compliance Approval (ECA): 3393-68RLD4 Dated January 28, 2005 Environmental Compliance Approval (Air): 7446-6AGNQZ Dated April 30, 2005 The Courtice Water Pollution Control Plant (WPCP) Performance Report provides staff, stakeholders and customers a performance overview of the Courtice WPCP in 2015. Further, this report fulfills the annual reporting requirements of the Ontario Ministry of the Environment and Climate Change (MOECC). The performance report demonstrates the commitment of ensuring that the WPCP continues to deliver wastewater services to our customers in an environmentally responsible manner. For a description of terms and abbreviations used in this report, refer to the glossary at the end of the report.
Water Pollution Control Plant Process Description
General The Courtice WPCP is owned and operated by the Regional Municipality of Durham in accordance with the terms and conditions of the ECA. The plant is located in the Municipality of Clarington (Courtice). The Courtice WPCP treats wastewater from the Oshawa and Courtice service areas in the Regional Municipality of Durham. The Courtice WPCP receives the majority of its flow from the Harmony Creek WPCP, receiving an average of 60% of the total collected sewage. The Courtice WPCP services 60% of the catchment population or approximately 107,703 residents. The Courtice WPCP is designed to treat wastewater at an average daily flow rate of 68,200 cubic metres per day (m3/d) with a peak flow rate of 180,000 m3/d as noted in the ECA. The plant is an MOECC Class Four conventional activated sludge treatment plant that utilizes the following processes to treat wastewater:
• raw influent pumping, • preliminary treatment, • primary treatment, • secondary treatment, • phosphorus removal system, • disinfection (chlorination/dechlorination), • solids treatment – anaerobic digestion.
Raw Influent Pumping Wastewater collected through approximately 656 km of sanitary sewers in Oshawa and Courtice is conveyed to the Harmony Creek sanitary sewage pumping station (SSPS) located at the Harmony Creek WPCP. A portion, approximately 60% of the influent flow is diverted to the Harmony Creek SSPS and conveyed 6.4 km in a 1050 mm diameter force main to the Courtice WPCP.

Courtice Water Pollution Control Plant Annual Performance Report 2015
Page 3 of 17
Preliminary Treatment Screening: Two automatic, mechanically cleaned screens remove paper products and large material that could harm pumps and process equipment. Screenings removed in the process are compacted for landfill disposal. Grit Removal: Heavy suspended material such as sand and small stones (grit) is removed in the two aerated grit tanks. The velocity of the wastewater rolling in the tanks is controlled by the quantity of air added to produce conditions that allow heavy grit material to settle, while keeping the lighter organic material in suspension to proceed to the next process tank. The grit removed in the process is dewatered and transported to landfill. Primary Treatment The two primary clarifiers utilize the physical process of sedimentation which allows the suspended material to settle to the bottom of the tank as sludge. This raw sludge, along with waste activated sludge from the secondary treatment process is collected by a flight and chain mechanism which pushes the sludge into hoppers. The sludge is then pumped to the anaerobic digesters for further treatment. Any material floating on the surface of the clarifier (scum) is also removed to the digester.
Secondary Treatment Aerated Bioreactor: The bioreactors are comprised of two distinct sections. The first section is an anoxic zone, where no oxygen is introduced and allows for potential denitrification. The effluent from the primary clarifiers flows into the anoxic zone first. Subsequently, the flow leaves the anoxic zone and enters the aerated zone where fine bubbled air is diffused into the sewage to remove dissolved and suspended organics and nutrients from the wastewater. Biological activity is controlled to assimilate the organic material. Final Clarifier: The effluent from the aerators is directed to the two secondary clarifiers where it settles quickly as an activated (living) sludge leaving a clear effluent to overflow the clarifier. The sludge collected on the bottom of the clarifier is pumped back to the head of the aeration tank. The microorganisms are returned to repeat the process. Waste activated sludge is sent to the primary clarifier to co-settle.
Phosphorus Removal: The phosphorous removal system is intended to lower the total phosphorous level in the final effluent by adding a chemical coagulant (ferrous chloride) as part of the treatment process. Ferrous chloride can be added at multiple locations. Effluent Disinfection: Chlorine in the form of liquid sodium hypochlorite is metered into the secondary effluent stream for pathogen control. Adequate contact time is provided by the two chlorine contact chambers. Disinfected effluent is dechlorinated with a sodium bisulphite solution before being discharged through the 1,676 mm diameter outfall extending 770 meters into Lake Ontario. Anaerobic Digestion: The raw sludge that is collected from the primary clarifiers is pumped into the primary digester followed by secondary digestion. Anaerobic bacteria reduce the volume of sludge. As a by-product these digesters produce a more stabilized sludge; water, which is returned to the plant for further treatment; and a combination of carbon dioxide; methane; and hydrogen sulphide. The methane is further used to meet the heating requirements of the digesters and for heating parts of the treatment facility.

Courtice Water Pollution Control Plant Annual Performance Report 2015
Page 4 of 17
Biosolids management: All digested sludge produced at the Courtice WPCP is pumped to the biosolids holding facility. From there the treated biosolids can be utilized on approved agricultural fields or be shipped to Duffin Creek WPCP for incineration. Biosolids are transported plant to plant in accordance with ECA #A820250 and ECA #4400-4LBLXD for land application.
Environmental Compliance Approval Under Condition 10 (6) of ECA #3393-68RLD4 the Region of Durham must produce an annual report that must contain the following information:
a) Summary and interpretation of all monitoring data and a comparison to the effluent limits, including an overview of the success and adequacy of the works. The Courtice WPCP effluent was determined to be compliant with the ECA approval limits during the reporting period. The plant operated at 69% of its rated capacity and received a maximum daily flow of 130,907 m3/d on June 29, 2015. See tables for effluent results.
b) Description of any operating problems encountered and corrective actions taken: There were no operating issues encountered in 2015.
c) Summary of all maintenance carried out on any major structure, equipment, apparatus, mechanism or thing forming part of the works. Major maintenance items in 2015 included:
• Emptied and repaired both aeration tanks and both associated secondary clarifiers, • Conducted maintenance on aeration blowers #1 and #3, • Adjusted and calibrated final effluent flow weir, • Repaired check valve on return activated sludge pump, • Repaired mixer on secondary digester, • Replaced ferrous chloride feed pump, • Replaced variable frequency drives on Boiler #2, return activated sludge pump, and
Digester pump, • Replaced primary digester valve, • Repaired anoxic mixer.
d) Summary of any effluent quality assurance or control measures undertaken in the reporting period. • In-house lab test results are compared to the results of the Regional Environmental
Laboratory on comparable samples to determine the in-house accuracy. All results were found to be within a comparable range.
• On-line instrumentation is verified by WPCP operators using various field or laboratory test equipment.
e) Summary of the calibration and maintenance carried out on all effluent monitoring equipment. • Calibration of the effluent flow meter and the secondary clarifier flow meters occurred in
May and September 2015. • Calibration of the AutoCat 9000 chlorine analyzer was conducted July 29. • Calibration of the in-house lab pH meter is conducted monthly.

Courtice Water Pollution Control Plant Annual Performance Report 2015
Page 5 of 17
f) Description of efforts made and results achieved in meeting the effluent objectives. The Regional Municipality of Durham continually strives to achieve the best effluent quality at all times, remaining below the ECA compliance limits. The average daily rated flow capacity of 68,200 m3/d was not exceeded. The rated peak flow capacity of 180,000 m3/d was not exceeded. One of 295(0.3%) total suspended solids samples exceeded the objective 15 mg/L. This was due to a contaminated auto sampler container. The container was subsequently scrubbed clean. The total phosphorus objective of 0.8 mg/L was exceeded in 16 of 295 samples (5%). This was due primarily to insufficient ferrous chloride dosing. Ferrous chloride feed was increased as required. The pH objective of <6.5 was exceeded on eight occasions. Operators monitored the results and calibrated the pH meter as required. Six of 54 (11%) E.coli samples exceeded the objective of 200 cfu/100 ml. This occurred during a period of secondary clarifier and aeration tank maintenance resulting in higher than usual chlorine demand. Sodium hypochlorite was increased as needed and once the tanks were put back into service the E.coli concentrations were reduced. Best efforts and process adjustments will continue to be applied to maintain results below objectives.
g) Tabulation of Volume of Sludge Generated: The volume of sludge removed from Courtice WPCP in 2015 was 83,020m3. Outline of Anticipated Volumes to be Generated in the Next Reporting Period: There is no increase of sludge volume expected in the next reporting period.
Summary of Locations to Where Sludge was Disposed: Duffin Creek WPCP – 49,518 m3 or 59.6% Agricultural Fields – 33,502 m3 or 40.4%
h) Summary of any complaints received during the reporting period and any steps taken to address the complaint: One odour complaint was received from a neighboring industry on March 9. The concern was investigated and no odour could be identified. The MOECC was notified of the incident verbally and in writing.
i) Summary of all By-pass, spill or abnormal discharge events. There were no by-passes during the reporting period. There are no anticipated by-passes planned during the next reporting period. There were no spills during the reporting period.
j) Any other information the District Manager requires from time to time. No additional information required.

Courtice Water Pollution Control Plant Annual Performance Report 2015
Page 6 of 17
MOECC Inspection No MOECC inspection occurred in 2015.

Courtice Water Pollution Control Plant Annual Performance Report 2015
Table 1 Raw Influent Flow
Month
Total Flow to Plant - metered
at the final effluent m3
Average Daily Flow m3/d
Maximum Daily Flow m3/d
January 1,493,052 48,163 66,828
February 1,222,097 43,646 46,583
March 1,494,667 48,215 56,405
April 1,901,943 63,398 110,385
May 1,321,046 42,614 52,540
June 1,700,341 56,678 130,907
July 1,364,027 44,001 68,878
August 1,276,542 41,179 50,404
September 1,238,137 41,271 61,004
October 1,395,005 45,000 92,461
November 1,485,661 49,522 63,051
December 1,257,069 40,551 52,770
Total 17,149,586 N/A N/A
Average 1,429,132 46,985* N/A
Minimum 1,222,097 N/A N/A
Maximum 1,901,943 N/A 130,907
ECA Requirement N/A 68,200 180,000
Met Compliance N/A Yes Yes *Annual Average Daily Flow
Courtice Water Pollution Control Plant Annual Performance Report 2015
Page 8 of 17
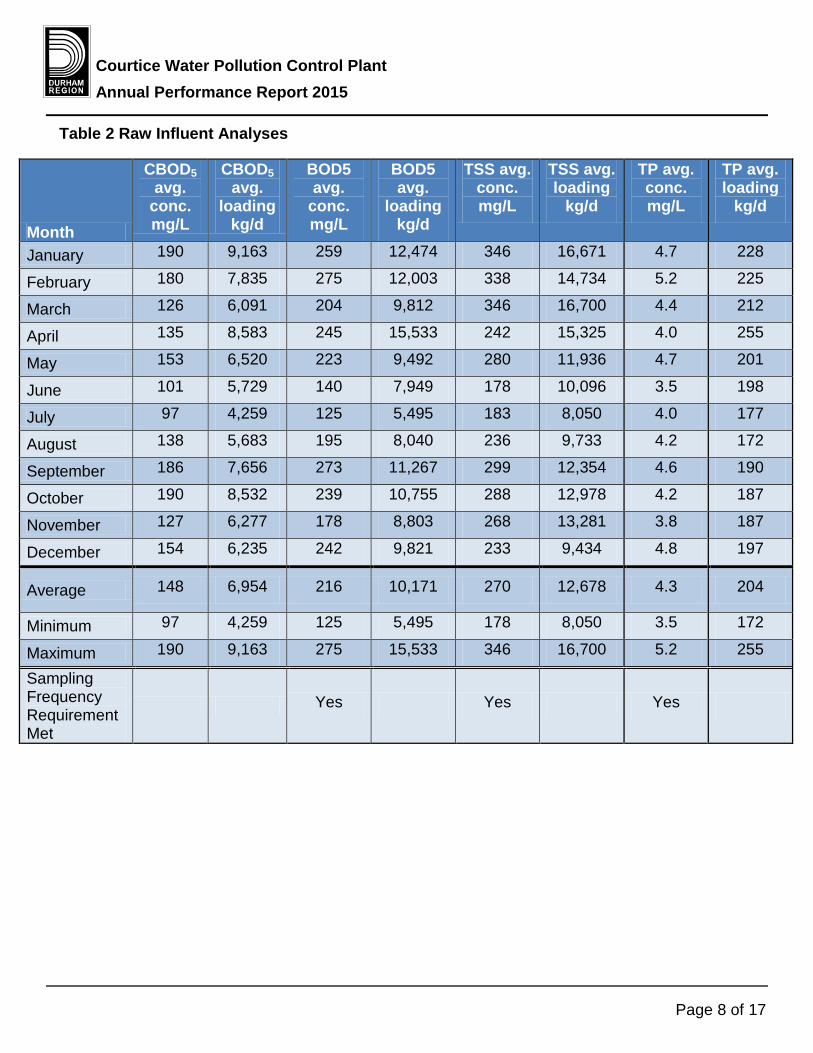
Table 2 Raw Influent Analyses
Month
CBOD5 avg.
conc. mg/L
CBOD5 avg.
loading kg/d
BOD5 avg.
conc. mg/L
BOD5 avg.
loading kg/d
TSS avg. conc. mg/L
TSS avg. loading
kg/d
TP avg. conc. mg/L
TP avg. loading
kg/d
January 190 9,163 259 12,474 346 16,671 4.7 228
February 180 7,835 275 12,003 338 14,734 5.2 225
March 126 6,091 204 9,812 346 16,700 4.4 212
April 135 8,583 245 15,533 242 15,325 4.0 255
May 153 6,520 223 9,492 280 11,936 4.7 201
June 101 5,729 140 7,949 178 10,096 3.5 198
July 97 4,259 125 5,495 183 8,050 4.0 177
August 138 5,683 195 8,040 236 9,733 4.2 172
September 186 7,656 273 11,267 299 12,354 4.6 190
October 190 8,532 239 10,755 288 12,978 4.2 187
November 127 6,277 178 8,803 268 13,281 3.8 187
December 154 6,235 242 9,821 233 9,434 4.8 197
Average 148 6,954 216 10,171 270 12,678 4.3 204
Minimum 97 4,259 125 5,495 178 8,050 3.5 172
Maximum 190 9,163 275 15,533 346 16,700 5.2 255
Sampling Frequency Requirement Met
N/A N/A Yes N/A Yes N/A Yes N/A

Courtice Water Pollution Control Plant Annual Performance Report 2015
Page 9 of 17
Table 2 Raw Influent Analyses continued
Month
DP avg. conc. mg/L
TKN avg. conc. mg/L
TAN avg.
conc. mg/L
TAN avg.
loading kg/d
pH min.
pH max.
Temp. min.
Temp. max.
Alkalinity avg.
conc. mg/L
January 2.45 42.50 26.04 1,254 6.88 7.65 6.6 16.2 264
February 2.59 44.35 24.62 1,075 6.75 7.66 8.1 15.1 293
March 2.33 37.98 26.18 1,262 6.76 7.75 8.5 18.9 257
April 1.93 33.62 19.08 1,210 6.83 7.61 12.8 18.3 269
May 2.80 41.60 26.66 1,136 6.50 7.35 15.4 19.7 284
June 1.94 31.58 20.49 1,162 6.99 7.40 11.5 21.8 282
July 2.20 33.84 24.99 1,100 7.06 7.53 18.8 24.1 291
August 2.32 37.95 27.93 1,150 7.07 7.67 18.9 25.2 329
September 2.53 45.18 27.45 1,133 6.86 7.59 18.2 23.1 235
October 2.48 44.94 27.31 1,229 7.05 7.81 12.2 20.2 296
November 2.10 37.20 25.27 1,252 7.01 7.99 11.3 18.8 260
December 2.45 41.32 29.29 1,188 6.86 7.97 9.3 18.3 262
Average 2.34 39.34 25.44 1,195 N/A N/A N/A N/A 277
Minimum 1.93 31.58 19.08 1,075 6.50 N/A 6.6 N/A 235
Maximum 2.80 45.18 29.29 1,262 N/A 7.99 N/A 25.2 329
Sampling Frequency Requirement Met
Yes Yes Yes N/A Yes Yes Yes Yes Yes
Courtice Water Pollution Control Plant Annual Performance Report 2015
Page 10 of 17
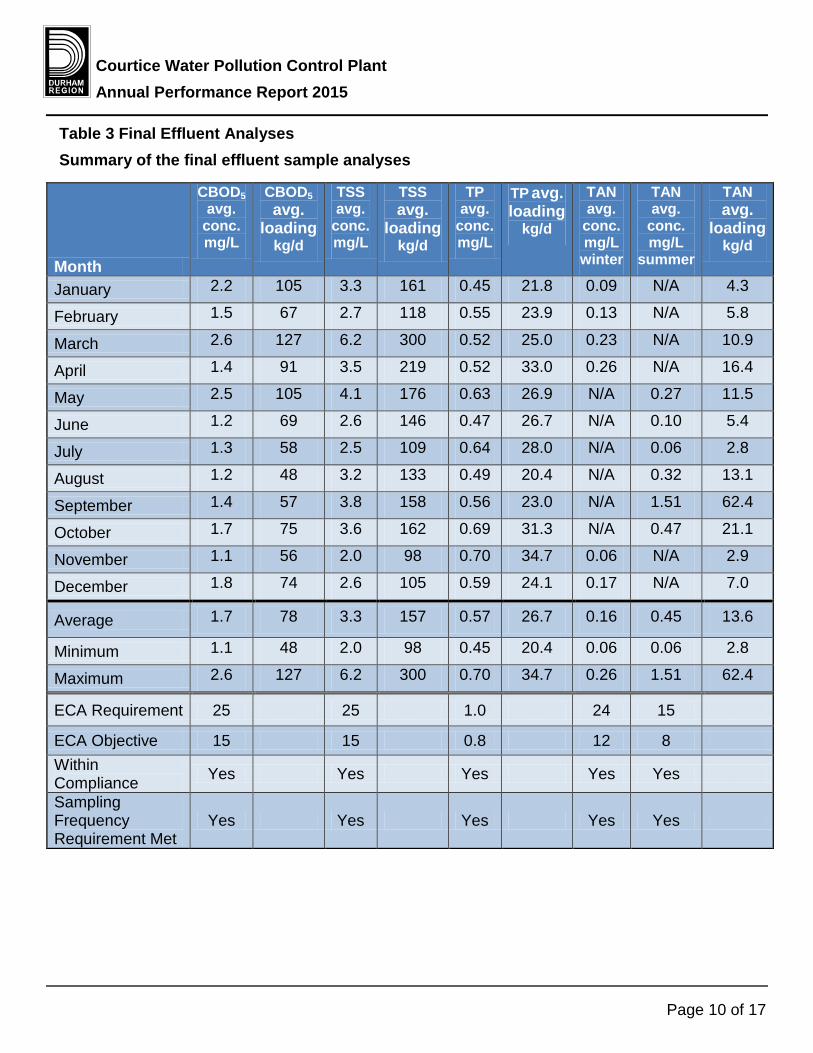
Table 3 Final Effluent Analyses Summary of the final effluent sample analyses
Month
CBOD5 avg.
conc. mg/L
CBOD5 avg.
loading kg/d
TSS avg.
conc. mg/L
TSS avg.
loading kg/d
TP avg.
conc. mg/L
TP avg. loading
kg/d
TAN avg.
conc. mg/L winter
TAN avg.
conc. mg/L
summer
TAN avg.
loading kg/d
January 2.2 105 3.3 161 0.45 21.8 0.09 N/A 4.3
February 1.5 67 2.7 118 0.55 23.9 0.13 N/A 5.8
March 2.6 127 6.2 300 0.52 25.0 0.23 N/A 10.9
April 1.4 91 3.5 219 0.52 33.0 0.26 N/A 16.4
May 2.5 105 4.1 176 0.63 26.9 N/A 0.27 11.5
June 1.2 69 2.6 146 0.47 26.7 N/A 0.10 5.4
July 1.3 58 2.5 109 0.64 28.0 N/A 0.06 2.8
August 1.2 48 3.2 133 0.49 20.4 N/A 0.32 13.1
September 1.4 57 3.8 158 0.56 23.0 N/A 1.51 62.4
October 1.7 75 3.6 162 0.69 31.3 N/A 0.47 21.1
November 1.1 56 2.0 98 0.70 34.7 0.06 N/A 2.9
December 1.8 74 2.6 105 0.59 24.1 0.17 N/A 7.0
Average 1.7 78 3.3 157 0.57 26.7 0.16 0.45 13.6
Minimum 1.1 48 2.0 98 0.45 20.4 0.06 0.06 2.8
Maximum 2.6 127 6.2 300 0.70 34.7 0.26 1.51 62.4
ECA Requirement 25 N/A 25 N/A 1.0 N/A 24 15 N/A
ECA Objective 15 N/A 15 N/A 0.8 N/A 12 8 N/A Within Compliance Yes N/A Yes N/A Yes N/A Yes Yes N/A
Sampling Frequency Requirement Met
Yes N/A Yes N/A Yes N/A Yes Yes N/A

Courtice Water Pollution Control Plant Annual Performance Report 2015
Page 11 of 17
Table 3 Final Effluent Analyses continued
Month
Unionized NH3 avg.
conc. mg/L
TKN avg.
conc. mg/L
DP avg. conc. mg/L
Nitrate avg. conc. mg/L
Alkalinity avg. conc. mg/L
January 0.0 1.14 0.38 20.11 85
February 0.0 1.53 0.49 19.53 82
March 0.0 1.07 0.69 20.19 113
April 0.0 1.64 0.42 19.96 128
May 0.0 2.18 0.56 21.64 91
June 0.0 1.48 0.45 18.44 117
July 0.0 1.04 0.55 20.26 103
August 0.0 1.25 0.46 20.19 108
September 0.0 2.15 0.49 19.83 69
October 0.0 1.91 0.65 19.83 102
November 0.0 1.63 0.65 15.87 101
December 0.0 1.48 0.63 24.54 69
Average 0.0 1.54 0.54 20.03 97
Minimum 0.0 1.04 0.38 15.87 69
Maximum 0.0 2.18 0.69 24.54 128
ECA Requirement 0.2 N/A N/A N/A N/A
ECA Objective 0.1 N/A N/A N/A N/A
Within Compliance Yes N/A N/A N/A N/A
Sampling Frequency Requirement Met
Yes N/A Yes Yes Yes

Courtice Water Pollution Control Plant Annual Performance Report 2015
Page 12 of 17
Table 3 Final Effluent Analyses continued
Month
TCR avg. conc. mg/L
TCR avg. loading kg/d
pH min. pH max. Temp. oC min.
Temp. oC max.
January 0.01 0.3 6.25 7.90 11.1 15.1
February 0.00 0.0 6.41 6.92 9.3 14.1
March 0.01 0.3 6.55 7.51 10.5 15.4
April 0.01 0.7 6.83 7.33 12.7 15.4
May 0.00 0.1 6.73 7.50 14.9 17.8
June 0.00 0.1 6.78 7.69 16.8 19.4
July 0.00 0.1 6.87 7.57 17.6 21.2
August 0.00 0.1 6.63 7.62 18.9 25.5
September 0.00 0.1 6.25 7.73 20.2 22.9
October 0.00 0.1 6.64 7.71 16.9 20.3
November 0.01 0.4 6.98 7.49 16.1 18.5
December 0.00 0.1 6.87 7.22 14.8 17.2
Average 0.00 0.2 N/A N/A
Minimum 0.00 0.0 6.25 N/A 9.3 N/A
Maximum 0.01 0.7 N/A 7.90 N/A 25.5
ECA Requirement N/A N/A 6.0 9.5 N/A N/A
ECA Objective N/A N/A 6.5 9.0 N/A N/A
Within Compliance N/A N/A Yes Yes N/A N/A
Sampling Frequency Requirement Met
Yes N/A Yes Yes Yes Yes
Courtice Water Pollution Control Plant Annual Performance Report 2015
Page 13 of 17
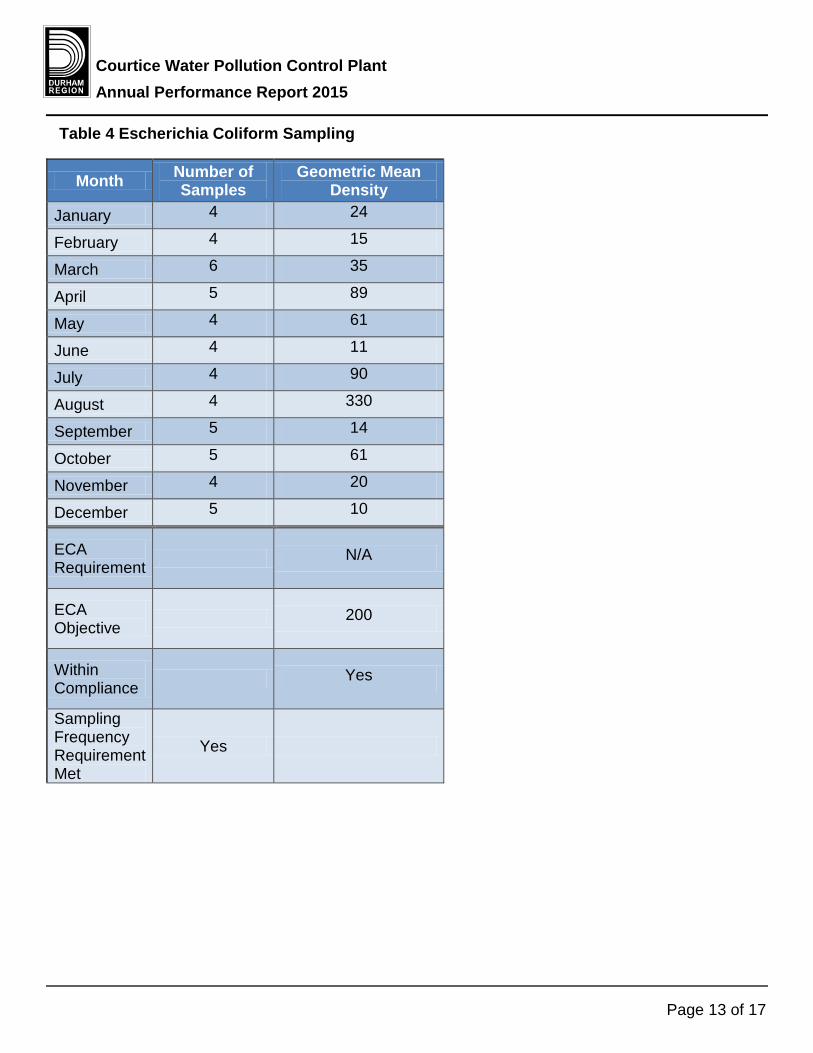
Table 4 Escherichia Coliform Sampling
Month Number of Samples
Geometric Mean Density
January 4 24
February 4 15
March 6 35
April 5 89
May 4 61
June 4 11
July 4 90
August 4 330
September 5 14
October 5 61
November 4 20
December 5 10
ECA Requirement N/A N/A
ECA Objective N/A 200
Within Compliance N/A Yes
Sampling Frequency Requirement Met
Yes N/A

Courtice Water Pollution Control Plant Annual Performance Report 2015
Page 14 of 17
Table 5 Energy and Chemical Usage
Month
Total Plant Flow (cubic
metres)
Ferrous Chloride (litres)
Sodium Hypochlorite (kilograms as chlorine)
Sodium Bisulphite
(Litres)
Hydro (kWh)
Natural Gas
(cubic metres)
January 1,493,052 82,320 2,999 13,837 634,522 10,868
February 1,222,097 92,680 2,293 14,168 640,741 18,626
March 1,494,667 84,420 2,720 20,939 648,004 4,329
April 1,901,943 105,140 2,999 15,640 717,108 3,078
May 1,321,046 121,940 2,646 11,224 661,348 2,456
June 1,700,341 120,820 3,557 12,291 703,079 1,485
July 1,364,027 124,740 2,661 8,280 550,714 1,623
August 1,276,542 121,982 2,675 7,544 596,258 1,103
September 1,238,137 114,100 3,219 7,544 671,823 3,070
October 1,395,005 111,300 3,822 8,170 659,305 2,803
November 1,485,661 72,380 4,880 9,126 619,502 2,676
December 1,257,069 107,380 3,660 7,581 1,399,279 6,634
Total 17,149,586 1,259,202 38,132 136,344 8,501,683 58,751

Courtice Water Pollution Control Plant Annual Performance Report 2015
Page 15 of 17
Glossary of Terms Anaerobic Digestion
A series of biological processes in which microorganisms break down biodegradable material in the absence of oxygen.
Average Daily Flow The cumulative total sewage flow to the sewage works during a calendar year divided by the number of days during which sewage was flowing to the sewage works that year.
Biosolids Organic material recovered from wastewater sludge.
Bioreactor A bioreactor is a vessel in which a biological process is carried out which involves bacterial organisms or biochemically active substances derived from such organisms. This encompasses a combination of aerobic, and anoxic processes.
BOD5 Five Day Biochemical Oxygen Demand (also known as totalBOD5) Five day biochemical oxygen demand measured in an unfiltered sample and includes carbonaceous and nitrogenous oxygen demand.
By-pass Any discharge from the Works that does not undergo any treatment or only undergoes partial treatment before it is discharged to the environment.
CBOD5 -Five day Carbonaceous Biochemical Oxygen Demand A five day carbonaceous (nitrification inhibited) biochemical oxygen demand measured in an unfiltered sample.
Conc. Concentration District Manager
The District Manager of the York-Durham District Office of the Ministry. DP – Dissolved Phosphorus
The soluble form of phosphorus present in the wastewater. ECA - Environmental Compliance Approval
The primary regulatory instrument for each WPCP. E. coli - (Escherichia coli)
Refers to the thermally tolerant forms of Escherichia that can survive at 44.5 degrees Celsius.
Final Effluent Sewage discharge via the Sewage Treatment Plant outfall after undergoing the full train of unit processes as listed in the Environmental Compliance Approval.
Geometric Mean Density Is the nth root of the product of multiplication of the results of n number of samples over the period specified.

Courtice Water Pollution Control Plant Annual Performance Report 2015
Page 16 of 17
Grab Sample A single sample taken at a specific moment in time, a snapshot of the conditions at the time the sample was retrieved.
m3 - (Cubic Metre) Volume measurement, 1m3 = 1000 litres or 220 imperial gallons.
m3/d - (Cubic Metres Per Day) Flow measurement, 1m3 = 1000 litres or 220 imperial gallons. Volume of liquid treated in a 24 hour period.
Max. – Maximum Maximum Flow Rate
The peak or highest flow recorded during a specific time period usually in a twenty-four (24) period.
mg/L - (Milligram Per Litre) This is a measure of the concentration of a parameter in wastewater, sometimes referred to as parts per million (ppm).
Min. – Minimum mm - (millimetre)
Is a unit of length in the metric system, equal to one thousandth of a metre. MOECC - (Ministry of the Environment and Climate Change)
The Provincial regulatory agency responsible for overseeing the water and wastewater industries in Ontario. Their primary functions include approval for new or expanding facilities, inspections and investigations.
Monthly average concentration The arithmetic mean of all daily concentrations of a contaminant in the effluent sampled or measured, or both, during a calendar month.
Monthly average loading is calculated by multiplying the monthly average concentration of a contaminant in the effluent sampled or measured, or both, during a calendar month.
N/A - Not Applicable pH
Index of hydrogen ion activity, pH is defined as the negative logarithm of hydrogen ion concentration in moles per litre. The pH may range from 0 – 14, where 0 is most acidic, 14 most basic and 7 neutral.
Rated Capacity The average daily flow for which the works are approved to handle.
Raw Influent Raw wastewater entering the water pollution control plant before treatment.
Septage Partially treated sludge from a septic tank.
Sludge
Courtice Water Pollution Control Plant Annual Performance Report 2015
Page 17 of 17
The settleable solids separated from liquids during processing. Substantial completion – has the same meaning as “substantial performance” in the Construction
Lien Act. TAN -Total Ammonia Nitrogen
Ammonia exists in two forms in the water: NH3 (this is called unionized ammonia ) NH4+ ( this is called ionized ammonia ) Together, these two forms of ammonia are called TAN which means total ammonia nitrogen.
TCR -Total Chlorine Residual The total amount of chlorine in water, including the combined chlorine and the free available chlorine.
Temp. – Temperature TP -Total Phosphorus
A laboratory analyses to determine the total amount of particulate and soluble phosphorus present in the wastewater.
TSS -Total Suspended Solids A laboratory analyses to measure particles that are larger than 2 microns found in the wastewater.
TS -Total Solids Is a measure of the suspended and dissolved solids in the wastewater and in biosolids.
Unionized Ammonia Nitrogen Un-ionized ammonia refers to all forms of ammonia in water with the exception of the ammonium ion (NH4 +).
Works –The sewage works described in the owner’s application, and the ECA, and includes both proposed works and previous works.
WPCP - Water Pollution Control Plant Is typically a facility composed of a variety of treatment processes that collectively treat the wastewater.
If this information is required in an accessible format, please contact 1-800-372-1102 extension 3488

Duffin Creek Water Pollution Control Plant Annual Performance Report 2015
Duffin Creek Water Pollution Control Plant Annual Performance Report 2015

Duffin Creek Water Pollution Control Plant Annual Performance Report 2015
Duffin Creek Water Pollution Control Plant 2015 Annual Performance Report
Environmental Compliance Approval (ECA): 5531-9FJJT5 Dated March 3, 2014 Environmental Compliance Approval (Air): 1110-9AJP5C Dated September 13, 2013 International Organization for Standardization (ISO) 14001 Certification: CA05/3563/E
The Duffin Creek Water Pollution Control Plant (WPCP) Annual Performance Report provides staff, stakeholders and customers an overview of the performance of the Duffin Creek WPCP in 2015. Further, this report fulfills the annual reporting requirements of the Ontario Ministry of the Environment and Climate Change (MOECC). The performance report demonstrates the commitment of ensuring that the WPCP continues to deliver wastewater services to our customers in an environmentally responsible manner.
Water Pollution Control Plant Process Description
General The Duffin Creek WPCP is jointly owned by the Regional Municipality of Durham and the Regional Municipality of York and operated in accordance with the terms and conditions of the ECA noted above. The plant is located in the City of Pickering, and operated by the Regional Municipality of Durham. This MOECC Class Four conventional activated sludge treatment plant is designed to treat wastewater at an average daily flow rate of 630,000 cubic metres per day (m3/d) with a limit of 520,000 m3/d as noted in the outfall capacity limitations in the ECA. Duffin Creek WPCP treats wastewater from the Town of Ajax and the City of Pickering service areas in the Regional Municipality of Durham as well as the following service areas in the Regional Municipality of York: Vaughan, King, Newmarket, Whitchurch-Stouffville, Aurora, East Gwillimbury, Richmond Hill, and Markham. The Duffin Creek WPCP is ISO 14001 Certified and an MOECC Class Four conventional activated sludge treatment plant that utilizes the following processes to treat wastewater:
• raw influent pumping, • preliminary treatment, • primary treatment, • phosphorous removal system, • secondary treatment, • disinfection (chlorination/dechlorination) • sludge management, • dewatering of sludge, • incineration.
Raw Influent Pumping Wastewater collected through approximately 655 km of sanitary sewers in Ajax and Pickering is conveyed to the treatment plant by gravity and by the following sanitary sewage pumping stations located in the collection system: Bayly St, Jodrel Rd., Toy Ave., Liverpool/Finch and Liverpool. Wastewater collected from the Corporation of the Regional Municipality of York is conveyed to the WPCP via the York Durham Sewage System (YDSS) which accounted for 81.9% of the wastewater
Page 2 of 22

Duffin Creek Water Pollution Control Plant Annual Performance Report 2015
treated in 2015. The remaining 18.1% was generated by the Town of Ajax and the City of Pickering. The combined flows enter a diversion chamber which then splits the flow between Stages 1 & 2 and Stage 3.
Stages 1 & 2:
Preliminary Treatment Screening: Twelve automatic, mechanically cleaned bar screens remove paper products and large material that could harm pumps and process equipment. The bar screens discharge the screenings onto a series of conveyers which in turn discharge into bins for landfill disposal. Grit Removal: The eight grit tanks are sized such that the flow-through velocity will allow the grit material such as sand and small stones to settle to the bottom of the tanks. The grit collecting mechanism, which has rotating arms with blades, scrapes the grit into a collection pit where a rake deposits the grit onto a series of conveyers and into bins for landfill disposal.
Primary Treatment Eight primary clarifiers each equipped with a travelling bridge system utilize the physical process of sedimentation which causes heavy particles to settle to the bottom of the tank as raw sludge and lighter particles to float to the surface as scum. The sludge, along with return activated sludge from the secondary treatment process is collected by scraper blades which push the sludge into hoppers. The sludge is then pumped to the digester tanks or to the dewatering building. The scum is collected by the travelling bridge and sent to the digester. Phosphorous Removal System The phosphorous removal system is intended to lower the total phosphorous level in the final effluent by adding chemicals (ferrous chloride) as part of the treatment process. It also improves the settling of solids which reduces the total solids concentration in the final effluent. Ferrous chloride can be added at multiple locations throughout the WPCP.
Secondary Treatment Aeration: Effluent from the primary clarifiers is treated with ferrous chloride in order to aid in phosphorus removal. There are eight aeration tanks each containing anoxic and aerobic zones. The first part of the tank is a selector where there is no oxygen introduced, this is for denitrification. The second part of the tank is where fine bubbled air is diffused into the sewage to remove dissolved and suspended organics and nutrients from the wastewater. Biological activity is controlled to assimilate the organic material. Secondary Clarifier: The effluent from the aeration tanks is directed to the 16 secondary clarifiers where it settles quickly as an activated (living) sludge leaving a clear effluent to overflow the clarifier. The sludge collected on the bottom of the clarifier is pumped back to the head of the aeration tank. The microorganisms are returned to repeat the process. Waste activated sludge is sent to the primary clarifier to co-settle.
Disinfection (chlorination/dechlorination) Chlorine in the form of liquid sodium hypochlorite is metered into the effluent stream for pathogen control. Adequate contact time is provided by the chlorine contact chambers. Disinfected effluent is
Page 3 of 22
Duffin Creek Water Pollution Control Plant Annual Performance Report 2015
dechlorinated with a sodium bisulphite solution before being discharged to Lake Ontario through a 3.05 m diameter outfall tunnel, approximately 1,100 m long with a 183 m long diffuser pipe.
Stage 3:
Preliminary Treatment Screening: Six automatic, mechanically cleaned screens remove paper products and large material that could harm pumps and process equipment. Screenings are compacted for disposal to landfill. Grit Removal: There are four grit tanks equipped with coarse bubble diffusers to provide aeration in the grit removal process. Heavy suspended material such as sand and small stones (grit) is settled to the bottom of the tanks while lighter organic particles are kept in suspension and passed through the tanks for further treatment. The grit removed is dewatered for landfill disposal.
Primary Treatment Six primary clarifiers each equipped with a travelling bridge system utilize the physical process of sedimentation which causes heavy particles to settle to the bottom of the tank as raw sludge and lighter particles to float to the surface as scum. The sludge, along with return activated sludge from the secondary treatment process is collected by scraper blades which push the sludge into hoppers. The sludge is then pumped to the digester tanks or to the dewatering building. The scum is collected by the travelling bridge and sent to the digester. Phosphorous Removal System The phosphorous removal system is intended to lower the total phosphorous level in the final effluent by adding chemical (ferrous chloride) as part of the treatment process. It also improves the settling of solids which reduces the total solids concentration in the final effluent. Ferrous chloride can be added at multiple locations throughout the WPCP.
Secondary Treatment Aeration: Effluent from the primary clarifiers is treated with ferrous chloride in order to aid in phosphorus removal. There are six aeration tanks each containing anoxic and aerobic zones. The first part of the tank is a selector where there is no oxygen introduced, this is for denitrification. The second part of the tank is where fine bubbled air is diffused into the sewage to remove dissolved and suspended organics and nutrients from the wastewater. Biological activity is controlled to assimilate the organic material. Secondary Clarifier: The effluent from the aerators is directed to the six secondary clarifiers where it settles quickly as an activated (living) sludge leaving a clear effluent to overflow the clarifier. The sludge collected on the bottom of the clarifier is pumped back to the head of the aeration tank. The microorganisms are returned to repeat the process. Waste activated sludge is sent to the primary clarifier to co-settle. Disinfection (chlorination/dechlorination) Chlorine in the form of liquid sodium hypochlorite is metered into the effluent stream for pathogen control. Adequate contact time is provided by the chlorine contact chambers. Disinfected effluent is dechlorinated with a sodium bisulphite solution before being discharged to Lake Ontario through a 3.05 m diameter outfall tunnel, approximately 1,100 m long with a 183 m long diffuser pipe.
Page 4 of 22

Duffin Creek Water Pollution Control Plant Annual Performance Report 2015
Sludge Management The sludges that are collected from the primary clarifiers are pumped into one of the four primary digesters followed by two secondary digesters. There are four blending tanks where raw sludges are blended with digested sludges before they are pumped to be dewatered. All sludges produced are dewatered and incinerated on site. Imported Sludge Durham’s Regional Biosolids Management Program (ECA #H120110009-03) imports sludges from facilities in the Regional of Municipality of York and the Regional Municipality of Durham with the exception of the Newcastle WPCP and the facultative lagoons. Durham’s sludges are transported by Terratec Environmental Ltd. under C of A # A820250 and York’s sludges are transported by GFL Environmental Corp. under C of A # A841293.
Dewatering of Sludge Duffin Creek WPCP utilizes eight dewatering solid bowl centrifuges in order to separate the heavier material and the liquid waste. All dewatered sludges (sludge cake) are sent to incineration.
Incineration There are four fluidized bed process trains which through the combustion process burns the organic substances contained in the sludge cake and converts the waste into ash, flue gas. Steam boilers are utilized for waste heat recovery. All sludges at Duffin Creek WPCP were incinerated during the reporting period. The incinerated ash is sent to St. Mary’s Cement in Bowmanville, Ontario for reuse. No land application or landfill of biosolids occurred in 2015. Ash disposal was hauled to St. Mary’s Cement by BFI Canada Inc. under ECA #A840506.
Environmental Compliance Approval Under Condition 10 (6) of ECA # 5531-9FJJT5 the Region of Durham must produce an annual performance report that contains the following information:
a) Summary and interpretation of all monitoring data and a comparison to the effluent limits
• The Duffin Creek WPCP effluent was determined to be compliant with the ECA approval limits during the reporting period.
• The plant operated at 61.5% of its approved capacity for this reporting period. The plant received a maximum daily flow of 623,810 m3 on June 28, 2015. See tables for effluent flow and sampling results.
b) Description of any operating problems encountered and corrective actions taken: • Challenges arose when accommodating ongoing construction with processes being offline,
electrical interruptions, flow diversions etc. These challenges were overcome with careful planning and communication.
• Primary Digesters 1 & 4 shut down for clean out which reduced solids holding capacity.
Page 5 of 22
Duffin Creek Water Pollution Control Plant Annual Performance Report 2015
• New disinfection building brought online in March, 2015, therefore all chemical pumps, regulators and analyzers had to be commissioned and verified. Temporary storage tanker and gravity feed lines were removed.
c) Maintenance of major equipment Major maintenance items in 2015 included: Operations • Stage 1&2 and 3 Substations – servicing of all 4,160V and certain 600V switches, breakers,
transformers/protection relays etc. • Blowers 1-9 schedule 1 or 2 tear down and rebuild/cleaning of all internal blowers. • Generators 1100, 1200, 1300, 1400, 5401, 5501,5601 – regular monthly runs as well as all
oils and filters changed, fuel system checks. • Program modifications to generators 1100-1400 to allow generators to run independently. • Digester preventative maintenance, Waste Gas Burners – servicing of all gas protection,
including; pressure relief valves, gas valves, flame arrestors, roof pressure tests etc. • Stage 3 headworks – all screenings and grit screw liners refurbished. • Primary tanks # 11 and # 12 – cross collectors rebuilt. • Secondary tanks # 17-22, chain adjustments and skimmer, complete rebuilds # 19 and #
21, inlet baffle replaced on # 21. • Stage 3 Influent pumping station – all eight pumps lifted and inspected. Dewatering • Plug valve replacement in the basement of the south Dewatering building. • Filtrate station overhaul (rebuilt pumps, new piping, new platform, new guide rails and new
check valves). • Cleaned tank, repaired gates, replaced ladders, rebuilt mixers in # 3 and # 4 sludge
holding tanks. • Repair two centrifuge screw conveyors. Incineration • Purchased two excess steam condensers, one installed, one remaining. • Replaced # 2 coil on auxiliary boiler. • Rebuilt venture dampers on incinerators # 1 and # 2. • Installed new bearings, shaft sleeves and carbon rings on # 2 turbine. • Replaced # 2 speed reducer on turbine / Fluidizing Air Blower (FAB) • Installed # 3 feedwater pump at new incineration. • Completed FAB cross-over duct from incinerators # 3 and # 4. • Stack inspections and repairs completed. • Replaced part of old incineration roof. • Exterior cleaning of concrete façade on old incineration building.
d) Summary of any effluent quality assurance or control measures • In-house lab test results are compared to the results of the Regional Environmental
Laboratory on comparable samples to determine the in-house accuracy. All results were found to be within a comparable range.
• On-line instrumentation is verified by WPCP operators using various field or laboratory test equipment.
Page 6 of 22
Duffin Creek Water Pollution Control Plant Annual Performance Report 2015
e) Summary of the calibration and maintenance carried out on all effluent monitoring equipment; Plant flows are measured at the influent of this plant.
• All influent flow meters were calibrated in February and March. • All monitoring and laboratory equipment is calibrated and maintained according to
manufacturer’s specifications.
f) Effluent Objectives The objective for pH was exceeded in the months of October, November and December. New instrumentation was purchased and installed. The total chlorine residual was detectable in the months of March and October. Best efforts and process adjustments were and will continue to be applied to maintain results below objectives.
g) Biosolids Production A summary of plant biosolids production and disposal is included in Table 7. There is no increase of sludge volume expected in the next reporting period.
h) Complaints Odour complaint – received August 31, 2015. Email was sent to staff regarding odour in the Ajax Waterfront Park area. Staff investigated odours at the plant and sanitary sewage pumping stations. No odours were detected, however, an algae mat was covering the shoreline area. The algae was found to be producing an odour when staff were investigating. Odour complaint – received September 15, 2015. E-mail was sent to staff regarding perceived odours in the Ajax Waterfront Park area. Staff investigated odours at the plant. No odours were detected. There were no abnormal maintenance activities or operational events taking place at the time of the reported incident. The MOECC was notified verbally on September 15, 2015 and by letter dated Sept. 24, 2015.
i) By-passes, Spills or abnormal discharge events There is no mechanism for by-passing untreated wastewater at this facility. There are no anticipated by-passes planned for the next reporting period. Spills On June 4, 2015 a sludge sample sink in the dewatering complex plugged and resulted in a sludge overflow. The overflow reached two stormwater catch basins. Proper clean up and notification procedures were followed. Modifications to the sink and to sampling procedures have been put in place to prevent a re-occurrence. The MOECC Spills Action Center (SAC) was notified verbally on June 4, 2015 and by written report dated June 12, 2015. Environment Canada was notified by email on June 16, 2015.
j) Notice of modifications and any implementation of Limited Operational Flexibility No notice of modifications were submitted in 2015.
Page 7 of 22
Duffin Creek Water Pollution Control Plant Annual Performance Report 2015
k) Extra Information The fixed bed carbon adsorption units in the incineration complex was by-passed. The MOECC was notified on October 13, 2015.
Proposed Alterations, Extensions or Replacements • Replacement of existing Stage 1 and 2 disinfection facility Contract T-12-92 (complete, in
service). • Replacement of the Stage 1 and 2 Headworks and influent pumping station Contract T-13-
50 (in progress, estimated completion date March, 2017). • Improvements to Stage 1 and 2 Contract T-13-86 (Stage 2 complete and returned to
service, Stage 1 off-line, estimated completion date December, 2016). • Odour control duct modifications in dewatering building (in progress, estimated completion
date August, 2016). • Capital restoration plan for damaged sludge blending tank and biofilter works (design
commenced). • Stage 1 and 2 incineration hot water heating upgrades (complete and in service). • Installation of 3rd waste heat boiler feedwater pump and fluidized air crossover in Stage 3
and incineration facility (complete and in service). • Standby power closed transition modifications to Stage 3 electrical substation (in progress,
estimated completion date September, 2016). • Stage 1 and 2 digester mixing improvements and motor control center replacements
(conceptual design to commence April, 2016). • Conceptual planning has commenced for replacement of incineration facility reactor 1
and/or 2.
MOECC Inspection This plant was inspected by the MOECC on February 12, 2015. No action items were identified in the report.
Page 8 of 22

Duffin Creek Water Pollution Control Plant Annual Performance Report 2015
Table 1 Raw Influent Flows
Month York Region Plant
Flow m3 Durham Region Plant Flow m3
Total Flow to Plant metered at the raw
influent m3
Average Daily Flow
m3/d
Maximum Daily Flow
m3/d
Minimum Daily Flow
m3/d
January 8,068,674 1,783,187 9,851,860 317,802 392,100 289,316
February 6,824,837 1,508,297 8,333,134 297,612 310,333 287,536
March 8,230,271 1,818,900 10,049,171 324,167 373,945 290,433
April 8,958,274 1,979,789 10,938,063 364,602 507,985 313,558
May 8,324,068 1,839,629 10,163,697 327,861 404,981 307,080
June 9,372,389 2,071,309 11,443,699 381,457 623,810 327,251
July 8,249,652 1,823,183 10,072,835 324,930 379,239 304,708
August 7,687,017 1,698,840 9,385,857 302,770 349,990 283,887
September 7,197,657 1,590,691 8,788,348 292,945 339,303 250,898
October 7,781,522 1,719,726 9,501,248 306,492 440,953 278,608
November 7,521,458 1,662,251 9,183,709 306,124 350,763 280,576
December 7,427,870 1,641,568 9,069,438 292,563 355,808 273,812
Total (percentage (%)) * 95,643,688 (81.9%) 21,137,372 (18.1%) 116,781,059 (100%) N/A N/A N/A Average * 7,970,307 1,761,448 9,731,755 319,944 N/A N/A Minimum 6,824,837 1,508,297 8,333,134 N/A N/A 250,898 Maximum 9,372,389 2,071,309 11,443,699
623,810 N/A
ECA Requirement N/A N/A N/A 520,000 N/A N/A ECA Objective N/A N/A N/A N/A N/A N/A Met Compliance N/A N/A N/A Yes N/A N/A
*Note – total and average reflect rounding of decimal places
Page 9 of 22
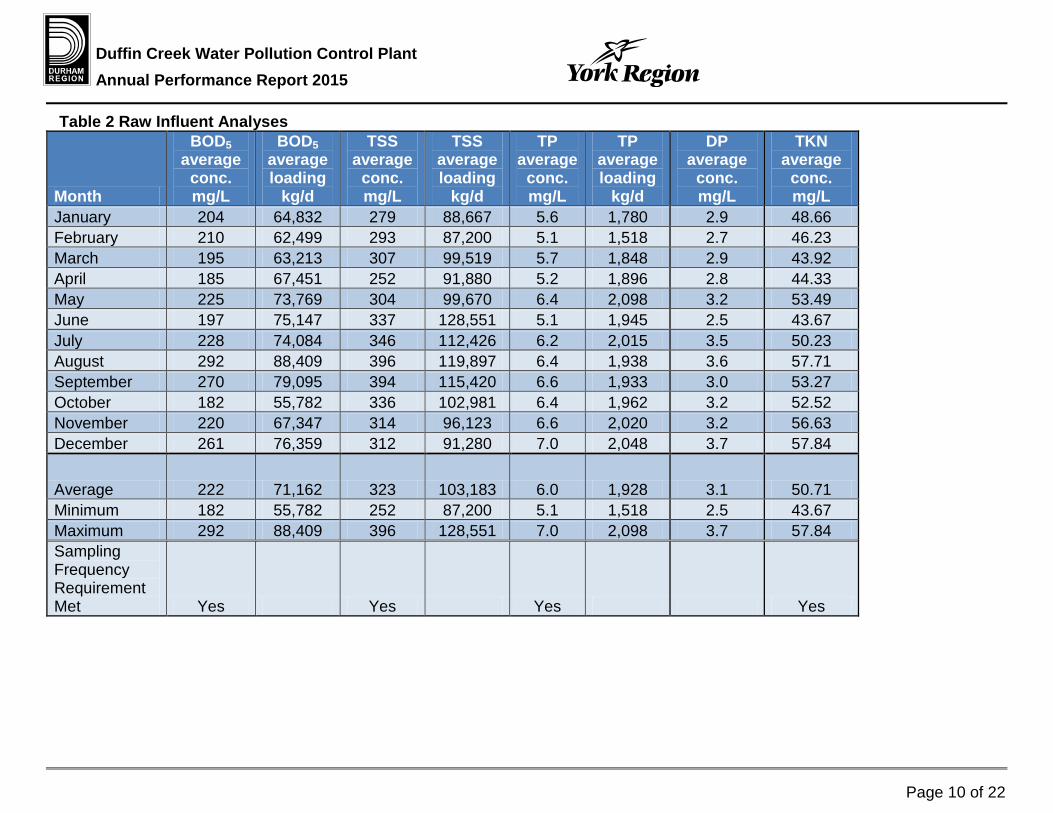
Duffin Creek Water Pollution Control Plant Annual Performance Report 2015
Table 2 Raw Influent Analyses
Month
BOD5 average
conc. mg/L
BOD5 average loading
kg/d
TSS average
conc. mg/L
TSS average loading
kg/d
TP average
conc. mg/L
TP average loading
kg/d
DP average
conc. mg/L
TKN average
conc. mg/L
January 204 64,832 279 88,667 5.6 1,780 2.9 48.66 February 210 62,499 293 87,200 5.1 1,518 2.7 46.23 March 195 63,213 307 99,519 5.7 1,848 2.9 43.92 April 185 67,451 252 91,880 5.2 1,896 2.8 44.33 May 225 73,769 304 99,670 6.4 2,098 3.2 53.49 June 197 75,147 337 128,551 5.1 1,945 2.5 43.67 July 228 74,084 346 112,426 6.2 2,015 3.5 50.23 August 292 88,409 396 119,897 6.4 1,938 3.6 57.71 September 270 79,095 394 115,420 6.6 1,933 3.0 53.27 October 182 55,782 336 102,981 6.4 1,962 3.2 52.52 November 220 67,347 314 96,123 6.6 2,020 3.2 56.63 December 261 76,359 312 91,280 7.0 2,048 3.7 57.84
Average 222 71,162 323 103,183 6.0 1,928 3.1 50.71 Minimum 182 55,782 252 87,200 5.1 1,518 2.5 43.67 Maximum 292 88,409 396 128,551 7.0 2,098 3.7 57.84 Sampling Frequency Requirement Met Yes N/A Yes N/A Yes N/A Yes
Page 10 of 22

Duffin Creek Water Pollution Control Plant Annual Performance Report 2015
Table 2 Raw Influent Analyses continued
Month
TAN average
conc. mg/L
TAN average loading
kg/d pH min. pH max. Temperature
min. oC Temperature
max. oC January 33.5 10,646 6.90 8.40 5.9 14.5 February 30.4 9,047 7.40 8.30 7.5 13.8 March 29.5 9,563 7.30 8.10 8.2 13.6 April 30.1 10,975 7.00 7.78 11.3 16.1 May 37.0 12,131 6.95 7.50 10.9 18.6 June 28.4 10,833 6.80 7.46 14.9 20.3 July 32.2 10,463 6.40 7.60 17.3 23.7 August 35.7 10,809 6.70 7.52 18.2 21.9 September 34.2 10,019 6.70 7.60 19.0 23.1 October 31.6 9,685 6.70 7.50 15.4 21.8 November 37.2 11,388 6.90 7.61 14.2 20.3 December 43.5 12,726 6.83 7.67 6.8 19.1
Average 33.6 10,753 Minimum 28.4 9,047 6.4 5.9 Maximum 43.5 12,726 8.4 23.7
Page 11 of 22

Duffin Creek Water Pollution Control Plant Annual Performance Report 2015
Table 3 Final Effluent Analyses
Month
CBOD5 average
conc. mg/L
CBOD5 average loading
kg/d
TSS average
conc. mg/L
TSS average loading
kg/d
TP average
conc. mg/L
TP average loading
kg/d
TAN average
conc. mg/L
summer
TAN average
conc. mg/L
winter
TAN average loading
kg/d January 3.7 1,176 6.7 2,129 0.54 172 0.56 178 February 4.3 1,280 7.7 2,292 0.58 173 1.05 312 March 4.0 1,297 9.1 2,950 0.49 159 2.09 312 April 2.8 1,021 6.9 2,516 0.43 157 0.75 678 May 2.6 852 6.0 1,967 0.58 190 0.51 167 June 2.4 915 6.3 2,403 0.37 141 1.74 664 July 2.6 845 6.8 2,210 0.52 169 0.97 315 August 3.4 1,029 10.5 3,179 0.52 157 1.15 348 September 3.1 908 12.4 3,633 0.49 144 1.91 560 October 3.4 1,042 10.5 3,218 0.55 169 1.49 457 November 2.6 796 8.2 2,510 0.51 156 0.49 150 December 3.1 907 9.0 2,633 0.51 149 1.52 445
Average 3.2 1,013 8.3 2,669 0.51 162 1.30 1.08 379 Minimum 2.4 796 6.0 1,967 0.37 141 0.51 0.49 150 Maximum 4.3 1,297 12.4 3,633 0.58 190 1.91 2.09 678 ECA Requirement 25.0 25.0 0.8 311 6.0 10.0 ECA Objective 15.0 15.0 0.6 5.0 5.0 Within Compliance Yes N/A Yes N/A Yes Yes Yes Yes N/A Sampling Requirement Frequency Met Yes N/A Yes N/A Yes N/A Yes N/ Yes A N/A
Page 12 of 22
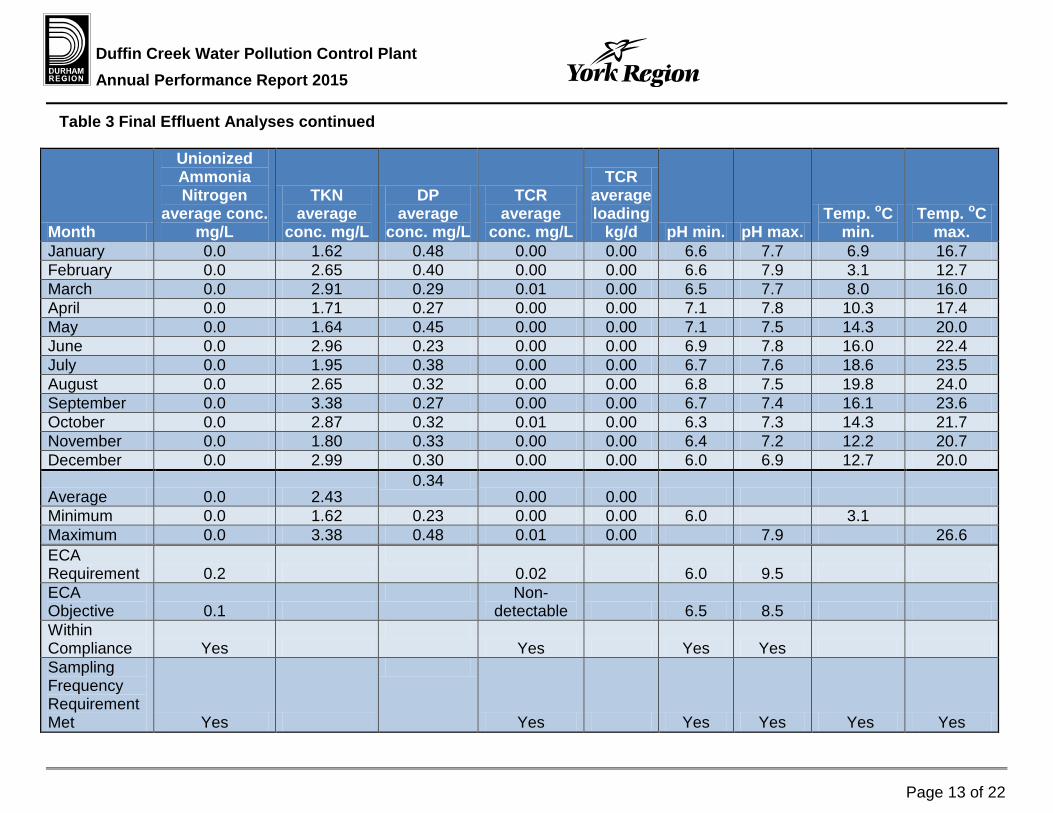
Duffin Creek Water Pollution Control Plant Annual Performance Report 2015
Table 3 Final Effluent Analyses continued
Month
Unionized Ammonia Nitrogen
average conc. mg/L
TKN average
conc. mg/L
DP average
conc. mg/L
TCR average
conc. mg/L
TCR average loading
kg/d pH min. pH max. Temp. oC
min. Temp. oC
max. January 0.0 1.62 0.48 0.00 0.00 6.6 7.7 6.9 16.7 February 0.0 2.65 0.40 0.00 0.00 6.6 7.9 3.1 12.7 March 0.0 2.91 0.29 0.01 0.00 6.5 7.7 8.0 16.0 April 0.0 1.71 0.27 0.00 0.00 7.1 7.8 10.3 17.4 May 0.0 1.64 0.45 0.00 0.00 7.1 7.5 14.3 20.0 June 0.0 2.96 0.23 0.00 0.00 6.9 7.8 16.0 22.4 July 0.0 1.95 0.38 0.00 0.00 6.7 7.6 18.6 23.5 August 0.0 2.65 0.32 0.00 0.00 6.8 7.5 19.8 24.0 September 0.0 3.38 0.27 0.00 0.00 6.7 7.4 16.1 23.6 October 0.0 2.87 0.32 0.01 0.00 6.3 7.3 14.3 21.7 November 0.0 1.80 0.33 0.00 0.00 6.4 7.2 12.2 20.7 December 0.0 2.99 0.30 0.00 0.00 6.0 6.9 12.7 20.0
Average 0.0 2.43 0.34
0.00 0.00 Minimum 0.0 1.62 0.23 0.00 0.00 6.0 3.1 Maximum 0.0 3.38 0.48 0.01 0.00 7.9 26.6 ECA Requirement 0.2 N/A
0.02 N/A 6.0 9.5 N/A N/A
ECA Objective 0.1 N/A
Non-detectable N/A 6.5 8.5 N/A N/A
Within Compliance Yes N/A
Yes N/A Yes Yes N/A N/A
Sampling Frequency Requirement Met Yes N/A
Yes N/A Yes Yes Yes Yes
Page 13 of 22

Duffin Creek Water Pollution Control Plant Annual Performance Report 2015
Table 4 Escherichia Coliform Sampling
Month Number of Samples
Geometric Mean Density
January 21 31 February 21 34 March 22 7 April 20 29 May 20 19 June 23 19 July 22 34 August 20 90 September 18 45 October 19 54 November 19 76 December 20 41 ECA Requirement 52 200 ECA Objective 100 Within Compliance Yes Sampling Frequency Requirement Met Yes
Page 14 of 22

Duffin Creek Water Pollution Control Plant Annual Performance Report 2015
Table 5 Imported Wastewater Analyses
Month
BOD5 average
conc. mg/L
TSS average
conc. mg/L
TP average
conc. mg/L
TKN average
conc. mg/L
January 4,158 10,865 180.0 1,159.00 February 8,831 15,334 206.0 1,771.00 March 7,715 18,380 136.0 1,374.00 April 10,025 21,173 419.0 1,903.00 May 7,312 13,743 192.0 1,403.00 June 3,253 7,397 178.0 1,267.00 July 4,242 15,191 279.0 1,344.00 August 4,094 10,485 244.0 1,189.00 September 6,653 11,555 216.0 1,283.00 October 7,231 19,960 215.0 1,313.00 November 27,524 10,079 173.0 589.00 December 6,116 21,295 366.0 1,717.00
Average 8,096 14,621 233.7 1,359.33 Minimum 3,253 7,397 136.0 589.00 Maximum 27,524 21,295 419.0 1,903.00
Sampling Requirement Frequency Met Yes Yes Yes Yes
Page 15 of 22

Duffin Creek Water Pollution Control Plant Annual Performance Report 2015
Table 6 Energy and Chemical Usage
Month Plant Flow
m3 Ferrous Chloride
L Sodium Hypochlorite
L Sodium Bisulphite
L Hydro kWh
Natural Gas m3
January 9,851,860 864,594 187,557 32,675 5,568,466 190,659 February 8,333,134 928,007 168,369 28,396 5,082,577 331,487 March 10,049,171 1,004,221 211,325 30,718 6,073,485 270,141* April 10,938,063 919,023 221,072 30,606 5,457,569 162,657* May 10,163,697 1,041,291 199,504 29,078 5,493,756 124,592* June 11,443,699 984,556 197,869 29,756 5,286,169 32,888* July 10,072,835 771,765 163,506 24,845 5,192,318 30,038* August 9,385,857 911,987 167,463 26,300 4,992,880 36,058* September 8,788,348 1,169,735 165,136 23,007 4,709,764 62,477* October 9,501,248 1,281,045 184,665 28,211 5,065,226 234,063 November 9,183,709 847,245 236,105 27,653 4,956,388 167,673 December 9,069,438 892,717 186,265 29,567 4,935,736 259,090
Total 116,781,059 11,616,185 2,231,474 340,812 62,814,334 1,901,823* *Note- The natural gas flowmeter was deemed inaccurate by Enbridge from March 23 to September 18, 2015. The flowmeter is owned and maintained by Enbridge.
Page 16 of 22
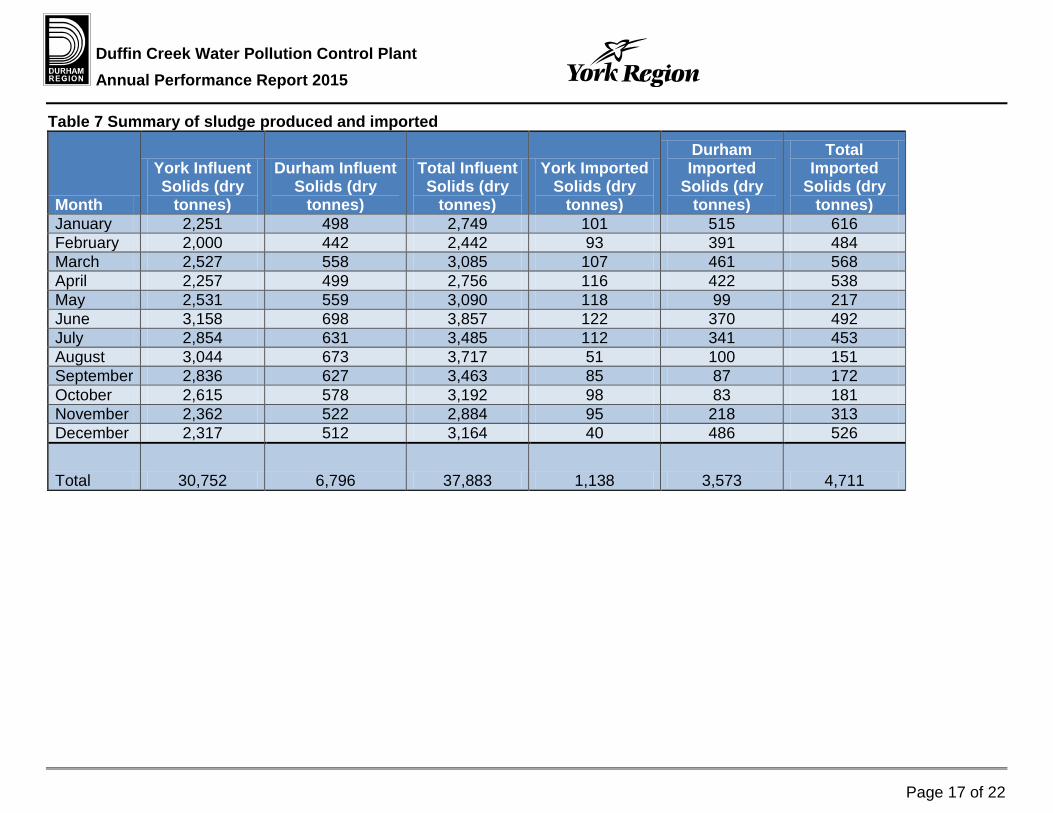
Duffin Creek Water Pollution Control Plant Annual Performance Report 2015
Table 7 Summary of sludge produced and imported
Month
York Influent Solids (dry
tonnes)
Durham Influent Solids (dry
tonnes)
Total Influent Solids (dry
tonnes)
York Imported Solids (dry
tonnes)
Durham Imported
Solids (dry tonnes)
Total Imported
Solids (dry tonnes)
January 2,251 498 2,749 101 515 616 February 2,000 442 2,442 93 391 484 March 2,527 558 3,085 107 461 568 April 2,257 499 2,756 116 422 538 May 2,531 559 3,090 118 99 217 June 3,158 698 3,857 122 370 492 July 2,854 631 3,485 112 341 453 August 3,044 673 3,717 51 100 151 September 2,836 627 3,463 85 87 172 October 2,615 578 3,192 98 83 181 November 2,362 522 2,884 95 218 313 December 2,317 512 3,164 40 486 526
Total 30,752 6,796 37,883 1,138 3,573 4,711
Page 17 of 22

Duffin Creek Water Pollution Control Plant Annual Performance Report 2015
Table 8 Summary Hauled Septage
Month
York Septage Solids (dry
tonnes)
Durham Septage Solids
(dry tonnes)
Total Septage Solids (dry
tonnes)
Dewatered Sludge
Incinerated (dry tonnes)
Ash Produced (tonnes)
January 1.4 3.6 5.0 2,037 867 February 0.8 2.3 3.1 2,097 788 March 0.6 3.7 4.4 2,274 773 April 7.0 23.6 30.5 2,522 909 May 3.0 13.9 16.9 2,527 933 June 7.8 40.3 48.1 2,403 1,015 July 2.5 13.5 16.0 2,204 961 August 3.4 10.3 13.7 1,851 768 September 0.9 3.5 4.4 1,398 651 October 6.9 18.6 25.5 2,055 934 November 4.5 25.5 30.0 2,070 852 December 3.1 12.6 15.7 2,347 1,252
Total 41.9 171.5 213.4 25,785 10,703
Page 18 of 22

Duffin Creek Water Pollution Control Plant Annual Performance Report 2015
Table 9 Dewatering Summary
Month Average Feed Solids % TS
Average Sludge Cake
% TS Average Polymer Dosage kg/tonne
Total Sludge Output dry tonnes
January 2.7 26.1 9.6 2,433 February 2.5 25.7 9.0 2,400 March 3.1 26.3 9.2 2,535 April 3.3 27.3 9.0 2,796 May 2.8 27.0 7.6 3,186 June 3.1 27.0 8.2 3,012 July 2.7 26.7 8.7 2,648 August 2.6 26.6 9.0 2,198 September 2.4 25.5 8.5 1,695 October 2.4 25.2 8.5 2,532 November 2.6 26.1 7.9 2,561 December 3.3 27.3 5.5 3,955 Total 31,951 Average 2.8 26.39 8.4 2,663 Min 2.4 25.20 5.5 1,695 Max 3.3 27.28 9.6 3,955
Page 19 of 22
Duffin Creek Water Pollution Control Plant Annual Performance Report 2015
Glossary of Terms Aeration Tank
A vessel in which a biological process is carried out which involves bacterial organisms or biochemically active substances derived from such organisms. This encompasses a combination of aerobic, anoxic, and anaerobic processes.
Anaerobic Digestion Is a series of biological processes in which microorganisms break down biodegradable material in the absence of oxygen.
Annual Average Concentration An arithmetic mean of the monthly average concentrations of a contaminant in the effluent calculated for any particular year.
Annual Average Loading The value obtained by multiplying the Annual Average Concentration of a contaminant by the Average Daily Flow over the same calendar year.
Average Daily Flow The cumulative total sewage flow to the sewage works during a calendar year divided by the number of days during which sewage was flowing to the sewage works that year.
Biosolids Organic material recovered from wastewater sludge.
BOD5 Five Day Biochemical Oxygen Demand (also known as totalBOD5) means five day biochemical oxygen demand measured in an unfiltered sample and includes carbonaceous and nitrogenous oxygen demand.
By-pass Means a diversion of sewage around one or more unit processes within the Sewage Treatment Plant with the diverted sewage flows being returned to the Sewage Treatment Plant treatment train upstream of the Final effluent sampling location, and discharging to the environment through the Sewage Treatment Plant outfall.
CBOD5 -Five day Carbonaceous Biochemical Oxygen Demand Means a five day carbonaceous (nitrification inhibited) biochemical oxygen demand measured in an unfiltered sample.
conc. - Concentration DP - Dissolved Phosphorus
This is the soluble form of phosphorus present in the wastewater. ECA - Environmental Compliance Approval
The primary regulatory instrument for each WPCP. E. coli - (Escherichia coli)
Refers to the thermally tolerant forms of Escherichia that can survive at 44.5 degrees Celsius. Final Effluent
Sewage discharge via the WPCP outfall after undergoing the full train of unit processes as listed in the Environmental Compliance Approval.
Geometric Mean Density Is the nth root of the product of multiplication of the results of n number of samples over the period specified.
Grab Sample A single sample taken at a specific moment in time, a snapshot of the conditions at the time the sample was retrieved.
Duffin Creek Water Pollution Control Plant Annual Performance Report 2015
m3 - (Cubic Metre) Volume measurement, 1m3 = 1000 litres or 220 imperial gallons.
m3/d - (Cubic Metres Per Day) Flow measurement, 1m3 = 1000 litres or 220 imperial gallons. Volume of liquid treated in a 24 hour period.
Max. – Maximum Maximum Flow Rate
The peak or highest flow recorded during a specific time period usually in a twenty-four (24) period.
mg/L - (Milligram Per Litre) This is a measure of the concentration of a parameter in water or wastewater, sometimes referred to as parts per million (ppm).
Min. – Minimum mm - (millimetre)
Is a unit of length in the metric system, equal to one thousandth of a metre. MOECC - (Ministry of the Environment and Climate Change)
The Provincial regulatory agency responsible for overseeing the water and wastewater facilities in Ontario. Their primary functions include approval for new or expanding facilities, inspections and investigations.
Monthly Average Concentration The arithmetic mean of all daily concentrations of a contaminant in the effluent sampled or measured, or both, during a calendar month.
Monthly Average Loading Calculated by multiplying the monthly average concentration of a contaminant in the effluent sampled or measured, or both, during a calendar month.
N/A - Not Applicable pH
Index of hydrogen ion activity, pH is defined as the negative logarithm of hydrogen ion concentration in moles per litre. The pH may range from 0 – 14, where 0 is most acidic, 14 most basic and 7 neutral.
Raw Influent Raw wastewater entering the water pollution control plant before treatment.
Septage Partially treated sludge from a septic tank.
Sludge The settleable solids separated from liquids during processing.
TAN -Total Ammonia Nitrogen Ammonia exists in two forms in the water: NH3 (this is called unionized ammonia ) NH4+ ( this is called ionized ammonia ) Together, these two forms of ammonia are called TAN which means total ammonia nitrogen.
TCR -Total Chlorine Residual The total amount of chlorine in water, including the combined chlorine and the free available chlorine.
Temp. – Temperature
Page 21 of 22

Duffin Creek Water Pollution Control Plant Annual Performance Report 2015
TP -Total Phosphorus A laboratory analyses to determine the total amount of particulate and soluble phosphorus present in the wastewater.
TSS -Total Suspended Solids A laboratory analyses to measure particles that are larger than 2 microns found in the wastewater.
TS -Total Solids Is a measure of the suspended and dissolved solids in the wastewater and in biosolids.
Unionized Ammonia Nitrogen Un-ionized ammonia refers to all forms of ammonia in water with the exception of the ammonium ion (NH4 +).
WPCP - Water Pollution Control Plant Is typically a facility composed of a variety of treatment processes that collectively treat the wastewater.
If this information is required in an accessible format, please contact 1-800-372-1102 extension 3488
Page 22 of 22
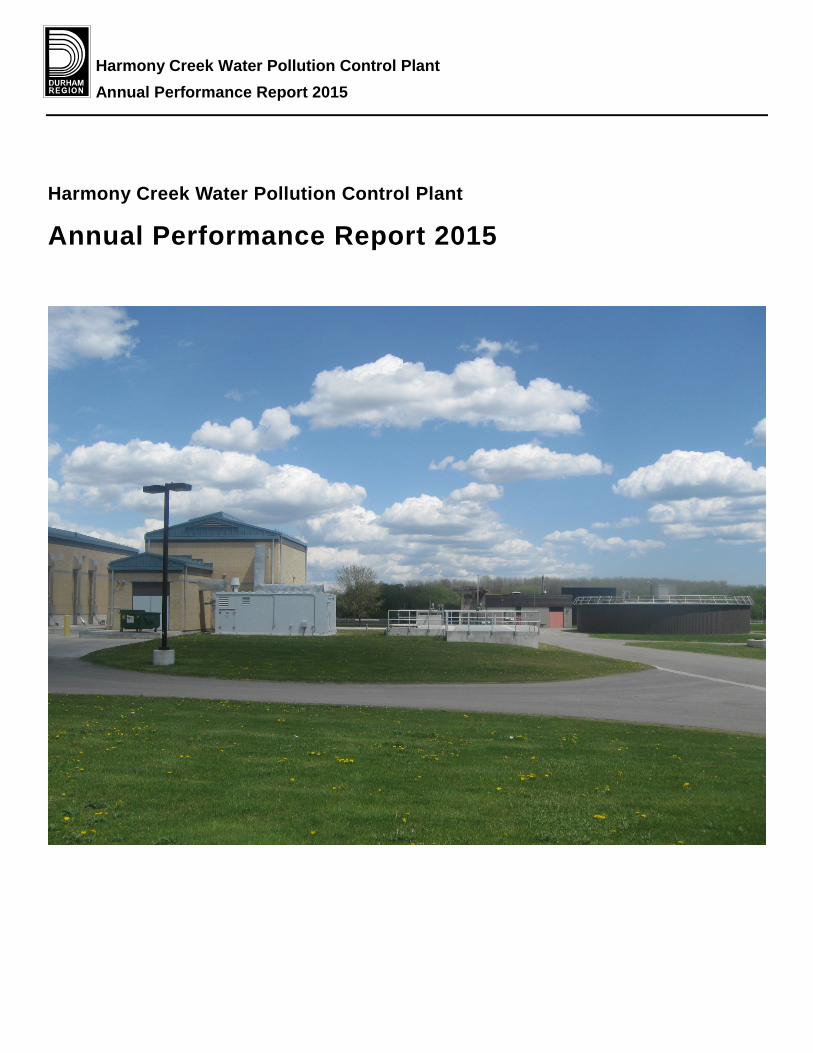
Harmony Creek Water Pollution Control Plant Annual Performance Report 2015
Harmony Creek Water Pollution Control Plant
Annual Performance Report 2015

Harmony Creek Water Pollution Control Plant Annual Performance Report 2015
Page 2 of 16
The Regional Municipality of Durham
Harmony Creek Water Pollution Control Plant 2015 Annual Performance Report Environmental Compliance Approval (ECA): 3580-9PXLVG Dated December 3, 2014 Environmental Compliance Approval (Air): 0488-6X5PZD Dated November 16, 2007 The Harmony Creek Water Pollution Control Plant (WPCP) Performance Report provides staff, stakeholders and customers a performance overview of the Harmony Creek WPCP in 2015. Further, this report fulfills the annual reporting requirements of the Ontario Ministry of the Environment and Climate Change (MOECC). The performance report demonstrates the commitment of ensuring that the WPCP continues to deliver wastewater services to our customers in an environmentally responsible manner. For a description of terms and abbreviations used in this report, refer to the glossary at the end of the report.
Water Pollution Control Plant Process Description
General The Harmony Creek WPCP is owned and operated by the Regional Municipality of Durham and in accordance with the terms and conditions of the ECA. The plant is located in the City of Oshawa. Harmony Creek WPCP treats wastewater from the Oshawa and Courtice service areas in the Regional Municipality of Durham. A portion of the flow received at the Harmony Creek WPCP is pumped to the Courtice WPCP by the on-site Harmony Creek Sanitary Sewage Pumping Station (SSPS). The Harmony Creek WPCP services 40% of the catchment population or approximately 74,564 residents. The Harmony Creek WPCP is designed to treat wastewater at an average flow rate of 34,100 cubic metres per day (m3/d) as noted in the ECA. The plant is an MOECC Class Four conventional activated sludge treatment plant that utilizes the following processes to treat wastewater:
• raw influent, • preliminary treatment, • primary treatment, • secondary treatment, • phosphorus removal system, • disinfection (chlorination/dechlorination), • solids treatment – anaerobic digestion..
Raw Influent Wastewater is collected through approximately 655 km of sanitary sewers in Oshawa and Courtice and is conveyed to the Harmony Creek WPCP and Harmony Creek sanitary sewage pumping station (SSPS). Approximately 60% of the influent flow is diverted to the Harmony Creek SSPS and conveyed to the Courtice WPCP. The remaining flow is treated at the Harmony Creek WPCP.
Harmony Creek Water Pollution Control Plant Annual Performance Report 2015
Page 3 of 16
Preliminary Treatment Grit Removal: Heavy suspended material such as sand and small stones (grit) is removed in the aerated grit tank. The velocity of the wastewater rolling in the tanks is controlled by the quantity of air added to produce conditions that allow heavy grit material to settle, while keeping the lighter organic material in suspension to proceed to the next process tank. The grit removed in this process is transported to landfill. Screening: One automatic, mechanically cleaned screen removes paper products and large material that could harm pumps and process equipment. Screenings are removed in this process and transported to landfill for disposal. Primary Treatment The primary clarifier utilizes the physical process of sedimentation which allows suspended material to settle to the bottom of the tank as sludge. This raw sludge, along with excess activated sludge from the secondary treatment process is collected by a flight and chain mechanism which pushes the sludge into hoppers. The sludge is then pumped to the anaerobic digester for further treatment. Any material floating on the surface of the clarifier (scum) is also removed to the digester.
Secondary Treatment Aeration: The Harmony Creek WPCP has a flexible aeration system which can operate as two individual aeration tanks or as one large aeration tank. The current configuration is as one large aeration tank. The effluent from the primary clarifier flows into the aeration tanks. Here fine bubbled air is diffused into the sewage to remove organics and nutrients from the wastewater. Biological activity is controlled to assimilate the organic material. Secondary Clarifier: The effluent from the aeration tank is directed to the two secondary clarifiers where it settles quickly as an activated (living) sludge leaving a clear effluent to overflow the clarifier. The sludge collected on the bottom of the clarifier is pumped back to the head of the aeration tank. The microorganisms are returned to repeat the process. Waste activated sludge is sent to the primary clarifier. Phosphorous Removal System
The phosphorous removal system is intended to lower the total phosphorous level in the final effluent by adding a chemical coagulant (ferrous chloride) as part of the treatment process. Ferrous chloride can be added at the primary effluent. Disinfection (chlorination/dechlorination) Chlorine in the form of liquid sodium hypochlorite is metered into the effluent stream for pathogen control. Disinfected effluent is discharged to Lake Ontario. Sludge Management Anaerobic Digestion: The raw sludge collected from the primary clarifiers is pumped into the primary digester. Anaerobic bacteria reduce the volume of sludge. As a by-product the digester produces a more stabilized sludge; water, which is returned to the plant for further treatment; and a combination of carbon dioxide, methane, and hydrogen sulphide. The methane is used to offset the heating requirements of the digesters.

Harmony Creek Water Pollution Control Plant Annual Performance Report 2015
Page 4 of 16
Biosolids: All sludge produced is pumped to the biosolids holding facility. From there the treated biosolids can be utilized on approved nurseries or be shipped to Duffin Creek WPCP for incineration. Biosolids are transported plant to plant in accordance with ECA #A820250 and ECA #4400-4LBLXD for land application.
Environmental Compliance Approval Under Condition 9 (5) of the ECA #3580-9PXLVG the Region of Durham must produce an annual report that contains the following information:
a) Summary and interpretation of all monitoring data and a comparison to the effluent limits The Harmony Creek WPCP effluent was determined to be compliant with the ECA approval limits during the reporting period. The plant operated at an average of 62% of its rated capacity and received a maximum daily flow of 42,178 m3/d on June 29, 2015. Table 3 provides a descriptive tabulation of effluent results.
b) Description of any operating problems encountered and corrective actions taken: No major operating problems were encountered other than the high flow events described in the bypass section. No corrective actions could be taken for these events. Ongoing construction upgrades were taking place in 2015.
c) Maintenance of major equipment Major maintenance items in 2015 included:
• Repairs to secondary clarifier flight & chain system. • Plant #2 main bar screen maintenance. • Rebuild return activated sludge pump. • Rebuild waste activated sludge pump. • Effluent water pump rebuild. • Digester mixer refurbishment. • Repaired leaking pipes in digester heat exchanger.
d) Summary of any effluent quality assurance or control measures • In-house lab test results are compared to the results of the Regional Environmental
Laboratory on comparable samples to determine the in-house accuracy. All results were found to be within a comparable range.
e) Summary of the calibration and maintenance carried out • Calibration of the effluent flow meter and the secondary clarifier flow meter occurred in May
and October 2015. • Calibration of the in-house lab pH meter is conducted regularly.
f) Effluent Objectives The Regional Municipality of Durham continually strives to achieve the best effluent quality at all times, remaining below the ECA compliance limits. The average daily rated flow capacity of 34,100 m3/d was not exceeded.

Harmony Creek Water Pollution Control Plant Annual Performance Report 2015
Page 5 of 16
The total suspended solids objective of 15 mg/L was exceeded in 6 of 282 samples (2%). This was the result of additional loading to the plant while receiving sludge from the Port Darlington WPCP which was undergoing construction. Samples were monitored, no process changes were made. The total phosphorus objective of 1 mg/L was exceeded in 14 of 291 (5%) samples. This is likely also attributed to the additional sludge loading to the plant. Samples were monitored and ferrous chloride was increased as required. The E.coli monthly average objective of 200 cfu/100 ml was exceeded on six occasions. These results occurred during the non-disinfection period of January 1 to May 15 and October 16 to December 31. The total chlorine residual objective was exceeded 175 times during the disinfection period attempting to meet the E.coli objective. Dechlorination facilities were under construction in 2015. Best efforts and process adjustments will continue to be applied to maintain results below objectives.
g) Biosolids Production: Tabulation of Volume of Sludge Generated: The volume of sludge removed from Harmony Creek WPCP in 2015 was 11,600 m3.
Outline of Anticipated Volumes to be Generated in the Next Reporting Period: There is no increase of sludge volume expected in the next reporting period. Summary of Locations to Where Sludge is Disposed: Duffin Creek WPCP - 100%
h) Summary of Complaints and Steps Taken to Address the Complaint: There were no documented complaints in 2015.
i) By-passes and Spills Construction was underway during 2015 in order to upgrade processes at the Harmony Creek WPCP. A planned by-pass was approved by the MOECC in September of 2014 allowing the influent raw flow to be diverted around the primary clarifier so that raw sewage could go directly to the aeration tank. This was done so that the primary clarifier could undergo approved essential maintenance. The influent sewage was fully treated through the preliminary and secondary processes and sampling was conducted to ensure compliance with the ECA. Approval for the by-pass expired April 3, 2015. The MOECC granted an extension to complete the work by July 31, 2015. The primary clarifier was put back into service July 7 of 2015. Two unplanned by-pass events occurred in 2015: A primary by-pass occurred on June 23rd. The event lasted three hours and fifteen minutes and discharged approximately 4,200 m3 without treatment. Exceptionally high flows caused this event. The MOECC was notified and the Region received notification number 124313.
Harmony Creek Water Pollution Control Plant Annual Performance Report 2015
Page 6 of 16
A secondary by-pass occurred on October 28th, due to very high flows during a heavy rainfall event. 113 m3 bypassed secondary treatment with the event lasting eight hours and twenty three minutes. The MOECC was notified and the Region received notification number 127115. Both bypasses were chlorinated and sampled as required. There were no spills during the reporting period.
j) Schedule ‘A’, Section 1 Notice of Modifications and Status Update As per the letter submitted to the MOECC dated August 24, 2012, as part of the previous Comprehensive Certificate of Approval (CCofA), the aeration system has been converted to fine bubble aeration, and the chlorine contact tank and disinfection building construction have been completed.
k) Schedule ‘A’, Section 3 Notice of Modifications No schedule ‘A’, Section 3 Notice of Modifications were submitted in 2015.
l) Additional Information Required by MOECC Water Supervisor No additional information required. MOECC Inspection No MOECC inspection occurred in 2015.

Harmony Creek Water Pollution Control Plant Annual Performance Report 2015
Table 1 Raw Influent Flows
Month
Total Flow to Plant -metered
at the final effluent m3
Average Day Flow m3/d
Maximum Day Flow m3/d
January 621,941 20,063 28,462
February 553,440 19,766 21,064
March 618,708 19,958 21,736
April 616,189 20,540 36,754
May 639,117 20,617 28,747
June 681,482 22,716 42,178
July 654,972 21,128 29,649
August 660,095 21,293 21,905
September 635,327 21,178 24,875
October 648,017 20,904 40,518
November 747,626 24,921 27,330
December 664,418 21,433 29,142
Total 7,741,332 N/A N/A
Average 645,111 21,209* N/A
Minimum 553,440 N/A N/A
Maximum 747,626 N/A 42,178
ECA Requirement N/A 34,100 N/A
Met Compliance N/A Yes N/A *Annual Average Daily Flow

Harmony Creek Water Pollution Control Plant Annual Performance Report 2015
Page 8 of 16
Table 2 Raw Influent Analyses
Month
CBOD5 avg.
conc. mg/L
CBOD5 loading
kg/d
BOD5 avg.
conc. mg/L
BOD5 loading
kg/d
TSS avg. conc. mg/L
TSS loading
kg/d
TP avg. conc. mg/L
TP loading
kg/d
January 104 2,077 175 3,516 194 3,902 4.3 85
February 74 1,462 167 3,291 169 3,335 4.8 96
March 75 1,501 138 2,763 151 3,013 4.2 83
April 183 3,756 161 3,300 144 2,960 3.5 72
May 70 1,439 170 3,495 183 3,767 4.4 91
June 56 1,261 112 2,555 121 2,757 3.6 83
July 230 4,859 185 3,904 341 7,210 5.1 108
August 385 8,187 510 10,849 571 12,164 9.5 203
September 380 8,047 500 10,585 594 12,582 11.2 237
October 260 5,425 449 9,375 646 13,514 10.6 222
November 270 6,729 450 11,208 511 12,734 10.3 258
December 209 4,469 297 6,366 557 11,943 7.5 161
Average 191 4,053 276 5,854 349 7,394 6.6 140
Minimum 56 1,261 112 2,555 121 2,757 3.5 72
Maximum 385 8,187 510 11,208 646 13,514 11.2 258
Sampling Frequency Requirement Met
N/A N/A Yes N/A Yes N/A Yes N/A

Harmony Creek Water Pollution Control Plant Annual Performance Report 2015
Page 9 of 16
Table 2 Raw Influent Analyses continued
Month
DP avg. conc. mg/L
COD avg.
conc. mg/L
TKN avg.
conc. mg/L
TAN avg.
conc. mg/L
TAN loading*
kg/d
pH min.
pH max.
January 1.82 267 39.58 27.02 542 6.75 7.27
February 1.93 451 42.65 29.36 580 6.87 7.20
March 2.25 391 39.15 30.72 613 6.58 7.54
April 1.76 351 36.60 21.82 448 7.00 8.11
May 1.76 394 38.23 27.05 558 7.29 7.77
June 1.54 265 31.52 18.68 424 6.91 7.78
July 1.13 812 40.83 27.49 581 6.70 7.54
August 1.67 1017 59.63 28.96 617 6.40 7.32
September 1.40 985 67.96 26.84 568 6.59 7.33
October 1.57 609 69.03 26.27 549 6.68 7.80
November 1.65 865 64.58 27.46 684 7.07 7.52
December 1.81 550 49.50 26.38 565 6.47 7.63
Average 1.69 580 48.27 26.50 562 N/A N/A
Minimum 1.13 265 31.52 18.68 424 6.40 N/A
Maximum 2.25 1017 69.03 30.72 684 N/A 8.11
Sampling Frequency Requirement Met
N/A Yes Yes Yes N/A Yes Yes
*Annual Average loading
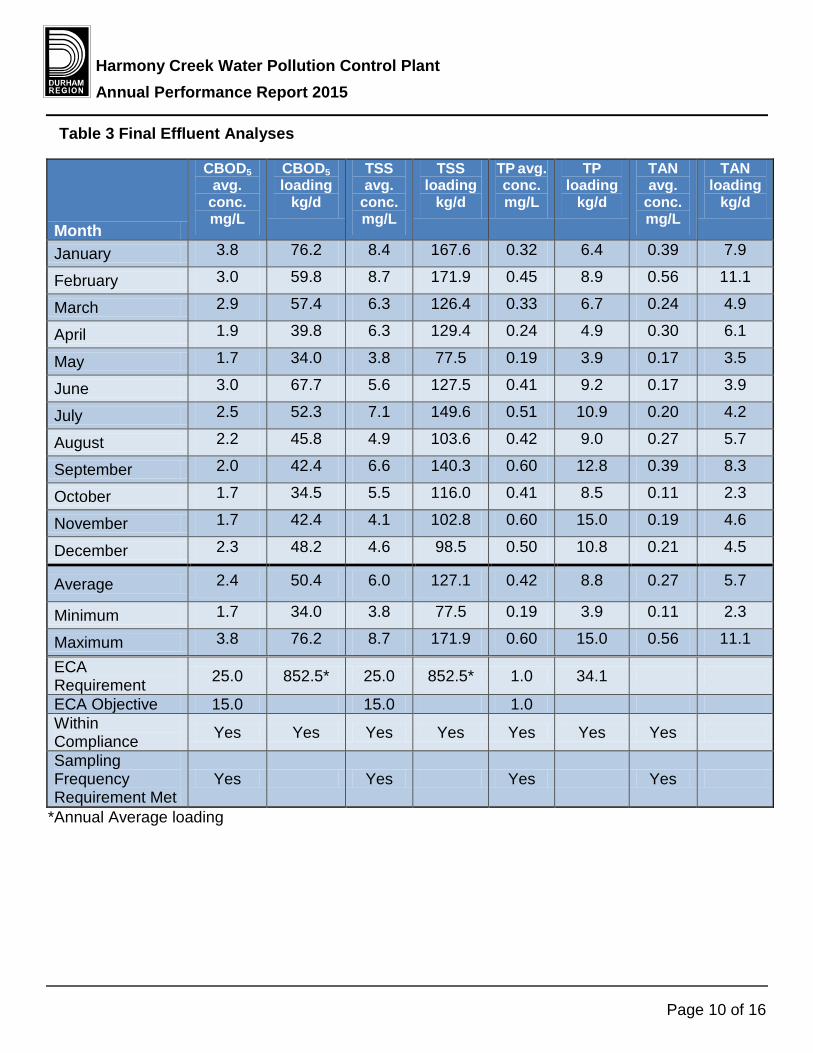
Harmony Creek Water Pollution Control Plant Annual Performance Report 2015
Page 10 of 16
Table 3 Final Effluent Analyses
Month
CBOD5 avg.
conc. mg/L
CBOD5 loading
kg/d
TSS avg.
conc. mg/L
TSS loading
kg/d
TP avg. conc. mg/L
TP loading
kg/d
TAN avg.
conc. mg/L
TAN loading
kg/d
January 3.8 76.2 8.4 167.6 0.32 6.4 0.39 7.9
February 3.0 59.8 8.7 171.9 0.45 8.9 0.56 11.1
March 2.9 57.4 6.3 126.4 0.33 6.7 0.24 4.9
April 1.9 39.8 6.3 129.4 0.24 4.9 0.30 6.1
May 1.7 34.0 3.8 77.5 0.19 3.9 0.17 3.5
June 3.0 67.7 5.6 127.5 0.41 9.2 0.17 3.9
July 2.5 52.3 7.1 149.6 0.51 10.9 0.20 4.2
August 2.2 45.8 4.9 103.6 0.42 9.0 0.27 5.7
September 2.0 42.4 6.6 140.3 0.60 12.8 0.39 8.3
October 1.7 34.5 5.5 116.0 0.41 8.5 0.11 2.3
November 1.7 42.4 4.1 102.8 0.60 15.0 0.19 4.6
December 2.3 48.2 4.6 98.5 0.50 10.8 0.21 4.5
Average 2.4 50.4 6.0 127.1 0.42 8.8 0.27 5.7
Minimum 1.7 34.0 3.8 77.5 0.19 3.9 0.11 2.3
Maximum 3.8 76.2 8.7 171.9 0.60 15.0 0.56 11.1
ECA Requirement 25.0 852.5* 25.0 852.5* 1.0 34.1 N/A N/A
ECA Objective 15.0 N/A 15.0 N/A 1.0 N/A N/A N/A Within Compliance Yes Yes Yes Yes Yes Yes Yes N/A
Sampling Frequency Requirement Met
Yes N/A Yes N/A Yes N/A Yes N/A
*Annual Average loading

Harmony Creek Water Pollution Control Plant Annual Performance Report 2015
Page 11 of 16
Table 3 Final Effluent Analyses continued
Month
Unionized NH3 avg.
conc. mg/L
TKN avg.
conc. mg/L
DP avg.
conc. mg/L
TCR avg.
conc. mg/L
TCR loading
kg/d
pH min.
pH max.
Temp. oC
min.
Temp. oC
max.
January 0.00 1.65 0.10 N/A N/A 6.70 7.04 6.6 11.4
February 0.00 1.80 0.06 N/A N/A 6.73 7.18 7.6 11.1
March 0.00 1.75 0.06 N/A N/A 6.54 7.37 9.7 13.8
April 0.00 1.67 0.05 N/A N/A 6.83 7.49 9.4 14.0
May 0.00 1.30 0.06 0.57 11.7 7.04 7.50 14.0 18.9
June 0.00 1.92 0.24 0.52 11.8 6.86 7.20 16.4 20.1
July 0.00 1.73 0.33 0.56 11.8 6.79 7.55 17.9 24.3
August 0.00 1.92 0.29 0.56 12.0 6.92 7.14 20.0 22.5
September 0.00 1.80 0.44 0.53 11.2 6.63 7.13 18.5 23.9
October 0.00 1.56 0.30 0.53 11.0 6.59 7.42 14.9 19.6
November 0.00 1.79 0.39 N/A N/A 7.15 7.64 13.0 17.9
December 0.00 1.70 0.30 N/A N/A 6.99 7.62 13.6 18.6
Average 0.00 1.72 0.22 0.54 11.6 N/A N/A N/A N/A
Minimum 0.00 1.30 0.05 0.52 11.1 6.54 N/A 6.6 N/A
Maximum 0.00 1.92 0.44 0.57 12.0 N/A 7.64 N/A 24.3
ECA Requirement N/A N/A N/A N/A N/A N/A N/A N/A N/A
ECA Objective N/A N/A N/A 0.5 N/A 6.0 9.5 N/A N/A
Within Compliance N/A N/A N/A N/A N/A N/A N/A N/A N/A
Sampling Frequency Requirement Met
Yes Yes N/A Yes N/A Yes Yes Yes Yes
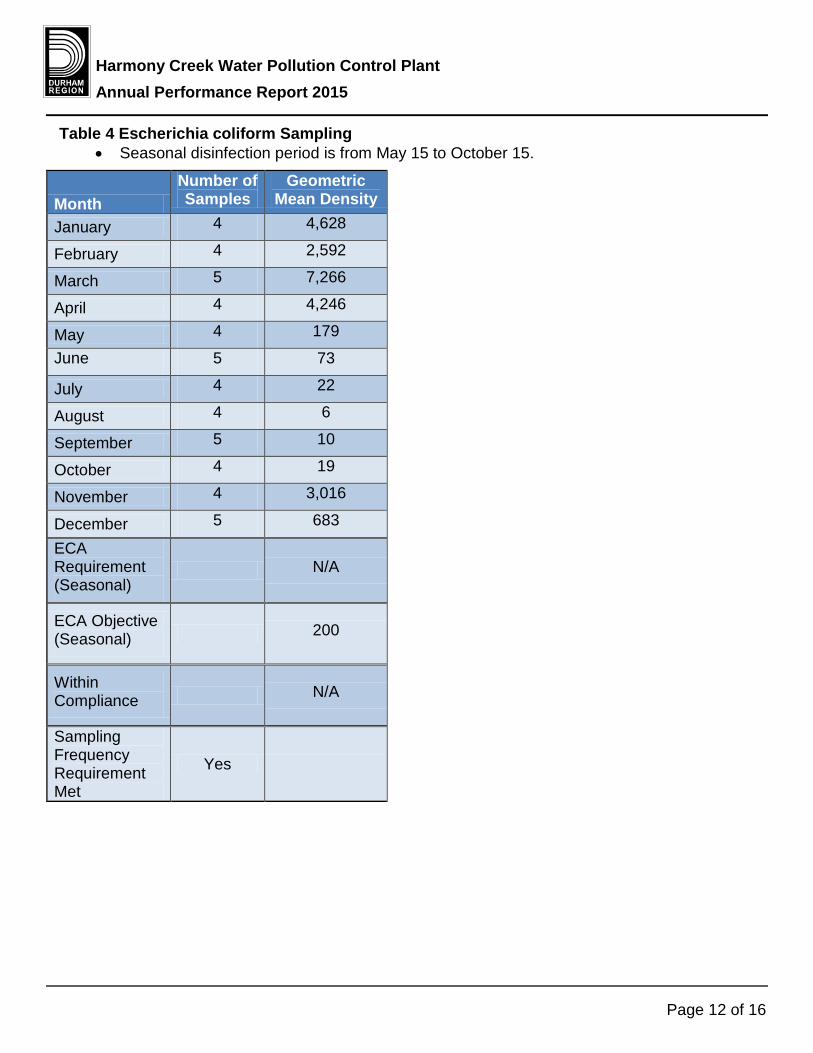
Harmony Creek Water Pollution Control Plant Annual Performance Report 2015
Page 12 of 16
Table 4 Escherichia coliform Sampling • Seasonal disinfection period is from May 15 to October 15.
Month Number of Samples
Geometric Mean Density
January 4 4,628
February 4 2,592
March 5 7,266
April 4 4,246
May 4 179
June 5 73
July 4 22
August 4 6
September 5 10
October 4 19
November 4 3,016
December 5 683
ECA Requirement (Seasonal)
N/A N/A
ECA Objective (Seasonal) N/A 200
Within Compliance N/A N/A
Sampling Frequency Requirement Met
Yes N/A

Harmony Creek Water Pollution Control Plant Annual Performance Report 2015
Page 13 of 16
Table 5 Energy and Chemical Usage
Month
Total Plant Flow
(cubic metres)
Ferrous Chloride (litres)
Sodium Hypochlorite (kilograms as chlorine)
Hydro (kWh)
Natural Gas
(cubic metres)
January 621,941 10,963 0 513,476 14,989
February 553,440 11,089 0 456,228 17,997
March 618,708 13,299 0 496,760 13,823
April 616,189 13,140 0 554,337 9,668
May 639,117 15,326 182 451,563 3,377
June 681,482 15,052 327 621,950 2,517
July 654,972 13,853 362 468,051 4,424
August 660,095 12,633 355 406,755 1,822
September 635,327 13,685 371 405,634 12,745
October 648,017 13,778 183 463,124 7,584
November 747,626 13,155 0 479,631 25,344
December 664,418 16,007 0 524,110 11,770
Total 7,741,332 161,980 1,780 5,841,619 126,060

Harmony Creek Water Pollution Control Plant Annual Performance Report 2015
Page 14 of 16
Glossary of Terms Aeration Tank
Is a vessel in which a biological process is carried out which involves bacterial organisms or biochemically active substances derived from such organisms. This encompasses a combination of aerobic, anoxic processes.
Anaerobic Digestion Is a series of biological processes in which microorganisms break down biodegradable material in the absence of oxygen.
Annual Average Concentration An arithmetic mean of the monthly average concentrations of a contaminant in the effluent calculated for any particular year.
Annual Average Loading The value obtained by multiplying the Annual Average Concentration of a contaminant by the Average Daily Flow over the same calendar year.
Average Daily Flow The cumulative total sewage flow to the sewage works during a calendar year divided by the number of days during which sewage was flowing to the sewage works that year.
Biosolids Organic material recovered from wastewater sludge.
BOD5 Five Day Biochemical Oxygen Demand (also known as totalBOD5) means five day biochemical oxygen demand measured in an unfiltered sample and includes carbonaceous and nitrogenous oxygen demand.
By-pass A diversion of sewage around one or more unit processes within the Sewage Treatment Plant with the diverted sewage flows being returned to the Sewage Treatment Plant treatment train upstream of the Final effluent sampling location, and discharging to the environment through the Sewage Treatment Plant outfall.
CBOD5 -Five day Carbonaceous Biochemical Oxygen Demand A five day carbonaceous (nitrification inhibited) biochemical oxygen demand measured in an unfiltered sample.
Conc. Concentration The abundance of a constituent divided by the total volume of a mixture.
DP – Dissolved Phosphorus This is the soluble form of phosphorus present in the wastewater.
ECA - Environmental Compliance Approval The primary regulatory instrument for each WPCP.
E. coli - (Escherichia coli) Refers to the thermally tolerant forms of Escherichia that can survive at 44.5 degrees Celsius. Calculated using a monthly geometric mean density.

Harmony Creek Water Pollution Control Plant Annual Performance Report 2015
Page 15 of 16
Final Effluent Sewage discharge via the WPCP outfall after undergoing the full train of unit processes as listed in the Environmental Compliance Approval.
Geometric Mean Density Is the nth root of the product of multiplication of the results of n number of samples over the period specified.
Grab Sample A single sample taken at a specific moment in time, a snapshot of the conditions at the time the sample was retrieved.
m3 - (Cubic Metre) Volume measurement, 1 m3 = 1000 litres or 220 imperial gallons.
m3/d - (Cubic Metres Per Day) Flow measurement, 1 m3 = 1000 litres or 220 imperial gallons. Volume of liquid treated in a 24 hour period.
Max. – Maximum Maximum Flow Rate
The peak or highest flow recorded during a specific time period usually in a twenty-four (24) period.
mg/L - (Milligram Per Litre) This is a measure of the concentration of a parameter in wastewater, sometimes referred to as parts per million (ppm).
Min. – Minimum mm - (millimetre)
Is a unit of length in the metric system, equal to one thousandth of a metre. MOECC - (Ministry of the Environment and Climate Change)
The Provincial regulatory agency responsible for overseeing the water and wastewater industries in Ontario. Their primary functions include approval for new or expanding facilities, inspections and investigations.
Monthly Average Concentration The arithmetic mean of all daily concentrations of a contaminant in the effluent sampled or measured, or both, during a calendar month.
Monthly Average Daily Flow The cumulative total sewage flow to the sewage works during a calendar month divided by the number of days during which sewage was flowing to the sewage works that month.
Monthly Average Loading Calculated by multiplying the monthly average concentration of a contaminant in the effluent sampled or measured, or both, during a calendar month by the monthly average daily flow.
N/A - Not Applicable
Harmony Creek Water Pollution Control Plant Annual Performance Report 2015
Page 16 of 16
pH Index of hydrogen ion activity, pH is defined as the negative logarithm of hydrogen ion concentration in moles per litre. The pH may range from 0 – 14, where 0 is most acidic, 14 most basic and 7 neutral.
Rated Capacity The Average Daily Flow for which the works are approved to handle.
Raw Influent Raw wastewater entering the water pollution control plant before treatment.
Septage Partially treated sludge from a septic tank.
Sludge The settleable solids separated from liquids during processing.
TAN -Total Ammonia Nitrogen Ammonia exists in two forms in the water: NH3 (this is called unionized ammonia ) NH4+ ( this is called ionized ammonia ) Together, these two forms of ammonia are called TAN which means total ammonia nitrogen.
TCR -Total Chlorine Residual The total amount of chlorine in water, including the combined chlorine and the free available chlorine.
Temp. – Temperature TP -Total Phosphorus
A laboratory analyses to determine the total amount of particulate and soluble phosphorus present in the wastewater.
TSS -Total Suspended Solids A laboratory analyses to measure particles that are larger than 2 microns found in the wastewater.
TS -Total Solids Is a measure of the suspended and dissolved solids in the wastewater and in biosolids.
Unionized Ammonia Nitrogen Un-ionized ammonia refers to all forms of ammonia in water with the exception of the ammonium ion (NH4 +). Calculated using the methodology specified in the MOECC’s Guideline and Policies document titled “Provincial Water Quality Objectives” (July 1994).
WPCP - Water Pollution Control Plant Is typically a facility composed of a variety of treatment processes that collectively treat the wastewater.
If this information is required in an accessible format, please contact 1-800-372-1102 extension 3488

Lake Simcoe Water Pollution Control Plant Annual Performance Report 2015
Lake Simcoe Water Pollution Control Plant
Annual Performance Report 2015
Lake Simcoe Water Pollution Control Plant Annual Performance Report 2015
Page 2 of 18
The Regional Municipality of Durham
Lake Simcoe Water Pollution Control Plant 2015 Annual Performance Report Environmental Compliance Approval (ECA): 5292-8CYHTQ Dated June 28, 2012 Environmental Compliance Approval (Air): 8-3041-95-006 Dated February 5, 1996 The Lake Simcoe Water Pollution Control Plant (WPCP) Performance Report provides staff, stakeholders and customers an overview of the performance of the Lake Simcoe WPCP in 2015. Further, this report fulfills the annual reporting requirements of the Ontario Ministry of the Environment and Climate Change (MOECC). The performance report demonstrates the commitment of ensuring that the WPCP continues to deliver wastewater services to our customers in an environmentally responsible manner. For a description of terms and abbreviations used in this report, refer to the glossary at the end of the report.
Water Pollution Control Plant Process Description
General The Lake Simcoe WPCP is owned and operated by the Regional Municipality of Durham in accordance with the terms and conditions of the ECA. The plant is located in the Community of Beaverton in the Township of Brock. This MOECC Class Three wastewater treatment plant utilizes an extended aeration process with tertiary treatment and is designed to treat wastewater at a rated capacity of 4,550 cubic metres per day (m3/d) The Lake Simcoe WPCP has a service population of 3,788 residents. Lake Simcoe WPCP treats wastewater from the Community of Beaverton service area in the Township of Brock utilizing the following processes:
• raw influent pumping, • preliminary treatment, • secondary treatment, • tertiary treatment, • disinfection, • aerobic digestion.
Raw Influent Pumping Wastewater is collected through approximately 23.5 km of sanitary sewers in Beaverton and is conveyed to the WPCP by gravity or by two sanitary sewage pumping stations Harbor Street and Cedar Beach located in the collection system. The two flows are combined in the raw sewage inlet channel.
Preliminary Treatment Screening: There are two screen channels in the screen room for the removal of paper products and large material that could harm pumps and process equipment. One channel contains an automatic,
Lake Simcoe Water Pollution Control Plant Annual Performance Report 2015
Page 3 of 18
mechanically cleaned bar screen and the other is equipped with a bar rack to provide screening on an emergency basis. Screenings are transported to landfill for disposal. Grit Removal: Vortex grit removal is provided to remove sand, gravel, etc. for protection of mechanical equipment from unnecessary wear and reduce formation of heavy deposits in pipelines, channels and process tanks. The vortex grit tank uses centrifugal force to separate the grit from the wastewater. Grit is collected in the lower portion of the grit tank and is pumped to a grit classifier for dewatering. The dewatered grit is conveyed to the grit/screenings bin for landfill disposal.
Secondary Treatment Aeration Tanks: Preliminary effluent flow is directed to two aeration tanks. Aluminum sulphate is added to the aeration tanks to react with and remove phosphorus. Surface mechanical aerators mix air into the sewage to remove dissolved and suspended solids and nutrients from the wastewater. Biological activity is controlled to assimilate the organic material. Secondary Clarifier: The effluent from the aeration tanks is directed to its associated secondary clarifier where it settles quickly as an activated (living) sludge leaving a clear effluent to overflow the tank. The activated sludge collected on the bottom of the clarifier is pumped back to the head of the aeration tanks. The microorganisms are returned to repeat the process. Any excess activated sludge is ‘wasted’ to the aerobic digester.
Tertiary Treatment Tertiary Clarifier: The secondary effluent is directed to the tertiary clarifier. The helical flow pattern in the clarifier separates the solids from the liquid, the effluent flows over to the next process and the thickened sludge is pumped to the aerobic digestor. Tertiary Sand Filter: Effluent flow from the tertiary clarifier flows into an automatic self- cleaning sand filter. The automatic backwash may be set to backwash by an increase in head pressure or a programmed timer. The backwash water is returned to the beginning of the plant for further treatment.
Disinfection Ultra Violet (UV) Irradiation: The effluent flow from the sand filter is then directed to the UV channel for disinfection. The flow passes two banks of UV lamps connected in series before the effluent outfall channel and final discharge to Lake Simcoe.
Sludge Treatment Aerobic Digester: Activated sludge from the secondary clarifiers is pumped to an aerobic digestor for stabilization. Two mechanical mixers and a fixed header diffused aeration system provide oxygen for the microorganisms. The diffusers are turned off to allow solids to settle for removal and the supernatant to be decanted and flow by gravity to the raw equalization lagoon for further treatment. Biosolids: Stabilized biosolids from the digester are transported plant to plant within the Region of Durham for further treatment, stabilization or incineration in accordance with ECA #A820250.
Environmental Compliance Approval Under Condition 9 (5) of ECA # 5292-8CYHTQ the Region of Durham must produce an annual report that must contain the following information:
Lake Simcoe Water Pollution Control Plant Annual Performance Report 2015
Page 4 of 18
a) Summary and interpretation of all monitoring data and a comparison to the effluent limits outlined in Condition 5, including an overview of the success and adequacy of the works The raw wastewater flowing into the plant is analyzed for its chemical and physical composition. Monitoring of the raw wastewater is performed in accordance with the conditions in the ECA. Table 2 summarizes the raw wastewater characteristics during the reporting period. The Lake Simcoe WPCP effluent was compliant with the approval limits during the reporting period. The plant operated at 31.2% of its rated capacity and received a maximum daily flow of 3,749m3/d on April 26th, 2015. Tables 3-5 provide a tabulation of effluent results.
b) Description of any operating problems encountered and corrective actions taken: No operating problems were encountered in 2015.
c) Maintenance of major equipment Major maintenance items in 2015 included:
• Upgrades were made to the mechanical barscreen. • The overhead fill station for the biosolids removal has been removed and replaced with a
hose at ground level as it was causing problems in cold weather and created a safety concern when lifting the filler pipe.
d) Summary of any effluent quality assurance or control measures In-house lab test results are compared to the results of the Regional Environmental Laboratory on comparable samples to determine the in-house accuracy. Results were found to be in a comparable range. On-line instrumentation is verified by WPCP operators using various field or laboratory test equipment.
e) Summary of the calibration and maintenance carried out on all effluent monitoring equipment • Calibration of the effluent flow meter occurred in May and September 2015. • All monitoring and laboratory equipment is calibrated and maintained according to
manufacturer’s specifications. f) Efforts made and results achieved in meeting the effluent objectives
• The Regional Municipality of Durham strives to achieve the best effluent quality at all times, remaining below the ECA compliance limits.
• The annual average daily flow did not exceed the rated capacity of 4,550m3/d during the reporting period. The preliminary peak flow rate of 22,750m3/d was not exceeded.
• The effluent objective for CBOD5 was exceeded once on February 25th. • The effluent objective for total suspended solids was exceeded nine times of 257 samples
(3.5%). • The effluent objective for total phosphorus was exceeded 18 times of 308 samples (5.8%).
Aluminum sulphate dosage was increased. • The minimum objective for pH was exceeded six times of 282 samples (2%). The bench
top pH meter probe was replaced.

Lake Simcoe Water Pollution Control Plant Annual Performance Report 2015
Page 5 of 18
• The effluent objective for total ammonia nitrogen was exceeded seven times of 267 samples (2.6%).
• Extreme cold temperatures in February caused operational difficulties. Both secondary clarifiers had frozen over causing higher levels of suspended solids and total phosphorus. Aluminum sulphate dosing was increased to accommodate plant process conditions.
• On July 28th the microbial life was lost in the activated sludge process due to an overdose of aluminum sulphate. Secondary flows were diverted to the secondary equalization lagoon for stabilization. High levels of total ammonia nitrogen were experienced when microbial life was being restored to the activated sludge process.
• Best efforts and process adjustments will continue to be applied to maintain results below objectives.
g) Sludge generated A summary of the sludge volume generated in the reporting period is included in Table 5.There is no increase of sludge volume expected in the next reporting period
h) Complaints A summary of complaints received from the public is administered through a central database. There were no complaints received during the reporting period.
i) By-passes No by-passes, spills or abnormal discharges occurred during the reporting period.
j) Initial Effluent Characterization The initial effluent characterization sampling was conducted in 2014. A report was submitted to the MOECC in April of 2015.
k) Information required by MOECC Water Supervisor No additional information required.
Proposed Alterations, Extensions or Replacements There are no proposed alterations for 2016. MOECC Inspection This plant was not inspected by the MOECC in 2015.
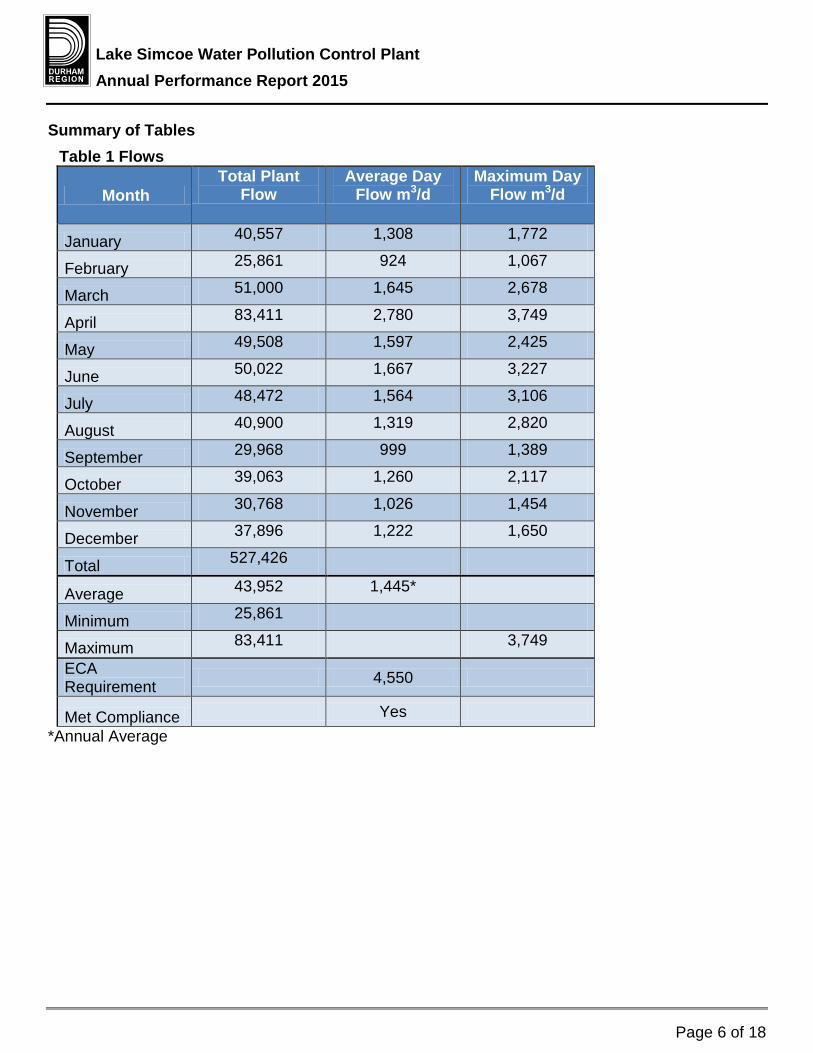
Lake Simcoe Water Pollution Control Plant Annual Performance Report 2015
Page 6 of 18
Summary of Tables Table 1 Flows
Month Total Plant
Flow Average Day
Flow m3/d Maximum Day
Flow m3/d
January 40,557 1,308 1,772
February 25,861 924 1,067
March 51,000 1,645 2,678
April 83,411 2,780 3,749
May 49,508 1,597 2,425
June 50,022 1,667 3,227
July 48,472 1,564 3,106
August 40,900 1,319 2,820
September 29,968 999 1,389
October 39,063 1,260 2,117
November 30,768 1,026 1,454
December 37,896 1,222 1,650
Total 527,426 N/A N/A
Average 43,952 1,445* N/A
Minimum 25,861 N/A
Maximum 83,411 N/A 3,749
ECA Requirement N/A 4,550 N/A
Met Compliance N/A Yes N/A *Annual Average

Lake Simcoe Water Pollution Control Plant Annual Performance Report 2015
Page 7 of 18
Table 2 Raw Influent Analyses
Month
BOD5 avg.
conc. mg/L
BOD5 loading
kg/d
TSS avg. conc. mg/L
TSS loading
kg/d
TP avg. conc. mg/L
TP loading
kg/d
DP avg.
conc. mg/L
Alkal-inity
CaCO3 mg/L
January 86 112 80 105 2.1 2.7 1.12 300
February 105 97 84 78 3.0 2.8 1.47 267
March 77 127 107 176 2.1 3.5 1.03 237
April 50 139 66 183 1.0 2.8 0.34 269
May 66 105 107 171 1.9 3.0 0.64 270
June 61 102 82 137 1.9 3.2 0.73 278
July 86 135 110 172 2.1 3.3 0.7 258
August 107 141 113 149 2.4 3.2 0.95 255
September 93 93 102 102 2.4 2.4 0.89 224
October 83 105 96 121 2.4 3.0 0.88 219
November 95 97 96 98 2.6 2.7 1.02 262
December 73 89 84 103 2.3 2.8 1.46 280
Average 82 118 94 136 2.2 3.2 0.94 260
Minimum 50 89 66 78 1.0 2.4 0.34 219
Maximum 107 141 113 183 3.0 3.5 1.47 300
Sampling Frequency Requirement Met
Yes N/A Yes N/A Yes N/A N/A Yes
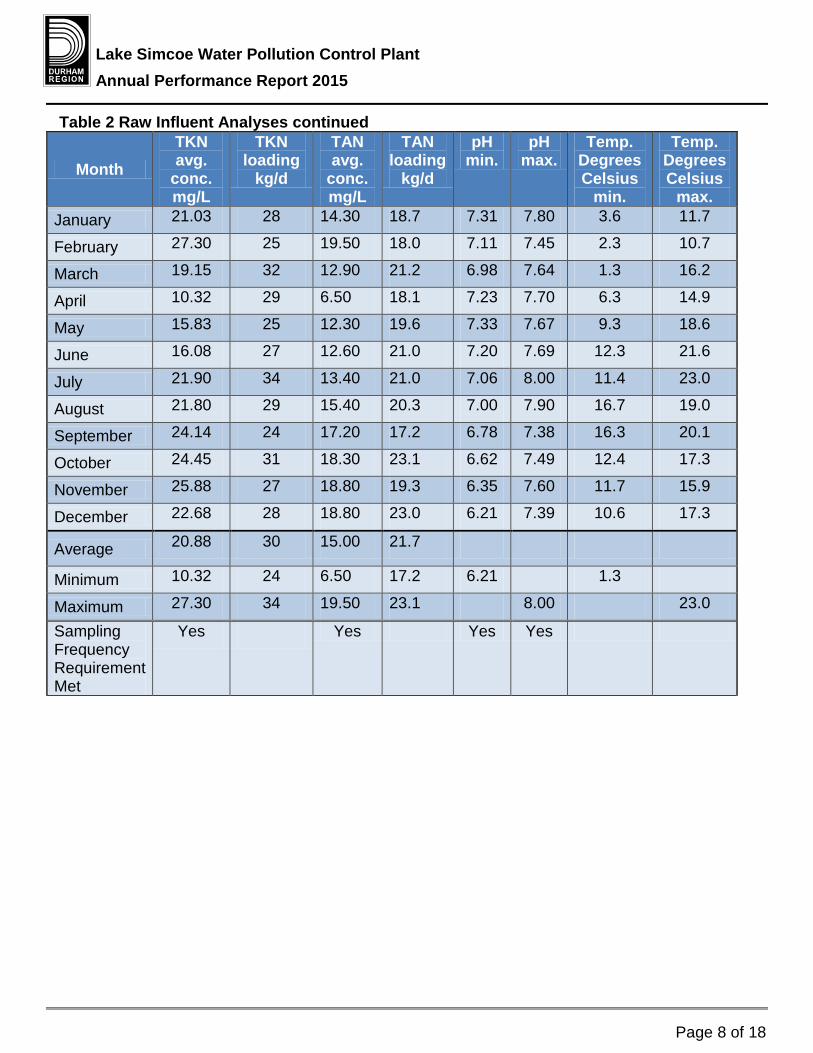
Lake Simcoe Water Pollution Control Plant Annual Performance Report 2015
Page 8 of 18
Table 2 Raw Influent Analyses continued
Month TKN avg.
conc. mg/L
TKN loading
kg/d
TAN avg.
conc. mg/L
TAN loading
kg/d
pH min.
pH max.
Temp. Degrees Celsius
min.
Temp. Degrees Celsius
max. January 21.03 28 14.30 18.7 7.31 7.80 3.6 11.7
February 27.30 25 19.50 18.0 7.11 7.45 2.3 10.7
March 19.15 32 12.90 21.2 6.98 7.64 1.3 16.2
April 10.32 29 6.50 18.1 7.23 7.70 6.3 14.9
May 15.83 25 12.30 19.6 7.33 7.67 9.3 18.6
June 16.08 27 12.60 21.0 7.20 7.69 12.3 21.6
July 21.90 34 13.40 21.0 7.06 8.00 11.4 23.0
August 21.80 29 15.40 20.3 7.00 7.90 16.7 19.0
September 24.14 24 17.20 17.2 6.78 7.38 16.3 20.1
October 24.45 31 18.30 23.1 6.62 7.49 12.4 17.3
November 25.88 27 18.80 19.3 6.35 7.60 11.7 15.9
December 22.68 28 18.80 23.0 6.21 7.39 10.6 17.3
Average 20.88 30 15.00 21.7 N/A N/A N/A N/A
Minimum 10.32 24 6.50 17.2 6.21 N/A 1.3 N/A
Maximum 27.30 34 19.50 23.1 N/A 8.00 N/A 23.0
Sampling Frequency Requirement Met
Yes N/A Yes N/A Yes Yes N/A N/A

Lake Simcoe Water Pollution Control Plant Annual Performance Report 2015
Page 9 of 18
Table 3 Final Effluent Analyses
Month
CBOD5 avg.
conc. mg/L
CBOD5 loading
kg/d
TSS avg.
conc. mg/L
TSS loading
kg/d
TP avg.
conc. mg/L
TP loading
kg/d
TP loading
kg/month
January 0.7 0.9 0.8 1 0.03 0.0 1.2
February 3.0 2.8 3.0 3 0.10 0.1 2.6
March 1.9 3.1 3.3 5 0.10 0.2 5.1
April 0.9 2.5 1.2 3 0.02 0.1 1.7
May 0.8 1.3 1.2 2 0.03 0.0 1.5
June 0.6 1.0 0.5 1 0.03 0.1 1.5
July 1.1 1.7 1.7 3 0.04 0.1 1.9
August 0.8 1.1 1.1 1 0.05 0.1 2.0
September 0.5 0.5 0.8 1 0.08 0.1 2.4
October 0.7 0.9 0.8 1 0.04 0.1 1.6
November 0.6 0.6 0.8 1 0.03 0.0 0.9
December 0.5 0.6 0.9 1 0.02 0.0 0.8
Total N/A N/A N/A N/A N/A N/A 23*
Average 1.0 1.5 1.3 2 0.05 0.1 2
Minimum 0.5 0.5 0.5 1 0.02 0.0 1
Maximum 3.0 3.1 3.3 5 0.10 0.2 5
ECA Limit 10** N/A 10** N/A 0.3** N/A 190*
ECA Objective 5 N/A 5 N/A 0.12 N/A 190
LSPRS N/A N/A N/A N/A 0.15*** N/A 190*
Within Compliance
Yes N/A Yes N/A Yes N/A Yes
Sampling Frequency Requirement Met
Yes N/A Yes N/A Yes N/A N/A
*Total Annual Loading, kg/year **Monthly Average Concentration ***Annual Average Concentration

Lake Simcoe Water Pollution Control Plant Annual Performance Report 2015
Page 10 of 18
Table 3 Final Effluent Analyses continued
Month
DP avg.
conc. mg/L
TAN Summer
avg. conc. mg/L
TAN Winter
avg. conc. mg/L
TAN loading
kg/d
TKN avg.
conc. mg/L
Un-ionized ammonia avg. conc.
mg/L
January 0.005 N/A 0.02 0.0 0.56 0.0
February 0.019 N/A 3.73 3.4 4.44 0.0
March 0.017 N/A 1.79 2.9 2.41 0.0
April 0.003 N/A 0.04 0.1 0.62 0.0
May 0.012 N/A 0.03 0.0 0.65 0.0
June 0.014 0.03 N/A 0.1 0.82 0.0
July 0.017 1.46 N/A 2.3 3.38 0.0
August 0.016 1.81 N/A 2.4 1.26 0.0
September 0.039 N/A 0.05 0.0 0.62 0.0
October 0.016 N/A 0.03 0.0 0.81 0.0
November 0.019 N/A 0.34 0.3 1.02 0.0
December 0.011 N/A 0.02 0.0 0.61 0.0
Average 0.016 1.10 0.67 1.1 1.43 0.0
Minimum 0.003 0.03 0.02 0.0 0.56 0.0
Maximum 0.039 1.81 3.73 3.4 4.44 0.0
ECA Limit N/A 5** 15** N/A N/A N/A
ECA Objective
N/A 3 10 N/A N/A N/A
Within Compliance
N/A Yes Yes N/A N/A N/A
Sampling Frequency Requirement Met
Yes Yes Yes N/A N/A N/A
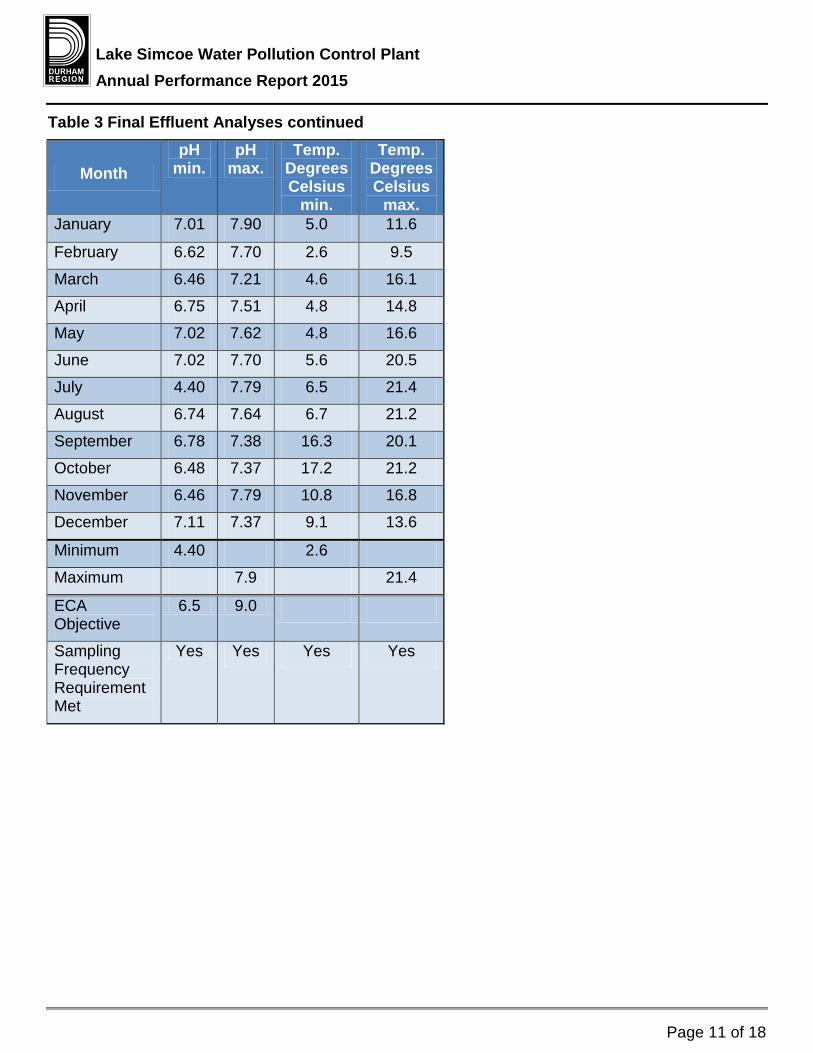
Lake Simcoe Water Pollution Control Plant Annual Performance Report 2015
Page 11 of 18
Table 3 Final Effluent Analyses continued
Month pH
min. pH
max. Temp.
Degrees Celsius
min.
Temp. Degrees Celsius
max. January 7.01 7.90 5.0 11.6
February 6.62 7.70 2.6 9.5
March 6.46 7.21 4.6 16.1
April 6.75 7.51 4.8 14.8
May 7.02 7.62 4.8 16.6
June 7.02 7.70 5.6 20.5
July 4.40 7.79 6.5 21.4
August 6.74 7.64 6.7 21.2
September 6.78 7.38 16.3 20.1
October 6.48 7.37 17.2 21.2
November 6.46 7.79 10.8 16.8
December 7.11 7.37 9.1 13.6
Minimum 4.40 N/A 2.6 N/A
Maximum N/A 7.9 N/A 21.4
ECA Objective
6.5 9.0 N/A N/A
Sampling Frequency Requirement Met
Yes Yes Yes Yes
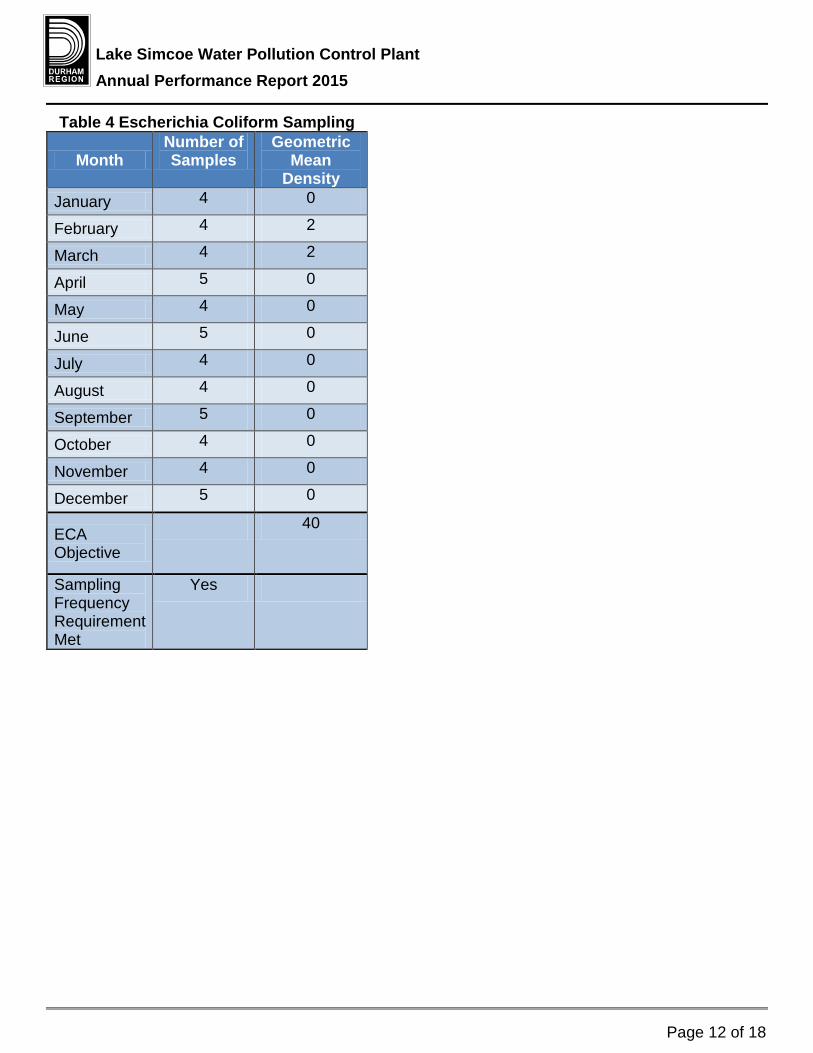
Lake Simcoe Water Pollution Control Plant Annual Performance Report 2015
Page 12 of 18
Table 4 Escherichia Coliform Sampling
Month Number of Samples
Geometric Mean
Density January 4 0
February 4 2
March 4 2
April 5 0
May 4 0
June 5 0
July 4 0
August 4 0
September 5 0
October 4 0
November 4 0
December 5 0
ECA Objective
N/A 40
Sampling Frequency Requirement Met
Yes N/A
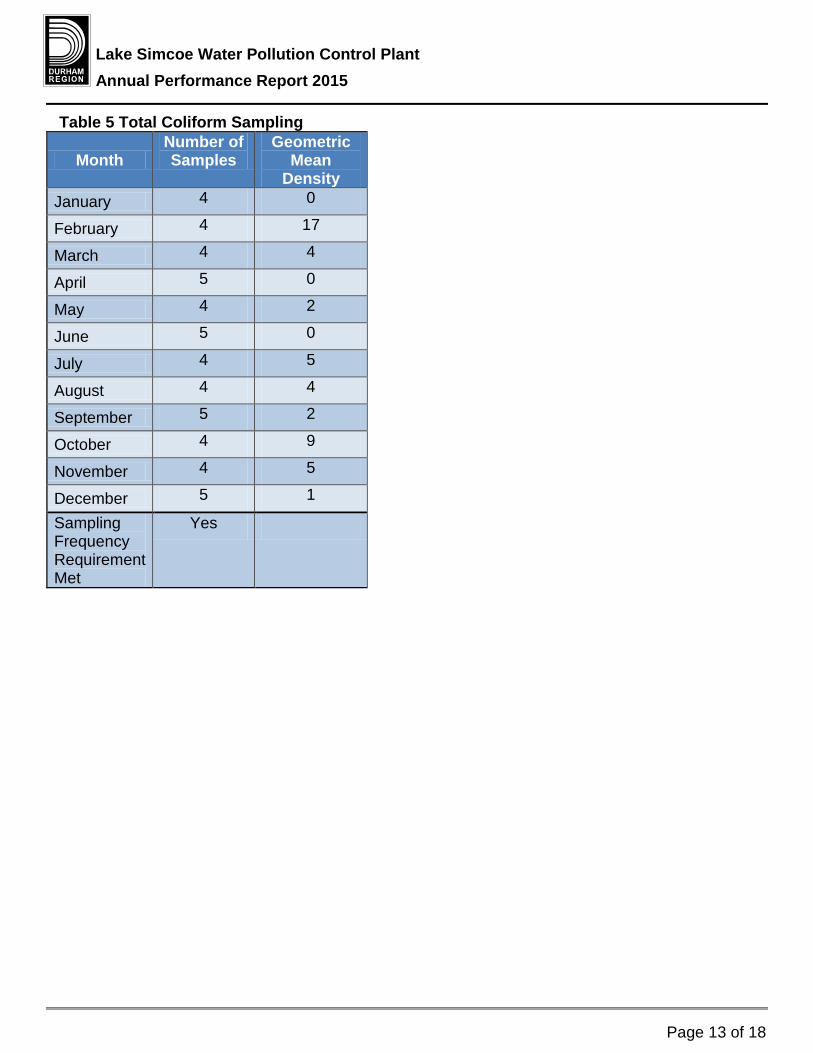
Lake Simcoe Water Pollution Control Plant Annual Performance Report 2015
Page 13 of 18
Table 5 Total Coliform Sampling
Month Number of Samples
Geometric Mean
Density January 4 0
February 4 17
March 4 4
April 5 0
May 4 2
June 5 0
July 4 5
August 4 4
September 5 2
October 4 9
November 4 5
December 5 1
Sampling Frequency Requirement Met
Yes N/N/A

Lake Simcoe Water Pollution Control Plant Annual Performance Report 2015
Page 14 of 18
Table 6 Energy and Chemical Usage
Month Total Plant
Flow (cubic metres)
Alum (litres)
Hydro (kWh)
Natural Gas (cubic metres)
January 40,557 4,287 99,310 18,818
February 25,861 4,079 69,135 22,191
March 51,000 8,022 71,427 30,100
April 83,411 10,446 67,225 17,754
May 49,508 4,502 75,246 1,954
June 50,022 4,925 69,517 2,897
July 48,472 4,775 56,912 2,797
August 40,900 2,243 70,663 0
September 29,968 3,051 66,843 0
October 39,063 3,822 67,989 3,944
November 30,768 3,155 65,315 8,887
December 37,896 4,751 75,246 11,848
Total 527,426 58,058 854,828 121,190
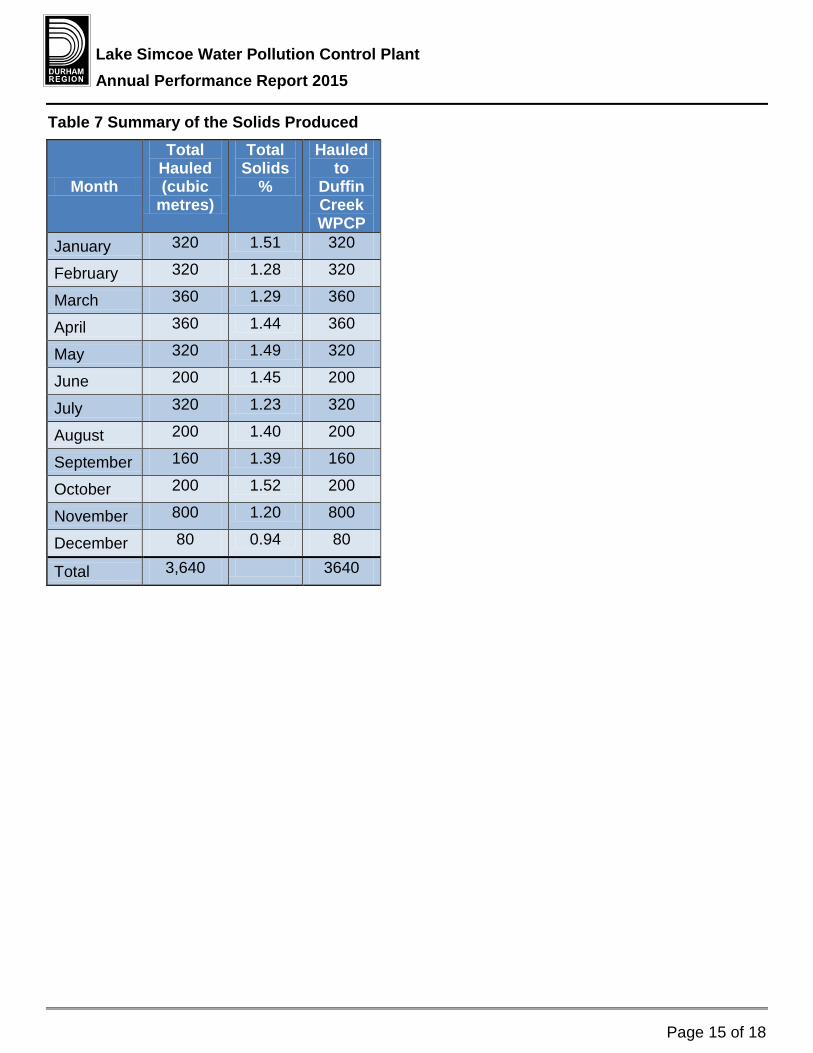
Lake Simcoe Water Pollution Control Plant Annual Performance Report 2015
Page 15 of 18
Table 7 Summary of the Solids Produced
Month
Total Hauled (cubic
metres)
Total Solids
%
Hauled to
Duffin Creek WPCP
January 320 1.51 320
February 320 1.28 320
March 360 1.29 360
April 360 1.44 360
May 320 1.49 320
June 200 1.45 200
July 320 1.23 320
August 200 1.40 200
September 160 1.39 160
October 200 1.52 200
November 800 1.20 800
December 80 0.94 80
Total 3,640 N/A 3640
Lake Simcoe Water Pollution Control Plant Annual Performance Report 2015
Page 16 of 18
Glossary of Terms Annual Average Concentration
An arithmetic mean of the monthly average concentrations of a contaminant in the effluent calculated for any particular year.
Annual Average Loading The value obtained by multiplying the annual average concentration of a contaminant by the average daily flow over the same calendar year.
Average Daily Flow The cumulative total sewage flow to the sewage works during a calendar year divided by the number of days during which sewage was flowing to the sewage works that year.
Avg – Average An arithemetic mean of the average concentrations and loadings.
Biosolids Organic material recovered from wastewater sludge.
Bioreactor A bioreactor is a vessel in which a biological process is carried out which involves bacterial organisms or biochemically active substances derived from such organisms.
BOD5 Five Day Biochemical Oxygen Demand (also known as total BOD5) means five day biochemical oxygen demand measured in an unfiltered sample and includes carbonaceous and nitrogenous oxygen demand.
By-pass Any discharge from the works that does not undergo any treatment or only receives partial treatment before it is discharged to the environment.
cBOD5 -Five Day Carbonaceous Biochemical Oxygen Demand Means a five day carbonaceous (nitrification inhibited) biochemical oxygen demand measured in an unfiltered sample..
Conc. - Concentration The abundance of a constituent divided by the total volume of a mixture.
Daily Concentration The concentration of a contaminant in the effluent discharged over any single day, as measured by a composite or grab sample, whichever is required.
DP - Dissolved Phosphorus This is the soluble form of phosphorus present in the wastewater.
ECA - Environmental Compliance Approval The primary regulatory instrument for each water pollution control plant.
E. - coli - (Escherichia coli) Refers to the thermally tolerant forms of Escherichia that can survive at 44.5 degrees Celsius.
Final Effluent Sewage discharge through the water pollution control plant outfall after undergoing the full train of unit processes as listed in the Environmental Compliance Approval.
Geometric Mean Density Is the nth root of the product of multiplication of the results of n number of samples over the period specified.
Grab Sample A single sample taken at a specific moment in time, when tested provides a snapshot of the conditions at the time the sample was retrieved.
Lake Simcoe Water Pollution Control Plant Annual Performance Report 2015
Page 17 of 18
kg - kilogram Basic unit of mass in the metric system
kg/d – kilogram per day LSPRS - Lake Simcoe Phosphorus Reduction Strategy
The ECA issued on June 28, 2012 introduced additional phosphorus objectives to comply with the requirements of the Lake Simcoe Phosphorus Reduction Strategy (2010) prepared under the Lake Simcoe Protection Plan (2009).
m3 - (Cubic Metre) Volume measurement, 1m3 = 1000 litres or 220 imperial gallons.
m3/d - (Cubic Metre Per Day) Flow measurement, 1m3 = 1000litres or 220 imperial gallons. Volume of liquid treated in a 24 hour period.
Max. - Maximum Maximum Flow Rate
The peak or highest flow recorded during a specific time period usually in a 24 hour period. mg/L - (Milligram Per Litre)
This is a measure of the concentration of a parameter in water, sometimes referred to as parts per million (ppm).
Min. - Minimum mm.-(millimetre)
Is a unit of length in the metric system, equal to one thousandth of a metre. MOECC - (Ministry of the Environment and Climate Change)
The Provincial regulatory agency responsible for overseeing the water and wastewater industries in Ontario. Their primary functions include approval for new or expanding facilities, inspections and investigations.
Monthly Average Concentration The arithmetic mean of all daily concentrations of a contaminant in the effluent sampled or measured, or both, during a calendar month.
Monthly Average Loading Is calculated by multiplying the monthly average concentration of a contaminant by the monthly average daily flow over the same calendar month.
N/A - Not Applicable Peak Flow Rate
The maximum rate of sewage flow for which the plant or process unit was designed. pH
Index of hydrogen ion activity, pH is defined as the negative logarithm of hydrogen ion concentration in moles per litre. The pH may range from 0 – 14, where 0 is most acidic, 14 most basic and 7 neutral.
Rated Capacity The average daily flow for which the works are approved to handle.
Raw Influent Raw wastewater entering the water pollution control plant before treatment.
Septage Partially treated sludge from a septic tank.
Sludge The settleable solids separated from liquids during processing.
Lake Simcoe Water Pollution Control Plant Annual Performance Report 2015
Page 18 of 18
TAN - Total Ammonia Nitrogen Ammonia exists in two forms in the water: NH3 (this is called unionized ammonia ) NH4+ ( this is called ionized ammonia ) Together, these two forms of ammonia are called TAN which means total ammonia nitrogen.
Temp. – Temperature Total Annual Loading
Is calculated by adding the calculated total monthly load discharged for each calendar year. Total Monthly Loading
Is calculated by multiplying the total monthly flow by the monthly average concentration. TP - Total Phosphorus
A laboratory analyses to determine the total amount of non-soluble and soluble phosphorus present in the wastewater.
TSS - Total Suspended Solids A laboratory analyses to measure particles that are larger than 2 microns found in the wastewater.
TS - Total Solids Is a measure of the suspended and dissolved solids in the wastewater and in biosolids.
Unionized Ammonia Nitrogen Un-ionized ammonia refers to all forms of ammonia in water with the exception of the ammonium ion (NH4 +).
WPCP - Water Pollution Control Plant A facility composed of a variety of treatment processes that collectively treat wastewater
If this information is required in an accessible format, please contact 1-800-372-1102 extension 3488

Newcastle Water Pollution Control Plant Annual Performance Report 2015
Newcastle Water Pollution Control Plant
Annual Performance Report 2015
Newcastle Water Pollution Control Plant Annual Performance Report 2015
Page 2 of 19
The Regional Municipality of Durham
Newcastle Water Pollution Control Plant 2015 Annual Performance Report Environmental Compliance Approval (ECA): 3-2189-87-946 Dated July 26, 1994
Amendments: Dated June 21, 2006 May 10, 1998 June 11, 1996
Environmental Compliance Approval (Air): 8-3083-93-006 Dated March 22, 1993 The Newcastle Water Pollution Control Plant (WPCP) Performance Report provides staff, stakeholders and customers a performance overview of the Newcastle WPCP in 2015. Further, this report fulfills the annual reporting requirements of the Ontario Ministry of the Environment and Climate Change (MOECC). The performance report demonstrates the commitment of ensuring that the WPCP continues to deliver wastewater services to our customers in an environmentally responsible manner. For a description of terms and abbreviations used in this report, refer to the glossary at the end of the report.
Water Pollution Control Plant Process Description
General The Newcastle WPCP is owned and operated by the Regional Municipality of Durham in accordance with the terms and conditions of the ECA. The plant is located in the Municipality of Clarington (Newcastle) and treats wastewater from the Newcastle service area in the Regional Municipality of Durham. The Newcastle WPCP is designed to treat wastewater at an average flow rate of 4,086 cubic metres per day (m3/d) with a peak flow rate of 12,300 m3/d as noted in the ECA. The plant is an MOECC Class Three conventional activated sludge treatment plant that utilizes the following processes to treat wastewater:
• raw influent pumping, • preliminary treatment, • primary treatment, • secondary treatment, • phosphorus removal system, • disinfection (chlorination/dechlorination), • solids treatment – sludge holding.
Raw Influent Pumping Wastewater collected through approximately 38 km of sanitary sewers in Newcastle is conveyed to the Newcastle WPCP by gravity and by two sanitary sewage pumping stations located in the collection system.

Newcastle Water Pollution Control Plant Annual Performance Report 2015
Page 3 of 19
Preliminary Treatment Screening: One automatic, mechanically cleaned screen removes paper products and large material that could harm pumps and process equipment. Screenings removed in this process are transported to landfill. Grit Removal: Heavy suspended material such as sand and small stones (grit) is removed in the aerated grit tank. The velocity of the wastewater rolling in the tanks is controlled by the quantity of air added to produce conditions that allow heavy grit material to settle, while keeping the lighter organic material in suspension to proceed to the next process tank. The grit removed in this process is dewatered and transported to landfill.
Primary Treatment The primary clarifier utilizes the physical process of sedimentation which allows suspended material to settle to the bottom of the tank as sludge. This raw sludge, along with waste activated sludge from the secondary treatment process is collected by a sweep arm mechanism which pushes the sludge into a hopper. The sludge is then pumped to the sludge holding tank for transportation to Courtice WPCP. Any material floating on the surface of the clarifier (scum) is also removed to the holding tank.
Secondary Treatment Aeration Tanks: The aeration tank is comprised of two distinct sections. The first part of the tank is a selector where there is no oxygen introduced, this is for denitrification. The second part of the tank is where fine bubbled air is diffused into the sewage to remove dissolved and suspended organics and nutrients from the wastewater. Biological activity is controlled to assimilate the organic material. Secondary Clarifier: The effluent from the aeration tank is directed to the secondary clarifier where it settles quickly as an activated (living) sludge leaving a clear effluent to overflow the clarifier. The sludge collected on the bottom of the clarifier is pumped back to the head of the aeration tank. The microorganisms are returned to repeat the process. Waste activated sludge is sent to the primary clarifier to co-settle.
Phosphorus Removal System The phosphorous removal system is intended to lower the total phosphorous level in the final effluent by adding a chemical coagulant (aluminum chloride) as part of the treatment process. Aluminum chloride can be added at multiple locations throughout the WPCP
Disinfection (chlorination/dechlorination) Chlorine in the form of liquid sodium hypochlorite is metered into the secondary effluent stream for pathogen control. Adequate contact time is provided by the single chlorine contact chamber. Disinfected effluent is dechlorinated with a sodium bisulphite solution before being discharged through a 900 mm diameter outfall extending 130 m to a 600 mm pipe extending 800 m into Lake Ontario.
Solids Treatment – Sludge Holding All sludge produced at the Newcastle WPCP is stored in a sludge holding tank. From there the sludge is shipped to Courtice WPCP for anaerobic digestion. Sludge is transported plant to plant in accordance with ECA #A820250.

Newcastle Water Pollution Control Plant Annual Performance Report 2015
Page 4 of 19
Environmental Compliance Approval Under Condition 17 (1) of ECA #3-2189-87-946 the Region of Durham must produce an annual report that contains the following information:
a) Summary and interpretation of all monitoring data and a comparison to the effluent limits The Newcastle WPCP effluent was determined to be compliant with the ECA approval limits during the reporting period. The plant operated at an average of 68% of its rated capacity and received a maximum daily flow of 8,282 m3/d on October 29, 2015. See tables for effluent results.
b) Description of any operating problems encountered and corrective actions taken: No operating problems were encountered at the Newcastle WPCP in 2015.
c) Maintenance of major equipment Major maintenance items in 2015 included:
• Major clean out of wet well, • Replacement of clutch on primary clarifier sludge collector drive, • Installation of winterized chemical lines for year round chlorination/dechlorination.
d) Summary of any effluent quality assurance or control measures • In-house lab test results are compared to the results of the Regional Environmental
Laboratory on comparable samples to determine the in-house accuracy. All results were found to be within a comparable range.
• Online instrumentation is verified by WPCP operators using field or laboratory test equipment.
e) Summary of the calibration and maintenance carried out • Calibration of the effluent flow meter and the secondary clarifier flow meter occurred in
June and September 2015. Verification showed that meters were operating as required. • Calibration of the AutoCat 9000 chlorine analyzer was conducted on July 29, 2015. • Calibration of the in-house lab pH meter is conducted monthly. • On-line instrumentation is verified by WPCP operators using various field or laboratory test
equipment. f) Effluent Objectives
The Regional Municipality of Durham continually strives to achieve the best effluent quality at all times, remaining below the ECA compliance limits. The average daily rated flow capacity of 4,086m3/d was not exceeded. The maximum rated flow rate of 12,300 m3/d was not exceeded. The effluent objective for E. coli was exceeded on eight occasions during the non-disinfection seasons of January 1 to May 15 and October 16 to December 31. This is due to no chlorine addition during these periods. The total chlorine residual objective was exceeded on seven occasions. The ECA requests an objective concentration of 0 mg/L, however the instrumentation used has a detection limit of
Newcastle Water Pollution Control Plant Annual Performance Report 2015
Page 5 of 19
0.0012 mg/L so it is typical to have results above 0 mg/L. Sodium bisulphite dosing is monitored to ensure low total chlorine residuals. Chlorination and dechlorination chemical dosing became a year round practice as of December 2015. Best efforts and process adjustments will continue to be applied to maintain results below objectives.
g) Sludge Production: Tabulation of Volume of Sludge Generated: The volume of sludge removed from Newcastle WPCP in 2015 was 7,132 m3 at an average concentration of 3.19% total solids. See table 5 for a tabulation of hauled sludge. Outline of Anticipated Volumes to be Generated in the Next Reporting Period: There is no increase of sludge volume expected in the next reporting period. Summary of Locations to Where Sludge is Disposed: Courtice WPCP -100%
h) Summary of Complaints and Steps Taken to Address the Complaint: There were no documented complaints received.
i) By-passes and Spills There were no by-passes during the reporting period. There are no anticipated by-passes planned during the next reporting period. There were no spills during the reporting period.
j) Proposed Alterations, Extensions or Replacements A plant-wide SCADA system upgrade is expected to begin in 2016.
k) Information Required by MOECC Water Supervisor Table 7 provides a Bacterial analysis of the Newcastle Water Supply Plant raw water for 2015. MOECC Inspection No MOECC inspection occurred in 2015.
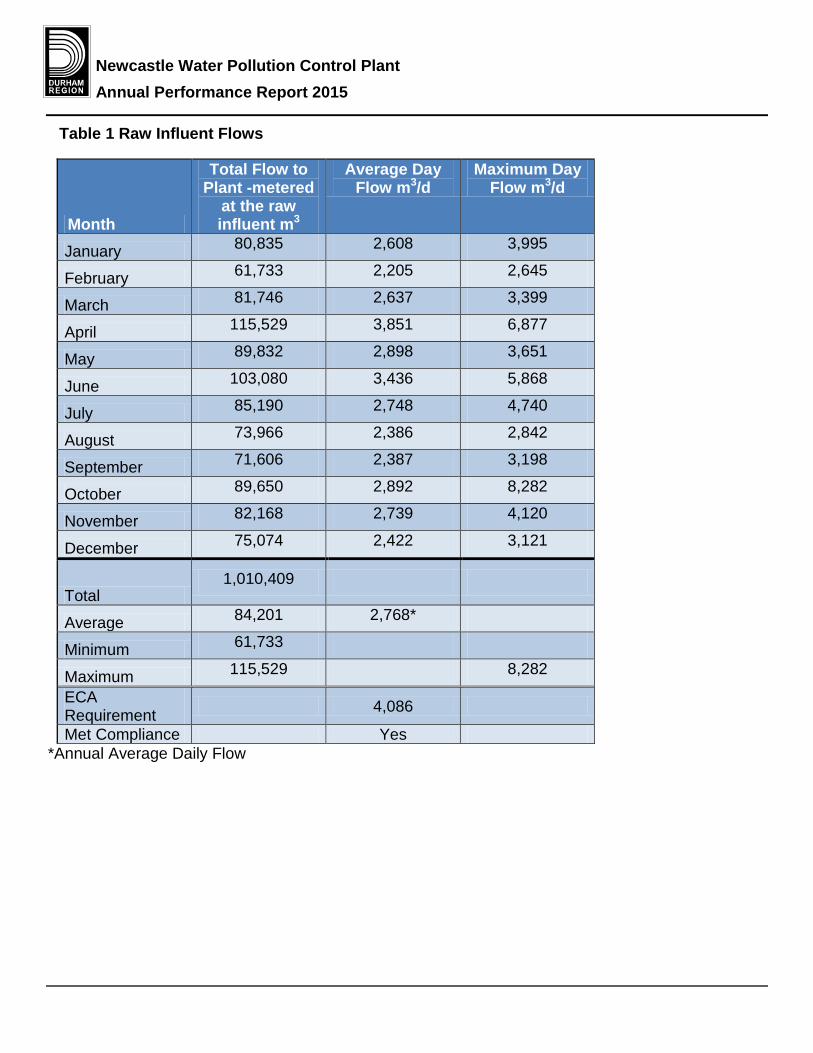
Newcastle Water Pollution Control Plant Annual Performance Report 2015
Table 1 Raw Influent Flows
Month
Total Flow to Plant -metered
at the raw influent m3
Average Day Flow m3/d
Maximum Day Flow m3/d
January 80,835 2,608 3,995
February 61,733 2,205 2,645
March 81,746 2,637 3,399
April 115,529 3,851 6,877
May 89,832 2,898 3,651
June 103,080 3,436 5,868
July 85,190 2,748 4,740
August 73,966 2,386 2,842
September 71,606 2,387 3,198
October 89,650 2,892 8,282
November 82,168 2,739 4,120
December 75,074 2,422 3,121
Total 1,010,409 N/A N/A
Average 84,201 2,768* N/A
Minimum 61,733 N/A N/A
Maximum 115,529 N/A 8,282
ECA Requirement N/A 4,086 N/A
Met Compliance N/A Yes N/A *Annual Average Daily Flow

Newcastle Water Pollution Control Plant Annual Performance Report 2015
Page 7 of 19
Table 2 Raw Influent Analyses
Month
CBOD5 avg.
conc. mg/L
CBOD5 loading
kg/d
BOD5 avg.
conc. mg/L
BOD5 loading
kg/d
TSS avg. conc. mg/L
TSS loading
kg/d
TP avg. conc. mg/L
TP loading
kg/d
January 132 345 319 832 290 757 7.5 20
February 132 291 358 790 309 681 7.9 17
March 136 359 383 1,010 353 931 8.2 21
April 117 449 293 1,128 322 1,241 6.3 24
May 155 448 412 1,195 293 848 7.1 21
June 109 375 260 893 258 886 5.7 20
July 212 581 406 1,115 320 879 7.2 20
August 165 394 366 874 272 648 7.2 17
September 129 307 245 584 213 508 6.4 15
October 128 369 162 469 227 655 5.1 15
November 88 242 144 394 175 478 4.3 12
December 94 227 151 365 227 550 4.6 11
Average 133 368 292 807 271 751 6.5 18
Minimum 88 227 144 365 175 478 4.3 11
Maximum 212 581 412 1,195 353 1,241 8.2 24
Sampling Frequency Requirement Met
N/A N/A Yes N/A Yes N/A Yes N/A

Newcastle Water Pollution Control Plant Annual Performance Report 2015
Page 8 of 19
Table 2 Raw Influent Analyses continued
Month
DP avg. conc. mg/L
TKN avg.
conc. mg/L
TKN loading
kg/d
TAN avg.
conc. mg/L
TAN loading
kg/d
pH min.
pH max.
January 2.52 46.95 122 32.85 86 7.06 8.85
February 2.96 52.90 117 36.81 81 6.89 8.85
March 2.88 49.96 132 31.55 83 7.47 8.30
April 2.08 36.15 139 21.85 84 7.11 8.69
May 2.86 49.35 143 31.01 90 6.91 8.60
June 2.16 36.96 127 24.49 84 6.82 8.00
July 3.20 50.40 139 29.79 82 6.68 7.38
August 3.58 50.45 120 32.73 78 6.80 7.62
September 2.13 42.36 101 29.52 70 6.80 7.28
October 2.08 42.55 123 27.59 80 7.02 7.50
November 1.86 35.53 97 25.84 71 6.90 7.38
December 2.22 38.32 93 28.09 68 7.00 7.71
Average 2.54 44.32 123 29.34 81 N/A N/A
Minimum 1.86 35.53 93 21.85 68 6.68
Maximum 3.58 52.90 143 36.81 90 N/A 8.85
Sampling Frequency Requirement Met
N/A Yes N/A Yes N/A Yes Yes

Newcastle Water Pollution Control Plant Annual Performance Report 2015
Page 9 of 19
Table 3 Final Effluent Analyses
Month
CBOD5 avg.
conc. mg/L
CBOD5 loading
kg/d
TSS avg.
conc. mg/L
TSS loading
kg/d
TP avg.
conc. mg/L
TP loading
kg/d
TAN avg.
conc. mg/L
summer
TAN avg.
conc. mg/L
winter
TAN loading
kg/d
January 1.5 4 5.3 14 0.40 1.0 N/A 0.08 0.2
February 2.3 5 5.6 12 0.38 0.8 N/A 0.44 1.0
March 1.9 5 5.3 14 0.42 1.1 N/A 3.68 9.7
April 1.6 6 4.7 18 0.52 2.0 0.32 N/A 1.2
May 2.3 7 7.4 22 0.75 2.2 0.57 N/A 1.6
June 1.3 4 6.0 21 0.54 1.8 0.77 N/A 2.6
July 1.8 5 5.4 15 0.46 1.3 0.05 N/A 0.1
August 1.2 3 3.7 9 0.32 0.8 0.08 N/A 0.2
September 1.2 3 5.2 12 0.48 1.1 0.10 N/A 0.2
October 1.9 6 6.2 18 0.68 2.0 0.51 N/A 1.5
November 1.6 4 6.3 17 0.30 0.8 1.07 N/A 2.9
December 2.0 5 5.4 13 0.39 0.9 N/A 0.08 0.2
Average 1.7 5 5.5 15 0.47 1.3 0.43 1.07 1.8
Minimum 1.2 3 3.7 9 0.30 0.8 0.05 0.08 0.1
Maximum 2.3 7 7.4 22 0.75 2.2 1.07 3.68 9.7
ECA Requirement 25.0 102 25.0 102 N/A N/A 15 20 N/A
ECA Objective 15.0 61.29 15.0 61.29 1.0 4.1 10 15 N/A
Within Compliance Yes Yes Yes Yes Yes N/A Yes Yes N/A
Sampling Frequency Requirement Met
Yes N/A Yes N/A Yes N/A Yes Yes N/A

Newcastle Water Pollution Control Plant Annual Performance Report 2015
Page 10 of 19
Table 3 Final Effluent Analyses continued
Month
Unionized NH3 avg.
conc. mg/L
TKN avg.
conc. mg/L
DP avg.
conc. mg/L
TCR avg.
conc. mg/L
TCR loading
kg/d
pH min.
pH max.
Temp. oC
min.
Temp. oC
max.
January 0.00 1.26 0.18 0.00 0.00 6.50 7.60 5.6 14.7
February 0.00 1.85 0.16 0.00 0.00 6.60 7.50 8.2 10.9
March 0.01 4.34 0.25 0.00 0.00 6.83 7.48 9.5 12.0
April 0.00 1.52 0.36 0.00 0.00 7.20 7.65 10.6 21.1
May 0.00 1.79 0.44 0.01 0.02 6.45 7.50 12.1 22.1
June 0.00 2.24 0.29 0.01 0.03 6.49 7.28 14.5 17.0
July 0.00 1.08 0.18 0.01 0.02 6.41 7.25 16.2 19.5
August 0.00 1.16 0.13 0.00 0.01 6.40 6.97 18.3 28.6
September 0.00 1.21 0.27 0.01 0.01 6.20 6.95 18.9 21.7
October 0.00 1.40 0.70 0.01 0.03 6.34 7.19 13.3 19.6
November 0.00 2.47 0.08 0.00 0.00 6.69 7.27 14.8 17.7
December 0.00 1.27 0.09 0.00 0.00 6.40 7.10 12.5 18.1
Average 0.00 1.80 0.26 0.00 0.03 N/A N/A N/A N/A
Minimum 0.00 1.08 0.08 0.00 0.00 6.20 N/A 5.6 N/A
Maximum 0.01 4.34 0.70 0.01 0.10 N/A 7.65 N/A 28.6
ECA Requirement N/A N/A N/A 0.04 N/A N/A N/A N/A N/A
ECA Objective N/A N/A N/A 0 N/A N/A N/A N/A N/A
Within Compliance N/A N/A N/A Yes N/A N/A N/A N/A N/A
Sampling Frequency Requirement Met
N/A Yes N/A Yes N/A Yes Yes Yes Yes
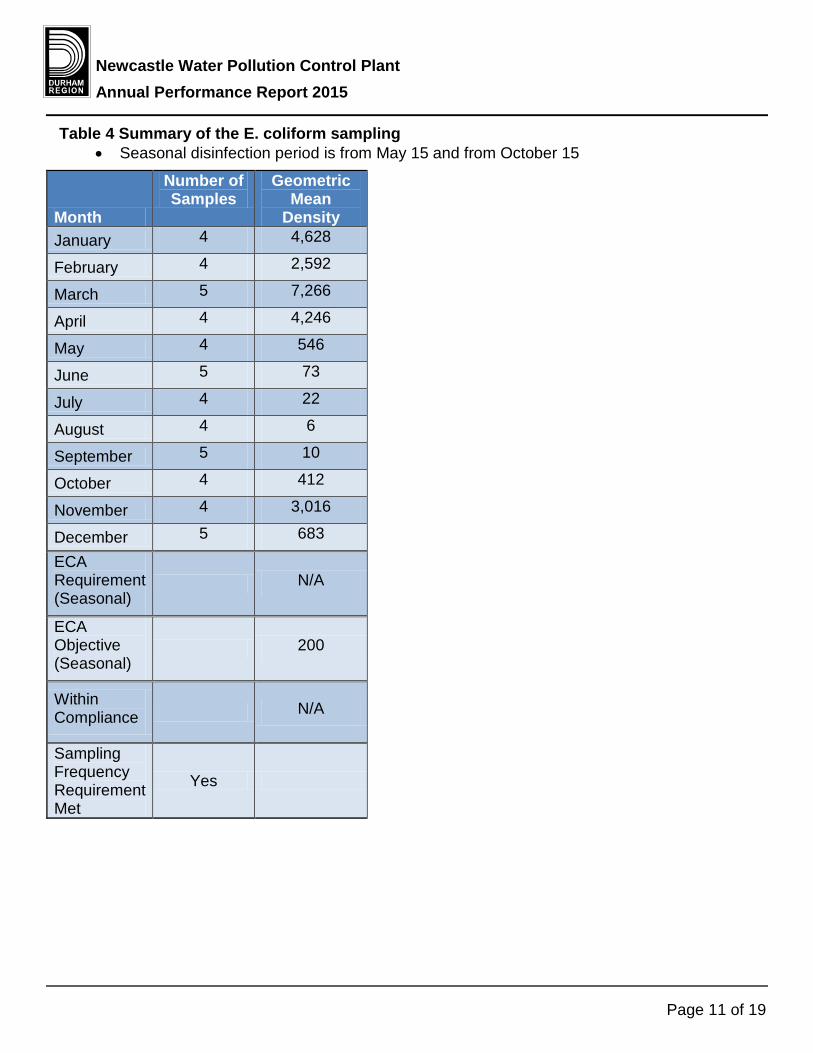
Newcastle Water Pollution Control Plant Annual Performance Report 2015
Page 11 of 19
Table 4 Summary of the E. coliform sampling • Seasonal disinfection period is from May 15 and from October 15
Month
Number of Samples
Geometric Mean
Density January 4 4,628
February 4 2,592
March 5 7,266
April 4 4,246
May 4 546
June 5 73
July 4 22
August 4 6
September 5 10
October 4 412
November 4 3,016
December 5 683
ECA Requirement (Seasonal)
N/A N/A
ECA Objective (Seasonal)
N/A 200
Within Compliance N/A N/A
Sampling Frequency Requirement Met
Yes N/A
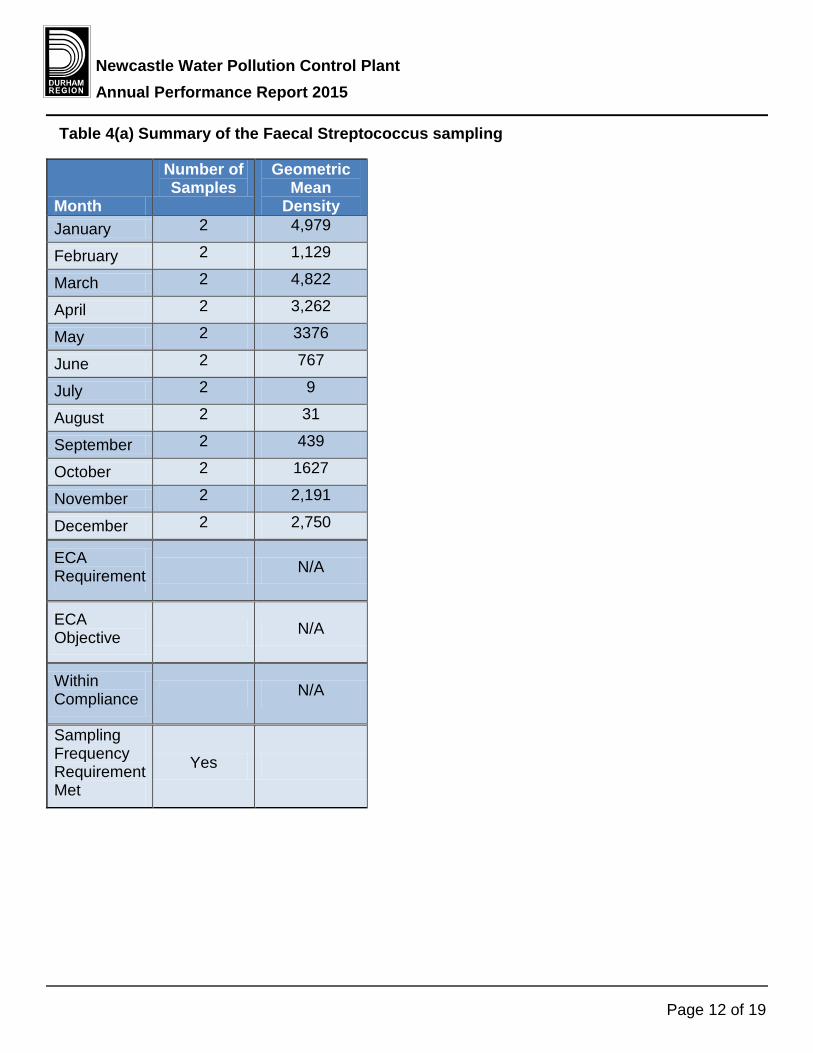
Newcastle Water Pollution Control Plant Annual Performance Report 2015
Page 12 of 19
Table 4(a) Summary of the Faecal Streptococcus sampling
Month
Number of Samples
Geometric Mean
Density January 2 4,979
February 2 1,129
March 2 4,822
April 2 3,262
May 2 3376
June 2 767
July 2 9
August 2 31
September 2 439
October 2 1627
November 2 2,191
December 2 2,750
ECA Requirement N/A N/A
ECA Objective N/A N/A
Within Compliance N/A N/A
Sampling Frequency Requirement Met
Yes N/A

Newcastle Water Pollution Control Plant Annual Performance Report 2015
Page 13 of 19
Table 4(b) Summary of the Total Coliform sampling
Month
Number of Samples
Geometric Mean
Density January 2 55,498
February 2 25,923
March 2 30,984
April 2 28,142
May 2 34,957
June 2 13,248
July 2 438
August 2 219
September 2 684
October 2 48,990
November 2 29,665
December 2 31,623
ECA Requirement
N/A N/A
ECA Objective
N/A N/A
Within Compliance
N/A N/A
Sampling Frequency Requirement Met
Yes
N/A

Newcastle Water Pollution Control Plant Annual Performance Report 2015
Page 14 of 19
Table 5 Sludge Quality and Disposal
Month
Avg. Sludge TS (%)
Total Volume Removed
(m3)
Total Volume Hauled to Courtice
WPCP (m3)
Total Volume Hauled to Duffin
Creek WPCP (m3)
January 3.31 608 608 0
February 3.04 532 532 0
March 2.79 570 570 0
April 5.53 608 608 0
May 3.16 608 608 0
June 3.02 646 646 0
July 3.90 646 646 0
August 2.56 558 558 0
September 15.98 570 570 0
October 1.28 608 608 0
November 2.27 570 570 0
December 4.60 608 608 0
Total N/A 7,132 7,132 0
Average 4.29 594 594 0
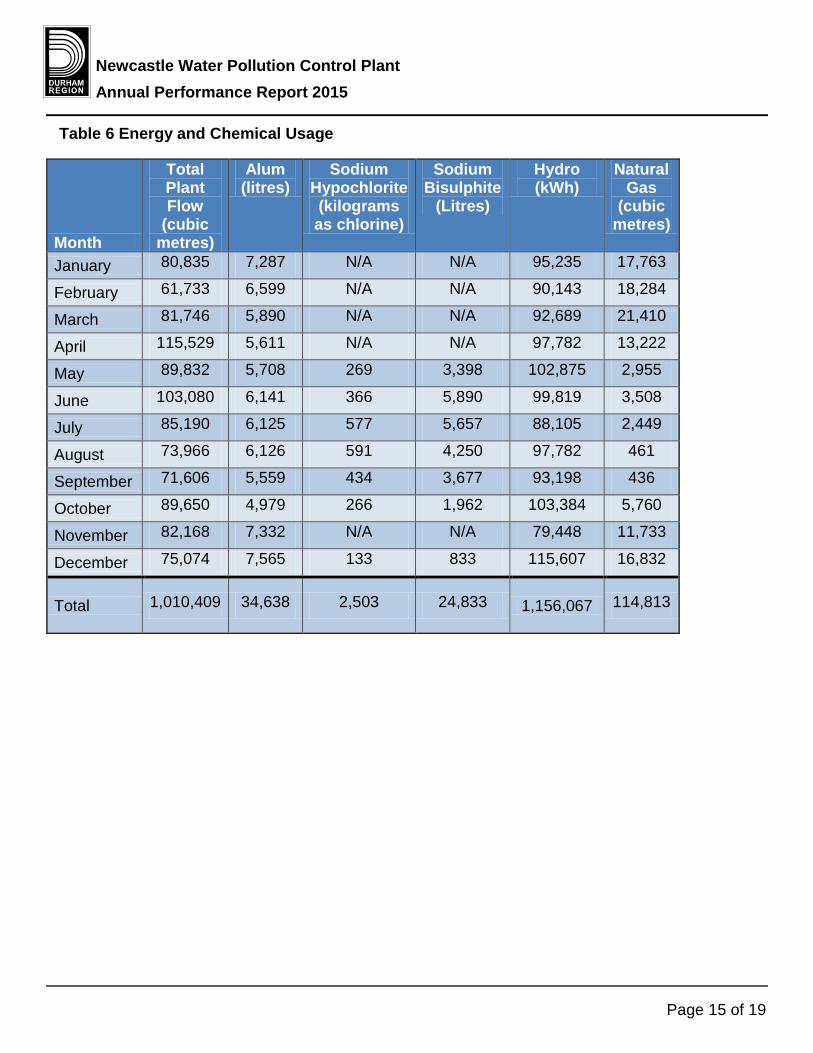
Newcastle Water Pollution Control Plant Annual Performance Report 2015
Page 15 of 19
Table 6 Energy and Chemical Usage
Month
Total Plant Flow
(cubic metres)
Alum (litres)
Sodium Hypochlorite (kilograms as chlorine)
Sodium Bisulphite
(Litres)
Hydro (kWh)
Natural Gas
(cubic metres)
January 80,835 7,287 N/A N/A 95,235 17,763
February 61,733 6,599 N/A N/A 90,143 18,284
March 81,746 5,890 N/A N/A 92,689 21,410
April 115,529 5,611 N/A N/A 97,782 13,222
May 89,832 5,708 269 3,398 102,875 2,955
June 103,080 6,141 366 5,890 99,819 3,508
July 85,190 6,125 577 5,657 88,105 2,449
August 73,966 6,126 591 4,250 97,782 461
September 71,606 5,559 434 3,677 93,198 436
October 89,650 4,979 266 1,962 103,384 5,760
November 82,168 7,332 N/A N/A 79,448 11,733
December 75,074 7,565 133 833 115,607 16,832
Total 1,010,409 34,638 2,503 24,833 1,156,067 114,813

Newcastle Water Pollution Control Plant Annual Performance Report 2015
Page 16 of 19
Table 7 Newcastle WSP Bacteriological Sampling
Month
E.coli cfu/100ml (min-max
result)
E.coli (number of samples)
Total Coliform cfu/100ml (min-max
result)
Total Coliform
(number of samples)
January ND-2 16 ND-33 16
February ND-1 15 ND-3 15
March ND-<1 18 ND-52 18
April ND-2 17 ND-200 17
May ND-<1 15 ND-200 15
June ND-3 18 ND-88 18
July ND-1 17 ND-12 17
August ND-1 16 ND-1300 16
September ND-3 17 3-900 17
October ND-3 16 ND-47 16
November ND-3 16 ND-61 16
December ND-4 16 ND-12 16

Newcastle Water Pollution Control Plant Annual Performance Report 2015
Page 17 of 19
Glossary of Terms Aeration tank
An aeration tank is a vessel in which a biological process is carried out which involves bacterial organisms or biochemically active substances derived from such organisms. This encompasses a combination of aerobic and anoxic processes.
Anaerobic digestion Is a series of biological processes in which microorganisms break down biodegradable material in the absence of oxygen.
Average Concentration The arithmetic mean concentration of a parameter within a specified period of operation.
Average Daily Flow The total volume of sewage flow to the plant over twelve consecutive calendar months divided by the number of days over the same period of time.
BOD5 - Five day Biochemical Oxygen Demand (also known as total BOD5) means five day biochemical oxygen demand measured in an unfiltered sample and includes carbonaceous and nitrogenous oxygen demand.
By-pass A diversion of sewage around one or more unit processes within the Sewage Treatment Plant with the diverted sewage flows being returned to the Sewage Treatment Plant treatment train upstream of the Final effluent sampling location, and discharging to the environment through the Sewage Treatment Plant outfall.
CBOD5 -Five day Carbonaceous Biochemical Oxygen Demand A five day carbonaceous (nitrification inhibited) biochemical oxygen demand measured in an unfiltered sample.
Conc. - Concentration DP – Dissolved Phosphorus
This is the soluble form of phosphorus present in the wastewater. ECA
Environmental Compliance Approval. The primary governing document for each WPCP. E. coli - (Escherichia coli)
Refers to the thermally tolerant forms of Escherichia that can survive at 44.5 degrees Celsius. Calculated using a monthly geometric mean density.
Final Effluent sewage discharge via the Sewage Treatment Plant outfall after undergoing the full train of unit processes as listed in the Environmental Compliance Approval.
Geometric mean density Is the nth root of the product of multiplication of the results of n number of samples over the period specified.

Newcastle Water Pollution Control Plant Annual Performance Report 2015
Page 18 of 19
Grab Sample A single sample taken at a specific moment in time, a snapshot of the conditions at the time the sample was retrieved.
Loading Volume of a parameter that is present in a given volume of wastewater, is calculated by multiplying the annual average concentration by the average daily flow as kg/day.
m3 - (Cubic Metre) Volume measurement, 1m3 = 1000 litres or 220 imperial gallons.
m3/d - (Cubic Metre Per Day) Flow measurement, 1m3 = 1000 litres or 220 imperial gallons. Volume of liquid treated in a 24 hour period.
Max. - Maximum Maximum Flow Rate
The peak or highest flow recorded during a specific time period usually in a twenty-four (24) period.
Mg/L - (Milligram Per Litre) This is a measure of the concentration of a parameter in water, sometimes referred to as parts per million (ppm).
Min. - Minimum mm.- (millimetre)
Is a unit of length in the metric system, equal to one thousandth of a metre. MOECC - (Ministry of the Environment and Climate Change)
The Provincial regulatory agency responsible for overseeing the water and wastewater industries in Ontario. Their primary functions include approval for new or expanding facilities, inspections and investigations.
Monthly average concentration Calculated as an arithmetic mean of all daily concentrations analyzed for the month.
Monthly average loading Calculated by multiplying the monthly average concentration by the monthly average daily flow.
N/A - Not applicable NH3 – Unionized Ammonia
Is a compound of nitrogen and hydrogen with the formula NH3. It is a colourless gas with a characteristic pungent smell
pH Index of hydrogen ion activity, pH is defined as the negative logarithm of hydrogen ion concentration in moles per litre. A solution of pH from 0-7 is acidic, 7 is neutral, and 7-14 is alkaline.
Raw Influent Raw wastewater entering the water pollution control plant before treatment.
Rated Capacity The average daily flow for which the works is approved to handle.

Newcastle Water Pollution Control Plant Annual Performance Report 2015
Page 19 of 19
Septage Partially treated sludge from a septic tank.
Sludge A Semi-solid material that is produced as a by-product during sewage treatment. Similar to biosolids.
TAN -Total Ammonia Nitrogen Ammonia exists in two forms in the water: NH3 (this is called unionized ammonia ) NH4+ ( this is called ionized ammonia ) Together, these two forms of ammonia are called TAN which means total ammonia nitrogen.
TCR -Total Chlorine Residual The sum of the free and combined chlorine residual
Temp. - Temperature Total loading
Calculated by multiplying the average concentration by the average flow. TP -Total Phosphorus
A laboratory analyses to determine the total amount of particulate and soluble phosphorus present in the wastewater.
TSS -Total Suspended Solids A laboratory analyses to measure particles that are larger than 2 microns found in the wastewater.
TS -Total Solids Is a measure of the suspended and dissolved solids in the wastewater and in biosolids.
Un-ionized Ammonia nitrogen Calculated using the methodology specified in the MOECC’s Guideline and Policies document titled “Provincial Water Quality Objectives” (July 1994).
WPCP - Water Pollution Control Plant Is typically a facility composed of a variety of treatment processes that collectively treat the wastewater.
If this information is required in an accessible format, please contact 1-800-372-1102 extension 3488
Nonquon Water Pollution Control Plant Annual Performance Report 2015
Nonquon Water Pollution Control Plant
Annual Performance Report 2015
Nonquon Water Pollution Control Plant Annual Performance Report 2015
The Regional Municipality of Durham
Nonquon Water Pollution Control Plant 2015 Annual Performance Report Environmental Compliance Approval (ECA): 2207-9LKHLM Dated July 17, 2014
4143-7NCKSG Dated June 18, 2009 The Nonquon Water Pollution Control Plant (WPCP) Performance Report provides staff, stakeholders and customers an overview of the performance of the Nonquon WPCP in 2015. Further, this report fulfills the annual reporting requirements of the Ontario Ministry of the Environment and Climate Change (MOECC). The performance report demonstrates the commitment of ensuring that the WPCP continues to deliver wastewater services to our customers in an environmentally responsible manner. For a description of terms and abbreviations used in this report, refer to the glossary at the end of the report.
Water Pollution Control Plant Process Description
General The Nonquon WPCP is owned and operated by the Regional Municipality of Durham in accordance with the terms and conditions of the ECA.The plant is located in the Community of Port Perry in the Township of Scugog. This MOECC Class Two wastewater treatment plant is designed to treat wastewater at an average flow rate of 3,870 cubic metres per day (m3/d) utilizing two aerated lagoon cells and six seasonal facultative retention ponds. The Nonquon WPCP has a service population of 8,154 residents. The treated effluent is discharged to the Nonquon River in accordance with the conditions listed in the ECA.
Raw Influent Wastewater is collected through approximately 48.5 km of sanitary sewers in the Port Perry service area and is conveyed to the Nonquon WPCP by three sanitary sewage pumping stations: Water Street, Reach Street and Canterbury Common. Additional flow is added to the forcemain by two private pumping systems: a recreational complex and a small lakefront community of 16 individual homes. Aluminum sulphate is added at the Water Street Pumping Station to enhance the settling of solids and phosphorus removal.
Lagoon Treatment Aerated Cells Influent wastewater enters the Nonquon WPCP through the aerated cell inlet chamber where the flow is split and directed into two aerated cells. These cells are aerated by mechanical surface aerators to mix the contents and provide oxygen to maintain biological activity. Seasonal Retention Ponds Partially treated wastewater from the aerated cells flows by gravity to cell number six for solids settling. The flow from cell number six is transferred through a distribution chamber to one of the five retention stabilization lagoons. The wastewater remains in the retention ponds until the effluent
Page 2 of 16
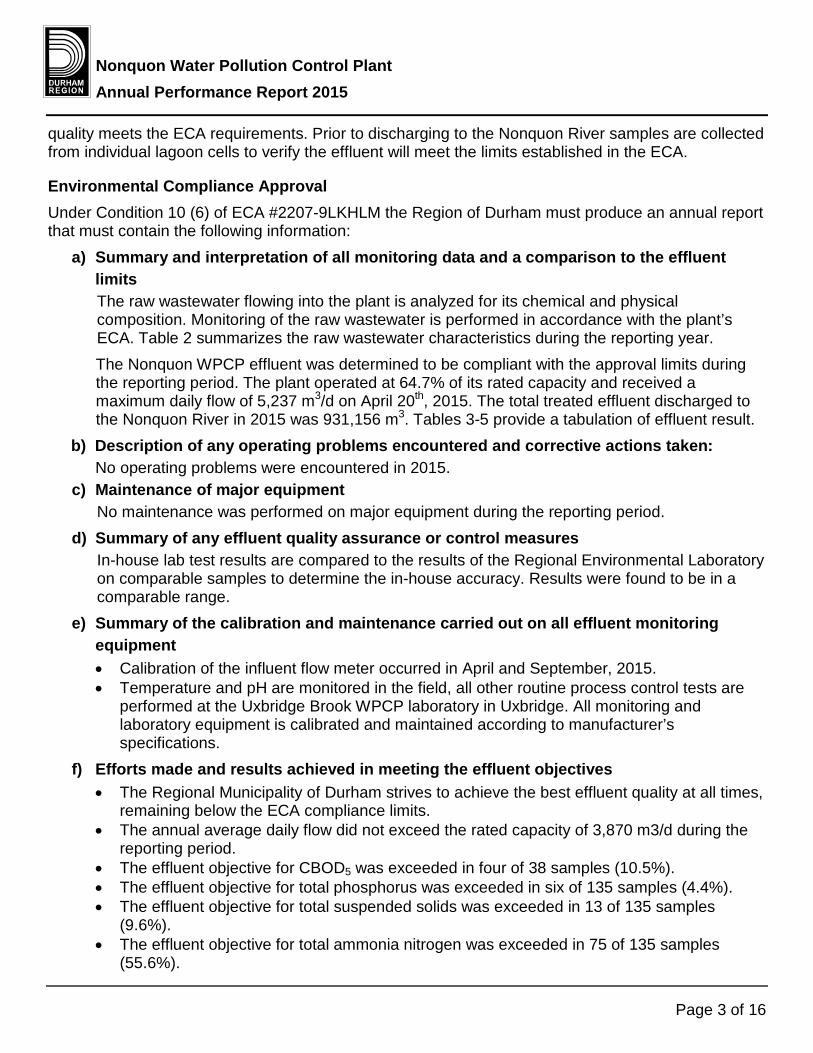
Nonquon Water Pollution Control Plant Annual Performance Report 2015
quality meets the ECA requirements. Prior to discharging to the Nonquon River samples are collected from individual lagoon cells to verify the effluent will meet the limits established in the ECA.
Environmental Compliance Approval Under Condition 10 (6) of ECA #2207-9LKHLM the Region of Durham must produce an annual report that must contain the following information:
a) Summary and interpretation of all monitoring data and a comparison to the effluent limits The raw wastewater flowing into the plant is analyzed for its chemical and physical composition. Monitoring of the raw wastewater is performed in accordance with the plant’s ECA. Table 2 summarizes the raw wastewater characteristics during the reporting year. The Nonquon WPCP effluent was determined to be compliant with the approval limits during the reporting period. The plant operated at 64.7% of its rated capacity and received a maximum daily flow of 5,237 m3/d on April 20th, 2015. The total treated effluent discharged to the Nonquon River in 2015 was 931,156 m3. Tables 3-5 provide a tabulation of effluent result.
b) Description of any operating problems encountered and corrective actions taken: No operating problems were encountered in 2015.
c) Maintenance of major equipment No maintenance was performed on major equipment during the reporting period.
d) Summary of any effluent quality assurance or control measures In-house lab test results are compared to the results of the Regional Environmental Laboratory on comparable samples to determine the in-house accuracy. Results were found to be in a comparable range.
e) Summary of the calibration and maintenance carried out on all effluent monitoring equipment • Calibration of the influent flow meter occurred in April and September, 2015. • Temperature and pH are monitored in the field, all other routine process control tests are
performed at the Uxbridge Brook WPCP laboratory in Uxbridge. All monitoring and laboratory equipment is calibrated and maintained according to manufacturer’s specifications.
f) Efforts made and results achieved in meeting the effluent objectives • The Regional Municipality of Durham strives to achieve the best effluent quality at all times,
remaining below the ECA compliance limits. • The annual average daily flow did not exceed the rated capacity of 3,870 m3/d during the
reporting period. • The effluent objective for CBOD5 was exceeded in four of 38 samples (10.5%). • The effluent objective for total phosphorus was exceeded in six of 135 samples (4.4%). • The effluent objective for total suspended solids was exceeded in 13 of 135 samples
(9.6%). • The effluent objective for total ammonia nitrogen was exceeded in 75 of 135 samples
(55.6%).
Page 3 of 16

Nonquon Water Pollution Control Plant Annual Performance Report 2015
• The objective for total ammonia nitrogen was exceeded due to ice cover on the lagoons during the winter and early spring. Limited storage made it necessary to discharge with continuous monitoring of the effluent.
• To assist in total suspended solids and total phosphorus removal, the aluminum sulphate dosage at the Water Street sanitary sewage pumping station was increased and additional aluminum sulphate was added by boat to the lagoons.
• All effluent flows met the flow objectives set by ECA #4143-7NCKSG dated June 18, 2009 with the exception of June where an emergency discharge request to increase effluent flows was approved by the MOECC. Table 5 summarizes discharge flows to the Nonquon River.
• Best efforts will continue to be applied to maintain results below objectives. g) Sludge Generated
The annual depletion of the sludge settling capacity is negligible. There was no removal of biosolids during the reporting period.
h) Complaints A summary of complaints received from the public is administered through a central database. On July 24th a noise complaint was received due to early morning construction. It was requested to have construction comply with the Township of Scugog noise by-law of 7:00am.to 7:00pm. Contractors were asked to comply with the by-law.
i) By-passes No by-passes or spills occurred during the reporting period. Additional Discharge Extreme cold temperatures in February and ice cover on the lagoons in the spring resulted in limited discharge during the winter months causing accumulation of effluent. The Region of Durham requested an emergency discharge to increase the treated effluent discharge rate to 8,200m3/day during the month of June. The MOECC approved an increased discharge rate in a letter dated May 29, 2015.
j) Copy of all Notice of modifications and any implementation of Limited Operational Flexibility(schedule B) No notice of modifications were submitted in 2015.
k) Report Summarizing Modifications(Schedule B) There were no modifications to the plant during the reporting period..
l) Information Required by MOECC Water Supervisor No additional information required.
Proposed Alterations, Extensions or Replacements The recommendation of the Class Environmental Assessment was to design and construct a WPCP which includes an activated sludge process and tertiary treatment. The construction of the new Nonquon WPCP began in spring of 2015 and completion is anticipated by the end of 2016 subject to weather and working conditions.
Page 4 of 16

Nonquon Water Pollution Control Plant Annual Performance Report 2015
MOECC Inspection This plant was not inspected by the MOECC in 2015.
Page 5 of 16
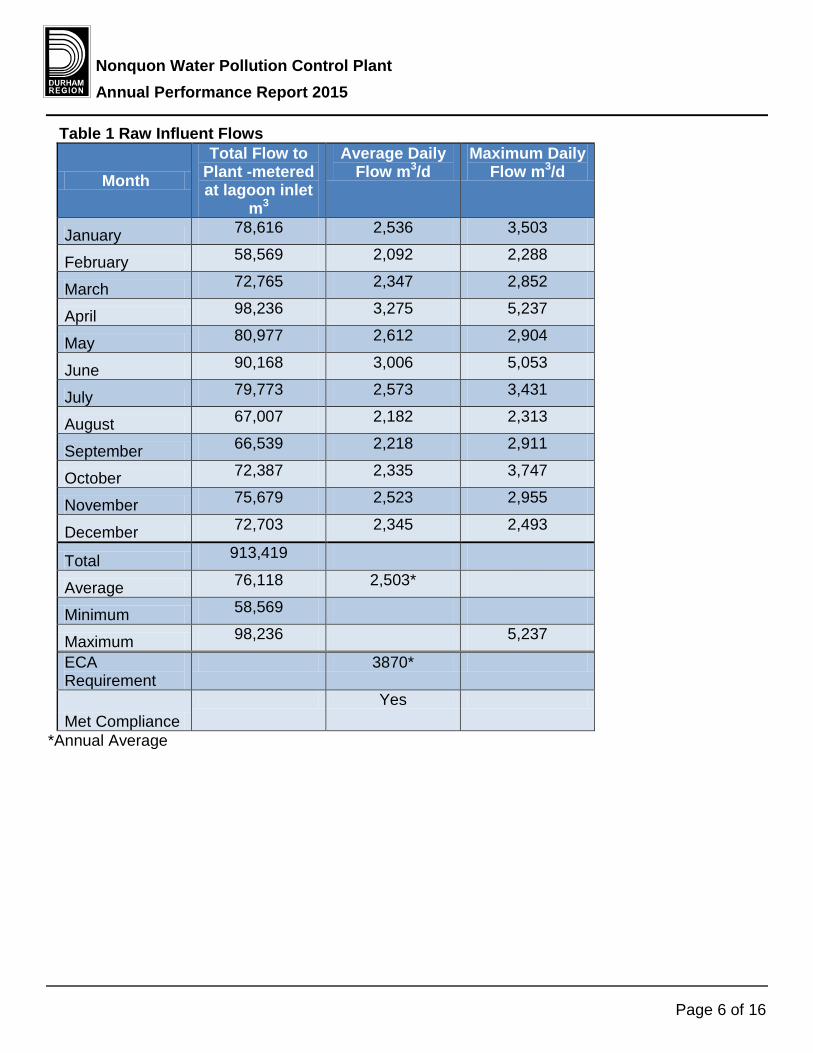
Nonquon Water Pollution Control Plant Annual Performance Report 2015
Table 1 Raw Influent Flows
Month Total Flow to
Plant -metered at lagoon inlet
m3
Average Daily Flow m3/d
Maximum Daily Flow m3/d
January 78,616 2,536 3,503
February 58,569 2,092 2,288
March 72,765 2,347 2,852
April 98,236 3,275 5,237
May 80,977 2,612 2,904
June 90,168 3,006 5,053
July 79,773 2,573 3,431
August 67,007 2,182 2,313
September 66,539 2,218 2,911
October 72,387 2,335 3,747
November 75,679 2,523 2,955
December 72,703 2,345 2,493
Total 913,419 N/A N/A
Average 76,118 2,503* N/A
Minimum 58,569 N/A
Maximum 98,236 5,237
ECA Requirement
N/A 3870* N/A
Met Compliance N/A Yes N/A
*Annual Average
Page 6 of 16

Nonquon Water Pollution Control Plant Annual Performance Report 2015
Table 2 Raw Influent Analyses
Month
BOD5 avg.
conc. mg/L
BOD5 loading
kg/d
TSS avg conc. mg/L
TSS loading
kg/d
TP avg conc. mg/L
TP loading
kg/d
January 216 548 302 766 4.5 11
February 268 561 318 665 5.8 12
March 195 458 243 570 4.4 10
April 169 553 267 874 3.1 10
May 280 731 405 1058 4.9 13
June 150 451 223 670 2.7 8
July 158 407 230 592 3.3 8
August 287 626 411 897 6.1 13
September 222 492 234 519 4.6 10
October 220 514 217 507 4.4 10
November 176 444 211 532 3.1 8
December 200 469 220 516 4.0 9
Average 212 530 273 684 4.2 11
Minimum 150 407 211 507 2.7 8
Maximum 287 731 411 1058 6.1 13
Sampling Frequency Requirement Met
Yes N/A Yes N/A Yes N/A
Page 7 of 16

Nonquon Water Pollution Control Plant Annual Performance Report 2015
Table 2 Raw Influent Analyses continued
Month DP
avg. conc. mg/L
TKN avg.
conc. mg/L
TKN loading
kg/d
January 0.49 40.25 102
February 1.57 49.48 104
March 1.09 39.44 93
April 0.93 29.65 97
May 0.86 41.85 109
June 0.21 33.36 100
July 0.5 34.20 88
August 1.23 47.05 103
September 0.52 45.06 100
October 0.91 44.38 104
November 0.65 40.15 101
December 0.86 41.76 98
Average 0.82 40.55 101
Minimum 0.21 29.65 88
Maximum 1.57 49.48 109
Sampling Frequency Requirement Met
N/A Yes N/A
Page 8 of 16

Nonquon Water Pollution Control Plant Annual Performance Report 2015
Table 3 Final Effluent Analyses
Month
CBOD5 avg.
conc. mg/L
CBOD5 loading
avg. kg/d
TSS avg.
conc. mg/L
TSS loading
avg. kg/d
TP avg.
conc. mg/L
TP loading
avg. kg/d
DP avg.
conc. mg/L
January 10.9 31.1 15.6 44.4 0.06 0.171 0.004
February 6.3 19.6 6.5 20.2 0.10 0.311 0.005
March 8.5 28.5 7.2 24.1 0.18 0.603 0.039
April 5.1 15.0 11.6 34.1 0.11 0.323 0.005
May 4.2 4.2 4.2 4.2 0.06 0.061 0.003
June 2.2 14.6 2.5 16.6 0.04 0.266 0.003
July N/D N/D N/D N/D N/D N/D N/A
August N/D N/D N/D N/D N/D N/D N/A
September 1.3 2.8 2.7 5.9 0.04 0.087 0.004
October 1.7 7.7 3.3 14.9 0.06 0.272 0.011
November 3.0 18.5 5.0 30.9 0.06 0.371 0.01
December 4.0 17.8 7.2 32.1 0.10 0.446 0.007
Average 4.7 11.8 6.6 16.5 0.08 0.202 0.091
Minimum 1.3 2.8 2.5 4.2 0.04 0.061 0.003
Maximum 10.9 31.1 15.6 44.4 0.18 0.603 0.039
ECA Limit 10* 37.1** 12.0* 44.5** 0.3*** 1.1** N/A
ECA Objective 8.0 N/A 11.0 N/A 0.21 N/A N/A
Within Compliance Yes Yes Yes Yes Yes Yes N/A
Sampling Frequency Requirement Met
Yes N/A Yes N/A Yes Yes N/A
*Annual Average Concentration **Annual Average Loading, kg/day ***Monthly Average Concentration
Page 9 of 16
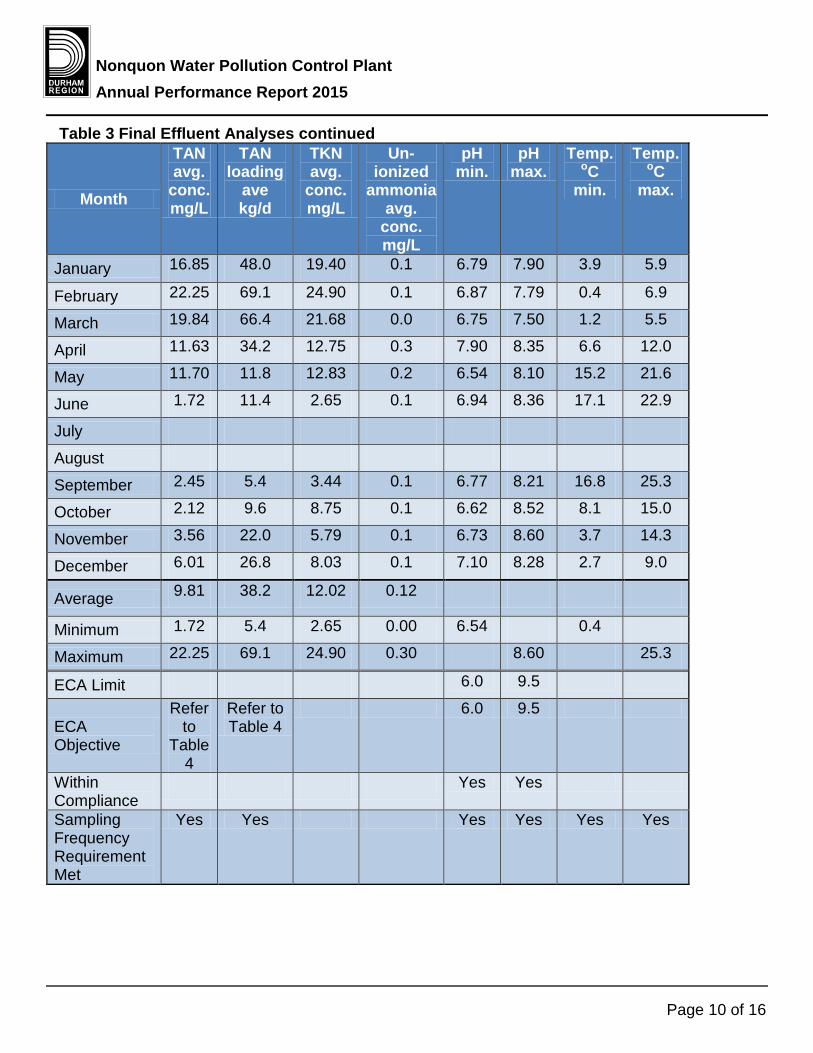
Nonquon Water Pollution Control Plant Annual Performance Report 2015
Table 3 Final Effluent Analyses continued
Month
TAN avg.
conc. mg/L
TAN loading
ave kg/d
TKN avg.
conc. mg/L
Un-ionized
ammonia avg.
conc. mg/L
pH min.
pH max.
Temp. oC
min.
Temp. oC
max.
January 16.85 48.0 19.40 0.1 6.79 7.90 3.9 5.9
February 22.25 69.1 24.90 0.1 6.87 7.79 0.4 6.9
March 19.84 66.4 21.68 0.0 6.75 7.50 1.2 5.5
April 11.63 34.2 12.75 0.3 7.90 8.35 6.6 12.0
May 11.70 11.8 12.83 0.2 6.54 8.10 15.2 21.6
June 1.72 11.4 2.65 0.1 6.94 8.36 17.1 22.9
July N/D N/D N/D N/D N/D N/D N/D N/D
August N/D N/D N/D N/D N/D N/D N/D N/D
September 2.45 5.4 3.44 0.1 6.77 8.21 16.8 25.3
October 2.12 9.6 8.75 0.1 6.62 8.52 8.1 15.0
November 3.56 22.0 5.79 0.1 6.73 8.60 3.7 14.3
December 6.01 26.8 8.03 0.1 7.10 8.28 2.7 9.0
Average 9.81 38.2 12.02 0.12 N/A N/A N/A N/A
Minimum 1.72 5.4 2.65 0.00 6.54 N/A 0.4 N/A
Maximum 22.25 69.1 24.90 0.30 N/A 8.60 N/A 25.3
ECA Limit N/A N/A N/A N/A 6.0 9.5 N/A N/A
ECA Objective
Refer to
Table 4
Refer to Table 4
N/A N/A 6.0 9.5 N/A N/A
Within Compliance
N/A N/A N/A N/A Yes Yes N/A N/A
Sampling Frequency Requirement Met
Yes Yes N/A N/A Yes Yes Yes Yes
Page 10 of 16

Nonquon Water Pollution Control Plant Annual Performance Report 2015
Table 4 Effluent Objectives for Total Ammonia Nitrogen
Month TAN Effluent
Objective conc. mg/L
January 8.4
February 8.6
March 8.6
April 7.8
May 2.4
June 2.1
July 0
August 0
September 2.3
October 3.4
November 5.7
December 7.9
Page 11 of 16
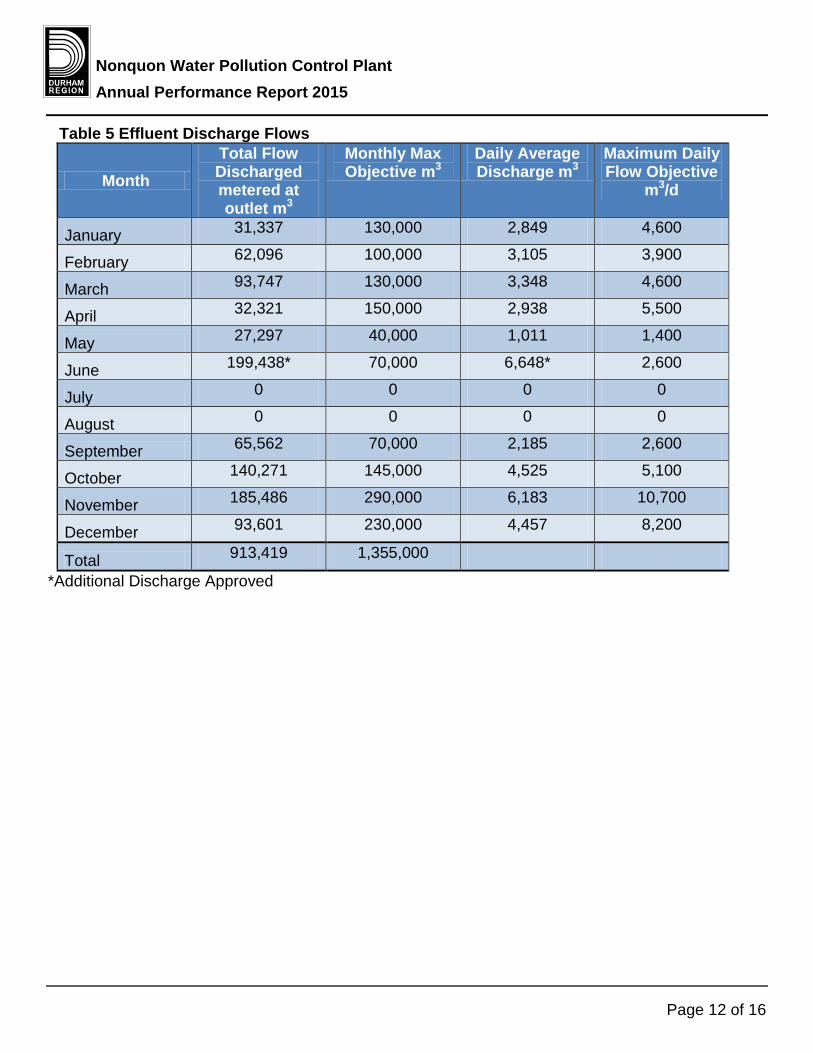
Nonquon Water Pollution Control Plant Annual Performance Report 2015
Table 5 Effluent Discharge Flows
Month Total Flow Discharged metered at outlet m3
Monthly Max Objective m3
Daily Average Discharge m3
Maximum Daily Flow Objective
m3/d
January 31,337 130,000 2,849 4,600
February 62,096 100,000 3,105 3,900
March 93,747 130,000 3,348 4,600
April 32,321 150,000 2,938 5,500
May 27,297 40,000 1,011 1,400
June 199,438* 70,000 6,648* 2,600
July 0 0 0 0
August 0 0 0 0
September 65,562 70,000 2,185 2,600
October 140,271 145,000 4,525 5,100
November 185,486 290,000 6,183 10,700
December 93,601 230,000 4,457 8,200
Total 913,419 1,355,000
*Additional Discharge Approved
Page 12 of 16

Nonquon Water Pollution Control Plant Annual Performance Report 2015
Table 6 Energy and Chemical Usage
Month Total Plant Inlet Flow
(cubic metres)
Aluminum Sulphate
(litres)
Hydro kWh
January 78,616 22.8 29,666
February 58,569 16.0 38,196
March 72,765 19.6 29,666
April 98,236 24.7 31,321
May 80,977 19.0 33,485
June 90,168 26.0 31,830
July 79,773 22.5 33,994
August 67,007 13.8 33,485
September 66,539 13.7 28,774
October 72,387 14.3 22,154
November 75,679 15.6 32,212
December 72,703 15.0 33,231
Total 931,156 223.0 378,014
Page 13 of 16

Nonquon Water Pollution Control Plant Annual Performance Report 2015
Glossary of Terms Annual Average Concentration
An arithmetic mean of the monthly average concentrations of a contaminant in the effluent calculated for any particular year.
Annual Average Loading The value obtained by multiplying the annual average concentration of a contaminant by the Average Daily Flow over the same calendar year.
Average Daily Flow The cumulative total sewage flow to the sewage works during a calendar year divided by the number of days during which sewage was flowing to the sewage works that year.
Biosolids Organic material recovered from wastewater sludge.
BOD5 Five Day Biochemical Oxygen Demand (also known as total BOD5) means five day biochemical oxygen demand measured in an unfiltered sample and includes carbonaceous and nitrogenous oxygen demand.
By-pass A diversion of sewage around one or more unit processes within the water pollution control plant with the diverted sewage flows being returned to the water pollution control plant treatment train upstream of the final effluent sampling location, and discharging to the environment through the water pollution control plant outfall.
CBOD5 -Five Day Carbonaceous Biochemical Oxygen Demand Means a five day carbonaceous (nitrification inhibited) biochemical oxygen demand measured in an unfiltered sample..
Conc. Concentration The abundance of a constituent divided by the total volume of a mixture.
Daily Concentration The concentration of a contaminant in the effluent discharged over any single day, as measured by a composite or grab sample, whichever is required.
DP – Dissolved Phosphorus This is the soluble form of phosphorus present in the wastewater.
ECA Environmental Compliance Approval The primary regulatory instrument for each water pollution control plant.
Final Effluent Sewage discharge via the water pollution control plant outfall after undergoing the full train of unit processes as listed in the Environmental Compliance Approval.
Geometric Mean Density Is the nth root of the product of multiplication of the results of n number of samples over the period specified.
Grab Sample A single sample taken at a specific moment in time, when tested provides a snapshot of the conditions at the time the sample was retrieved.
kg - kilogram Basic unit of mass in the metric system
kg/d – kilogram per day m3 - (Cubic Metre)
Volume measurement, 1m3 = 1000 litres or 220 imperial gallons.
Page 14 of 16
Nonquon Water Pollution Control Plant Annual Performance Report 2015
m3/d - (Cubic Metre Per Day) Flow measurement, 1m3 = 1000litres or 220 imperial gallons. Volume of liquid treated in a 24 hour period.
Max. - Maximum Maximum Flow Rate
The peak or highest flow recorded during a specific time period usually in a 24 hour period. mg./L. - (Milligram Per Litre)
This is a measure of the concentration of a parameter in water, sometimes referred to as parts per million (ppm).
Min. - Minimum mm.-(millimetre)
Is a unit of length in the metric system, equal to one thousandth of a metre. MOECC - (Ministry of the Environment and Climate Change)
The Provincial regulatory agency responsible for overseeing the water and wastewater industries in Ontario. Their primary functions include approval for new or expanding facilities, inspections and investigations.
Monthly Average Concentration The arithmetic mean of all daily concentrations of a contaminant in the effluent sampled or measured, or both, during a calendar month.
Monthly Average Loading Is calculated by multiplying the monthly average concentration of a contaminant in the effluent sampled or measured, or both, during a calendar month.
N/A - Not Applicable N/D - No Discharge Peak Flow Rate
The maximum rate of sewage flow for which the plant or process unit was designed. pH
Index of hydrogen ion activity, pH is defined as the negative logarithm of hydrogen ion concentration in moles per litre. The pH may range from 0 – 14, where 0 is most acidic, 14 most basic and 7 neutral.
Rated Capacity The average daily flow for which the works are approved to handle.
Raw Influent Raw wastewater entering the water pollution control plant before treatment.
Seasonal Average Concentration The arithmetic mean of all daily concentrations of a contaminant in the effluent sampled or measured or both during the seasonal discharge period.
Sludge The settleable solids separated from liquids during processing.
TAN - Total Ammonia Nitrogen Ammonia exists in two forms in the water: NH3 (this is called unionized ammonia ) NH4+ ( this is called ionized ammonia ) Together, these two forms of ammonia are called TAN which means total ammonia nitrogen.
Temp. – Temperature Total Annual Loading
Is calculated by summarizing the total monthly loadings within a calendar year.
Page 15 of 16

Nonquon Water Pollution Control Plant Annual Performance Report 2015
Total Monthly Loading Is calculated by multiplying the total monthly flow by the monthly average concentration.
TP - Total Phosphorus A laboratory analyses to determine the total amount of non-soluble and soluble phosphorus present in the wastewater.
TSS - Total Suspended Solids A laboratory analyses to measure particles that are larger than 2 microns found in the wastewater.
TS - Total Solids Is a measure of the suspended and dissolved solids in the wastewater and in biosolids.
Unionized Ammonia Nitrogen Un-ionized ammonia refers to all forms of ammonia in water with the exception of the ammonium ion (NH4 +).
WPCP - Water Pollution Control Plant A facility composed of a variety of treatment processes that collectively treat wastewater
If this information is required in an accessible format, please contact 1-800-372-1102 extension 3488
Page 16 of 16

Port Darlington Water Pollution Control Plant Annual Performance Report 2015
Port Darlington Water Pollution Control Plant
Annual Performance Report 2015
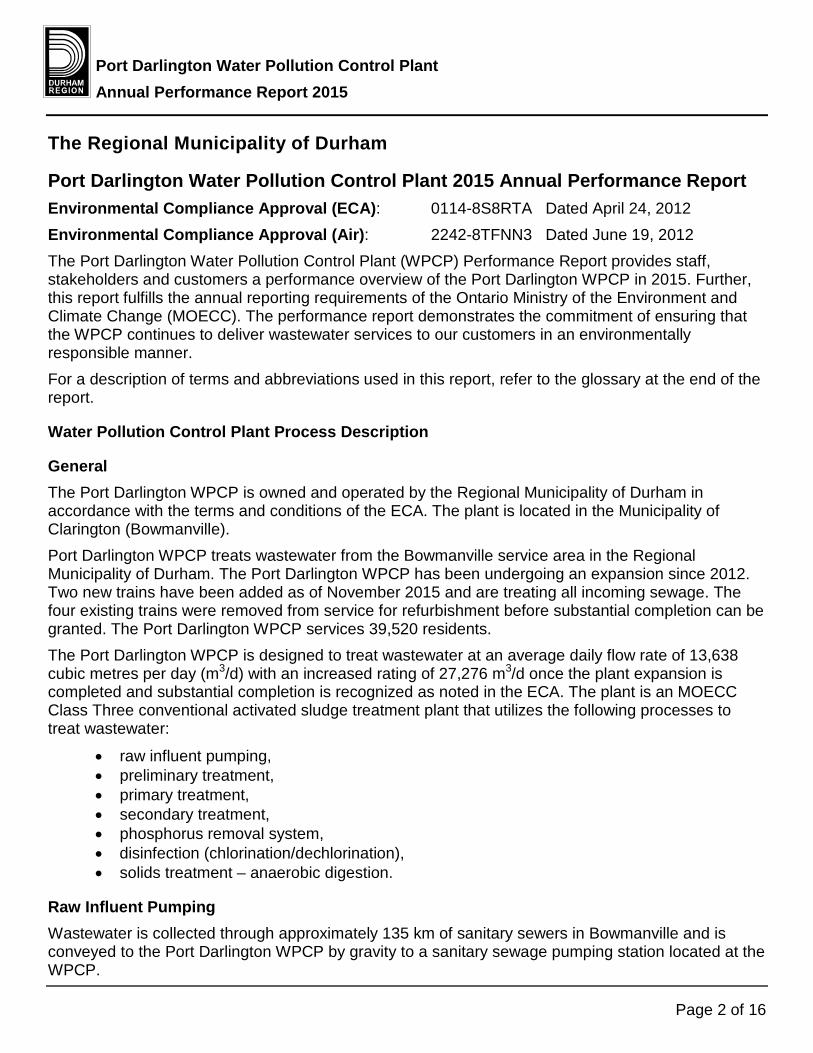
Port Darlington Water Pollution Control Plant Annual Performance Report 2015
Page 2 of 16
The Regional Municipality of Durham
Port Darlington Water Pollution Control Plant 2015 Annual Performance Report Environmental Compliance Approval (ECA): 0114-8S8RTA Dated April 24, 2012 Environmental Compliance Approval (Air): 2242-8TFNN3 Dated June 19, 2012 The Port Darlington Water Pollution Control Plant (WPCP) Performance Report provides staff, stakeholders and customers a performance overview of the Port Darlington WPCP in 2015. Further, this report fulfills the annual reporting requirements of the Ontario Ministry of the Environment and Climate Change (MOECC). The performance report demonstrates the commitment of ensuring that the WPCP continues to deliver wastewater services to our customers in an environmentally responsible manner. For a description of terms and abbreviations used in this report, refer to the glossary at the end of the report.
Water Pollution Control Plant Process Description
General The Port Darlington WPCP is owned and operated by the Regional Municipality of Durham in accordance with the terms and conditions of the ECA. The plant is located in the Municipality of Clarington (Bowmanville). Port Darlington WPCP treats wastewater from the Bowmanville service area in the Regional Municipality of Durham. The Port Darlington WPCP has been undergoing an expansion since 2012. Two new trains have been added as of November 2015 and are treating all incoming sewage. The four existing trains were removed from service for refurbishment before substantial completion can be granted. The Port Darlington WPCP services 39,520 residents. The Port Darlington WPCP is designed to treat wastewater at an average daily flow rate of 13,638 cubic metres per day (m3/d) with an increased rating of 27,276 m3/d once the plant expansion is completed and substantial completion is recognized as noted in the ECA. The plant is an MOECC Class Three conventional activated sludge treatment plant that utilizes the following processes to treat wastewater:
• raw influent pumping, • preliminary treatment, • primary treatment, • secondary treatment, • phosphorus removal system, • disinfection (chlorination/dechlorination), • solids treatment – anaerobic digestion.
Raw Influent Pumping Wastewater is collected through approximately 135 km of sanitary sewers in Bowmanville and is conveyed to the Port Darlington WPCP by gravity to a sanitary sewage pumping station located at the WPCP.

Port Darlington Water Pollution Control Plant Annual Performance Report 2015
Page 3 of 16
Preliminary Treatment Screening: Two automatic, mechanically cleaned screens remove paper products and large material that could harm pumps and process equipment. Screenings removed in this process are compacted for landfill disposal. Grit Removal: Heavy suspended material such as sand and small stones (grit) is removed in the two vortex grit tanks. The velocity of the wastewater swirling in the tanks is controlled by the velocity of influent flow to allow heavy grit material to settle, while keeping the lighter organic material in suspension to proceed to the next process tank. The grit removed in this process is dewatered and transported to landfill.
Primary Treatment The two primary clarifiers utilize the physical process of sedimentation which allows suspended material to settle to the bottom of the tank as sludge. This raw sludge, along with waste activated sludge from the secondary treatment process is collected by a flight and chain mechanism which pushes the sludge into hoppers. The sludge is then pumped to the anaerobic digesters for further treatment. Any material floating on the surface of the clarifier (scum) is also removed to the digester.
Secondary Treatment Aeration Tanks: The aerations tanks are comprised of two distinct sections. The first section is an anoxic zone, where there is no oxygen introduced, to allow for denitrification. The second part of the tank is where fine bubbled air is diffused into the sewage to remove organics and nutrients from the wastewater. Biological activity is controlled to assimilate the organic material. Secondary Clarifier: The effluent from the aeration tanks is directed to the secondary clarifiers where it settles quickly as an activated (living) sludge leaving a clear supernatant to overflow the tank. The activated sludge collected on the bottom of the clarifier is pumped back to the head of the aeration tank. Waste activated sludge is sent to the primary clarifier where it blends with the settled sludge and is removed to the anaerobic digester.
Phosphorus Removal System The phosphorous removal system is intended to lower the total phosphorous level in the final effluent by adding a chemical coagulant (ferrous chloride) as part of the treatment process. Ferrous chloride can be added at multiple locations throughout the WPCP.
Disinfection (chlorination/dechlorination) Chlorine in the form of liquid sodium hypochlorite is metered into the secondary effluent stream for pathogen control. Adequate contact time is provided by the single chlorine contact chamber. Disinfected effluent is dechlorinated with a sodium bisulphite solution before being discharged through the 1,350 mm diameter outfall extending 1,100 meters into Lake Ontario.
Solids Treatment - Anaerobic Digestion The raw sludge that is collected from the primary clarifiers is pumped into the primary digester. Anaerobic digestion reduces the volume of sludge by bacteria consuming the organic material. As these digesters are currently under construction, they are being used as sludge storage tanks only. All sludge produced at the Port Darlington WPCP is hauled to Harmony Creek WPCP or to Duffin

Port Darlington Water Pollution Control Plant Annual Performance Report 2015
Page 4 of 16
Creek WPCP for further processing. Sludges are transported plant to plant in accordance with ECA #A820250.
Environmental Compliance Approval Under Condition 10 (6) of ECA #0114-8S8RTA the Region of Durham must produce an annual report that contains the following information:
a) Summary and interpretation of all monitoring data and a comparison to the effluent limits, including an overview of the success and adequacy of the Works; • The Port Darlington WPCP effluent was determined to be compliant with the ECA approval
limits during the reporting period. The plant operated at an average of 93% of its rated capacity and received a maximum daily flow of 38,720 m3/d on October 29, 2015. See tables for effluent results.
b) Description of any operating problems encountered and corrective actions taken: There were no operating problems encountered in 2015.
c) Summary of all maintenance carried out on any major structure, equipment, apparatus, mechanism or thing forming part of the Works; • Due to the construction, no major maintenance was done outside of the expansion scope of
work. d) Summary of any effluent quality assurance or control measures undertaken in the
reporting period; • In-house lab test results are compared to the results of the Regional Environmental
Laboratory on comparable samples to determine the in-house accuracy. All results were found to be within a comparable range.
• On-line instrumentation is verified by WPCP operators using various field or laboratory test equipment.
e) Summary of the calibration and maintenance carried out on all effluent monitoring equipment; • Calibration of the effluent flow meter and the secondary clarifier flow meter occurred on
June and December 2015. • Calibration of the in-house lab pH meter is conducted regularly.
f) A description of efforts made and results achieved in meeting the Effluent Objectives; The Regional Municipality of Durham continually strives to achieve the best effluent quality at all times, remaining below the ECA compliance limits. The annual average daily flow did not exceed the rated capacity of 13,638 m3/d during the reporting period. An effluent objective for total ammonia nitrogen was exceeded on one occasion – the newly constructed treatment trains have alleviated this issue. The total chlorine residual objective was exceeded in 25 of 44 samples (57%). The newly constructed dechlorination system is intended to correct this.

Port Darlington Water Pollution Control Plant Annual Performance Report 2015
Page 5 of 16
The pH objective of 6.5 was exceeded in 55 of 279 samples (20%). The pH meter was calibrated as required and ultimately in December a replacement meter was purchased. Best efforts and process adjustments will continue to be applied to maintain results below objectives.
g) A tabulation of the volume of sludge generated in the reporting period, an outline of anticipated volumes to be generated in the next reporting period and a summary of the locations to where the sludge was disposed: The volume of sludge removed from Port Darlington WPCP in 2015 was 47,671 m3.
Outline of anticipated volumes to be generated in the next reporting period: There is no increase of sludge volume expected in the next reporting period.
Summary of locations to where sludge was disposed: Duffin Creek WPCP – 13,040 m3 or 27% Harmony Creek WPCP – 34,631 m3 or 73%
h) Summary of any complaints received during the reporting period and any steps taken to address the complaints: There were no documented complaints received about the Port Darlington WPCP in 2015.
i) A summary of all By-pass, Spills or abnormal discharge events; There were no by-passes during the reporting period. There are no anticipated by-passes planned during the next reporting period. There were no spills during the reporting period.
MOECC Inspection No MOECC inspection occurred in 2015.
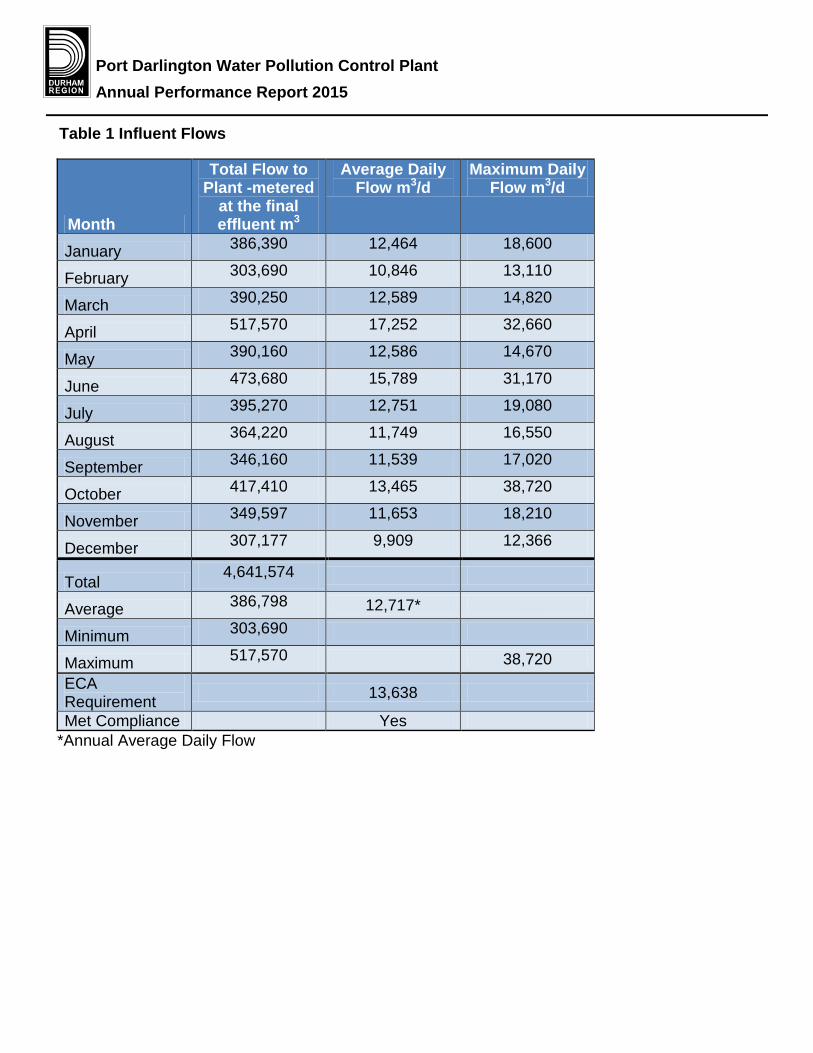
Port Darlington Water Pollution Control Plant Annual Performance Report 2015
Table 1 Influent Flows
Month
Total Flow to Plant -metered
at the final effluent m3
Average Daily Flow m3/d
Maximum Daily Flow m3/d
January 386,390 12,464 18,600
February 303,690 10,846 13,110
March 390,250 12,589 14,820
April 517,570 17,252 32,660
May 390,160 12,586 14,670
June 473,680 15,789 31,170
July 395,270 12,751 19,080
August 364,220 11,749 16,550
September 346,160 11,539 17,020
October 417,410 13,465 38,720
November 349,597 11,653 18,210
December 307,177 9,909 12,366
Total 4,641,574 N/A N/A
Average 386,798 12,717* N/A
Minimum 303,690 N/A N/A
Maximum 517,570 N/A 38,720 ECA Requirement N/A 13,638 N/A
Met Compliance N/A Yes N/A *Annual Average Daily Flow
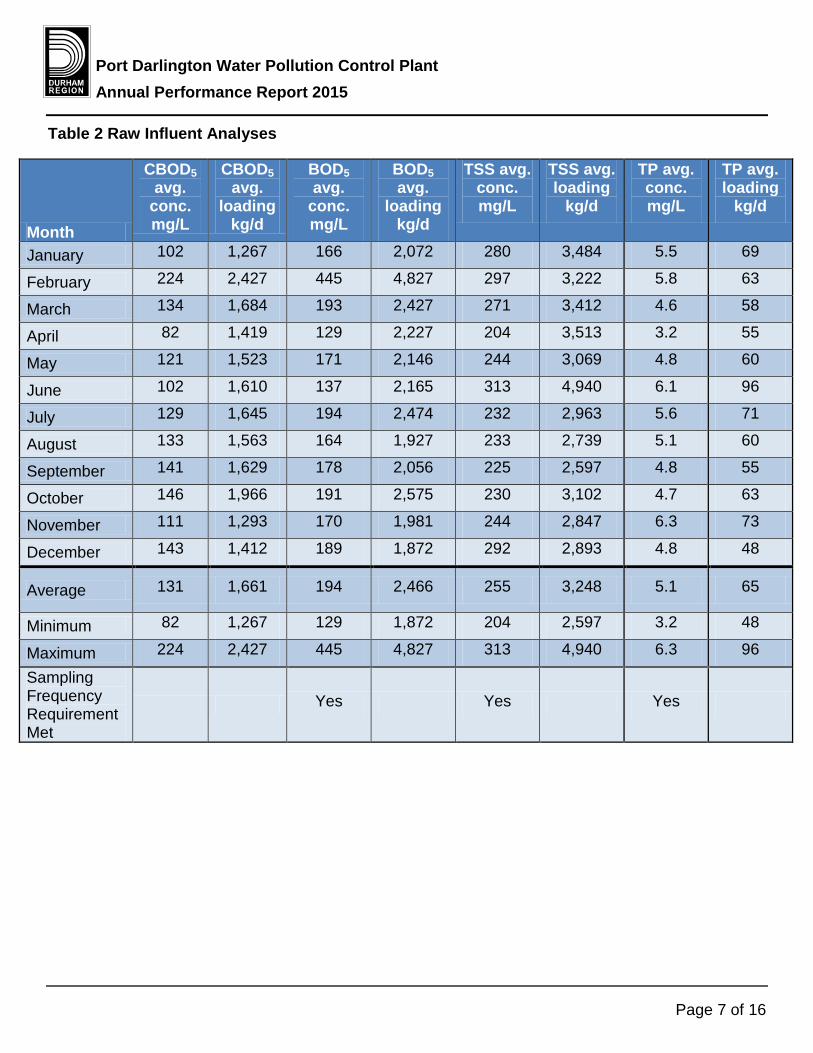
Port Darlington Water Pollution Control Plant Annual Performance Report 2015
Page 7 of 16
Table 2 Raw Influent Analyses
Month
CBOD5 avg.
conc. mg/L
CBOD5 avg.
loading kg/d
BOD5 avg.
conc. mg/L
BOD5 avg.
loading kg/d
TSS avg. conc. mg/L
TSS avg. loading
kg/d
TP avg. conc. mg/L
TP avg. loading
kg/d
January 102 1,267 166 2,072 280 3,484 5.5 69
February 224 2,427 445 4,827 297 3,222 5.8 63
March 134 1,684 193 2,427 271 3,412 4.6 58
April 82 1,419 129 2,227 204 3,513 3.2 55
May 121 1,523 171 2,146 244 3,069 4.8 60
June 102 1,610 137 2,165 313 4,940 6.1 96
July 129 1,645 194 2,474 232 2,963 5.6 71
August 133 1,563 164 1,927 233 2,739 5.1 60
September 141 1,629 178 2,056 225 2,597 4.8 55
October 146 1,966 191 2,575 230 3,102 4.7 63
November 111 1,293 170 1,981 244 2,847 6.3 73
December 143 1,412 189 1,872 292 2,893 4.8 48
Average 131 1,661 194 2,466 255 3,248 5.1 65
Minimum 82 1,267 129 1,872 204 2,597 3.2 48
Maximum 224 2,427 445 4,827 313 4,940 6.3 96
Sampling Frequency Requirement Met
N/A N/A Yes N/A Yes N/A Yes N/A
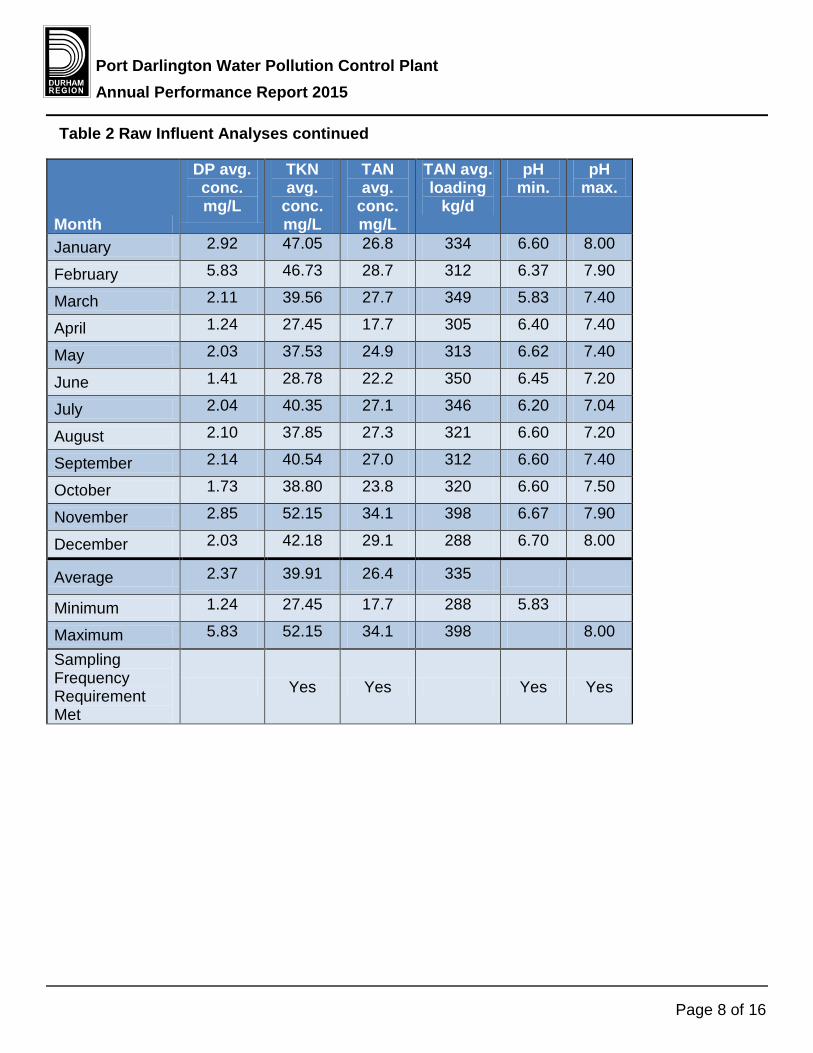
Port Darlington Water Pollution Control Plant Annual Performance Report 2015
Page 8 of 16
Table 2 Raw Influent Analyses continued
Month
DP avg. conc. mg/L
TKN avg.
conc. mg/L
TAN avg.
conc. mg/L
TAN avg. loading
kg/d
pH min.
pH max.
January 2.92 47.05 26.8 334 6.60 8.00
February 5.83 46.73 28.7 312 6.37 7.90
March 2.11 39.56 27.7 349 5.83 7.40
April 1.24 27.45 17.7 305 6.40 7.40
May 2.03 37.53 24.9 313 6.62 7.40
June 1.41 28.78 22.2 350 6.45 7.20
July 2.04 40.35 27.1 346 6.20 7.04
August 2.10 37.85 27.3 321 6.60 7.20
September 2.14 40.54 27.0 312 6.60 7.40
October 1.73 38.80 23.8 320 6.60 7.50
November 2.85 52.15 34.1 398 6.67 7.90
December 2.03 42.18 29.1 288 6.70 8.00
Average 2.37 39.91 26.4 335 N/A N/A
Minimum 1.24 27.45 17.7 288 5.83 N/A
Maximum 5.83 52.15 34.1 398 N/A 8.00
Sampling Frequency Requirement Met
N/A Yes Yes N/A Yes Yes
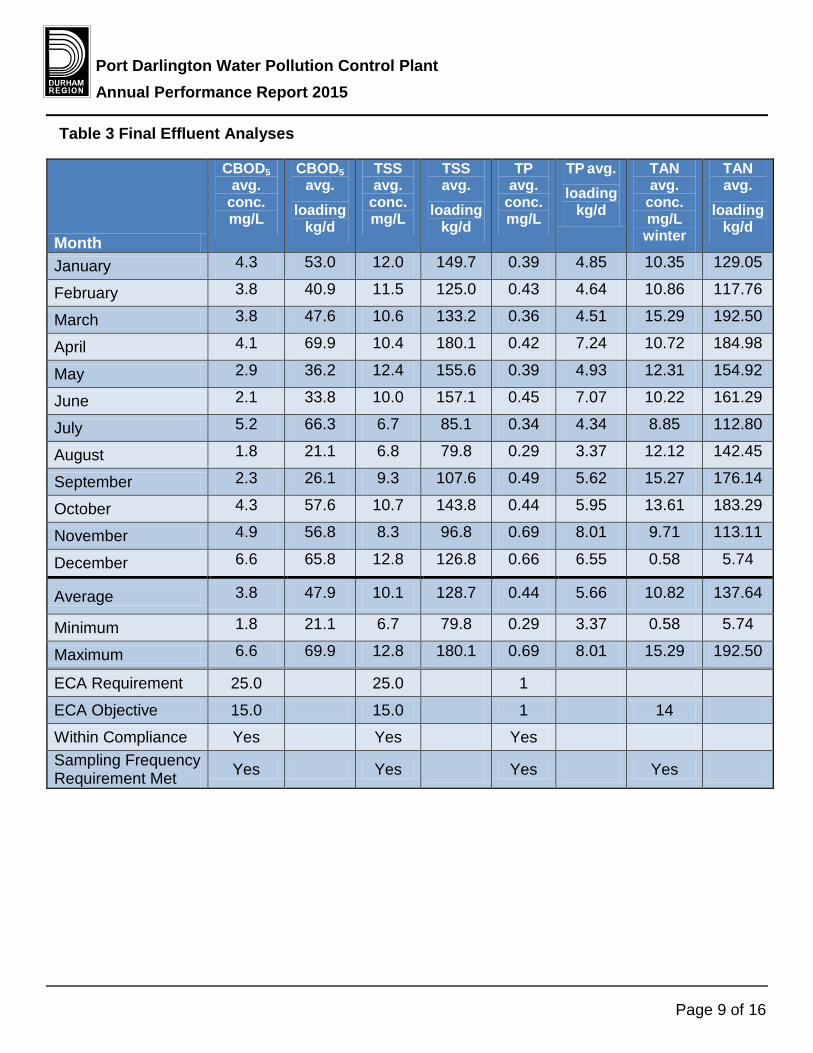
Port Darlington Water Pollution Control Plant Annual Performance Report 2015
Page 9 of 16
Table 3 Final Effluent Analyses
Month
CBOD5 avg.
conc. mg/L
CBOD5 avg.
loading kg/d
TSS avg.
conc. mg/L
TSS avg.
loading kg/d
TP avg.
conc. mg/L
TP avg. loading
kg/d
TAN avg.
conc. mg/L winter
TAN avg.
loading kg/d
January 4.3 53.0 12.0 149.7 0.39 4.85 10.35 129.05
February 3.8 40.9 11.5 125.0 0.43 4.64 10.86 117.76
March 3.8 47.6 10.6 133.2 0.36 4.51 15.29 192.50
April 4.1 69.9 10.4 180.1 0.42 7.24 10.72 184.98
May 2.9 36.2 12.4 155.6 0.39 4.93 12.31 154.92
June 2.1 33.8 10.0 157.1 0.45 7.07 10.22 161.29
July 5.2 66.3 6.7 85.1 0.34 4.34 8.85 112.80
August 1.8 21.1 6.8 79.8 0.29 3.37 12.12 142.45
September 2.3 26.1 9.3 107.6 0.49 5.62 15.27 176.14
October 4.3 57.6 10.7 143.8 0.44 5.95 13.61 183.29
November 4.9 56.8 8.3 96.8 0.69 8.01 9.71 113.11
December 6.6 65.8 12.8 126.8 0.66 6.55 0.58 5.74
Average 3.8 47.9 10.1 128.7 0.44 5.66 10.82 137.64
Minimum 1.8 21.1 6.7 79.8 0.29 3.37 0.58 5.74
Maximum 6.6 69.9 12.8 180.1 0.69 8.01 15.29 192.50
ECA Requirement 25.0 N/A 25.0 N/A 1 N/A N/A N/A
ECA Objective 15.0 N/A 15.0 N/A 1 N/A 14 N/A
Within Compliance Yes N/A Yes N/A Yes N/A N/A N/A
Sampling Frequency Requirement Met Yes N/A Yes N/A Yes N/A Yes N/A

Port Darlington Water Pollution Control Plant Annual Performance Report 2015
Page 10 of 16
Table 3 Final Effluent Analyses continued
Month
Unionized NH3
avg. conc. mg/L
TKN avg.
conc. mg/L
DP avg. conc. mg/L
TCR avg.
conc. mg/L
TCR avg.
loading kg/d
pH min.
pH max.
Temp. oC
min.
Temp. oC
max.
January 0.01 12.98 0.08 N/A N/A 6.10 6.80 11.3 13.4
February 0.01 17.63 0.08 N/A N/A 6.10 6.90 9.5 13.8
March 0.02 17.24 0.09 N/A N/A 6.30 7.00 10.2 11.9
April 0.01 11.80 0.11 N/A N/A 6.40 7.00 10.6 13.2
May 0.03 14.43 0.16 0.44 5.52 6.15 7.20 13.2 16.2
June 0.01 11.54 0.17 0.74 11.62 6.16 7.10 15.4 21.4
July 0.02 10.53 0.10 0.76 9.74 5.62 6.89 16.8 22.1
August 0.02 13.88 0.12 0.78 9.11 6.40 6.85 19.0 21.2
September 0.04 17.92 0.18 0.77 8.86 6.40 7.20 19.7 22.0
October 0.03 18.58 0.13 0.56 7.47 6.50 7.20 11.1 18.6
November 0.02 12.28 0.45 N/A N/A 6.53 7.40 7.7 17.8
December 0.00 7.26 0.21 0.41 4.04 6.30 7.50 10.2 15.3
Average 0.02 13.84 0.16 0.63 8.07 N/A N/A N/A N/A
Minimum 0.00 7.26 0.08 0.41 4.04 5.62 N/A 7.7 N/A
Maximum 0.04 18.58 0.45 0.78 11.62 N/A 7.50 N/A 22.1
ECA Requirement
N/A N/A N/A N/A N/A 5.5 9.5 N/A N/A
ECA Objective
N/A N/A N/A 0.5 N/A 6.5 9.0 N/A N/A
Within Compliance
N/A N/A N/A Yes N/A Yes Yes N/A N/A
Sampling Frequency Requirement Met
Yes N/A N/A Yes N/A Yes Yes Yes Yes
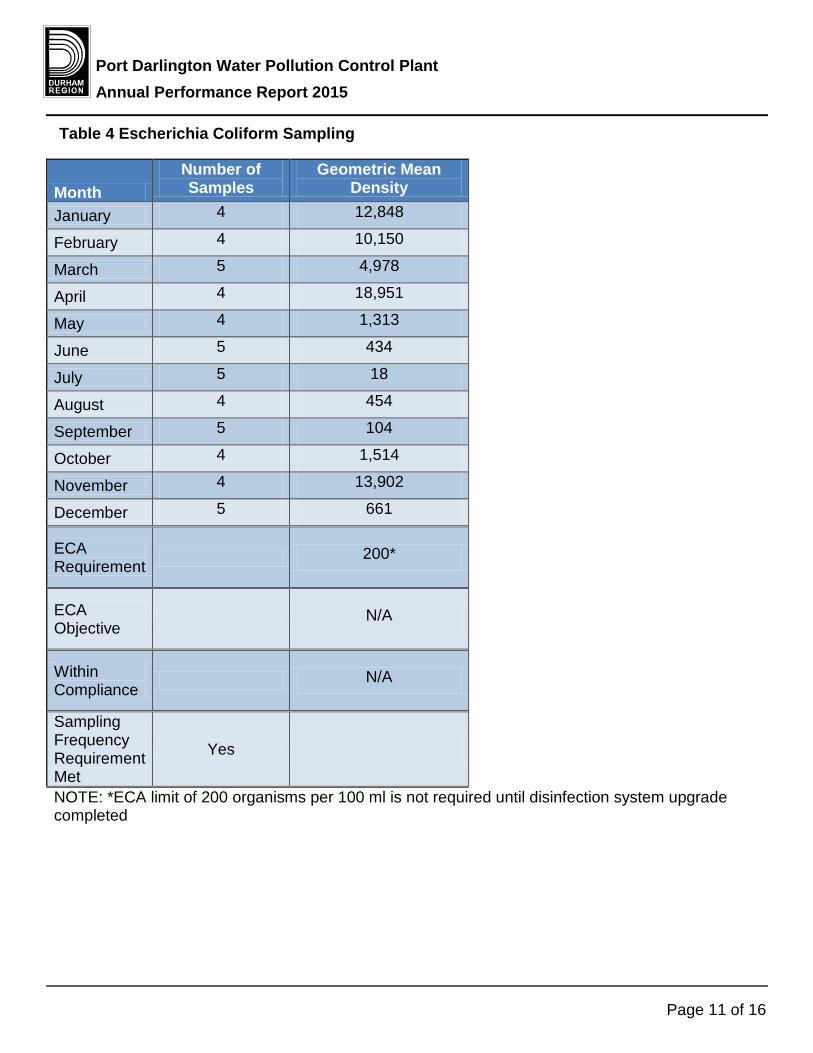
Port Darlington Water Pollution Control Plant Annual Performance Report 2015
Page 11 of 16
Table 4 Escherichia Coliform Sampling
Month
Number of Samples
Geometric Mean Density
January 4 12,848
February 4 10,150
March 5 4,978
April 4 18,951
May 4 1,313
June 5 434
July 5 18
August 4 454
September 5 104
October 4 1,514
November 4 13,902
December 5 661
ECA Requirement N/A 200*
ECA Objective N/A N/A
Within Compliance N/A N/A
Sampling Frequency Requirement Met
Yes N/A
NOTE: *ECA limit of 200 organisms per 100 ml is not required until disinfection system upgrade completed

Port Darlington Water Pollution Control Plant Annual Performance Report 2015
Page 12 of 16
Table 5 Energy and Chemical Usage
Month
Total Plant Flow
(cubic metres)
Alum (litres)
Ferrous Chloride (litres)
Sodium Hypochlorite (kilograms as chlorine)
Sodium Bisulphite
(Litres)
Hydro (kWh)
Natural Gas
(cubic metres)
January 386,390 50,341 0 0 0 131,286 12,572
February 303,690 42,185 0 0 0 116,586 7,941
March 390,250 49,080 0 0 0 129,408 8,032
April 517,570 50,507 0 0 0 147,466 4,237
May 390,160 50,301 0 571 0 164,682 5,002
June 473,680 50,217 0 1,128 0 136,338 497
July 395,270 48,800 0 1,161 0 135,132 393
August 364,220 47,999 0 1,090 0 146,870 3,115
September 346,160 45,857 0 1,318 0 146,013 3,063
October 417,410 48,822 0 550 0 251,245 5,489
November 349,597 21,920 6,165 0 0 237,753 12,546
December 307,177 0 24,795 161 451 256,082 23,143
Total 4,641,574 506,029 30,960 5,978 451 1,998,861 86,030

Port Darlington Water Pollution Control Plant Annual Performance Report 2015
Page 13 of 16
Table 6 Summary of Raw Water Bacteriological Analyses at the Bowmanville Water Supply Plant
Month
E.coli cfu/100ml (min-max
result)
E.coli (number of samples)
Total Coliform cfu/100ml (min-max
result)
Total Coliform
(number of samples)
January <1 16 <1-3 16
February <1 15 <1 15
March <1 18 <1-12 18
April <1-1 17 <1-34 17
May <1-1 15 <1-2 15
June <1-1 18 <1-10 18
July <1-1 17 <1-6 17
August <1-2 16 <1-240 16
September <1-1 17 <1-180 17
October <1-7 16 <1-90 16
November <1-15 16 <1-73 16
December <1-1 16 <1-3 16
Port Darlington Water Pollution Control Plant Annual Performance Report 2015
Page 14 of 16
Glossary of Terms Aeration Tank
A vessel in which a biological process is carried out which involves bacterial organisms or biochemically active substances derived from such organisms. This encompasses a combination of aerobic, anoxic, and anaerobic processes.
Anaerobic Digestion Is a series of biological processes in which microorganisms break down biodegradable material in the absence of oxygen.
Annual Average Concentration An arithmetic mean of the monthly average concentrations of a contaminant in the effluent calculated for any particular year.
Annual Average Loading The value obtained by multiplying the Annual Average Concentration of a contaminant by the Average Daily Flow over the same calendar year.
Average Daily Flow The cumulative total sewage flow to the sewage works during a calendar year divided by the number of days during which sewage was flowing to the sewage works that year.
Biosolids Organic material recovered from wastewater sludge.
BOD5 Five Day Biochemical Oxygen Demand (also known as totalBOD5) means five day biochemical oxygen demand measured in an unfiltered sample and includes carbonaceous and nitrogenous oxygen demand.
By-pass A diversion of sewage around one or more unit processes within the Sewage Treatment Plant with the diverted sewage flows being returned to the Sewage Treatment Plant treatment train upstream of the Final effluent sampling location, and discharging to the environment through the Sewage Treatment Plant outfall.
CBOD5 -Five day Carbonaceous Biochemical Oxygen Demand A five day carbonaceous (nitrification inhibited) biochemical oxygen demand measured in an unfiltered sample.
conc. - Concentration DP – Dissolved Phosphorus
The soluble form of phosphorus present in the wastewater. ECA - Environmental Compliance Approval
The primary regulatory instrument for each WPCP. E. coli - (Escherichia coli)
Refers to the thermally tolerant forms of Escherichia that can survive at 44.5 degrees Celsius. Final Effluent
Sewage discharge via the Sewage Treatment Plant outfall after undergoing the full train of unit processes as listed in the Environmental Compliance Approval.

Port Darlington Water Pollution Control Plant Annual Performance Report 2015
Page 15 of 16
Geometric Mean Density Is the nth root of the product of multiplication of the results of n number of samples over the period specified.
Grab Sample A single sample taken at a specific moment in time, a snapshot of the conditions at the time the sample was retrieved.
m3 - (Cubic Metre) Volume measurement, 1m3 = 1000 litres or 220 imperial gallons.
m3/d - (Cubic Metres Per Day) Flow measurement, 1m3 = 1000 litres or 220 imperial gallons. Volume of liquid treated in a 24 hour period.
Max. – Maximum Maximum Flow Rate
The peak or highest flow recorded during a specific time period usually in a twenty-four (24) period.
mg/L - (Milligram Per Litre) This is a measure of the concentration of a parameter in water or wastewater, sometimes referred to as parts per million (ppm).
Min. – Minimum mm - (millimetre)
A unit of length in the metric system, equal to one thousandth of a metre. MOECC - (Ministry of the Environment and Climate Change)
The Provincial regulatory agency responsible for overseeing the water and wastewater industries in Ontario. Their primary functions include approval for new or expanding facilities, inspections and investigations.
Monthly average concentration The arithmetic mean of all daily concentrations of a contaminant in the effluent sampled or measured, or both, during a calendar month.
Monthly average loading Is calculated by multiplying the monthly average concentration of a contaminant in the effluent sampled or measured, or both, during a calendar month.
N/A - Not Applicable pH
Index of hydrogen ion activity, pH is defined as the negative logarithm of hydrogen ion concentration in moles per litre. The pH may range from 0 – 14, where 0 is most acidic, 14 most basic and 7 neutral.
Rated Capacity The average daily flow for which the works are approved to handle.
Raw Influent Raw wastewater entering the water pollution control plant before treatment.
Port Darlington Water Pollution Control Plant Annual Performance Report 2015
Page 16 of 16
Septage Partially treated sludge from a septic tank.
Sludge The settleable solids separated from liquids during processing.
Substantial completion Has the same meaning as “substantial performance” in the Construction Lien Act.
TAN -Total Ammonia Nitrogen Ammonia exists in two forms in the water: NH3 (this is called unionized ammonia ) NH4+ ( this is called ionized ammonia ) Together, these two forms of ammonia are called TAN which means total ammonia nitrogen.
TCR -Total Chlorine Residual The total amount of chlorine in water, including the combined chlorine and the free available chlorine.
Temp. – Temperature TP -Total Phosphorus
A laboratory analyses to determine the total amount of particulate and soluble phosphorus present in the wastewater.
TSS -Total Suspended Solids A laboratory analyses to measure particles that are larger than 2 microns found in the wastewater.
TS -Total Solids Is a measure of the suspended and dissolved solids in the wastewater and in biosolids.
Unionized Ammonia Nitrogen Un-ionized ammonia refers to all forms of ammonia in water with the exception of the ammonium ion (NH4 +).
Works The sewage works described in the owner’s application, and the ECA, and includes both proposed works and previous works.
WPCP - Water Pollution Control Plant Is typically a facility composed of a variety of treatment processes that collectively treat the wastewater.
If this information is required in an accessible format, please contact 1-800-372-1102 extension 3488

Sunderland Water Pollution Control Plant Annual Performance Report 2015
Page 1 of 13
Sunderland Water Pollution Control Plant
Annual Performance Report 2015

Sunderland Water Pollution Control Plant Annual Performance Report 2015
Page 2 of 13
The Regional Municipality of Durham
Sunderland Water Pollution Control Plant 2015 Annual Performance Report Environmental Compliance Approval (ECA): 9252-8CUNBZ Dated June 28, 2012 The Sunderland Water Pollution Control Plant (WPCP) Performance Report provides staff, stakeholders and customers an overview of the performance of the Sunderland WPCP in 2015. Further, this report fulfills the annual reporting requirements of the Ontario Ministry of the Environment and Climate Change (MOECC). The performance report demonstrates the commitment of ensuring that the WPCP continues to deliver wastewater services to our customers in an environmentally responsible manner. For a description of terms and abbreviations used in this report, refer to the glossary at the end of the report.
General The Sunderland WPCP is owned and operated by the Regional Municipality of Durham in accordance with the terms and conditions of the ECA. The plant is located in the Community of Sunderland in the Township of Brock. This MOECC Class One wastewater treatment plant is designed to treat wastewater at a rated capacity of 632 cubic metres per day (m3/d) and utilizes a seasonal retention wastewater stabilization lagoon system. The Sunderland WPCP has a service population of 1,183 residents.
Raw Influent Wastewater is collected through 7.7 km of sanitary sewers in the Sunderland service area and is conveyed to the treatment facility by a single pumping station located on River Street.
Lagoon Treatment The Sunderland WPCP is a two cell lagoon system where the influent raw sewage enters a retention stabilization lagoon and overflows into an exfiltration cell giving a combined retention time of 182.5 days. The ECA permits two seasonal discharges per year. Spring discharge is for 20 days in May and fall discharge is for 20 days in November. Prior to and during discharge to the Beaver River, samples are collected to verify the effluent will meet the limits established in the ECA.
Environmental Compliance Approval Under Condition 9 (4) of ECA #9252-8CUNBZ the Region of Durham must produce an annual report that must contain the following information:
a) Summary and interpretation of all monitoring data and a comparison to the effluent limits outlined in Condition 5, including an overview of the success and adequacy of the works The raw wastewater flowing into the plant is analyzed for its chemical and physical composition. Monitoring of the raw wastewater is performed in accordance with the conditions in the ECA. Table 2 summarizes the raw wastewater characteristics during the reporting period.

Sunderland Water Pollution Control Plant Annual Performance Report 2015
Page 3 of 13
The Sunderland WPCP effluent was determined to be compliant with the approval limits during the reporting period. In early fall of 2015, the River Street Sanitary Sewage Pumping Station flow meter was found to be inaccurate. Based on a historical five year trend the utilization is estimated to be approximately 70%. Replacement of the flowmeter was completed in February 2016. The total treated effluent discharged to the Beaver River in 2015 was calculated to be 102,118 m3. Table 4 provides a tabulation of effluent results.
b) Description of any operating problems encountered and corrective actions taken: The River Street Sanitary Sewage Pumping Station flow meter was found to be inaccurate. The wet well and discharge chamber were inspected and cleaned. Replacement of the flow meter was completed in February 2016.
c) Maintenance of major equipment No maintenance was performed on major equipment during the reporting period.
d) Summary of any effluent quality assurance or control measures In-house lab test results are compared to the results of the Regional Environmental Laboratory on comparable samples to determine the in-house accuracy. Results were found to be within a comparable range.
e) Summary of the calibration and maintenance carried out on all effluent monitoring equipment • The influent flow meter located at River Street pumping station was calibrated in April and
August, 2015. • Temperature and pH are monitored in the field, all other routine process control tests are
performed at the Lake Simcoe WPCP laboratory in Beaverton. All monitoring and laboratory equipment is calibrated and maintained according to manufacturer’s specifications.
f) Estimate of sludge settling capacity of the lagoon and annual depletion The annual depletion of the sludge settling capacity is negligible. There was no removal of solids from the lagoons in 2015. Due to additional funding required the design and construction of a maintenance lagoon was not completed in 2015 and is scheduled for 2016.
g) Efforts made and results achieved in meeting the effluent objectives of Condition 4 • The Regional Municipality of Durham strives to achieve the best effluent quality at all times
consistently remaining well below ECA limits. • The annual average daily flow did not exceed the rated capacity of 632 m3/d during the
reporting period. The peak flow rate of 727 m3/d was not exceeded. • The maximum objective for pH was exceeded once on November 2nd during the fall
discharge. • The total phosphorus objective was exceeded once on November 12th during the fall
discharge, as a result the discharge was stopped. • Best efforts will continue to be applied to maintain results below objectives.
h) Complaints A summary of complaints received from the public is administered through a central database. No complaints were received during the reporting period regarding this plant.

Sunderland Water Pollution Control Plant Annual Performance Report 2015
Page 4 of 13
i) By-passes No by-passes, spills or abnormal discharges occurred during the reporting period.
j) Initial Effluent Characterization The initial effluent characterization sampling was conducted during 2015 with a completion date of November 2nd, 2015. A report will be submitted in April of 2016, as per Condition 8 (3) of the ECA.
k) Information Required by MOECC Water Supervisor No additional information required.
Proposed Alterations, Extensions or Replacements Design and construction of a maintenance lagoon to allow for storage during cleaning is scheduled to be completed in 2016. MOECC Inspection This plant was inspected by the MOECC on January 12, 2015.

Sunderland Water Pollution Control Plant Annual Performance Report 2015
Page 5 of 13
Summary of Tables Table 1 Raw Influent Flows
Month Total Flow to Plant -metered at the River
Street Pumping Station m3
Average Daily Flow
m3/d
Maximum Daily Flow
m3/d
Minimum Daily Flow
m3/d
January 8,125 262 219 221
February 6,103 218 270 149
March 7,418 239 277 190
April 8,504 283 316 232
May 7,298 235 255 212
June 8,135 271 392 200
July 8,314 268 333 217
August 6,187 200 228 164
September 5,676 189 246 167
October 5,263 170 206 149
November 5,743 191 211 165
December 5,863 189 208 151
Total 82,629 N/A N/A N/A
Average 6,886 226* N/A N/A
Minimum 5,263 170 N/A 149
Maximum 8,504 283 392 N/A
ECA Requirement N/A 632* N/A N/A
Met Compliance N/A Yes N/A N/A *Annual average daily flow Flowmeter was found to be inaccurate, replaced February 2016
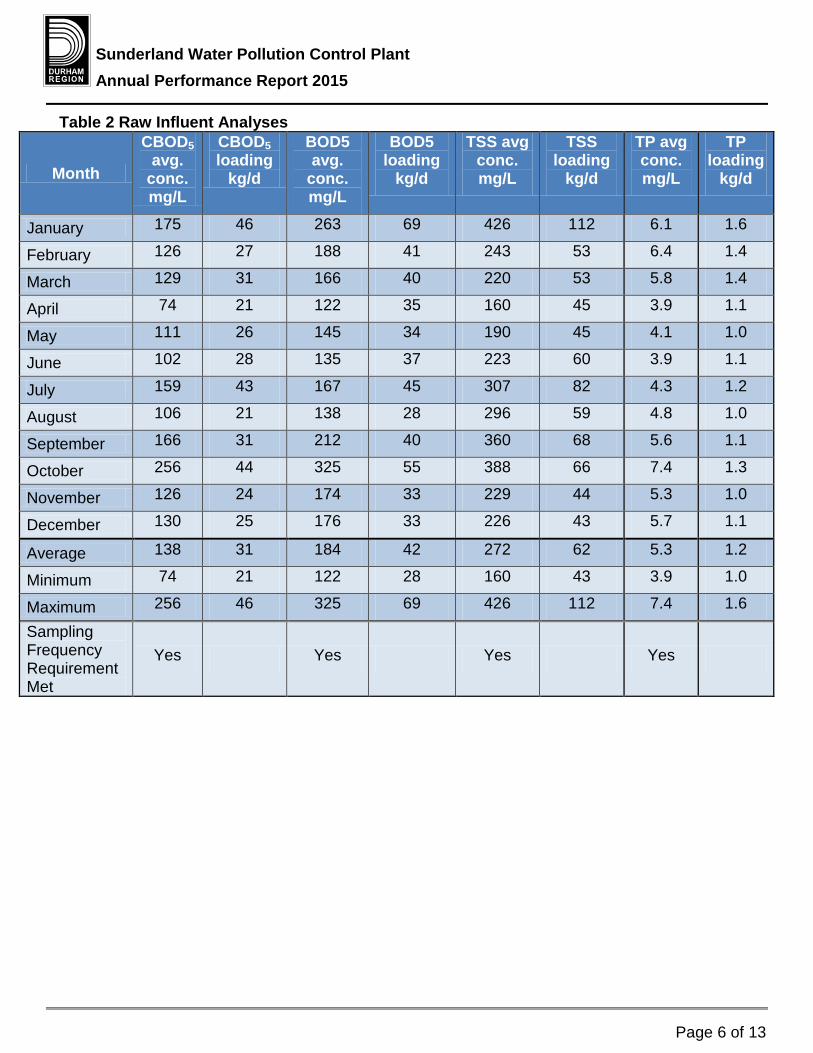
Sunderland Water Pollution Control Plant Annual Performance Report 2015
Page 6 of 13
Table 2 Raw Influent Analyses
Month
CBOD5 avg.
conc. mg/L
CBOD5 loading
kg/d
BOD5 avg.
conc. mg/L
BOD5 loading
kg/d
TSS avg conc. mg/L
TSS loading
kg/d
TP avg conc. mg/L
TP loading
kg/d
January 175 46 263 69 426 112 6.1 1.6
February 126 27 188 41 243 53 6.4 1.4
March 129 31 166 40 220 53 5.8 1.4
April 74 21 122 35 160 45 3.9 1.1
May 111 26 145 34 190 45 4.1 1.0
June 102 28 135 37 223 60 3.9 1.1
July 159 43 167 45 307 82 4.3 1.2
August 106 21 138 28 296 59 4.8 1.0
September 166 31 212 40 360 68 5.6 1.1
October 256 44 325 55 388 66 7.4 1.3
November 126 24 174 33 229 44 5.3 1.0
December 130 25 176 33 226 43 5.7 1.1
Average 138 31 184 42 272 62 5.3 1.2
Minimum 74 21 122 28 160 43 3.9 1.0
Maximum 256 46 325 69 426 112 7.4 1.6
Sampling Frequency Requirement Met
Yes N/A Yes N/A Yes N/A Yes N/A

Sunderland Water Pollution Control Plant Annual Performance Report 2015
Page 7 of 13
Table 2 Raw Influent Analyses continued
Month DP
avg. conc. mg/L
TKN avg.
conc. mg/L
TKN loading
kg/d
TAN avg.
conc. mg/L
TAN loading
kg/d
pH min.
pH max.
Temp. Degrees Celsius
min.
Temp. Degrees Celsius
max. January 2.28 44.90 12 24.8 6.5 7.4 7.8 7.3 12.6
February 3.01 52.60 11 30.5 6.6 7.6 8.5 3.9 10.2
March 3.11 49.72 12 33.7 8.1 7.5 8.4 8.2 9.2
April 1.91 33.73 10 21.8 6.2 7.4 7.7 8.8 9.6
May 1.99 36.50 9 24.8 5.8 7.6 7.9 10.4 13.2
June 1.68 30.80 8 20.1 5.4 7.0 8.4 13.7 25.0
July 1.79 35.28 9 23.8 6.4 7.0 7.8 15.3 16.4
August 2.38 40.30 8 27.1 5.4 7.5 8.0 16.4 17.1
September 2.38 48.55 9 36.4 6.9 7.1 7.7 16.8 17.4
October 3.65 71.88 12 40.0 6.8 7.3 8.4 10.2 17.0
November 2.53 46.68 9 28.5 5.4 7.6 8.4 9.8 16.7
December 3.10 51.95 10 31.3 5.9 7.6 8.3 10.4 13.4
Average 2.48 45.24 10 28.6 6.5 N/A N/A N/A N/A
Minimum 1.68 30.80 8 20.1 5.4 7.0 3.9 N/A
Maximum 3.65 71.88 12 40.0 8.1 N/A 8.5 N/A 25.0
Sampling Frequency Requirement Met
N/A N/A N/A Yes N/A Yes Yes Yes Yes
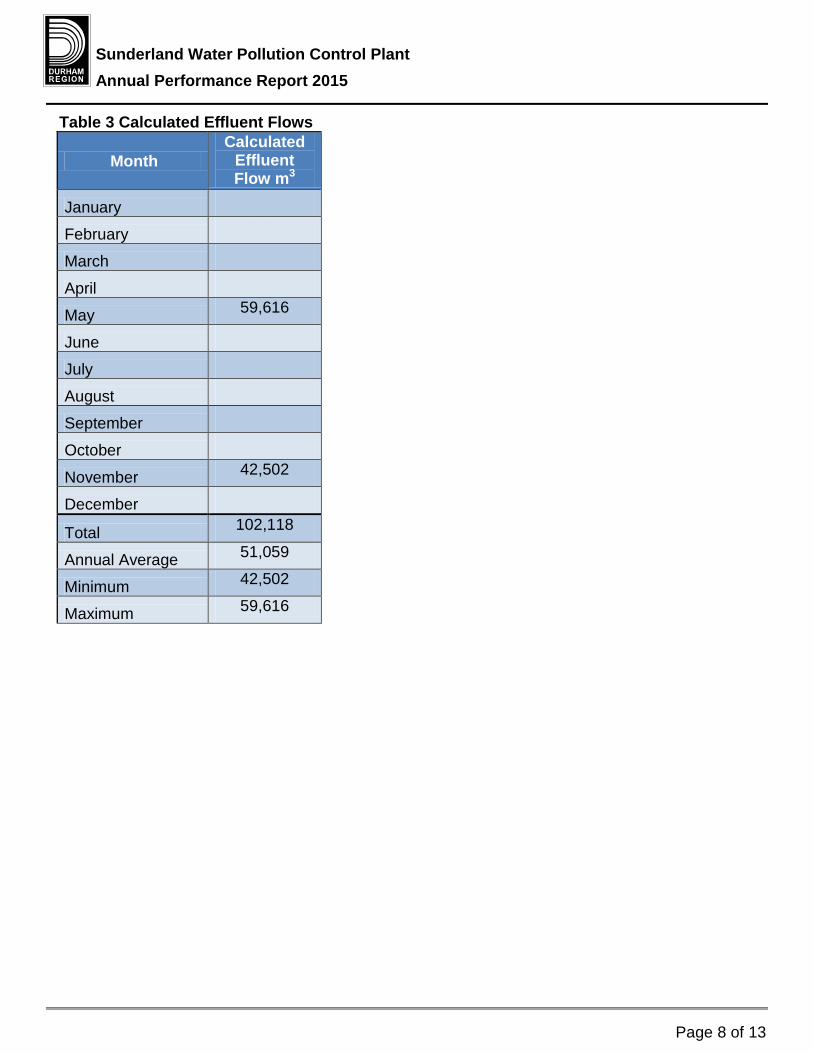
Sunderland Water Pollution Control Plant Annual Performance Report 2015
Page 8 of 13
Table 3 Calculated Effluent Flows
Month Calculated
Effluent Flow m3
January N/D
February N/D
March N/D
April N/D
May 59,616
June N/D
July N/D
August N/D
September N/D
October N/D
November 42,502
December N/D
Total 102,118
Annual Average 51,059
Minimum 42,502
Maximum 59,616

Sunderland Water Pollution Control Plant Annual Performance Report 2015
Page 9 of 13
Table 4 Final Effluent Analyses
Month
CBOD5 avg.
conc. mg/L
CBOD5 loading
kg/d
BOD5 avg.
conc. mg/L
BOD5 loading
kg/d
TSS avg.
conc. mg/L
TSS loading
kg/d
TP avg.
conc. mg/L
TP loading
kg/d
TP loading
kg/ month
January N/D N/D N/D N/D N/D N/D N/D N/D N/D
February N/D N/D N/D N/D N/D N/D N/D N/D N/D
March N/D N/D N/D N/D N/D N/D N/D N/D N/D
April N/D N/D N/D N/D N/D N/D N/D N/D N/D
May 4.1 22 5.7 31 4.6 25 0.05 0.3 3.0
June N/D N/D N/D N/D N/D N/D N/D N/D N/D
July N/D N/D N/D N/D N/D N/D N/D N/D N/D
August N/D N/D N/D N/D N/D N/D N/D N/D N/D
September N/D N/D N/D N/D N/D N/D N/D N/D N/D
October N/D N/D N/D N/D N/D N/D N/D N/D N/D
November 1.9 8 3.3 6 5.8 25 0.12 0.5 5.1
December N/D N/D N/D N/D N/D N/D N/D N/D N/D
Total N/A N/A N/A N/A N/A N/A N/A N/A 8.1*
Average 3.0 15 4.5 22 5.2 25 0.09 0.4 2.0
Minimum 1.9 8 3.3 6 4.6 25 0.05 0.3 3.0
Maximum 4.1 22 5.7 31 5.8 25 0.12 0.5 5.1
ECA Limit 10** N/A N/A N/A 15** N/A 0.3** N/A 69*
ECA Objective
10 N/A N/A N/A 15 N/A 0.5 N/A N/A
LSPRS N/A N/A N/A N/A N/A N/A 0.25** N/A 58*
Within Compliance
Yes N/A N/A N/A Yes N/A Yes N/A Yes
Sampling Frequency Requirement Met
Yes N/A Yes N/A Yes N/A Yes N/A N/A
*Total Annual Loading , kg/year **Annual Average Concentration

Sunderland Water Pollution Control Plant Annual Performance Report 2015
Page 10 of 13
Table 4 Final Effluent Analyses continued
Month
DP avg.
conc. mg/L
TAN avg.
conc. mg/L
TAN loading
kg/d
TKN avg.
conc. mg/L
Un-ionized
ammonia avg.
conc. mg/L
pH min.
pH max.
Temp. oC
min.
Temp. oC
max.
January N/D N/D N/D N/D N/D N/D N/D N/D N/D
February N/D N/D N/D N/D N/D N/D N/D N/D N/D
March N/D N/D N/D N/D N/D N/D N/D N/D N/D
April N/D N/D N/D N/D N/D N/D N/D N/D N/D
May 0.003 6.18 4.93 26.7 0.10 7.6 7.9 14.7 20.5
June N/D N/D N/D N/D N/D N/D N/D N/D N/D
July N/D N/D N/D N/D N/D N/D N/D N/D N/D
August N/D N/D N/D N/D N/D N/D N/D N/D N/D
September N/D N/D N/D N/D N/D N/D N/D N/D N/D
October N/D N/D N/D N/D N/D N/D N/D N/D N/D
November 0.007 1.95 1.67 7.2 0.00 6.6 8.2 9.9 15.7
December N/D N/D N/D N/D N/D N/D N/D N/D N/D
Average 0.005 4.07 3.30 16.1 0.05 N/A N/A N/A N/A
Minimum 0.003 1.95 1.67 7.2 0.00 6.6 N/A 9.9 N/A
Maximum 0.007 6.18 4.93 26.7 0.10 N/A 8.2 N/A 20.5
ECA Limit N/A N/A N/A N/A N/A 6.0 9.5 N/A N/A ECA Objective N/A N/A N/A N/A N/A 6.5 8.0 N/A N/A Within Compliance N/A N/A N/A N/A N/A Yes Yes N/A N/A
Sampling Frequency Requirement Met
N/A Yes N/A N/A N/A Yes Yes Yes Yes

Sunderland Water Pollution Control Plant Annual Performance Report 2015
Page 11 of 13
Glossary of Terms Annual Average Concentration
An arithmetic mean of the seasonal average concentrations of a contaminant in the effluent calculated for any particular year.
Annual Average Loading The value obtained by multiplying the seasonal average concentration of a contaminant by the Average Daily Flow over the same calendar year.
Average Daily Flow The cumulative total sewage flow to the sewage works during a calendar year divided by the number of days during which sewage was flowing to the sewage works that year.
Avg – Average An arithemetic mean of the average concentrations and loadings.
BOD5 Five Day Biochemical Oxygen Demand (also known as total BOD5) means five day biochemical oxygen demand measured in an unfiltered sample and includes carbonaceous and nitrogenous oxygen demand.
By-pass Any discharge from any portion of the works other than in accordance with the conditions of the ECA.
CBOD5 -Five Day Carbonaceous Biochemical Oxygen Demand A five day carbonaceous (nitrification inhibited) biochemical oxygen demand measured in an unfiltered sample..
Conc. Concentration The abundance of a constituent divided by the total volume of a mixture.
Daily Concentration Means the concentration of a contaminant in the effluent discharged over any single day, as measured by a composite or grab sample, whichever is required.
DP – Dissolved Phosphorus This is the soluble form of phosphorus present in the wastewater.
ECA Environmental Compliance Approval The primary regulatory instrument for each water pollution control plant.
E. coli - (Escherichia coli) Refers to the thermally tolerant forms of Escherichia that can survive at 44.5 degrees Celsius.
Final Effluent Sewage discharge through the water pollution control plant outfall after undergoing the full train of unit processes as listed in the Environmental Compliance Approval.
Geometric Mean Density Is the nth root of the product of multiplication of the results of n number of samples over the period specified.
Grab Sample A single sample taken at a specific moment in time, when tested provides a snapshot of the conditions at the time the sample was retrieved.
kg - kilogram Basic unit of mass in the metric system
kg/d – kilogram per day
Sunderland Water Pollution Control Plant Annual Performance Report 2015
Page 12 of 13
LSPRS - Lake Simcoe Phosphorus Reduction Strategy The ECA issued on June 28, 2012 introduced additional phosphorus objectives to comply with the requirements of the Lake Simcoe Phosphorus Reduction Strategy (2010) prepared under the Lake Simcoe Protection Plan (2009).
m3 - (Cubic Metre) Volume measurement, 1m3 = 1000 litres or 220 imperial gallons.
m3/d - (Cubic Metre Per Day) Flow measurement, 1m3 = 1000 litres or 220 imperial gallons. Volume of liquid treated in a 24 hour period.
Max. - Maximum Maximum Flow Rate
The peak or highest flow recorded during a specific time period usually in a 24 hour period. mg./L. - (Milligram Per Litre)
This is a measure of the concentration of a parameter in water, sometimes referred to as parts per million (ppm).
Min. - Minimum mm.-(millimetre)
Is a unit of length in the metric system, equal to one thousandth of a metre. MOECC - (Ministry of the Environment and Climate Change)
The Provincial regulatory agency responsible for overseeing the water and wastewater industries in Ontario. Their primary functions include approval for new or expanding facilities, inspections and investigations.
Monthly Average Concentration The arithmetic mean of all daily concentrations of a contaminant in the effluent sampled or measured, or both, during a calendar month.
Monthly Average Loading Is calculated by multiplying the monthly average concentration of a contaminant in the effluent sampled or measured, or both, during a calendar month.
N/A - Not Applicable N/D - No Discharge Peak Flow Rate
The maximum rate of sewage flow for which the plant or process unit was designed. pH
Index of hydrogen ion activity, pH is defined as the negative logarithm of hydrogen ion concentration in moles per litre. The pH may range from 0 – 14, where 0 is most acidic, 14 most basic and 7 neutral.
Rated Capacity The average daily flow for which the works are approved to handle.
Raw Influent Raw wastewater entering the water pollution control plant before treatment.
Seasonal Average Concentration The arithmetic mean of all daily concentrations of a contaminant in the effluent sampled or measured or both during the seasonal discharge period.
Sludge The settleable solids separated from liquids during processing.

Sunderland Water Pollution Control Plant Annual Performance Report 2015
Page 13 of 13
TAN - Total Ammonia Nitrogen Ammonia exists in two forms in the water: NH3 (this is called unionized ammonia ) NH4+ ( this is called ionized ammonia ) Together, these two forms of ammonia are called TAN which means total ammonia nitrogen.
Temp. – Temperature Total Annual Loading
Is calculated by adding the calculated total monthly load discharged each month during each seasonal dischargeperiod for each calendar year.
Total Monthly Loading Is calculated by multiplying the total monthly flow by the monthly average concentration.
TP - Total Phosphorus A laboratory analyses to determine the total amount of non-soluble and soluble phosphorus present in the wastewater.
TSS - Total Suspended Solids A laboratory analyses to measure particles that are larger than 2 microns found in the wastewater.
TS - Total Solids Is a measure of the suspended and dissolved solids in the wastewater and in biosolids.
WPCP - Water Pollution Control Plant A facility composed of a variety of treatment processes that collectively treat wastewater
If this information is required in an accessible format, please contact 1-800-372-1102 extension 3488
Uxbridge Brook Water Pollution Control Plant Annual Performance Report 2015
Uxbridge Brook Water Pollution Control Plant
Annual Performance Report 2015

Uxbridge Brook Water Pollution Control Plant Annual Performance Report 2015
The Regional Municipality of Durham
Uxbridge Brook Water Pollution Control Plant 2015 Annual Performance Report Environmental Compliance Approval (ECA): 8357-8CTQ5V Dated June 28, 2012 Environmental Compliance Approval (Air): 6581-67GRPR Dated December 10, 2004 The Uxbridge Brook Water Pollution Control Plant (WPCP) Performance Report provides staff, stakeholders and customers an overview of the performance of the Uxbridge Brook WPCP in 2015. Further, this report fulfills the annual reporting requirements of the Ontario Ministry of the Environment and Climate Change (MOECC). The performance report demonstrates the commitment of ensuring that the WPCP continues to deliver wastewater services to our customers in an environmentally responsible manner. For a description of terms and abbreviations used in this report, refer to the glossary at the end of the report.
Water Pollution Control Plant Process Description
General The Uxbridge Brook WPCP is owned and operated by the Regional Municipality of Durham in accordance with the terms and conditions of the ECA. The plant is located in the Township of Uxbridge. This MOECC Class Three wastewater treatment plant utilizes an extended aeration process with tertiary treatment and is designed to treat wastewater at a rated capacity of 5,221 cubic metres per day (m3/d). The Uxbridge Brook WPCP has a service population of 11,055 residents. Uxbridge Brook WPCP treats wastewater from the Uxbridge service area utilizing the following processes:
• preliminary treatment, • secondary treatment, • tertiary filtration, • disinfection, • aerobic digestion.
Raw Influent Wastewater is collected through approximately 50 km of sanitary sewers in Uxbridge and is conveyed to the WPCP by gravity and one sanitary sewage pumping station (Sandy Hook).
Preliminary Treatment Screening: There are two screens in the screening room for the removal of paper products and large material that could harm pumps and process equipment. One channel contains an automatic, mechanically cleaned bar screen and the other is equipped with a manually raked bar screen to provide screening on an emergency basis. Screenings are transported to landfill for disposal. Grit Removal: Vortex grit removal is provided to remove sand, gravel, etc. for protection of mechanical equipment from unnecessary wear and reduce formation of heavy deposits in pipelines, channels and process tanks. The vortex grit removal chamber uses centrifugal force to separate the
Page 2 of 17

Uxbridge Brook Water Pollution Control Plant Annual Performance Report 2015
grit from the wastewater. Grit is collected in the lower portion of the grit tank and is pumped to a grit classifier for dewatering. The dewatered grit is conveyed to the grit/screenings bin for landfill disposal.
Secondary Treatment Aeration Tanks: Preliminary effluent flow is directed to two aeration tanks. Aluminum sulphate is added to the aeration tanks to react with and remove phosphorus. Fine bubbled air is diffused into the sewage to remove dissolved and suspended solids and nutrients from the wastewater. Biological activity is controlled to assimilate the organic material. Secondary Clarifiers: The effluent from the aeration tank is directed to three secondary clarifiers where it settles quickly as an activated (living) sludge leaving a clear effluent to overflow the clarifier. The activated sludge collected on the bottom of the clarifier is pumped back to the head of the aeration tanks. The microorganisms are returned to repeat the process. Any excess activated sludge is ‘wasted’ to the aerobic digester.
Tertiary Treatment Tertiary Sand Filter: Effluent from the secondary clarifiers is filtered through two automatic self cleaning sand filters. The automatic backwash is triggered by an increase in head pressure or on a programmed timer. The backwash water is returned to the head of the plant for further treatment.
Disinfection Ultra Violet (UV) Irradiation: The effluent flow from the sand filter is then directed to the UV system channel for disinfection. The effluent passes two banks of UV lamps connected in series. The treated effluent is discharged to the Uxbridge Brook. Aerobic Digester: Waste activated sludge from the secondary clarifiers is pumped to a two stage aerobic digestor for stabilization. A coarse bubble diffuser provides oxygen for the microrganisms. The diffusers are turned off to allow solids to settle for removal and the supernatant is returned to the head of the plant for further treatment. Biosolids: Stabilized biosolids from the digester are transported plant to plant within the Region of Durham for further treatment, stabilization or incineration in accordance with ECA #A820250.
Environmental Compliance Approval Under Condition 9 (5) of ECA #8357-8CTQ5V the Region of Durham must produce an annual report that must contain the following information:
a) Summary and interpretation of all monitoring data and a comparison to the effluent limits outlined in Condition 5, including an overview of the success and adequacy of the works The raw wastewater flowing into the plant is analyzed for its chemical and physical composition. Monitoring of the raw wastewater is performed in accordance with the conditions in the ECA. Table 2 summarizes the raw wastewater characteristics during the reporting period.
Page 3 of 17

Uxbridge Brook Water Pollution Control Plant Annual Performance Report 2015
The Uxbridge Brook WPCP effluent was compliant with the approval limits during the reporting period. The plant operated at 77.7% of its rated capacity and received a maximum daily flow of 5,923 m3/d on June 28th, 2015. Tables 3 and 4 provide a tabulation of effluent results.
b) Description of any operating problems encountered and corrective actions taken: No operating problems were encountered in 2015
c) Maintenance of major equipment No major maintenance items occurred in 2015.
d) Summary of any effluent quality assurance or control measures In-house lab test results are compared to the results of the Regional Environmental Laboratory on comparable samples to determine the in-house accuracy. Results were found to be in a comparable range. On-line instrumentation is verified by WPCP operators using various field or laboratory test equipment.
e) Summary of the calibration and maintenance carried out on all effluent monitoring equipment
• Calibration of the plant flow meters occurred in June and October 2015. • All monitoring and laboratory equipment is calibrated and maintained according to
manufacturer’s specifications. f) Efforts made and results achieved in meeting the effluent objectives • The Regional Municipality of Durham strives to achieve the best effluent quality at all times,
remaining below the ECA compliance limits. • The annual average daily flow did not exceed the rated capacity of 5,221m3/d during the
reporting period . The peak flow rate of 15,110 m3/d was never exceeded. • The effluent objective for total suspended solids was exceeded once on January 14th . • The effluent objective for total ammonia nitrogen was exceeded twice, May 14th and 15th. • The effluent objective for total phosphorus was exceeded 28 times of 312 samples (9%).
Aluminum sulphate dosage was increased to accommodate. • The minimum effluent objective for pH was exceeded 41 times of 265 samples (15.5%). 24
of the exceedances occurred during the months of January and February. The techniques for calibration and measurement were reviewed at this time. Regular maintenance and cleaning of the probe electrode was performed with continuous monitoring for the remainder of the year.
• Best efforts and process adjustments will continue to be applied to maintain results below objectives.
g) Sludge Generated A summary of the sludge volume generated in the reporting period is included in Table 5. There is no increase of sludge volume expected in the next reporting period.
h) Complaints A summary of complaints received from the public is administered through a central database. There were no complaints received during the reporting period.
Page 4 of 17

Uxbridge Brook Water Pollution Control Plant Annual Performance Report 2015
i) By-passes No by-passes, spills or abnormal discharges occurred during the reporting period.
j) Initial Effluent Characterization The initial effluent characterization sampling was conducted during 2015 with a completion date of October 13th, 2015. A report will be submitted in April, 2016 as per Condition 8 (3) of the ECA.
k) Information Required by MOECC Water Supervisor No additional information required.
Proposed Alterations, Extensions or Replacements No proposed alterations, extensions or replacements. MOECC Inspection This plant was not inspected by the MOECC in 2015.
Page 5 of 17

Uxbridge Brook Water Pollution Control Plant Annual Performance Report 2015
Summary of Tables Table 1 Flows
Month Plant Flow m3 Average Daily
Flow m3/d Maximum Daily
Flow m3/d
January 117,224 3,781 4,775
February 99,648 3,559 3,774
March 122,500 3,952 4,533
April 134,318 4,477 5,060
May 131,303 4,236 5,697
June 140,206 4,539 5,923
July 136,912 4,417 5,171
August 123,240 3,975 4,319
September 116,024 3,867 4,547
October 122,300 3,945 4,823
November 127,244 4,241 4,621
December 110,555 3,566 3,855
Total 1,481,474 N/A N/A
Average 123,456 4,059* N/A
Minimum 99,648 N/A N/A
Maximum 140,206 N/A 5,923
ECA Requirement
N/A 5,221 15,110
Met Compliance N/A Yes Yes
*Annual average
Page 6 of 17

Uxbridge Brook Water Pollution Control Plant Annual Performance Report 2015
Table 2 Raw Influent Analyses
Month
BOD5 avg.
conc. mg/L
BOD5 loading
kg/d
TSS avg. conc. mg/L
TSS loading
kg/d
TP avg. conc. mg/L
TP loading
kg/d
DP avg.
conc. mg/L
January 225 851 219 828 4.9 19 2.0
February 219 779 232 826 6.2 22 2.6
March 188 743 240 948 4.4 17 1.9
April 159 712 206 922 3.9 17 1.7
May 147 623 233 987 4.0 17 1.7
June 202 917 243 1,103 4.5 20 1.9
July 194 857 223 985 4.5 20 1.8
August 188 747 225 894 4.0 16 2.0
September 198 766 228 882 4.6 18 1.9
October 156 615 155 611 3.9 15 1.9
November 115 488 162 687 3.8 16 2.4
December 143 510 119 424 4.0 14 2.3
Average 178 722 207 841 4.4 18 2.0
Minimum 115 488 119 424 3.8 14 1.7
Maximum 225 917 243 1,103 6.2 22 2.6
Sampling Frequency Requirement Met
Yes N/A Yes N/A Yes N/A Yes
Page 7 of 17

Uxbridge Brook Water Pollution Control Plant Annual Performance Report 2015
Table 2 Raw Influent Analyses continued
Month TKN avg.
conc. mg/L
TKN loading
kg/d
TAN avg.
conc. mg/L
TAN loading
kg/d
Alkal-inity
CaCO3 mg/L
pH min.
pH max.
Temp. Degrees Celsius
min.
Temp. Degrees Celsius
max. January 37.03 140 25.0 94.5 352 7.1 8.5 11.2 13.8
February 45.98 164 29.5 105.0 338 7.2 7.5 5.6 10.6
March 25.32 100 23.0 90.9 309 7.8 8.3 10.4 15.2
April 33.42 150 21.7 97.2 327 7.6 8.4 11.5 14.4
May 31.40 133 22.0 93.2 324 7.3 8.3 13.9 16.9
June 36.50 166 22.8 103.5 330 7.3 8.4 14.8 19.7
July 38.05 168 24.4 107.8 337 7.4 8.2 15.5 20.4
August 34.98 139 23.4 93.0 327 7.5 8.3 17.8 20.4
September 36.26 140 24.3 94.0 327 7.0 8.4 17.9 21.0
October 35.38 140 23.8 93.9 334 6.7 8.4 16.1 18.2
November 33.23 141 24.0 101.8 330 7.6 8.6 13.8 18.7
December 35.50 127 25.2 89.9 337 7.0 8.5 12.8 17.5
Average 35.25 143 24.1 97.8 331 N/A N/A N/A N/A
Minimum 25.32 100 21.7 89.9 309 6.7 N/A 5.6 N/A
Maximum 45.98 168 29.5 107.8 352 N/A 8.6 N/A 21.0
Sampling Frequency Requirement Met
Yes N/A Yes N/A Yes Yes Yes Yes Yes
Page 8 of 17

Uxbridge Brook Water Pollution Control Plant Annual Performance Report 2015
Table 3 Final Effluent Analyses
Month
CBOD5 avg.
conc. mg/L
CBOD5 loading monthly avg kg/d
TSS avg. conc. mg/L
TSS loading monthly avg. kg/d
TP avg. conc. mg/L
TP loading
avg. kg/d
TP loading
kg/month
January 0.7 2.6 2.2 8.3 0.03 0.11 4
February 0.8 2.8 2.6 9.3 0.08 0.28 8
March 1.4 5.5 1.7 6.7 0.10 0.40 12
April 1.3 5.8 2.0 9.0 0.10 0.45 13
May 0.7 3.0 1.8 7.6 0.06 0.25 8
June 0.6 2.8 1.3 5.9 0.03 0.14 4
July 0.5 2.2 0.8 3.5 0.03 0.13 4
August 0.7 2.8 1.0 4.0 0.03 0.12 4
September 0.5 1.9 1.5 5.8 0.03 0.12 3
October 0.7 2.8 1.2 4.7 0.03 0.12 4
November 0.8 3.4 1.4 5.9 0.05 0.21 6
December 0.7 2.5 1.4 5.0 0.04 0.14 4
Total N/A N/A N/A N/A N/A N/A 75*
Average 0.8 3.2 1.6 6.4 0.05 0.21 6
Minimum 0.5 1.9 0.8 3.5 0.03 0.11 3
Maximum 1.4 5.8 2.6 9.3 0.10 0.45 13
ECA Limit 8.5** 30.9**** 10** 36.3**** 0.15** 0.78**** 286*
ECA Objective 5 N/A 5 N/A 0.1 N/A N/A
LSPRS N/A N/A N/A N/A 0.15*** N/A 286*
Within Compliance
Yes Yes Yes Yes Yes Yes Yes
Sampling Frequency Requirement Met
Yes N/A Yes N/A Yes Yes N/A
*Total Annual Loading, kg/year **Monthly Average Concentration ***Annual Average Concentration ****Annual Average Loading,kg/day *****Monthly Average Loading,kg/day
Page 9 of 17
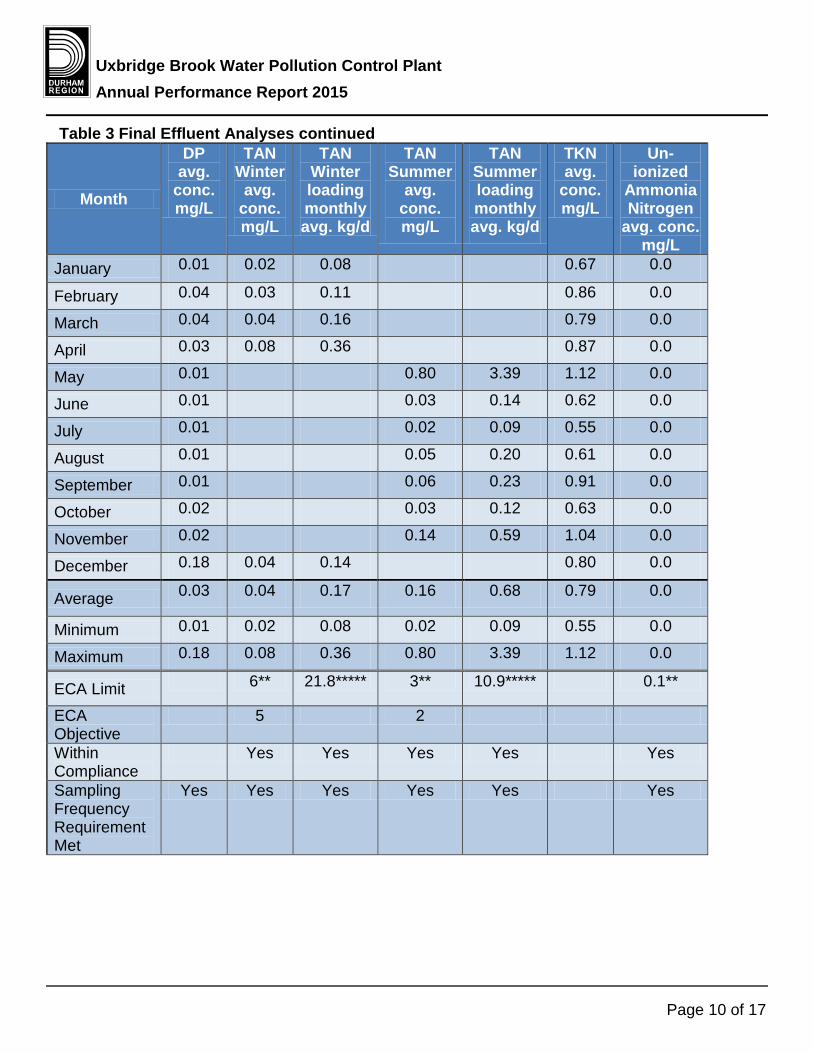
Uxbridge Brook Water Pollution Control Plant Annual Performance Report 2015
Table 3 Final Effluent Analyses continued
Month
DP avg.
conc. mg/L
TAN Winter
avg. conc. mg/L
TAN Winter loading monthly avg. kg/d
TAN Summer
avg. conc. mg/L
TAN Summer loading monthly avg. kg/d
TKN avg.
conc. mg/L
Un-ionized
Ammonia Nitrogen
avg. conc. mg/L
January 0.01 0.02 0.08 N/A N/A 0.67 0.0
February 0.04 0.03 0.11 N/A N/A 0.86 0.0
March 0.04 0.04 0.16 N/A N/A 0.79 0.0
April 0.03 0.08 0.36 N/A N/A 0.87 0.0
May 0.01 N/A N/A 0.80 3.39 1.12 0.0
June 0.01 N/A N/A 0.03 0.14 0.62 0.0
July 0.01 N/A N/A 0.02 0.09 0.55 0.0
August 0.01 N/A N/A 0.05 0.20 0.61 0.0
September 0.01 N/A N/A 0.06 0.23 0.91 0.0
October 0.02 N/A N/A 0.03 0.12 0.63 0.0
November 0.02 N/A N/A 0.14 0.59 1.04 0.0
December 0.18 0.04 0.14 N/A N/A 0.80 0.0
Average 0.03 0.04 0.17 0.16 0.68 0.79 0.0
Minimum 0.01 0.02 0.08 0.02 0.09 0.55 0.0
Maximum 0.18 0.08 0.36 0.80 3.39 1.12 0.0
ECA Limit N/A 6** 21.8***** 3** 10.9***** N/A 0.1**
ECA Objective
N/A 5 N/A 2 N/A N/A N/A
Within Compliance
N/A Yes Yes Yes Yes N/A Yes
Sampling Frequency Requirement Met
Yes Yes Yes Yes Yes N/A Yes
Page 10 of 17
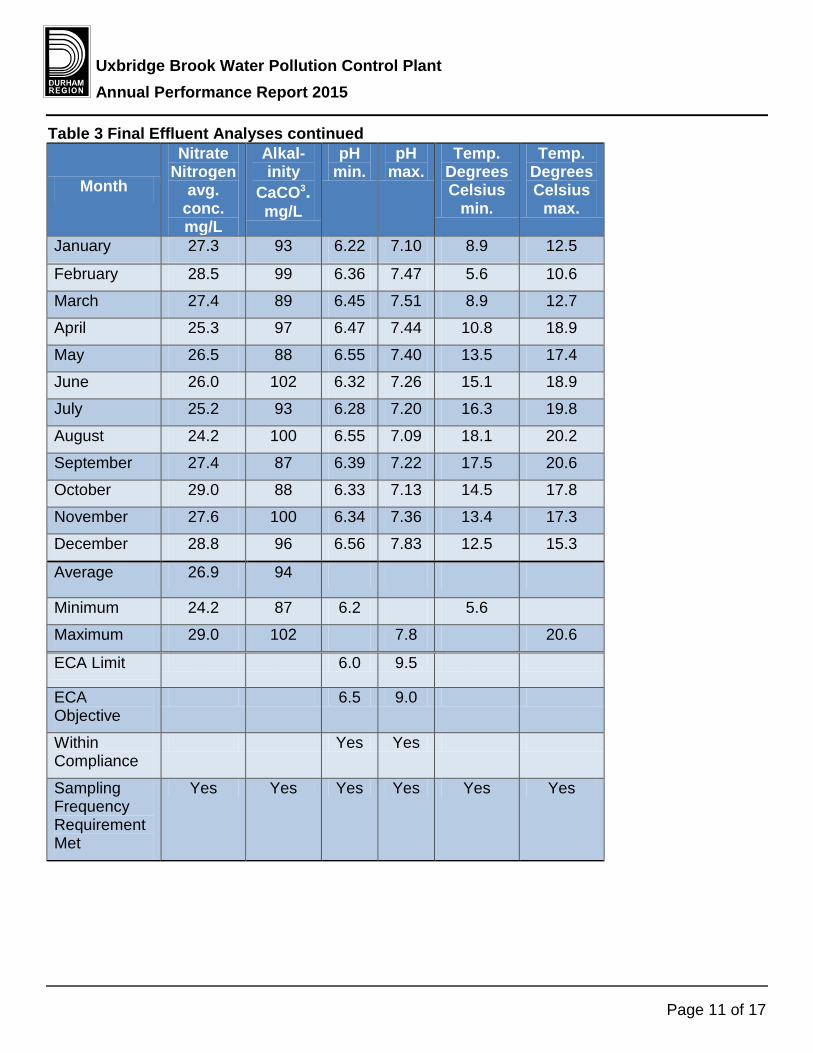
Uxbridge Brook Water Pollution Control Plant Annual Performance Report 2015
Table 3 Final Effluent Analyses continued
Month
Nitrate Nitrogen
avg. conc. mg/L
Alkal-inity
CaCO3. mg/L
pH min.
pH max.
Temp. Degrees Celsius
min.
Temp. Degrees Celsius
max.
January 27.3 93 6.22 7.10 8.9 12.5
February 28.5 99 6.36 7.47 5.6 10.6
March 27.4 89 6.45 7.51 8.9 12.7
April 25.3 97 6.47 7.44 10.8 18.9
May 26.5 88 6.55 7.40 13.5 17.4
June 26.0 102 6.32 7.26 15.1 18.9
July 25.2 93 6.28 7.20 16.3 19.8
August 24.2 100 6.55 7.09 18.1 20.2
September 27.4 87 6.39 7.22 17.5 20.6
October 29.0 88 6.33 7.13 14.5 17.8
November 27.6 100 6.34 7.36 13.4 17.3
December 28.8 96 6.56 7.83 12.5 15.3
Average 26.9 94 N/A N/A N/A N/A
Minimum 24.2 87 6.2 N/A 5.6 N/A
Maximum 29.0 102 N/A 7.8 20.6
ECA Limit N/A N/A 6.0 9.5 N/A N/A
ECA Objective
N/A N/A 6.5 9.0 N/A N/A
Within Compliance
N/A N/A Yes Yes N/A N/A
Sampling Frequency Requirement Met
Yes Yes Yes Yes Yes Yes
Page 11 of 17
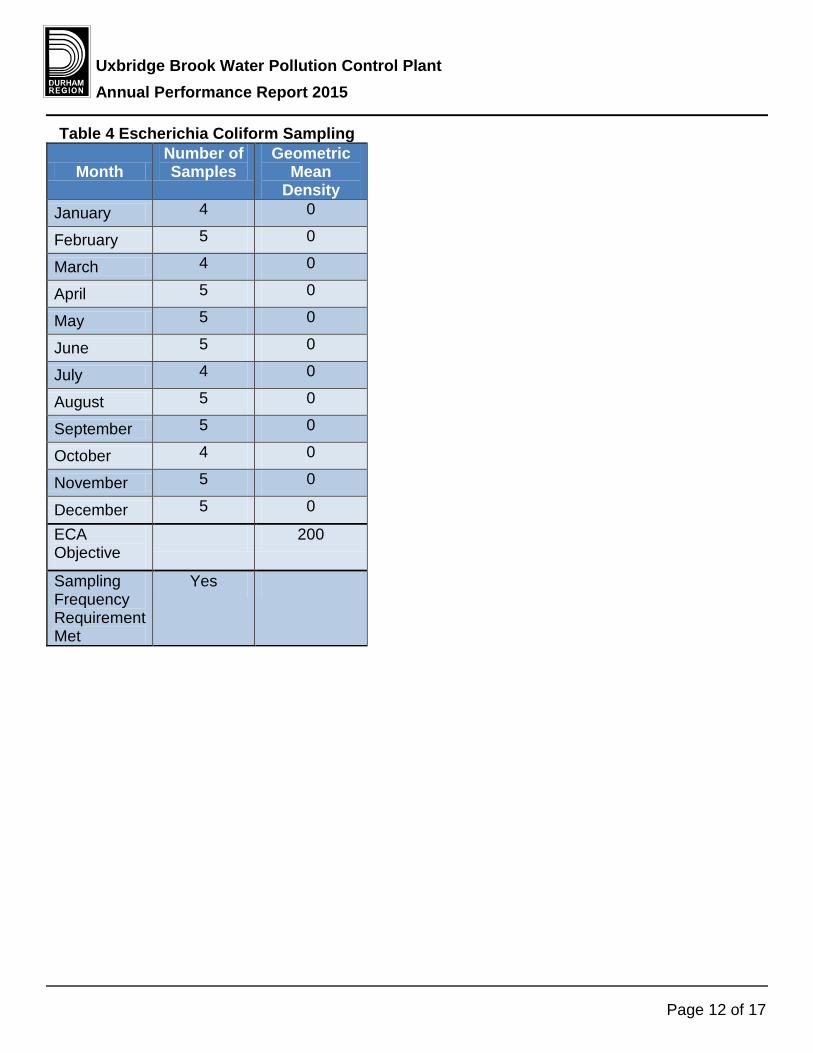
Uxbridge Brook Water Pollution Control Plant Annual Performance Report 2015
Table 4 Escherichia Coliform Sampling
Month Number of Samples
Geometric Mean
Density January 4 0
February 5 0
March 4 0
April 5 0
May 5 0
June 5 0
July 4 0
August 5 0
September 5 0
October 4 0
November 5 0
December 5 0
ECA Objective
N/A 200
Sampling Frequency Requirement Met
Yes N/A
Page 12 of 17
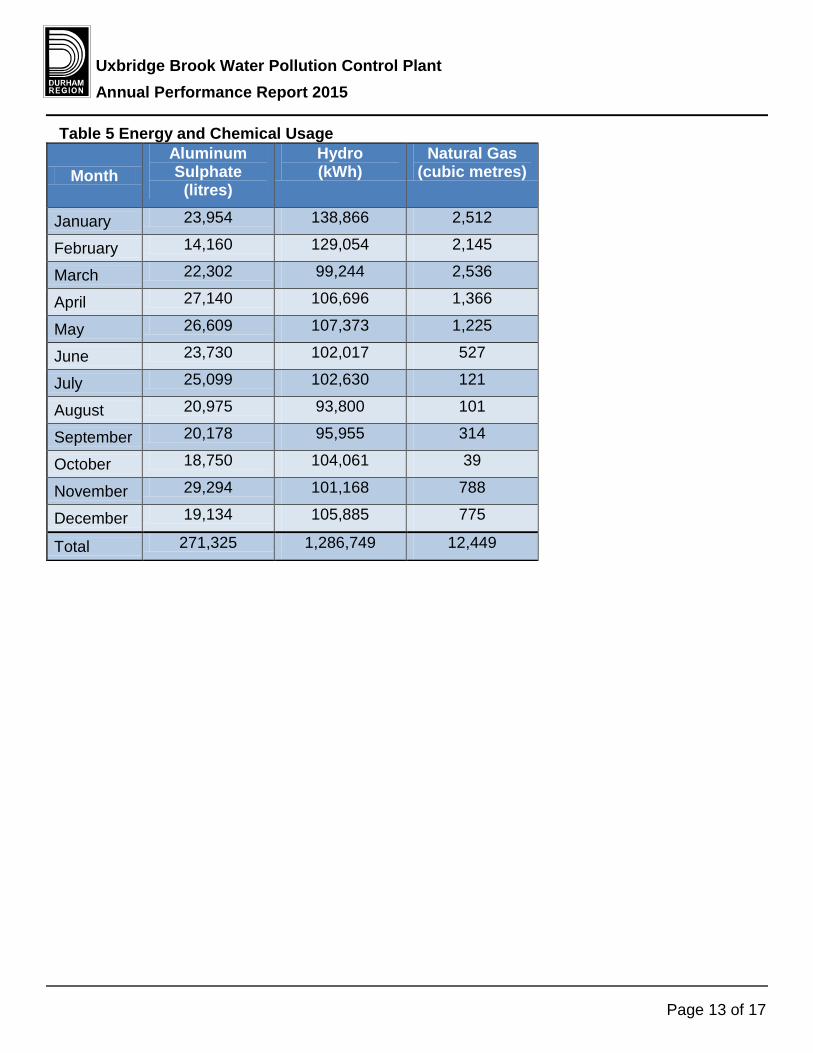
Uxbridge Brook Water Pollution Control Plant Annual Performance Report 2015
Table 5 Energy and Chemical Usage
Month Aluminum Sulphate
(litres)
Hydro (kWh)
Natural Gas (cubic metres)
January 23,954 138,866 2,512
February 14,160 129,054 2,145
March 22,302 99,244 2,536
April 27,140 106,696 1,366
May 26,609 107,373 1,225
June 23,730 102,017 527
July 25,099 102,630 121
August 20,975 93,800 101
September 20,178 95,955 314
October 18,750 104,061 39
November 29,294 101,168 788
December 19,134 105,885 775
Total 271,325 1,286,749 12,449
Page 13 of 17

Uxbridge Brook Water Pollution Control Plant Annual Performance Report 2015
Table 6 Summary of the Solids Produced
Month
Total Hauled (cubic
metres)
Total Solids
%
Hauled to
Duffin Creek WPCP
January 1,200 1.65 1,200
February 960 1.76 960
March 1,160 1.48 1,160
April 1,240 1.49 1,240
May 1,360 1.22 1,360
June 1,680 1.10 1,680
July 1,360 1.50 1,360
August 920 1.55 920
September 1,160 1.76 1,160
October 1,160 1.08 1,160
November 1,160 0.94 1,160
December 1,240 1.21 1,240
Total 14,760 N/A 14,760
Page 14 of 17

Uxbridge Brook Water Pollution Control Plant Annual Performance Report 2015
Glossary of Terms Annual Average Concentration
An arithmetic mean of the monthly average concentrations of a contaminant in the effluent calculated for any particular year.
Annual Average Loading The value obtained by multiplying the annual average concentration of a contaminant by the average daily flow over the same calendar year.
Average Daily Flow The cumulative total sewage flow to the sewage works during a calendar year divided by the number of days during which sewage was flowing to the sewage works that year.
Avg – Average An arithemetic mean of the average concentrations and loadings.
Biosolids Organic material recovered from wastewater sludge.
Bioreactor A bioreactor is a vessel in which a biological process is carried out which involves bacterial organisms or biochemically active substances derived from such organisms.
BOD5 Five Day Biochemical Oxygen Demand (also known as total BOD5) a five day biochemical oxygen demand measured in an unfiltered sample and includes carbonaceous and nitrogenous oxygen demand.
By-pass Any discharge from the works that does not undergo any treatment or only undergoes partial treatment before it is discharged to the environment.
CBOD5 -Five Day Carbonaceous Biochemical Oxygen Demand A five day carbonaceous (nitrification inhibited) biochemical oxygen demand measured in an unfiltered sample..
Conc. - Concentration The abundance of a constituent divided by the total volume of a mixture.
Daily Concentration The concentration of a contaminant in the effluent discharged over any single day, as measured by a composite or grab sample, whichever is required.
DP - Dissolved Phosphorus This is the soluble form of phosphorus present in the wastewater.
ECA - Environmental Compliance Approval The primary regulatory instrument for each water pollution control plant.
E. - coli - (Escherichia coli) Refers to the thermally tolerant forms of Escherichia that can survive at 44.5 degrees Celsius.
Final Effluent Sewage discharge through the water pollution control plant outfall after undergoing the full train of unit processes as listed in the Environmental Compliance Approval.
Geometric Mean Density Is the nth root of the product of multiplication of the results of n number of samples over the period specified.
Page 15 of 17

Uxbridge Brook Water Pollution Control Plant Annual Performance Report 2015
Grab Sample A single sample taken at a specific moment in time, when tested provides a snapshot of the conditions at the time the sample was retrieved.
kg - kilogram Basic unit of mass in the metric system
kg/d – kilogram per day LSPRS - Lake Simcoe Phosphorus Reduction Strategy
The ECA issued on June 28, 2012 introduced additional phosphorus objectives to comply with the requirements of the Lake Simcoe Phosphorus Reduction Strategy (2010) prepared under the Lake Simcoe Protection Plan (2009).
m3 - (Cubic Metre) Volume measurement, 1m3 = 1000 litres or 220 imperial gallons.
m3/d - (Cubic Metre Per Day) Flow measurement, 1m3 = 1000litres or 220 imperial gallons. Volume of liquid treated in a 24 hour period.
Max. - Maximum Maximum Flow Rate
The peak or highest flow recorded during a specific time period usually in a 24 hour period. mg/L - (Milligram Per Litre)
This is a measure of the concentration of a parameter in water, sometimes referred to as parts per million (ppm).
Min. - Minimum mm.-(millimetre)
Is a unit of length in the metric system, equal to one thousandth of a metre. MOECC - (Ministry of the Environment and Climate Change)
The Provincial regulatory agency responsible for overseeing the water and wastewater industries in Ontario. Their primary functions include approval for new or expanding facilities, inspections and investigations.
Monthly average concentration The arithmetic mean of all daily concentrations of a contaminant in the effluent sampled or measured, or both, during a calendar month.
Monthly average loading Is calculated by multiplying the monthly average concentration of a contaminant by the monthly average daily flow over the same calendar month.
Nitrate Nitrogen
Is a salt or ester of nitric acid, containing the NO3 ion. Nitrates are the most water soluble of salts, and play a major part in the nitrogen cycle and nitrate pollution.
N/A - Not Applicable Peak Flow Rate
The maximum rate of sewage flow for which the plant or process unit was designed. pH
Index of hydrogen ion activity, pH is defined as the negative logarithm of hydrogen ion concentration in moles per litre. The pH may range from 0 – 14, where 0 is most acidic, 14 most basic and 7 neutral.
Page 16 of 17
Uxbridge Brook Water Pollution Control Plant Annual Performance Report 2015
Rated Capacity The average daily flow for which the works are approved to handle.
Raw Influent Raw wastewater entering the water pollution control plant before treatment.
Septage Partially treated sludge from a septic tank.
Sludge The settleable solids separated from liquids during processing.
TAN - Total Ammonia Nitrogen Ammonia exists in two forms in the water: NH3 (this is called unionized ammonia ) NH4+ ( this is called ionized ammonia ) Together, these two forms of ammonia are called TAN which means total ammonia nitrogen.
Temp. – Temperature Total Annual Loading
Is calculated by adding the calculated total monthly load discharged for each calendar year. Total Monthly Loading
Is calculated by multiplying the total monthly flow by the monthly average concentration. TP - Total Phosphorus
A laboratory analyses to determine the total amount of non-soluble and soluble phosphorus present in the wastewater.
TSS - Total Suspended Solids A laboratory analyses to measure particles that are larger than 2 microns found in the wastewater.
TS - Total Solids Is a measure of the suspended and dissolved solids in the wastewater and in biosolids.
Unionized Ammonia Nitrogen Un-ionized ammonia refers to all forms of ammonia in water with the exception of the ammonium ion (NH4 +).
WPCP - Water Pollution Control Plant A facility composed of a variety of treatment processes that collectively treat wastewater
If this information is required in an accessible format, please contact 1-800-372-1102 extension 3488
Page 17 of 17