carbon footprint of the raw materials of an urban …
TRANSCRIPT
CARBON FOOTPRINT OF THE RAW
MATERIALS OF AN URBAN TRANSIT
BUS
Case Study: Diesel, Hybrid, Electric and Converted Electric Bus
LAHTI UNIVERSITY OF APPLIED
SCIENCES
Degree Programme in Environmental
Technology
Environmental Engineering
Bachelor’s Thesis
Autumn 2012
Päivi Kärnä

Lahti University of Applied Sciences
Degree Programme in Environmental Technology
KÄRNÄ, PÄIVI: Carbon Footprint of the Raw Materials of
an Urban Transit Bus
Case study: Diesel, Hybrid, Electric and
Converted Electric Bus
Bachelor’s Thesis 51 pages, 10 pages of appendices
in Environmental Engineering
Autumn 2012
ABSTRACT
The environmental impacts of a bus have been studied by concentrating notably
on the carbon footprint caused during the operation of a bus. It is understandable,
since the majority of the emissions are produced during the use. The results of this
study, however, provide some in-depth information about the emissions of the
first phase of a bus' life cycle, raw material extraction and pre-processing.
In this study, the raw materials of four bus types were investigated with the help
of five case studies. Based on this data, the amounts of the most common
greenhouse gases per the materials of one bus were calculated. The bus types in
this study are two diesels, a hybrid, an electric and a converted electric bus. The
examples examined in the study are 12-meter-long buses meant for urban traffic.
The study was conducted by utilizing the Product Life Cycle Accounting and
Reporting Standard by GHG Protocol, and EcoInvent database.
According to the results of this study, the factors which affect the material carbon
footprint of a bus most are the choice of the main raw material and the amount of
different electric components. Also the amount of double glass, which is used in
windows for safety, causes notable greenhouse gases to all of the case buses. The
results of this study are meant to be combined with other studies describing the
life cycle of a bus in order to draw a clear picture of the environmental impact of a
bus.
The data for this study has been produced as a part of the EcoMill project.
Key words: material carbon footprint, bus, greenhouse gas emissions, kg CO2e

Lahden ammattikorkeakoulu
Ympäristöteknologian koulutusohjelma
KÄRNÄ, PÄIVI: Kaupunkilinja-auton raaka-aineiden
hiilijalanjälki
Tapaustutkimus: diesel-, hybridi-, sähkö-
ja konversiosähkölinja-auto
Ympäristötekniikan opinnäytetyö 51 sivua, 10 liitesivua
Syksy 2012
TIIVISTELMÄ
Linja-auton ympäristövaikutuksia on tutkittu keskittymällä pääasiassa
käytönaikaiseen hiilijalanjälkeen. Tämä on ymmärrettävää, sillä suurin osa
päästöistä syntyy käytössä. Tämän tutkimuksen tulokset antavat syventävää tietoa
linja-auton elinkaaren ensimmäisestä vaiheesta: raaka-aineiden erotuksesta ja
esikäsittelystä.
Tässä tutkimuksessa on selvitetty neljän linja-autotyypin raaka-aineiden määrät
hyödyntäen viittä tapaustutkimusta. Yleisimpien kasvihuonekaasupäästöjen
määrät linja-auton materiaaleja kohti on laskettu näiden tulosten pohjalta. Tutkitut
linja-autotyypit ovat kaksi diesellinja-autoa sekä hybridi-, sähkö- ja
konversiosähkölinja-auto. Tutkimuksessa tarkastellut esimerkit ovat
kaupunkiliikenteessä käytettäviä 12-metrisiä linja-autoja. Tutkimuksen
toteutuksessa on käytetty Product Life Cycle Accounting and Reporting
-standardin GHG Protocol -ohjeistusta sekä EcoInvent-tietokantaa.
Tutkimuksen tulosten mukaan pääraaka-ainevalinta ja elektroniikan määrä
vaikuttavat eniten linja-auton materiaalihiilijalanjälkeen. Myös ikkunoissa
turvallisuuden takia käytettävä tuplalasi aiheuttaa huomattavasti
kasvihuonekaasupäästöjä kaikissa tapaustutkimuksen linja-autoissa. Tämän
tutkimuksen tulokset on tarkoitettu yhdistettäväksi muiden linja-auton elinkaarta
tarkastelevien tutkimusten kanssa, jotta voitaisiin muodostaa selkeä kuva linja-
auton ympäristövaikutuksista.
Tutkimuksessa käytetty aineisto on tuotettu EcoMill-projektissa.
Asiasanat: materiaalihiilijalanjälki, linja-auto, kasvihuonekaasupäästöt, kg CO2e

PERSONAL COMMENT AND ACKNOWLEDGEMENTS
My personal goal while conducting this work was to sum up the whole four years
of studies and the main insight I learned during this time: everything we people do
has an environmental impact. When we eat, live or travel, we spend natural
resources and cause pollution.
It is the same with a bus. A bus is an example of a product which consists of
thousands of parts, which someone has produced in order to combine them
together. The raw materials of each part have been acquired and pre-processed in
order to manufacture the part. I hope the readers of this work will understand at
least some of the environmental impacts caused by the manufacture of products.
Maybe understanding will change behavior.
I would like to thank all the friendly people, who took part in making this study.
There were company representatives, researchers, teachers and friends to give me
the needed support to conduct this work. I thank you,
- Reetta Jänis, Project leader in EcoMill project, for being a role model for me
- Company representatives, subcontractors and researchers for providing data
- Anastasia Sipari from Bionova
- Fellow students and friends: Arttu Vanninen, Jukka Tapio from LUAS
- My inspiring trumpet mentor, Rikupetteri Aaltonen, for cheering me up when
the work was not progressing
- Other project workers of EcoMill: Maarit Virtanen and Susanna Vanhamäki
- Teachers of LUAS: thesis supervisor Sakari Autio, Maija Varala language
supervisor

CONTENTS
ABBREVIATIONS
GLOSSARY
1 INTRODUCTION 1
2 BACKGROUND OF THE STUDIED BUSES 3
2.1 Short description of a bus 3
2.2 Bus types 4
2.2.1 Buses used in Finland 5
2.2.2 Description of bus types studied in the case 5
3 PREVIOUS STUDIES 7
3.1 Introduction to previous studies 7
3.2 Studies in Finland 7
3.3 Foreign studies 8
3.4 Evaluation of previous studies 10
4 METHOD 12
4.1 Life cycle assessment and environmental impact indicators 12
4.2 Tools for perfoming LCA 13
4.3 Basic definitions of a material carbon footprint study 14
4.3.1 Scope and system boundary of the study 15
4.3.2 Explanation of the scope outline 16
4.4 Steps of conducting the study in accordance to method 17
5 CASE STUDY DATA AND CLASSIFICATION 18
5.1 Case buses 18
5.2 Trisection of the bus composition 19
5.3 Material classification 20
5.3.1 Classical material classification 20
5.3.2 Material classification in the case study 21
5.3.3 Extraction and pre-processing examples 22
6 MATERIAL CARBON FOOTPRINT CALCULATIONS 25
6.1 Conducting of the calculations 25
6.1.1 Equation for material carbon footprint 26
6.1.2 Excluded from the calculations 27
7 MATERIAL CARBON FOOTPRINT RESULTS 28
7.1 Deeper look into the results 30
7.1.1 Effect of metal choice on the material carbon footprint 33
7.1.2 Material carbon footprint by part division 35
7.2 Data quality and sensitivity analysis 37
8 COMBINING THE CASE STUDY WITH PREVIOUS STUDIES 39
9 EVALUATION 40
9.1 Evaluation of the topic and the method 40
9.2 Evaluation of the calculations 41
10 CONCLUSION 43
11 PROPOSALS FOR FUTURE WORK 45
REFERENCES 46
APPENDICES 52

ABBREVIATIONS
CH4 – Methane
CNG – Compressed natural gas
CO2 – Carbon dioxide
CO2e – Carbon dioxide equivalent
EIO-LCA – Economic input-output life cycle assessment
GWP – Global warming potential
GHG – Greenhouse gas
HFC – hydrofluorocarbon
HSL – Helsinki Region Transport (Helsingin seudun liikenne)
ICE – Internal combustion engine
ISO – International Standardization Organization
LCA – Life cycle assessment
LCI – Life cycle inventory
Li-Ion – Lithium ion
MIPS – Material input per service unit
N2O – Nitrous oxide
NOx – Nitrogen oxides
PFC – Perfluorocarbon
PKT – Passenger kilometres traveled
SF6 – Sulfur hexafluoride

SO2 – Sulfur dioxide
SOx – Sulfur oxides
VTT – Technical Research Center of Finland (Valtion teknillinen tutkimuslaitos)

GLOSSARY
Acidification potential Potential of SO2, NOx, HCl, NH3 and HF to
contribute to the potential acid deposition, i.e. to form
H+ ions.
Activity data Information which can be measured, modeled or
calculated. It is the quantitative data of the activity
leading into GHG emissions. In this study, activity
data refers to the mass of the material (kg).
Carbon dioxide
equivalent (CO2e)
Unit for comparing the radiative forcing of a GHG to
carbon dioxide. The carbon dioxide equivalent is
calculated using the mass of a given GHG multiplied
by its global warming potential.
Eutrophical potential The potential to cause over-fertilization of water and
soil, which can result in increased growth of biomass.
Function The service provided by the studied product.
Functional unit The quantified performance of the studied product.
Global warming
potential (GWP)
Value calculated as a sum of emissions of greenhouse
gases multiplied by their respective GWP factors.
GWP factor Factor describing the radiative forcing impact of one
mass-based unit of a given GHG relative to an
equivalent unit of carbon dioxide over a given period
of time.
Iterative process
A process for arriving at a decision or a desired result
by repeating rounds of analysis or a cycle of
operations. The objective is to bring the desired
decision or result closer to discovery with each
repetition.

Life cycle assessment A technique to assess environmental impacts
associated with all the stages of a product’s life cycle.
Life cycle inventory Quantification of inputs and outputs of a system.
Material acquisition
and pre-processing
Life cycle stage that begins when resources are
extracted from nature and ends when the product
components enter the gate of the studied product’s
production facility
Material input per
service unit (MIPS)
A concept used to estimate environmental impacts
caused by material input from products. Can be
calculated for abiotic and biotic impact, or as impact
on the water, earth movement and air.
Passenger kilometres
traveled
A distance travelled by all passengers.
Powertrain Group of components which generate the power and
cause the motion of the vehicle.
Product life cycle Phases of a product’s life. Consists of the following
phases: raw material acquisition, pre-processing,
manufacture, distribution and storage, use and end-of-
life.
Scope A chosen range, within which the study is conducted.
Secondary data Process data that are not from specific processes in
the studied product’s life cycle.
System boundary System boundary defines the scope in a more specific
level. It indicates which processes are included and
excluded in the study.

1 INTRODUCTION
The growth of the number of vehicles has resulted in an increase in the passenger
mileage. The average of the kilometers travelled in Finland was 51 800 km for
buses in the year 2006. (Tilastokeskus a 2007.) In the year 2011 the number of
registered buses in Finland was about 14 200 (Tilastokeskus c 2012). The amount
of greenhouse gas (GHG) emissions caused by traffic was about one fifth of the
total emissions in Finland in the year 2009 (Tilastokeskus b 2011,15). The
European Union has set goals to decrease the GHG emissions and energy
consumption by 20 % by the year 2020 (TransEco 2012). All this data show that
there is a lot of potential in decreasing the GHG emission of buses.
The majority of emissions caused during the life cycle of a bus come from the use
phase, which is a popular topic for studies. The emissions caused during the first
phase of a bus’ life cycle have, however, rarely been looked into.
The goal of this study is to find out the approximate magnitude of the material
carbon footprint of an urban transit bus, which means the greenhouse gas
emissions caused by the production of the raw materials used in a bus. The goal is
also to investigate how the material choices influence the material carbon
footprint of a bus and what the difference is between the material carbon
footprints of buses with different means of energy conversions.
This study is based on life-cycle thinking, where the phases of a product’s life
cycle are raw material extraction and pre-processing, production, distribution and
storage, use, and end-of-life. In this study, the first phase, raw material extraction
and pre-processing, is being looked into.
The material carbon footprint has been inspected with the help of case buses. The
case buses are urban transit buses with the length of 12 meters. The studied bus
types are a diesel, a hybrid, an electric and a converted electric bus. The standard
for conducting the study was the Product Life Cycle Accounting and Reporting
Standard, a part of the Greenhouse gas (GHG) Protocol.
The results of this study do not tell the emissions of the whole life cycle of a bus
and they should always be combined with an understanding of the impacts during

2
other stages of a bus’ life cycle. When done so, the results can help bus
manufacturers understand which materials cause most emissions and help them
develop their products into a more environmentally-friendly direction. The results
can also be used when planning calls for bids for bus operators in cities. Other
interest groups such as consumers might find this study interesting as well, since it
gives information on the product life cycle process.
This thesis has been written based on calculations of the material carbon footprint
of different bus types. The calculations have been done as a part of the EcoMill
project. The project is coordinated by Lahti University of Applied Sciences and
conducted in cooperation with Aalto University. The EcoMill project is funded by
the European Social Fund. One of the goals in the EcoMill project is to develop
working life qualifications of the students by organizing business cases. The work
has been conducted in cooperation with several bus manufacturers such as
Caetanobus, Kabus Ltd, MovekoTech Ltd and Volvo Bus Finland Ltd.
3
2 BACKGROUND OF THE STUDIED BUSES
2.1 Short description of a bus
A bus is a vehicle meant for transporting people. It has seats for the driver and
more than eight people. (Ajoneuvolaki 11.12.2002/1090, 10 §.) Buses can vary by
size, passenger capacity, energy conversion, number of axles, design, and many
other factors. The properties of a bus vary depending on the intended usage of the
bus. For example, an urban transit bus has a low floor, several doors, seats with a
low backrest and a thin padding, and also space for standing passengers and baby
carriages (Kuukankorpi 2012). A coach (a long-distance bus), again, has a trunk
for luggage and more seats in relation to the length. Other examples of buses with
different structures include mini buses, double deckers and articulated buses.
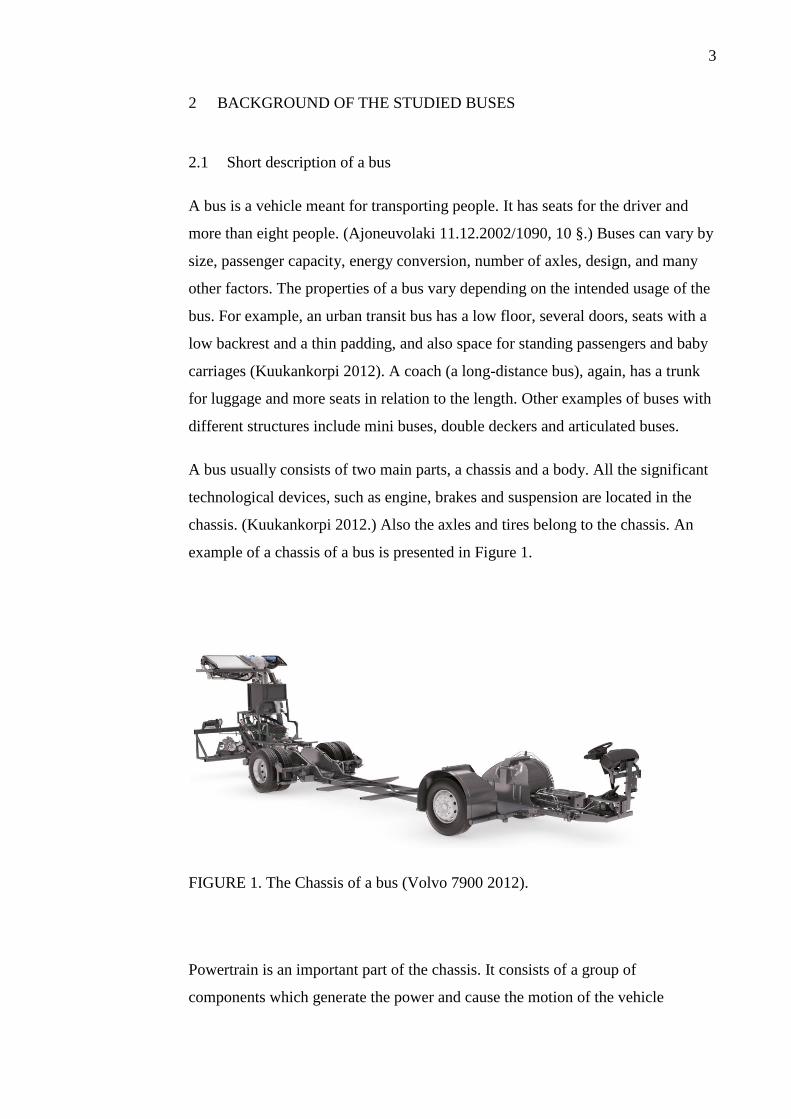
A bus usually consists of two main parts, a chassis and a body. All the significant
technological devices, such as engine, brakes and suspension are located in the
chassis. (Kuukankorpi 2012.) Also the axles and tires belong to the chassis. An
example of a chassis of a bus is presented in Figure 1.
FIGURE 1. The Chassis of a bus (Volvo 7900 2012).
Powertrain is an important part of the chassis. It consists of a group of
components which generate the power and cause the motion of the vehicle

4
(Wallace 2012). The components classified to belong in the powertrain in this
study are presented in Chapter 5.
The body of a bus means the occupant space, that is, the rest of the bus excluding
the chassis. Examples of the body parts are walls, roof, nose, rear, doors,
windows, interior and seats. It is not very common for the bus manufacturers to
produce a bus as a whole (Kuukankorpi 2012). This means that the body is
typically built over an already-manufactured chassis.
The main raw material of the bus is usually steel, an alloy of iron and some carbon
(How Products Are Made – School Bus 2012). The structure can also be made of
aluminium as the main raw material (Kabus kaupunkiliikenneauto 2012). A bus
consists mainly of metals, but there are also other materials, such as wood, glass,
plastics and technical devices in the structure.
The required properties set to the bus types are defined by the use. Since the urban
city buses are used in city traffic and for picking up passengers, they have to be
designed for frequent stops and accelerating. Coaches, however, are used on
longer routes with fewer stops. (European Stainless Steel Development
Association 2007, 111).
2.2 Bus types
In this study, the concept of a bus type means a bus with a certain energy
conversion system. The bus types investigated in this study are diesel, hybrid,
electric and converted electric bus. There are also other types of buses, such as
compressed natural gas (CNG) buses or hydrogen fuel cell buses.
There can be several variants when examining a certain bus type. For example, a
hybrid can be a parallel hybrid, a series hybrid or a mixed hybrid, or it can be
fitted with a capacitor instead of a battery (Salaterä 2012, Zolfagharifard 2010).
The bus types in the case study are presented in Chapter 2.2.2.

5
2.2.1 Buses used in Finland
A diesel bus is the most common bus type used in Finland (Kuukankorpi 2012).
The other bus types used are natural gas (CNG) buses and hybrid buses (Karvonen
2012).
Helsinki Region Transport (HSL) has 86 CNG buses in the metropolitan area
(Karvonen 2012; Kuukankorpi 2012). Additionally, there are also two hybrid
buses tested by HSL (Karvonen 2012). The other cities testing hybrid buses are
Turku and Tampere with a couple of buses in use (Karvonen 2012; Laurikko
2012).
When it comes to electric buses, the city of Espoo is going to test one bus in the
near future (Laurikko 2012). Converted electric buses will be tested in two cities
in the near future: in Lahti in the beginning of the year 2013 and in Hyvinkää in
the spring 2013 (MovekoTech Ltd 2012).
2.2.2 Description of bus types studied in the case
A diesel bus is the most common bus type around the world. The propulsion
system of a diesel bus consists of an internal combustion engine (ICE), which uses
diesel as the fuel. (ACT Government 2012.) A diesel bus can also run with
biodiesel.
A hybrid vehicle is a vehicle with a driveline, which uses at least two different
means of energy conversion and two different techniques for storing energy
(Braess & Seiffert 2005, 114). The definition of a hybrid vehicle applies to hybrid
buses as well. The powertrain of a hybrid bus consists of an internal combustion
engine, an electric motor, a battery and an inverter (Dietsche 2011, 646). The
hybrid bus studied in the case is a parallel hybrid, which means that it is driven by
the battery or directly by the engine.
The energy source of an electric bus is electricity. The powertrain of an electric
bus consists of a battery and an electric motor with an inverter (Braess & Seiffert
2005, 102). The battery technology is constantly improving, even though it
6
struggles with high production costs (Hybrid Electric and Battery Electric
Vehicles – Buyers Guide 2007, 7; 23).
A converted electric bus is a bus which used to have a powertrain of a diesel bus
but has been converted to run with electricity. This means that the diesel
powertrain has been replaced with an electric motor and a battery. The aim of the
conversion is to lengthen the life cycle of a bus by converting diesel buses which
have been used for about 10 years. That is why there might also be other changes
in the bus, regarding the interior for example. (Kulju 2012.)
7
3 PREVIOUS STUDIES
3.1 Introduction to previous studies
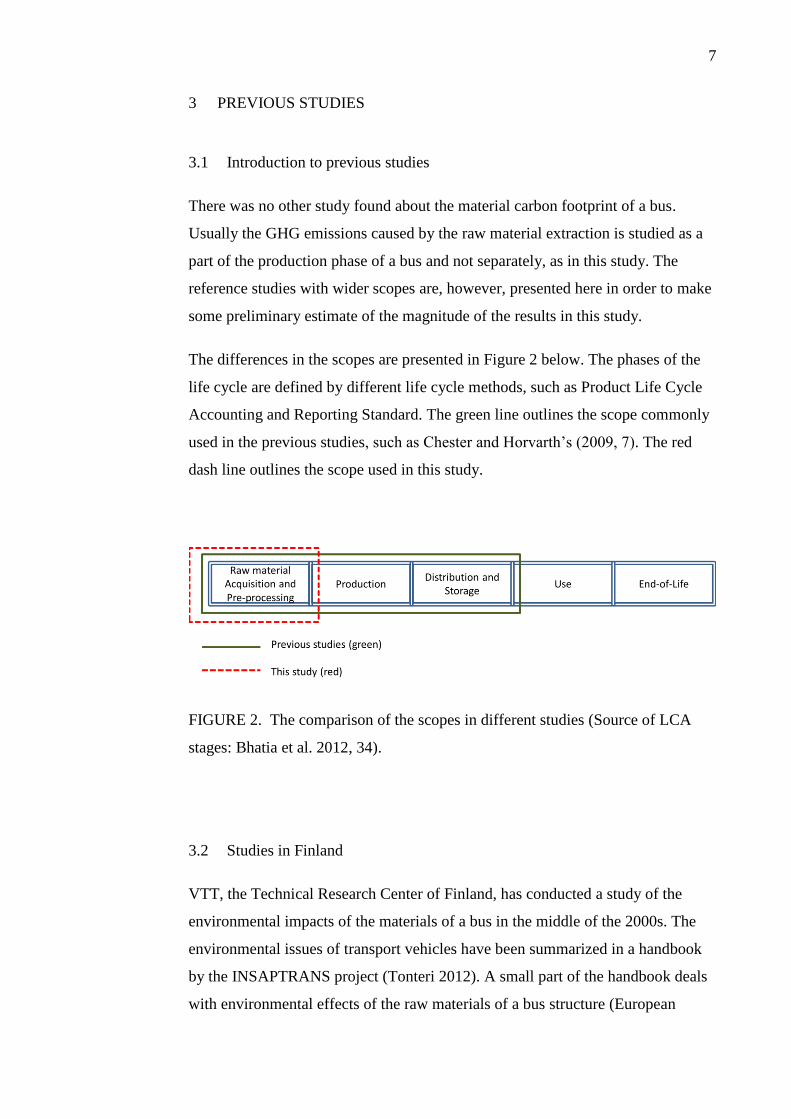
There was no other study found about the material carbon footprint of a bus.
Usually the GHG emissions caused by the raw material extraction is studied as a
part of the production phase of a bus and not separately, as in this study. The
reference studies with wider scopes are, however, presented here in order to make
some preliminary estimate of the magnitude of the results in this study.
The differences in the scopes are presented in Figure 2 below. The phases of the
life cycle are defined by different life cycle methods, such as Product Life Cycle
Accounting and Reporting Standard. The green line outlines the scope commonly
used in the previous studies, such as Chester and Horvarth’s (2009, 7). The red
dash line outlines the scope used in this study.
FIGURE 2. The comparison of the scopes in different studies (Source of LCA
stages: Bhatia et al. 2012, 34).
3.2 Studies in Finland
VTT, the Technical Research Center of Finland, has conducted a study of the
environmental impacts of the materials of a bus in the middle of the 2000s. The
environmental issues of transport vehicles have been summarized in a handbook
by the INSAPTRANS project (Tonteri 2012). A small part of the handbook deals
with environmental effects of the raw materials of a bus structure (European
8
Stainless Steel Development Association 2007,1). There is no data about the
environmental impact of the different means of energy conversion of a bus in the
handbook.
The handbook emphasizes the effect of the vehicle weight on the environmental
impacts. The reduction in the weight of a bus decreases the amount of produced
and recycled raw materials. Furthermore, it lowers the fuel consumption.
(European Stainless Steel Development Association 2007, 111.)
Pusenius, Lettenmeier & Saari (2005, 7) studied MIPS (Material input per service
unit) values for public roads in Finland. The direct use of road area and the use of
natural resources during the life cycle of different forms of traffic were studied.
The MIPS values were calculated for the consumption of abiotic and biotic
materials, water and air (Pusenius et al. 2005, 8). The MIPS values for production
describe the use of natural resources and potential of environmental impacts
caused by production of the materials of a bus, but are not comparable with the
GHG emission indicators. That is why the results cannot be directly compared
with this study.
Nevertheless, some of the data in the study can be exploited. In the study of
Pusenius et al. (2005, Appendix 3), the raw material and material weight
information of an urban transit bus is described. This information has been used as
a point of comparison when analyzing the raw material and weight information of
the case buses used in this study. The comparison is presented in Chapter 6,
Material carbon footprint calculations.
3.3 Foreign studies
Cooney (2011, 3) conducted a life cycle assessment of diesel and electric public
transportation buses in the USA. In the study, a conventional internal combustion
engine bus was compared with a battery electric bus using process-based and
EIO-LCA (Economic input-output life cycle assessment) methods. The goal of the
study was to do research on the environmental impacts of the manufacture and
operation of the two bus types.
The conclusion of the study was that the use-phase of a bus causes the majority of
9
the emissions. When it comes to the production phase of the life-cycle, according
to Cooney the batteries in the electric system cause significant emissions and
other environmental impacts. (Cooney 2011, iv). There was no numerical data
presented about the emissions caused during the manufacture or raw material
extraction of a bus.
A life cycle energy and emissions inventory has been made for motorcycles,
diesel automobiles, school buses, electric buses, Chicago rail and New York City
rail in the USA. Vehicle manufacturing in the inventory was studied using EIO-
LCA. (Chester and Horvath 2009, 7.) The manufacturing covers the whole
manufacturing process starting from the energy use and emissions of the raw
material extraction and ending with the assembling of the vehicle (Chester &
Horvath 2009, 2).
Chester & Horvath’s inventory showed that the GHG emissions of the
manufacture of an electric bus was 150 tonnes CO2e/bus. The corresponding value
for an urban diesel bus was 140 tonnes CO2e/bus. (Chester & Horvath 2009, 5, 43,
70.)
Chester also made a life-cycle environmental inventory of passenger
transportation in the USA. The life-cycle inventory included for example vehicle
manufacturing, use-phase, maintenance, infrastructure, and fuel production.
(Chester 2008, 14.) The calculations for the greenhouse gas emissions of bus
manufacturing were performed using inventory data of heavy-duty truck
manufacturing. (Chester 2008, 22). The LCA was performed using the EIO-LCA
method and the National Transit Database of FTA (Federal Transit Authority).
Greenhouse gas emissions of the manufacture of a bus were 129 tonnes CO2e
/bus. (Chester 2008, 56.) Another value was presented for an average bus: the
manufacture emissions were 160 tonnes CO2e / bus. (Chester 2008, 32.)
Assessing the material carbon footprint of a bus by using the data regarding the
heavy-duty vehicles is reasonable, as done in the study presented above. The
construction of the heavy-duty vehicles and buses is quite similar (Juhala 2012).
For example, the chassis in both vehicles is of the same type.
In the presented studies the result was often given as tonnes CO2e (Carbon

10
dioxide equivalent) per vehicle life. In this study the used unit is tonnes CO2e/bus,
which means the same as per vehicle life. For clarity’s sake, all the comparable
results are turned into the unit used in this study.
3.4 Evaluation of previous studies
The comparison of the previous carbon footprint studies with numerical results is
presented in Table 1. Only two of the studies resulted in actual values of carbon
footprint during the manufacture phase.
TABLE 1. Comparison of the CO2-footprint of the previous studies.
Study Scope Result
TieMIPS
2005 Materials of the bus kg, see Calculations
Chester & Horvath
2009
Manufacture,
electric bus 150 t CO2e/bus
Manufacture,
urban diesel bus 140 t CO2e/bus
Chester
2008
Manufacture 129 t CO2e/bus
Manufacture,
average bus 160 t CO2e/bus
This case study
2012
Raw material
extraction and
pre-processing,
urban transit bus,
different energy
conversions
t CO2e/bus
(see result in
Calculations)
The numerical values found in the literature are not directly comparable with the
results of this study, since none of them investigate only the raw material
extraction and pre-processing. However, it is an advantage that there are at least
some values to start off with.

11
Based on the results of previous studies, the material carbon footprint is predicted
to be about half or less of the reference studies’, 60-80 t CO2e/bus. In any case,
the material carbon footprint should be smaller than the results of the reference
studies.
The material carbon footprint results of this study between the buses with
different means of energy conversion are assumed to differ to some extent. The
most significant difference between the results is assumed to be in the powertrain.
Also, the main raw material of the bus is assumed to affect the final results.
12
4 METHOD
4.1 Life cycle assessment and environmental impact indicators
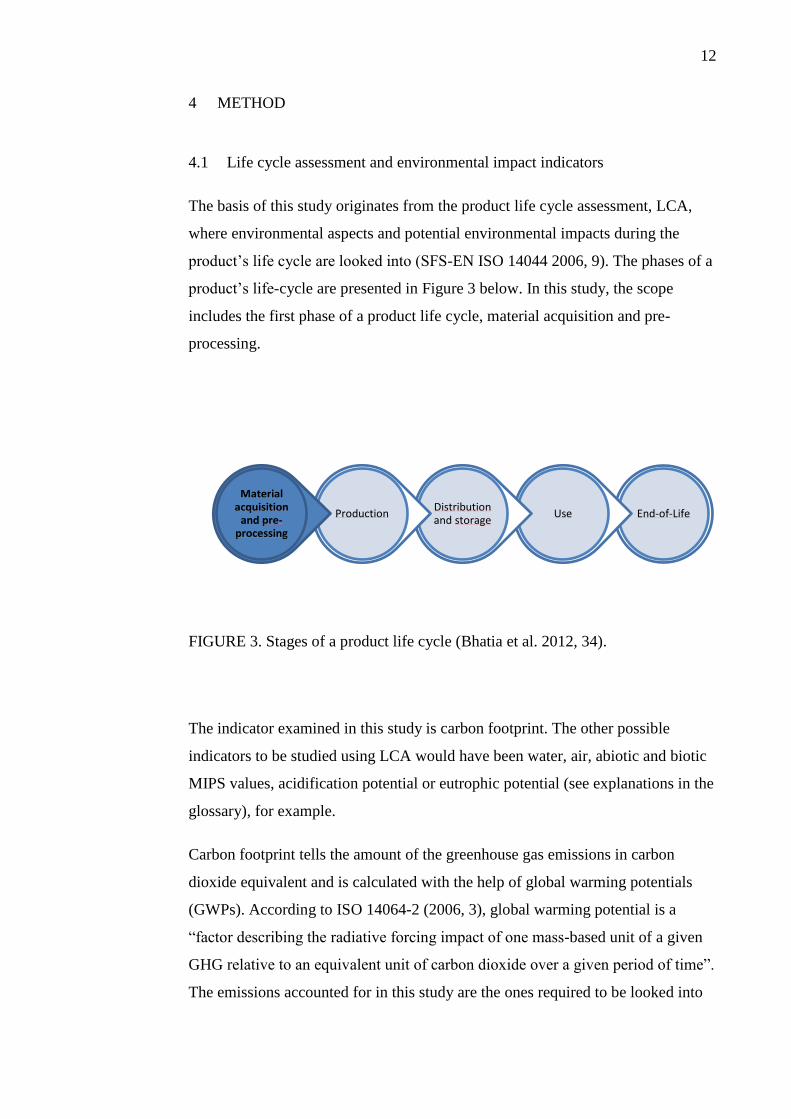
The basis of this study originates from the product life cycle assessment, LCA,
where environmental aspects and potential environmental impacts during the
product’s life cycle are looked into (SFS-EN ISO 14044 2006, 9). The phases of a
product’s life-cycle are presented in Figure 3 below. In this study, the scope
includes the first phase of a product life cycle, material acquisition and pre-
processing.
FIGURE 3. Stages of a product life cycle (Bhatia et al. 2012, 34).
The indicator examined in this study is carbon footprint. The other possible
indicators to be studied using LCA would have been water, air, abiotic and biotic
MIPS values, acidification potential or eutrophic potential (see explanations in the
glossary), for example.
Carbon footprint tells the amount of the greenhouse gas emissions in carbon
dioxide equivalent and is calculated with the help of global warming potentials
(GWPs). According to ISO 14064-2 (2006, 3), global warming potential is a
“factor describing the radiative forcing impact of one mass-based unit of a given
GHG relative to an equivalent unit of carbon dioxide over a given period of time”.
The emissions accounted for in this study are the ones required to be looked into
End-of-Life Use Distribution and storage
Production
Material acquisition
and pre-processing

13
in the used method: carbon dioxide (CO2), methane (CH4), nitrous oxide (N2O),
sulfur hexafluoride (SF6), perfluorocarbons (PFCs) and hydrofluorocarbons
(HFCs). The emissions are calculated using the EcoInvent database for global
warming potential of 100 years (GWP 100 a) factors, choosing the values
complying with the CML 2001 impact assessment method (EcoInvent 2012).
4.2 Tools for perfoming LCA
There are several tools to help one perform LCA. The ISO 14040 standards offer
guidance on the principles for conducting an LCA study. ISO 14064 standard
deals with greenhouse gas accounting and verification. (Environmental
management – The ISO 14000 family of International Standards 2009,6.) Other
and more practice-oriented examples include Product Life Cycle Accounting and
Reporting Standard by GHG Protocol, and PAS 2050 (Greenhouse gas protocol
2012; PAS 2050 2012). The method used in this study was chosen to be Product
Life Cycle Accounting and Reporting Standard, because it concentrates
particularly on the greenhouse gases. ISO 14064 will probably be the most
popular method in the future, but was not chosen to be used in this study for two
reasons. Firstly, it was released only when the study was already well on the way
and secondly it concentrates on measuring the emissions. This study focused on
calculating the emissions.
Other tools helping to perform the study are different kinds of databases and
calculation programs. EcoInvent is a database offering transparent and up-to-date
information for performing a life-cycle inventory (LCI), a quantification of inputs
and outputs of a system (EcoInvent 2012; Procter & Gamble 2012). Ecoinvent is
by far the most used database and it has been connected with several calculation
programs (Antikainen, R. 2010, 22). It is also the database used in this study.
Additionally, examples of different calculation programs on the LCA known in
Finland are GaBi, SimaPro, Umberto and Finnish KCL-Eco (Antikainen, R. 2010,
23). This study was planned to be performed utilizing GaBi, but the program
concentrates on modeling the processes. There was only a little to model when
studying the material and weight information of the bus, and therefore using GaBi
was left out of the study.
14
4.3 Basic definitions of a material carbon footprint study
In order to understand the method used in this study, one should be aware of the
most important concepts appearing in it. It is important to understand what raw
material acquisition and pre-processing as the first stage of a product life cycle
include. Other important concepts in the study are functional unit, reference flow,
unit of analysis, activity data, scope and system boundary.
The exact concept of raw material acquisition and pre-processing is defined in
Product Life Cycle Accounting and Reporting Standard (Bhatia et al. 2012, 38):
The material acquisition and preprocessing stage starts
when resources are extracted from nature and ends when
the product components enter the gate of the studied
product’s production facility. Other processes that may
occur in this stage include recycled material acquisition,
processing of materials into intermediate material inputs
(preprocessing), and transportation of material inputs
to the production facility.
Functional unit is “the quantified performance of the studied product” (Bhatia et
al. 2012, 134). In this study, the functional unit is a 12-meter-long urban transit
bus. Functional unit could also have been different, such as passenger kilometers
travelled (PKT).
Reference flow means the amount of studied product, which fulfills the function
defined in the unit of analysis. Unit of analysis is the unit based on which the
inventory results are calculated. Activity data means the measures of a process
which result in GHG emissions. (Bhatia et al. 2012, 136-137). In this study,
reference flow is the same as unit of analysis, a 12-meter-long urban transit bus.
Activity data in this case is the amount of raw material of a bus stated in
kilograms.
15
4.3.1 Scope and system boundary of the study
The scope in the study is the first stage of the product life cycle, material
acquisition and pre-processing. The functional unit in this study is the carbon
footprint caused during the extraction and pre-processing of the raw materials of a
bus. The functional unit has been chosen so that the results can easily be turned
into passenger kilometers travelled. This enables a better comparison with other
studies.
System boundary describes the scope in more detail. It outlines the processes
which are included in the study. In this study, the system boundary includes raw
material acquisition and pre-processing. However, the production of some parts
such as electric motors is included in the system boundary. The system boundary
outline was conducted knowing that there is no easy access to more detailed
information about the raw materials of some parts, but it is possible to access the
GWP factors of the parts. Otherwise, the further processing of the materials, such
as cutting or welding metals and assembling of the parts is mainly not included in
the system boundary. The process map for the bus’ life cycle with complete
system boundary marked with red dash line is presented in Figure 4 below.

16
FIGURE 4. Process map with system boundary.
4.3.2 Explanation of the scope outline
In order to find out the most significant factors causing the GHG emissions during
a bus’ life cycle, the use phase should be looked into. An other important factor
would be the manufacture phase, where the electricity consumption causes the
majority of the emissions. Also the end-of life of a bus would be interesting to
study, since the good recycling opportunities for Li-Ion (Lithium ion) batteries
most probably reduce the actual emissions of the electric buses.
17
The system boundary concentrating only on the raw material acquision and pre-
prosessing was chosen, however, for three reasons. Firstly, the use phase is
planned to be studied further on in the EcoMill project. Secondly, a study
concentrating specifically on the first phase of a bus life cycle has a fresh view
point. Thirdly, a boundary with the scope of the whole life cycle of a bus would
be too wide for a thesis. Based on this information, the system boundary is set to
include the raw material acquisition and pre-processing.
4.4 Steps of conducting the study in accordance to method
There was a data management plan made about the data sources and data
management in the beginning of conducting this study, as recommended in the
used method. The data management plan is presented in Appendix 1. The
execution of the plan succeeded well, considering the iterative nature of this kind
of study. Iterative process means resulting in a decision by repeating the stages of
the analysis over and over again (BusinessDictionary.com 2012). Conducting an
LCA is an iterative process, because the understanding of the matter grows during
the progress of the work.
The steps of conducting a carbon footprint study are stated in the Product Life
Cycle Accounting and Reporting Standard (Bhatia et al. 2012, 13). The steps of
the study, the requirements in each step and the execution are presented in
Appendix 5. The study was performed as well as it could be performed within the
given time and work frame. All the requirements of the standard were not
fulfilled, though. Performance tracking was not conducted and the report of the
study was made complying other instructions than of those of the method’s. The
assurance was done without reporting. These phases should have been gone
through in order to conduct a complete study in accordance with the Product Life
Cycle Accounting and Reporting Standard.
18
5 CASE STUDY DATA AND CLASSIFICATION
5.1 Case buses
The characteristics of the case buses of this study are the following: a low-floor or
a half-low-floor urban transit bus with 2 axles and the length of about 12 meters.
The weight of the bus varies between about 8 200 kg and 12 000 kg depending on
the main raw material. There is space for 68 to 79 passengers depending on the
case bus.
There are five case buses and four bus types studied in this work. Two of the case
buses use diesel as their source of energy. The other cases are a parallel hybrid
bus, an electric bus and a converted electric bus. There is also an already-existing
material list of a third diesel bus. The data about a third diesel bus is used as
reference information in the calculations. The features of the case buses are
presented in Table 2 below.

19
TABLE 2. General information on the case buses (Puseniut et al. 2005 Appendix
3, Source A 2012, MovekoTech Ltd 2012, Kabus Ltd 2012, Source B 2012).
Feature
Case 1 Diesel (*1)
Case 2 Diesel
Case 3 Hybrid
Case 4 Electric
Case 5 Converted electric (2*)
Reference Diesel (*3)
Bus type diesel diesel hybrid electric electric diesel
Weight [kg] (*4)
8 200 11 340 10 830 12 500 E.g. 12 000 10 926
Doors (5*) 1+2+0 2+2+0 2+2+0 0+2+2 E.g. 2+2+0 E.g.
1+1+0
(ICE) (6*) x x x - - x
Electric motor
- - x x x -
Fuel tank [l] 273 250 215 - - no data
Passenger capacity
40 seats 29 standing
34 seats 45
standing
34 seats 45
standing
23 seats 45 standing
E.g. 34 seats.
45 standing no data
Speciality Aluminium structure
light weight
Parallel hybrid
Range 160 km recharging
possible any time
Opportunity charging
(7*) Reference
(1*) Kabus 4 City Bus
(2*) Converted electric bus by MovekoTech Ltd
(3*) Volvo 8500 Low Entry
(4*) Excl. driver, fuel and lubrication
(5*) Front door(s) + middle door(s) + back door(s)
(6*) Internal combustion engine
(7*) Charging takes place through a charging rod
The buses are comparable with each other because of the same functionality in
each: the case buses are used for urban transportation. Also the length and the
passenger capacity are all approximately the same. There are single or double
doors either in the front and in the middle of the bus (cases 1-3, 5) or in the
middle and in the back (case 4). All the buses excluding Case 1 are approximately
of the same weight.
5.2 Trisection of the bus composition
In this study, the body and chassis are studied as separate sections of a bus.
Furthermore, the chassis is divided into powertrain and the rest of the chassis. The
material carbon footprint is calculated utilizing this trisection of a bus.
20
The powertrain in this study includes ICE for the diesel buses, electric motor for
electric buses, or both in the hybrid bus. Other parts of the powertrain are
transmission, cardan shaft and in electric buses, batteries and control system of the
powertrain.
The rest of the chassis parts include chassis frame, front and rear axles, wheels,
brakes, power steering, pneumatics, electrical wires, cooling system and in diesel
buses, an exhaust system, and a battery for starting. The body includes the frame
of the bus, walls, roof, doors, windows, heating and seats, for example.
5.3 Material classification
5.3.1 Classical material classification
Dietsche (2011, 135) classifies the materials used in vehicles into four groups.
These material groups are metals, nonmetallic inorganic materials, nonmetallic
organic materials and composite materials.
Metals are crystalline-by-structure materials, which can be wrought, rolled or cast,
for example. Also alloys belong to this group. Alloys are metals consisting of two
or more components, at least one of which is metal. (Dietsche 2011, 135.)
Nonmetallic inorganic materials have low thermal and electric conductivity,
luminous reflectance and brittleness due to their capacity to be held together by
different types of bonds. They are not suited for cold forming. For example,
ceramics and glass belong to this material group. (Dietsche 2011, 135.)
Nonmetallic organic materials are comprised of carbon and hydrogen and often
have nitrogen, oxygen and other elements in their structure. Natural materials and
plastics belong to this group. (Dietsche 2011, 135.) Plastic is a polymeric material
with the capability of being molded or shaped, usually by the application of heat
and pressure (Encyclopædia Britannica 2012-d). Plastics can be divided into
thermosets and thermoplastics (Järvinen 2000, 15).

21
Composite materials comprise of at least two physically or chemically different
components. Fiber glass and cotton-fiber-reinforced plastics belong to this group.
(Dietsche 2011, 135.)
5.3.2 Material classification in the case study
In this case study, the material groups are formed based on a different
classification from Dietsche, because some of the collected data is in the form of
bus parts and some in the form of pre-processed materials. Table 3 presents the
material groups and the materials under each group according to the classification
in this study.
TABLE 3. The grouping of the materials in the case study
Grouping metals and plastics to their own groups is an obvious solution. The only
exception is reinforced plastic, which is included in the plastics group regardless
of the fact that there is also fiber glass resin in the plastic.
Metals
•Iron
•Steel
•Aluminium
•Copper
•Brass
Devices and batteries
•Electrics
•Electric motor
•Lead acid battery
•Li-Ion battery
•Catalytic converter
Plastics
•ABS
•PA
•PE
•Textile, polyester
•Reinforced plastic
•PP
•PVC
•PUR
•PS foam
•Silicone
•Plastic, undefined
Lubricants and chemicals
•Lubricant
•Paint
•Refrigerant
•Ethylene glycol
Other materials
•Plywood
•Glass
•Double glass
•Rubber, undefined
•Rubber, natural
•Bitumen
•Other

22
The group of lubricants and chemicals includes lubricants used in the
transmission, axles and power steering. The adhesive is used in a bus for example
to attach the components together. Paint is used for the surface of the bus.
Ethylene glycol is used in the cooling system.
In this study, the devices and batteries are gathered into one group. The materials
in this group are actually already-assembled parts, which have been studied as
parts due to the lack of data about their further construction.
The material group pf other materials includes some organic materials such as
plywood, rubber and bitumen, and inorganic materials such as glass. Glass is an
inorganic solid material, which is hard, brittle and impervious to the natural
elements. Most of the glasses are soda-lime-silica glasses, which compose of
sand, limestone and sodium carbonate. (Encyclopædia Britannica 2012-b.) The
double glass appearing in the material list of this study refers to a glass product
with two sheets of glass, which have an aluminium molding between them. In a
bus, glass is used in the windows: the windscreen, the side windows and the
windows on the doors.There is both natural and synthetic rubber used in the
structure of a bus.
5.3.3 Extraction and pre-processing examples
In this subchapter, there is an example of the extraction and pre-processing of a
material from each group. Examples have been chosen based on the importance of
the material in the group.
Metallic raw materials are usually processed in two phases: ore beneficiation and
additional processes. Beneficiation is the process of dressing crude ore to increase
the concentration of the desired metal. The usual beneficiation processes include
crushing, roasting, magnetic separation, flotation and leaching. The additional
processes such as smelting and alloying result in producing the metal for parts and
products. (Encyclopædia Britannica 2012-c.)
Approximately half of the produced lithium in the world comes from brine, which
is refined into lithium carbonate. The other half is mined from different minerals,
such as lithium aluminium silicate. (Duleep, van Essen, Kampman & Grünig
23
2011, 27.) Lithium is used in the batteries of electric and hybrid buses. According
to Daniel, lithium ion batteries consist of battery cells. The production of a cell
starts by forming the electrolytes. A coating machine feeds paste of active
materials on collector foils, such as aluminium for the cathode side and copper for
the anode side. The foils are cut to correct width and stacked, winded and inserted
in cylindrical cases. Finally, the conducting tab is welded. The produced cells are
filled with electrolyte. In the end, other needed insulators, seals and safety devices
are attached and connected. (Daniel 2008.)
Plastics are made of plastic resins. Plastic resins are produced with chemical
techniques into powder, pellet, putty or liquid. (Encyclopædia Britannica 2012-c).
Usually the further processing of plastic resins begins with compounding, which
means mixing together various raw materials according to the used recipe. Mixing
can be done in conventional stirred tanks or with the help of special machinery.
Sometimes mixing can take place with the extrusion or molding of the plastic.
(Encyclopædia Britannica 2012-d.) Compounding is followed by forming, which
refers to the process of melting, shaping and solidifying plastics into different
shapes. (Encyclopædia Britannica 2012-d.)
Fiber glass is a fibrous form of glass and it is used in most cases as insulation and
as a reinforcing agent in plastics. The process of production starts with obtaining
liquid glass either directly from a glass-melting furnace or by melting preformed
glass marbles. The liquid is directed into a bushing, which generates fine streams.
The solidifying strands can be twisted, or woven into fabrics, for instance.
(Encyclopædia Britannica 2012-a.) Fiber glass is used as the resin in reinforced
plastic, which is used in the body parts of a bus, such as the roof.
Ethylene glycol is utilized in the cooling system of a bus as an antifreeze agent. It
is manufactured from ethylene oxide, which is produced in a direct oxidation
process with air or oxygen and a silver-based catalyst. Ethylene oxide is then fed
with water at higher temperature to generate mono-ethylene glycol. (Siemens AG
2009, 1.)
The rubber used in the tires is natural rubber (Michelin 2012). Natural rubber
comes from rubber trees, from which the raw material, latex, is extracted. Rubber

24
is recovered from latex with the help of an acid. The liquid is driven out and the
rubber is rolled into sheets and dried. Synthetic rubber, instead, is in most cases
produced from petroleum utilizing the same polymerization techniques as used to
synthesize other polymers. (Groover 2011, 192-193)

25
6 MATERIAL CARBON FOOTPRINT CALCULATIONS
6.1 Conducting of the calculations
The case buses used in the study are presented below. In case 1 the main raw
material is aluminium. The main raw material in the rest of the cases is steel.
Case 1 diesel bus (aluminium chassis)
Case 2 diesel bus
Case 3 hybrid bus
Case 4 electric bus
Case 5 converted electric bus
The calculations were performed by using the raw material data of each case bus.
The materials and the weights of the raw materials were defined for the three
sections of a bus: powertrain, chassis and body. The data was divided into
material groups. The materials and weights in the case buses according to the used
material classification are presented in Appendix 2.
The sources of the data for each bus type are the following:
Case 1 diesel bus, Case 2 diesel bus and Case 3 hybrid bus – data mainly
from the manufacturer of each
Case 4 electric bus – chassis data from the manufacturer, body data is the
same as Case 2
Case 5 converted electric bus – powertrain data from the manufacturer,
body and rest of chassis data the same as Case 2
Reference Diesel bus – study by Pusenius, Lettenmeier and Saari (2005,
appendix 3)
In Case 4, the body data of Case 2 was used in the calculations due to the lack of
data regarding the actual body. The results of the calculations regarding Case 4
are considered to be less reliable than of other cases’ because of the made
assumption. In Case 5, it is justified to make the calculations with the data from
Case 2. That is because the business idea in Case 5 bus is to replace the
powertrain of a basic diesel bus with an electric system.
26
6.1.1 Equation for material carbon footprint
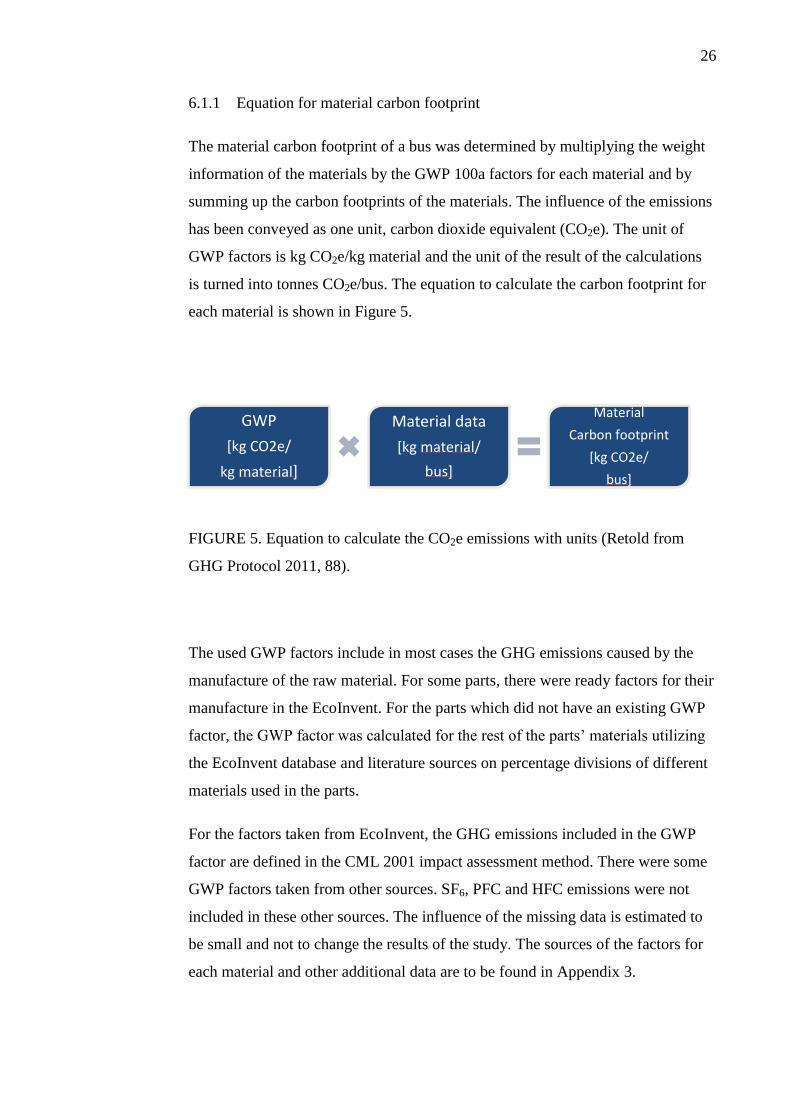
The material carbon footprint of a bus was determined by multiplying the weight
information of the materials by the GWP 100a factors for each material and by
summing up the carbon footprints of the materials. The influence of the emissions
has been conveyed as one unit, carbon dioxide equivalent (CO2e). The unit of
GWP factors is kg CO2e/kg material and the unit of the result of the calculations
is turned into tonnes CO2e/bus. The equation to calculate the carbon footprint for
each material is shown in Figure 5.
FIGURE 5. Equation to calculate the CO2e emissions with units (Retold from
GHG Protocol 2011, 88).
The used GWP factors include in most cases the GHG emissions caused by the
manufacture of the raw material. For some parts, there were ready factors for their
manufacture in the EcoInvent. For the parts which did not have an existing GWP
factor, the GWP factor was calculated for the rest of the parts’ materials utilizing
the EcoInvent database and literature sources on percentage divisions of different
materials used in the parts.
For the factors taken from EcoInvent, the GHG emissions included in the GWP
factor are defined in the CML 2001 impact assessment method. There were some
GWP factors taken from other sources. SF6, PFC and HFC emissions were not
included in these other sources. The influence of the missing data is estimated to
be small and not to change the results of the study. The sources of the factors for
each material and other additional data are to be found in Appendix 3.
GWP
[kg CO2e/
kg material]
Material data
[kg material/
bus]
Material
Carbon footprint
[kg CO2e/
bus]

27
The recycling rate of the metals is included in the GWP factors for cast iron, hot-
rolled steel, electro galvanized steel, aluminium and cast aluminium. For the other
metals, the recycling rate is left out. The recycling rate for steel had to be left out
due to the lack of reliable data.
6.1.2 Excluded from the calculations
In some cases, the material data for the case buses was given very specifically.
For example, there were several different types of lubricants in the material list
given by the source. In such cases, the amount of the most common material was
included and the others (less than 1 % of the total weight of the bus) were
excluded.
Some of the paints were not included in the calculations, because the weight of the
paint was less than 1 % of the total weight of the bus. The paints could not be
combined to be one group, paints, because they differ from each other by
structure.
The anti-rust agent was left out of the studies because not every manufacturer
reported to be using it. The amount of this substance is small and therefore should
not affect the result.
The diesel and the equipment used for fuelling up the tank which are used in the
diesel and hybrid buses was excluded from the calculations. Also the recharging
equipment of the hybrid and electric buses was excluded from the calculations.

28
7 MATERIAL CARBON FOOTPRINT RESULTS
The material carbon footprints according to the raw material classification are
presented in Figure 6. The difference between the smallest and the biggest value is
11.5 t CO2e/bus. This amount is about twice the carbon footprint of manufacturing
a small city car, Citroen C1 (Berners-Lee & Clark 2010). The smallest material
carbon footprint is caused by the Case 2 diesel bus and the biggest by the
preliminary results of Case 4 electric bus.
(1*) Preliminary results
FIGURE 6. The material carbon footprints of the case buses by the material
classification.
0
10
20
30
40
50
60
Emis
sio
ns
t C
O2e
/bu
s
Greenhouse gases of the case buses by the material classification
Other materials
Lubricants andchemicals
Plastics
Devices and batteries
Metals
29
According to the results, about one third of all emissions for all the buses is
caused by the material group of other materials. Raw material extraction and pre-
processing of metals also causes significant emissions. Devices and batteries
cause least emissions for the diesel buses, to a larger extent for the hybrid bus and
notable emissions for the electric and converted electric buses.
When comparing the steel-structured buses with each other, the raw material
extraction and pre-processing of the raw materials of a diesel bus causes least
emissions with 45.4 t CO2e/bus. After that comes the hybrid bus causing 48.6 t
CO2e/bus and converted electric bus with 51.2 t CO2e/bus. The most emissions
are caused by the preliminary results of the electric bus with 56.9 t CO2e/bus. The
material carbon footprint calculated for the reference diesel is about the same as
the result of the converted electric bus: 51.4 t CO2e/bus. The result for the
aluminium-structured diesel bus is 54.0 t CO2e/bus, which is between the results
of the reference diesel and the electric bus.
The material carbon footprint for the case 2 diesel bus can be seen as a reference
value, with the help of which one can evaluate the other results. The material
carbon footprint of the reference diesel bus most probably contains a large error,
since the raw material classification in the reference study was done differently.
The material group devices and batteries is best presented in weight in the electric
buses. The weight of this material group is less in the hybrid bus and the least in
the diesel buses. The material group devices and batteries causes considerably
emissions. Therefore it is logical that the material carbon footprints for the hybrid
bus and further on, for the electric buses is bigger than of the steel-structured
diesel’s
One could have expected the result of the hybrid bus to be bigger than that of the
electric bus, because a hybrid contains both a diesel engine and an electric motor.
The results show, however, that the material carbon footprint of the hybrid bus is
smaller than that of the electric bus. This is explained with the smaller energy
conversion systems, both diesel and electric, which cause less emissions together
than one electric system.
30
The difference between the results of the two case diesel buses is explained with
the different main raw material. As expected, aluminium causes higher emissions
than steel as the main raw material. This result calls for further inspection of the
other life cycle phases of the buses to show the actual carbon footprint of the bus
types.
The highest material carbon footprint is caused by the electric bus. However, the
results for the electric bus are preliminary. The large numerical value is partly due
to the material classification, which was done less accurately in comparison to
other case buses. More importantly, having more electrics in comparison to other
bus types increases the material carbon footprint.
The material carbon footprint of the converted electric bus is small in relation to
the electric bus. The reason for this is amongst other things the more careful
material classification by the source.
When calculating the material carbon footprint of the converted electric bus, the
time aspect should have been taken into consideration; conversion of a bus adds
extra years for the bus to be operated, which decreases the relative material carbon
footprint of the converted electric bus.
The results for each case bus seem to be accurate. Producing the raw materials
causes most pollution for the buses containing a lot of electrics or with aluminium
as the main raw material. Emissions caused by the material groups other
materials, lubricants and chemicals and plastics are fairly similar for the studied
buses.
7.1 Deeper look into the results
The weights of materials in each raw material group both in kilograms and
percentage of the total weight of each bus are presented in Table 4. Also the
material carbon footprints for each material group in t CO2e/bus and % are shown.

31
TABLE 4. Weight and material carbon footprint data according to the material
groups.
(1*) Preliminary results
A bus consists mainly of metals. 59-79 % of the weights of the case buses are
metals. They are the main material carbon footprint causers for the diesel case
Case 1 Diesel
Case 2 Diesel
Case 3 Hybrid
Case 4 Electric
(1*)
Case 5 Converted
electric
Reference Diesel
Metals
kg 5 916 8 149 7 865 6 869 7 583 8 565 % 72 % 73 % 70 % 59 % 64 % 79 %
t CO2e/bus 31.2 19.8 19.9 16.2 17.4 24.3 % 58 % 44 % 41 % 28 % 34 % 47 %
Devices and batteries kg 140 254 632 2 393 1756 124 % 2 % 2 % 6 % 20 % 15 % 1 %
t CO2e/bus 0.8 2.2 5.2 18.3 10.8 0.2 % 1 % 5 % 11 % 32 % 21 % 0,4 %
Plastics
kg 933 896 874 811 833 576 % 11 % 8 % 8 % 7 % 7 % 5 %
t CO2e/bus 3.9 3.7 3.6 3.3 3.4 2.8 % 7 % 8 % 7 % 6 % 7 % 5 %
Lubricants and chemicals kg 139 219 212 99 112 108 % 2 % 2 % 2 % 1 % 1 % 1 %
t CO2e/bus 0.5 1.0 1.1 0.8 0.8 0.2 % 1 % 2 % 2 % 1 % 2 % 0,3 %
Other materials kg 1 134 1 639 1 643 1 553 1 629 1 527 % 14 % 15 % 15 % 13 % 14 % 14 %
t CO2e/bus 17.7 18.7 18.7 18.3 18.7 24.0 % 33 % 41 % 39 % 32 % 36 % 47 %
Total
kg 8 262 11 156 11 227 11 725 11 913 10 900
% 100 % 100 % 100 % 100 % 100 % 100 %
t CO2e/bus 54.0 45.4 48.6 56.9 51.2 51.4 % 100 % 100 % 100 % 100 % 100 % 100 %

32
buses 1 and 2. In the reference diesel, the fraction of emissions caused by metals
is the same as by other materials, 47 %.
The second largest material group is other materials with about 13-15 % of the
weights of the buses. This shows that the proportional amounts of plywood,
rubber and glass are about the same in each case. This material group causes about
one third of the material carbon footprint for cases 1, 4 and 5 and increases until it
is almost one half of the emissions in the rest of the examined buses.
Other materials, including mostly plywood, glass, and rubbers, cause a
surprisingly notable share of the material carbon footprint emissions. This is
explained by the high GWP factor of double glass. The factor is evaluated to have
an equal effect on each of the results, except for the reference diesel, where it
might have increased the final result.
The weight of devices and batteries varies significantly depending on the bus type.
In diesel cases, 1 and 2, the weight of devices and batteries is about 2 %, and in
the reference diesel, 1% of the total weight. In comparison, there is already a
significant growth of the actual weight of devices and batteries in the hybrid bus:
around 400 kg, which makes 6 % of the weight of the hybrid bus. The
proportional share of devices and batteries in electric buses is 15 % for case 5
converted electric bus and 20 % for the case 4 electric bus. This is caused by the
weight of the lithium ion battery.
The emissions caused by devices and batteries are small in relation to total
emissions in the case 1 diesel bus and the reference diesel. The percentage still
remains low with 5 % for the case 2 diesel bus. The share of the material carbon
footprint for this material group grows for case 3 Hybrid bus and reaches its peak
with the electric buses. The emissions caused by the devices and batteries in the
case 4 electric bus, 32%, should be smaller in order to be comparable with the
other buses; in this case, there is a lot of weight reported to belong to electrics,
which causes significant emission growth.
In case 1 the relative amount of plastic, 11 % of the total weight, is big in relation
to other case buses. This is probably one of the reasons to explain the light weight
33
of this bus type. In other cases the percentage of the weight of used plastic is 5-8
%. Emissions caused by the production of plastics vary between 5-8 %.
As expected, the amount of lubricants and chemicals is small, 1-2 % in each bus.
Also the emissions caused by the production of these materials are insignificant
for considering the final results: 0,3-2 % of the material carbon footprint.
The weight of the case 1 bus is smaller than of the other buses, but the percentages
of the materials of the total weight is about the same as with the other buses. This
means that the materials in case 1 have approximately the same percentages as in
other cases.
7.1.1 Effect of metal choice on the material carbon footprint
The effect of the metal choice is to be seen in Figures 7 and 8, where the first
shows the weight of the metals in the case buses and the latter presents the
material carbon footprint of metals used in the studied buses. The numerical data
behind the metals’ material carbon footprint calculations is presented in Appendix
4.

34
(1*) Preliminary results
FIGURE 7. Weight of the metals in kilograms for each bus.
The total amount of metals is considerably small in case 1 in comparison to other
buses. Also in case 4 there are fewer metals than in the other buses. Some of the
metals used in the electric bus are included in the material group devices and
batteries due to the form of data given by the manufacturer. This is one of the
reasons why the results of case 4 are considered preliminary.
0
1000
2000
3000
4000
5000
6000
7000
8000
9000
We
igh
t (k
g)
Weight of the metals in the case buses
Other metals
Aluminium
Stainless steel
Iron or steel excl.Stainless steel

35
(1*) Preliminary results
FIGURE 8. Material carbon footprint data for the metals of the case buses.
It can be seen in Figures 8 and 9 that even though the main raw material in cases
2-5 and the reference diesel is steel, aluminium is the metal which causes most of
the raw material extraction and pre-processing emissions for each of the buses.
The material carbon footprint for steel is smaller than for aluminium. Producing of
other metals causes little emissions due to their small amount in the bus.
7.1.2 Material carbon footprint by part division
Figure 9 presents how the part division composes the material carbon footprints.
The fraction of caused emission by the body structure is shown in green. The
amount of emissions caused by the chassis is marked with red and the powertrain
in blue. The sum of the material carbon footprints of the powertrain and chassis
tell the share of the material carbon footprint of the whole chassis.
0
5
10
15
20
25
30
35
Emis
sio
ns
CO
2e
/bu
s
Greenhouse gases of the case buses caused by metals
Other metals
Aluminium
Stainless steel
Iron or steel excl.Stainless steel

36
FIGURE 10. The division of material carbon footprint by the bus part
classification.
Powertrain
Chassis
Body
2.4 t CO2e
13.2 t CO2e
38.4 t CO2e
Case 1 Diesel
3.9 t CO2e
7.7 t CO2e
33.8 t CO2e
Case 2 Diesel
6.3 t CO2e
7.6 t CO2e
34.6 t CO2e
Case 3 Hybrid
13.5 t CO2e
9.7 t CO2e
33.8 t CO2e
Case 4 Electric
10.4 t CO2e
7.0 t CO2e 33.8 t
CO2e
Case 5 Converted electric
The division of greenhouse gases by bus part classification

37
One can see in Figure 10 that the relative proportion of emissions caused by body
decreases, when the amount of electric components in the chassis increases. The
powertrain of the electric buses and the hybrid bus cause more emissions than
ofthe powertrain of the diesel.
The material carbon footprint caused by the body is quite the same for the steel-
structured buses: between 33.8 and 34.6 t CO2e/bus. The material carbon footprint
of the body of the case 1 diesel is a little bigger because of the aluminium
structure, as expected.
There are some differences in the material carbon footprint of the chassis between
the bus types: the least emissions are caused by the chassis of the converted
electric bus and the greatest by the aluminium-structured diesel bus. The material
carbon footprint caused by the powertrain complies with the other results of the
study: the more electrics in the bus, the bigger the material carbon footprint.
7.2 Data quality and sensitivity analysis
The data quality for the materials of this study has been documented but there was
no report made on the results. Briefly, the data quality of the materials of cases 1-
3 and 5 is between good and very good and the data quality in case 4 is fair. The
data used in the case study was either from the manufacturing companies,
companies’ suppliers, other possible suppliers, or previous studies. The data for
the calculations was mostly calculated or estimated by the representatives of the
companies. In some cases, the data was measured. According to the used method,
calculated data has very good quality and estimated values give a good result.
That is why the data quality is between good and very good. The data for the body
of case 4 comes from case 2 and is therefore graded to be lower than of the other
cases.
The sensitivity analysis should have been conducted as a part of the work.
However, due to the time and work frame of a thesis, the sensitivity analysis has
been left out of the work. The following variants would have been important to
investigate:
38
- How much does the value of the carbon footprint change when steel/aluminium
is used as the main raw material?
- How much would more specific material information regarding the material
group electronic and batteries change the results of the whole study?
- What would the result be with more specific data about the material group
lubricants and chemicals?
- How much would it change the results, if the recycling rate for all the metals
were taken into consideration?

39
8 COMBINING THE CASE STUDY WITH PREVIOUS STUDIES
In the previous studies, one of the factors affecting behind the environmental
impact of a bus was stated to be the weight of the whole bus because of the
reduced fuel consumption (Research Fund for Coal and Steel 2007, 1). The weight
has also an impact on the material carbon footprint, unless the main raw material
is different in the compared buses. A lighter, aluminium-structured bus causes
more emissions than a heavier steel-structured bus. That is because the emissions
caused by the production of aluminium are very high.
The previous studies also stated that the batteries in an electric bus cause a
significant impact on the emissions caused in the production of a bus (Cooney
2011, iv). In this study it was found that batteries, but also other electrics affect
the material footprint of a bus.
The size of the carbon footprint of the manufacture of a bus in the case studies
was150 tonnes CO2e/bus for an electric bus, 140 tonnes CO2e/ bus for an urban
diesel bus (Chester & Horvath. 2009, 5, 43) and 160 tonnes CO2e /bus for an
average bus (Chester 2008, 56). The carbon footprint of the manufacture of a non-
specified bus is 129 tonnes CO2e /bus (Chester 2008, 56).
In this study it was found out that the approximate size of the material carbon
footprint of a bus varies between 45-54 (57 by the preliminary results of an
electric bus) tonnes CO2e /bus. This makes about one third of the emissions of the
manufacture of a bus stated in the previous studies. All in all, one can conclude
that the results of this case study comply quite well with the assumptions and
previous studies.

40
9 EVALUATION
9.1 Evaluation of the topic and the method
The topic chosen for study should be critically reviewed. Thinking generally, the
increase in the understanding of effectiveness of material production is something
to be striven for. On the other hand, looking into something very specific will
provide results based on which one cannot make conclusions and, further on,
decisions. What can be regarded as a good thing is that the view point in this
study is fresh.
The used method was chosen from three possibilities: ISO, PAS 2050 and GHG
Protocol. All the methods had their advantages but GHG Protocol was chosen,
because it concentrated so clearly on the GHG emissions and also the conducting
of the study was well instructed. ISO was left out because the new standard was
not ready until in the middle of conducting this study. PAS 2050 might have been
a good possibility as well, but it would have been more difficult to carry out due
to the complicated instructions.
Another point to criticize was the meeting the requirements of the method. All the
phases required in the method were not gone through. It was also noticed during
the work, that it was easier to make your own decisions regarding the conduction
of the work than to look up from the guidebook what was required to be done.
There are several factors which have an influence on the reliability of the results
of this study. When it comes to system boundary, it is important to understand that
with the system boundary concentrating only on the raw material acquisition and
pre-processing, the results cannot be used for evaluating the carbon footprint of
the whole bus. Also combining just this study and the use phase, as planned, will
only give the approximate evaluation of all the emissions during the life cycle of a
bus, not the actual value. When studying the life cycle of a bus, the whole
manufacture phase is estimated to be the second largest causer of emissions after
the use phase.

41
9.2 Evaluation of the calculations
The calculations were made as studiously as possible within the time limit and
size of the study. There are, however, several factors which might change the
actual emissions of the raw material extraction and pre-processing of the raw
materials of a bus.
First of all, there was no information about the geographical location of the
different points of manufacture. It was not possible to gain this kind of
information from the manufacturers and their subcontractors, because
manufacturers still have little data of the origins of their products. On the other
hand, taking the location into more specific consideration would also have been
impossible due to the level of accuracy of the used GWP factors. They were
almost without exception given on the global or European level. The location of
raw-material acquisition and pre-processing affects the transportation of different
raw materials, which affects the caused emissions. Also the means of
transportation and local manufacturing circumstances affect the emissions.
The material carbon footprint of the reference diesel is probably a little bit too big.
The explanation to this comes from the original material classification, which was
performed in a way different from this study. The fact that glass was not classified
separately as double glass and glass causes great changes in the results. Also the
amount of other materials increases the material carbon footprint into a greater
size. The contents of other materials differ greatly between the case buses as well,
which makes it difficult to choose a reliable GWP factor. The variation of the
material content in other materials most probably causes error in the final results.
There are three different types of lubricants used in the buses: engine,
transmission and axle oil. The lubricants do not have the same structure, but they
were still calculated with the same factor. The amount of lubricants is under 1 %
of the total weight of the bus, so according to the used method, it could have been
left out of the study. Including them into calculations is estimated to have a small
impact on the final results.

42
There were some substances which were left out because they did not fulfill the
requirement of being more than 1 % of the total weight. The amount of this kind
of materials is evaluated to be 2 % of the total weight at most.
Calculating the theoretical construction of the catalytic converter was based on the
material % -data of a 5-kilogram-heavy catalytic converter of a car. The catalytic
converters of buses are several times bigger than those of cars, which can lead to
unreliability due to a bigger surface area when studying a bigger product.
The calculated total weights of the buses are comparable with the theoretical
weights given by the bus manufacturers. The biggest variation in weights takes
place with case 2 with 3.4 %, and case 4 with 4.7 % missing from the theoretical
weight.
43
10 CONCLUSION
In this study, the emissions of the extraction and pre-processing of the raw
materials of an urban transit bus were inspected. The study was conducted by
calculating the material carbon footprint for five case buses and four different bus
types. The guideline used in the study was Product Life Cycle Accounting and
Reporting Standard by GHG Protocol. The studied bus types were diesel, hybrid,
electric and converted electric bus.
The material carbon footprint is about 45-51 tonnes CO2e for a basic diesel bus,
54 tonnes CO2e for a diesel bus with an aluminium structure, 49 tonnes CO2e for a
hybrid bus and 51 tonnes CO2e for a converted electric bus. According to the
preliminary results of the electric bus, the material carbon footprint is about 57
tonnes CO2e/bus.
Metals cause about one third of the material carbon footprint, which is
surprisingly little, because about 60-80 % of the weight of a bus comes from
metals. When looking at the two main metals used in a bus, producing aluminium
causes more emissions than producing steel. Single material groups with
significant impacts on the material carbon footprint are electrics and double glass,
for example.
When it comes to the materials used in a bus from the emissions point of view, it
is impossible to say which combination of the materials would be the best. If you
look at the results of this study, the answer would be that one should choose steel
as the main raw material and avoid electrics and double glass.
If also the use-phase were studied, the results might be the opposite: the light
weight of an aluminium structured bus causes smaller fuel consumption and
electric buses enable the use of a cleaner energy source (such as wind energy) or
at least the producing of emissions further away from the cities to avoid fine
particles and air pollution in the city. In any case, the amount of electrics used in
every bus increases as the development goes further. Double glass increases the
safety of a bus. Therefore it is hard to start minimizing the materials from this end.
44
The material carbon footprint of a bus makes one third of the emissions of the
whole manufacture of a bus, and probably even less of the totality of the carbon
footprint of a bus. The greatest emissions during the life cycle of a bus are caused
by the use phase. In order to minimize the emissions of the life cycle of a bus, one
of the factors is to choose durable and practical materials, which cause the least
emissions during the use phase.

45
11 PROPOSALS FOR FUTURE WORK
The environmental impacts caused during the life cycle of a bus is a very
interesting topic. One could look at the theme from several view points and with
different system boundaries. In the future, the following viewpoints are suggested
to be studied.
A very obvious topic to take under consideration is the use phase of the case buses
of this study. The use phase is an important topic to be studied and there already
are several studies conducted of it. One would make an extensive study even by
studying the already-conducted studies.
The manufacture phase of a bus is also a good topic to be studied. Using this
study as a reference, the study including transportation and the emissions caused
in the factories when producing the parts and assembling the buses would
complement the overall picture.
Studying the end-of-life of a bus would add extra value especially to the carbon
footprint caused by the converted electric bus. The goal in the bus conversion is to
add active years of use for the bus. Having more data about the fate of out-of-
operation buses at the moment would be important.
For a more reliable picture of the emissions of the converted electric bus, the time
aspect should be looked at. In this study, for example, it would have meant
dividing the results with active years of use. This aspect was left out of the study
because of the time and work frame, but should definitely be looked into.
This leads to a very interesting possibility to be studied: it would be the most
important to master the cause and effect of different aspects in the whole life cycle
of a bus. It would include not only the caused GHG emissions, but also cover all
the other environmental impacts, such as acidification and the use of water and
land during the life cycle phases. This kind of understanding turned into
knowledge would be very beneficial for cities inviting the bus operators to tender.
Also the first phases of the life cycle of a bus should be studied by finding out the
footprints of different components, such as motors, batteries and catalytic
converters.
46
REFERENCES
WRITTEN REFERENCES
Ajoneuvolaki 11.12.2002/1090 2. luku Ajoneuvojen perusluokitus 10§ Auto.
Yleiset luokitusta koskevat säädökset. Also available on:
http://www.finlex.fi/fi/laki/ajantasa/2002/20021248
Braess, H. & Seiffert, U. 2005. Handbook of Automotive Engineering.
Warrendale: SAE.
Daniel, C. 2008. Materials and Processing for Lithium-ion Batteries. JOM vol. 60,
No. 9 p. 43-48 [referenced 13 September 2012]. Available on:
http://www.tms.org/pubs/journals/jom/0809/daniel-0809.html
Editorial staff Dietsche, K. 2011. Automotive Handbook. 8th
edition revised and
extended. Cambridge: Bentley Publishers.
Groover. M. 2011. Introduction to Manufacturing Processes. Lehigh: John Wiley
& Sons.
Järvinen, P. 2000. Muovin suomalainen käsikirja. Muovifakta Oy. Porvoo: WS
Bookwell Oy.
SFS-EN ISO 14044. 2006. Environmental management. Life cycle assessment.
Requires and guidelines. Helsinki:Suomen standardoimisliitto.
ELECTRONIC REFERENCES
ACT Government. 2012. Transport options for Canberra: bus rapid transit.
Brochure [referenced 13 September 2012]. Available on:
http://www.transport.act.gov.au/studies_projects/City%20To%20Gungahlin%20fa
ctsheet.pdf

47
Antikainen, R. 2010. Elinkaarimetodiikkojen nykytila, hyvät käytännöt ja
kehitystarpeet. Suomen ympäristökeskuksen raportteja 7. Suomen
ympäristökeskus [referenced 27 August 2012]. Available on:
http://www.ymparisto.fi/download.asp?contentid=116835&lan=fi
Bhatia, P., Cummins, C., Brown, A., Drauker, L. Rich, D. & Lahd, H. 2012.
Greenhouse Gas Protocol: Product Life Cycle Accounting and Reporting
Standard. World Resources Institute [referenced 3 May 2012]. Available on:
http://www.ghgprotocol.org/files/ghgp/Product%20Life%20Cycle%20Accounting
%20and%20Reporting%20Standard.pdf
Berners-Lee, M. & Clark, D. 2010. What’s the carbon footprint of … a new car?
GreenLiving Blog [referenced 20 September 2012]. Available on:
http://www.guardian.co.uk/environment/green-living-blog/2010/sep/23/carbon-
footprint-new-car
BusinessDictionary.com. 2012. Iterative process [referenced 6 September 2012].
Available on: http://www.businessdictionary.com/definition/iterative-process.html
Chester, M. 2008. Life-cycle Environmental Inventory of Passenger
Transportation in the United States. Institute of Transportation Studies. University
of California, Berkley. Dissertations [referenced 24 August 2012]. Available on:
http://escholarship.org/uc/item/7n29n303#page-1
Chester, M & Horvath, A. 2009. Life-cycle Energy and Emissions Inventories for
Motorcycles, Diesel Automobiles, School Buses, Electric Buses, Chicago Rail,
and New York City Rail. UC Berkley Center for Future Urban Transport: A
Volvo Center of Excellence, Institute of Transportation Studies (UCB), UC
Berkeley [referenced 24 August 2012]. Available on:
http://escholarship.org/uc/item/6z37f2jr.
Cooney, G. 2011. Life Cycle Assessment of Diesel and Electric Public
Transportation Buses. University of Pittsburgh [referenced 22 August 2012].
Available on: http://d-scholarship.pitt.edu/8474/1/cooneyga_etd2011.pdf
Duleep, G., van Essen, H., Kampman, B . & Grünig, M. 2011. Assessment of
electric vehicle and battery technology. Impacts of Electric Vehicles – Deliverable
48
2. Delft. CE Delft [referenced 4 September 2012]. Available on
http://www.cedelft.eu/publicatie/impact_of_electric_vehicles/1153
EcoInvent. 2012. Database [referenced 27 August 2012]. Available on:
http://www.ecoinvent.org/database/
Ecoinvent. 2012. Dataset information [referenced 27 August 2012]. Available on
EcoInvent-database.
Encyclopædia Britannica. 2012-a. Fibreglass [Referenced 30 July 2012].
Available on: http://www.britannica.com/EBchecked/topic/205852/fibreglass
Encyclopædia Britannica. 2012-b. Glass [referenced 30 July 2012]. Available on:
http://www.britannica.com/EBchecked/topic/234888/glass
Encyclopædia Britannica. 2012-c. Materials processing [Referenced 30 July
2012]. Available on:
http://www.britannica.com/EBchecked/topic/369072/materials-processing
Encyclopædia Britannica. 2012-d. Plastic [Referenced 30 July 2012]. Available
on: http://www.britannica.com/EBchecked/topic/463684/plastic/82461/The-
composition-structure-and-properties-of-plastics?anchor=ref625150
Environmental management – The ISO 14000 family of International Standards.
2009. International Organization for Standardization [Referenced 27 August
2012]. Available on: http://www.iso.org/iso/theiso14000family_2009.pdf
European Stainless Steel Development Association. 2007.Innovative Stainless
Steel Applications in transport vehicles (INSAPTRANS) [referred 22 August
2012]. Available on: http://www.euro-
inox.org/pdf/auto/INSAPTRANS_Handbook_EN.pdf
Greenhouse gas protocol. 2012. Greenhouse gas protocol [referenced 6 September
2012]. Available on: http://www.ghgprotocol.org/
How Products Are Made. 2012. School Bus. Vol. 4 [Referenced 3 September
2012]. Available on: http://www.madehow.com/Volume-4/School-Bus.html

49
Hybrid Electric and Battery Electric Vehicles – Buyers Guide. 2007. Sustainable
Energy Ireland. AEA Energy & Environment. Version 1 [referenced 3 September
2012]. Available on:
http://www.seai.ie/News_Events/Press_Releases/Buyers_Guide.pdf
Kabus kaupunkiliikenneauto. 2012. Kabus Oy [Referenced 3 September 2012].
Available on: http://www.kabus.fi/tuotteet
Karvonen, V., VTT. 2012. RE: Opinnäytetyö linja-auton materiaaliCO2-jäljestä.
[e-mail]. Receiver Kärnä, P. Sent on 31 August 2012.
Kuukankorpi, A. 2012. Bussityypit. Arttu Kuukankorpi [referenced 18 July 2012].
Available on: http://www.kuukankorpi.com/paikallisliikenne/bussityypit.html
Laurikko, J. VTT. 2012. RE: Opinnäytetyö linja-auton materiaaliCO2-jäljestä [e-
mail]. Receiver Kärnä, P. Sent on 31 August 2012.
PAS 2050. 2012. PAS 2050 [referenced 6 September 2012]. Available on:
http://www.bsigroup.com/en/Standards-and-Publications/How-we-can-help-
you/Professional-Standards-Service/PAS-2050/PAS-2050/
Procter & Gamble. 2012. Life Cycle Assessment (LCA) [referenced 13 September
2012]. Available on:
http://www.scienceinthebox.com/en_UK/sustainability/definition_en.html
Pusenius, K., Lettenmeier, M. & Saari, A. 2005. Luonnonvarojen kulutus
tieliikenteessä. Helsinki [referenced 3 September 2012]. Available on:
http://www.lvm.fi/fileserver/Julkaisuja%2054_2005.pdf
Siemens AG. 2009. Process Analytics in Ethylene Oxide and Ethylene Glycol
Plants [referenced 13 September 2012]. Available on:
http://www.industry.usa.siemens.com/automation/us/en/process-instrumentation-
and-analytics/process-analytics/pa-case-studies/Documents/CS_EO-
EG_03_2009_en.pdf

50
Source B. 2012. FW: A request: Cooperation in a Bus Carbon Footprint –work.
[e-mail]. Receiver Kärnä, P. Sent on 30 July 2012. Requested to remain
anonymous.
Tilastokeskus a. 2007. Vuosisata suomalaista autoilua. Tilastokeskus, Helsinki
[referenced 12 September 2012]. Available on:
http://www.stat.fi/tup/suomi90/lokakuu.html
Tilastokeskus b. 2011. Suomen kasvihuonepäästöt 1990-2009. Katsauksia 2011/1
Ympäristö ja luonnonvarat. Helsinki [referenced 12 September 2012]. Available:
http://tilastokeskus.fi/tup/khkinv/suominir_2011.pdf
Tilastokeskus c. 2012. Rekisterissä olleiden ajoneuvojen lukumäärä, 31.12.1922-
2011 [referenced 12 September 2012]. Available on:
http://pxweb2.stat.fi/Dialog/Saveshow.asp
TransEco. 2012. TransEco [referenced 13 September 2012]. Available on:
http://www.transeco.fi/transeco/
Volvo 7900. 2012. Volvo Buses Image Gallery [Referenced 3 August 2012].
Available on: http://images.volvobuses.com/#1343983398213_3
Wallace, O. 2012. What is Powertrain? WiseGEEK [referenced 13 September
2012]. Available on: http://www.wisegeek.com/what-is-a-powertrain.htm
Zolfagharifard, E. 2010. Urban legend: Hybrid bus technology. The Engineer. 29
November 2010 [referenced 13 September 2012]. Available on:
http://www.theengineer.co.uk/urban-legend-hybrid-bus-
technology/1006276.article
ORAL REFERENCES
Juhala, M. 2012. Head of Department of Engineering Design and Production.
Aalto University. Interview 19 April 2012.
Kulju, H. 2012. Chairman of Moveko Group. Interview. 28 February 2012.
51
Laurikko, J. 2012. Special researcher VTT. Interview 31 August 2012.
Salaterä, H. 2012. Plant manager. Kabus Oy. Interview 8 May 2012.
Tonteri, H. 2012. Senior Research Scientist. Technical Research Center of
Finland. Interview 12 April 2012.
Source A. 2012. Interview 4 May 2012. Requested to remain anonymous.

APPENDICES
APPENDIX 1. Data management plan
APPENDIX 2. Materials and weights of the case buses according to the
classification
APPENDIX 3. Additional information on the GWP-factors used in the
calculations.
APPENDIX 4. Weight and material carbon footprint data for the metals
APPENDIX 5. Steps in a product standard inventory

13 April 2012
APPENDIX 1/1. Data management plan
Data Management Plan
Responsibilities
Management of product inventory, data collection for material aqcuisition and pre-processing: Päivi Kärnä, project worker, EcoMill-project.
Product description
An urban transit bus (rigid bus) with two axles. Length 12 meters. Model from the 21th century or later. 5 different models:
1) Diesel bus (combustion engine) 2) Hybrid bus 3) Natural gas bus 4) Electric bus 5) Converted electric bus
Change on 19 July 2012: Natural gas bus excluded due to the lack of data. There will be two case diesel buses and one reference study of a diesel in the calculations.
Functional unit
kg CO2e /bus or tons CO2e/bus (further could be CO2e/bus/year of use)
Inventory boundary
Inventory boundary description: This assessment will concentrate on the production phase and furthermore, on the material acquisition and pre-processing of the raw material used in the buses in case. How the boundary was derived: it is supposed that after the using phase, the extraction of raw materials contribute to the largest environmental impact when talking about the life-cycle of a bus. That is why the material acquisition has been taken into further consideration. Attributable processes included in the inventory: the mining and concentration of the raw materials. Attributable processes excluded from the inventory: the processing of the raw material into parts is being excluded because in comparison to the extraction of raw materials, the impacts of the processing are evaluated to be rather small. This lack of information will be critically evaluated in the assurance evaluation. It is also possible to try to make an evaluation of the volume of the impact.
13 April 2012
APPENDIX 1/2.
Data summary
Data collection procedures: the data for each bus type will be collected from a suitable bus manufacturer and/or from literature overview.
Data quality assessment and uncertainty assessment
Data quality assessment will be performed by tracking the technology, time of data, geography, completeness and reliability to an excel file. A qualitative data quality assessment will be performed. There will be no measures for improving the quality of data during this work: the data quality is as good as possible during the study. The study and improvement of the data quality can be further worked on by the person carrying on the study. Uncertainty assessment will be performed by calculating the studied subject with the variation of 5 %. Change on 16 August 2012: Performing uncertainty assessment was left out due to the lack of time.
Inventory results calculations
Calculation methodologies: The calculation methodology has not yet been completely defined. So far the ISO standard, PAS 2050 and now the GHG Protocol are being looked into. Most probably one of these methodologies will be used. The narrowing-down of the theme will, however, limit the use of a methodology. This will also be criticized in the assurance evaluation. Changes in methodologies: 24 April 2012 - It was decided that the GHG Protocol will be used as the methodology in this study. Used GWP values: the GWP values used in this work will be the up-to-date values which can be found on the internet-site of Greenhouse Gas Protocol: www.ghgprotocol.org. Changes in GWP values: 24.8.2012 - The GWP values will be for the most part from the EcoInvent database.
Performance tracking
When tracking performance, details of the base inventory adjustment policy = how much can we bend in getting the base information? Answer: it would be beneficial to decide at this point, where the limits go. It is, however, a little challenging since the precision of the data received is not known. This point will be clarified in the course of the work.

13 April 2012
APPENDIX 1/3.
Comments: 24 August 2012 – the limits have been found out during the course of work and will be presented in the final report.
Data storage procedures
How and where the data will be stored? The answer to this question will most probably become more clear once we have some more information. So far, there has been a general picture of the work pictured in a Prezi-file. The numeric information on the work will be collected onto an excel-file.
File content File form
Contact information Excel
Overall picture Prezi
Scope on the structure Prezi
Information for calculations Excel
Written information Word
List of literature references Word
References Books, Word, PDF, etc
Report Word
Backup procedures: the backup procedures of the EcoMill project in Innovation Centre will be enough. No other arrangements will be done.
Quality Assurance/ Quality Control (QA/QC) procedures
The QA/QC procedures will be done by the Table C.2. in the GHG Protocol Document (p. 130).

APPENDIX 2/1. Materials and weights of the case buses according to the classification
Materials and weights of the case buses according to classification
Case 1 Diesel
Case 2 Diesel
Case 3 Hybrid
Case 4 Electric (1*)
Case 5 Converted electric (2*)
Comparison: Diesel (3*)
Material Weight [kg]
Me
tals
Iron, cast 358 1062 762 43 385 1531
Steel 1628 932 932 3 602 1561 -
Steel, rod - 468 468 468 468 2408
Steel, hot-rolled - 1 528 1 528 298 1 528 1590
Steel, cold-rolled 238 1 430 1 388 716 1 385 568
Stainless steel 40 188 188 105 108 690
Steel, hardened 96 643 638 16 473 -
Electro galv. - 192 192 192 192 -
Other metals - - - - - -
Al 3 327 1316 1 396 1 209 1 207 1666
Al, cast 77 209 145 - 68 -
Copper 126 163 212 219 208 109
Brass 26 17 16 2 - 3
De
vice
s an
d
bat
teri
es
Electrics 20 70 131 282 80 -
Electric motor - - 155 111 70 -
Lead acid battery 93 118 118 - - 124
Li-Ion battery - - 183 2000 1 606 -
Catalytic converter 27 66 45 - - -
Pla
stic
s
ABS 272 67 67 67 67 -
PA 9 1 1 1 1 -
PE 8 32 32 32 32 -
Textile, polyester 32 22 22 22 22 23
Reinforced plastic 218 392 392 392 392 553
PP 2 1 1 1 1 -
PVC 89 123 123 130 105 -
PUR foam 96 82 82 82 82 -
PUR adhesive 100 84 84 84 84 -
PS foam 55 - - - - -
Silicone 13 - - - - -
Plastic, undefined 39 92 71 - 48 -
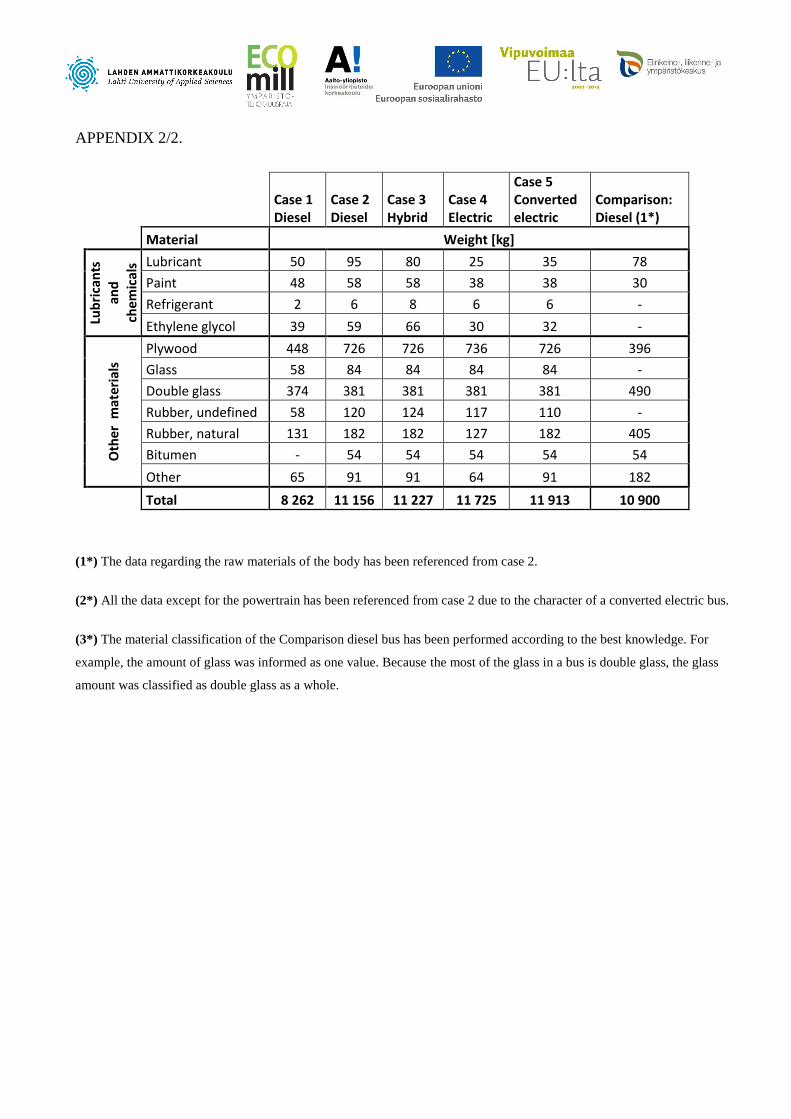
APPENDIX 2/2.
Case 1 Diesel
Case 2 Diesel
Case 3 Hybrid
Case 4 Electric
Case 5 Converted electric
Comparison: Diesel (1*)
Material Weight [kg]
Lub
rica
nts
and
ch
emic
als Lubricant 50 95 80 25 35 78
Paint 48 58 58 38 38 30
Refrigerant 2 6 8 6 6 -
Ethylene glycol 39 59 66 30 32 -
Oth
er m
ater
ials
Plywood 448 726 726 736 726 396
Glass 58 84 84 84 84 -
Double glass 374 381 381 381 381 490
Rubber, undefined 58 120 124 117 110 -
Rubber, natural 131 182 182 127 182 405
Bitumen - 54 54 54 54 54
Other 65 91 91 64 91 182
Total 8 262 11 156 11 227 11 725 11 913 10 900
(1*) The data regarding the raw materials of the body has been referenced from case 2.
(2*) All the data except for the powertrain has been referenced from case 2 due to the character of a converted electric bus.
(3*) The material classification of the Comparison diesel bus has been performed according to the best knowledge. For
example, the amount of glass was informed as one value. Because the most of the glass in a bus is double glass, the glass
amount was classified as double glass as a whole.

APPENDIX 3/1. Additional information on the GWP-factor used in the calculations
Additional data regarding GWP factors used in calculations
Material Description of the used GWP factor Location Referenced Source
Met
als
Iron, cast cast iron, at plant RER 23.7.2012 EcoInvent
Steel steel, cold rolled FIN 9.5.2012 Ruukki
Steel, rod steel, hot-rolled, cold-molded FIN 9.5.2012 Ruukki
Steel, hot-rolled hot-rolled steel sheets and profiles FIN 9.5.2012 Ruukki
Steel, cold-rolled cold-rolled steel FIN 9.5.2012 Ruukki
Stainless steel chronium steel 18/8, at plant RER 9.8.2012 EcoInvent
Steel, hardened reinforcing steel RER 9.8.2012 EcoInvent
Electro galv. electro galvanised steel, cradle to gate GLO 21.8.2012 World Steel Association
Other metals
Al aluminium, production mix, at plant RER 23.7.2012 EcoInvent
Al, cast aluminium, production mix, cast alloy, at plant RER 23.7.2012 EcoInvent
Copper copper, primary, at refinery GLO 23.7.2012 EcoInvent
Brass brass, at plant CH 23.7.2012 EcoInvent
Dev
ices
an
d b
atte
ries
Electrics electrics for control units RER 23.7.2012 EcoInvent
Electric motor electric motor, vehicle, at plant RER 23.7.2012 EcoInvent
Lead acid battery calculated: materials of lead acid battery EU calculated /EcoInvent*
Li-Ion battery single cell, lithium-ion battery, lithium manganiese oxide/graphite, at plant CN 23.7.2012 EcoInvent
Catalytic converter calculated: materials of catalytic converter EU/GLO 9.8.2012 calculated /EcoInvent*
Pla
stic
s
ABS acrylonitrile-butadiene-styrene copolymer, ABS, at plant RER 23.7.2012 EcoInvent
PA nylon 6, at plant RER 23.7.2012 EcoInvent
PE polyethylene, LDPE, granulate, at plant RER 23.7.2012 EcoInvent
Textile, polyester fleece, polyethylene, at plant RER 27.8.2012 EcoInvent
Reinforced plastic glass fibre reinforced plastic, polyester resin, hand lay-up, at plant RER 23.7.2012 EcoInvent
PP polypropylene, granulate, at plant RER 23.7.2012 EcoInvent
PVC PVC, suspension polymerized, at plant RER 23.7.2012 EcoInvent
PUR foam polyurethane, flexible foam, at plant RER 23.7.2012 EcoInvent
PUR adhesive polyurethane adhesive for automobiles EU 7.9.2012 Sika
PS foam polystyrene foam slab, at plant RER 23.7.2012 EcoInvent
Silicone silicone product, at plant RER 27.8.2012 EcoInvent
Plastic, undefined acrylonitrile-butadiene-styrene copolymer, ABS, at plant RER 23.7.2012 EcoInvent

APPENDIX 3/2.
* calculated based on theoretical data about the part and GWP factors for materials of a part.
GWP = Global Warming Potential
Abbreviations for location
CH = Switzerland
DE = Germany
EU = European Union
FIN = Finland
GLO = Global
RER = Europe
Additional information on the source:
Ecoinvent: GWP calculated in accordance to CML 2001 guidance
Ruukki: Environmental declarations for steel products by Ruukki Corporation
World Steel Association: Data through a questionnaire of World Steel Association
Sika: GWP for Sika adhesive by Sika Group
Puuinfo: GWP for plywood by Puuinfo Ltd.
GWP factors from the Finnish companies Puuinfo and Ruukki: including carbon dioxide, methane and
nitrous oxide. Factors exclude sulfur hexafluoride, perfluorocarbons and hydrofluorocarbons.
Material Description of the used GWP factor Location Referenced Source
Lub
rica
nts
an
d
chem
ical
s
Lubricant lubricant oil, at plant RER 28.8.2012 EcoInvent
Paint alkyd paint, white, 60 % in H2O, at plant RER 23.7.2012 EcoInvent
Refrigerant refrigerant R134a, at plant RER 23.7.2012 EcoInvent
Ethylene glycol ethylene glycol, at plant RER 9.8.2012 EcoInvent
Oth
er m
ate
rial
s
Plywood plywood, birch FIN 26.6.2012 Puuinfo
Glass flat glass, uncoated at plant RER 23.7.2012 EcoInvent
Double glass double glazing, laminated safety glass, at plant RER 23.7.2012 EcoInvent
Rubber, undefined synthetic rubber, at plant RER 23.7.2012 EcoInvent
Rubber, natural natural rubber based sealing, at plant DE 23.7.2012 EcoInvent
Bitumen bitumen, at refinery RER 23.7.2012 EcoInvent
Other electronics for control units RER 23.7.2012 EcoInvent
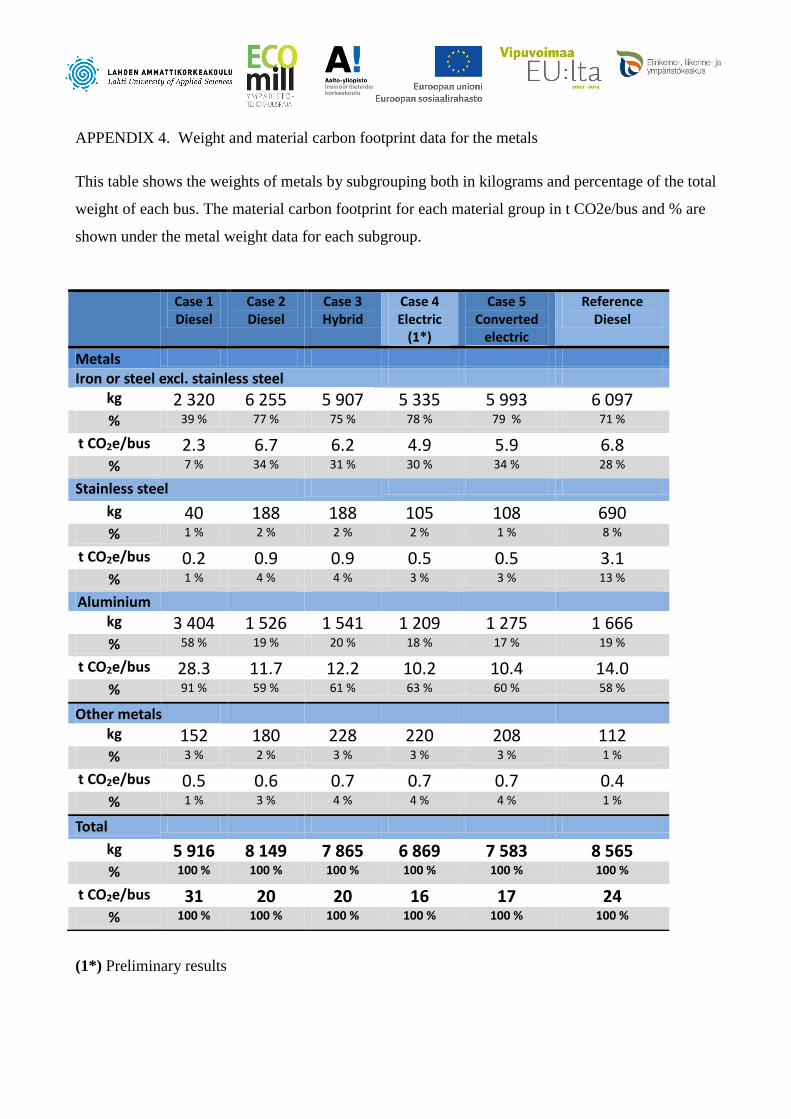
APPENDIX 4. Weight and material carbon footprint data for the metals
This table shows the weights of metals by subgrouping both in kilograms and percentage of the total
weight of each bus. The material carbon footprint for each material group in t CO2e/bus and % are
shown under the metal weight data for each subgroup.
(1*) Preliminary results
Case 1 Diesel
Case 2 Diesel
Case 3 Hybrid
Case 4 Electric
(1*)
Case 5 Converted
electric
Reference Diesel
Metals
Iron or steel excl. stainless steel
kg 2 320 6 255 5 907 5 335 5 993 6 097 % 39 % 77 % 75 % 78 % 79 % 71 %
t CO2e/bus 2.3 6.7 6.2 4.9 5.9 6.8 % 7 % 34 % 31 % 30 % 34 % 28 %
Stainless steel
kg 40 188 188 105 108 690 % 1 % 2 % 2 % 2 % 1 % 8 %
t CO2e/bus 0.2 0.9 0.9 0.5 0.5 3.1 % 1 % 4 % 4 % 3 % 3 % 13 %
Aluminium kg 3 404 1 526 1 541 1 209 1 275 1 666 % 58 % 19 % 20 % 18 % 17 % 19 %
t CO2e/bus 28.3 11.7 12.2 10.2 10.4 14.0 % 91 % 59 % 61 % 63 % 60 % 58 %
Other metals kg 152 180 228 220 208 112 % 3 % 2 % 3 % 3 % 3 % 1 %
t CO2e/bus 0.5 0.6 0.7 0.7 0.7 0.4 % 1 % 3 % 4 % 4 % 4 % 1 %
Total
kg 5 916 8 149 7 865 6 869 7 583 8 565 % 100 % 100 % 100 % 100 % 100 % 100 %
t CO2e/bus 31 20 20 16 17 24 % 100 % 100 % 100 % 100 % 100 % 100 %

APPENDIX 5/1. Steps in a product standard inventory (steps retold from Bhatia et al 2012, 23).
Steps in product standard GHG Inventory
The steps in product standard GHG inventory as stated in Product Life Cycle Accounting and
Reporting Standard and realization of the steps are presented in this document. Note: Product Standard
names “carbon footprint” with the gloss “GHG product inventory”.
Steps in a product standard GHG inventory (Phatia et al. 2012)
Realization
(Business goals) What is the purpose of the study?
Goal is to find out - the approximate size of CO2-footprint - factors affecting on the CO2-footprint
Principles How are the following principles taken into consideration?
Relevance
Accuracy
Completeness
Consistency
Relevance: the study is relevant and serves the benefit of several operators. Accuracy: the GHG emissions are calculated with the best knowledge in hand making sure that the calculated emissions are not systematically greater or less than actual emissions. Uncertainties are reduced as far as practicable. Completeness: the boundaries are defined so that the information can be gathered within the time limit. Consistency: chosen methodologies, data and assumptions allow meaningful comparison of GHG inventory over time. Transparency: the method and time of gathering information is recorded and presented in the report.
Fundamentals of product life cycle accounting
Taken into consideration.
Defining the scope Requirements - CO2, CH4, N2O, SF6, PFSs and HFCs must be accounted
- Define studied product - Define unit of analysis = functional unit - Define reference flow
Scope: Raw material extraction and pre-processing of the raw materials of the bus. - All the 6 emissions are accounted according to the CML2001 impact assessment method. Almost all the used GWPs are from this source. - Studied product: a 12 m long urban transit bus with seat amount of about 40. - GHG emission caused by the extraction and pre-processing of the raw materials of a bus (t CO2e/bus) - reference flow = functional unit1
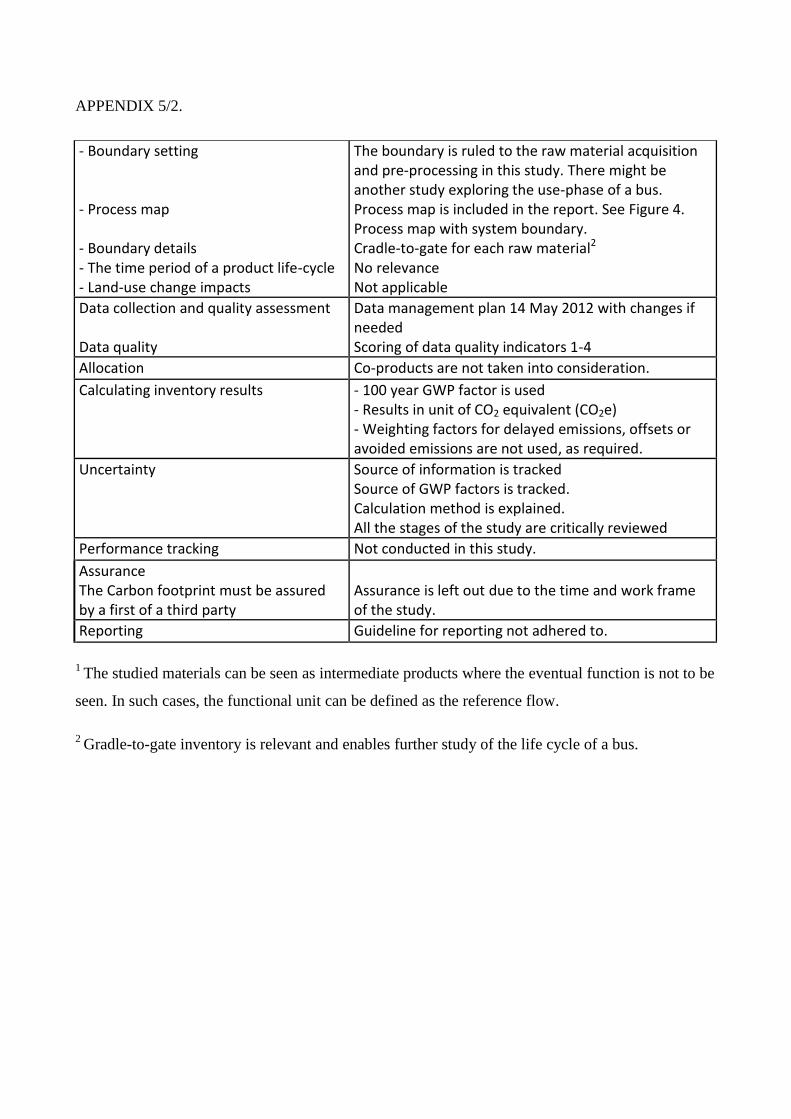
APPENDIX 5/2.
1 The studied materials can be seen as intermediate products where the eventual function is not to be
seen. In such cases, the functional unit can be defined as the reference flow.
2 Gradle-to-gate inventory is relevant and enables further study of the life cycle of a bus.
- Boundary setting - Process map - Boundary details - The time period of a product life-cycle - Land-use change impacts
The boundary is ruled to the raw material acquisition and pre-processing in this study. There might be another study exploring the use-phase of a bus. Process map is included in the report. See Figure 4. Process map with system boundary. Cradle-to-gate for each raw material2
No relevance Not applicable
Data collection and quality assessment Data quality
Data management plan 14 May 2012 with changes if needed Scoring of data quality indicators 1-4
Allocation Co-products are not taken into consideration.
Calculating inventory results - 100 year GWP factor is used - Results in unit of CO2 equivalent (CO2e) - Weighting factors for delayed emissions, offsets or avoided emissions are not used, as required.
Uncertainty Source of information is tracked Source of GWP factors is tracked. Calculation method is explained. All the stages of the study are critically reviewed
Performance tracking Not conducted in this study.
Assurance The Carbon footprint must be assured by a first of a third party
Assurance is left out due to the time and work frame of the study.
Reporting Guideline for reporting not adhered to.

