catalyst residence time prediction for fcc riser …cfdoil.com.br/2012/pdf/10_2_1730.pdf ·...
TRANSCRIPT

CATALYST RESIDENCE TIME PREDICTION FOR FCC RISER USING A CFD TRACER TECHNIQUE Alvarez C, H.C., Matos E.M, Mori M, Martignoni, W.
Institution:

OUTLINE
1. LABORATORY OVERVIEW
2. PROBLEM DESCRIPTION
3. GOALS
4. METHODOLOGY
5. RESULTS AND DISCUSSION
6. CONCLUSION
7. REFERENCES
Institution:

1. LABORATORY OVERVIEW
Institution:
Business Management and Chemical Processes
Research Laboratory (LPQGe). State University of
Campinas, Campinas, Brazil
Founded in 1984 Main topics research
• Application of Computational Fluid Dynamics
(CFD) in multiphase flow .
• Experimental measurements using Particle Image
Velocimetry (PIV) techniques.
Coordinator: Prof. Dr. Milton Mori

Figura 1. Fluid Catalytic Cracking (FCC) side-by-side
2. PROBLEM DESCRIPTION
• Reaction scheme
• Fluid dynamic
• Residence time distribution
Simulation requires good
understanding of :

3. GOALS
• To implement in CFX code a tracer technique to determine the residence time of the catalyst in a conventional riser of FCC.
• To estimate a distribution and accumulation residence time curves of catalyst for FCC riser.
Institution:

Software :
Ansys CFX 14.0
4. METHODOLOGY
Figure 2. CFD Solving Methodology Figure 3. Conventional riser Ali e Corriou, (1997).
Geometry

Table 1. Variables for different mesh densities
Figure 4. Details of tetrahedral mesh with prisms near the wall
980,000 Elements
Mesh
Monitoring Variables for different mesh densities
Number of elements and control volumes 334,000 534,000 765,000 980,000 1,457,000
Gasoline mass fraction 0.43 0.46 0.45 0.45 0.45
Pressure (Pa) -6,052 -6,068 -6,042 -6,052 -6,014

Institution:
• Geometry: Three-dimensional
• Fluid model: Gas-solid continuous flow (Eulerian-Eulerian)
• Continuity equations and Momentum equations
• Catalytic cracking kinetic model: A four lump approach was used as in the
previous work (Lopes et. al., 2011).
• Turbulence equations: k-epsilon Model
• Heat transfer model: heat transfer model between phases Ranz-Marshall
Pre-processing
Post processing
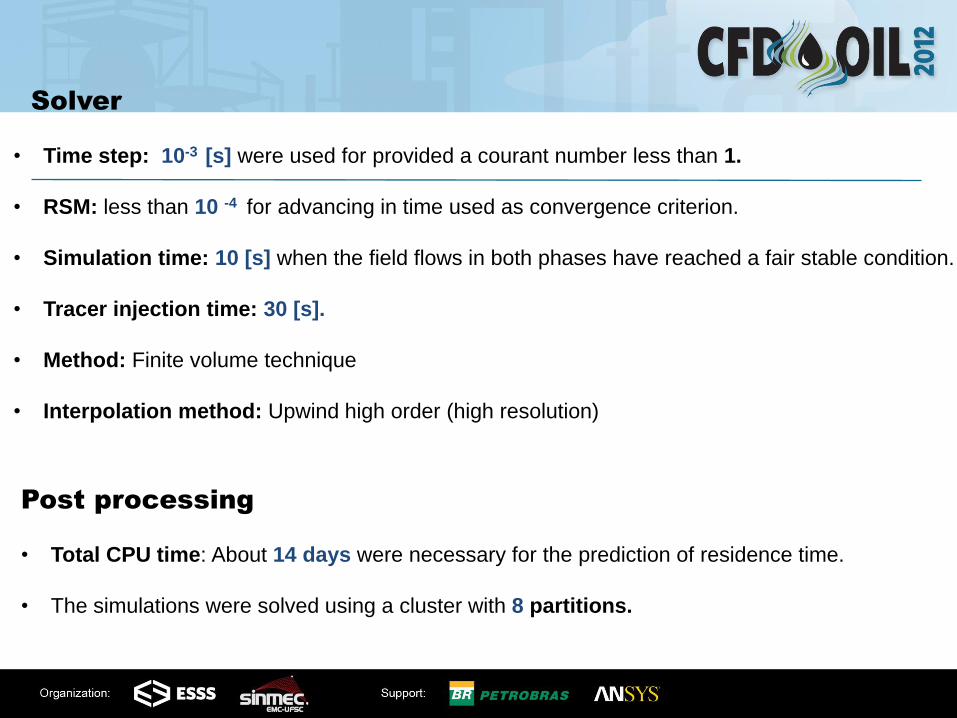
• Total CPU time: About 14 days were necessary for the prediction of residence time.
• The simulations were solved using a cluster with 8 partitions.
Solver
• Time step: 10-3 [s] were used for provided a courant number less than 1.
• RSM: less than 10 -4 for advancing in time used as convergence criterion.
• Simulation time: 10 [s] when the field flows in both phases have reached a fair stable condition.
• Tracer injection time: 30 [s].
• Method: Finite volume technique
• Interpolation method: Upwind high order (high resolution)
5. RESULTS AND DISCUSSION
Institution:
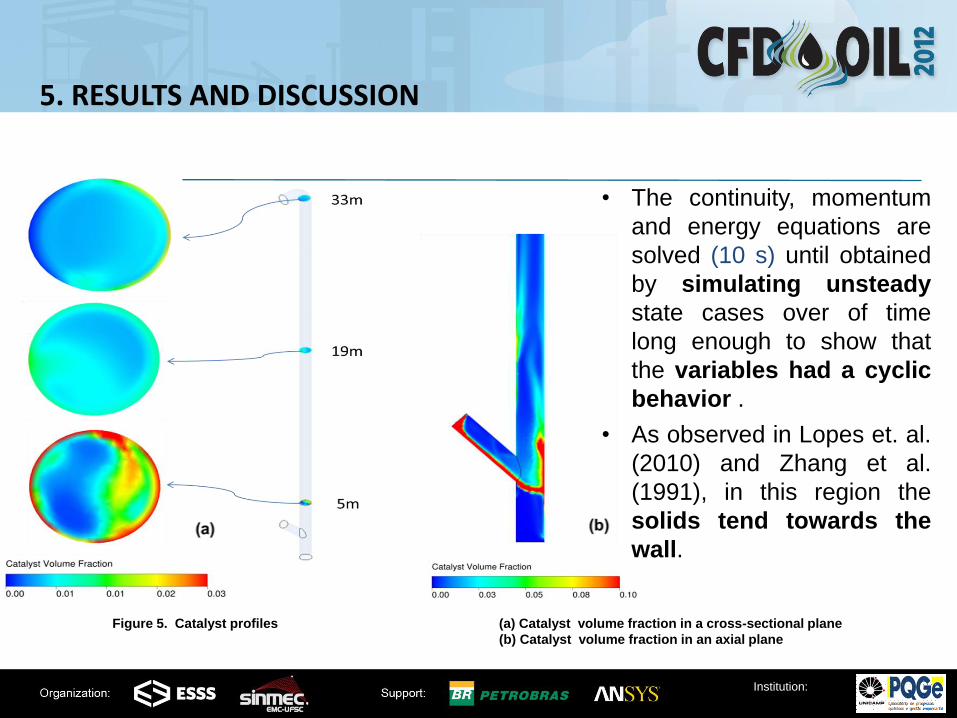
Figure 5. Catalyst profiles (a) Catalyst volume fraction in a cross-sectional plane
(b) Catalyst volume fraction in an axial plane
• As observed in Lopes et. al.
(2010) and Zhang et al.
(1991), in this region the
solids tend towards the
wall.
• The continuity, momentum
and energy equations are
solved (10 s) until obtained
by simulating unsteady
state cases over of time
long enough to show that
the variables had a cyclic
behavior .

Figure 6. Predict model results and the experimental data reported Derouin et al. (1997).

1. Tracer injection: 10 [kg] of tracer during 1 [s] in the inlet catalyst
side, by user define function
2. The tracer was measured in the outlet products.
3. Transport equation for tracer with convection term only.
Figura 4 Pulso da curva de traçador.
Tracer technique via CFD
Figure 7. Catalyst velocity in an
axial plane Figure 8. Pulse tracer curve.

Acording to Mohamed A. Fahim (2010)
the residence time in the industrial riser
is 2–10 [s].
Figure 9. Residence time distribution curve
Figure 10. Accumulated residence time
curve

6. CONCLUSION • Simulation results of kinetic model show a good prediction for gasoline and
gas oil yields. The results were validated against experimental data reported by Derouin et al. (1997).
• The results show a good prediction for resident time of catalyst behavior in risers as compared with experimental data reported by Fahim, M. A. et al. (2012).
• Tracer technique through the use of CFD can be useful for performance analysis of different riser designs and it can provide important estimation for the kinetic selectivity.
Acknowledgments: The authors are grateful for the financial support Petrobras for this research.
Institution:

7. REFERENCES
Institution:
1] Lopes, G.C.; Rosa L.M.; Mori, M.; Nunhez, J.R.; Martignoni, W.P. Three-
Dimensional Modeling of Fluid Catalytic Craking Industrial Riser Flow and Reactions.
Computers and Chemical Engineering, v.35, p.2159-2168 ,2011.
[2] Derouin,C., Nevicato,D., Forissier,M.,Wild,G.,& Bernard,J.R.. Hydrodynam-ics of
riser units and the impact on FCC operation. Industrial and Engineering Chemistry
Research, 36, 4504–4515. (1997).
[3] Mohammed A. Fahim. Fundamentals of Petroleum Refining by Elsevier. Pag. 241.
(2010).
[4] Ansys Inc. (US). ANSYS CFX-Solver theory guide. Release 12.0. Canonsburg, PA
(2009).
[5] Jianfei Song., Guogang Sun.,Zhongxi Chao., Yaodong Wei., Mingxian Shi. Gas
flow behavior and residence time distribution in a FCC disengage vessel with different
coupling configurations between two-stage separators. (2010).
[6] Zhang and Y. Tung. Radial voidage profiles in fast fluidized beds of different
diameters . Chemical Engineering Science Volume 46, Issue 12, 1991, Pages 3045–
3052.

Contacts:
Helver Crispiniano Alvarez Castro
PhD student
LPQGe/FEQ - Unicamp.
E-mail:
Thanks you for your atenttion !!
Prof. Dr. Milton Mori
LPQGe/FEQ - Unicamp.
E-mail: [email protected]