centuria metropolitan reit for personal use only fy15
TRANSCRIPT

12 AUGUST 2015 ASX:CMA
Centuria Metropolitan REIT
FY15Results Briefing
9 HELP STREET, CHATSWOOD NSW
For
per
sona
l use
onl
y
CENTURIA METROPOLITAN REIT I ASX:CMA I 12 AUGUST 2015 PAGE 1
FY15Contents
Section 1 FY15 ReviewSection 2 Operating UpdateSection 3 Strategy & OutlookSection 4 Appendices
For
per
sona
l use
onl
y

CENTURIA METROPOLITAN REIT I ASX:CMA I 12 AUGUST 2015 PAGE 2
FY15 REVIEW
For
per
sona
l use
onl
y

CENTURIA METROPOLITAN REIT I ASX:CMA I 12 AUGUST 2015 PAGE 3
FY15Achievements & Performance Since Listing
1) Includes the financial results of the previous stapled group (being Centuria Metropolitan REIT No. 1 and Centuria Metropolitan REIT No. 2 formerly known as Centuria Diversified Property Fund) from 1 July 2014 – 9 December 2014 and Centuria Metropolitan REIT stapled group from 10 December 2014 to 30 June 2015.
2) Distributable earnings is a financial measure which is not prescribed by Australian Accounting Standards (”AAS”) and represents the profit under AAS adjusted for specific non‑cash and significant items. The Directors consider that distributable earnings reflect the core earnings of the Fund.
3) Relates to the Centuria Metropolitan REIT stapled group for the period from 10 December 2014 to 30 June 2015.
4) Gearing is defined as interest bearing liabilities less cash divided by total assets less cash.
5) Based on CMA closing price of $2.06 as at 30 June 2015.
> Statutory net profit of $8.9 million 1
> Distributable earnings of 10.5 cents per stapled security 2,3
> Paid distribution totalling 9.2 cents per stapled security in line with guidance
> Completed the acquisition of four assets valued at $129.3 million partially funded by an approximately $100 million entitlement offer
> Completed 12 lease transactions totalling 5,116 square metres of space across the portfolio to 30 June 2015> 3 lease transactions across 988 square metres of vacant space> 9 renewals over 4,128 square metres> De-risked CH2M Hill’s FY16 expiry at 9 Help Street
> Portfolio occupancy of 96.7 per cent
> Increased NTA by 6 cents to $1.97 per stapled security
> Conservative gearing maintained at 24.0 per cent 4
> Market capitalisation of $245.5 million as at 30 June 2015 5
14 MARS ROAD, LANE COVE NSW
For
per
sona
l use
onl
y

CENTURIA METROPOLITAN REIT I ASX:CMA I 12 AUGUST 2015 PAGE 4
FY15Overview
1) As at 30 June 2015.
2) PDS forecast adjusted for actual listing date (10 December 2015) and the impact of CH2M Hill surrender payment as outlined in the CMA entitlement offer presentation dated 29 April 2015.
3) Includes the financial results of the previous stapled group (being Centuria Metropolitan REIT No. 1 and Centuria Metropolitan REIT No. 2 formerly known as Centuria Diversified Property Fund) from 1 July 2014 – 9 December 2014 and Centuria Metropolitan REIT stapled group from 10 December 2014 to 30 June 2015.
4) Distributable earnings is a financial measure which is not prescribed by Australian Accounting Standards (”AAS”) and represents the profit under AAS adjusted for specific non‑cash and significant items. The Directors consider that distributable earnings reflect the core earnings of the Fund.
5) Based on issue price at listing of $2.00 per stapled security.
6) Gearing is defined as interest bearing liabilities less cash divided by total assets less cash.
Allotment to Financial snapshot 1 30 June 2015 PDS Forecast 2 Change
Statutory profit/(loss) 3 ($m) 8.9 4.8
Distributable earnings 4 ($m) 8.2 7.5
Distributable earnings per stapled security 4,5 (cents) 10.5 10.5
Annualised distributable earnings yield 4,5 (%) 9.37 9.37
Distribution ($m) 8.6 6.9
Distribution per stapled security (cents) 9.2 9.2
Distribution yield (%) 8.25 8.25
Balance sheet metrics 30 June 2015 PDS 2 Change
Total assets ($m) 330.0 185.2
NTA per security ($) 1.97 1.91
Gearing 6 (%) 24.0 25.0
For
per
sona
l use
onl
y

CENTURIA METROPOLITAN REIT I ASX:CMA I 12 AUGUST 2015 PAGE 5
OPERATING UPDATE
For
per
sona
l use
onl
y

CENTURIA METROPOLITAN REIT I ASX:CMA I 12 AUGUST 2015 PAGE 6
FY15Key Metrics
1) As at 30 June 2015.
2) Weighted by book value.
3) By area.
Portfolio snapshot 1
Number of assets (#) 12
Book value ($m) 323.1
Independent valuation ($m) 322.1
Weighted average capitalisation rate 2 (%) 8.43
Occupancy 3 (%) 96.7
Weighted average lease expiry 3 (years) 4.8
Geographic diversification
NSW35%
QLD32%
ACT20%
SA14%
Asset type diversification
Office82%
Industrial18%
For
per
sona
l use
onl
y

CENTURIA METROPOLITAN REIT I ASX:CMA I 12 AUGUST 2015 PAGE 7
FY15Portfolio
1) By area as at 30 June 2015.
2) By gross income.
> Portfolio occupancy of 96.7 per cent 1
> Portfolio WALE of 4.8 years 1
> Portfolio rental growth is underpinned by 92 per cent of leases containing average fixed rental reviews of 3.6 per cent per annum
80%
60
40
20
0
Weighted Average Lease Expiry 1
Vacant FY16 FY17 FY18 FY19 FY20+
3.3%7.3%
13.6%
4.7%7.9%
63.2%
Austar Entertainment Pty Limited
BlueScope Steel Limited
Minister for Infrastructure
Cochlear Ltd
Minister for Transport & Infrastructure
CSC Australia
Royal District Nursing Service
CH2M Hill Australia
Advisian Pty Ltd (Worsley Parsons)
St George Bank
12.2%
9.9%
6.7%
6.5%
5.1%
5.1%
4.3%
2.8%
2.7%
2.2%
0 10%5% 15%
Tenant diversification 2
For
per
sona
l use
onl
y

CENTURIA METROPOLITAN REIT I ASX:CMA I 12 AUGUST 2015 PAGE 8
FY15Leasing
1) CMA listed on 10 December 2014.
2) By area as at 30 June 2015.
> Executed 12 lease transactions over 5,116 square metres since listing to 30 June 2015 1
> 3 new leases across 988 square metres of vacant space> 9 renewals across 4,128 square metres
> De-risked ~2,900 square metre FY16 expiry at 9 Help Street, Chatswood, NSW> Agreed renewal over 1,815 square metres with CH2M Hill for a further 3 year term
from March 2016 expiry at passing rents> Agreed partial surrender (in return for upfront payment) with CH2M Hill over
~1,090 square metres (refer Post 30 June slide for subsequent leasing activity)
> Other key leasing transactions include:> 3 Carlingford Road, Epping – new lease over 234 square metres to Personal Eyes,
and renewed 411 square metres to BDH & Co > 44 Hampden Road, Artarmon – renewed a total of 826 square metres to ASE IT,
Phillip Chun & Associates and The Leukaemia Foundation > 9 Help Street, Chatswood – renewed 775 square metres to Lend Lease Engineering
> Portfolio WALE maintained at 4.8 years 2
44 HAMPDEN ROAD, ARTARMON NSW
9 HELP STREET, CHATSWOOD NSW
For
per
sona
l use
onl
y
CENTURIA METROPOLITAN REIT I ASX:CMA I 12 AUGUST 2015 PAGE 9
FY15Asset Valuations
1) Includes independent valuations undertaken at acquisition.
2) As at 30 June 2015.
3) PDS dated 11 November 2014.
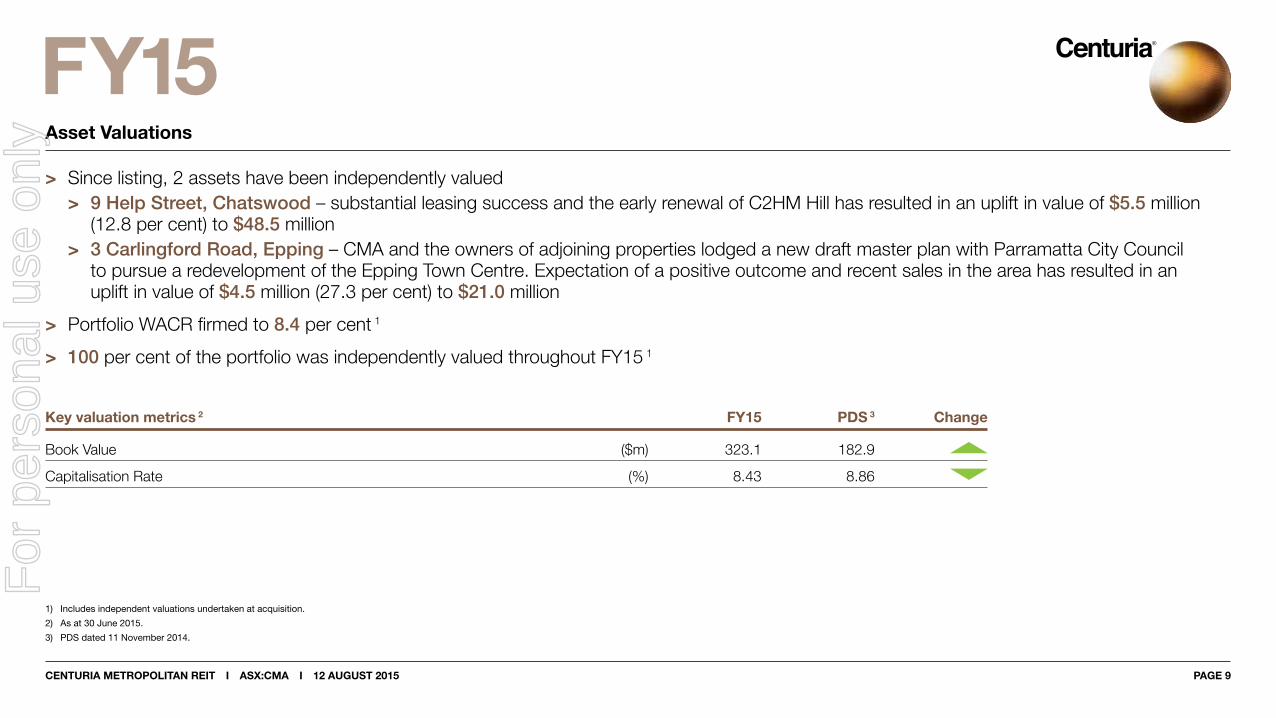
> Since listing, 2 assets have been independently valued> 9 Help Street, Chatswood – substantial leasing success and the early renewal of C2HM Hill has resulted in an uplift in value of $5.5 million
(12.8 per cent) to $48.5 million> 3 Carlingford Road, Epping – CMA and the owners of adjoining properties lodged a new draft master plan with Parramatta City Council
to pursue a redevelopment of the Epping Town Centre. Expectation of a positive outcome and recent sales in the area has resulted in an uplift in value of $4.5 million (27.3 per cent) to $21.0 million
> Portfolio WACR firmed to 8.4 per cent 1
> 100 per cent of the portfolio was independently valued throughout FY15 1
Key valuation metrics 2 FY15 PDS 3 Change
Book Value ($m) 323.1 182.9
Capitalisation Rate (%) 8.43 8.86
For
per
sona
l use
onl
y

CENTURIA METROPOLITAN REIT I ASX:CMA I 12 AUGUST 2015 PAGE 10
FY15Capital Management
1) As at 30 June 2015.
2) The Trust entered into a 5 year swap at 2.55% on 9 July for an additional $36 million of drawn debt.
3) Includes amortised loan establishment costs of 10bps per annum.
> As at 30 June 2015 the Fund had two secured domestic bank debt facilities totalling $95 million
> 99 per cent of drawn debt is hedged through maturity at a total cost of 4.0 per cent 2
> Target hedging greater than 50 per cent of drawn debt
> The Fund’s target gearing level is below 30 per cent however, management will consider short term increases to undertake strategic acquisitions that are beneficial to securityholders
> CMA operated its DRP for the 30 June 2015 quarter raising approximately $0.5 million
Key debt metrics 1
Facility limit ($m) 95.0
Amount drawn ($m) 84.6
Undrawn capacity ($m) 10.4
Weighted average debt expiry (years) 4.7
Proportion hedged (%) 99.3
Weighted average hedge maturity (years) 4.7
Interest rate (%) 4.0
Interest cover ratio (x) 8.6
For
per
sona
l use
onl
y

CENTURIA METROPOLITAN REIT I ASX:CMA I 12 AUGUST 2015 PAGE 11
FY15Capital Transactions
> Over the period the Fund completed four strategic acquisitions totalling $129.3 million, funded through a combination of bank debt ($29.3 million) and an entitlement offer (approximately $100 million)
> The acquisitions were in line with the Funds strategy to invest in office and industrial assets in Australian metropolitan markets which generate income returns and offer the potential for capital growth through active management
Property State Valuation 1 Cap rate NLA (sqm)
60 Marcus Clarke, Canberra ACT 49.1 8.3% 12,215
35 Robina Town Centre Drive, Robina QLD 46.0 7.8% 9,814
131-139 Grenfell Street, Adelaide 2 SA 20.0 9.0% 4,052
54 Marcus Clarke, Canberra ACT 14.2 10.0% 5,161
Total / weighted average 129.3 8.4% 31,241
1) As at 30 June 2015.
2) Strata office levels 5‑9.
For
per
sona
l use
onl
y

CENTURIA METROPOLITAN REIT I ASX:CMA I 12 AUGUST 2015 PAGE 12
FY15Post 30 June 2015
> Post 30 June 2015, 7 lease commitments have been agreed or executed totalling 2,536 square metres > 4 new leases totalling 1,220 square metres> 3 renewals totalling 1,316 square metres
> Key leases included:> 60 Marcus Clarke Street, Canberra – commitments have been secured to renew
over 1,002 square metres, and for a new lease over 424 square metres> 9 Help Street, Chatswood – new leases over 645 square metres of the area
surrendered by CH2M Hill, and renewed 314 square metres> 3 Carlingford Road, Epping – new lease over 151 square metres
3 CARLINGFORD ROAD, EPPING NSW
60 MARCUS CLARKE STREET, CANBERRA ACT
1) By area.
For
per
sona
l use
onl
y

CENTURIA METROPOLITAN REIT I ASX:CMA I 12 AUGUST 2015 PAGE 13
FY15Key Asset Update : 9 Help Street
> Asset acquired with near term expiry risk associated with ~2,900 square metre C2HM Hill tenancy
> Agreed early surrender with C2HM Hill over ~1,090 square metres in exchange for an upfront payment
> Renewed the balance 1,815 square metre tenancy for a further 3 year term from March 2016
> Remaining ~1,090 square metre vacancy subsequently leased to a combination of new and incumbent tenants
> Valuation improvement from $43.0 million at listing to $48.5 million at 30 June 2015
50%
25
0
Asset WALE comparison at 30 June
Vacant FY16 FY17 FY18 FY19 FY20+
5.5%
10.0%
22.5%
42.3%
26.5%24.7%
18.1%18.1%
24.9%
2.3% 2.6%2.6%
At Iisting 2015
ALL IMAGES: 9 HELP STREET, CHATSWOOD NSW
For
per
sona
l use
onl
y
CENTURIA METROPOLITAN REIT I ASX:CMA I 12 AUGUST 2015 PAGE 14
FY15Key Asset Update : 3 Carlingford Road
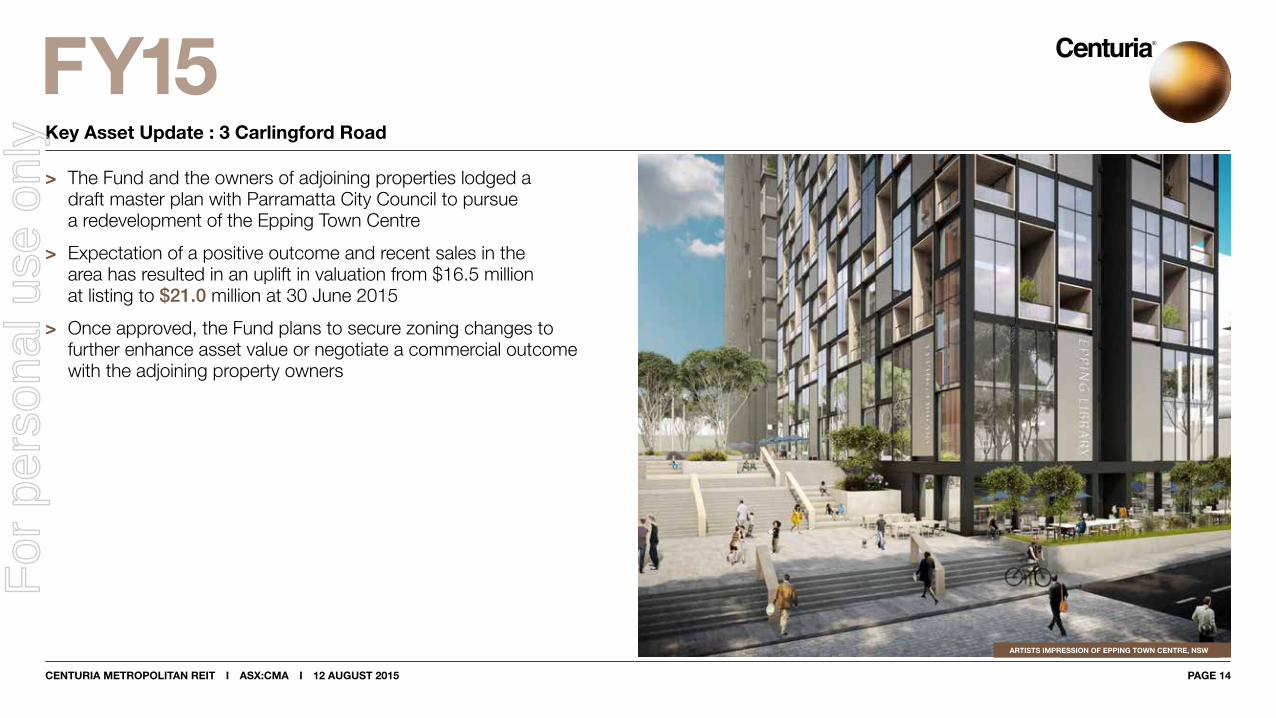
> The Fund and the owners of adjoining properties lodged a draft master plan with Parramatta City Council to pursue a redevelopment of the Epping Town Centre
> Expectation of a positive outcome and recent sales in the area has resulted in an uplift in valuation from $16.5 million at listing to $21.0 million at 30 June 2015
> Once approved, the Fund plans to secure zoning changes to further enhance asset value or negotiate a commercial outcome with the adjoining property owners
ARTISTS IMPRESSION OF EPPING TOWN CENTRE, NSW
For
per
sona
l use
onl
y

CENTURIA METROPOLITAN REIT I ASX:CMA I 12 AUGUST 2015 PAGE 15
FY15Key Asset Update : 54 & 60 Marcus Clarke Street
> Adjoining assets acquired in May 2015 on a combined passing yield of 8.5 per cent with approximately 76 per cent occupancy
> The Fund will undertake refurbishments over the near to medium term to modernise the building and enhance its already strong appeal to private sector tenants
> Since taking ownership management has negotiated in excess of 1,500 square metres of lease commitments from new and incumbent tenants
> Fully leased the passing yield on the assets is expected to be greater than 10 per cent
60 MARCUS CLARKE STREET, CANBERRA ACT
For
per
sona
l use
onl
y
CENTURIA METROPOLITAN REIT I ASX:CMA I 12 AUGUST 2015 PAGE 16
STRATEGY & OUTLOOK
For
per
sona
l use
onl
y

CENTURIA METROPOLITAN REIT I ASX:CMA I 12 AUGUST 2015 PAGE 17
FY15Strategy
> Pursue strategic acquisitions that fit CMA’s strategy and provide meaningful benefits to securityholders> Established suburban and fringe CBD markets, particularly those markets where competing supply is being withdrawn
for alternate use> Seek assets that provide secure income streams or that can be enhanced through active management and
repositioning strategies> Maintain a strong balance sheet through conservative capital management
> Continue executing leasing initiatives to ensure portfolio occupancy and income are maximised> Key asset specific strategies include:
Fund
Portfolio
9 Help Street, Chatswood
Continue leasing initiatives including renewals with key tenants
54 & 60 Marcus Clarke Street, Canberra
Undertake lobby and street level refurbishments, to compliment the leasing campaign already underway
3 Carlingford Road, Epping
Progress draft master plan approval with Parramatta City Council to secure zoning changes to further enhance asset value
1 Richmond Road, Keswick
Progress leasing and lobby refurbishment initiatives in order to reposition the asset
44 Hampden Road, Artarmon
Determine the viability of acquiring the asset’s freehold interest to unlock development potentialF
or p
erso
nal u
se o
nly

CENTURIA METROPOLITAN REIT I ASX:CMA I 12 AUGUST 2015 PAGE 18
FY15Outlook
1) Distributable earnings is a financial measure which is not prescribed by Australian Accounting Standards (”AAS”) and represents the profit under AAS adjusted for specific non‑cash and significant items. The Directors consider that distributable earnings reflect the core earnings of the Fund.
2) CMA unit price as at 11 August 2015.
> FY16 distributable earnings guidance of 17.9 cents per stapled security 1
> FY16 distribution guidance of 17.0 cents per stapled security in line with PDS forecasts
> Indicative quarterly distribution of 4.25 cents per stapled security
> Distribution yield of 8.25 per cent based on $2.06 unit price 2
54 MARCUS CLARKE STREET, CANBERRA ACT
For
per
sona
l use
onl
y
CENTURIA METROPOLITAN REIT I ASX:CMA I 12 AUGUST 2015 PAGE 19
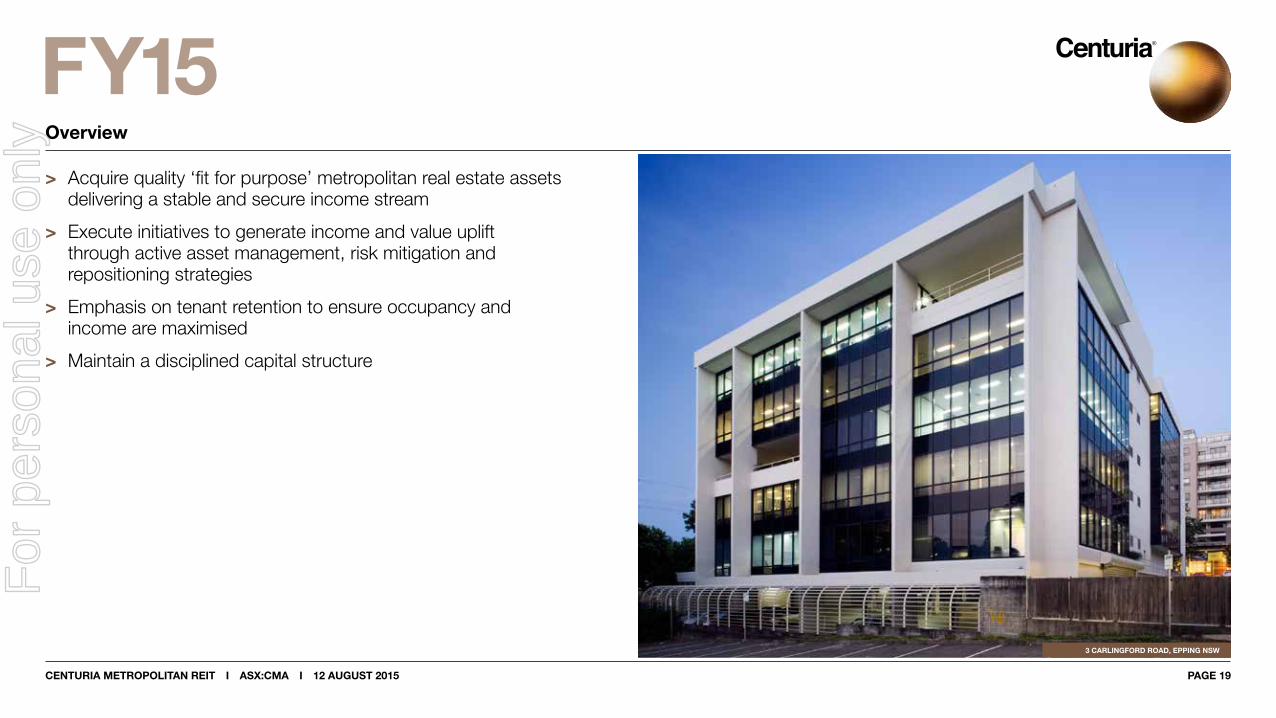
FY15Overview
> Acquire quality ‘fit for purpose’ metropolitan real estate assets delivering a stable and secure income stream
> Execute initiatives to generate income and value uplift through active asset management, risk mitigation and repositioning strategies
> Emphasis on tenant retention to ensure occupancy and income are maximised
> Maintain a disciplined capital structure
3 CARLINGFORD ROAD, EPPING NSW
For
per
sona
l use
onl
y
CENTURIA METROPOLITAN REIT I ASX:CMA I 12 AUGUST 2015 PAGE 20
APPENDICES
For
per
sona
l use
onl
y

FY15
CENTURIA METROPOLITAN REIT I ASX:CMA I 12 AUGUST 2015 PAGE 21
Appendix A Income StatementAppendix B Distribution StatementAppendix C Balance SheetAppendix D Investment Portfolio Overview
For
per
sona
l use
onl
y

CENTURIA METROPOLITAN REIT I ASX:CMA I 12 AUGUST 2015 PAGE 22
FY15A : Income Statement 1
Note: Tables may not add due to impact of rounding.
1) Relates to the Centuria Metropolitan REIT stapled group for the period from 10 December 2014 to 30 June 2015.
2) PDS earnings forecasts adjusted for actual listing date (10 December 2015) and the impact of CH2M Hill surrender payment as outlined in the CMA entitlement offer presentation dated 29 April 2015.
3) Net of amortisation of leasing commissions and tenant incentives.
Allotment to PDS 2
$m 30 June 2015 Forecast
Gross property income 13.0 11.5
Straight lining of rental income 3 0.1 (0.1)
Interest Income 0.1 —
Total revenue 13.3 11.5
Direct property expenses (2.7) (2.2)
Responsible entity fees (0.6) (0.6)
Finance costs (1.2) (1.2)
Management and other administrative expenses (0.4) (0.2)
Total expenses (4.9) (4.1)
Sub-total 8.4 7.4
Investment properties revaluation gain / (loss) 2.6 —
Net profit 11.2 7.4
For
per
sona
l use
onl
y
CENTURIA METROPOLITAN REIT I ASX:CMA I 12 AUGUST 2015 PAGE 23
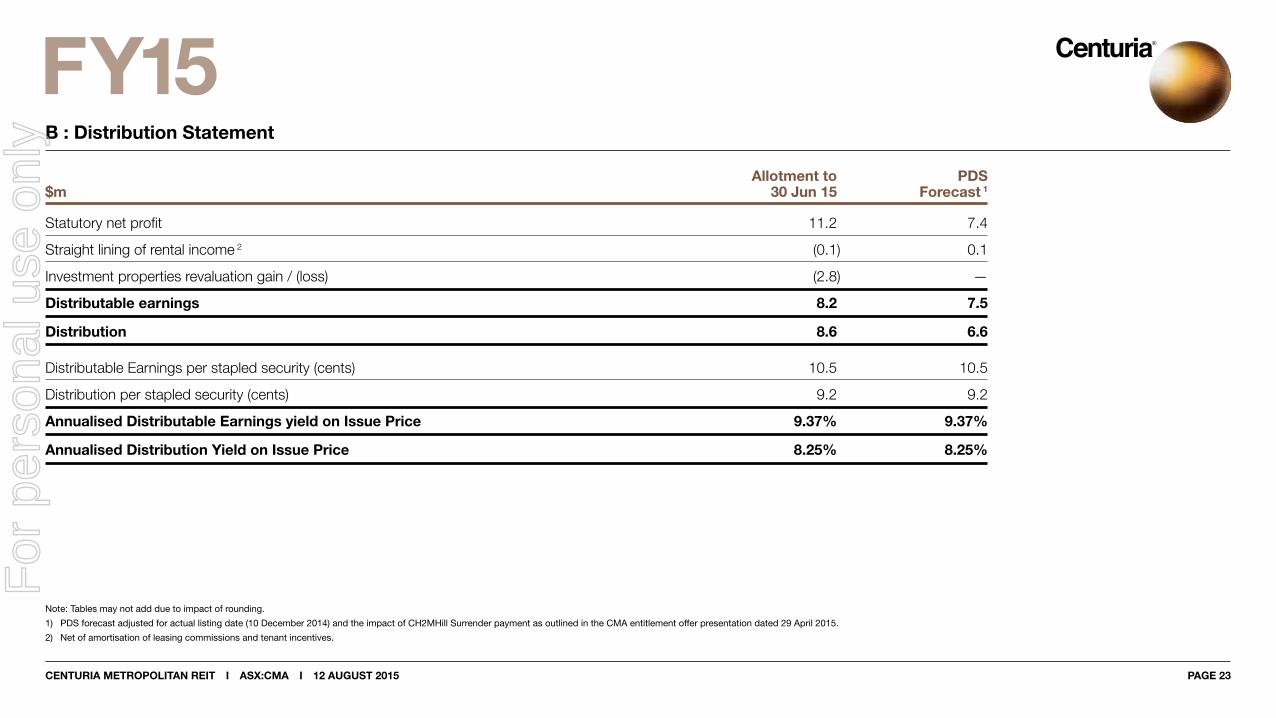
FY15B : Distribution Statement
Note: Tables may not add due to impact of rounding.
1) PDS forecast adjusted for actual listing date (10 December 2014) and the impact of CH2MHill Surrender payment as outlined in the CMA entitlement offer presentation dated 29 April 2015.
2) Net of amortisation of leasing commissions and tenant incentives.
Allotment to PDS$m 30 Jun 15 Forecast 1
Statutory net profit 11.2 7.4
Straight lining of rental income 2 (0.1) 0.1
Investment properties revaluation gain / (loss) (2.8) —
Distributable earnings 8.2 7.5
Distribution 8.6 6.6
Distributable Earnings per stapled security (cents) 10.5 10.5
Distribution per stapled security (cents) 9.2 9.2
Annualised Distributable Earnings yield on Issue Price 9.37% 9.37%
Annualised Distribution Yield on Issue Price 8.25% 8.25%
For
per
sona
l use
onl
y

CENTURIA METROPOLITAN REIT I ASX:CMA I 12 AUGUST 2015 PAGE 24
FY15C : Balance Sheet
Note: Tables may not add due to impact of rounding.
1) Gearing is defined as interest bearing liabilities less cash divided by total assets less cash.
$m 30 June 2015 PDS
Cash 6.3 2.0
Investment properties 323.1 182.9
Other assets 0.6 0.4
Total assets 330.0 185.2
Interest bearing liabilities 83.9 47.7
Derivative financial instruments 0.7 —
Other liabilities 10.1 1.3
Total liabilities 94.7 49.0
Net assets 235.3 136.2
Stapled securities on issue (millions) 119.2 71.5
Net tangible assets per stapled security ($) 1.97 1.91
Gearing (%) 1 24.0% 25.0%
For
per
sona
l use
onl
y

CENTURIA METROPOLITAN REIT I ASX:CMA I 12 AUGUST 2015 PAGE 25
FY15D : Investment Portfolio Overview
1) Based on most recent independent valuations.2) As at 1 July 2015.3) As at 30 June 2015, by area.4) Inclusive of vendor rental guarantee over 1,297 square metres until 31 January 2016.4) Strata office levels 5 ‑ 9.
Book Independent NLA WALE3
Property State value ($m) Valuation ($m) 1 Passing yield 2 Cap rate (sqm) (years) Occupancy 3
Office60 Marcus Clarke, Canberra ACT 49.1 49.1 8.7% 8.4% 12,215 2.1 87.6%
9 Help Street, Chatswood NSW 48.5 48.5 7.5% 8.3% 9,401 1.8 94.5%
35 Robina Town Centre Drive, Robina QLD 46.0 46.0 7.9% 7.8% 9,814 8.3 100.0%
555 Coronation Drive, Brisbane QLD 33.8 33.8 8.9% 8.5% 5,591 3.4 100.0%
1 Richmond Road, Keswick SA 25.2 25.2 11.2% 9.5% 8,135 3.5 100.0%
3 Carlingford Road, Epping NSW 21.0 21.0 7.8% 7.5% 4,702 2.6 98.3%
131-139 Grenfell Street, Adelaide 4 SA 20.0 20.0 9.1% 9.0% 4,052 4.4 100.0%
54 Marcus Clarke, Canberra ACT 14.2 14.2 7.6% 10.0% 5,161 1.9 75.7%
44 Hampden Road, Artarmon NSW 7.6 7.3 9.7% 8.8% 2,339 2.1 100.0%
Industrial149 Kerry Road, Archerfield QLD 22.7 22.2 7.8% 7.8% 13,774 9.5 100.0%
14 Mars Road, Lane Cove NSW 18.5 18.5 10.9% 9.3% 10,601 6.5 100.0%
13 Ferndell Street, Granville NSW 16.6 16.4 9.5% 8.3% 15,301 4.8 100.0%
Total / weighted average 323.1 322.1 8.7% 8.4% 101,085 4.8 96.7%
For
per
sona
l use
onl
y

CENTURIA METROPOLITAN REIT I ASX:CMA I 12 AUGUST 2015 PAGE 26
ABOUT CENTURIA
For
per
sona
l use
onl
y

CENTURIA METROPOLITAN REIT I ASX:CMA I 12 AUGUST 2015 PAGE 27
FY15Centuria Capital
Centuria Investment Bonds offers a range of unit-linked, tax effective investment bonds which can be used to meet a range of personal and financial goals.
Our Investment Bonds may suit investors that are looking for:> A tax effective alternative to complement superannuation> A way to build wealth over the long term> Certainty in estate planning> A savings vehicle for children’s education> A strategy to help reduce aged care fees> A way to fund a business succession plan> An alternative to investing in a company structure
The range of unit-linked investment options offered within our investment bonds covers balanced to aggressive risk profiles.
Centuria has a track record of developing high quality investment products with the aim of delivering strong returns to investors
Centuria Capital (CNI) is an ASX-listed specialist investment manager with $1.7 billion in funds under management and a 35 year track-record of delivering value for investors, advisers and shareholders. There are two divisions to our business; Centuria Investment Bonds and Centuria Property Funds.
Centuria Property Fund Limited (CPFL) currently owns and manages 27 individual properties with a combined value of approximately $1.0 billion. In addition to Centuria’s portfolio of 13 unlisted funds, we recently launched our first ASX-listed fund, the Centuria Metropolitan REIT (CMA) and our first residential development fund.
For
per
sona
l use
onl
y

Further Information:
Shalome Mielewska Investor Relations +61 2 8923 8962
Nicholas Blake Trust Manager +61 2 8923 8923
www.centuria.com.au/listed-property
CENTURIA METROPOLITAN REIT I ASX:CMA I 12 AUGUST 2015
Centuria Metropolitan REIT
Thank you
For
per
sona
l use
onl
y
CENTURIA METROPOLITAN REIT I ASX:CMA I 12 AUGUST 2015 PAGE 29
FY15Important Information
This presentation has been prepared by Centuria Property Funds Limited Limited (ABN 11 086 553 639, AFSL 231 149) (‘CPFL’) as responsible entity of the stapled entities Centuria Metropolitan REIT No.1 (ARSN 124 364 718) and Centuria Metropolitan REIT No.2 (ARSN 124 364 656), collectively known as the Centuria Metropolitan REIT (‘CMA’ or the ‘Trust’).
All information and statistics in this presentation are current as at 12 August unless otherwise specified. It contains selected summary information and does not purport to be all‑inclusive or to contain all of the information that may be relevant, or which a prospective investor may require in evaluations for a possible investment CMA. It should be read in conjunction with CMA’s periodic and continuous disclosure announcements which are available at www.centuria.com.au. The recipient acknowledges that circumstances may change and that this presentation may become outdated as a result. This presentation and the information in it are subject to change without notice and CPFL is not obliged to update this presentation.
This presentation is provided for general information purposes only. It is not a product disclosure statement, pathfinder document or any other disclosure document for the purposes of the Corporations Act and has not been, and is not required to be, lodged with the Australian Securities & Investments Commission. It should not be relied upon by the recipient in considering the merits of CMA or the acquisition of securities in CMA . Nothing in this presentation constitutes investment, legal, tax, accounting or other advice and it is not to be relied upon in substitution for the recipient’s own exercise of independent judgment with regard to the operations, financial condition and prospects of CMA.
The information contained in this presentation does not constitute financial product advice. Before making an investment decision, the recipient should consider its own financial situation, objectives and needs, and conduct its own independent investigation and assessment of the contents of this presentation, including obtaining investment, legal, tax, accounting and such other advice as it considers necessary or appropriate. This presentation has been prepared without taking account of any person’s individual investment objectives, financial situation or particular needs. It is not an invitation or offer to buy or sell, or a solicitation to invest in or refrain from investing in, securities in CMA or any other investment product.
The information in this presentation has been obtained from and based on sources believed by CPFL to be reliable.
To the maximum extent permitted by law, CPFL and its related bodies corporate make no representation or warranty, express or implied, as to the accuracy, completeness, timeliness or reliability of the contents of this presentation. To the maximum extent permitted by law, CPFL does not accept any liability (including, without limitation, any liability arising from fault or negligence) for any loss whatsoever arising from the use of this presentation or its contents or otherwise arising in connection with it.
This presentation may contain forward‑looking statements, guidance, forecasts, estimates , prospects, projections or statements in relation to future matters (‘Forward Statements’). Forward Statements can generally be identified by the use of forward looking words such as “anticipate”, “estimates”, “will”, “should”, “could”, “may”, “expects”, “plans”, “forecast”, “target” or similar expressions. Forward Statements including indications, guidance or outlook on future revenues, distributions or financial position and performance or return or growth in underlying investments are provided as a general guide only and should not be relied upon as an indication or guarantee of future performance. No independent third party has reviewed the reasonableness of any such statements or assumptions. No member of CPFL represents or warrants that such Forward Statements will be achieved or will prove to be correct or gives any warranty, express or implied, as to the accuracy, completeness, likelihood of achievement or reasonableness of any Forward Statement contained in this presentation. Except as required by law or regulation, CPFL assumes no obligation to release updates or revisions to Forward Statements to reflect any changes. The reader should note that this presentation may also contain pro‑forma financial information.
All dollar values are in Australian dollars ($ or A$) unless stated otherwise.For
per
sona
l use
onl
y