chapter 18: air quality a. introduction
TRANSCRIPT

18-1
Chapter 18: Air Quality
A. INTRODUCTION This chapter examines the potential for air quality impacts from the proposed actions. Ambient air quality is affected by numerous sources and activities that introduce air pollutants into the atmosphere. A comprehensive assessment of potential air quality impacts from the proposed actions was performed. The analyses described in the sections that follow were performed utilizing the general procedures recommended in the City Environmental Quality Review (CEQR) Technical Manual.
Air quality impacts can be either direct or indirect. Direct impacts stem from emissions generated by stationary sources associated with the proposed actions, such as emissions from fuel burned on-site for heating, ventilation, and air conditioning (HVAC) systems. Indirect effects include emissions from motor vehicles (mobile sources) generated by the proposed actions and effects of existing stationary sources on the proposed actions.
B. POLLUTANTS FOR ANALYSIS Ambient air quality is affected by air pollutants produced by both motor vehicles and stationary sources. Emissions from motor vehicles are referred to as mobile source emissions, while emissions from fixed facilities are referred to as stationary source emissions. Ambient concentrations of carbon monoxide (CO) are predominantly influenced by mobile source emissions. Particulate matter (PM), volatile organic compounds (VOCs), and nitrogen oxides (NO and NO2, collectively referred to as NOx) are emitted from both mobile and stationary sources. Fine PM is also formed when emissions of NOx, sulfur oxides (SOx), ammonia, organic compounds, and other gases react or condense in the atmosphere. Emissions of sulfur dioxide (SO2) are associated mainly with stationary sources, and sources utilizing non-road diesel such as diesel trains, marine engines, and non-road vehicles (e.g., construction engines). On-road diesel vehicles currently contribute very little to SO2 emissions since the sulfur content of on-road diesel fuel, which is federally regulated, is extremely low. Ozone is formed in the atmosphere by complex photochemical processes that include NOx and VOCs.
CARBON MONOXIDE
CO, a colorless and odorless gas, is produced in the urban environment primarily by the incomplete combustion of gasoline and other fossil fuels. In urban areas, approximately 80 to 90 percent of CO emissions are from motor vehicles. Since CO is a reactive gas which does not persist in the atmosphere, CO concentrations can vary greatly over relatively short distances; elevated concentrations are usually limited to locations near crowded intersections, heavily traveled and congested roadways, parking lots, and garages. Consequently, CO concentrations must be predicted on a local, or microscale, basis.

Coney Island Rezoning
18-2
The proposed actions would result in changes in traffic patterns and an increase in traffic volume in the study area. Therefore, a mobile source analysis was conducted at critical intersections in the study area to evaluate future CO concentrations with and without the proposed actions.
A parking garage analysis was also conducted to evaluate future CO concentrations with the operation of prototypical parking garages, expected to result in the greatest effect on air quality.
NITROGEN OXIDES, VOCS, AND OZONE
NOx are of principal concern because of their role, together with VOCs, as precursors in the formation of ozone. Ozone is formed through a series of reactions that take place in the atmosphere in the presence of sunlight. Because the reactions are slow, and occur as the pollutants are advected downwind, elevated ozone levels are often found many miles from sources of the precursor pollutants. The effects of NOx and VOC emissions from all sources are therefore generally examined on a regional basis. The contribution of any action or project to regional emissions of these pollutants would include any added stationary or mobile source emissions; the change in regional mobile source emissions of these pollutants would be related to the total vehicle miles traveled added or subtracted on various roadway types throughout the New York metropolitan area, which is designated as a moderate non-attainment area for ozone by the U.S. Environmental Protection Agency (EPA).
The proposed actions would not have a significant effect on the overall volume of vehicular travel in the metropolitan area; therefore, no measurable impact on regional NOx emissions or on ozone levels is predicted. An analysis of action-related emissions of these pollutants from mobile sources was therefore not warranted.
In addition to being a precursor to the formation of ozone, NO2 (one component of NOx) is also a regulated pollutant. Since NO2 is mostly formed from the transformation of NO in the atmosphere, it is mostly of concern further downwind from large stationary point sources, and is not a local concern from mobile sources. (NOx emissions from fuel combustion consist of approximately 90 percent NO and 10 percent NO2 at the source.) Potential impacts on local NO2 concentrations from the fuel combustion for the proposed actions’ heat and hot water boiler systems were evaluated.
LEAD
Airborne lead emissions are currently associated principally with industrial sources. Effective January 1, 1996, the Clean Air Act (CAA) banned the sale of the small amount of leaded fuel that was still available in some parts of the country for use in on-road vehicles, concluding a 25-year effort to phase out lead in gasoline. Even at locations in the New York City area where traffic volumes are very high, atmospheric lead concentrations are far below the 3-month average national standard of 0.15 micrograms per cubic meter (µg/m3).
No significant sources of lead are associated with the proposed actions and, therefore, analysis was not warranted.
RESPIRABLE PARTICULATE MATTER—PM10 AND PM2.5
PM is a broad class of air pollutants that includes discrete particles of a wide range of sizes and chemical compositions, as either liquid droplets (aerosols) or solids suspended in the atmosphere. The constituents of PM are both numerous and varied, and they are emitted from a wide variety of sources (both natural and anthropogenic). Natural sources include the condensed

Chapter 18: Air Quality
18-3
and reacted forms of naturally occurring VOC; salt particles resulting from the evaporation of sea spray; wind-borne pollen, fungi, molds, algae, yeasts, rusts, bacteria, and material from live and decaying plant and animal life; particles eroded from beaches, soil, and rock; and particles emitted from volcanic and geothermal eruptions and from forest fires. Naturally occurring PM is generally greater than 2.5 micrometers in diameter. Major anthropogenic sources include the combustion of fossil fuels (e.g., vehicular exhaust, power generation, boilers, engines, and home heating), chemical and manufacturing processes, all types of construction, agricultural activities, as well as wood-burning stoves and fireplaces. PM also acts as a substrate for the adsorption (accumulation of gases, liquids, or solutes on the surface of a solid or liquid) of other pollutants, often toxic and some likely carcinogenic compounds.
As described below, PM is regulated in two size categories: particles with an aerodynamic diameter of less than or equal to 2.5 micrometers (PM2.5), and particles with an aerodynamic diameter of less than or equal to 10 micrometers (PM10, which includes PM2.5). PM2.5 has the ability to reach the lower regions of the respiratory tract, delivering with it other compounds that adsorb to the surfaces of the particles, and is also extremely persistent in the atmosphere. PM2.5 is mainly derived from combustion material that has volatilized and then condensed to form primary PM (often soon after the release from a source exhaust) or from precursor gases reacting in the atmosphere to form secondary PM.
Diesel-powered vehicles, especially heavy duty trucks and buses, are a significant source of respirable PM, most of which is PM2.5; PM concentrations may, consequently, be locally elevated near roadways with high volumes of heavy diesel powered vehicles. An analysis of PM2.5 and PM10 was conducted to assess the worst case impacts on air quality from the traffic that would be generated by the proposed actions.
SULFUR DIOXIDE
SO2 emissions are primarily associated with the combustion of sulfur-containing fuels (oil and coal). Monitored SO2 concentrations in New York City are lower than the national standards. Due to the federal restrictions on the sulfur content in diesel fuel for on-road vehicles, no significant quantities are emitted from vehicular sources. Vehicular sources of SO2 are not significant and therefore, an analysis of SO2 from mobile sources was not warranted.
As part of the proposed actions, fuel oil or natural gas could be burned in the heat and hot water systems. Therefore, potential future levels of SO2 from boilers were examined.
AIR TOXICS
In addition to the criteria pollutants discussed above, air toxics are of concern. Air toxics are emitted by a wide range of man-made and naturally occurring sources. Emissions of air toxics from industries are regulated by EPA. Federal ambient air quality standards do not exist for non criteria air toxics; however, the New York State Department of Environmental Conservation (NYSDEC) has issued standards for certain non-criteria compounds, including beryllium, gaseous fluorides, and hydrogen sulfide. NYSDEC has also developed guideline concentrations for numerous air toxic compounds. The NYSDEC guidance document DAR-1 (September 2007) contains a compilation of annual and short term (1-hour) guideline concentrations for these compounds. The NYSDEC guidance thresholds represent ambient levels that are considered safe for public exposure. The potential impact from existing sources of air toxics in the study area on the proposed uses was examined.
Coney Island Rezoning
18-4
C. AIR QUALITY REGULATIONS, STANDARDS, AND BENCHMARKS
NATIONAL AND STATE AIR QUALITY STANDARDS
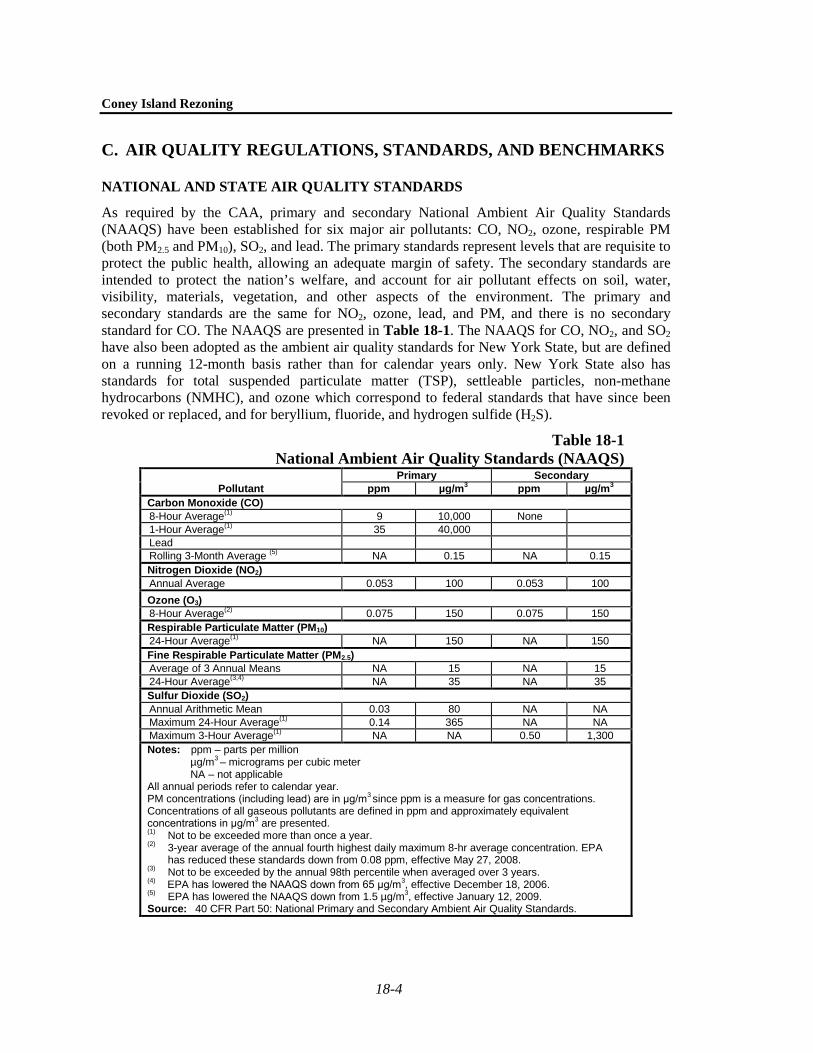
As required by the CAA, primary and secondary National Ambient Air Quality Standards (NAAQS) have been established for six major air pollutants: CO, NO2, ozone, respirable PM (both PM2.5 and PM10), SO2, and lead. The primary standards represent levels that are requisite to protect the public health, allowing an adequate margin of safety. The secondary standards are intended to protect the nation’s welfare, and account for air pollutant effects on soil, water, visibility, materials, vegetation, and other aspects of the environment. The primary and secondary standards are the same for NO2, ozone, lead, and PM, and there is no secondary standard for CO. The NAAQS are presented in Table 18-1. The NAAQS for CO, NO2, and SO2 have also been adopted as the ambient air quality standards for New York State, but are defined on a running 12-month basis rather than for calendar years only. New York State also has standards for total suspended particulate matter (TSP), settleable particles, non-methane hydrocarbons (NMHC), and ozone which correspond to federal standards that have since been revoked or replaced, and for beryllium, fluoride, and hydrogen sulfide (H2S).
Table 18-1 National Ambient Air Quality Standards (NAAQS)
Pollutant Primary Secondary
ppm µg/m3 ppm µg/m3 Carbon Monoxide (CO) 8-Hour Average(1) 9 10,000 None 1-Hour Average(1) 35 40,000 Lead Rolling 3-Month Average (5) NA 0.15 NA 0.15 Nitrogen Dioxide (NO2) Annual Average 0.053 100 0.053 100 Ozone (O3) 8-Hour Average(2) 0.075 150 0.075 150 Respirable Particulate Matter (PM10) 24-Hour Average(1) NA 150 NA 150 Fine Respirable Particulate Matter (PM2.5) Average of 3 Annual Means NA 15 NA 15 24-Hour Average(3,4) NA 35 NA 35 Sulfur Dioxide (SO2) Annual Arithmetic Mean 0.03 80 NA NA Maximum 24-Hour Average(1) 0.14 365 NA NA Maximum 3-Hour Average(1) NA NA 0.50 1,300 Notes: ppm – parts per million
µg/m3 – micrograms per cubic meter NA – not applicable
All annual periods refer to calendar year. PM concentrations (including lead) are in μg/m3 since ppm is a measure for gas concentrations. Concentrations of all gaseous pollutants are defined in ppm and approximately equivalent concentrations in μg/m3 are presented. (1) Not to be exceeded more than once a year. (2) 3-year average of the annual fourth highest daily maximum 8-hr average concentration. EPA
has reduced these standards down from 0.08 ppm, effective May 27, 2008. (3) Not to be exceeded by the annual 98th percentile when averaged over 3 years. (4) EPA has lowered the NAAQS down from 65 μg/m3, effective December 18, 2006. (5) EPA has lowered the NAAQS down from 1.5 µg/m3, effective January 12, 2009. Source: 40 CFR Part 50: National Primary and Secondary Ambient Air Quality Standards.

Chapter 18: Air Quality
18-5
EPA has revised the NAAQS for PM, effective December 18, 2006. The revision included lowering the level of the 24-hour PM2.5 standard from 65 µg/m3 to 35 µg/m3 and retaining the level of the annual standard at 15 µg/m3. The PM10 24-hour average standard was retained and the annual average PM10 standard was revoked. EPA has also revised the 8-hour ozone standard, lowering it from 0.08 to 0.075 parts per million (ppm), effective in May 2008.
EPA revised the primary and secondary standards for lead to 0.15 μg/m3, effective January 12, 2009. EPA revised the averaging time to a rolling 3-month average and the form of the standard to not-to-exceed across a 3-year span. The current lead NAAQS will remain in place for one year following the effective date of attainment designations for any new or revised NAAQS before being revoked, except in current non-attainment areas, where the existing NAAQS will not be revoked until the affected area submits, and EPA approves, an attainment demonstration for the revised lead NAAQS.
NAAQS ATTAINMENT STATUS AND STATE IMPLEMENTATION PLANS
The CAA, as amended in 1990, defines non-attainment areas (NAA) as geographic regions that have been designated as not meeting one or more of the NAAQS. When an area is designated as non-attainment by EPA, the State is required to develop and implement a State Implementation Plan (SIP), which delineates how a state plans to achieve air quality that meets the NAAQS under the deadlines established by the CAA.
In 2002, EPA re-designated New York City as in attainment for CO. The CAA requires that a maintenance plan ensure continued compliance with the CO NAAQS for former non-attainment areas. New York City is also committed to implementing site-specific control measures throughout the City to reduce CO levels, should unanticipated localized growth result in elevated CO levels during the maintenance period.
Manhattan has been designated as a moderate NAA for PM10. On December 17, 2004, EPA took final action, designating the five New York City counties, Nassau, Suffolk, Rockland, Westchester, and Orange counties as a PM2.5 non-attainment area under the CAA due to exceedance of the annual average standard. New York State has submitted a draft SIP to EPA, dated April 2008, designed to meet the annual average standard by April 8, 2010, which will be finalized after public review.
As described above, EPA has revised the 24-hour average PM2.5 standard. In December 2008 EPA designated the New York City Metropolitan Area as nonattainment with the 2006 24-hour PM2.5 NAAQS, effective in April 2009. The nonattainment area includes the same 10-county area EPA designated as nonattainment with the 1997 annual PM2.5 NAAQS. By April 2012 New York will be required to submit a SIP demonstrating attainment with the 2006 24-hour standard by 2014 (EPA may grant attainment date extensions for up to five additional years).
Nassau, Rockland, Suffolk, Westchester, Lower Orange County Metropolitan Area (LOCMA), and the five New York City counties had been designated as a severe non-attainment area for ozone (1-hour average standard). In November 1998, New York State submitted its Phase II Alternative Attainment Demonstration for Ozone, which was finalized and approved by EPA effective March 6, 2002, addressing attainment of the 1-hour ozone NAAQS by 2007. These SIP revisions included additional emission reductions that EPA requested to demonstrate attainment of the standard, and an update of the SIP estimates using the latest versions of the mobile source emissions model, MOBILE6.2, and the nonroad emissions model, NONROAD—which have

Coney Island Rezoning
18-6
been updated to reflect current knowledge of engine emissions and the latest mobile and nonroad engine emissions regulations.
On April 15, 2004, EPA designated these same counties as moderate non-attainment for the 8-hour average ozone standard which became effective as of June 15, 2004 (LOCMA was moved to the Poughkeepsie moderate non-attainment area for 8-hour ozone). EPA revoked the 1-hour standard on June 15, 2005; however, the specific control measures for the 1-hour standard included in the SIP are required to stay in place until the 8-hour standard is attained. The discretionary emissions reductions in the SIP would also remain but could be revised or dropped based on modeling. On February 8, 2008, NYSDEC submitted final revisions to a new SIP for ozone to EPA. NYSDEC has determined that achieving attainment for ozone before 2012 is unlikely, and has therefore made a request for a voluntary reclassification of the New York nonattainment area as “serious.”
In March 2008 EPA strengthened the 8–hour ozone standards. SIPs will be due three years after the final designations are made. On March 12, 2009, NYSDEC recommended that the counties of Suffolk, Nassau, Bronx, Kings, New York, Queens, Richmond, Rockland, and Westchester be designated as a non-attainment area for the 2008 ozone NAAQS (the NYMA MSA nonattainment area). NYSDEC also recommended that Dutchess, Orange, Ulster, and Putnam counties be designated as a nonattainment area for the 2008 ozone NAAQS (the Poughkeepsie, NY nonattainment area). EPA expects designations to take effect no later than March 2010.
DETERMINING THE SIGNIFICANCE OF AIR QUALITY IMPACTS
Any action predicted to increase the concentration of a criteria air pollutant to a level that would exceed the concentrations defined by the NAAQS (see Table 18-1) would be deemed to have a potential significant adverse impact. In addition, to maintain concentrations lower than the NAAQS in attainment areas, or to ensure that concentrations will not be significantly increased in non-attainment areas, threshold levels have been defined for certain pollutants. Any action predicted to increase the concentrations of these pollutants above the thresholds would be deemed to have a potential significant adverse impact, even in cases where violations of the NAAQS are not predicted.
DE MINIMIS CRITERIA REGARDING CO IMPACTS
New York City has developed de minimis criteria to assess the significance of the incremental increase in CO concentrations that would result from proposed projects or actions, as set forth in the CEQR Technical Manual. These criteria set the minimum change in CO concentration that defines a significant environmental impact. Significant increases of CO concentrations in New York City are defined as: (1) an increase of 0.5 ppm or more in the maximum 8-hour average CO concentration at a location where the predicted No Build 8-hour concentration is equal to or between 8 and 9 ppm; or (2) an increase of more than half the difference between baseline (i.e., No Build) concentrations and the 8-hour standard, when No Build concentrations are below 8.0 ppm.
INTERIM GUIDANCE CRITERIA REGARDING PM2.5 IMPACTS
NYSDEC has published a policy to provide interim direction for evaluating PM2.5 impacts. This policy would apply only to facilities applying for permits or major permit modifications under SEQRA that emit 15 tons of PM10 or more annually. The policy states that such a project will be deemed to have a potentially significant adverse impact if the project’s maximum impacts are predicted to increase PM2.5 concentrations by more than 0.3 µg/m3 averaged annually or more

Chapter 18: Air Quality
18-7
than 5 µg/m3 on a 24-hour basis. Projects that exceed either the annual or 24-hour threshold will be required to prepare an Environmental Impact Statement (EIS) to assess the severity of the impacts, to evaluate alternatives, and to employ reasonable and necessary mitigation measures to minimize the PM2.5 impacts of the source to the maximum extent practicable.
In addition, the New York City Department of Environmental Protection (DEP) recommends interim guidance criteria for evaluating the potential PM2.5 impacts for projects subject to CEQR. The updated interim guidance currently employed by DEP for determination of potential significant adverse PM2.5 impacts under CEQR is as follows:
• 24-hour average concentrations increments which are predicted to be greater than 5 µg/m3 at a discrete receptor location would be considered a significant adverse impact on air quality under operational conditions (i.e., permanent condition predicted to exist for many years) regardless of the frequency of occurrence;
• 24-hour average PM2.5 concentration increments which are predicted to be greater than 2 µg/m3 but no greater than 5 µg/m3 would be considered a significant adverse impact on air quality based on the magnitude, frequency, duration, location, and size of the area of the predicted concentrations;
• Predicted annual average PM2.5 concentration increments greater than 0.1 µg/m3 at ground-level on a neighborhood scale (i.e., the annual increase in concentration representing the average over an area of approximately 1 square kilometer, centered on the location where the maximum ground-level impact is predicted for stationary sources; or at a distance from a roadway corridor similar to the minimum distance defined for locating neighborhood scale monitoring stations); or
• Predicted annual average PM2.5 concentration increments greater than 0.3 µg/m3 at a discrete or ground level receptor location.
Actions under CEQR that would increase PM2.5 concentrations by more than the DEP or NYSDEC interim guidance criteria above will be considered to have potential significant adverse impacts. DEP recommends that its actions subject to CEQR that fail the interim guidance criteria prepare an EIS and examine potential measures to reduce or eliminate such potential significant adverse impacts.
The above DEP and NYSDEC interim guidance criteria have been used for the purpose of evaluating the significance of predicted impacts of the proposed actions on PM2.5 concentrations from mobile sources, and determine the need to minimize PM emissions from the proposed actions.
NON-CRITERIA POLLUTANT THRESHOLDS
Non-criteria, or toxic, air pollutants include a multitude of pollutants of ranging toxicity. No federal ambient air quality standards have been promulgated for toxic air pollutants. However, the EPA and the NYSDEC have issued guidelines that establish acceptable ambient levels for these pollutants based on human exposure.

Coney Island Rezoning
18-8
D. METHODOLOGY FOR PREDICTING POLLUTANT CONCENTRATIONS
MOBILE SOURCES
The prediction of vehicle-generated CO and PM emissions and their dispersion in an urban environment incorporates meteorological phenomena, traffic conditions, and physical configurations. Air pollutant dispersion models mathematically simulate how traffic, meteorology, and geometry combine to affect pollutant concentrations. The mathematical expressions and formulations contained in the various models attempt to describe an extremely complex physical phenomenon as closely as possible. However, because all models contain simplifications and approximations of actual conditions and interactions and it is necessary to predict the reasonable worst-case condition, most of these dispersion models predict conservatively high concentrations of pollutants.
The mobile source analyses for the proposed actions employ models approved by EPA that have been widely used for evaluating air quality impacts of projects in New York City, other parts of New York State, and throughout the country. The modeling approach includes a series of conservative assumptions relating to meteorology, traffic, and background concentration levels resulting in a conservatively high estimate of expected pollutant concentrations that could result from the proposed actions. The assumptions used in the PM analysis were based on the latest PM2.5 interim guidance developed by DEP.
DISPERSION MODELS FOR MICROSCALE ANALYSES
Maximum CO concentrations adjacent to streets within the rezoning area, resulting from vehicle emissions, were predicted using the CAL3QHC model Version 2.0.1
METEOROLOGY
The CAL3QHC model employs a Gaussian (normal distribution) dispersion assumption and includes an algorithm for estimating vehicular queue lengths at signalized intersections. CAL3QHC predicts emissions and dispersion of pollutants from idling and moving vehicles. The queuing algorithm includes site-specific traffic parameters, such as signal timing and delay calculations (from the 2000 Highway Capacity Manual traffic forecasting model), saturation flow rate, vehicle arrival type, and signal actuation (i.e., pre-timed or actuated signal) characteristics to accurately predict the number of idling vehicles. The CAL3QHC model has been updated with an extended module, CAL3QHCR, which allows for the incorporation of hourly meteorological data into the modeling, instead of worst-case assumptions regarding meteorological parameters. This refined version of the model is employed if maximum predicted future CO concentrations are greater than the applicable ambient air quality standards or when de minimis thresholds are exceeded using the first-level CAL3QHC modeling. It is also used to calculate PM mobile source impacts since it is more appropriate for calculating 24-hour and annual average PM concentrations.
In general, the transport and concentration of pollutants from vehicular sources are influenced by three principal meteorological factors: wind direction, wind speed, and atmospheric stability. Wind
1 User’s Guide to CAL3QHC, A Modeling Methodology for Predicted Pollutant Concentrations Near
Roadway Intersections, Office of Air Quality, Planning Standards, EPA, Research Triangle Park, North Carolina, Publication EPA-454/R-92-006.

Chapter 18: Air Quality
18-9
direction influences the accumulation of pollutants at a particular prediction location (receptor), and atmospheric stability accounts for the effects of vertical mixing in the atmosphere.
Tier I Analyses—CAL3QHC CO calculations were performed using the CAL3QHC model. In applying the CAL3QHC model, the wind angle was varied to determine the wind direction resulting in the maximum concentrations at each receptor.
Following the EPA guidelines1
Tier II Analyses—CAL3QHCR
, CO computations were performed using a wind speed of 1 meter per second and stability class E. The 8-hour average CO concentrations were estimated by multiplying the predicted 1-hour average CO concentrations by a factor of 0.70 to account for persistence of meteorological conditions and fluctuations in traffic volumes. A surface roughness of 3.21 meters was chosen. At each receptor location, concentrations were calculated for all wind directions, and the highest predicted concentration was reported, regardless of frequency of occurrence. These assumptions ensured that worst-case meteorology was used to estimate impacts.
A Tier II analysis using the CAL3QHCR model, which includes the modeling of hour-by-hour concentrations based on hourly traffic data and five years of monitored hourly meteorological data, was performed to predict maximum 24-hour and annual average PM levels. The data consists of surface data collected at JFK International Airport and upper air data collected at Brookhaven, New York, for the period 2003-2007. All hours were modeled, and the highest resulting concentration for each averaging period was presented.
ANALYSIS YEAR
The microscale analyses were performed for existing conditions and the 2019 analysis year. The future analyses were performed both without the proposed actions (the No Build scenario) and with the proposed actions (the Build scenario).
VEHICLE EMISSIONS DATA
Engine Emissions Vehicular CO and PM emission factors were computed using the EPA mobile source emissions model, MOBILE6.22
1 Guidelines for Modeling Carbon Monoxide from Roadway Intersections, EPA Office of Air Quality
Planning and Standards, Publication EPA-454/R-92-005.
. This emissions model is capable of calculating engine emission factors for various vehicle types, based on the fuel type (gasoline, diesel, or natural gas), meteorological conditions, vehicle speeds, vehicle age, roadway types, number of starts per day, engine soak time, and various other factors that influence emissions, such as changes in fuel and tailpipe emission standards, and inspection maintenance programs. The inputs and use of MOBILE6.2 incorporates the most current guidance available from NYSDEC and DEP.
2 EPA, User’s Guide to MOBILE6.1 and MOBILE6.2: Mobile Source Emission Factor Model, EPA420-R-03-010, August 2003.

Coney Island Rezoning
18-10
Appropriate credits were used to accurately reflect the New York State inspection and maintenance program, which requires inspections of automobiles and light trucks to determine if pollutant emissions from the vehicles’ exhaust systems are below emission standards. Vehicles failing the emissions test must undergo maintenance and pass a repeat test to be registered in New York State.
Vehicle classification data were based on field studies conducted for the project. The general categories of vehicle types for specific roadways were further categorized into subcategories based on their relative fleet-wide breakdown.1
An ambient temperature of 43ºF was used. The use of this temperature is recommended in the CEQR Technical Manual for the Borough of Brooklyn and is consistent with current DEP guidance.
Road Dust The contribution of re-entrained road dust to PM10 concentrations, as presented in the PM10 SIP, is considered to be significant; therefore, the PM10 emission estimates include both exhaust and re-entrained road dust. Road dust emission factors were calculated according to the latest procedure delineated by EPA.2
TRAFFIC DATA
For the PM2.5 microscale analyses, fugitive road dust was calculated to be negligible (zero) based on the current EPA protocol for determining fugitive dust emissions from paved roads.
Traffic data for the air quality analysis were derived from existing traffic counts, projected future growth in traffic, and other information developed as part of the traffic analysis for the proposed actions (see Chapter 16, “Traffic and Parking”). Traffic data for the future without and with the proposed actions were employed in the respective air quality modeling scenarios. The weekday PM (5 to 6 PM) and weekend midday (1 to 2 PM) peak periods were analyzed. These time periods were selected for the mobile source analysis because they produce the maximum anticipated project-generated and future with the proposed actions traffic and therefore have the greatest potential for significant air quality impacts.
Since the PM analysis requires hourly traffic data over an entire 24-hour period, it was necessary to estimate this information for the non-peak traffic periods. The projected weekday and weekend peak no build traffic volumes were used as a baseline, and no build traffic volumes for other hours were determined by adjusting the peak period volumes by the 24-hour distributions of actual vehicle counts collected for the project. Project-generated traffic volumes were determined over the 24-hour period using data obtained from the traffic analysis. For annual impacts, average weekday and weekend 24-hour distributions were used to more accurately simulate traffic patterns over longer periods.
1 The MOBILE6.2 emissions model utilizes 28 vehicle categories by size and fuel. Traffic counts and
predictions are based on broader size categories and then broken down according to the fleet-wide distribution of subcategories and fuel types (diesel, gasoline, or alternative).
2 EPA, Compilations of Air Pollutant Emission Factors AP-42, Fifth Edition, Volume I: Stationary Point and Area Sources, Ch. 13.2.1, NC, http://www.epa.gov/ttn/chief/ap42, November 2006.
Chapter 18: Air Quality
18-11
BACKGROUND CONCENTRATIONS
Background concentrations are those pollutant levels not directly accounted for through the modeling analysis (which directly accounts for vehicle-generated emissions on the streets within 1,000 feet and line-of-sight of the receptor location). Background concentrations must be added to modeling results to obtain total pollutant concentrations at a study site.
The 8-hour average background concentration used in the analysis was 2.5 ppm, which is based on the highest second-highest 8-hour measurements over the most recent three-year period for which complete monitoring data are available (2005-2007), utilizing measurements obtained at the Brooklyn Transit monitoring station. The 1-hour CO background used in the analysis was 5.4 ppm.
The Canal Street monitoring station is the closest location to the proposed actions where NYSDEC collected PM10 data in recent years. Therefore, a background value of 59 µg/m3 used in the analysis represents the maximum second-highest PM10 24-hour background concentration measured over the most recent period for which a complete data set is available (2006–2007) at the Canal Street monitoring station.
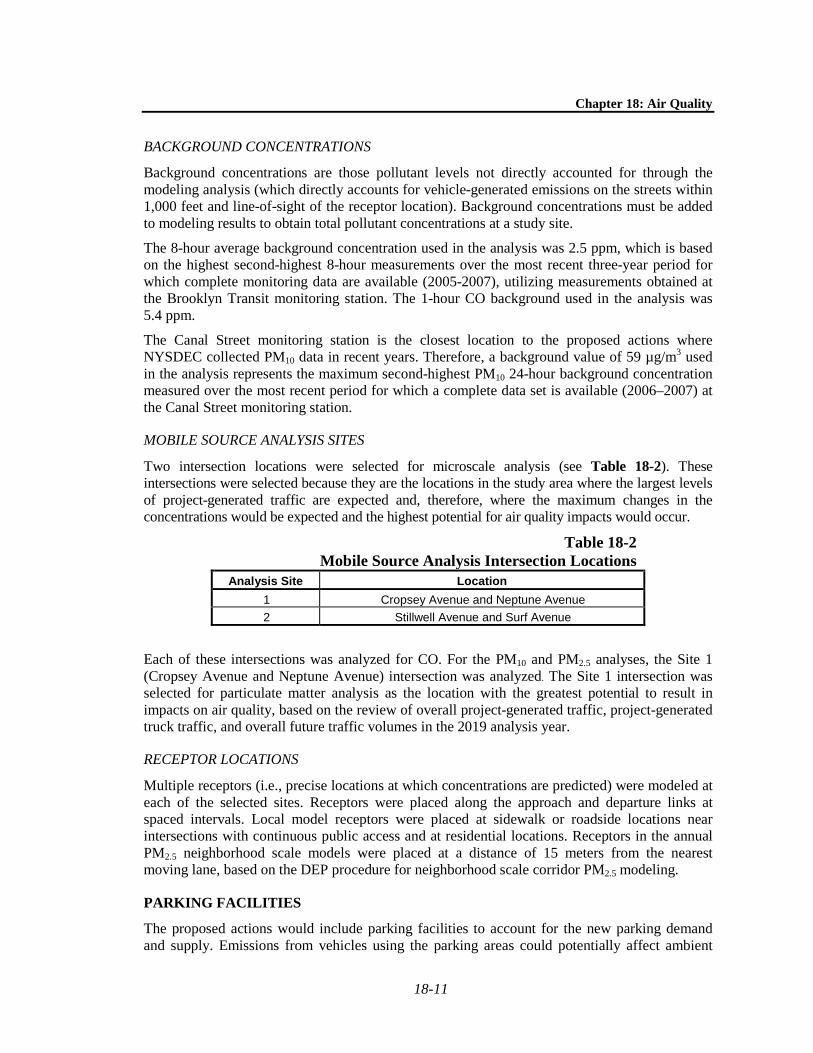
MOBILE SOURCE ANALYSIS SITES
Two intersection locations were selected for microscale analysis (see Table 18-2). These intersections were selected because they are the locations in the study area where the largest levels of project-generated traffic are expected and, therefore, where the maximum changes in the concentrations would be expected and the highest potential for air quality impacts would occur.
Table 18-2 Mobile Source Analysis Intersection Locations
Analysis Site Location 1 Cropsey Avenue and Neptune Avenue 2 Stillwell Avenue and Surf Avenue
Each of these intersections was analyzed for CO. For the PM10 and PM2.5 analyses, the Site 1 (Cropsey Avenue and Neptune Avenue) intersection was analyzed. The Site 1 intersection was selected for particulate matter analysis as the location with the greatest potential to result in impacts on air quality, based on the review of overall project-generated traffic, project-generated truck traffic, and overall future traffic volumes in the 2019 analysis year.
RECEPTOR LOCATIONS
Multiple receptors (i.e., precise locations at which concentrations are predicted) were modeled at each of the selected sites. Receptors were placed along the approach and departure links at spaced intervals. Local model receptors were placed at sidewalk or roadside locations near intersections with continuous public access and at residential locations. Receptors in the annual PM2.5 neighborhood scale models were placed at a distance of 15 meters from the nearest moving lane, based on the DEP procedure for neighborhood scale corridor PM2.5 modeling.
PARKING FACILITIES
The proposed actions would include parking facilities to account for the new parking demand and supply. Emissions from vehicles using the parking areas could potentially affect ambient

Coney Island Rezoning
18-12
levels of CO in the future with the proposed actions. Projected parking facility capacity by development block and the peak hour arrivals and departures were used to identify the parking facilities most likely to result in impacts on local air quality. Since no detailed design information is available, the parking facilities selected for the analysis were conservatively assumed to be enclosed, mechanically ventilated garages. Other conservative assumptions regarding the garage size, ventilation rate, and exhaust location were also made. The location of the garages selected for analysis is shown in Table 18-3 and Figure 18-1.
Table 18-3 Parking Garage—Analyzed Sites
Garage Site Number of Spaces Block Site 1, North of Ocean Way 383 7071 Site 2, North of Ocean Way 399 7070
NY Aquarium 400 8697
An analysis of the emissions from the outlet vents and their dispersion in the environment was performed, calculating pollutant levels in the surrounding area, using the methodology set forth in the CEQR Technical Manual. Emissions from vehicles entering, parking, and exiting the garages were estimated using the EPA MOBILE6.2 mobile source emission model and an ambient temperature of 43°F, as referenced in the CEQR Technical Manual. For all arriving and departing vehicles, an average speed of 5 miles per hour was conservatively assumed for travel within the parking garages. In addition, all departing vehicles were assumed to idle for 1 minute before proceeding to the exit. The concentration of CO within the garages was calculated assuming a minimum ventilation rate, based on New York City Building Code requirements, of 1 cubic foot per minute of fresh air per gross square foot of garage area. To determine compliance with the NAAQS, CO concentrations were determined for the maximum 8-hour average period. (No exceedances of the 1-hour standard would occur, and the 8-hour values are the most critical for impact assessment.)
To determine pollutant concentrations, the outlet vents were analyzed as a “virtual point source” using the methodology in EPA’s Workbook of Atmospheric Dispersion Estimates, AP-26. This methodology estimates CO concentrations at various distances from an outlet vent by assuming that the concentration in the garage is equal to the concentration leaving the vent, and determining the appropriate initial horizontal and vertical dispersion coefficients at the vent faces.
The CO concentrations were determined for the time periods when overall garage usage would be the greatest, considering the hours when the greatest number of vehicles would exit the facility. The weekday PM peak period and weekend midday peak periods were therefore analyzed. Departing vehicles were assumed to be operating in a “cold-start” mode, emitting higher levels of CO than arriving vehicles. Traffic data for the parking garage analysis were derived from the trip generation analysis described in Chapter 16, “Traffic and Parking.” Background and on-street CO concentrations were added to the modeling results to obtain the total ambient CO levels.
STATIONARY SOURCES
A stationary source analysis was conducted to evaluate potential impacts from the proposed actions’ HVAC systems. In addition, an assessment was conducted to determine the potential for impacts due to industrial activities within the study area.

W. 1
5TH
ST.
W. 1
6TH
ST.
W. 1
7TH
ST.
SURF AVE.
RIEGELMANN BOARDWALK
NEPTUNE AVE.
W. 1
9TH
ST.
W. 2
0TH
ST.
W. 2
1ST
ST.
W. 2
2ND
ST.
W. 2
3RD
ST.
W. 2
4TH
ST.
W. 2
5TH
ST.
STIL
LWEL
L AV
E.
W. 8
TH S
T.
MERMAID AVE.
W. 1
5TH
ST.
W. 1
6TH
ST.
W. 1
7TH
ST.
SURF AVE.
RIEGELMANN BOARDWALK
NEPTUNE AVE.
W. 1
9TH
ST.
W. 2
0TH
ST.
W. 2
1ST
ST.
W. 2
2ND
ST.
W. 2
3RD
ST.
W. 2
4TH
ST.
W. 2
5TH
ST.
STIL
LWEL
L AV
E.
W. 8
TH S
T.W 1
2TH
ST.
BOWERY ST.
WONDER WHEEL WAYOCEAN WAY
ATLANTIC OCEAN
SHEEPSHEAD BAY RD.
KEYSPANPARK
NY AquariumNY Aquarium
400 Spaces400 Spaces
383Spaces
383Spaces399
Spaces399
Spaces
22
22
11
11
Parking Facilities Analyzed for Air Quality ImpactsFigure 18-1CONEY ISLAND REZONING
SCALE
0 500 1000 FEET
1.13.09
Rezoning Area Boundary
Proposed Parking Facility
Analyzed Parking Facility Site

Chapter 18: Air Quality
18-13
HVAC SOURCE ANALYSES
Individual Source Screening Analysis A screening analysis was performed to assess air quality impacts associated with emissions from the HVAC system of each projected and potential development site. The methodology described in the CEQR Technical Manual was used for the analysis and considered impacts on sensitive uses. The CEQR screening analysis methodology determines the threshold of development size below which the action would not have a significant adverse impact. The screening procedures utilize information regarding the type of fuel to be used, the maximum development size, and the HVAC exhaust stack height to evaluate whether a significant adverse impact is likely. Based on the distance from the proposed development to the nearest building of similar or greater height, if the maximum development size is greater than the threshold size in the CEQR Technical Manual, there is the potential for significant air quality impacts, and a refined dispersion modeling analysis would be required. Otherwise, the source passes the screening analysis, and no further analysis is required.
Since information on the HVAC systems’ design is not available, each projected and potential development site was evaluated with the nearest existing or proposed residential development of a similar or greater height analyzed as a potential receptor. The maximum development floor areas of the proposed sites from the reasonable worst-case development scenario (RWCDS) were used as input for the screening analysis.
It was assumed that natural gas, No. 2, or No. 4 fuel oil would be used in the HVAC systems, and that the stacks would be installed three feet above roof height (as per the CEQR Technical Manual). For buildings with different tier configurations (provided in the conceptual design), the analysis assumed that the HVAC stack would be installed on the highest tier. In the case of a site that would be developed with multiple towers based on the conceptual design, the analysis assumed that each tower would have an HVAC stack installed on its highest tier. If a source did not pass the screening analyses with No. 2 fuel oil or gas using the CEQR Technical Manual procedures, a refined modeling analysis was performed, as described below.
Individual Source Dispersion Modeling A refined analysis was performed using the EPA’s AERMOD dispersion model where the HVAC system screening analysis assuming use of No. 2 oil indicated that there could be potential for impacts on air quality—at Potential Development Site C located on Mermaid Avenue at West 13th Street.
AERMOD is a steady-state plume model that incorporates handling of terrain interactions and current concepts about flow and dispersion in complex terrain, including updated treatments of the boundary layer theory, understanding of turbulence and dispersion. The AERMOD model was designed as a replacement to the EPA Industrial Source Complex (ISC3) model and is applicable to rural and urban areas, flat and complex terrain, surface and elevated releases, and multiple sources (including point, area, and volume sources). The CEQR Technical Manual states that the refined model should be run with and without building downwash (the downwash option accounts for the effects on plume dispersion created by the structure the stack is located on, as well as other nearby structures). In general, modeling without building downwash produces higher estimates of pollutant concentrations when assessing the impact of elevated sources on elevated receptor locations. Therefore, the analysis was performed using the AERMOD model with the no downwash option only.

Coney Island Rezoning
18-14
AERMOD calculates pollutant concentrations based on hourly meteorological data. Five years of meteorological data (2003-2007) with surface data from JFK International Airport and concurrent upper air data from Brookhaven, NY, were used for the modeling study.
Meteorological Data
Discrete receptors (i.e., locations at which concentrations are calculated) were modeled along the sides and roof of the nearest development site of similar or greater height for which the screening-level analysis had indicated the potential for impacts. Receptors were modeled at spaced intervals on the building at multiple elevations, where operable windows, intake vents, and otherwise accessible locations such as terraces could potentially be impacted.
Receptor Locations
No. 2 fuel oil residential usage rates per unit of floor area obtained from the CEQR Technical Manual Air Quality Appendix 7 were used to determine total No. 2 oil usage, based on the size (in square feet) of the development site. The calculated No. 2 oil usage rate (in gallons per year) was then multiplied by EPA AP-42 emission factors (in pounds per gallon) for No. 2 oil fired boilers to estimate the SO2, NO2, and PM10 emission rates for the heating system stack. The HVAC system exhaust stack height was modeled at three feet above the highest tier of the building. The stack exhaust location was modeled nearest to the receptor building where the potential for impacts was predicted using the screening-level analysis. The stack diameter, stack velocity, and stack temperature used were based on a survey of DEP boiler registrations and are presented in Table 18-4.
Emissions Estimates and Stack Parameters
Table 18-4 Stack Parameters and Emission Rates for Potential Development Site C
Parameter Value Stack Height1 61.5 m
Stack Diameter2 0.1524 m Stack Exit Velocity2 3.9 m/s
Stack Exit Temperature2 307.8 ºF SO2 Short-term Emission Rate 0.0235 g/s
SO2 Annual Emission Rate 0.00644 g/s PM10 Emission Rate 0.00273 g/s NOx Emission Rate 0.00454 g/s
Notes: 1 Assumes a 3-foot stack above the building roof as per CEQR Technical Manual Guidance. 2 Based on survey of DEP boiler registrations.
To estimate the maximum expected pollutant concentration at a given receptor, the predicted impacts from individual sources or development clusters must be added to a background value that accounts for existing pollutant concentrations from sources that are not directly accounted for in the model. The background values used in the analysis are presented in Table 18-5. The values are based on the highest annual and second highest short-term concentrations for the 2003 to 2007 monitoring period obtained at the NYSDEC monitoring stations closest to the proposed rezoning area. Data from the P.S. 59 and Canal Street monitoring stations in Manhattan were used, as those were the monitoring stations closest to the proposed rezoning area, with a recent
Background Concentrations

Chapter 18: Air Quality
18-15
set of measurements. The background for PM10 was based on measurements over a two-year period (2006-2007), as a recent data set for more than two years was not available from any of the monitoring stations.
Table 18-5 Background Pollutant Concentrations
Pollutants Averaging
Period Monitoring Station Background
Concentration (μg/m3) Ambient
Standard (μg/m3) NO2 Annual P.S. 59, Manhattan 64 100 SO2 3 hour
P.S. 59, Manhattan 202 1,300
24 hour 123 365 Annual 37 80
PM10 24 Hour Canal Street, Manhattan 59 150 Source: 2003–2007 Annual New York State Air Quality Report, Ambient Air Monitoring System, NYSDEC.
These background concentrations were added to the predicted contributions from local sources to determine the total pollutant concentrations with the proposed actions. The total concentrations were then compared to the ambient standard concentrations.
PM2.5 Analysis Dispersion modeling was performed to assess the impacts of the particulate matter emitted from the proposed actions on ambient PM2.5 concentrations at sensitive receptors in the defined study areas. The methodology followed the general approach that was taken in the refined dispersion modeling of PM10 impacts from HVAC systems. The PM2.5 impacts from the development of most concern were assessed. The development that failed the screening-level analysis for both No. 4 and No. 2 oil is a reasonable indicator for assessing overall PM2.5 impacts from the proposed actions. Since the interim guidance criteria for PM2.5 are based on incremental changes for both localized and neighborhood-scale assessments, the modeling was performed to estimate the maximum predicted changes in PM2.5 concentrations so that the results could be compared to these criteria.
The PM2.5 modeling impact assessment employed the same EPA dispersion model that was employed in the modeling of the other criteria pollutants, i.e., the AERMOD model, with the same stack parameters and receptor network. The PM2.5 emission rate used was based on the CEQR Technical Manual Air Quality Appendix 7 residential fuel usage factor and AP-42 emission factors. The short-term emission rate used in the analysis was 0.00101 g/s while the annual average emission rate used in the analysis was 0.000278 g/s. Hourly meteorological data collected at the JFK International Airport station during the 2003 through 2007 period were also employed in the analysis.
Cumulative Impacts from HVAC Sources In addition to the individual HVAC source analysis, a group or “cluster” of HVAC sources with similar stack heights was analyzed in order to address the cumulative impacts of multiple sources. The study area for the proposed actions was analyzed to select a cluster of sources that would be most likely to result in cumulative impacts based on the floor area, proximity of the sources in the cluster to one another, their proximity to buildings of similar or greater height, and the results of the single source screening analysis for HVAC systems.

Coney Island Rezoning
18-16
DEP Report 12 was used to determine fuel usage rates per unit of floor area. The use of No. 4 fuel oil was assumed for sources that individually passed the screening analysis with No. 4 oil, while No. 2 fuel oil was assumed for sources that would be restricted to No. 2 fuel oil or natural gas. Emission factors as reported in AP-42 for fuel oil fired boilers were used to estimate emissions from each source within the cluster, based on the development size and calculated fuel usage estimate.
To predict pollutant concentrations resulting from the cluster of HVAC sources, a dispersion analysis was performed using the EPA SCREEN3 Model (version 96043). The SCREEN3 model is a screening version of the ISC3 model, and is used for determining maximum concentrations from a source using predefined meteorological conditions. The cluster was modeled as an area source. The modeled concentrations were added to background concentrations shown in Table 18-5 to predict the total concentration at the nearest receptor site—the closest taller building.
INDUSTRIAL SOURCE ANALYSIS
To assess the potential effects of non-criteria pollutant emissions from existing industrial sources in the study area on the proposed uses, a survey of potential air toxics emission sources was conducted. Non-criteria air pollutant emission sources within 400 feet of the projected and potential sites were considered for inclusion in the air quality impact analyses. The CEQR Technical Manual also requires an assessment of any actions that could result in the location of residential developments within 1,000 feet of a large emission source or within 400 feet of commercial, institutional, or large-scale residential developments where the proposed structure would be of a height similar to or greater than the height of an existing emission stack. These boundaries were used to identify the extent of the study area for determining air quality impacts associated with the proposed actions.
Information regarding the release of air pollutants from existing industrial sources was obtained from the DEP’s Bureau of Environmental Compliance (BEC) and NYSDEC records. A comprehensive search was also performed to identify the NYSDEC state facility and Title V permits and registrations listed in the EPA Envirofacts database.1
E. EXISTING CONDITIONS
EXISTING MONITORED AIR QUALITY CONDITIONS
Monitored concentrations of SO2, NO2, CO, ozone, lead, PM10, and PM2.5 for the study area are shown in Table 18-6. These values are the most recent monitored data that have been made available by NYSDEC. Except for the 24-hour PM2.5 concentration, there were no monitored vio-lations of NAAQS at these monitoring sites. While the values in Table 18-6 are a reflection of the existing conditions, for modeling purposes the analysis utilized the background values presented in Table 18-5, which were developed following DEP guidance.
1 EPA, Envirofacts Data Warehouse, http://oaspub.epa.gov/enviro/ef_home2.air, 1/8/2008

Chapter 18: Air Quality
18-17
Table 18-6 Representative Monitored Ambient Air Quality Data
Pollutants Location Units Period Concentration
Exceeds Federal Standard?
Primary Secondary CO P.S. 59, Manhattan ppm 8-hour 2.1 N N
1-hour 2.9 N N SO2 P.S. 59, Manhattan μg/m3 Annual 26 N -
24-hour 79 N - 3-hour 152 - N
Respirable particulates (PM10)
Canal Street, Manhattan μg/m3 24-hour 52 (1) N N
Respirable particulates (PM2.5)
P.S. 314, Brooklyn μg/m3 Annual 11.9 N N 24-hour 45.4 Y Y
NO2 P.S. 59, Manhattan μg/m3 Annual 64 N N Lead J.H.S. 126, Brooklyn μg/m3 3-month 0.02 N - Ozone (O3) Susan Wagner, Staten
Island ppm 1-hour 0.110 (2) - - ppm 8-hour 0.083 (3) N N
Notes: 1 The annual PM10 standard was revoked, effective December 18, 2006. 2 The 1-hour ozone NAAQS has been replaced with the 8-hour standard; however, the maximum monitored
concentration is provided for informational purposes. 3 The most recent monitoring data does not exceed the previous standard, which was in place at the time the
monitoring was performed. However, the concentration does exceed the revised standard of 0.075 ppm, effective May 2008.
Source: NYSDEC, 2007 New York State Ambient Air Quality Data.
CALCULATED EXISTING CO CONCENTRATIONS
As noted previously, receptors were modeled at multiple sidewalk locations next to the analyzed intersections. CO concentrations were calculated for each receptor location, at each intersection, and each peak period analyzed. Table 18-7 shows the maximum calculated existing CO 8-hour average concentrations for all receptor sites and each time period analyzed. (No 1-hour values are shown since predicted values are much lower than the 1-hour standard of 35 ppm.) At all receptor sites, the maximum predicted 8-hour average concentrations are well below the national standard of 9 ppm.
Table 18-7 Maximum Predicted Existing 8-Hour Average
CO Concentrations for 2008 Receptor
Site Location Time Period 8-Hour Concentration
(ppm) 1 Cropsey Avenue and Neptune Avenue Weekday PM
Weekend Midday 4.3 4.4
2 Stillwell Avenue and Surf Avenue Weekday PM Weekend Midday
3.1 3.1
Note: 8-hour standard is 9 ppm.

Coney Island Rezoning
18-18
F. THE FUTURE WITHOUT THE PROPOSED ACTIONS
MOBILE SOURCES ANALYSIS
CO
CO concentrations without the proposed actions were determined for the 2019 analysis year using the methodology previously described. Table 18-8 shows future maximum predicted 8-hour average CO concentrations at the analyzed intersections without the proposed actions (i.e., 2019 No Build values). The values shown are the highest predicted concentrations for each time period for the receptor analyzed.
Table 18-8 Future (2019) Maximum Predicted 8-Hour
Average Carbon Monoxide No Build Concentrations
Receptor Site Location Time Period
8-Hour Concentration
(ppm)
1 Cropsey Avenue and Neptune Avenue Weekday PM Weekend Midday
4.8 4.8
2 Stillwell Avenue and Surf Avenue Weekday PM Weekend Midday
3.2 3.2
Note: 8-hour standard is 9 ppm.
PM PM concentrations without the proposed actions were determined for the 2019 analysis year using the methodology previously described. Table 18-9 presents the future maximum predicted PM10 concentrations at the intersection analyzed without the proposed actions (i.e., No Build values). The value shown is the highest predicted concentration for the receptor locations analyzed and includes the ambient background concentration. Note that PM2.5 concentrations without the proposed actions are not presented, since impacts are assessed on an incremental basis.
Table 18-9 Future (2019) Maximum Predicted No Build
24-Hour PM10 Concentrations Receptor Site Location 24-Hour Concentration (μg/m3)
1 Cropsey Avenue and Neptune Avenue 59.2 Note: National Ambient Air Quality Standards—24-hour, 150 μg/m3.
STATIONARY SOURCE ANALYSIS
Some development within the study area would occur in the future without the proposed actions by 2019. A number of development sites that were considered in the analyses of the proposed actions are also sites that would be developed in the absence of the proposed actions, i.e., under the No Build scenario. The proposed actions would result in more development and therefore the emissions from HVAC systems associated with the proposed actions would cumulatively be greater than the emissions from HVAC systems under the No Build scenario.

Chapter 18: Air Quality
18-19
G. PROBABLE IMPACTS OF THE PROPOSED ACTIONS
MOBILE SOURCES ANALYSIS
CO
CO concentrations with the proposed actions were determined for the 2019 analysis year at traffic intersections using the methodology previously described. Table 18-10 shows the future maximum predicted 8-hour average CO concentration with the proposed actions at the two intersections studied. (No 1-hour values are shown since no exceedances of the standard would occur and the de minimis criteria are only applicable to 8-hour concentrations. Therefore, the 8-hour values are the most critical for impact assessment.) The values shown are the highest predicted concentrations for all receptors at each of the time periods analyzed. The results indicate that the proposed actions would not result in any violations of the 8-hour CO standard. In addition, the incremental increase in 8-hour average CO concentrations would not result in a violation of the CEQR de minimis CO criteria. Therefore, the proposed actions would not result in any significant CO air quality impacts.
Table 18-10 Future (2019) Maximum Predicted 8-Hour Average
No Build and Build Carbon Monoxide Concentrations Receptor
Site Location Time Period 8-Hour Concentration (ppm)
No Build Build
1 Cropsey Avenue and Neptune Avenue
Weekday PM Weekend Midday
4.8 4.8
6.2 6.3
2 Stillwell Avenue and Surf Avenue Weekday PM
Weekend Midday 3.2 3.2
3.5 3.6
Note: 8-hour standard is 9 ppm.
PM
PM concentrations with the proposed actions were determined for the 2019 analysis year using the methodology previously described. Table 18-11 shows the future maximum predicted 24-hour average PM10 concentrations with the proposed actions. The values shown are the highest predicted concentrations for all locations analyzed and include the ambient background concentrations. The results indicate that the proposed actions would not result in any violations of the PM10 standard or any significant adverse impacts on air quality.
Table 18-11 Future (2019) Maximum Predicted 24-Hour Average PM10 Concentrations
Receptor Site Location
24-Hour Concentration (μg/m3)1 No Build Build
1 Cropsey Avenue and Neptune Avenue 59.2 59.3 Note: 1 National Ambient Air Quality Standards—24-hour, 150 μg/m3.
Future maximum predicted 24-hour and annual average PM2.5 concentration increments were calculated so that they could be compared to the interim guidance criteria that would determine the potential significance of any impacts from the proposed actions. Based on this analysis, the maximum predicted localized 24-hour average and neighborhood-scale annual average

Coney Island Rezoning
18-20
incremental PM2.5 concentrations are presented in Tables 18-12 and 18-13, respectively. The results show that the annual and daily (24-hour) PM2.5 increments are predicted to be well below the interim guidance criteria and, therefore, the proposed actions would not result in significant PM2.5 impacts at the analyzed receptor locations.
Table 18-12 Future (2019) Maximum Predicted 24-Hour Average PM2.5 Concentrations
Receptor Site Location Increment 1 Cropsey Avenue and Neptune Avenue 0.004
Note: PM2.5 interim guidance criteria—24-hour average, 2 µg/m3 (5 µg/m3 not-to-exceed value).
Table 18-13 Future (2019) Maximum Predicted Annual Average PM2.5 Concentrations Receptor Site Location Increment
1 Cropsey Avenue and Neptune Avenue 0.01 Note: PM2.5 interim guidance criteria—annual (neighborhood scale), 0.1 µg/m3.
PARKING FACILITIES
The maximum future CO concentrations for the analyzed parking facilities and time periods were obtained based on the methodology previously discussed. Including ambient background levels and on-site traffic at sidewalk receptor locations the overall maximum total CO concentration would be 9.0 ppm for the 1-hour and 4.8 ppm for the 8-hour averaging period. The maximum 1- and 8-hour contribution from the parking garages would be 2.3 ppm and 1.4 ppm, respectively. These maximum concentrations were predicted at the New York Aquarium parking facility (400 spaces). The values are the highest predicted concentrations for any time period analyzed. These maximum predicted CO concentrations and concentration increments are in compliance with the applicable CO standards, and therefore, no significant adverse impacts from the proposed parking facilities are expected.
CONSISTENCY WITH NEW YORK STATE AIR QUALITY IMPLEMENTATION PLAN
As addressed above, maximum predicted pollutant concentrations and concentration increments with the proposed actions would comply with the applicable ambient air standards or local guidance criteria. Therefore, the proposed actions would be consistent with the New York State Implementation Plans for the pollutants of concern.
STATIONARY SOURCES
HVAC SOURCE ANALYSES
Individual Source Screening Analysis The screening analysis was performed to determine whether impacts from projected and potential development sites could potentially impact other projected and potential development sites, or existing buildings. The screening analysis was performed assuming No. 4 fuel oil, No. 2 fuel oil, and natural gas as the fuel type for HVAC systems.

Chapter 18: Air Quality
18-21
A total of five development sites (two projected and three potential) failed the screening analysis using No. 4 oil as the fuel source, but passed assuming No. 2 oil. A refined dispersion modeling analysis was performed that also indicated that the use of No. 4 oil at these sites would have the potential for impacts on air quality. To preclude the potential for significant adverse impacts, the development sites that failed the screening analysis for No. 4 oil, but not for No. 2 oil, would be restricted to using No. 2 oil or natural gas. An E-designation would be incorporated into the rezoning proposal for three of the five affected sites—Projected Development Site 1, Projected Development Site 4, and Potential Development Site F. Two sites, Potential Development Site A for both portions north and south of Ocean Way, are currently owned by the City and a Memorandum of Understanding between Department of Parks and Recreation (DPR) or New York City Economic Development Corporation (NYCEDC) and DEP would be placed on the site which would be disposed of or to the NYCEDC. Restrictive declarations would subsequently be placed on Potential Site A north and south at the time of their disposition by the City, in accordance with the Memorandum of Understanding that would be entered into between NYCEDC and DEP. In addition, one potential development site failed the screening analysis assuming both No. 4 oil and No. 2 oil. A refined dispersion analysis, assuming No. 2 oil was undertaken for that site, as described in the following section.
Individual Source Dispersion Modeling The HVAC system screening analysis for Potential Development Site C indicated the potential for impacts on air quality, assuming both No. 4 oil and No. 2 fuel oil. The use of No. 4 oil would be restricted by incorporating an E-designation into the rezoning proposal to preclude the potential for significant impacts on air quality. An analysis was performed with the AERMOD dispersion model assuming the use of No. 2 fuel oil at Potential Development Site C as a refined assessment of the potential for impact from the HVAC system at that site.
The refined analysis indicated that there would be no potential for significant impact, assuming use of No. 2 oil, as the calculated pollutant concentrations, when added to the applicable background values, would not exceed the relevant air quality standards. The use of natural gas would also be allowed and no restrictions on the placement of the HVAC system exhaust stack would be needed. Maximum pollutant concentrations predicted at modeled receptor locations, assuming No. 2 oil, and total pollutant concentrations that include background pollutant levels are presented in Table 18-14.
Table 18-14 Site C HVAC System
Total Predicted Pollutant Concentrations (µg/m3)
Pollutant Averaging
Period
Concentration Due to Stack Emissions
Background Concentration
Total Concentration
Air Quality Standard
NO2 Annual 0.8 64 65 100 PM10 24 Hour 3.0 59 62 150
SO2 Annual 1.1 37 38 80 24 Hour 26.0 123 149 365 3 Hour 88.8 202 291 1,300
Note: Background concentrations are from NYSDEC monitoring data.
Maximum PM2.5 Incremental Impacts The air quality modeling analysis determined the highest predicted increase in 24-hour and annual average PM2.5 concentrations from the development site most likely to result in impacts

Coney Island Rezoning
18-22
on air quality, Potential Development Site C. Table 18-15 summarizes the results of the impacts compared to the appropriate interim guidance criteria.
Table 18-15 Maximum Predicted Stationary Source
PM2.5 Incremental Concentrations
Source Averaging Period Maximum
Increment (µg/m3) Significant Impact Threshold (µg/m3)
Potential Development Site C
24-hour 1.1 2.0 to 5.0 Annual 0.05 0.3
Note: 1 Annual results represent the maximum impacts at individual receptor locations.
As shown in the table, the maximum 24-hour incremental impacts from Potential Development Site C would be less than the applicable interim guidance criterion. On an annual basis, the projected PM2.5 impacts would be less than the NYSDEC policy threshold of 0.3 µg/m3. Since the maximum predicted incremental impacts of PM2.5 do not exceed 0.1 µg/m3 on an annual average basis, a neighborhood-scale analysis was not required. A neighborhood-scale concentration represents the average concentration over an area of approximately one square kilometer centered on the location where the maximum impact is predicted.
Cumulative Impacts from HVAC Sources HVAC sources in close proximity with similar stack heights that would have the greatest potential to cumulatively impact neighboring sites of similar or greater height were identified and a quantitative analysis was performed to determine their potential impact. The total floor area of the individual buildings and the use of No. 4 or No. 2 oil were considered. The selected cluster consisted of the following projected and potential development sites:
• Coney West, Potential Development Site A, South of Ocean Way, east tower — total floor area of 107,895 square feet (sf), stack height at 160 feet, use of No. 4 fuel oil.
• Coney West, Potential Development Site A, South of Ocean Way, west tower — total floor area of 108,000 sf, stack height at 160 feet, use of No. 2 fuel oil. (The use of No. 4 oil at this site would be restricted, due to impacts predicted with the results of the individual source HVAC screening analysis).
• Coney West, Projected Development Site 1, South of Ocean Way, east tower — total floor area of 99,000 sf, stack height at 160 feet, use of No. 4 fuel oil.
• Coney West, Projected Development Site 1, South of Ocean Way, west tower — total floor area of 99,000 sf, stack height at 160 feet, use of No. 2 fuel oil. (The use of No. 4 oil at this site would be restricted, due to impacts predicted with the individual source HVAC screening analysis).
• Coney West, Projected Development Site 2, South of Ocean Way, tower — total floor area of 96,938 sf, stack height at 160 feet, use of No. 4 fuel oil.
The predicted pollutant concentrations for the HVAC sources associated with the cluster analyzed are presented in Table 18-16 along with background concentrations and total concentrations. Based on the results of the analysis, the impacts from the proposed actions HVAC systems would not result in any significant adverse air quality impacts in neighboring uses.

Chapter 18: Air Quality
18-23
Table 18-16 Cumulative Impacts from HVAC Sources
Total Predicted Pollutant Concentrations (µg/m3)
Pollutant Averaging
Period Concentration Due to Stack Emissions
Background Concentration
Total Concentration
Air Quality Standard
NO2 Annual 7 64 71 100 PM10 24 Hour 40 59 99 150
SO2 Annual 13 37 50 80 24 Hour 238 123 361 365 3 Hour 535 202 737 1,300
Note: Background concentrations are from NYSDEC monitoring data.
As indicated in the table, the results of the modeling analysis demonstrate compliance with the NAAQS for each pollutant. Based on the results of the analysis there would be no cumulative significant adverse impacts on air quality from the HVAC systems associated with the proposed actions.
Sites Requiring an E-Designation or Memorandum of Understanding The only potential for impacts on air quality from HVAC systems associated with the proposed actions stems from use of No. 4 oil in certain individual towers on potential or projected development sites. To preclude the potential for significant air quality impacts, E-designations or a Memorandum of Understanding that would restrict the use of No. 4 oil would be incorporated into the zoning proposal for the following sites (see Figure 18-2).
The text of the E-designations would be as follows:
Any new residential and/or commercial development on Block 7072, Lot 1 (southwest tower on Site 1) must ensure that No. 2 fuel oil or natural gas is used for the heating, ventilation, and air conditioning systems.
Block 7072, Lot 1 (Projected Development Site 1)
Any new residential and/or commercial development on Block 7063, Lot 12 (southeast tower on Site 4) must ensure that No. 2 fuel oil or natural gas is used for the heating, ventilation, and air conditioning systems.
Block 7063, Lot 12 (Projected Development Site 4)
Any new residential and/or commercial development on Block 7061, Lots 6 and 8 (Site F) must ensure that No. 2 fuel oil or natural gas is used for the heating, ventilation, and air conditioning systems.
Block 7061, Lots 6 and 8 (Potential Development Site F)
Any new residential and/or commercial development on Block 7064, Lot 45 (Site C) must ensure that No. 2 fuel oil or natural gas is used for the heating, ventilation, and air conditioning systems.
Block 7064, Lot 45 (Potential Development Site C)
The text of the Memorandum of Understanding and subsequent Restrictive Declaration would be as follows:

HIGHLANDVIEWPARK
OCEAN WAYOCEAN WAY
E-Designation and Memorandum of Understanding LocationsFigure 18-2CONEY ISLAND REZONING
1.15.09
N
SCALE
0 400 1000 FEET
Rezoning Area
E-Designation or Memorandum of Understanding
Amusement (enclosed and open)
Hotel Base
Hotel Tower
Restaurants and Other Enhancing Uses
Small Scale Accessory Retail
Retail - Neighborhood
Residential
Residential Tower
Park
Parking/Roof Garden Above
For Illustrative Purposes Only

Coney Island Rezoning
18-24
Any new residential and/or commercial development on Block 7073, Lot 101 (220 ft tower on Site A) must ensure that No. 2 fuel oil or natural gas is used for the heating, ventilation, and air conditioning systems.
Block 7073, Lot 101 (Potential Development Site A, portion north of Ocean Way)
Any new residential and/or commercial development on Block 7073, Lot 101 (southwest tower on Site A) must ensure that No. 2 fuel oil or natural gas is used for the heating, ventilation, and air conditioning systems.
Block 7073, Lot 101 (Potential Development Site A, portion south of Ocean Way)
INDUSTRIAL SOURCE ANALYSIS
As discussed previously, a survey of uses was conducted to identify industrial uses within 400 feet of the projected and potential development sites, large sources within 1,000 feet of a projected or potential development site, and commercial, institutional and large-scale residential sources within 400 feet of a projected or potential development site. A request for permit information for addresses identified was made to DEP on December 10, 2008. A search of the EPA Envirofacts database, and the NYSDEC Title V and State Facility Permit databases were also conducted. No large sources of air toxic emissions were identified in the 1,000 foot study area, and there were no large-scale sources within the 400 foot study area. No existing sources with DEP air emission permits would remain in the project study area with the proposed actions. Therefore, there would be no potential for significant adverse air quality impacts.
H. CONCLUSIONS Based on the analyses conducted, the proposed actions would not result in any significant adverse air quality impacts on sensitive uses in the surrounding community, and the proposed actions would not be adversely affected by existing sources of air emissions in the study area. A summary of the findings is presented below.
The traffic that would be generated by the proposed actions would not have the potential for significant adverse impacts on air quality. CO and PM10 concentrations in the future with the proposed actions would not result in violations of NAAQS. It was also determined that CO impacts would not exceed CEQR de minimis criteria, while increments of PM2.5 would not exceed the City’s interim guidance criteria. In addition, the parking garage analysis determined that the parking facilities under the proposed actions would not cause any significant adverse air quality impacts.
The stationary source analyses determined that there would be no potential significant adverse air quality impacts from HVAC systems at the projected and potential development sites. At certain sites, to preclude the potential for impacts from HVAC systems at certain potential and projected development sites, an air quality E-designation would be mapped as part of the proposed zoning for non-city owned parcels, and a Memorandum of Understanding would be established for city-owned parcels with a subsequent Restrictive Declaration for land disposed of by the City. With these restrictions in place, there would be no potential for any significant air quality impacts from HVAC system emissions.
Existing industrial sources, businesses with air emission permits, and institutional, commercial, and large-scale residential developments within 400 feet of a residential projected or potential development site were identified. A search for large industrial sources within 1,000 feet of proposed sensitive uses was also conducted. It was concluded that no existing industrial source or other emission source of concern would have the potential to impact the proposed actions.