chapter 3: coastal environmenthumanitarian.net/cfpnet/hurricane/ref/ccm/vol1_ch03.pdfa rocky...
TRANSCRIPT

3-iCOASTAL CONSTRUCTION MANUAL
TABLE OF CONTENTS
Table of Contents
3.1 Introduction ................................................................................3-1
3.2 United States Coastline Characteristics ........................................3-4
3.2.1 Atlantic Coast .................................................................3-5
3.2.2 Gulf of Mexico Coast .....................................................3-6
3.2.3 Pacific Coast ...................................................................3-6
3.2.4 Great Lakes Coast ..........................................................3-7
3.2.5 Coast of Alaska ..............................................................3-7
3.2.6 Coast of Hawaii and Pacific Territories ...........................3-7
3.2.7 Coast of Puerto Rico and the U.S. Virgin Islands .............3-7
3.3 Coastal Flood Hazards ................................................................3-8
3.3.1 Wave Heights and Wave Crest Elevations...................... 3-10
3.3.2 Wave Runup ................................................................. 3-10
3.3.3 Erosion Considerations and Flood Hazard Mapping ...... 3-12
3.4 References ................................................................................ 3-13
FiguresFigure 3-1 Coastal region terminology. ............................................3-1
Figure 3-2 Principal components of a typical sediment budgetfor a barrier island and barrier spit shoreline. ...................3-3
Figure 3-3 Principal components of a typical sediment budgetfor a mainland shoreline backed by bluffs anddunes. ............................................................................. 3-3
Figure 3-4 Generalized depiction of erosion process alonga rocky coastline. ............................................................ 3-4
Figure 3-5 The United States coastline. ............................................3-5
Chapter 3:Coastal Environment
Page

3-ii FEDERAL EMERGENCY MANAGEMENT AGENCY
TABLE OF CONTENTS
Figure 3-6 This portion of a FIRM shows a coastal SpecialFlood Hazard Area (SFHA) (dark gray), the500-year flood hazard area (light gray), coastal BaseFlood Elevations (BFEs) (numbers in parentheses),and flood insurance rate zones (AE and VE = SFHA,VE = Coastal High Hazard Area, X = areasoutside the SFHA). .........................................................3-9
Figure 3-7 Typical shoreline-perpendicular transectused in the analysis of stillwater andwave crest elevations. ..................................................... 3-9
Figure 3-8 Determination of BFE in coastal flood hazardareas where wave crest elevations exceed waverunup elevations (Zones A and V). ................................ 3-11
Figure 3-9 Where wave runup elevations exceed wave crestelevations, the BFE is equal to the runup elevation. ....... 3-11
Figure 3-10 Portions of pre- and post-Hurricane Fran FIRMsfor Surf City, North Carolina. ........................................ 3-12

3-1COASTAL CONSTRUCTION MANUAL
CHAPTER 3COASTAL ENVIRONMENT
3.1 IntroductionPlanning, siting, design, and construction of coastal residential buildingsrequire an understanding of the coastal environment – including a basicunderstanding of coastal geology, coastal processes, regional variations incoastline characteristics, and coastal sediment budgets. Each of these topicswill be discussed briefly.
Coastal Geology refers to the origin, structure, and characteristics of thesediments that make up the coastal region, from the uplands to thenearshore region (see Figure 3-1). The sediments can vary from smallparticles of silt or sand (a few thousandths or hundredths of an inch across),to larger particles of gravel and cobble (up to several inches across), toformations of consolidated sediments and rock. The sediments can be easilyerodible and transportable by water and wind, as in the case of silts andsands, or can be highly resistant to erosion. The sediments and geology thatcompose a particular coastline will be the product of physical and chemicalprocesses that take place over thousands of years.
Coastal Environment
Figure 3-1 Coastal region terminology (USACE 1984).
Coastal Area
Beach or Shore
Backshore Foreshore
Zone of Nearshore Currents
Offshore
BreakersHigh Water Level
Coa
stlin
e or
Sho
relin
e
Low Water Level
Bottom
Crest of BermBeach Scarp
Berms
Bluff,Dune, or
Escarpment
Inshore or Shoreface(Extends through Breaker Zone)
Upland

3-2 FEDERAL EMERGENCY MANAGEMENT AGENCY
CHAPTER 3 COASTAL ENVIRONMENT
Coastal Processes refers to those physical processes that act upon and shapethe coastline. These processes, which influence the configuration, orientation,and movement of the coast, include the following:
• tides and fluctuating water levels
• waves
• currents (usually generated by tides or waves)
• winds
Coastal processes interact with the local coastal geology and sedimentsupply to form and modify the physical features that will be referred tofrequently in this manual: beaches, dunes, bluffs, and upland areas. Waterlevels, waves, currents, and winds will vary with time at a given location(sometimes according to short-term, seasonal, or longer-term patterns) andwill vary geographically at any point in time. A good analogy is weather:weather conditions at a given location undergo significant variability overtime, but tend to follow seasonal and other patterns. Further, weatherconditions can differ substantially from one location to another at the samepoint in time.
Regional Variations in Coastlines will be the product of variations incoastal processes and coastal geology. These variations can be quitesubstantial, as will be seen in the following sections of this chapter. Thus,shoreline siting and design practices appropriate to one area of the coastlinemay not be suitable for another.
Coastal Sediment Budget refers to the identification of sediment sourcesand sinks, and the quantification of the amounts and rates of sedimenttransport, erosion, and deposition within a defined region. Sedimentbudgets are used by coastal engineers and geologists to analyze and explainshoreline changes and to project future shoreline behavior. While thecalculation of sediment budgets is beyond the scope of typical planning anddesign studies for coastal residential structures, it is useful to consider thebasic concept and to review the principal components that make up asediment budget. Moreover, sediment budgets may have been calculated byothers for the shoreline segment containing a proposed building site.
Figures 3-2 and 3-3 illustrate the principal components of sediment budgetsfor the majority of U.S. coastline types. Note that there may be otherlocally important sediment sources and sinks that are not shown in thefigures. For example, the addition of sand to a beach through beachnourishment could be considered a significant source in somecommunities; the loss of sediment through storm-generated overwash (seeSection 7.5.2.6) could represent an important loss in some areas.
NOTEThe premise behind a coastalsediment budget is simple: ifmore sediment is transportedby coastal processes or man’sactions into a given area thanis transported out, shoreline ac-cretion results; if more sedi-ment is transported out of anarea than is transported in,shoreline erosion results.

3-3COASTAL CONSTRUCTION MANUAL
CHAPTER 3COASTAL ENVIRONMENT
It should be noted that Figures 3-2 and 3-3 do not characterize all coastlines,particularly those rocky coastlines that are generally resistant to erosion andwhose existence does not depend upon littoral sediments transport by coastalprocesses. Rocky coastlines typical of many Pacific, Great Lakes, NewEngland, and Caribbean areas are better represented by Figure 3-4. The figureillustrates the slow process by which rocky coasts erode in response toelevated water levels, waves, and storms.
Figure 3-3Principal components of atypical sediment budget for amainland shoreline backedby bluffs and dunes. Modifiedfrom Komar 1996.
Figure 3-2Principal components of atypical sediment budget for abarrier island and barrier spitshoreline.
DEFINITIONLongshore sand transport iswave- and/or tide-generatedmovement of shallow-watercoastal sediments parallel tothe shoreline.
Cross-shore sand transportis wave- and/or tide-generatedmovement of shallow-watercoastal sediments toward oraway from the shoreline.
DEFINITIONFlood shoals are sediment de-posits formed just inside a tidalinlet by flood tidal currents (alsocalled flood tidal delta).
Ebb shoals are sediment de-posits formed by ebb tidal cur-rents just offshore of a tidal in-let (also called ebb tidal delta).
Mainland
Spit Island
Loss to Flood Shoals
Bay or Estuary
TidalInlet
WindTransport
SandBypassingFrom Ebb Shoal
Loss toEbb
Shoal
CreditsDebits
Cross-ShoreExchange With
Continental Shelf
LongshoreSand Transport
ErodingSandDunes
LongshoreSand
Transport
CreditsDebits
ErodingSea Cliffs
Budget of Sediments
LongshoreSand Transport
ErodingSand Dunes
Input From Rivers
Cross-ShoreExchange With
Continental Shelf
SubmarineCanyon

3-4 FEDERAL EMERGENCY MANAGEMENT AGENCY
CHAPTER 3 COASTAL ENVIRONMENT
3.2 United States Coastline CharacteristicsSeveral sources (National Research Council 1990, Shepard and Wanless1971, USACE 1971) were used to characterize and divide the coastline of theUnited States into seven major segments and smaller subsegments (see Figure3-5). Each of the subsegments generally describes coastlines of similarorigin, characteristics, and hazards.
• The Atlantic coast, extending from Maine to the Florida KeysThe North Atlantic coast, extending from Maine to Long Island, NewYork
The Mid-Atlantic coast, extending from New Jersey to Virginia
The South Atlantic coast, extending from North Carolina to SouthFlorida
The Florida Keys
• The Gulf of Mexico coast, extending from the Florida Keys to Texas
The Eastern Gulf coast, extending from southwest Florida toMississippi
The Mississippi Delta coast of southeast Louisiana
The Western Gulf coast of Louisiana and Texas
Figure 3-4Generalized depiction oferosion process along arocky coastline (from HorningGeosciences 1998).

3-5COASTAL CONSTRUCTION MANUAL
CHAPTER 3COASTAL ENVIRONMENT
• The Pacific coast, extending from California to WashingtonThe Southern California coast, extending from San Diego County toPoint Conception (Santa Barbara County), California
The Northern Pacific coast, extending from Point Conception,California, to Washington
• The Great Lakes coast, extending from Minnesota to New York
• The coast of Alaska
• The coast of Hawaii and Pacific Territories
• The coast of Puerto Rico and the U.S. Virgin Islands
The USACE (1971) estimated the total shoreline length of the continentalUnited States, Alaska, and Hawaii at 84,240 miles, including 34,520 miles ofexposed shoreline and 49,720 miles of sheltered shoreline. The shorelinelength of the continental United States alone was put at 36,010 miles (13,370miles exposed, 22,640 miles sheltered).
3.2.1 Atlantic CoastThe North Atlantic coast is glacial in origin. It is highly irregular, witherosion-resistant rocky headlands and pocket beaches in northern NewEngland, and erodible bluffs and sandy barrier islands in southern NewEngland and along Long Island, New York.
The Mid-Atlantic coast extends from New Jersey to Virginia, and includes twoof the largest estuaries in the United States—Delaware Bay and ChesapeakeBay. The open coast shoreline is generally composed of long barrier islandsseparated by tidal inlets and bay entrances.
Figure 3-5The United States coastline.
AlaskaHawaii
NorthernPacificCoast
SouthernCalifornia
Coast
Western
Gulf C
oast
Eastern
Gulf C
oast
Great LakesCoast
NorthAtlanticCoast
Mid-AtlanticCoast
SouthAtlanticCoast
Florida Keys
Gulf Coast
Mississippi Delta Coast

3-6 FEDERAL EMERGENCY MANAGEMENT AGENCY
CHAPTER 3 COASTAL ENVIRONMENT
The South Atlantic coast consists of three regions: (1) the North Carolinaand northern South Carolina shoreline, composed of long barrier andmainland beaches (including the Outer Banks and the South Carolina GrandStrand region); (2) the region extending from Charleston, South Carolina, tothe St. Johns River entrance at Jacksonville, Florida (a tide-dominated coastcomposed of numerous short barrier islands, separated by large tidal inletsand backed by wide expanses of tidal marsh); and (3) the east coast ofFlorida (composed of barrier and mainland beaches backed by narrow baysand rivers).
The Florida Keys are a series of low-relief islands formed by limestone andreef rock, with narrow, intermittent carbonate beaches.
The entire Atlantic coast is subject to high storm surges from hurricanes and/or northeasters. Wave runup on steeply sloping beaches and shorelines in NewEngland is also a common source of coastal flooding.
3.2.2 Gulf of Mexico CoastThe Gulf of Mexico coast can be divided into three regions: (1) the easternGulf coast from southwest Florida to Mississippi (composed of low-lyingsandy barrier islands south of Tarpon Springs, Florida, and west of St.Marks, Florida, with a marsh-dominated coast in between in the Big Bendarea of Florida); (2) the Mississippi Delta region, characterized by wide,marshy areas and a low-lying coastal plain; and (3) the western Gulf ofMexico coast, including the cheniers of southwest Louisiana, and the long,sandy barrier islands of Texas.
The entire Gulf coast is vulnerable to high storm surges from hurricanes.Some areas (e.g., the Big Bend area of Florida) are especially vulnerablebecause of a wide, shallow continental shelf and low-lying upland areas.
3.2.3 Pacific CoastThe Pacific coast can be divided into two regions: (1) the southern Californiareach (long, sandy beaches and coastal bluffs dominate this region) and (2)the northern Pacific reach (characterized by rocky cliffs, pocket beaches, andoccasional long sandy barriers near river mouths).
Open coast storm surges along the Pacific shoreline are generally small (lessthan 2 feet) because of the narrow continental shelf and deep water close toshore. However, storm wave conditions along the Pacific shoreline are verysevere, and the resulting wave runup can be very destructive. In some areas ofthe Pacific coast, tsunami flood elevations can be much higher than floodelevations associated with coastal storms.
DEFINITIONCheniers are Mississippi Deltasediments transported west-ward to form sandy ridges atopmud plains.
3-7COASTAL CONSTRUCTION MANUAL
CHAPTER 3COASTAL ENVIRONMENT
3.2.4 Great Lakes CoastThe shorelines of the Great Lakes are highly variable and include wetlands,low and high cohesive bluffs, low sandy banks, and lofty sand dunes perchedon bluffs (200 feet or more above lake level). Storm surges along the GreatLakes are generally less than 2 feet except in embayments (2–4 feet) and onLake Erie (up to 8 feet). Periods of active erosion are triggered by heavyprecipitation events, storm waves, rising lake levels, and changes ingroundwater outflow along the coast.
3.2.5 Coast of AlaskaThe coast of Alaska can be divided into two areas: (1) the southern coast,dominated by steep mountainous islands indented by deep fjords and (2)the Bering Sea and arctic coasts, backed by a coastal plain dotted withlakes and drained by numerous streams and rivers. The climate of Alaskaand the action of ice along the shorelines set it apart from most othercoastal areas of the United States.
3.2.6 Coast of Hawaii and Pacific TerritoriesThe islands that make up Hawaii are submerged volcanoes; thus, the coast ofHawaii is formed by rocky cliffs and intermittent sandy beaches. Coastlinesalong the Pacific Territories are generally similar to those of Hawaii. Coastalflooding can be due to two sources: storm surges from hurricanes or cyclones,and wave runup from tsunamis.
3.2.7 Coast of Puerto Rico and the U.S. Virgin IslandsLike the Hawaiian Islands and Pacific Territories, the islands of Puerto Ricoand the Virgin Islands are the products of ancient volcanic activity. The coastallowlands of Puerto Rico, which occupy nearly one-third of the island’s area,contain sediment eroded and transported from the steep, inland mountains byrivers and streams. Ocean currents and wave activity rework the sediments onpocket beaches around each island. Coastal flooding is usually due tohurricanes, although tsunami events are not unknown to the Caribbean.

3-8 FEDERAL EMERGENCY MANAGEMENT AGENCY
CHAPTER 3 COASTAL ENVIRONMENT
3.3 Coastal Flood HazardsCoastal flood hazards at a site will depend upon several factors:
• the elevation and topography of the site
• the erodibility of the site
• the nature and intensity of coastal flood events affecting the site
FEMA has developed procedures for estimating and mapping coastal floodhazards that take the above factors into account. Some of the underlyingconcepts and mapping issues are described here; more detail is provided inChapters 6 and 7.
This manual will introduce the concept of the Coastal A zone, in order todifferentiate between A zones in coastal areas from those in inland areas (seeSection 1.4). Coastal A zones are not currently mapped or regulated byFEMA any differently than inland A zones; however, post-disaster damageinspections consistently show the need for such a distinction. Flood hazards incoastal A zones, like those in V zones, can include the effects of waves,velocity flow, and erosion (although the magnitude of these effects will be lessin coastal A zones than in V zones).
Figure 3-6 shows a typical Flood Insurance Rate Map (FIRM) that a designeris likely to encounter for a coastal area. Three flood hazard zones have beenmapped: V zones, A zones, and X zones. The V zone (also known as thevelocity zone or the Coastal High Hazard Area) is the most hazardous of thethree areas because structures there will be exposed to the most severe floodand wind forces, including wave action, high-velocity flow, and erosion. TheA zone shown on the map should be thought of as a coastal A zone. FEMA’sflood mapping procedures show the area designated as Zone X on the maphas less than a 1-percent probability of flooding in any year.
A FIRM is the product of a Flood Insurance Study (FIS) conducted for acommunity under FEMA’s National Flood Insurance Program. A coastal FISis completed with specified techniques and procedures (FEMA 1995a, FEMA1995b) to determine stillwater and wave elevations along transects drawnperpendicular to the shoreline (see Figures 3-6 and 3-7). The determination ofthe 100-year stillwater elevation (and stillwater elevations associated withother return periods) is usually accomplished through the statistical analysisof historical tide and water level data, or by the use of a numerical storm surgemodel. Wave heights and elevations are computed from stillwater andtopographic data with established procedures and models that account forwave dissipation by obstructions (e.g., sand dunes, buildings, vegetation) andwave regeneration across overland fetches.
NOTESeveral factors can contribute tothe 100-year stillwater elevationin a coastal area. The most im-portant factors include offshorebathymetry, astronomical tide,wind setup (rise in water surfaceas strong winds blow water to-ward the shore), pressure setup(rise in water surface due to lowatmospheric pressure), wavesetup (rise in water surface in-side the surf zone due to thepresence of breaking waves),and, in the case of the GreatLakes, seiches and long-termchanges in lake levels.
NOTEBase Flood Elevations (BFEs) incoastal areas will be controlledby the highest of the wavecrest elevation or the waverunup elevation (see Sections3.3.1 and 3.3.2).

3-9COASTAL CONSTRUCTION MANUAL
CHAPTER 3COASTAL ENVIRONMENT
Figure 3-6This portion of a FIRM showsa coastal Special FloodHazard Area (SFHA) (darkgray), the 500-year floodhazard area (light gray),coastal Base Flood Elevations(BFEs) (numbers inparentheses), and floodinsurance rate zones (AE andVE = SFHA, VE = Coastal HighHazard Area, X = areasoutside the SFHA).
Figure 3-7Typical shoreline-perpendicular transect used in the analysis of stillwater and wave crest elevations.
NOTEAdditional information aboutFIRMs is available in FEMA’s1994 booklet How to Use a FloodMap to Protect Your Property,FEMA 258 (FEMA 1994).
Zone X
Zone AE(EL9)
Zone AE(EL10)
Zone VE(EL10)Zone VE
(EL11)
Zone VE(EL13)
Typical Transect Shown in Figure 3-7
Zone VE(EL15)
Zone X
Zone XZone X
Atlantic Ocean
X
BFE IncludingWave Effects
Properly Elevated Building
Unelevated Building Constructed Before Community Entered the NFIP
100-YearStillwater Elevation
Datum (e.g. NGVD, NAVD)
Shoreline Sand Beach Buildings OverlandWind Fetch
VegetatedRegion
Limit of 100-YearFlooding and Waves
Wave Height < 3 ftWave Height > 3 ft
X

3-10 FEDERAL EMERGENCY MANAGEMENT AGENCY
CHAPTER 3 COASTAL ENVIRONMENT
3.3.1 Wave Heights and Wave Crest ElevationsFEMA’s primary means of establishing Base Flood Elevations (BFEs) anddistinguishing between V zones, (coastal) A zones, and X zones is the waveheight. The wave height is simply the vertical distance between the crest andtrough of a wave propagating over the water surface. BFEs in coastal areasare usually set at the crest of the wave as it propagates inland.
The maximum wave crest elevation (used to establish the BFE) is determinedby the maximum wave height, which depends largely on the 100-yearstillwater depth (d
100). This depth is the difference between the 100-year
stillwater elevation (E100) and the ground elevation (GS). Note that, asexplained in Chapter 11, GS is not the existing ground elevation; it is theground elevation that will result from the amount of erosion expected to occurduring the 100-year flood.
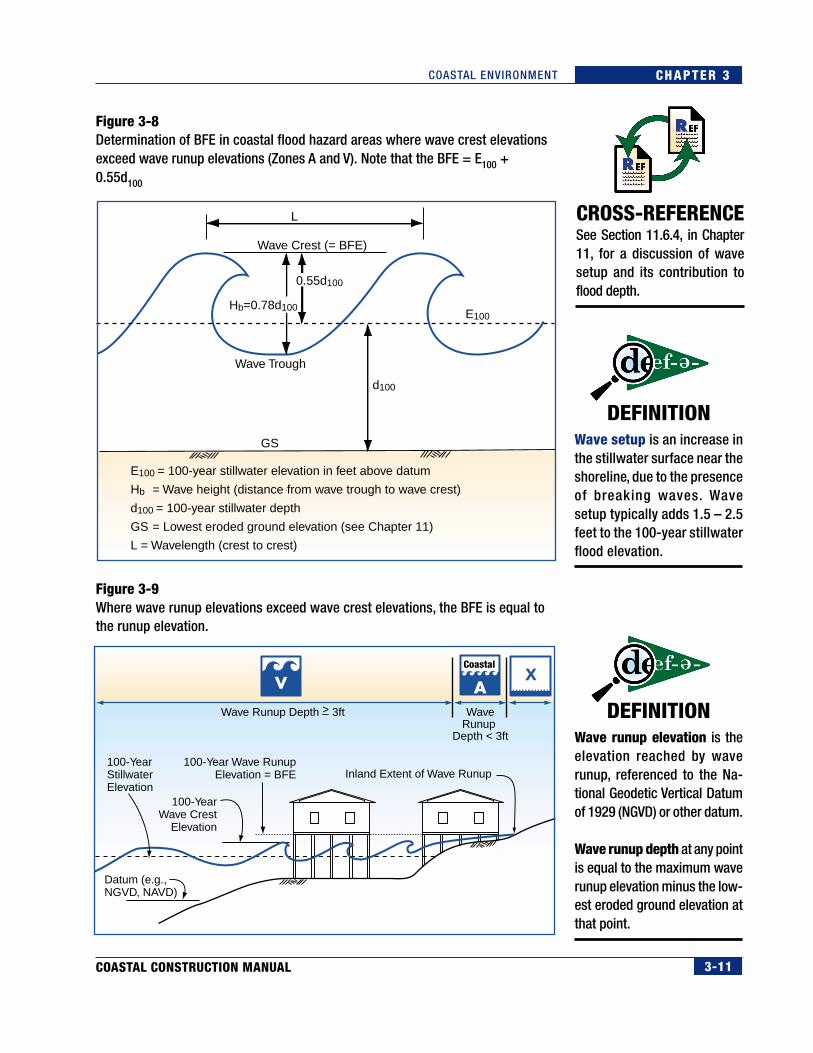
In relatively shallow waters, such as those in the coastal areas of the UnitedStates, the maximum height of a breaking wave (Hb) is determined by theequation Hb = 0.78dsw, where dsw is the stillwater depth. The maximum heightof a breaking wave above the stillwater elevation is equal to 0.55dsw. Thus, inthe case of the 100-year (base) flood, Hb = 0.78d100 and the maximum heightof a breaking wave above the 100-year stillwater elevation = 0.55d100 (seeFigure 3-8). Note that for wind-driven waves, water depth is only one of threeparameters that determine the actual wave height at a particular site (windspeed and fetch length are the other two). In some instances, actual waveheights may be below the computed maximum height.
For a coastal flood hazard area where the ground is gently sloping, the BFEshown on the FIRM is equal to the ground elevation (referenced to theNational Geodetic Vertical Datum of 1929 [NGVD] or other datum) plus the100-year stillwater depth (d100) plus 0.55d100. For example, where the groundelevation is 4 feet NGVD and d100 is 6 feet, the BFE is equal to 4 feet plus 6feet plus 3.3 feet, or 13.3 feet NGVD.
3.3.2 Wave RunupOn steeply sloped shorelines, the rush of water up the surface of the naturalbeach, including dunes and bluffs, or the surface of a manmade structure, suchas a revetment or vertical wall, can result in flood elevations higher than thoseof the crests of wind-driven waves. For a coastal flood hazard area where thissituation occurs, the BFE shown on the FIRM is equal to the highest elevationreached by the water (see Figure 3-9). The methodology adopted by FEMAfor the computation of wave runup elevations includes the determination ofwave heights. Where the wave runup elevations are lower than the waveheight elevations, the BFE equals the wave height elevation.
CROSS-REFERENCEFor situations in which the de-sign flood is greater than the100-year flood refer to Section11.6.1, in Chapter 11.
DEFINITIONWave height is the vertical dis-tance between the wave crestand wave trough (see Figure3-8).
Wave crest elevation is the el-evation of the crest of a wave,referenced to the National Geo-detic Vertical Datum of 1929(NGVD) or other datum.
CROSS-REFERENCEDesigners are referred to Chap-ter 11 for a discussion of erodedground elevations and impactson flood elevations.
DEFINITIONWave runup is the rush of wa-ter up a slope or structure.
3-11COASTAL CONSTRUCTION MANUAL
CHAPTER 3COASTAL ENVIRONMENT
Figure 3-8Determination of BFE in coastal flood hazard areas where wave crest elevationsexceed wave runup elevations (Zones A and V). Note that the BFE = E100 +0.55d100
Figure 3-9Where wave runup elevations exceed wave crest elevations, the BFE is equal tothe runup elevation.
DEFINITIONWave runup elevation is theelevation reached by waverunup, referenced to the Na-tional Geodetic Vertical Datumof 1929 (NGVD) or other datum.
Wave runup depth at any pointis equal to the maximum waverunup elevation minus the low-est eroded ground elevation atthat point.
CROSS-REFERENCESee Section 11.6.4, in Chapter11, for a discussion of wavesetup and its contribution toflood depth.
DEFINITIONWave setup is an increase inthe stillwater surface near theshoreline, due to the presenceof breaking waves. Wavesetup typically adds 1.5 – 2.5feet to the 100-year stillwaterflood elevation.
L
Wave Crest (= BFE)
Wave Trough
GS
0.55d100
E100
E100 = 100-year stillwater elevation in feet above datum
Hb = Wave height (distance from wave trough to wave crest)
d100 = 100-year stillwater depth
GS = Lowest eroded ground elevation (see Chapter 11)
L = Wavelength (crest to crest)
d100
Hb=0.78d100
Inland Extent of Wave Runup
100-YearWave Crest
Elevation
100-Year Wave RunupElevation = BFE
Wave Runup Depth > 3ft WaveRunup
Depth < 3ft
100-YearStillwaterElevation
Datum (e.g., NGVD, NAVD)
X

3-12 FEDERAL EMERGENCY MANAGEMENT AGENCY
CHAPTER 3 COASTAL ENVIRONMENT
Figure 3-10Portions of pre- and post-Hurricane FranFIRMs for Surf City, North Carolina.
Post-Hurricane Fran FIRM
CROSS-REFERENCEChapter 7 of this manual dis-cusses the identification ofcoastal hazards and their effects.
3.3.3 Erosion Considerations and Flood Hazard MappingCurrent FIS procedures account for the potential loss of protective dunesduring the 100-year flood. However, this factor was not considered in thepreparation of many older coastal FIRMs, which delineated V zones withoutany consideration for storm-induced erosion. V-zone boundaries were oftendrawn at the crest of the dune solely on the basis of the elevation of theground and without regard for the erosion that would occur during a storm.
Designers, property owners, and floodplain managers should be careful not toassume that flood hazard zones shown on FIRMs accurately reflect currentflood hazards. For example, flood hazard restudies completed after hurricaneOpal (1995 – Florida Panhandle) and Fran (1996 – Topsail Island, NorthCarolina) have produced FIRMs that are dramatically different from the FIRMsin effect prior to the storms.
Figure 3-10 compares pre-and post-storm FIRMs for Surf City, NorthCarolina. The map changes are attributable to two factors: (1) pre-stormFIRMs did not show the effects of erosion that had occurred since the FIRMswere published and did not meet technical standards currently in place, and(2) Hurricane Fran caused significant changes to the topography of the
Pre-Hurricane Fran FIRM

3-13COASTAL CONSTRUCTION MANUAL
CHAPTER 3COASTAL ENVIRONMENT
barrier island. Not all coastal FIRMs would be expected to undergo suchdrastic revisions after a flood restudy; however, many FIRMs may be in needof updating, and designers should be aware that FIRMs may not reflectpresent flood hazards at a site.
3.4 ReferencesFederal Emergency Management Agency. 1994. How to Use a Flood Map toProtect Your Property. FEMA 258.
Federal Emergency Management Agency. 1995a. Flood Insurance StudyGuidelines and Specifications for Study Contractors. FEMA 37.
Federal Emergency Management Agency. 1995b. Guidelines andSpecifications for Wave Elevation Determination and V Zone Mapping –Final Draft.
Horning Geosciences. 1998. Illustration showing principal geologic hazardsacting along typical sea cliff in Oregon.
Komar, P. D. 1996. “The Budget of Littoral Sediments – Concepts andApplications.” Shore and Beach, Vol. 64, No. 3, July 1996. pp. 18-25.
National Research Council. 1990. Managing Coastal Erosion. NationalAcademy Press.
Shepard, F. P.; H. L. Wanless. 1971. Our Changing Coastlines.McGraw-Hill, Inc.
U.S. Army Corps of Engineers. 1971. Report on the National Shoreline Study.
U.S. Army Corps of Engineers. 1984. Shore Protection Manual.