chapter 5 - wastewater treatment facilities
TRANSCRIPT


ʱ´ í ó ݸ¿°¬»® ë
É¿¬»©¿¬»® Ì®»¿¬³»²¬ Ú¿½·´·¬·»
ѽ¬±¾»® îððê Ú·²¿´ ÉÎÓÐ ëóï
CHAPTER 5 - WASTEWATER TREATMENT FACILITIES
5.1 Introduction The purpose of this chapter is to summarize the evaluation of the existing wastewater facilities� infrastructure and performance. The results from this evaluation will serve as the basis for developing a long-term plan to meet the wastewater treatment needs of Guam. The previous chapter assessed the collection system and established current wastewater flow estimates and future flow projections. Current flow estimates were based on recent monitoring results and future flow projections by incorporating the current flow estimates with future population and land use planning. Two essential criteria in planning for wastewater treatment facilities are quantity and quality: (1) the capacity to treat and dispose of current and future flows; and (2) ability to reliably achieve the necessary effluent quality for the intended means of disposal.
The seven GWA wastewater treatment facilities, together with the collections systems, are sited on the island to collect and treat wastewater generated by significant population centers. In rural areas where the population is widespread and there is little or no risk to the environment, individual wastewater treatment and disposal systems are used (e.g., cesspools and septic tanks). As discussed in Volume 1, Chapter 6 � Population and Land Use Forecast, Guam�s projected growth is such that the locations of the existing major wastewater treatment facilities are, in general, still appropriate and the contributory collection systems can grow to meet future demands.
The goal of this chapter is to identify major capital improvement requirements for the wastewater treatment facilities and estimate costs for these projects, to be used for planning and budgeting purposes. The WRMP is not intended to provide the depth and detailed evaluation necessary to develop construction documents, but it makes reasonable assumptions of likely future scenarios in order to develop the CIP budget. Detailed facility requirements will be developed in system-wide and/or individual Facilities Plans and Basis of Design reports prepared in conjunction with construction documents.
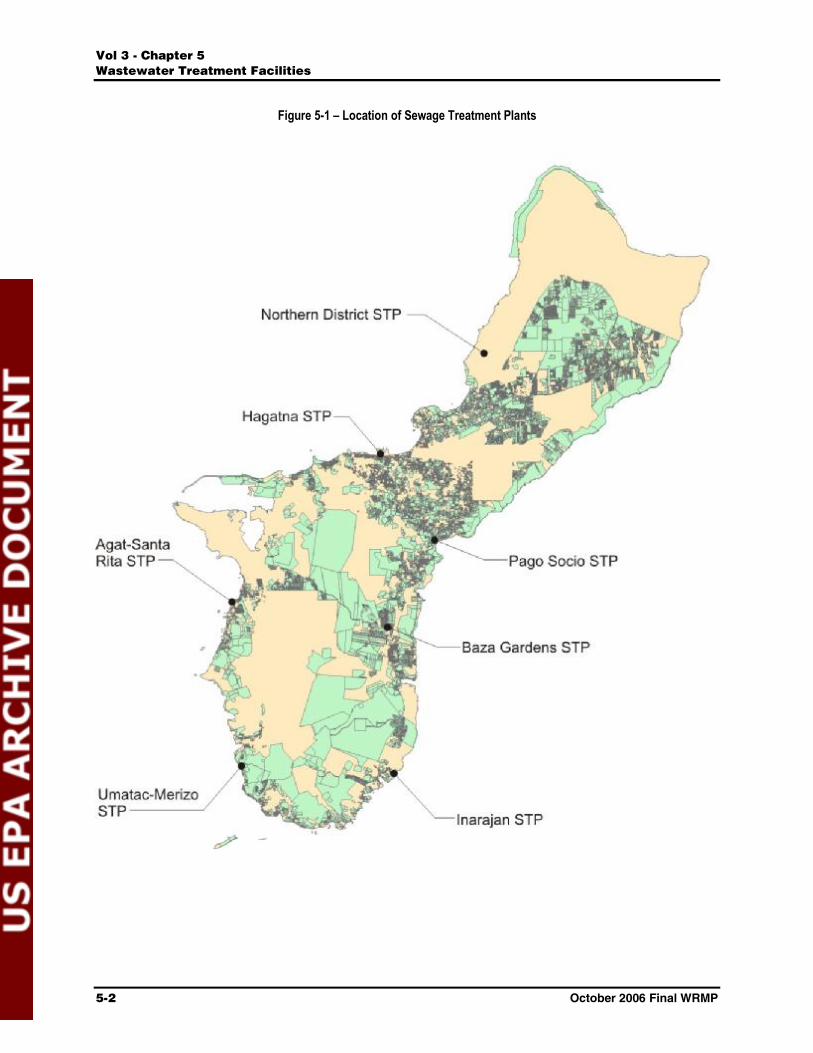
This chapter establishes the necessary background and basis for the development of the wastewater treatment facility CIP recommendations presented in Chapter 9 � Recommended Wastewater CIP of this volume. This evaluation will focus on the seven treatment facilities located on Guam, as shown in Figure 5-1 � Location of Sewage Treatment Plants.
Agat-Santa Rita STP Hagatna STP Baza Gardens STP Umatac-Merizo STP Northern District STP (NDSTP) Inarajan STP Pago Socio STP
The Hagatna STP and NDSTP are regional facilities that provide wastewater treatment for multiple villages in addition to Andersen Air Force Base. The Agat-Santa Rita, Baza Gardens, Inarajan, Umatac-Merizo, and Pago-Socio STPs provide wastewater treatment for their respective villages.
ʱ´ í ó ݸ¿°¬»® ë
É¿¬»©¿¬»® Ì®»¿¬³»²¬ Ú¿½·´·¬·»
ëóî ѽ¬±¾»® îððê Ú·²¿´ ÉÎÓÐ
Figure 5-1 – Location of Sewage Treatment Plants

ʱ´ í ó ݸ¿°¬»® ë
É¿¬»©¿¬»® Ì®»¿¬³»²¬ Ú¿½·´·¬·»
ѽ¬±¾»® îððê Ú·²¿´ ÉÎÓÐ ëóí
5.2 Approach The first step in the planning process is to assess the existing facilities in terms of their overall capacity and ability to achieve the necessary effluent quality for disposal. Detailed hydraulic analyses of the wastewater treatment facilities were not performed at the master plan level (and were also not possible because of the lack of reliable as-built plans and poor current condition of the facilities); however, should be included in the proposed facility planning projects. At the master plan level, it is assumed that costs to remedy internal plant hydraulic constraints are included in cost estimate contingencies.
There are various methods used to determine the capacity and efficiency of treatment facilities. The methods available for this assessment, in order of decreasing confidence level, include the following:
Stress testing � individual process units and/or the facility as a whole Recent historical process and flow data � influent and effluent flow meters, process control measurements, facility performance data, regulatory compliance reports Previous studies in conjunction with textbook calculations and assumptions based on as-built record drawings Original Basis of Design reports
Unfortunately, in general, the existing facilities are in such disrepair, lacking necessary instrumentation, and/or lacking parallel or redundant treatment units that stress testing is not feasible. Following completion of current and ongoing construction projects, along with supplemental instrumentation and laboratory support, stress testing of portions of the treatment facilities and some critical process units will be possible, and should be performed. The purpose of the stress testing is to monitor how individual process units, and if possible the entire facility, perform under various challenging conditions. Accurate and reliable recent historical flow information was not available since none of the existing facilities have recording influent and effluent flow measurement devices or the existing flow measurement equipment has not been functional in recent times. Process control data was not available since analyses have not been performed on a regular or periodic basis, either for individual process units or for entire facilities. The reported regulatory information (DMRs) is suspect because of questionable sampling and analysis techniques, but was used in the following permitting assessment since that is what was submitted to the regulatory agency. Original Basis of Design documents could not be supplied by GWA, so the process design assessment in Appendix 3B � Capacity Assessment Calculation Sheets, relies primarily on �textbook� calculations based on GWA record drawings, reported regulatory information (where available), and monitoring results from Chapter 4 � Wastewater Collection Systems in this volume.
5.2.1 Available Information Information and findings presented in recent Comprehensive Performance Evaluation (CPE) reports and GWA Quarterly Monitoring Reports (2004-2005) were one of the primary sources of data for the following assessment. These documents indicate that not all facilities are fully functional and most have not been able to meet regulatory performance requirements (NPDES permits). This evaluation process is based on a snapshot of time with ongoing repairs, improvements, and modifications occurring throughout the duration of the master planning process. The information database for this assessment also relied on the May 2005 system condition assessment in Chapter 3 � Wastewater Facilities Condition
ʱ´ í ó ݸ¿°¬»® ë
É¿¬»©¿¬»® Ì®»¿¬³»²¬ Ú¿½·´·¬·»
ëóì ѽ¬±¾»® îððê Ú·²¿´ ÉÎÓÐ
Assessment of this volume, as well as recent DMRs from January 2004 to March 2005. The approach to determine the existing and future wastewater treatment facility needs included the following steps:
Collect and review reports and studies, historical flows and process control data, performance data, regulatory reports, DMR reports, and O&M reports. Note that reliable influent and/or effluent flow records were not available from the treatment facilities due to the lack of instrumentation or disrepair of flow measurement equipment. Recent flows reported in DMRs and other documents were based on instantaneous manual measurements or estimates. Interview GWA staff and Guam EPA staff. Identify the original design of the facilities and try to determine capacity and treatment requirements. Original construction plans for most of facilities were located; however, basis of design reports and plans for modification were, in general, not available. Determine current capacity and treatment requirements (including reasonable improvements), from Chapter 4 � Wastewater Collection System of this volume. Estimate future flows from Chapter 4 and disposal requirements as they pertain to effluent quality requirements. Determine necessary treatment facility improvements to meet current permit requirements, future flows, and effluent quality requirements. Estimate costs for these improvements.
Research and discussions with GWA staff suggest that collection of flow data, wastewater sampling, and some laboratory analyses were not performed according to standard protocols, and therefore may not accurately represent the capabilities of the various facilities. The original Basis of Design reports for the STPs were unavailable, so as much as possible �original� design capacities for the treatment facilities were obtained from the original design plans, CPEs, and/or the 1994 Guam Island-Wide Facilities Plan. The current process capacity estimates (see Appendix 3B) were calculated based on layout and dimensional information from the design plans, CPEs, system condition assessment, site observations, and textbook process performance criteria. Effluent discharge requirements are based on current discharge permits and �best estimates based on professional judgment and experience� relative to future permit requirements. Although the �10 States Standards� were originally consulted for design/performance criteria, other references as cited in Appendix 3B were used in the analyses since we believed them to better suited for this application.
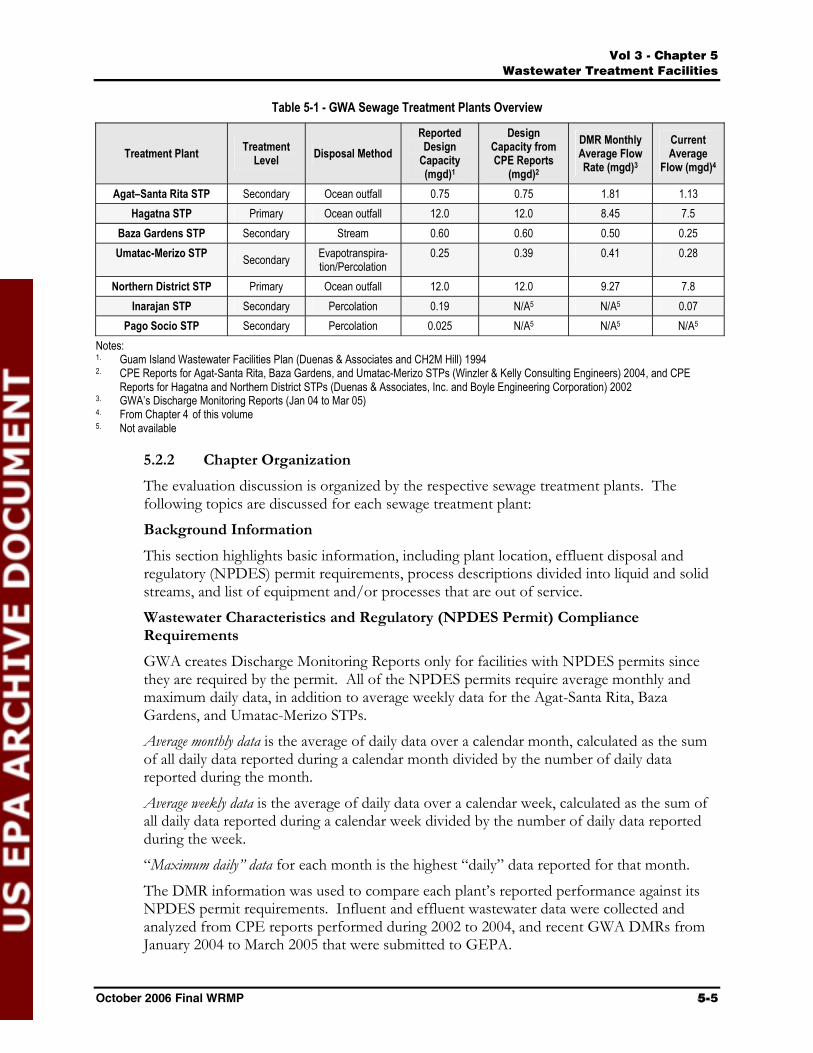
Table 5-1, GWA Sewage Treatment Plants Overview, presents the level of treatment, effluent disposal method, reported design capacity, capacity based on CPE report analyses, DMR-reported influent flows, and current average flow based on the flow monitoring task discussed in Chapter 4 of this volume.
ʱ´ í ó ݸ¿°¬»® ë
É¿¬»©¿¬»® Ì®»¿¬³»²¬ Ú¿½·´·¬·»
ѽ¬±¾»® îððê Ú·²¿´ ÉÎÓÐ ëóë
Table 5-1 - GWA Sewage Treatment Plants Overview
Treatment Plant TreatmentLevel Disposal Method
ReportedDesign
Capacity (mgd)1
DesignCapacity from CPE Reports
(mgd)2
DMR Monthly Average Flow Rate (mgd)3
CurrentAverage
Flow (mgd)4
Agat–Santa Rita STP Secondary Ocean outfall 0.75 0.75 1.81 1.13 Hagatna STP Primary Ocean outfall 12.0 12.0 8.45 7.5
Baza Gardens STP Secondary Stream 0.60 0.60 0.50 0.25 Umatac-Merizo STP Secondary Evapotranspira-
tion/Percolation 0.25 0.39 0.41 0.28
Northern District STP Primary Ocean outfall 12.0 12.0 9.27 7.8 Inarajan STP Secondary Percolation 0.19 N/A5 N/A5 0.07
Pago Socio STP Secondary Percolation 0.025 N/A5 N/A5 N/A5
Notes:1. Guam Island Wastewater Facilities Plan (Duenas & Associates and CH2M Hill) 1994 2. CPE Reports for Agat-Santa Rita, Baza Gardens, and Umatac-Merizo STPs (Winzler & Kelly Consulting Engineers) 2004, and CPE
Reports for Hagatna and Northern District STPs (Duenas & Associates, Inc. and Boyle Engineering Corporation) 2002 3. GWA’s Discharge Monitoring Reports (Jan 04 to Mar 05) 4. From Chapter 4 of this volume5. Not available
5.2.2 Chapter Organization The evaluation discussion is organized by the respective sewage treatment plants. The following topics are discussed for each sewage treatment plant:
Background Information This section highlights basic information, including plant location, effluent disposal and regulatory (NPDES) permit requirements, process descriptions divided into liquid and solid streams, and list of equipment and/or processes that are out of service.
Wastewater Characteristics and Regulatory (NPDES Permit) Compliance Requirements GWA creates Discharge Monitoring Reports only for facilities with NPDES permits since they are required by the permit. All of the NPDES permits require average monthly and maximum daily data, in addition to average weekly data for the Agat-Santa Rita, Baza Gardens, and Umatac-Merizo STPs.
Average monthly data is the average of daily data over a calendar month, calculated as the sum of all daily data reported during a calendar month divided by the number of daily data reported during the month.
Average weekly data is the average of daily data over a calendar week, calculated as the sum of all daily data reported during a calendar week divided by the number of daily data reported during the week.
�Maximum daily� data for each month is the highest �daily� data reported for that month.
The DMR information was used to compare each plant�s reported performance against its NPDES permit requirements. Influent and effluent wastewater data were collected and analyzed from CPE reports performed during 2002 to 2004, and recent GWA DMRs from January 2004 to March 2005 that were submitted to GEPA.
ʱ´ í ó ݸ¿°¬»® ë
É¿¬»©¿¬»® Ì®»¿¬³»²¬ Ú¿½·´·¬·»
ëóê ѽ¬±¾»® îððê Ú·²¿´ ÉÎÓÐ
Only the monthly effluent characteristics from the DMRs (January 2004 to March 2005) were used in the assessment. Daily and weekly data were not available in the DMRs to determine whether the NPDES permit requirements were actually met. Staff interviews regarding the sampling procedures and flow data indicated that the flow data reported in the DMRs were determined by instantaneous manual measurements when wastewater samples were taken. These discussions also indicated that flow-based composite samples were not used for the DMR analyses. Although there are shortcomings in the available regulatory reporting and operational data, this information was used to evaluate compliance with the respective NPDES permits because it was the only recent historical data available.
Capacity Assessment A process capacity assessment of the wastewater treatment facilities was performed based on assumed representative current wastewater influent characteristics and available wastewater facility designs. The objective of this evaluation was to determine reasonable estimates of process capacities for the wastewater treatment facilities to compare against current (monitored) and future flow projections. Unit processes for each treatment facility are summarized in Appendix 3C � List of Unit Processes of each STP. The detailed calculations for the process capacity assessments are presented in Appendix 3B. In general, the treatment facilities lack true redundant process units and equipment. The calculations ignored redundancy and assumed all process units and equipment was available. However, this lack of redundancy affects reliability and one of the goals of the future capital program should be to �build� redundancy into facilities and is included in the budget estimates in Chapter 3-9.
The calculated performance estimates were used as a basis for evaluating future plant expansions, modifications, improvements, and new facilities costs that will establish CIP budgets. The calculated process flow capacity for each treatment facility is based on the following general assumptions and criteria.
Process capacity assessment calculations were used to estimate the process flow capacity of the wastewater treatment facilities; hydraulic analyses were not performed.
In order to perform these calculations, it was assumed that the treatment facilities are in good working order, there are no hydraulic constraints, and all of the main unit process operations are functional and can be operated at their full capacity.
Dimensions of the existing facilities and unit processes were obtained from the original record (design) drawings, where available.
Average influent characteristics for the wastewater (BOD5 and TSS concentrations) were estimated from the average concentrations of monthly average BOD5 and TSS influent reported in the DMRs during the period between January 2004 and March 2005.
The capacity assessment was developed only for major unit processes, such as the aerobic system, clarifiers, and sludge digestion and handling systems. Individual pieces of equipment supporting the unit processes were not evaluated

ʱ´ í ó ݸ¿°¬»® ë
É¿¬»©¿¬»® Ì®»¿¬³»²¬ Ú¿½·´·¬·»
ѽ¬±¾»® îððê Ú·²¿´ ÉÎÓÐ ëóé
and are assumed to be operational and sufficient to deliver the necessary performance.
The capacity assessment assumed that wastewater treatment processes are not restricted by existing equipment (such as the actual condition and capacity of pumps, compressors, blowers, valves, and piping systems) and that all of the necessary individual equipment is available to support the major unit process operations.
Each major unit process of the treatment facilities was investigated individually. The lowest calculated process flow treatment capacity was used as the representative available flow capacity for these treatment facilities. An exception would be facilities that are no longer used, such as the chlorination systems.
It is recognized that the Stipulated Order cited the �Ten States Standards� as a resource for design assessments, it is believed that the following references meet and exceed the �Standards� and were used when basis of design reports were not available for the facility assessments:
Wastewater Engineering, Treatment, Disposal, and Reuse by Metcalf and Eddy, Inc., 3rd Edition. Design of Municipal Wastewater Treatment Plants Volume 1 and 2 by Water Environment Federation (WEF) Manual of Practice No. 8. American Society of Civil Engineers (ASCE) Manual and Report on Engineering Practice No. 76. Small and Decentralized Wastewater Management Systems by Ronald W. Crites and George Tchobanoglous.
Recommendations and CIP Planning Recommendations for future facilities and related CIP projects are discussed in Volume 3, Chapter 4 � Wastewater Collection System. The emphasis is on assuring reliable treatment and disposal of the current estimated flows. It also presents future flow projections and the facilities necessary for reliable treatment and disposal. Relevant budgetary cost estimates are located in Volume 3, Chapter 9 � Recommended Wastewater CIP.
5.3 Agat-Santa Rita STP 5.3.1 Introduction
The Agat-Santa Rita STP was built in 1972 and is classified as a Class II STP as defined by the GEPA Water and Wastewater Regulations, September 25, 1978. This �package� plant provides secondary treatment using a single train contact stabilization process (no process redundancy was provided). The treated effluent combines with the U.S. Navy�s Apra Harbor WWTP (not part of the GWA system) effluent, and the combined flow is discharged to the ocean through the Tipalao Bay outfall.
GWA has an executed agreement that establishes the conditions for discharge through the joint Navy outfall. Ocean disposal for the Agat-Santa Rita STP is regulated under NPDES Permit No. GU0020222, issued April 16, 2001 and expired as of April 15, 2006. An application for a permit renewal has been submitted by GWA and is under review by EPA.
ʱ´ í ó ݸ¿°¬»® ë
É¿¬»©¿¬»® Ì®»¿¬³»²¬ Ú¿½·´·¬·»
ëóè ѽ¬±¾»® îððê Ú·²¿´ ÉÎÓÐ
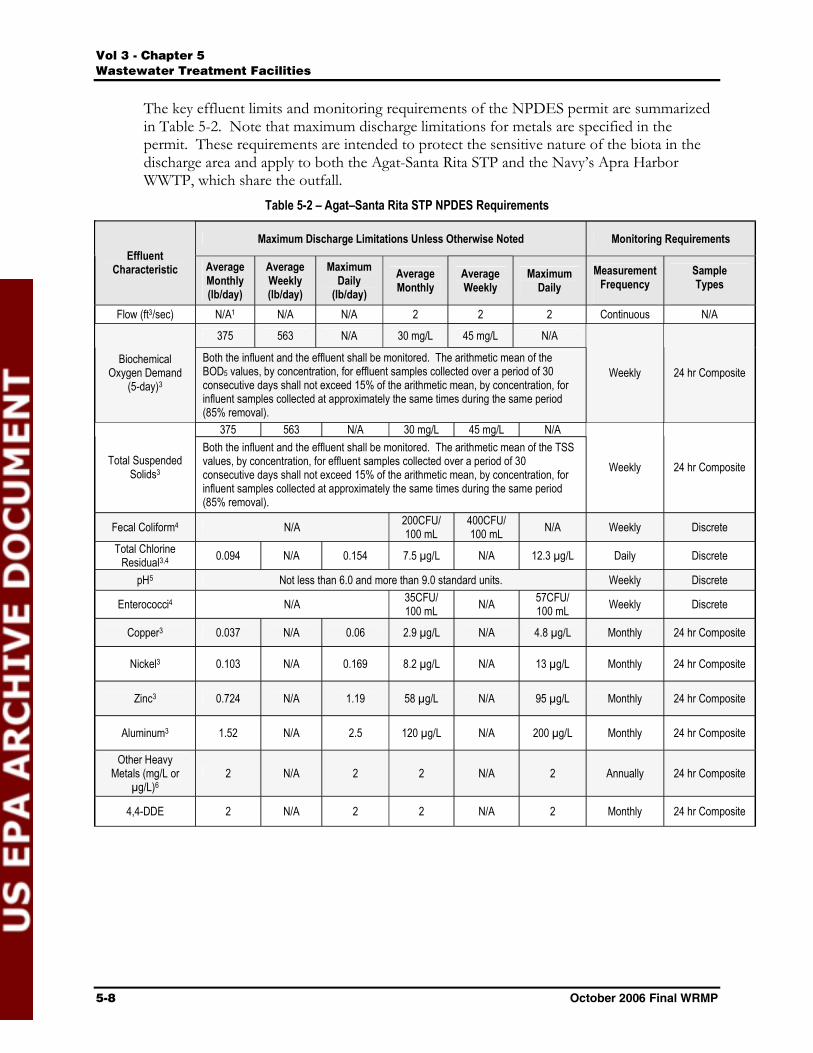
The key effluent limits and monitoring requirements of the NPDES permit are summarized in Table 5-2. Note that maximum discharge limitations for metals are specified in the permit. These requirements are intended to protect the sensitive nature of the biota in the discharge area and apply to both the Agat-Santa Rita STP and the Navy�s Apra Harbor WWTP, which share the outfall.
Table 5-2 – Agat–Santa Rita STP NPDES Requirements
Maximum Discharge Limitations Unless Otherwise Noted Monitoring Requirements Effluent
Characteristic AverageMonthly(lb/day)
AverageWeekly (lb/day)
Maximum Daily
(lb/day)AverageMonthly
AverageWeekly
Maximum Daily
Measurement Frequency
Sample Types
Flow (ft3/sec) N/A1 N/A N/A 2 2 2 Continuous N/A
375 563 N/A 30 mg/L 45 mg/L N/A
Biochemical Oxygen Demand
(5-day)3
Both the influent and the effluent shall be monitored. The arithmetic mean of the BOD5 values, by concentration, for effluent samples collected over a period of 30 consecutive days shall not exceed 15% of the arithmetic mean, by concentration, for influent samples collected at approximately the same times during the same period (85% removal).
Weekly 24 hr Composite
375 563 N/A 30 mg/L 45 mg/L N/A
Total Suspended Solids3
Both the influent and the effluent shall be monitored. The arithmetic mean of the TSS values, by concentration, for effluent samples collected over a period of 30 consecutive days shall not exceed 15% of the arithmetic mean, by concentration, for influent samples collected at approximately the same times during the same period (85% removal).
Weekly 24 hr Composite
Fecal Coliform4 N/A 200CFU/100 mL
400CFU/100 mL N/A Weekly Discrete
Total Chlorine Residual3,4 0.094 N/A 0.154 7.5 µg/L N/A 12.3 µg/L Daily Discrete
pH5 Not less than 6.0 and more than 9.0 standard units. Weekly Discrete
Enterococci4 N/A 35CFU/100 mL N/A 57CFU/
100 mL Weekly Discrete
Copper3 0.037 N/A 0.06 2.9 µg/L N/A 4.8 µg/L Monthly 24 hr Composite
Nickel3 0.103 N/A 0.169 8.2 µg/L N/A 13 µg/L Monthly 24 hr Composite
Zinc3 0.724 N/A 1.19 58 µg/L N/A 95 µg/L Monthly 24 hr Composite
Aluminum3 1.52 N/A 2.5 120 µg/L N/A 200 µg/L Monthly 24 hr Composite
Other Heavy Metals (mg/L or
µg/L)62 N/A 2 2 N/A 2 Annually 24 hr Composite
4,4-DDE 2 N/A 2 2 N/A 2 Monthly 24 hr Composite
ʱ´ í ó ݸ¿°¬»® ë
É¿¬»©¿¬»® Ì®»¿¬³»²¬ Ú¿½·´·¬·»
ѽ¬±¾»® îððê Ú·²¿´ ÉÎÓÐ ëóç
Table 5-2 – Agat – Santa Rita STP NPDES Requirements (continued)
Maximum Discharge Limitations Unless Otherwise Noted Monitoring Requirements Effluent
Characteristic AverageMonthly(lb/day)
AverageWeekly (lb/day)
Maximum Daily
(lb/day)AverageMonthly
AverageWeekly
Maximum Daily
Measurement Frequency
Sample Types
4,4-DDD 2 N/A 2 2 N/A 2 Monthly 24 hr Composite
Chlordane 2 N/A 2 2 N/A 2 Monthly 24 hr Composite
Dieldrin 2 N/A 2 2 N/A 2 Monthly 24 hr Composite
Pesticides (mg/L or µg/L)7 2 N/A 2 2 N/A 2 Annually 24 hr Composite
Ammonia 2 N/A 2 2 N/A 2 Weekly 24 hr Composite Oil & Grease
(mg/L) 2 N/A 2 2 N/A 2 Monthly Discrete
Whole Effluent Toxicity (TUc)7 N/A 2 N/A 2 Quarterly 24 hr Composite
Notes: 1. N/A = not applicable. 2. Monitoring and reporting required. No limitation set at this time. For flow, both the influent and the effluent shall be monitored. 3. Discharge limitation is based on federal secondary treatment standards in accordance with 40 CFR 133.102(c) and/or Revised Guam Water Quality
Standard (2001). Mass emission rate limitation is calculated using a design flow of 0.066 m3/sec (1.5 mgd). 4. Discharge limitation is based on applicable Revised Guam Water Quality Standards (2001). 5. Discharge limitation is based on applicable Revised Water Quality Standards and 40 CFR 122.44(d). The pH of the receiving water should not be
changed more than 0.2 units from the naturally occurring variation or in any case outside the range of 6.5-8.5. 6. Heavy metals means arsenic, cadmium, chromium III, chromium IV, lead, mercury, and silver. Samples shall be analyzed for both total recoverable
and dissolved metal. For the listing of all pesticides (organochlorines, organophosphates, carbamates, herbicides, fungicides, defoliants, and botanicals) see USEPA Water Quality Criteria Blue Book.
7. See Part A.5 of the permit for explanation of requirements.
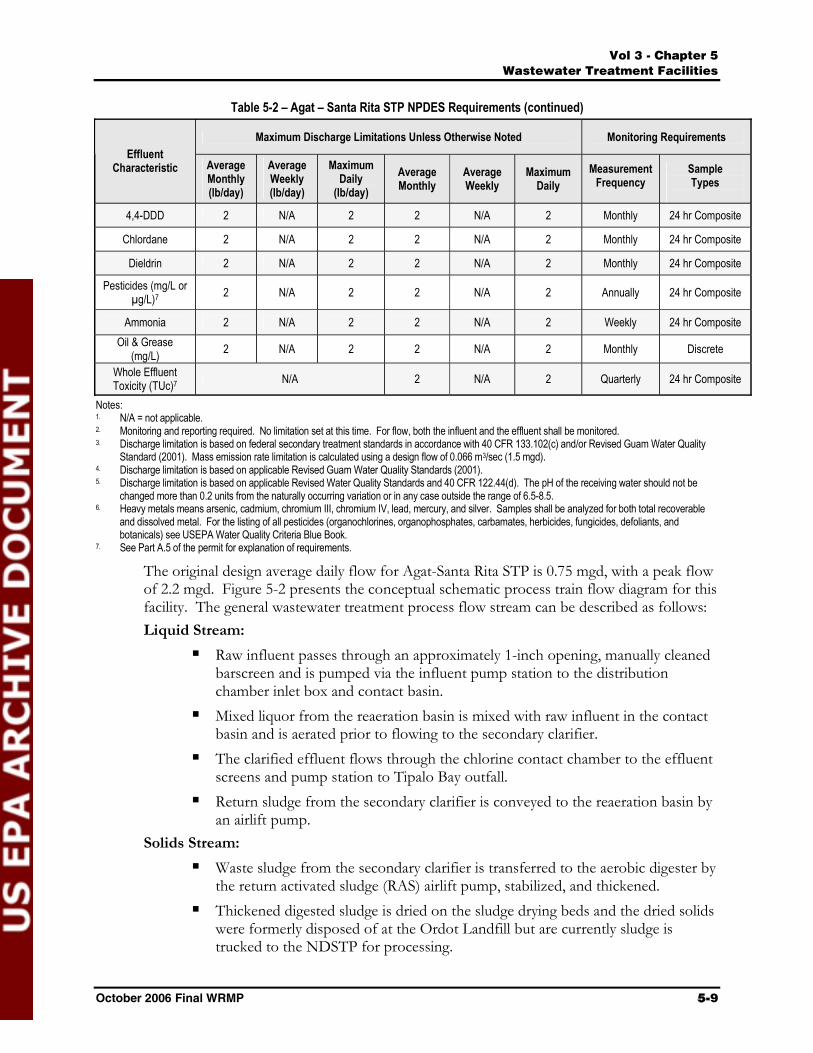
The original design average daily flow for Agat-Santa Rita STP is 0.75 mgd, with a peak flow of 2.2 mgd. Figure 5-2 presents the conceptual schematic process train flow diagram for this facility. The general wastewater treatment process flow stream can be described as follows: Liquid Stream:
Raw influent passes through an approximately 1-inch opening, manually cleaned barscreen and is pumped via the influent pump station to the distribution chamber inlet box and contact basin. Mixed liquor from the reaeration basin is mixed with raw influent in the contact basin and is aerated prior to flowing to the secondary clarifier. The clarified effluent flows through the chlorine contact chamber to the effluent screens and pump station to Tipalo Bay outfall. Return sludge from the secondary clarifier is conveyed to the reaeration basin by an airlift pump.
Solids Stream: Waste sludge from the secondary clarifier is transferred to the aerobic digester by the return activated sludge (RAS) airlift pump, stabilized, and thickened. Thickened digested sludge is dried on the sludge drying beds and the dried solids were formerly disposed of at the Ordot Landfill but are currently sludge is trucked to the NDSTP for processing.
ʱ´ í ó ݸ¿°¬»® ë
É¿¬»©¿¬»® Ì®»¿¬³»²¬ Ú¿½·´·¬·»
ëóïð ѽ¬±¾»® îððê Ú·²¿´ ÉÎÓÐ
Equipment/Process Out of Service: Comminutor Sonic influent flow meter Secondary clarifier sludge scraper Chlorination system Effluent flow meter
Figure 5-2 – Agat-Santa Rita STP Schematic Flow Diagram

ʱ´ í ó ݸ¿°¬»® ë
É¿¬»©¿¬»® Ì®»¿¬³»²¬ Ú¿½·´·¬·»
ѽ¬±¾»® îððê Ú·²¿´ ÉÎÓÐ ëóïï
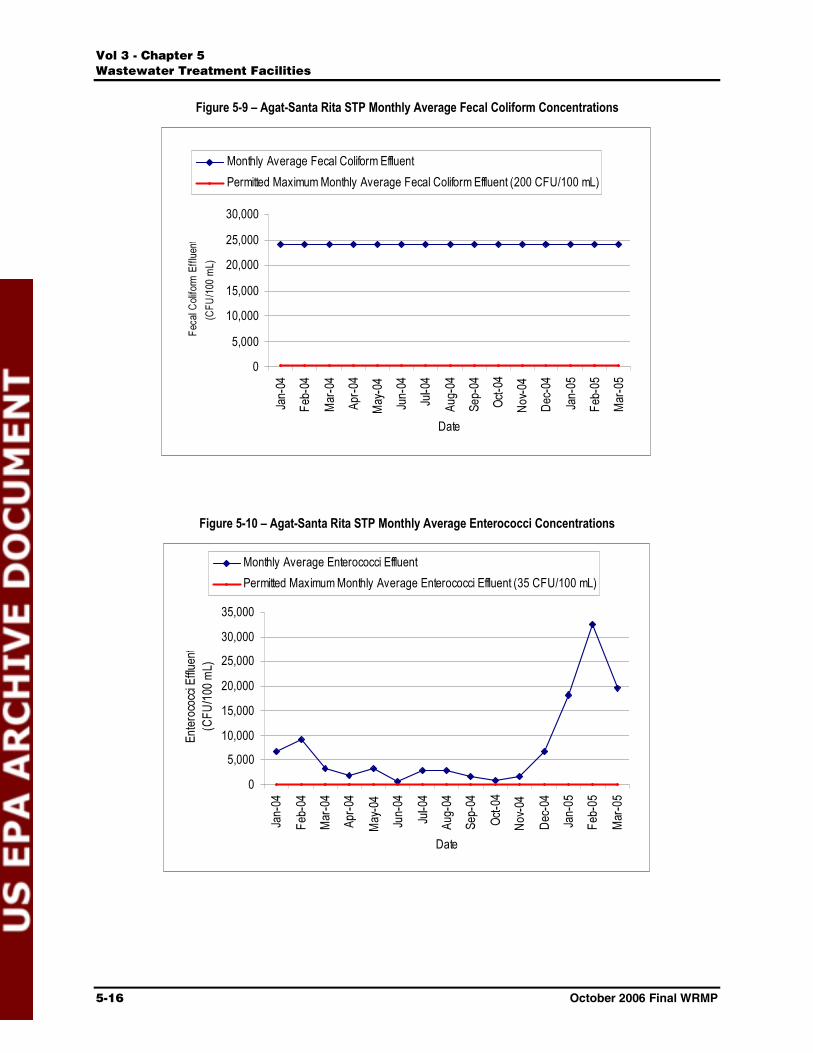
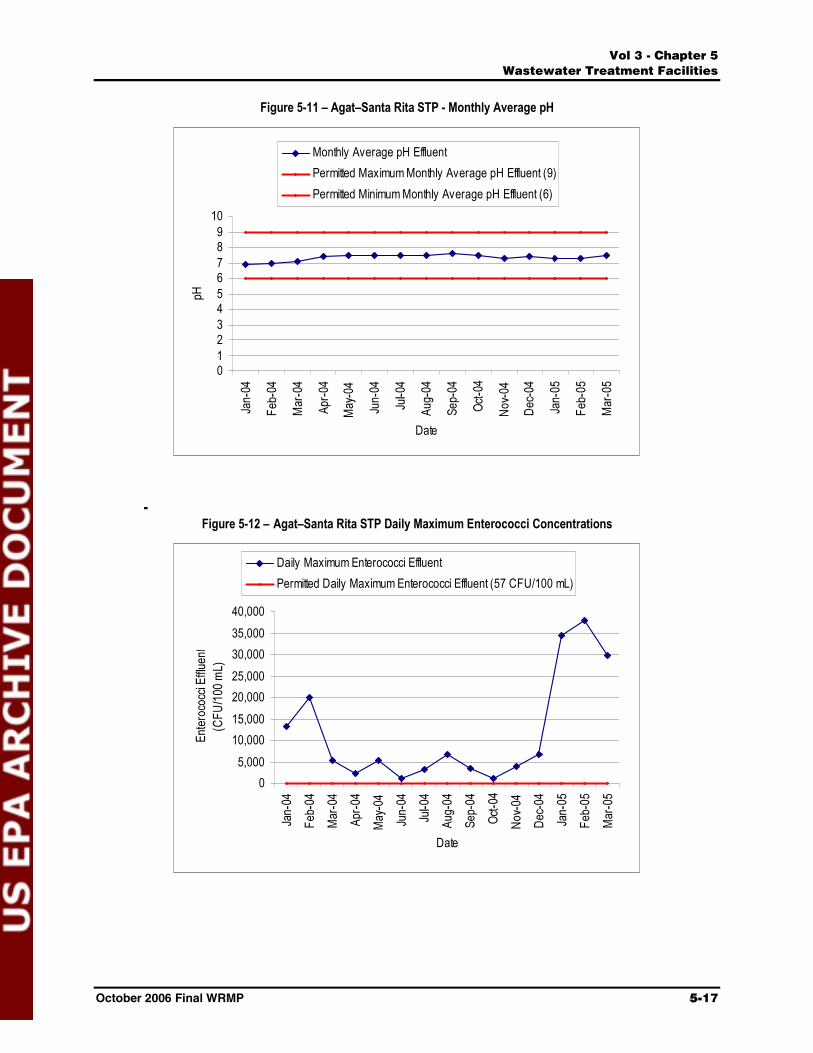
5.3.2 Wastewater Characteristics and NPDES Permit Requirements Based on the DMRs reviewed, the Agat-Santa Rita STP was essentially out of compliance with the NPDES permit requirements 100% of the time. All of the effluent discharge parameters, including 5-day biochemical oxygen demand (BOD5), total suspended solids (TSS), fecal coliform, and enterococci exceeded the maximum limits established in the NPDES permit, with the exception of pH. Although there are maximum limits for weekly average parameters in the NPDES permit, weekly information was not reported on the DMRs, so these data were not available. In addition, no total chlorine residual data were taken since the chlorination system was not operated. Therefore, the total chlorine residual could not have exceeded the maximum average monthly and maximum daily limits.
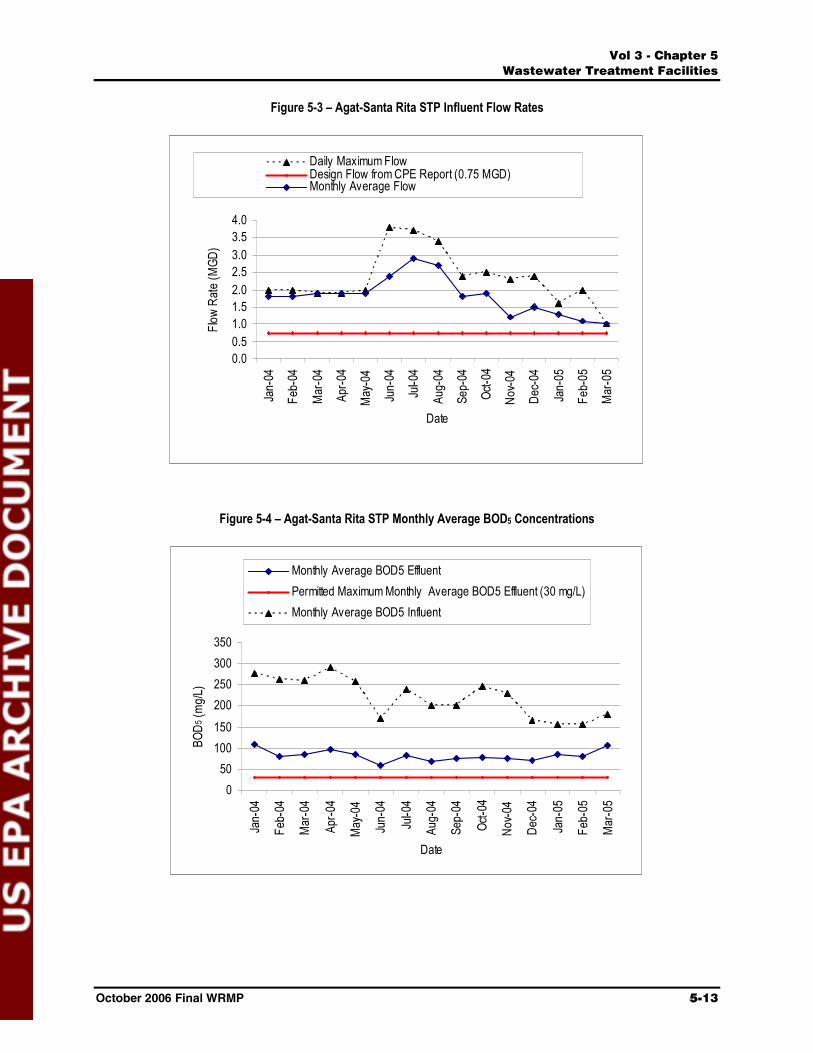
Based on the averages of the DMRs, BOD5 influent concentrations (~220 mg/L) were on the high side for typical wastewater. The average influent flow rate, ranging from 1.0 to 2.9 mgd as shown in Table 5-3, was much higher than the design flow (0.75 mgd). The flow data are not accurate because the influent flow meter was not functioning and it is believed that during the reporting period the DMR flow information was based on an instantaneous manual measurement taken at the time of sampling. In Chapter 4 of this volume, a current average flow for the facility was estimated as 1.13 mgd (from Table 5-1), which is significantly less than the reported averaged DMR flows of 1.81 mgd on Table 5-1. In both cases, current flows exceed the design flow, so there may not be sufficient hydraulic retention time for this treatment process. Moreover, some of the treatment equipment is not functioning properly, which would further negatively affect the final effluent quality.
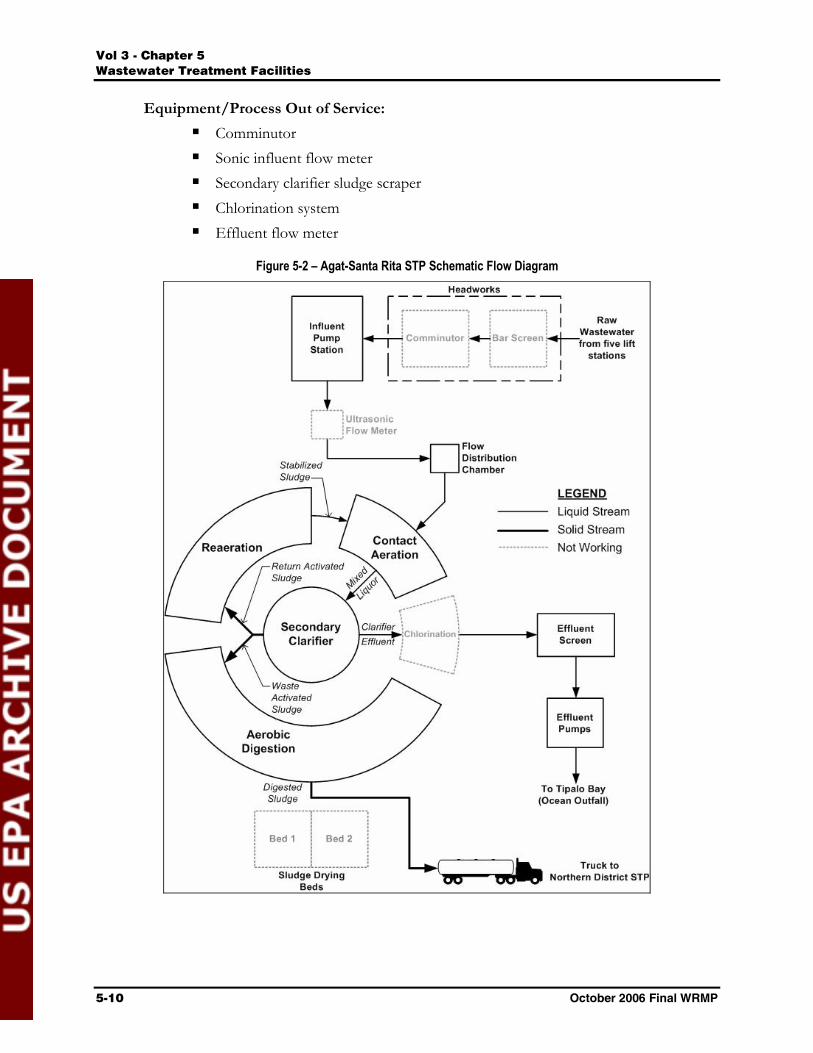
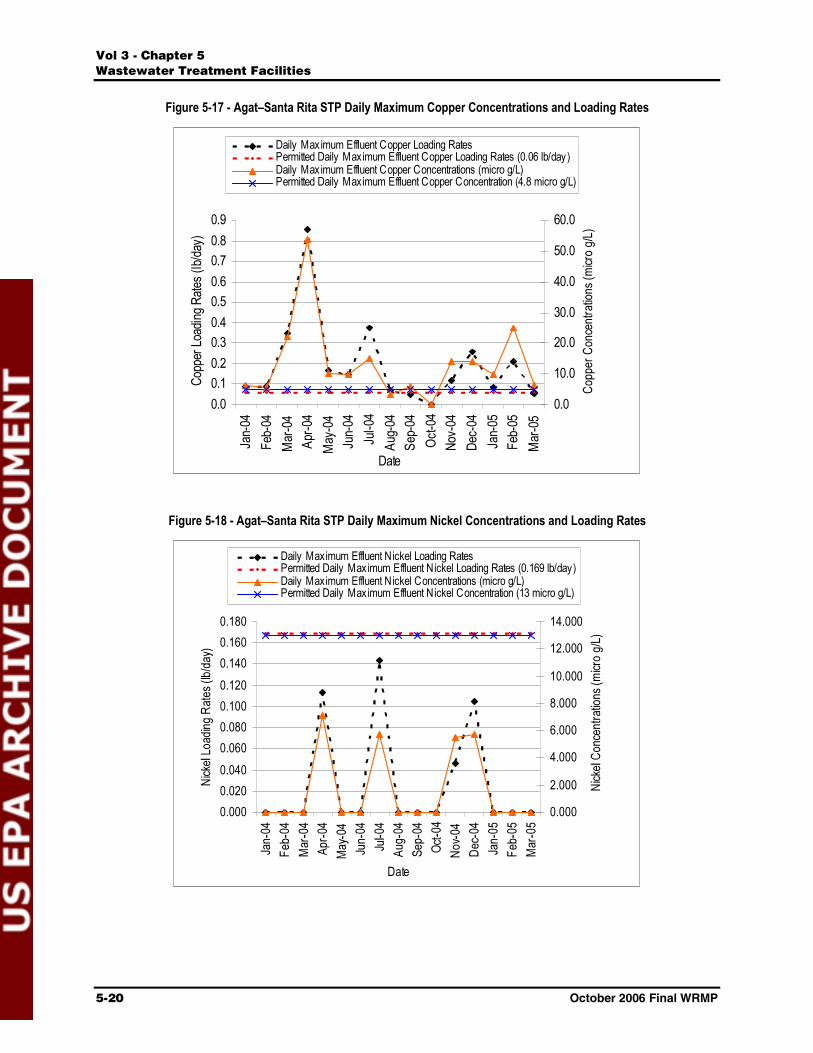
Based on DMR reports from January 2004 to March 2005 (summary information is presented in Figures 5-3 through 5-20) the monthly influent BOD5 and TSS averages during this period were approximately 220 mg/L and 102 mg/L, respectively (these values were used in the process capacity evaluations). The monthly average effluent BOD5 and TSS averages were roughly 82 mg/L and 67 mg/L, respectively, which exceed the maximum 30 mg/L BOD5 and 30 mg/L TSS effluent limits. Figures 5-3 to 5-20 show reported wastewater characteristics for key parameters based on the DMR reported average flow.
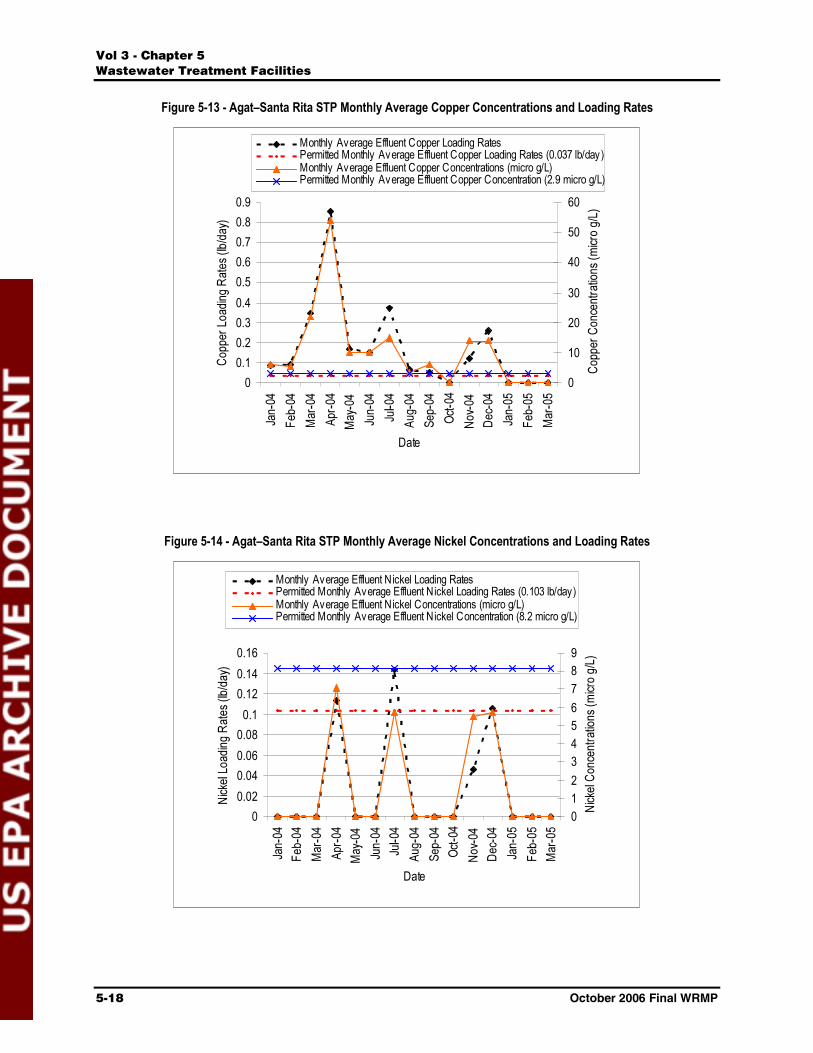
The other main group of effluent limits of concern is the metals � copper, nickel, zinc, and aluminum. According to the DMR data in Table 5-3, the copper and aluminum concentrations typically exceed NPDES permit limits, zinc occasionally exceeds the limit, and nickel concentrations are good. GWA believes that the higher metal concentrations in the effluent are due to higher levels in the groundwater in that area.
Table 5-3 – Agat-Santa Rita STP - Influent and Effluent Wastewater Characteristics
Parameter Average Range Permit Limitation Non- Compliance Frequency
Monthly AverageFlow (mgd) 1.8 1.0 – 2.9 NoneInfluent BOD5 (mg/L) 219.5 155 - 290 None Effluent BOD5 (mg/L) 82.3 58 – 108 30.0 100 % BOD5 Removal Rate (%) 61.3 40.8 – 69.5 85.0 100 % Influent BOD5 (lb/day) 3,378.5 1,305 – 5,662 NoneEffluent BOD5 (lb/day) 1,205.9 626 – 1,979 375.0 100 % Influent Suspended Solids (mg/L) 102.2 67 – 177 NoneEffluent Suspended Solids (mg/L) 67.0 44 – 96 30.0 100 % TSS Removal Rate (%) 32.8 15.0 – 48.0 85.0 100 %
ʱ´ í ó ݸ¿°¬»® ë
É¿¬»©¿¬»® Ì®»¿¬³»²¬ Ú¿½·´·¬·»
ëóïî ѽ¬±¾»® îððê Ú·²¿´ ÉÎÓÐ
Table 5-3 – Agat-Santa Rita STP - Influent and Effluent Wastewater Characteristics (continued)
Parameter Average Range Permit Limitation
Non- Compliance Frequency
Monthly Average
Influent Suspended Solids (lb/day) 1,392.3 689 – 2,243 None Effluent Suspended Solids (lb/day) 934.5 534 – 1,797 375.0 100 % Effluent Fecal Coliform (CFU/100 mL) 24,192.0 24,192 – 24,192 200.0 100 % Effluent Enterococci (CFU/ 100 mL) 7,430.3 600 – 32,535 35.0 100 % Effluent pH 7.4 6.9 – 7.6 6.0-9.0 0 % Effluent Copper (µg/L) 10.6 0.0 – 54.0 2.9 73 % Effluent Copper (lb/day) 0.17 0.0 – 0.9 0.037 67 % Effluent Nickel (µg/L) 1.6 0.0 – 7.1 8.2 0 % Effluent Nickel (lb/day) 0.03 0.0 – 0.1 0.103 20 % Effluent Zinc (µg/L) 72.1 0.0 – 250.0 58.0 53 % Effluent Zinc (lb/day) 1.1 0.0 – 4.0 0.724 47 % Effluent Aluminum (µg/L) 631.3 0.0 – 1,400 120.0 87 % Effluent Aluminum (lb/day) 9.7 0.0 – 22.2 1.52 87 %
Daily Maximum Flow (mgd) 2.3 1.0 – 3.8 NoneInfluent BOD5 (mg/L) 265.8 205 – 323 None Effluent BOD5 (mg/L) 99.3 68 – 121 NoneInfluent BOD5 (lb/day) 4,095.9 1,811 – 8,760 None Effluent BOD5 (lb/day) 1,486.0 729 – 3,320 NoneInfluent Suspended Solids (mg/L) 133.8 73 – 300 None Effluent Suspended Solids (mg/L) 81.2 56 – 118 NoneInfluent Suspended Solids (lb/day) 1,796.1 701 – 2,919 None Effluent Suspended Solids (lb/day) 1,164.1 600 – 1,960 NoneEffluent Fecal Coliform (CFU/100 mL) 24,192.0 24,192 – 24,192 None Effluent Enterococci (CFU/ 100 mL) 11,687.3 1,190 – 37,840 57.0 100% Effluent Copper (µg/L) 13.4 0.0 – 54.0 4.8 87 % Effluent Copper (lb/day) 0.19 0.0 – 0.9 0.06 80 % Effluent Nickel (µg/L) 1.6 0.0 – 7.1 13.0 0 % Effluent Nickel (lb/day) 0.03 0.0 – 0.1 0.169 0 % Effluent Zinc (µg/L) 74.5 0.0 – 250.0 95.0 20 % Effluent Zinc (lb/day) 1.1 0.0 – 4.0 1.19 47 % Effluent Aluminum (µg/L) 635.3 0.0 – 1,400 200.0 80 % Effluent Aluminum (lb/day) 9.8 0.0 – 22.2 2.5 87 %
Notes:1. Flow measurement is suspect. 2. Data from Discharge Monitoring Reports from Jan 04 to Mar 05. 3. NPDES permit limitations are based upon a design flow of 1.5 mgd.
ʱ´ í ó ݸ¿°¬»® ë
É¿¬»©¿¬»® Ì®»¿¬³»²¬ Ú¿½·´·¬·»
ѽ¬±¾»® îððê Ú·²¿´ ÉÎÓÐ ëóïí
Figure 5-3 – Agat-Santa Rita STP Influent Flow Rates
0.00.51.01.52.02.53.03.54.0
Date
Daily Maximum FlowDesign Flow from CPE Report (0.75 MGD) Monthly Average Flow
Figure 5-4 – Agat-Santa Rita STP Monthly Average BOD5 Concentrations
050
100150200250300350
Date
Monthly Average BOD5 EffluentPermitted Maximum Monthly Average BOD5 Effluent (30 mg/L) Monthly Average BOD5 Influent

ʱ´ í ó ݸ¿°¬»® ë
É¿¬»©¿¬»® Ì®»¿¬³»²¬ Ú¿½·´·¬·»
ëóïì ѽ¬±¾»® îððê Ú·²¿´ ÉÎÓÐ
Figure 5-5 – Agat-Santa Rita STP Monthly Average BOD5 Mass Loading Rates
0
1,000
2,000
3,000
4,000
5,000
6,000
Date
Monthly Average BOD5 EffluentPermitted Maximum Monthly Average BOD5 Effluent (375 lb/day)Monthly Average BOD5 Influent
Figure 5-6 – Agat-Santa Rita STP Monthly Average TSS Concentrations
020406080
100120140160180200
Date
Monthly Average TSS EffluentPermitted Maximum Monthly Average TSS Effluent (30 mg/L)Monthly Average TSS Influent

ʱ´ í ó ݸ¿°¬»® ë
É¿¬»©¿¬»® Ì®»¿¬³»²¬ Ú¿½·´·¬·»
ѽ¬±¾»® îððê Ú·²¿´ ÉÎÓÐ ëóïë
Figure 5-7 – Agat-Santa Rita STP Monthly Average TSS Mass Loading Rates
0
500
1,000
1,500
2,000
2,500
Date
Monthly Average TSS EffluentPermitted Maximum Monthly Average TSS Effluent (375 lb/day)Monthly Average TSS Influent
Figure 5-8 – Agat-Santa Rita STP Monthly Average of BOD5 and TSS Removal Rates
0102030405060708090
Date
Monthly Average of BOD5 Removal RatePermitted Minimum Monthly Average of BOD5 and TSS Removal Rate (85 % ) Monthly Average of TSS Removal Rate
ʱ´ í ó ݸ¿°¬»® ë
É¿¬»©¿¬»® Ì®»¿¬³»²¬ Ú¿½·´·¬·»
ëóïê ѽ¬±¾»® îððê Ú·²¿´ ÉÎÓÐ
Figure 5-9 – Agat-Santa Rita STP Monthly Average Fecal Coliform Concentrations
0
5,000
10,000
15,000
20,000
25,000
30,000
Date
Monthly Average Fecal Coliform EffluentPermitted Maximum Monthly Average Fecal Coliform Effluent (200 CFU/100 mL)
Figure 5-10 – Agat-Santa Rita STP Monthly Average Enterococci Concentrations
0
5,000
10,000
15,000
20,000
25,000
30,000
35,000
Date
Monthly Average Enterococci EffluentPermitted Maximum Monthly Average Enterococci Effluent (35 CFU/100 mL)
ʱ´ í ó ݸ¿°¬»® ë
É¿¬»©¿¬»® Ì®»¿¬³»²¬ Ú¿½·´·¬·»
ѽ¬±¾»® îððê Ú·²¿´ ÉÎÓÐ ëóïé
Figure 5-11 – Agat–Santa Rita STP - Monthly Average pH
0123456789
10
Date
Monthly Average pH EffluentPermitted Maximum Monthly Average pH Effluent (9)Permitted Minimum Monthly Average pH Effluent (6)
-Figure 5-12 – Agat–Santa Rita STP Daily Maximum Enterococci Concentrations
05,000
10,00015,00020,00025,00030,00035,00040,000
Date
Daily Maximum Enterococci EffluentPermitted Daily Maximum Enterococci Effluent (57 CFU/100 mL)
ʱ´ í ó ݸ¿°¬»® ë
É¿¬»©¿¬»® Ì®»¿¬³»²¬ Ú¿½·´·¬·»
ëóïè ѽ¬±¾»® îððê Ú·²¿´ ÉÎÓÐ
Figure 5-13 - Agat–Santa Rita STP Monthly Average Copper Concentrations and Loading Rates
00.10.20.30.40.50.60.70.80.9
Date
0
10
20
30
40
50
60
Monthly Average Effluent Copper Loading Rates Permitted Monthly Average Effluent Copper Loading Rates (0.037 lb/day)Monthly Average Effluent Copper Concentrations (micro g/L)Permitted Monthly Average Effluent Copper Concentration (2.9 micro g/L)
Figure 5-14 - Agat–Santa Rita STP Monthly Average Nickel Concentrations and Loading Rates
00.020.040.060.08
0.10.120.140.16
Date
0123456789
Monthly Average Effluent Nickel Loading Rates Permitted Monthly Average Effluent Nickel Loading Rates (0.103 lb/day)Monthly Average Effluent Nickel Concentrations (micro g/L)Permitted Monthly Average Effluent Nickel Concentration (8.2 micro g/L)

ʱ´ í ó ݸ¿°¬»® ë
É¿¬»©¿¬»® Ì®»¿¬³»²¬ Ú¿½·´·¬·»
ѽ¬±¾»® îððê Ú·²¿´ ÉÎÓÐ ëóïç
Figure 5-15 - Agat–Santa Rita STP Monthly Average Zinc Concentrations and Loading Rates
00.5
11.5
22.5
33.5
44.5
Date
0
50
100
150
200
250
300
Monthly Average Effluent Zinc Loading Rates Permitted Monthly Average Effluent Zinc Loading Rates (0.724 lb/day)Monthly Average Effluent Zinc Concentrations (micro g/L)Permitted Monthly Average Effluent Zinc Concentration (58 micro g/L)
Figure 5-16 - Agat–Santa Rita STP Monthly Average Aluminum Concentrations and Loading Rates
0
5
10
15
20
25
Date
02004006008001000120014001600
Monthly Average Effluent Aluminum Loading Rates Permitted Monthly Average Effluent Aluminum Loading Rates (1.52 lb/day)Monthly Average Effluent Aluminum Concentrations (micro g/L)Permitted Monthly Average Effluent Aluminum Concentration (120 micro g/L)
ʱ´ í ó ݸ¿°¬»® ë
É¿¬»©¿¬»® Ì®»¿¬³»²¬ Ú¿½·´·¬·»
ëóîð ѽ¬±¾»® îððê Ú·²¿´ ÉÎÓÐ
Figure 5-17 - Agat–Santa Rita STP Daily Maximum Copper Concentrations and Loading Rates
0.00.10.20.30.40.50.60.70.80.9
Jan-
04Fe
b-04
Mar
-04
Apr-0
4M
ay-0
4Ju
n-04
Jul-0
4Au
g-04
Sep-
04Oc
t-04
Nov-
04De
c-04
Jan-
05Fe
b-05
Mar
-05
Date
Copp
er Lo
ading
Rate
s (lb/
day)
0.0
10.0
20.0
30.0
40.0
50.0
60.0
Daily Max imum Effluent Copper Loading Rates Permitted Daily Maximum Effluent Copper Loading Rates (0.06 lb/day)Daily Max imum Effluent Copper Concentrations (micro g/L)Permitted Daily Maximum Effluent Copper Concentration (4.8 micro g/L)
Figure 5-18 - Agat–Santa Rita STP Daily Maximum Nickel Concentrations and Loading Rates
0.0000.0200.0400.0600.0800.1000.1200.1400.1600.180
Date
0.000
2.000
4.000
6.000
8.000
10.000
12.000
14.000
Daily Maximum Effluent Nickel Loading Rates Permitted Daily Max imum Effluent Nickel Loading Rates (0.169 lb/day)Daily Maximum Effluent Nickel Concentrations (micro g/L)Permitted Daily Max imum Effluent Nickel Concentration (13 micro g/L)

ʱ´ í ó ݸ¿°¬»® ë
É¿¬»©¿¬»® Ì®»¿¬³»²¬ Ú¿½·´·¬·»
ѽ¬±¾»® îððê Ú·²¿´ ÉÎÓÐ ëóîï
Figure 5-19 - Agat–Santa Rita STP Daily Maximum Zinc Concentrations and Loading Rates
0.00.51.01.52.02.53.03.54.04.5
Date
0.0
50.0
100.0
150.0
200.0
250.0
300.0
Daily Max imum Effluent Zinc Loading Rates Permitted Daily Maximum Effluent Zinc Loading Rates (1.19 lb/day)Daily Max imum Effluent Zinc Concentrations (micro g/L)Permitted Daily Maximum Effluent Zinc Concentration (95 micro g/L)
Figure 5-20 - Agat–Santa Rita STP Daily Maximum Aluminum Concentrations and Loading Rates
0.0
5.0
10.0
15.0
20.0
25.0
Date
Alum
inum
Loa
ding
Rate
s (lb
/day
)
0.0
200.0
400.0
600.0
800.0
1000.0
1200.0
1400.0
1600.0
Alum
inum
Con
cent
ratio
ns (m
icro
g/L)
Daily Maximum Effluent Aluminum Loading Rates Permitted Daily Maximum Effluent Aluminum Loading Rates (2.5 lb/day)Daily Maximum Effluent Aluminum Concentrations (micro g/L)Permitted Daily Max imum Effluent Aluminum Concentration (200 micro g/L)

ʱ´ í ó ݸ¿°¬»® ë
É¿¬»©¿¬»® Ì®»¿¬³»²¬ Ú¿½·´·¬·»
ëóîî ѽ¬±¾»® îððê Ú·²¿´ ÉÎÓÐ
Table 5-4 summarizes the monthly average influent BOD5 and TSS averages for each STP. This information was used in the capacity assessments of the unit processes in Appendix 3B. Although this is based on the DMRs, accuracy is suspect since there was no continuous flow monitoring accompanying the sampling and the samples were manually collected. Thus, the composite samples were not flow-based but rather a fixed volume that was taken every hour. Also, it can be noted that the ratio of BOD5 to TSS is very high, which suggests a large soluble BOD5 fraction, a sampling bias against particulate BOD5, or other laboratory/analytical issues.
Table 5-4 – Averages of the Monthly Average Influent BOD5 and TSS
Averages of the Monthly Average Influent Data Sewage Treatment Plants
BOD5 (mg/L) TSS (mg/L)
Agat-Santa Rita STP 219.5 102.2
Hagatna STP 209.1 93.1
Baza Gardens STP 186.7 104.7
Umatac Merizo STP 215.6 69.9
Northern District STP 221.7 105.4
Inarajan STP N/A N/A
5.3.3 Capacity Assessment Based on the reported DMR flow data and the flow monitoring and modeling in Chapter 4 of this volume, the Agat-Santa Rita STP is currently receiving flows significantly greater than the original design capacity. This is one of the contributing issues that have caused the facility to fail to regularly meet NPDES effluent permit requirements.
Table 5-5 summarizes the available maximum capacity for each treatment facility based on the capacity calculations performed in Appendix 3B. These values are then compared with the CPE design capacity, average DMR reported flows, the capacity established or used in the NPDES permits, and the current and future flow projections from Chapter 4.

ʱ´ í ó ݸ¿°¬»® ë
É¿¬»©¿¬»® Ì®»¿¬³»²¬ Ú¿½·´·¬·»
ѽ¬±¾»® îððê Ú·²¿´ ÉÎÓÐ ëóîí
Table 5-5 – Calculated STP Capacity Comparison
Flow Capacity (mgd)
Plant Capacity Assessment1Treatment Facilities
Based on LiquidStream
Based on Solid
Stream
DesignFlow from
CPEReports2
DMRMonthlyAverage
Flow3
Monitored Current
Ave. Flow (mgd)4
Projected Ave.Flow
(2025) (mgd)4
NPDESPermit5
Agat-Santa Rita STP 0.72 0.75 0.75 1.81 1.13 1.39 (1.5)
Hagatna STP4 11.0 20.0 12.0 8.45 7.50 9.70 12.0
Baza Gardens STP4 0.57 0.57 0.60 0.50 0.25 0.34 (0.93)
Umatac Merizo STP 0.52 N/A6 0.39 0.41 0.28 0.35 (0.61)
Northern District STP 11.9 5.7 12.0 9.27 7.80 11.9 6.0
Inarajan STP 0.18 0.42 0.19 N/A6 0.07 0.08 N/A6
Notes:1. See Appendix 3B 2. Comprehensive Performance Evaluation (CPE) Reports for Agat-Santa Rita, Baza Gardens, and Umatac-Merizo STPs (Winzler & Kelly Consulting
Engineers) 2004, and CPE Reports for Hagatna and Northern District STPs (Duenas & Associates, Inc. and Boyle Engineering Corporation) 2002. Design capacity for Inarajan STP is taken from Guam Island Wastewater Facilities Plan (Duenas & Associates and CH2M Hill) 1994
3. GWA’s Discharge Monitoring Reports (Jan 04 to Mar 05) 4. From Volume 3, Chapter 45. The values in the parentheses are not requirements but were used to calculate BOD5 and TSS mass loading 6. Not available
5.3.4 Recommended CIPThe 2005 estimated flows (from Chapter 4 of this volume) exceed both the design capacity of the STP and the estimated capacity for the existing facilities (from Appendix 3B). The projected treatment capacity requirements for 2025 are even greater. The existing treatment facilities have not been able to produce effluent that complies with the existing NPDES permit requirements. This situation may be partially a result of the actual flows being greater than the treatment plant capacity and exacerbated by the poor condition of equipment, components, and facilities, creating operational challenges for the aging facility. The general lack of redundancy also makes it difficult to perform proper maintenance and timely repairs, and increases reliability risks. In addition, the operating staff lacked training and experience with the activated sludge process. Because of the insufficient capacity of the existing facility, inability to meet NPDES permit requirements, poor condition of the equipment and facilities, and aging of the existing facilities, we recommend that GWA consider a new facility in order to meet the capacity demand of current flows as well as provide for the future flows. Key improvements to provide redundancy and ease of operation and maintenance are critical to meet reliability concerns.
GWA considered teaming with the U.S. Navy with a combined facility (Apra Harbor WWTP and Agat-Santa Rita STP) and design documents for the joint facilities were prepared. However, this joint facility was not constructed due to a variety of issues, such as land acquisition, and the future status of the project is unknown. Both GWA and the Navy should reconsider the joint facility concept in order to provide for future flows, improve reliability of operations and take advantage of potential construction and operational savings with one larger facility instead of two smaller ones.

ʱ´ í ó ݸ¿°¬»® ë
É¿¬»©¿¬»® Ì®»¿¬³»²¬ Ú¿½·´·¬·»
ëóîì ѽ¬±¾»® îððê Ú·²¿´ ÉÎÓÐ
It is assumed that the existing outfall will continue to be the principal means of effluent disposal in the future for the Agat-Santa Rita STP (and the Apra Harbor WWTP). Incorporating partial effluent reuse can be considered as another means of disposal to mitigate the ocean outfall discharge permit requirements; however, is unlikely to be attractive due to higher costs and the amount of rainfall in the area.
The level of technical and mechanical support available on Guam is a major consideration when determining the level of mechanical and electronic sophistication for new facilities. High maintenance and/or high technology treatment processes and equipment, which require a correspondingly high level of operator attention, skill and sophisticated maintenance are not recommended. The simplicity of pond and lagoon-type treatment systems are attractive; however, land requirements and effluent quality reliability of these systems are negative factors which makes them less attractive because of the strict discharge permit requirements and increased future flow predictions. It is recommended that a detailed facilities plan for the Agat�Santa Rita STP be prepared which includes an evaluation of treatment alternatives to determine the most suitable process for this facility. For the purposes of the master plan CIP budgeting process, two reliable processes for consideration are an oxidation ditch (�racetrack� configuration) or trickling filter solids contact (TFSC) type of process. These systems are capable of reliably producing high-quality effluent with relatively simple operations, equipment, and mechanical requirements.
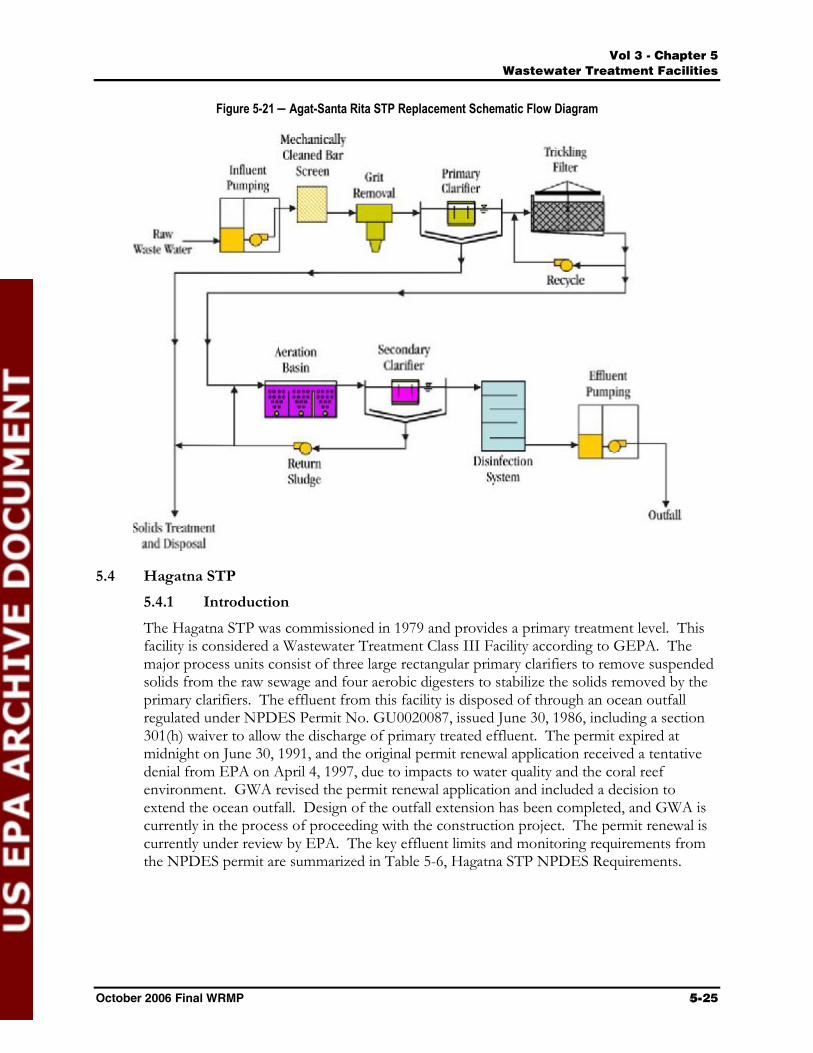
A TFSC facility with sufficient capacity, redundancy, and reliability to treat the year 2025 flows is used for the CIP budget model. Selection of this technology addresses tight site constraints and was also the favored option for the joint GWA-Navy facility. Figure 5-21 is a schematic flow diagram of the model replacement facility for the Agat-Santa Rita STP. In addition to new preliminary processes (headworks), both primary and secondary treatment processes and disinfection will be required to meet NPDES permit requirements. Chlorination and dechlorination facilities are included in the CIP budget estimate to meet the bacterial limits. Solids treatment is assumed to be provided at a central facility, although the existing process tankage could be retrofitted to provide aerobic digestion and gravity thickening. An in-depth facility plan task is recommended to include disposal options necessary to meet the NPDES permit. If it is deemed necessary to add follow-on tertiary treatment, this should be defined in the facility plan.
Although the TFSC process is reliable, simple to operate and maintain, and produces a consistent secondary effluent, it cannot be certain that it can appreciably reduce the metal concentrations from the influent to below the effluent limits. GWA believes that the source of the metals in the wastewater is due to high concentrations in the groundwater. Therefore, by reducing inflow and infiltration (I/I) into the sewer system they can meet the effluent limits. In addition some removal should occur in a well operated secondary treatment system, although we recommend consideration be given to pilot testing the process selected in the facility plan to confirm final effluent quality. Since it is unlikely that GWA can reliably operate and maintain complex treatment processes to remove metals (typically precipitation processes are used) excluding them from the wastewater is preferred, and the CIP facility recommendations do not include processes for metal removal. The level of success of I/I control should be discussed and analyzed in the Facilities Plan. If necessary, metal removal processes can be incorporated in the treatment plant design.
ʱ´ í ó ݸ¿°¬»® ë
É¿¬»©¿¬»® Ì®»¿¬³»²¬ Ú¿½·´·¬·»
ѽ¬±¾»® îððê Ú·²¿´ ÉÎÓÐ ëóîë
Figure 5-21 � Agat-Santa Rita STP Replacement Schematic Flow Diagram
5.4 Hagatna STP 5.4.1 Introduction The Hagatna STP was commissioned in 1979 and provides a primary treatment level. This facility is considered a Wastewater Treatment Class III Facility according to GEPA. The major process units consist of three large rectangular primary clarifiers to remove suspended solids from the raw sewage and four aerobic digesters to stabilize the solids removed by the primary clarifiers. The effluent from this facility is disposed of through an ocean outfall regulated under NPDES Permit No. GU0020087, issued June 30, 1986, including a section 301(h) waiver to allow the discharge of primary treated effluent. The permit expired at midnight on June 30, 1991, and the original permit renewal application received a tentative denial from EPA on April 4, 1997, due to impacts to water quality and the coral reef environment. GWA revised the permit renewal application and included a decision to extend the ocean outfall. Design of the outfall extension has been completed, and GWA is currently in the process of proceeding with the construction project. The permit renewal is currently under review by EPA. The key effluent limits and monitoring requirements from the NPDES permit are summarized in Table 5-6, Hagatna STP NPDES Requirements.
ʱ´ í ó ݸ¿°¬»® ë
É¿¬»©¿¬»® Ì®»¿¬³»²¬ Ú¿½·´·¬·»
ëóîê ѽ¬±¾»® îððê Ú·²¿´ ÉÎÓÐ
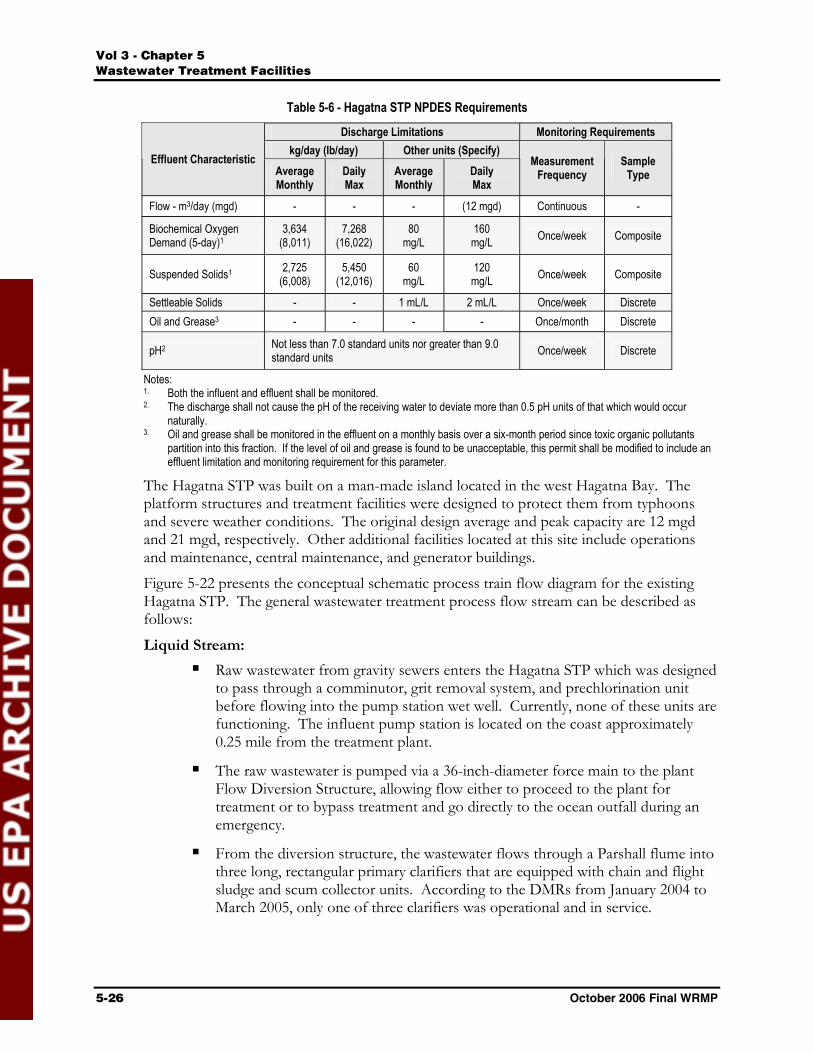
Table 5-6 - Hagatna STP NPDES Requirements
Discharge Limitations Monitoring Requirements kg/day (lb/day) Other units (Specify)
Effluent Characteristic AverageMonthly
DailyMax
AverageMonthly
DailyMax
Measurement Frequency
Sample Type
Flow - m3/day (mgd) - - - (12 mgd) Continuous -
Biochemical Oxygen Demand (5-day)1
3,634 (8,011)
7,268 (16,022)
80mg/L
160mg/L Once/week Composite
Suspended Solids1 2,725 (6,008)
5,450 (12,016)
60mg/L
120mg/L Once/week Composite
Settleable Solids - - 1 mL/L 2 mL/L Once/week Discrete Oil and Grease3 - - - - Once/month Discrete
pH2 Not less than 7.0 standard units nor greater than 9.0 standard units Once/week Discrete
Notes: 1. Both the influent and effluent shall be monitored. 2. The discharge shall not cause the pH of the receiving water to deviate more than 0.5 pH units of that which would occur
naturally. 3. Oil and grease shall be monitored in the effluent on a monthly basis over a six-month period since toxic organic pollutants
partition into this fraction. If the level of oil and grease is found to be unacceptable, this permit shall be modified to include an effluent limitation and monitoring requirement for this parameter.
The Hagatna STP was built on a man-made island located in the west Hagatna Bay. The platform structures and treatment facilities were designed to protect them from typhoons and severe weather conditions. The original design average and peak capacity are 12 mgd and 21 mgd, respectively. Other additional facilities located at this site include operations and maintenance, central maintenance, and generator buildings.
Figure 5-22 presents the conceptual schematic process train flow diagram for the existing Hagatna STP. The general wastewater treatment process flow stream can be described as follows:
Liquid Stream: Raw wastewater from gravity sewers enters the Hagatna STP which was designed to pass through a comminutor, grit removal system, and prechlorination unit before flowing into the pump station wet well. Currently, none of these units are functioning. The influent pump station is located on the coast approximately 0.25 mile from the treatment plant.
The raw wastewater is pumped via a 36-inch-diameter force main to the plant Flow Diversion Structure, allowing flow either to proceed to the plant for treatment or to bypass treatment and go directly to the ocean outfall during an emergency.
From the diversion structure, the wastewater flows through a Parshall flume into three long, rectangular primary clarifiers that are equipped with chain and flight sludge and scum collector units. According to the DMRs from January 2004 to March 2005, only one of three clarifiers was operational and in service.
ʱ´ í ó ݸ¿°¬»® ë
É¿¬»©¿¬»® Ì®»¿¬³»²¬ Ú¿½·´·¬·»
ѽ¬±¾»® îððê Ú·²¿´ ÉÎÓÐ ëóîé
Effluent is conveyed to the ocean outfall by gravity under normal conditions or, if needed, a booster pump is available for use during high tides.
Solids Stream: Primary sludge and scum are pumped from the primary clarifiers to the four aerobic digesters. Digested sludge is transferred from the aerobic digesters to a sludge decant tank. Supernatant from the sludge decant tank is returned to the inlet of the primary clarifiers. Currently, the sludge dewatering equipment (centrifuges) is inoperable and contents of the sludge decant tank are trucked to the NDSTP for dewatering.
Equipment/Process Out of Service: Comminutor, standby manual bar screen, grit removal, prechlorination Influent flow measurement Primary clarifiers Centrifuges Aerobic digesters Odor control system

ʱ
´ í
ó Ý
¸¿
°¬»
® ë
É¿
¬»
©¿
¬»®
Ì®»
¿¬³
»²
¬ Ú
¿½
·´·¬
·»
ѽ
¬±¾
»®
îð
ðê
Ú·²
¿´
ÉÎ
ÓÐ
ëóî
è
Figu
re 5-
22 –
Haga
tna S
TP S
chem
atic
Flow
Diag
ram
ʱ´ í ó ݸ¿°¬»® ë
É¿¬»©¿¬»® Ì®»¿¬³»²¬ Ú¿½·´·¬·»
ѽ¬±¾»® îððê Ú·²¿´ ÉÎÓÐ ëóîç
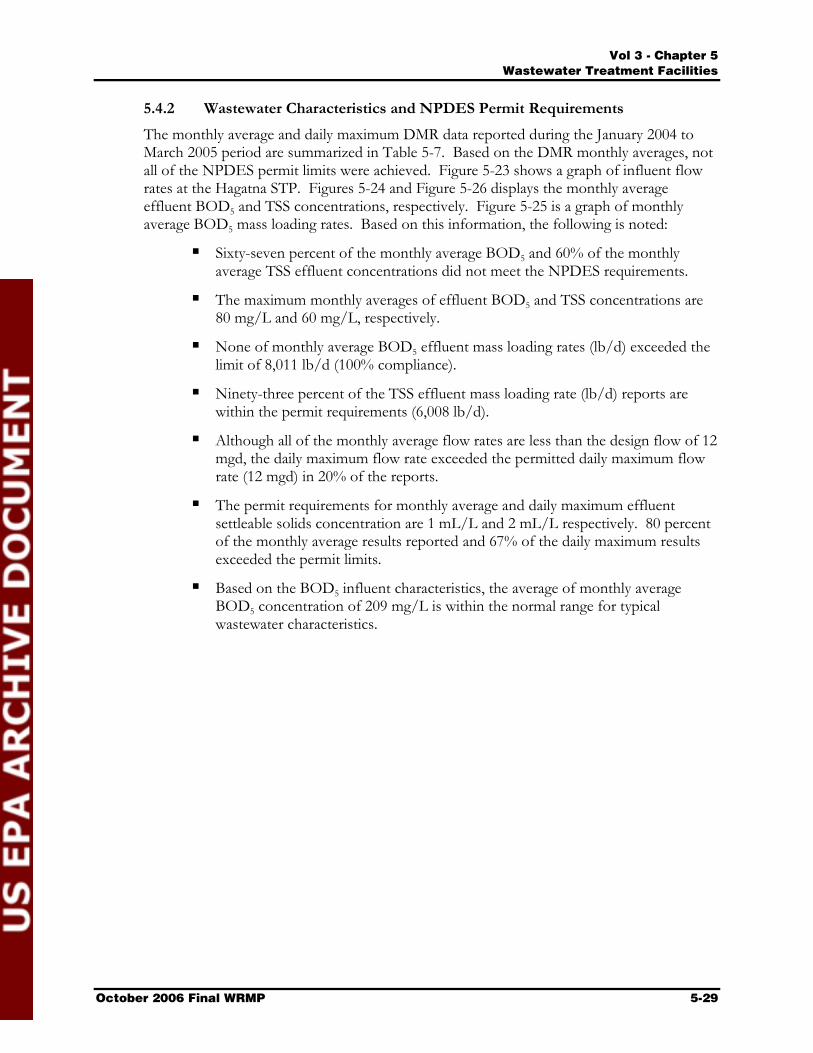
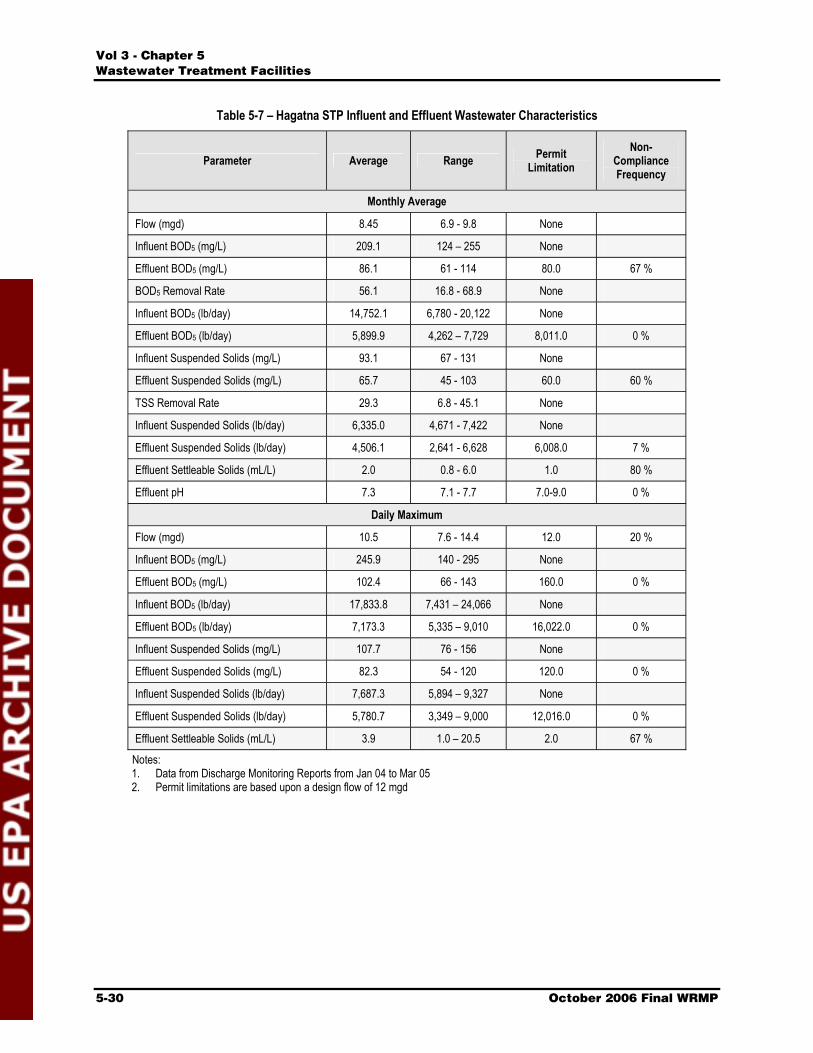
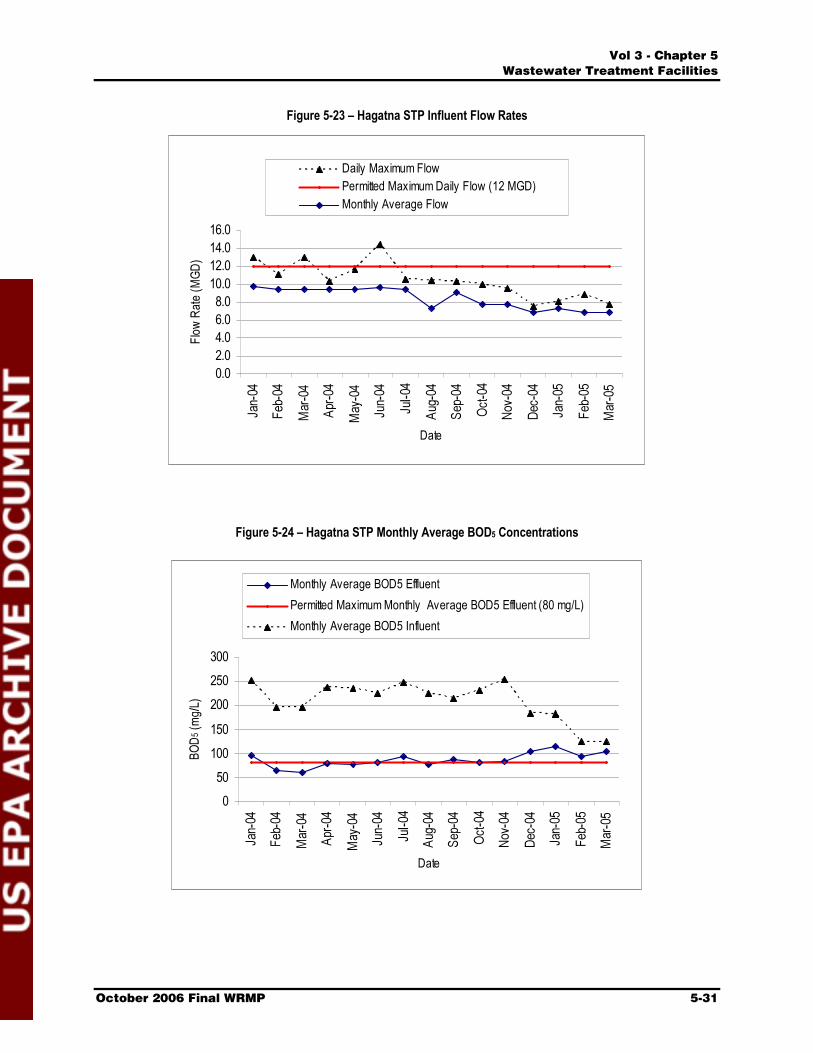
5.4.2 Wastewater Characteristics and NPDES Permit Requirements The monthly average and daily maximum DMR data reported during the January 2004 to March 2005 period are summarized in Table 5-7. Based on the DMR monthly averages, not all of the NPDES permit limits were achieved. Figure 5-23 shows a graph of influent flow rates at the Hagatna STP. Figures 5-24 and Figure 5-26 displays the monthly average effluent BOD5 and TSS concentrations, respectively. Figure 5-25 is a graph of monthly average BOD5 mass loading rates. Based on this information, the following is noted:
Sixty-seven percent of the monthly average BOD5 and 60% of the monthly average TSS effluent concentrations did not meet the NPDES requirements.
The maximum monthly averages of effluent BOD5 and TSS concentrations are 80 mg/L and 60 mg/L, respectively.
None of monthly average BOD5 effluent mass loading rates (lb/d) exceeded the limit of 8,011 lb/d (100% compliance).
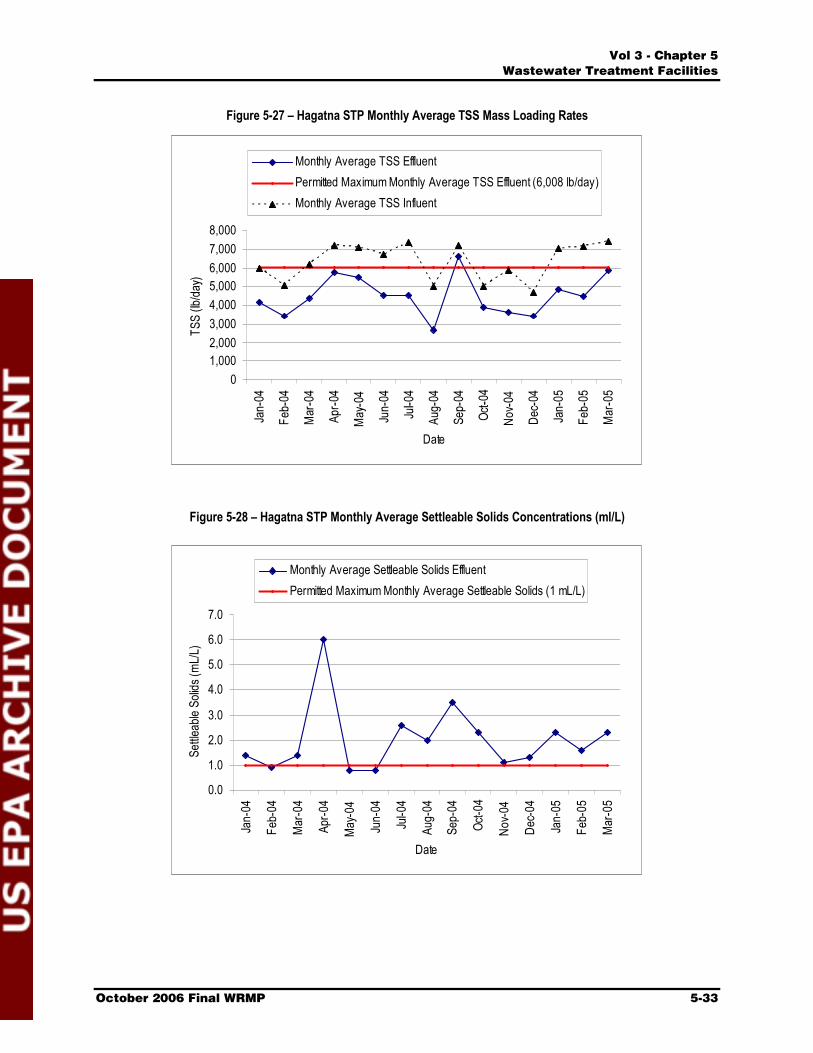
Ninety-three percent of the TSS effluent mass loading rate (lb/d) reports are within the permit requirements (6,008 lb/d).
Although all of the monthly average flow rates are less than the design flow of 12 mgd, the daily maximum flow rate exceeded the permitted daily maximum flow rate (12 mgd) in 20% of the reports.
The permit requirements for monthly average and daily maximum effluent settleable solids concentration are 1 mL/L and 2 mL/L respectively. 80 percent of the monthly average results reported and 67% of the daily maximum results exceeded the permit limits.
Based on the BOD5 influent characteristics, the average of monthly average BOD5 concentration of 209 mg/L is within the normal range for typical wastewater characteristics.
ʱ´ í ó ݸ¿°¬»® ë
É¿¬»©¿¬»® Ì®»¿¬³»²¬ Ú¿½·´·¬·»
ëóíð ѽ¬±¾»® îððê Ú·²¿´ ÉÎÓÐ
Table 5-7 – Hagatna STP Influent and Effluent Wastewater Characteristics
Parameter Average Range PermitLimitation
Non-Compliance Frequency
Monthly Average
Flow (mgd) 8.45 6.9 - 9.8 None
Influent BOD5 (mg/L) 209.1 124 – 255 None
Effluent BOD5 (mg/L) 86.1 61 - 114 80.0 67 %
BOD5 Removal Rate 56.1 16.8 - 68.9 None
Influent BOD5 (lb/day) 14,752.1 6,780 - 20,122 None
Effluent BOD5 (lb/day) 5,899.9 4,262 – 7,729 8,011.0 0 %
Influent Suspended Solids (mg/L) 93.1 67 - 131 None
Effluent Suspended Solids (mg/L) 65.7 45 - 103 60.0 60 %
TSS Removal Rate 29.3 6.8 - 45.1 None
Influent Suspended Solids (lb/day) 6,335.0 4,671 - 7,422 None
Effluent Suspended Solids (lb/day) 4,506.1 2,641 - 6,628 6,008.0 7 %
Effluent Settleable Solids (mL/L) 2.0 0.8 - 6.0 1.0 80 %
Effluent pH 7.3 7.1 - 7.7 7.0-9.0 0 %
Daily Maximum
Flow (mgd) 10.5 7.6 - 14.4 12.0 20 %
Influent BOD5 (mg/L) 245.9 140 - 295 None
Effluent BOD5 (mg/L) 102.4 66 - 143 160.0 0 %
Influent BOD5 (lb/day) 17,833.8 7,431 – 24,066 None
Effluent BOD5 (lb/day) 7,173.3 5,335 – 9,010 16,022.0 0 %
Influent Suspended Solids (mg/L) 107.7 76 - 156 None
Effluent Suspended Solids (mg/L) 82.3 54 - 120 120.0 0 %
Influent Suspended Solids (lb/day) 7,687.3 5,894 – 9,327 None
Effluent Suspended Solids (lb/day) 5,780.7 3,349 – 9,000 12,016.0 0 %
Effluent Settleable Solids (mL/L) 3.9 1.0 – 20.5 2.0 67 %
Notes: 1. Data from Discharge Monitoring Reports from Jan 04 to Mar 05 2. Permit limitations are based upon a design flow of 12 mgd
ʱ´ í ó ݸ¿°¬»® ë
É¿¬»©¿¬»® Ì®»¿¬³»²¬ Ú¿½·´·¬·»
ѽ¬±¾»® îððê Ú·²¿´ ÉÎÓÐ ëóíï
Figure 5-23 – Hagatna STP Influent Flow Rates
0.02.04.06.08.0
10.012.014.016.0
Date
Daily Maximum FlowPermitted Maximum Daily Flow (12 MGD) Monthly Average Flow
Figure 5-24 – Hagatna STP Monthly Average BOD5 Concentrations
050
100150
200250300
Date
Monthly Average BOD5 EffluentPermitted Maximum Monthly Average BOD5 Effluent (80 mg/L) Monthly Average BOD5 Influent

ʱ´ í ó ݸ¿°¬»® ë
É¿¬»©¿¬»® Ì®»¿¬³»²¬ Ú¿½·´·¬·»
ëóíî ѽ¬±¾»® îððê Ú·²¿´ ÉÎÓÐ
Figure 5-25 – Hagatna STP Monthly Average BOD5 Mass Loading Rates
0
5,000
10,000
15,000
20,000
25,000
Jan-
04
Feb-
04
Mar-0
4
Apr-0
4
May-0
4
Jun-
04
Jul-0
4
Aug-
04
Sep-
04
Oct-0
4
Nov-0
4
Dec-0
4
Jan-
05
Feb-
05
Mar-0
5
Date
BOD5
(lb/da
y)
Monthly Average BOD5 EffluentPermitted Maximum Monthly Average BOD5 Effluent (8,011 lb/day)Monthly Average BOD5 Influent
Figure 5-26 – Hagatna STP Monthly Average TSS Concentrations
0
20
40
60
80
100
120
140
Date
Monthly Average TSS EffluentPermitted Maximum Monthly Average TSS Effluent (60 mg/L)Monthly Average TSS Influent
ʱ´ í ó ݸ¿°¬»® ë
É¿¬»©¿¬»® Ì®»¿¬³»²¬ Ú¿½·´·¬·»
ѽ¬±¾»® îððê Ú·²¿´ ÉÎÓÐ ëóíí
Figure 5-27 – Hagatna STP Monthly Average TSS Mass Loading Rates
01,0002,0003,0004,0005,0006,0007,0008,000
Date
Monthly Average TSS EffluentPermitted Maximum Monthly Average TSS Effluent (6,008 lb/day)Monthly Average TSS Influent
Figure 5-28 – Hagatna STP Monthly Average Settleable Solids Concentrations (ml/L)
0.0
1.0
2.0
3.0
4.0
5.0
6.0
7.0
Jan-
04
Feb-
04
Mar-0
4
Apr-0
4
May-0
4
Jun-
04
Jul-0
4
Aug-
04
Sep-
04
Oct-0
4
Nov-0
4
Dec-0
4
Jan-
05
Feb-
05
Mar-0
5
Date
Settle
able
Solid
s (mL
/L)
Monthly Average Settleable Solids EffluentPermitted Maximum Monthly Average Settleable Solids (1 mL/L)
ʱ´ í ó ݸ¿°¬»® ë
É¿¬»©¿¬»® Ì®»¿¬³»²¬ Ú¿½·´·¬·»
ëóíì ѽ¬±¾»® îððê Ú·²¿´ ÉÎÓÐ
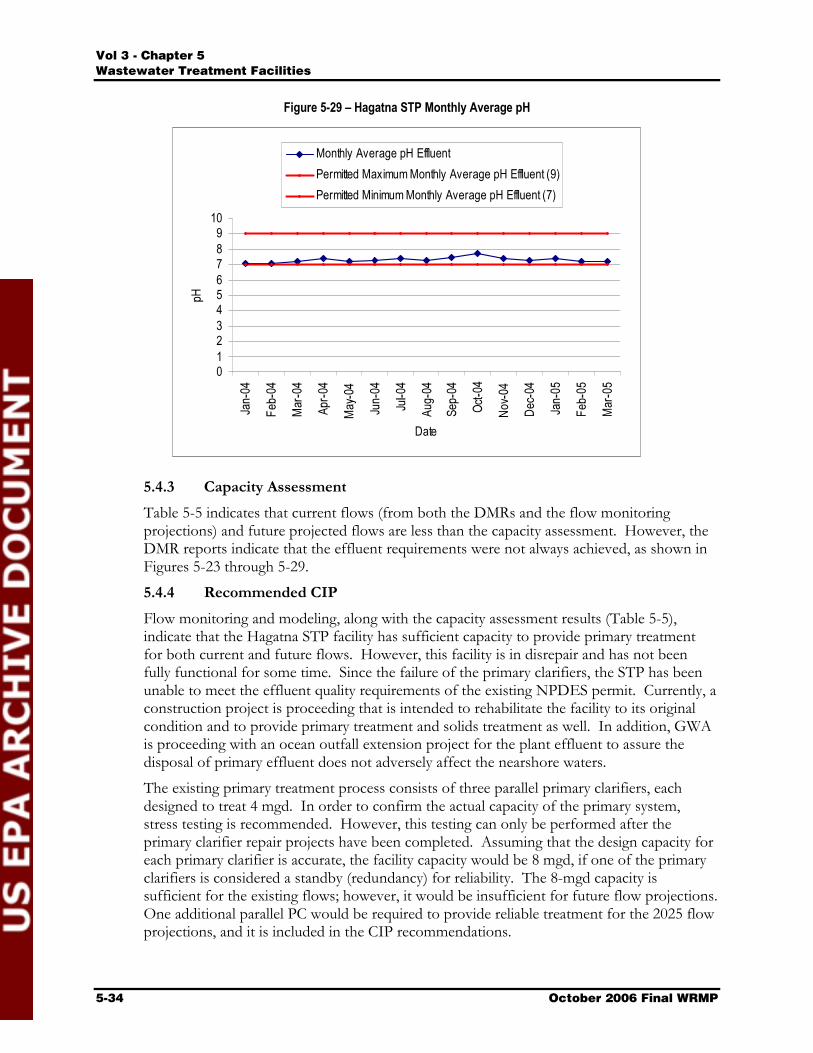
Figure 5-29 – Hagatna STP Monthly Average pH
0123456789
10
Date
Monthly Average pH EffluentPermitted Maximum Monthly Average pH Effluent (9)Permitted Minimum Monthly Average pH Effluent (7)
5.4.3 Capacity Assessment Table 5-5 indicates that current flows (from both the DMRs and the flow monitoring projections) and future projected flows are less than the capacity assessment. However, the DMR reports indicate that the effluent requirements were not always achieved, as shown in Figures 5-23 through 5-29.
5.4.4 Recommended CIP Flow monitoring and modeling, along with the capacity assessment results (Table 5-5), indicate that the Hagatna STP facility has sufficient capacity to provide primary treatment for both current and future flows. However, this facility is in disrepair and has not been fully functional for some time. Since the failure of the primary clarifiers, the STP has been unable to meet the effluent quality requirements of the existing NPDES permit. Currently, a construction project is proceeding that is intended to rehabilitate the facility to its original condition and to provide primary treatment and solids treatment as well. In addition, GWA is proceeding with an ocean outfall extension project for the plant effluent to assure the disposal of primary effluent does not adversely affect the nearshore waters.
The existing primary treatment process consists of three parallel primary clarifiers, each designed to treat 4 mgd. In order to confirm the actual capacity of the primary system, stress testing is recommended. However, this testing can only be performed after the primary clarifier repair projects have been completed. Assuming that the design capacity for each primary clarifier is accurate, the facility capacity would be 8 mgd, if one of the primary clarifiers is considered a standby (redundancy) for reliability. The 8-mgd capacity is sufficient for the existing flows; however, it would be insufficient for future flow projections. One additional parallel PC would be required to provide reliable treatment for the 2025 flow projections, and it is included in the CIP recommendations.
ʱ´ í ó ݸ¿°¬»® ë
É¿¬»©¿¬»® Ì®»¿¬³»²¬ Ú¿½·´·¬·»
ѽ¬±¾»® îððê Ú·²¿´ ÉÎÓÐ ëóíë
The screenings facilities located at the Hagatna influent pumping station are no longer functional, so new facilities to provide screenings and also facilities for grit removal should be considered to remove these undesirable elements from the flow stream. Space is limited at the influent pumping station and the remote location is difficult for the plant staff to operate and maintain, so it is recommended that these facilities be located onsite at the treatment plant, as part of the influent structure.
The existing NPDES permitted flow is 12 mgd, so the 2025 projected flow of 9.7 mgd will not exceed this permit limit. Solids handling facilities have capacity for 15 mgd (including one standby) and should be adequate for the 2025 flows (some repairs are necessary). Stress testing of the solids system following the completion of the repair projects is recommended to accurately determine the capacity of the system. We recommend consideration of creating two solids processing centers, at NDSTP and Hagatna STP because:
The solids load from Hagatna STP would be a lot to truck.
Having two centers provides redundancy and flexibility.
Although the anaerobic digestion process at NDSTP is preferred due to potential energy recovery and there is more space for a central facility at NDSTP, the repairs to the Hagatna STP solids treatment system are underway and will be functional much sooner than at NDSTP.
Therefore, we recommend that GWA continue with the repairs to the solids treatment facilities at Hagatna STP and continue to treat the solids from that facility there, but construct/repair the NDSTP to treat solids from the rest of the island.
In addition, due to the outfall improvements an effluent pump station for high flows under high tide conditions will be required.
5.5 Baza Gardens STP 5.5.1 Introduction The Baza Gardens STP is a Class II wastewater treatment plant as defined by the GEPA Water and Wastewater Regulations. The design capacity is 0.6 mgd. The treated effluent is discharged through a rock infiltrator to the Togcha River, which flows into the Pacific Ocean. The Baza Gardens STP was put into service in 1975. The plant is a steel packaged treatment unit which uses a single process train, extended aeration process to meet a secondary treatment objective.
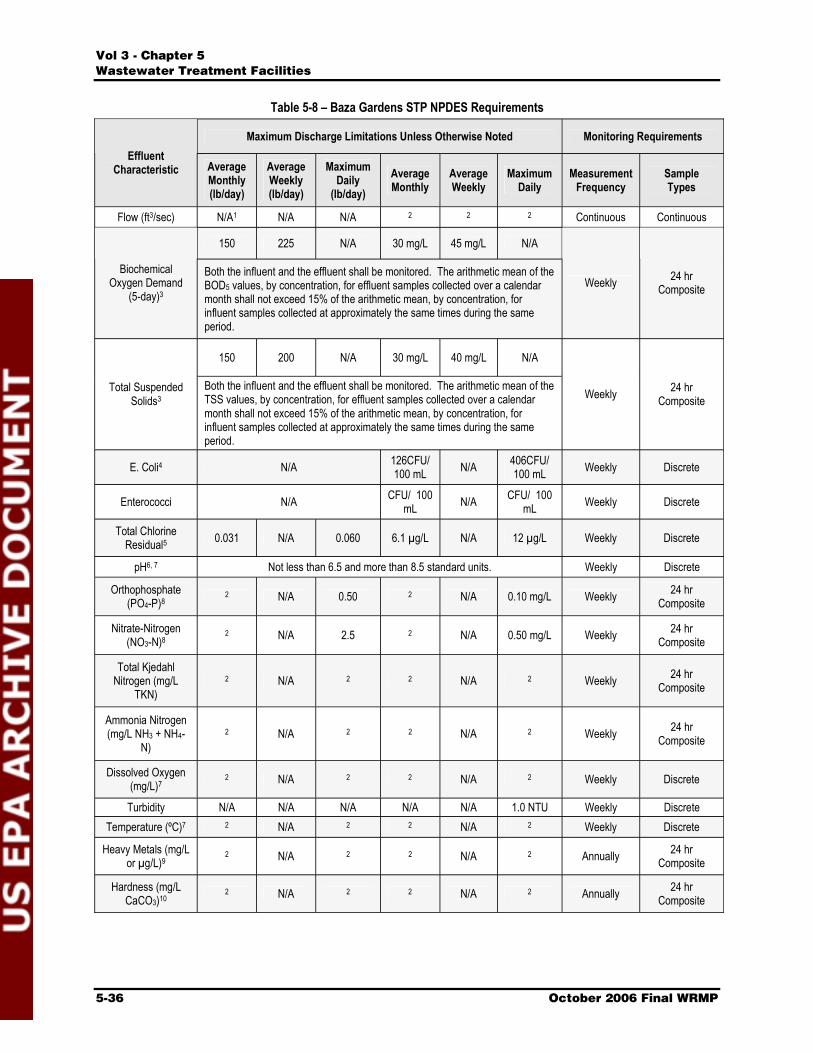
The Baza Gardens STP effluent disposal to the Togcha River is regulated under NPDES Permit No. GU0020095, issued September 7, 2000, which expired on September 6, 2005. A permit renewal has been submitted and is currently under review by EPA. Table 5-8 summarizes the NPDES permit key effluent limits and monitoring requirements. Stringent nutrient requirements are incorporated into this permit because of the stream discharge. The low nitrogen (nitrate-nitrogen) and phosphorus (orthophosphate) limits are practically impossible to achieve with the existing treatment facilities.
ʱ´ í ó ݸ¿°¬»® ë
É¿¬»©¿¬»® Ì®»¿¬³»²¬ Ú¿½·´·¬·»
ëóíê ѽ¬±¾»® îððê Ú·²¿´ ÉÎÓÐ
Table 5-8 – Baza Gardens STP NPDES Requirements
Maximum Discharge Limitations Unless Otherwise Noted Monitoring Requirements Effluent
Characteristic AverageMonthly(lb/day)
AverageWeekly (lb/day)
Maximum Daily
(lb/day)AverageMonthly
AverageWeekly
Maximum Daily
Measurement Frequency
Sample Types
Flow (ft3/sec) N/A1 N/A N/A 2 2 2 Continuous Continuous
150 225 N/A 30 mg/L 45 mg/L N/A
Biochemical Oxygen Demand
(5-day)3
Both the influent and the effluent shall be monitored. The arithmetic mean of the BOD5 values, by concentration, for effluent samples collected over a calendar month shall not exceed 15% of the arithmetic mean, by concentration, for influent samples collected at approximately the same times during the same period.
Weekly 24 hr Composite
150 200 N/A 30 mg/L 40 mg/L N/A
Total Suspended Solids3
Both the influent and the effluent shall be monitored. The arithmetic mean of the TSS values, by concentration, for effluent samples collected over a calendar month shall not exceed 15% of the arithmetic mean, by concentration, for influent samples collected at approximately the same times during the same period.
Weekly 24 hr Composite
E. Coli4 N/A 126CFU/100 mL N/A 406CFU/
100 mL Weekly Discrete
Enterococci N/A CFU/ 100 mL N/A CFU/ 100
mL Weekly Discrete
Total Chlorine Residual5 0.031 N/A 0.060 6.1 µg/L N/A 12 µg/L Weekly Discrete
pH6, 7 Not less than 6.5 and more than 8.5 standard units. Weekly Discrete
Orthophosphate (PO4-P)8
2 N/A 0.50 2 N/A 0.10 mg/L Weekly 24 hr Composite
Nitrate-Nitrogen (NO3-N)8
2 N/A 2.5 2 N/A 0.50 mg/L Weekly 24 hr Composite
Total Kjedahl Nitrogen (mg/L
TKN)2 N/A 2 2 N/A 2 Weekly 24 hr
Composite
Ammonia Nitrogen (mg/L NH3 + NH4-
N)2 N/A 2 2 N/A 2 Weekly 24 hr
Composite
Dissolved Oxygen (mg/L)7
2 N/A 2 2 N/A 2 Weekly Discrete
Turbidity N/A N/A N/A N/A N/A 1.0 NTU Weekly Discrete Temperature (ºC)7 2 N/A 2 2 N/A 2 Weekly Discrete
Heavy Metals (mg/L or µg/L)9
2 N/A 2 2 N/A 2 Annually 24 hr Composite
Hardness (mg/L CaCO3)10
2 N/A 2 2 N/A 2 Annually 24 hr Composite
ʱ´ í ó ݸ¿°¬»® ë
É¿¬»©¿¬»® Ì®»¿¬³»²¬ Ú¿½·´·¬·»
ѽ¬±¾»® îððê Ú·²¿´ ÉÎÓÐ ëóíé
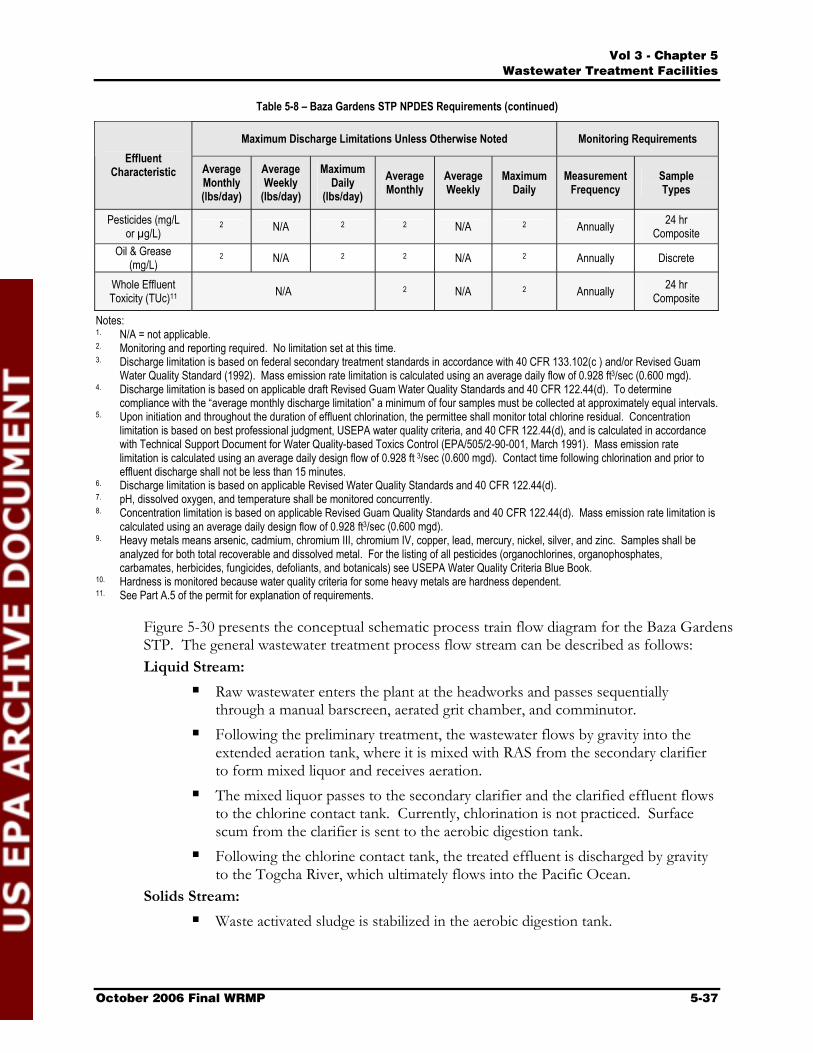
Table 5-8 – Baza Gardens STP NPDES Requirements (continued)
Maximum Discharge Limitations Unless Otherwise Noted Monitoring Requirements Effluent
Characteristic AverageMonthly(lbs/day)
AverageWeekly
(lbs/day)
Maximum Daily
(lbs/day)AverageMonthly
AverageWeekly
Maximum Daily
Measurement Frequency
Sample Types
Pesticides (mg/L or µg/L)
2 N/A 2 2 N/A 2 Annually 24 hr Composite
Oil & Grease (mg/L)
2 N/A 2 2 N/A 2 Annually Discrete
Whole Effluent Toxicity (TUc)11 N/A 2 N/A 2 Annually 24 hr
Composite
Notes: 1. N/A = not applicable. 2. Monitoring and reporting required. No limitation set at this time. 3. Discharge limitation is based on federal secondary treatment standards in accordance with 40 CFR 133.102(c ) and/or Revised Guam
Water Quality Standard (1992). Mass emission rate limitation is calculated using an average daily flow of 0.928 ft3/sec (0.600 mgd). 4. Discharge limitation is based on applicable draft Revised Guam Water Quality Standards and 40 CFR 122.44(d). To determine
compliance with the “average monthly discharge limitation” a minimum of four samples must be collected at approximately equal intervals. 5. Upon initiation and throughout the duration of effluent chlorination, the permittee shall monitor total chlorine residual. Concentration
limitation is based on best professional judgment, USEPA water quality criteria, and 40 CFR 122.44(d), and is calculated in accordance with Technical Support Document for Water Quality-based Toxics Control (EPA/505/2-90-001, March 1991). Mass emission rate limitation is calculated using an average daily design flow of 0.928 ft 3/sec (0.600 mgd). Contact time following chlorination and prior to effluent discharge shall not be less than 15 minutes.
6. Discharge limitation is based on applicable Revised Water Quality Standards and 40 CFR 122.44(d). 7. pH, dissolved oxygen, and temperature shall be monitored concurrently. 8. Concentration limitation is based on applicable Revised Guam Quality Standards and 40 CFR 122.44(d). Mass emission rate limitation is
calculated using an average daily design flow of 0.928 ft3/sec (0.600 mgd). 9. Heavy metals means arsenic, cadmium, chromium III, chromium IV, copper, lead, mercury, nickel, silver, and zinc. Samples shall be
analyzed for both total recoverable and dissolved metal. For the listing of all pesticides (organochlorines, organophosphates,carbamates, herbicides, fungicides, defoliants, and botanicals) see USEPA Water Quality Criteria Blue Book.
10. Hardness is monitored because water quality criteria for some heavy metals are hardness dependent. 11. See Part A.5 of the permit for explanation of requirements.
Figure 5-30 presents the conceptual schematic process train flow diagram for the Baza Gardens STP. The general wastewater treatment process flow stream can be described as follows: Liquid Stream:
Raw wastewater enters the plant at the headworks and passes sequentially through a manual barscreen, aerated grit chamber, and comminutor. Following the preliminary treatment, the wastewater flows by gravity into the extended aeration tank, where it is mixed with RAS from the secondary clarifier to form mixed liquor and receives aeration. The mixed liquor passes to the secondary clarifier and the clarified effluent flows to the chlorine contact tank. Currently, chlorination is not practiced. Surface scum from the clarifier is sent to the aerobic digestion tank. Following the chlorine contact tank, the treated effluent is discharged by gravity to the Togcha River, which ultimately flows into the Pacific Ocean.
Solids Stream: Waste activated sludge is stabilized in the aerobic digestion tank.

ʱ´ í ó ݸ¿°¬»® ë
É¿¬»©¿¬»® Ì®»¿¬³»²¬ Ú¿½·´·¬·»
ëóíè ѽ¬±¾»® îððê Ú·²¿´ ÉÎÓÐ
Stabilized digested sludge in the aerated digester is thickened and then pumped into a tanker truck for disposal at the NDSTP or Hagatna STP. The supernatant from the aerobic digestion tank is sent back to the extended aeration tank.
Equipment/Process Out of Service: Influent and effluent flow meters Chlorination system (not used) Emergency generator
Figure 5-30 – Baza Gardens STP Schematic Flow Diagram

ʱ´ í ó ݸ¿°¬»® ë
É¿¬»©¿¬»® Ì®»¿¬³»²¬ Ú¿½·´·¬·»
ѽ¬±¾»® îððê Ú·²¿´ ÉÎÓÐ ëóíç
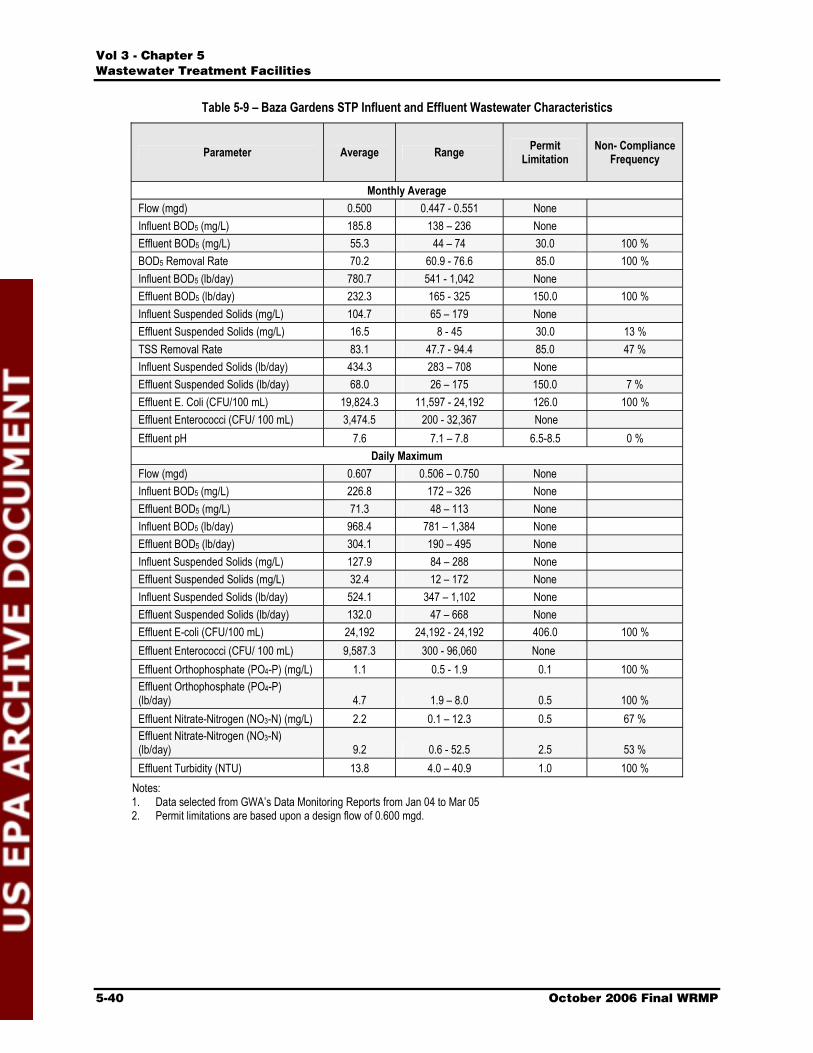
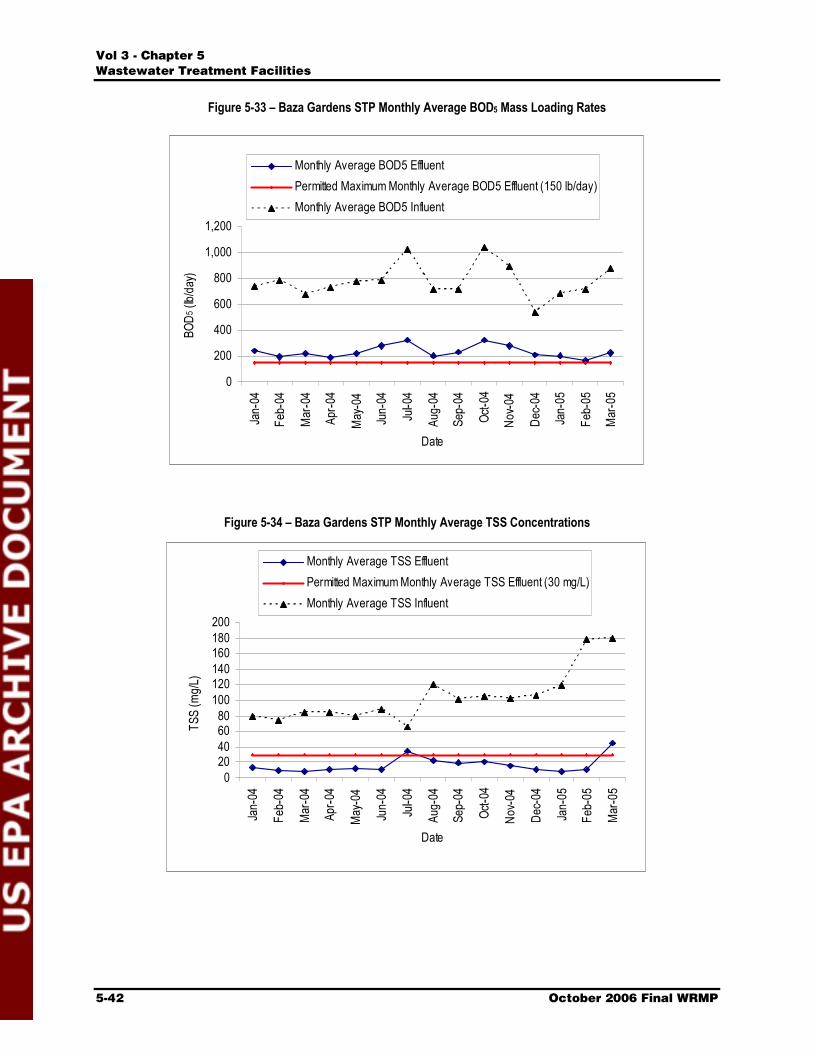
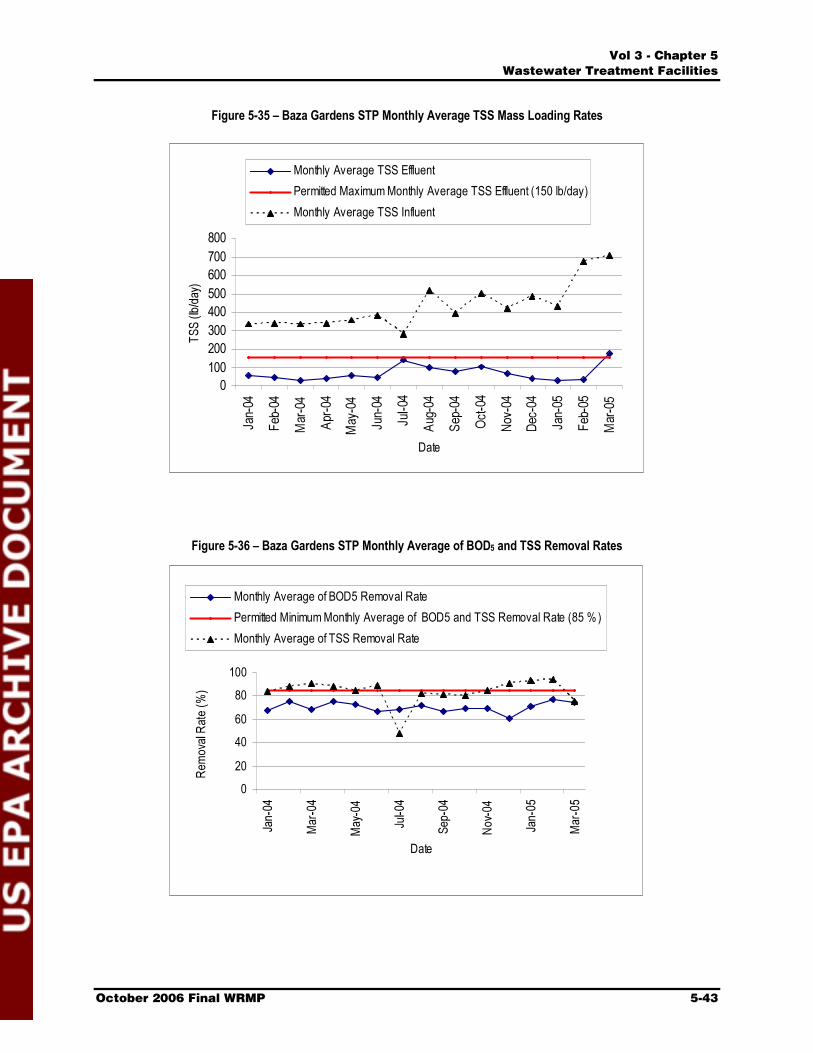
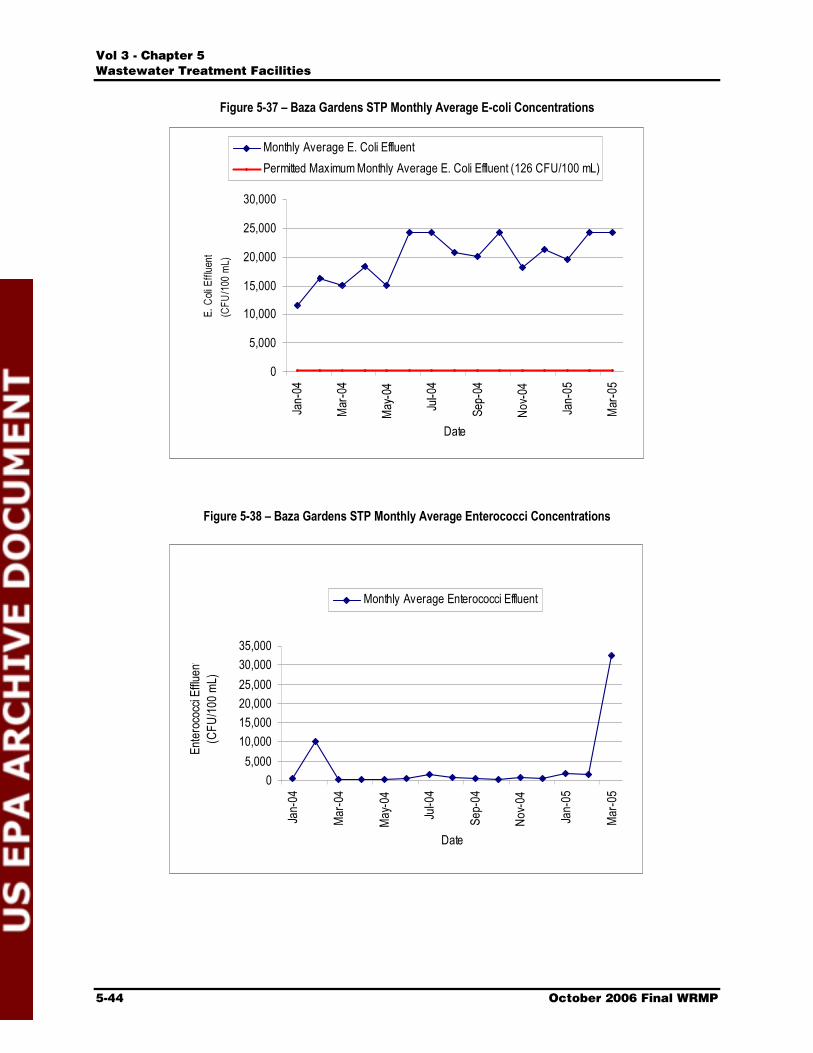
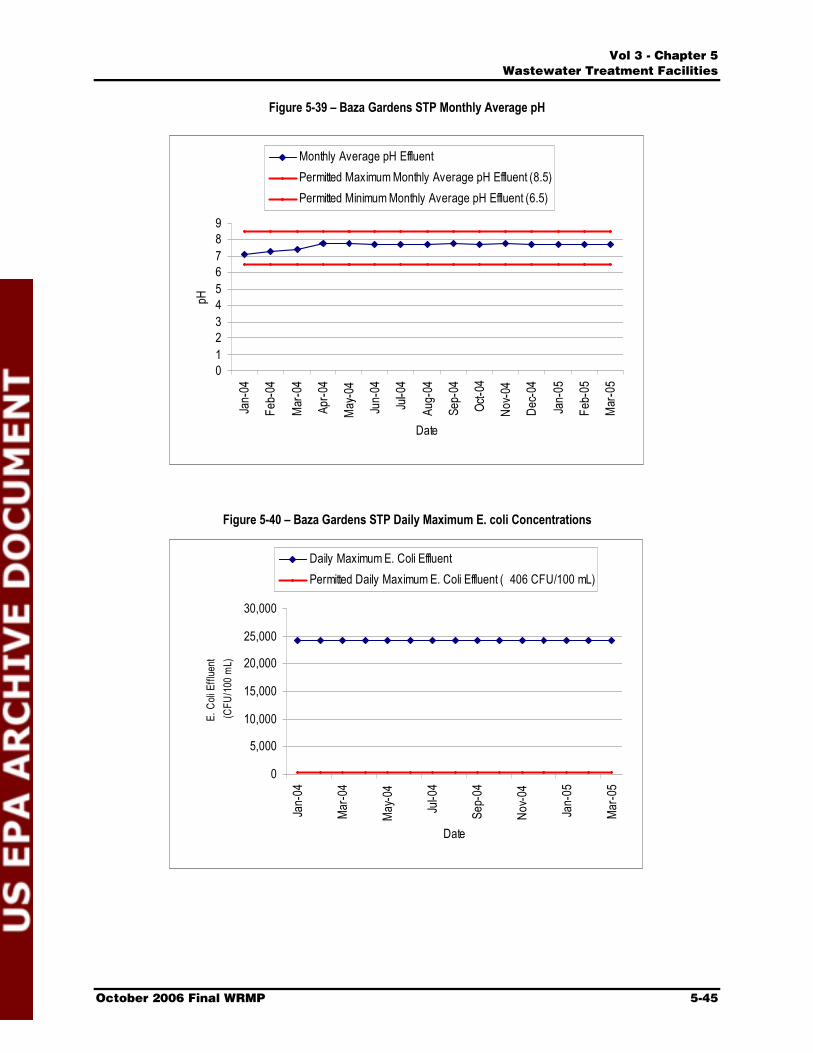
5.5.2 Wastewater Characteristics and NPDES Permit Requirements During the period of January 2004 to March 2005, the monthly average parameters for the Baza Gardens STP effluent generally did not meet the NPDES permit requirements (NPDES Permit No.GU0020095). The monthly average BOD5 concentrations, mass loading rates, and removal rates had 100% noncompliance during the period of consideration. Compliance for TSS maximum monthly average effluent parameters ranged from 7 to 47% during the observed period. The daily maximum and monthly average E. coli effluent concentrations were out of compliance with the permit limits 100% of the time (due to the fact that disinfection is not currently performed). Although there are maximum limits for weekly average parameters in the NPDES permit, weekly information was not reported on the DMRs so the data were not available. Similar to the Agat-Santa Rita STP, no total chlorine residual data were reported by GWA because the disinfection system was not operated. Therefore, the total chlorine residual did not exceed the maximum average monthly and maximum daily limits.
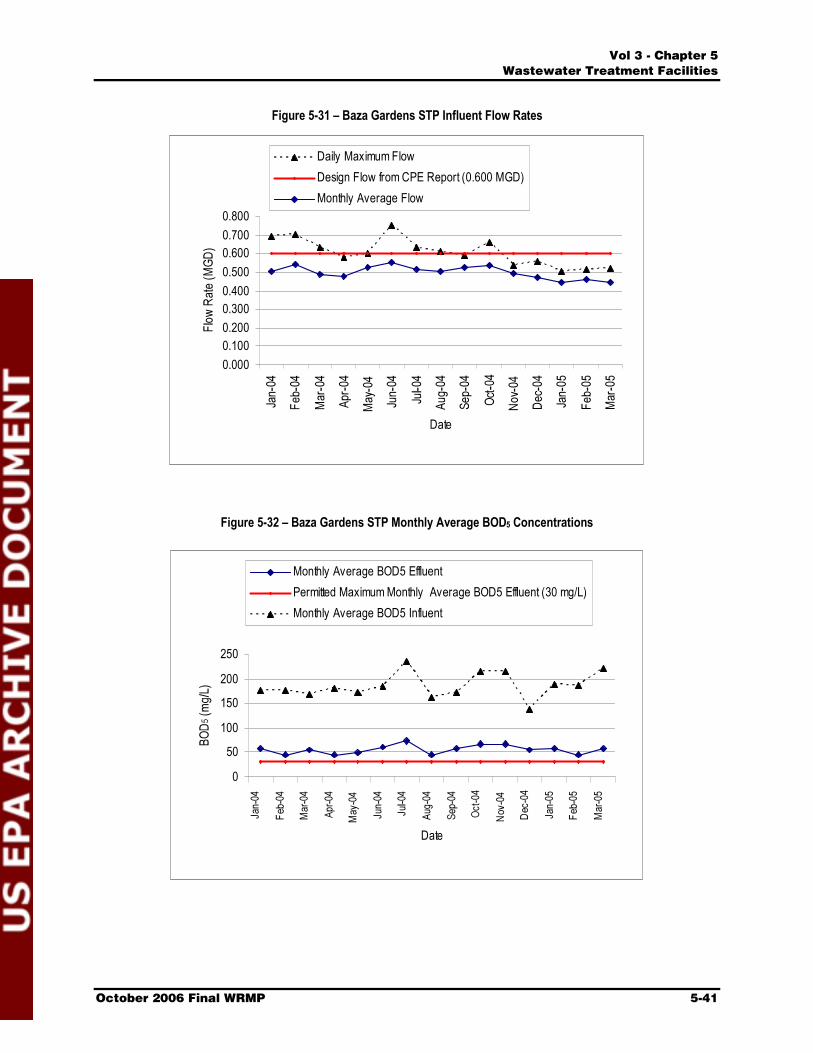
The DMR monthly average flow rate ranges from 0.447 to 0.551 mgd (note that the flow monitoring study detailed in Chapter 4 suggests much lower influent flows). The influent BOD5 monthly average concentration is approximately 186 mg/L. Although the monthly average flow rates are within the design range and monthly average BOD5 influent concentrations are within the typical range for residential wastewater, this facility still had a high level of noncompliance. Figures 5-31 through 5-46 present representative ranges of various measured parameters.
In addition to the above, the following was determined:
The effluent turbidity is consistently above the NPDES permit limit.
Because disinfection is not performed the effluent level of E. coli is consistently above the NPDES permit limit for maximum daily and maximum monthly average. Concentrations are typically two orders of magnitude greater than the limit specified in the permit.
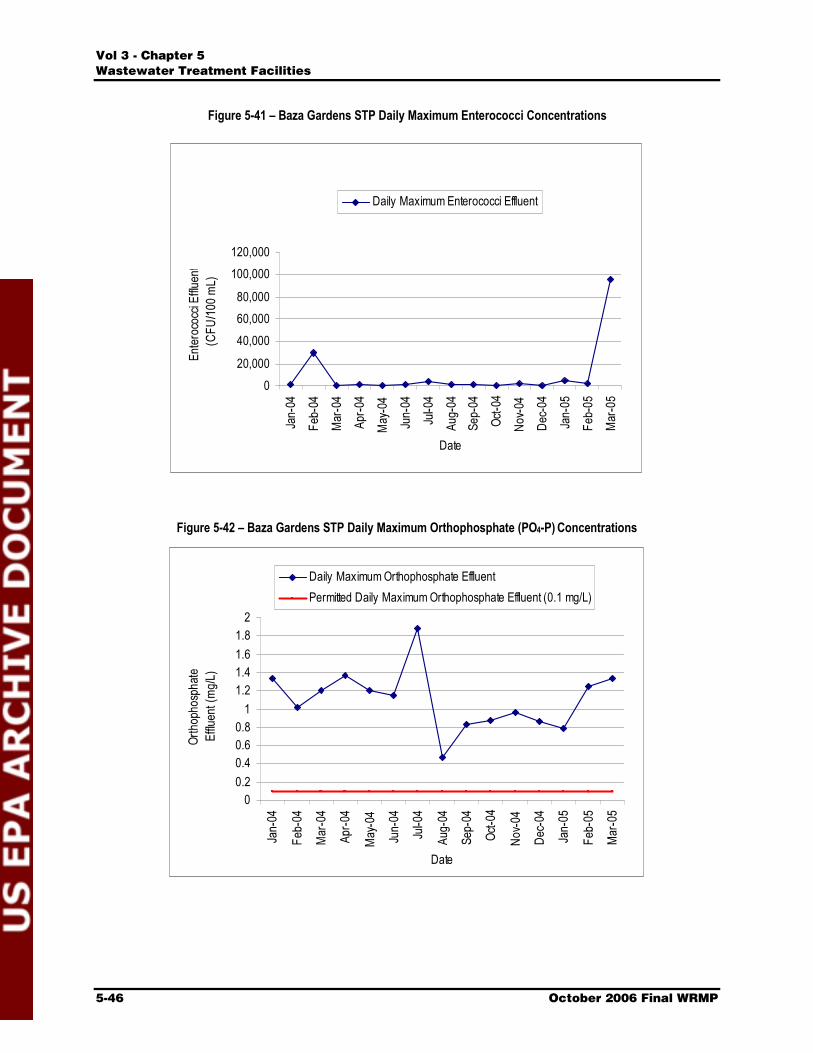
The maximum daily effluent levels of orthophosphate (mg/L and lb/day) are consistently above the NPDES permitted limit.
The maximum daily effluent levels of nitrate and nitrogen (mg/L and lb/day) are above the NPDES permitted limit 67% and 53% of the time, respectively.
ʱ´ í ó ݸ¿°¬»® ë
É¿¬»©¿¬»® Ì®»¿¬³»²¬ Ú¿½·´·¬·»
ëóìð ѽ¬±¾»® îððê Ú·²¿´ ÉÎÓÐ
Table 5-9 – Baza Gardens STP Influent and Effluent Wastewater Characteristics
Parameter Average Range PermitLimitation
Non- Compliance Frequency
Monthly Average Flow (mgd) 0.500 0.447 - 0.551 NoneInfluent BOD5 (mg/L) 185.8 138 – 236 None Effluent BOD5 (mg/L) 55.3 44 – 74 30.0 100 % BOD5 Removal Rate 70.2 60.9 - 76.6 85.0 100 % Influent BOD5 (lb/day) 780.7 541 - 1,042 NoneEffluent BOD5 (lb/day) 232.3 165 - 325 150.0 100 % Influent Suspended Solids (mg/L) 104.7 65 – 179 NoneEffluent Suspended Solids (mg/L) 16.5 8 - 45 30.0 13 % TSS Removal Rate 83.1 47.7 - 94.4 85.0 47 % Influent Suspended Solids (lb/day) 434.3 283 – 708 None Effluent Suspended Solids (lb/day) 68.0 26 – 175 150.0 7 % Effluent E. Coli (CFU/100 mL) 19,824.3 11,597 - 24,192 126.0 100 % Effluent Enterococci (CFU/ 100 mL) 3,474.5 200 - 32,367 None Effluent pH 7.6 7.1 – 7.8 6.5-8.5 0 %
Daily Maximum Flow (mgd) 0.607 0.506 – 0.750 NoneInfluent BOD5 (mg/L) 226.8 172 – 326 None Effluent BOD5 (mg/L) 71.3 48 – 113 NoneInfluent BOD5 (lb/day) 968.4 781 – 1,384 None Effluent BOD5 (lb/day) 304.1 190 – 495 NoneInfluent Suspended Solids (mg/L) 127.9 84 – 288 None Effluent Suspended Solids (mg/L) 32.4 12 – 172 NoneInfluent Suspended Solids (lb/day) 524.1 347 – 1,102 None Effluent Suspended Solids (lb/day) 132.0 47 – 668 NoneEffluent E-coli (CFU/100 mL) 24,192 24,192 - 24,192 406.0 100 % Effluent Enterococci (CFU/ 100 mL) 9,587.3 300 - 96,060 NoneEffluent Orthophosphate (PO4-P) (mg/L) 1.1 0.5 - 1.9 0.1 100 % Effluent Orthophosphate (PO4-P)(lb/day) 4.7 1.9 – 8.0 0.5 100 % Effluent Nitrate-Nitrogen (NO3-N) (mg/L) 2.2 0.1 – 12.3 0.5 67 % Effluent Nitrate-Nitrogen (NO3-N)(lb/day) 9.2 0.6 - 52.5 2.5 53 % Effluent Turbidity (NTU) 13.8 4.0 – 40.9 1.0 100 %
Notes:1. Data selected from GWA’s Data Monitoring Reports from Jan 04 to Mar 05 2. Permit limitations are based upon a design flow of 0.600 mgd.
ʱ´ í ó ݸ¿°¬»® ë
É¿¬»©¿¬»® Ì®»¿¬³»²¬ Ú¿½·´·¬·»
ѽ¬±¾»® îððê Ú·²¿´ ÉÎÓÐ ëóìï
Figure 5-31 – Baza Gardens STP Influent Flow Rates
0.0000.1000.2000.3000.4000.5000.6000.7000.800
Date
Daily Maximum FlowDesign Flow from CPE Report (0.600 MGD) Monthly Average Flow
Figure 5-32 – Baza Gardens STP Monthly Average BOD5 Concentrations
0
50
100
150
200
250
Date
Monthly Average BOD5 EffluentPermitted Maximum Monthly Average BOD5 Effluent (30 mg/L) Monthly Average BOD5 Influent
ʱ´ í ó ݸ¿°¬»® ë
É¿¬»©¿¬»® Ì®»¿¬³»²¬ Ú¿½·´·¬·»
ëóìî ѽ¬±¾»® îððê Ú·²¿´ ÉÎÓÐ
Figure 5-33 – Baza Gardens STP Monthly Average BOD5 Mass Loading Rates
0
200
400
600
800
1,000
1,200
Date
Monthly Average BOD5 EffluentPermitted Maximum Monthly Average BOD5 Effluent (150 lb/day)Monthly Average BOD5 Influent
Figure 5-34 – Baza Gardens STP Monthly Average TSS Concentrations
020406080
100120140160180200
Date
Monthly Average TSS EffluentPermitted Maximum Monthly Average TSS Effluent (30 mg/L)Monthly Average TSS Influent
ʱ´ í ó ݸ¿°¬»® ë
É¿¬»©¿¬»® Ì®»¿¬³»²¬ Ú¿½·´·¬·»
ѽ¬±¾»® îððê Ú·²¿´ ÉÎÓÐ ëóìí
Figure 5-35 – Baza Gardens STP Monthly Average TSS Mass Loading Rates
0100200300400500600700800
Date
Monthly Average TSS EffluentPermitted Maximum Monthly Average TSS Effluent (150 lb/day)Monthly Average TSS Influent
Figure 5-36 – Baza Gardens STP Monthly Average of BOD5 and TSS Removal Rates
0
20
40
60
80
100
Date
Monthly Average of BOD5 Removal RatePermitted Minimum Monthly Average of BOD5 and TSS Removal Rate (85 % ) Monthly Average of TSS Removal Rate
ʱ´ í ó ݸ¿°¬»® ë
É¿¬»©¿¬»® Ì®»¿¬³»²¬ Ú¿½·´·¬·»
ëóìì ѽ¬±¾»® îððê Ú·²¿´ ÉÎÓÐ
Figure 5-37 – Baza Gardens STP Monthly Average E-coli Concentrations
0
5,000
10,000
15,000
20,000
25,000
30,000
Date
Monthly Average E. Coli EffluentPermitted Maximum Monthly Average E. Coli Effluent (126 CFU/100 mL)
Figure 5-38 – Baza Gardens STP Monthly Average Enterococci Concentrations
05,000
10,00015,00020,00025,00030,00035,000
Jan-
04
Mar-0
4
May-0
4
Jul-0
4
Sep-
04
Nov-0
4
Jan-
05
Mar-0
5
Date
Ente
roco
cci E
ffluen
t(C
FU/10
0 mL)
Monthly Average Enterococci Effluent
ʱ´ í ó ݸ¿°¬»® ë
É¿¬»©¿¬»® Ì®»¿¬³»²¬ Ú¿½·´·¬·»
ѽ¬±¾»® îððê Ú·²¿´ ÉÎÓÐ ëóìë
Figure 5-39 – Baza Gardens STP Monthly Average pH
0123456789
Date
Monthly Average pH EffluentPermitted Maximum Monthly Average pH Effluent (8.5)Permitted Minimum Monthly Average pH Effluent (6.5)
Figure 5-40 – Baza Gardens STP Daily Maximum E. coli Concentrations
0
5,000
10,000
15,000
20,000
25,000
30,000
Jan-
04
Mar-0
4
May-0
4
Jul-0
4
Sep-
04
Nov-0
4
Jan-
05
Mar-0
5
Date
E. C
oli E
fflue
nt
(CF
U/10
0 m
L)
Daily Maximum E. Coli EffluentPermitted Daily Maximum E. Coli Effluent ( 406 CFU/100 mL)
ʱ´ í ó ݸ¿°¬»® ë
É¿¬»©¿¬»® Ì®»¿¬³»²¬ Ú¿½·´·¬·»
ëóìê ѽ¬±¾»® îððê Ú·²¿´ ÉÎÓÐ
Figure 5-41 – Baza Gardens STP Daily Maximum Enterococci Concentrations
020,000
40,00060,00080,000
100,000120,000
Date
Daily Maximum Enterococci Effluent
Figure 5-42 – Baza Gardens STP Daily Maximum Orthophosphate (PO4-P) Concentrations
00.20.40.60.8
11.21.41.61.8
2
Date
Daily Maximum Orthophosphate Effluent Permitted Daily Maximum Orthophosphate Effluent (0.1 mg/L)

ʱ´ í ó ݸ¿°¬»® ë
É¿¬»©¿¬»® Ì®»¿¬³»²¬ Ú¿½·´·¬·»
ѽ¬±¾»® îððê Ú·²¿´ ÉÎÓÐ ëóìé
Figure 5-43 – Baza Gardens STP Daily Maximum Orthophosphate (PO4-P) Mass Loading Rates
0123456789
Date
Daily Maximum Orthophosphate Effluent Permitted Daily Maximum Orthophosphate Effluent (0.5 lb/day)
Figure 5-44 – Baza Gardens STP Daily Maximum Nitrate-Nitrogen (NO3-N) Concentrations
0
2
4
6
8
10
12
14
Date
Daily Maximum Nitrate-Nitrogen Effluent Permitted Daily Maximum Nitrate-Nitrogen Effluent (0.5 mg/L)

ʱ´ í ó ݸ¿°¬»® ë
É¿¬»©¿¬»® Ì®»¿¬³»²¬ Ú¿½·´·¬·»
ëóìè ѽ¬±¾»® îððê Ú·²¿´ ÉÎÓÐ
Figure 5-45 – Baza Gardens STP Daily Maximum Nitrate-Nitrogen (NO3-N) Mass Loading Rates
0
10
20
30
40
50
60
Date
Daily Maximum Nitrate-Nitrogen Effluent Permitted Daily Maximum Nitrate-Nitrogen Effluent (2.5 lb/day)
Figure 5-46 – Baza Gardens STP Daily Maximum Turbidity
05
1015202530354045
Date
Daily Maximum Turbidity Effluent Permitted Daily Maximum Turbidity Effluent (1.0 NTU)

ʱ´ í ó ݸ¿°¬»® ë
É¿¬»©¿¬»® Ì®»¿¬³»²¬ Ú¿½·´·¬·»
ѽ¬±¾»® îððê Ú·²¿´ ÉÎÓÐ ëóìç
5.5.3 Capacity Assessment The capacity assessment results from Appendix 3B (summarized in Table 5-5) indicate that the current flows are within the design capacity. The DMR flows suggest that the facility is operating at full capacity, whereas the more reliable WRMP flow monitoring suggests that the plant is operating at about half of its design capacity.
5.5.4 Recommended CIP The design capacity of the Baza Gardens STP is 600,000 gpd without redundancy or standby facilities, and it is currently processing roughly 250,000 gpd (Table 5-5); however, this facility has not been able to reliably achieve effluent quality within the NPDES permit requirements. The treatment process has usually been able to meet effluent TSS concentration limits; however, it has regularly failed to meet BOD requirements and is not capable of achieving the strict nutrient (phosphorus and nitrogen) limits. Alternative or additional treatment processes designed to reliably meet the low nutrient limits would be an operations and maintenance challenge and would require significant operator skills and knowledge.
One of the primary goals of the recommended facility plan should be to evaluate alternative disposal methods to eliminate the stream discharge as a primary disposal method since the low nutrient limits in the existing NPDES permit are driven by the instream standards. However, the Togcha River could serve as the backup disposal method with an NPDES permit obtained strictly for occasional use (backup purpose).
Candidate disposal methods include: Reuse Injection wells Seepage pits and evaporation ponds Ocean outfall
Because of the high rainfall amounts on Guam, it is unlikely that reuse, seepage, or evaporation alone can be reliably used for disposal. However, reuse (including storage) in combination with one or more of the other disposal methods to provide backup disposal or dispose of a portion of the flow may be feasible.
Similar to the Agat-Santa Rita STP, the existing packaged plant lacks redundancy which affects GWA�s ability to perform necessary repairs and maintenance. Because of its age, current poor condition, lack of redundancy and the difficulty of operating this facility, it is recommended that a new facility be considered. This should be designed to provide the appropriate level of redundancy and standby equipment for the necessary reliability as well as provide for future flow requirements. One option, for the same reasons as the recommendation for the Agat-Santa Rita STP, the TFSC process should be considered. In this case an aerated lagoon may not be feasible due to space limitations. For the purposes of CIP project planning, a TFSC plant that includes screenings, grit removal, primary and secondary clarification, and disinfection will be considered. Figure 5-47 is a schematic flow diagram of the proposed Baza Gardens STP replacement. However, even a new TFSC facility will not be able to meet the nutrient limits in the current NPDES permit, so an alternate means of disposal is still required. A cost for a two 300 foot injection wells is also included in case other disposal methods cannot be confirmed. It is assumed that solids will be processed at a central facility (possibly at the NDSTP) so no CIP costs are included for
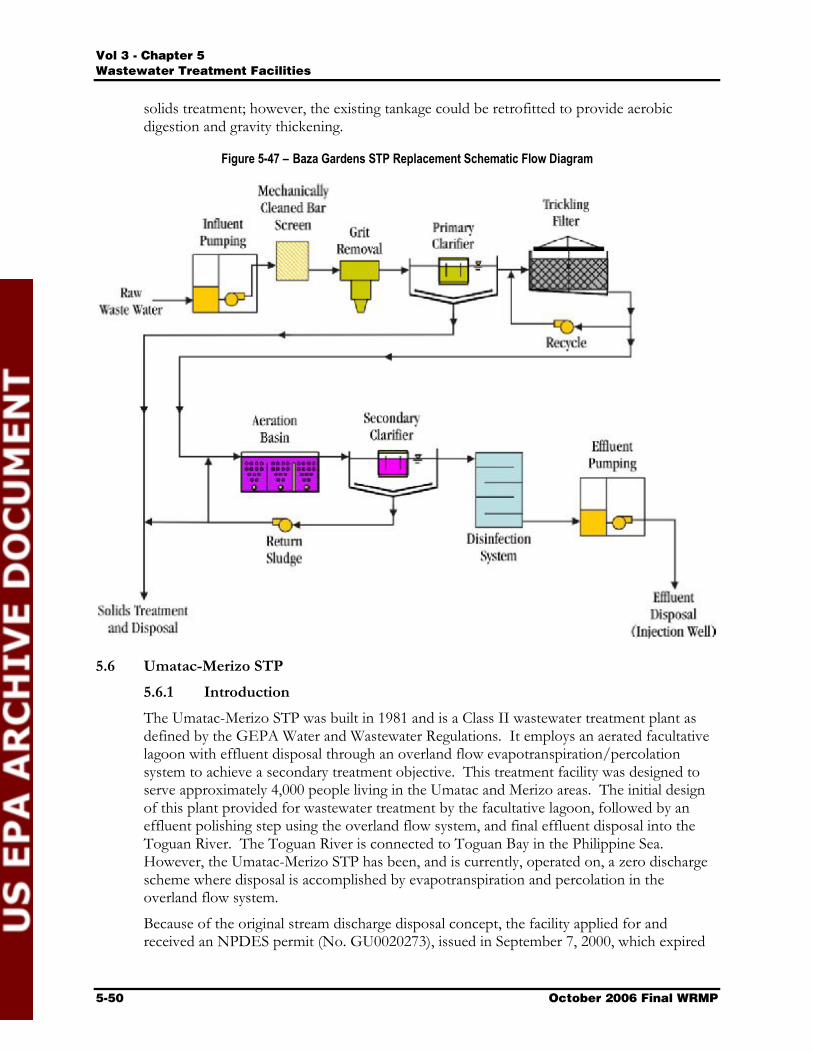
ʱ´ í ó ݸ¿°¬»® ë
É¿¬»©¿¬»® Ì®»¿¬³»²¬ Ú¿½·´·¬·»
ëóëð ѽ¬±¾»® îððê Ú·²¿´ ÉÎÓÐ
solids treatment; however, the existing tankage could be retrofitted to provide aerobic digestion and gravity thickening.
Figure 5-47 – Baza Gardens STP Replacement Schematic Flow Diagram
5.6 Umatac-Merizo STP
5.6.1 Introduction The Umatac-Merizo STP was built in 1981 and is a Class II wastewater treatment plant as defined by the GEPA Water and Wastewater Regulations. It employs an aerated facultative lagoon with effluent disposal through an overland flow evapotranspiration/percolation system to achieve a secondary treatment objective. This treatment facility was designed to serve approximately 4,000 people living in the Umatac and Merizo areas. The initial design of this plant provided for wastewater treatment by the facultative lagoon, followed by an effluent polishing step using the overland flow system, and final effluent disposal into the Toguan River. The Toguan River is connected to Toguan Bay in the Philippine Sea. However, the Umatac-Merizo STP has been, and is currently, operated on, a zero discharge scheme where disposal is accomplished by evapotranspiration and percolation in the overland flow system.
Because of the original stream discharge disposal concept, the facility applied for and received an NPDES permit (No. GU0020273), issued in September 7, 2000, which expired
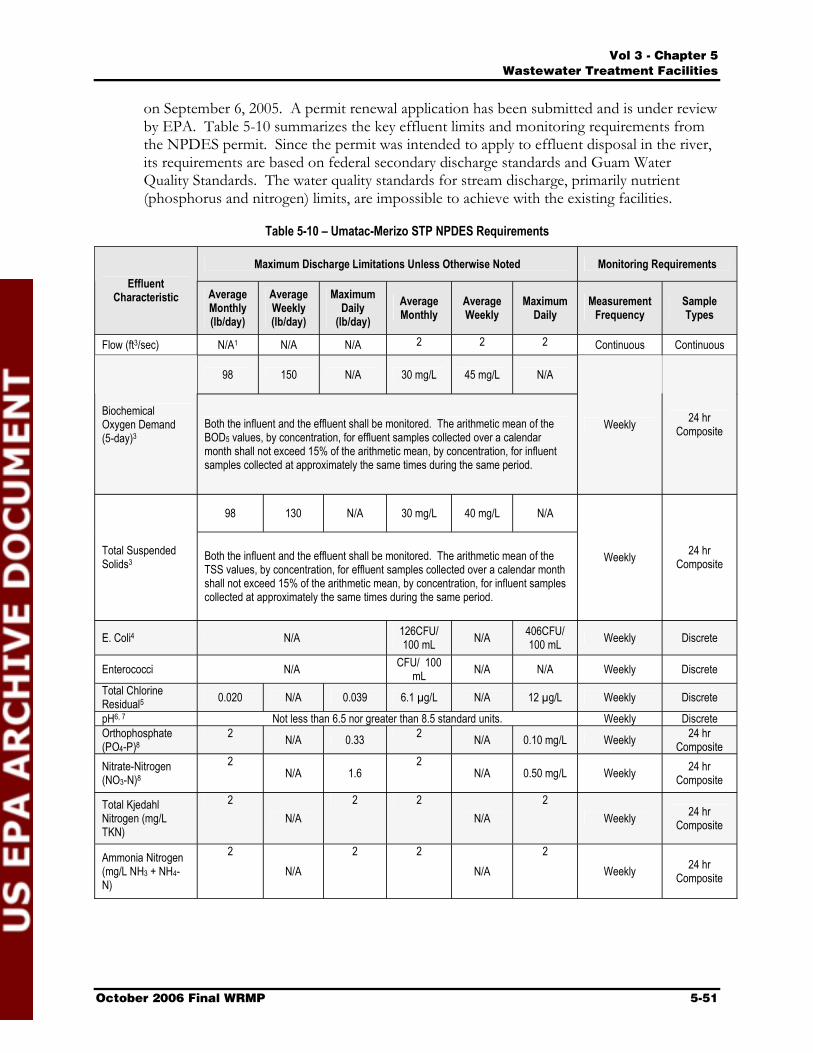
ʱ´ í ó ݸ¿°¬»® ë
É¿¬»©¿¬»® Ì®»¿¬³»²¬ Ú¿½·´·¬·»
ѽ¬±¾»® îððê Ú·²¿´ ÉÎÓÐ ëóëï
on September 6, 2005. A permit renewal application has been submitted and is under review by EPA. Table 5-10 summarizes the key effluent limits and monitoring requirements from the NPDES permit. Since the permit was intended to apply to effluent disposal in the river, its requirements are based on federal secondary discharge standards and Guam Water Quality Standards. The water quality standards for stream discharge, primarily nutrient (phosphorus and nitrogen) limits, are impossible to achieve with the existing facilities.
Table 5-10 – Umatac-Merizo STP NPDES Requirements
Maximum Discharge Limitations Unless Otherwise Noted Monitoring Requirements Effluent
Characteristic AverageMonthly(lb/day)
AverageWeekly (lb/day)
Maximum Daily
(lb/day)AverageMonthly
AverageWeekly
Maximum Daily
Measurement Frequency
Sample Types
Flow (ft3/sec) N/A1 N/A N/A 2 2 2 Continuous Continuous
98 150 N/A 30 mg/L 45 mg/L N/A
Biochemical Oxygen Demand (5-day)3
Both the influent and the effluent shall be monitored. The arithmetic mean of the BOD5 values, by concentration, for effluent samples collected over a calendar month shall not exceed 15% of the arithmetic mean, by concentration, for influent samples collected at approximately the same times during the same period.
Weekly 24 hr Composite
98 130 N/A 30 mg/L 40 mg/L N/A
Total Suspended Solids3 Both the influent and the effluent shall be monitored. The arithmetic mean of the
TSS values, by concentration, for effluent samples collected over a calendar month shall not exceed 15% of the arithmetic mean, by concentration, for influent samples collected at approximately the same times during the same period.
Weekly 24 hr Composite
E. Coli4 N/A 126CFU/100 mL N/A 406CFU/
100 mL Weekly Discrete
Enterococci N/A CFU/ 100 mL N/A N/A Weekly Discrete
Total Chlorine Residual5 0.020 N/A 0.039 6.1 µg/L N/A 12 µg/L Weekly Discrete
pH6, 7 Not less than 6.5 nor greater than 8.5 standard units. Weekly Discrete Orthophosphate (PO4-P)8
2 N/A 0.33 2 N/A 0.10 mg/L Weekly 24 hr Composite
Nitrate-Nitrogen (NO3-N)8
2N/A 1.6
2N/A 0.50 mg/L Weekly 24 hr
Composite
Total Kjedahl Nitrogen (mg/L TKN)
2N/A
2 2N/A
2Weekly 24 hr
Composite
Ammonia Nitrogen (mg/L NH3 + NH4-N)
2N/A
2 2N/A
2Weekly 24 hr
Composite

ʱ´ í ó ݸ¿°¬»® ë
É¿¬»©¿¬»® Ì®»¿¬³»²¬ Ú¿½·´·¬·»
ëóëî ѽ¬±¾»® îððê Ú·²¿´ ÉÎÓÐ
Table 5-10 – Umatac-Merizo STP NPDES Requirements (continued)
Maximum Discharge Limitations Unless Otherwise Noted Monitoring Requirements Effluent
Characteristic AverageMonthly(lb/day)
AverageWeekly (lb/day)
Maximum Daily
(lb/day)AverageMonthly
AverageWeekly
Maximum Daily
Measurement Frequency
Sample Types
Dissolved Oxygen (mg/L)7
2N/A
2 2N/A
2Weekly Discrete
Turbidity N/A N/A N/A N/A N/A 1.0 NTU Weekly Discrete Temperature (ºC)7 2 N/A 2 2 N/A 2 Weekly Discrete Heavy Metals (mg/L or µg/L)9
2 N/A 2 2 N/A 2 Annually 24 hr Composite
Hardness (mg/L CaCO3)10
2N/A
2 2N/A
2Annually 24 hr
Composite
Pesticides (mg/L or µg/L)9
2N/A
2 2N/A
2Annually 24 hr
Composite
Oil & Grease (mg/L)
2N/A
2 2N/A
2Annually Discrete
Whole Effluent Toxicity (TUc)11 N/A
2N/A
2Annually 24 hr
Composite
Notes: 1. N/A = not applicable. 2. Monitoring and reporting required. No limitation set at this time. For flow, both the influent and the effluent shall be monitored. 3. Discharge limitation is based on federal secondary treatment standards in accordance with 40 CFR 133.102(c ) and/or Revised Guam Water
Quality Standard (1992). Mass emission rate limitation is calculated using a design flow of 0.605 ft3/sec (0.391 MGD). 4. Discharge limitation is based on applicable draft Revised Guam Water Quality Standards and 40 CFR 122.44(d). To determine compliance with
the “average monthly discharge limitation” a minimum of four samples must be collected at approximately equal intervals. Samples shall be taken at the location specified in Part A.6.c of the permit.
5. Upon initiation and throughout the duration of effluent chlorination, the permittee shall monitor total chlorine residual. Samples shall be taken at the location specified in Part A.6.c of the permit. Concentration limitation is based on best professional judgment, USEPA water quality criteria, and 40 CFR 122.44(d), and is calculated in accordance with Technical Support Document for Water Quality-based Toxics Control (EPA/505/2-90-001, March 1991). Mass emission rate limitation is calculated using an average daily design flow of 0.605 ft 3/sec (0.391 MGD). Contact time following chlorination and prior to effluent discharge shall not be less than 15 minutes.
6. Discharge limitation is based on applicable Revised Water Quality Standards and 40 CFR 122.44(d). 7. pH, dissolved oxygen, and temperature shall be monitored concurrently. To account for diurnal fluctuations, monitoring shall be conducted within
3 hours after sunrise and within 3 hours before sunset. 8. Concentration limitation is based on applicable Revised Guam Quality Standards and 40 CFR 122.44(d). Mass emission rate limitation is
calculated using an average daily design flow of 0.605 ft3/sec (0.391 mgd). 9. Heavy metals means arsenic, cadmium, chromium III, chromium IV, copper, lead, mercury, nickel, silver, and zinc. Samples shall be analyzed for
both total recoverable and dissolved metal. For the listing of all pesticides (organochlorines, organophosphates, carbonates, herbicides, fungicides, defoliants, and botanicals) see USEPA Water Quality Criteria Blue Book.
10. Hardness is monitored because water quality criteria for some heavy metals are hardness dependent. 11. See Part A.5 of the permit for explanation of requirements.
The treatment facilities were originally designed for a flow rate of 0.391 mgd. From January 2004 to March 2005, the plant received a monthly average flow ranging from 0.34 to 0.48 mgd with zero effluent discharge reported according to the DMR reports. A discharge to the Toguan River would be generated if the overland flow system cannot entirely dispose of the effluent (historically during and immediately after heavy rainfall events). GWA is required to report any effluent discharges to the river to GEPA.
Figure 5-48 presents a conceptual schematic process train flow diagram for the Umatac-Merizo STP.
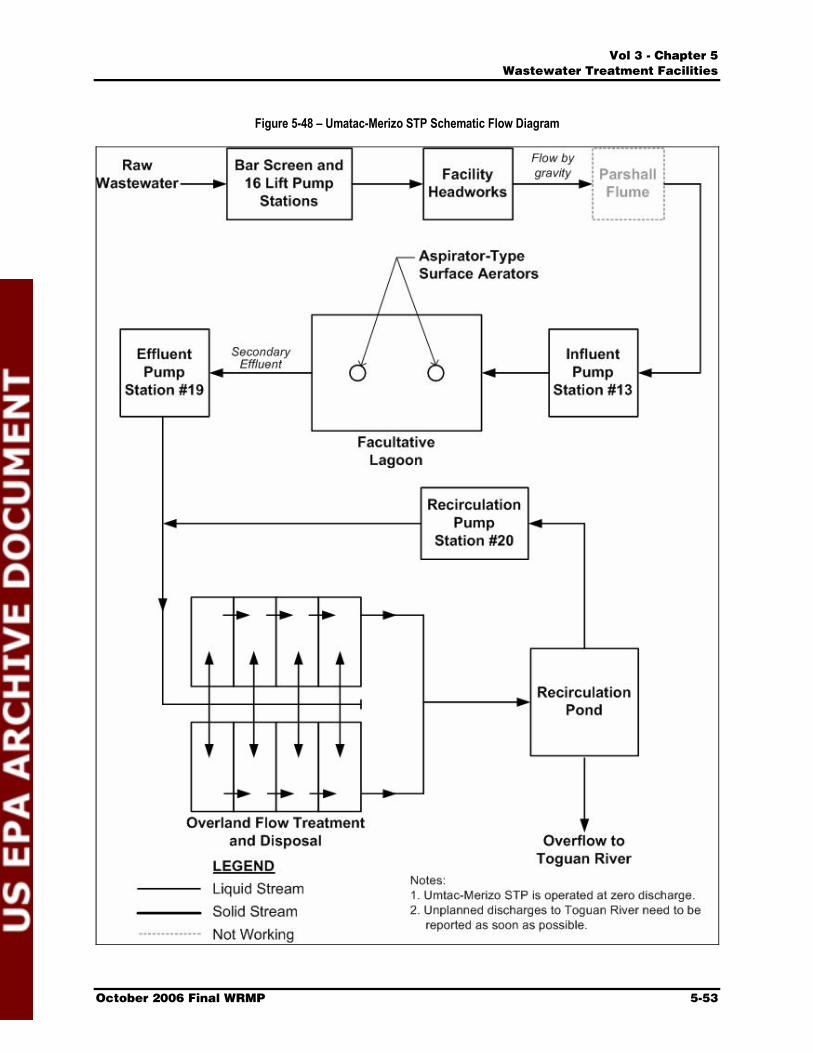
ʱ´ í ó ݸ¿°¬»® ë
É¿¬»©¿¬»® Ì®»¿¬³»²¬ Ú¿½·´·¬·»
ѽ¬±¾»® îððê Ú·²¿´ ÉÎÓÐ ëóëí
Figure 5-48 – Umatac-Merizo STP Schematic Flow Diagram

ʱ´ í ó ݸ¿°¬»® ë
É¿¬»©¿¬»® Ì®»¿¬³»²¬ Ú¿½·´·¬·»
ëóëì ѽ¬±¾»® îððê Ú·²¿´ ÉÎÓÐ
The general wastewater treatment process flow stream can be described as follows:
Liquid Stream: Flow enters the influent pump station (PS #13) by gravity through a Parshall flume and is pumped to the aerobic facultative lagoon. Influent entering the lagoon causes the treated effluent to overflow to the effluent pump station. Flow is pumped to the overland flow disposal system located on the hills about one mile away at an elevation approximately 100 to 150 feet above sea level. The overland flow system consists of two parallel terraced grass fields, including a distribution piping system. The distribution system is valved, and the system is operated in such a way that the terraced disposal fields are alternated. Treatment and disposal occurs through evapotranspiration and percolation processes as the treated effluent flows down through the field. Any remaining effluent not removed by the overland flow disposal system is collected by a concrete interceptor ditch at the bottom of the hill and returned to a recirculation pond, from which it is pumped back to the top of the overland flow disposal system. If the recirculation pond overfills, it will overflow into a concrete spillway to the Toguan River.
Solids Stream: Sludge accumulation from the bottom of the aerated facultative lagoon is dredged when necessary, although only one record was found that reported such an incident. In 1992, 40,000 gallons of sludge were removed.
Equipment/Process Out of Service: Influent flow meter
5.6.2 Wastewater Characteristics and NPDES Permit Requirements Because GWA operates the Umatac-Merizo STP as a zero discharge facility, effluent reports were not available. However, according to the available information from GWA quarterly wastewater operations and maintenance progress reports, some accidental discharges occurred for a week in February 2004 and between October 20 and 22, 2004. In addition, plant staff has indicated that discharges to the river occur following periods of heavy rainfall. Although notification and sampling are required by permit, only one data set (only one day�s sample) was available from GWA to reflect effluent quality during discharges to the river. Although there are maximum limits for weekly average parameters in the NPDES permit if discharges did occur, weekly information was not reported on the DMRs and the data were not available. Like the Agat-Santa Rita and Baza Gardens STPs, no total chlorine residual data were reported by GWA since the disinfection system was not operated. Therefore, the total chlorine residual did not exceed maximum average monthly and maximum daily limits.
Table 5-11 summarizes basic parameters required by the NPDES permit; including flow rate, BOD5, TSS, E.coli, enterococci, and pH from January 2004 to March 2005 (limited data were available between October 2004 and December 2004). The data were obtained from the DMRs that are submitted to GEPA quarterly. Figure 5-49 indicates that the monthly average
ʱ´ í ó ݸ¿°¬»® ë
É¿¬»©¿¬»® Ì®»¿¬³»²¬ Ú¿½·´·¬·»
ѽ¬±¾»® îððê Ú·²¿´ ÉÎÓÐ ëóëë
influent flow rates range from 0.340 to 0.480 mgd, with an average of 0.409 mgd; this rate is slightly higher than the original design flow rate. About 50% of the reported monthly average flow rates during this period were above the design flow rate, and all of the daily maximum flow rates reported were higher than the 0.391 mgd design flow rate.
The monthly average and daily maximum influent BOD5 concentrations range from 168 to 259 mg/L and 169 to 359 mg/L, respectively. Figure 5-50 shows the reported monthly average BOD5 influent concentrations plotted with the permitted monthly average BOD5 effluent concentration. This concentration is roughly 216 mg/L, which is within the range of typical BOD5 concentrations for domestic wastewater. The TSS influent concentrations reported were low for domestic wastewater, in the range of 44 to 101 mg/L for the monthly average, and 74 to 420 mg/L for the daily maximum. The monthly average influent TSS concentration shown in Figure 5-52 is 69.9 mg/L, which would be characterized as a low TSS concentration for domestic wastewater. Low TSS values may be attributed to accumulation of solids in the facultative lagoon; however there are no data to support this assumption. The ranges of measured parameters are diagramed in Figures 5-51 through 5-53.
In general, both influent monthly average flow rates and BOD5 concentrations are in the normal range. However, the reported daily maximum influent flow rate is higher than the original design, although it does not appear to affect the overall plant performance.
Note that the permit limitations are only applicable if the effluent flow is discharged to the river. Under normal operating conditions as a �zero-discharge� facility, the NPDES permit limits are not applicable.
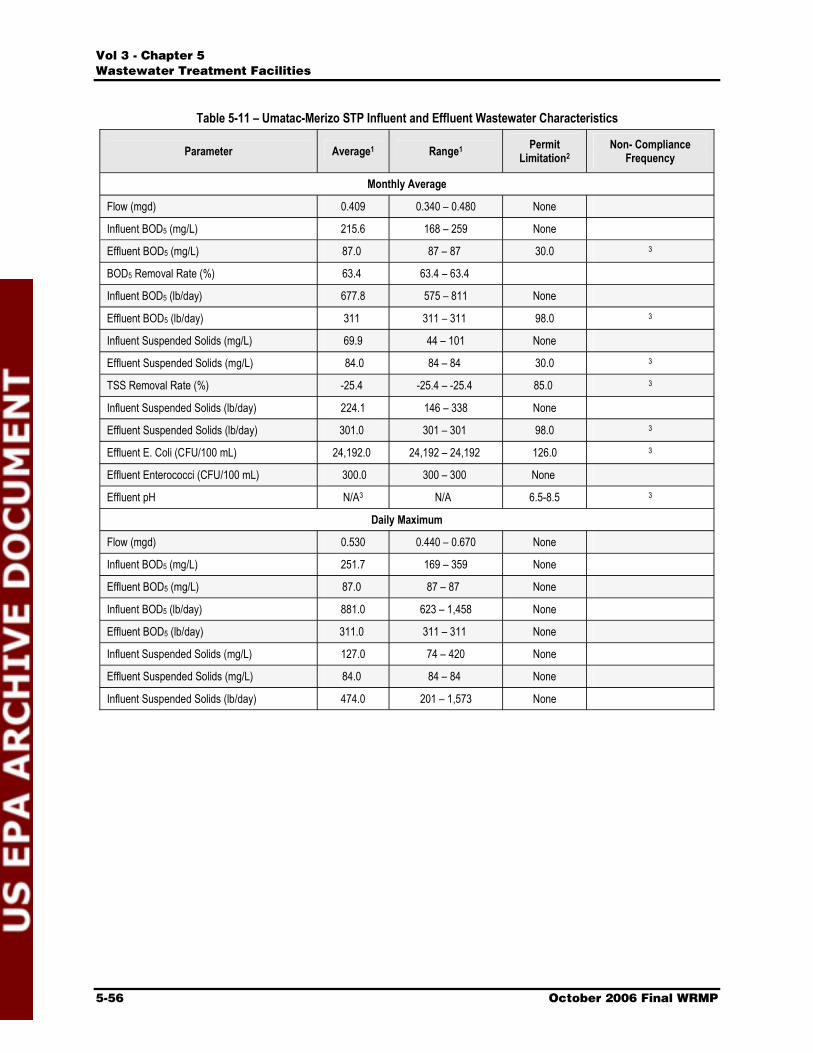
ʱ´ í ó ݸ¿°¬»® ë
É¿¬»©¿¬»® Ì®»¿¬³»²¬ Ú¿½·´·¬·»
ëóëê ѽ¬±¾»® îððê Ú·²¿´ ÉÎÓÐ
Table 5-11 – Umatac-Merizo STP Influent and Effluent Wastewater Characteristics
Parameter Average1 Range1 PermitLimitation2
Non- Compliance Frequency
Monthly Average
Flow (mgd) 0.409 0.340 – 0.480 None
Influent BOD5 (mg/L) 215.6 168 – 259 None
Effluent BOD5 (mg/L) 87.0 87 – 87 30.0 3
BOD5 Removal Rate (%) 63.4 63.4 – 63.4
Influent BOD5 (lb/day) 677.8 575 – 811 None
Effluent BOD5 (lb/day) 311 311 – 311 98.0 3
Influent Suspended Solids (mg/L) 69.9 44 – 101 None
Effluent Suspended Solids (mg/L) 84.0 84 – 84 30.0 3
TSS Removal Rate (%) -25.4 -25.4 – -25.4 85.0 3
Influent Suspended Solids (lb/day) 224.1 146 – 338 None
Effluent Suspended Solids (lb/day) 301.0 301 – 301 98.0 3
Effluent E. Coli (CFU/100 mL) 24,192.0 24,192 – 24,192 126.0 3
Effluent Enterococci (CFU/100 mL) 300.0 300 – 300 None
Effluent pH N/A3 N/A 6.5-8.5 3
Daily Maximum
Flow (mgd) 0.530 0.440 – 0.670 None
Influent BOD5 (mg/L) 251.7 169 – 359 None
Effluent BOD5 (mg/L) 87.0 87 – 87 None
Influent BOD5 (lb/day) 881.0 623 – 1,458 None
Effluent BOD5 (lb/day) 311.0 311 – 311 None
Influent Suspended Solids (mg/L) 127.0 74 – 420 None
Effluent Suspended Solids (mg/L) 84.0 84 – 84 None
Influent Suspended Solids (lb/day) 474.0 201 – 1,573 None
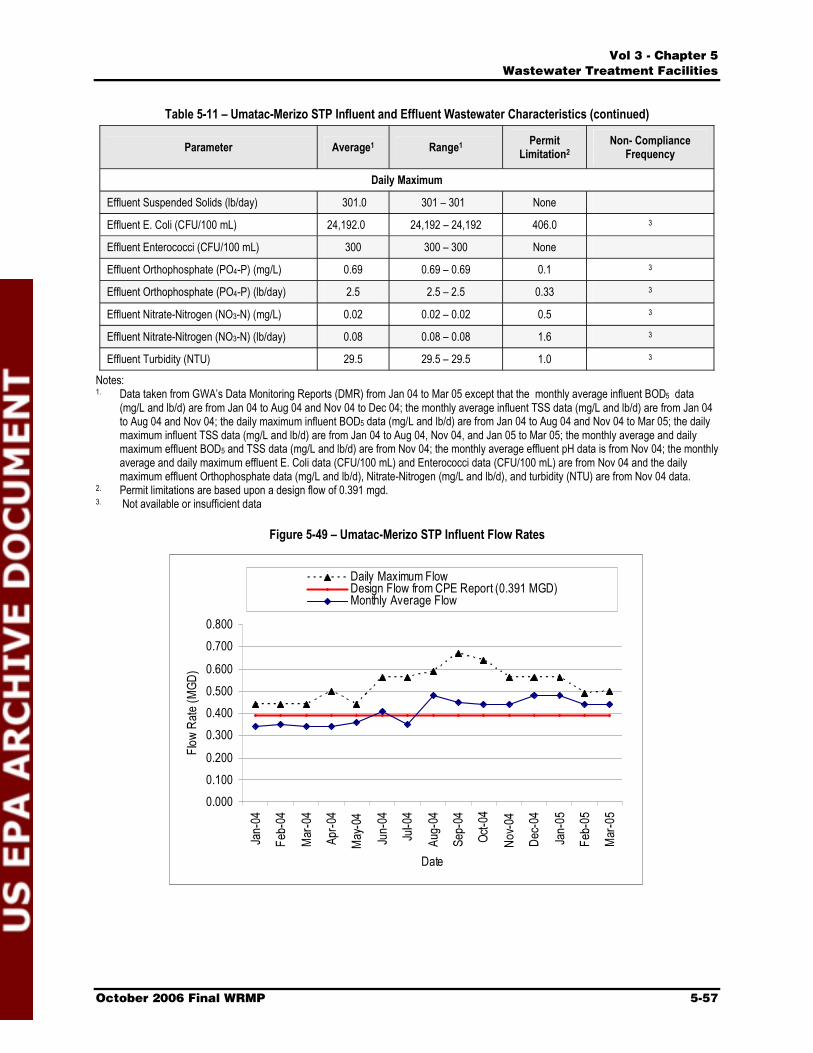
ʱ´ í ó ݸ¿°¬»® ë
É¿¬»©¿¬»® Ì®»¿¬³»²¬ Ú¿½·´·¬·»
ѽ¬±¾»® îððê Ú·²¿´ ÉÎÓÐ ëóëé
Table 5-11 – Umatac-Merizo STP Influent and Effluent Wastewater Characteristics (continued)
Parameter Average1 Range1 PermitLimitation2
Non- Compliance Frequency
Daily Maximum
Effluent Suspended Solids (lb/day) 301.0 301 – 301 None
Effluent E. Coli (CFU/100 mL) 24,192.0 24,192 – 24,192 406.0 3
Effluent Enterococci (CFU/100 mL) 300 300 – 300 None
Effluent Orthophosphate (PO4-P) (mg/L) 0.69 0.69 – 0.69 0.1 3
Effluent Orthophosphate (PO4-P) (lb/day) 2.5 2.5 – 2.5 0.33 3
Effluent Nitrate-Nitrogen (NO3-N) (mg/L) 0.02 0.02 – 0.02 0.5 3
Effluent Nitrate-Nitrogen (NO3-N) (lb/day) 0.08 0.08 – 0.08 1.6 3
Effluent Turbidity (NTU) 29.5 29.5 – 29.5 1.0 3
Notes:1. Data taken from GWA’s Data Monitoring Reports (DMR) from Jan 04 to Mar 05 except that the monthly average influent BOD5 data
(mg/L and lb/d) are from Jan 04 to Aug 04 and Nov 04 to Dec 04; the monthly average influent TSS data (mg/L and lb/d) are from Jan 04 to Aug 04 and Nov 04; the daily maximum influent BOD5 data (mg/L and lb/d) are from Jan 04 to Aug 04 and Nov 04 to Mar 05; the daily maximum influent TSS data (mg/L and lb/d) are from Jan 04 to Aug 04, Nov 04, and Jan 05 to Mar 05; the monthly average and dailymaximum effluent BOD5 and TSS data (mg/L and lb/d) are from Nov 04; the monthly average effluent pH data is from Nov 04; the monthly average and daily maximum effluent E. Coli data (CFU/100 mL) and Enterococci data (CFU/100 mL) are from Nov 04 and the daily maximum effluent Orthophosphate data (mg/L and lb/d), Nitrate-Nitrogen (mg/L and lb/d), and turbidity (NTU) are from Nov 04 data.
2. Permit limitations are based upon a design flow of 0.391 mgd. 3. Not available or insufficient data
Figure 5-49 – Umatac-Merizo STP Influent Flow Rates
0.0000.1000.200
0.3000.4000.5000.600
0.7000.800
Date
Daily Maximum FlowDesign Flow from CPE Report (0.391 MGD) Monthly Average Flow
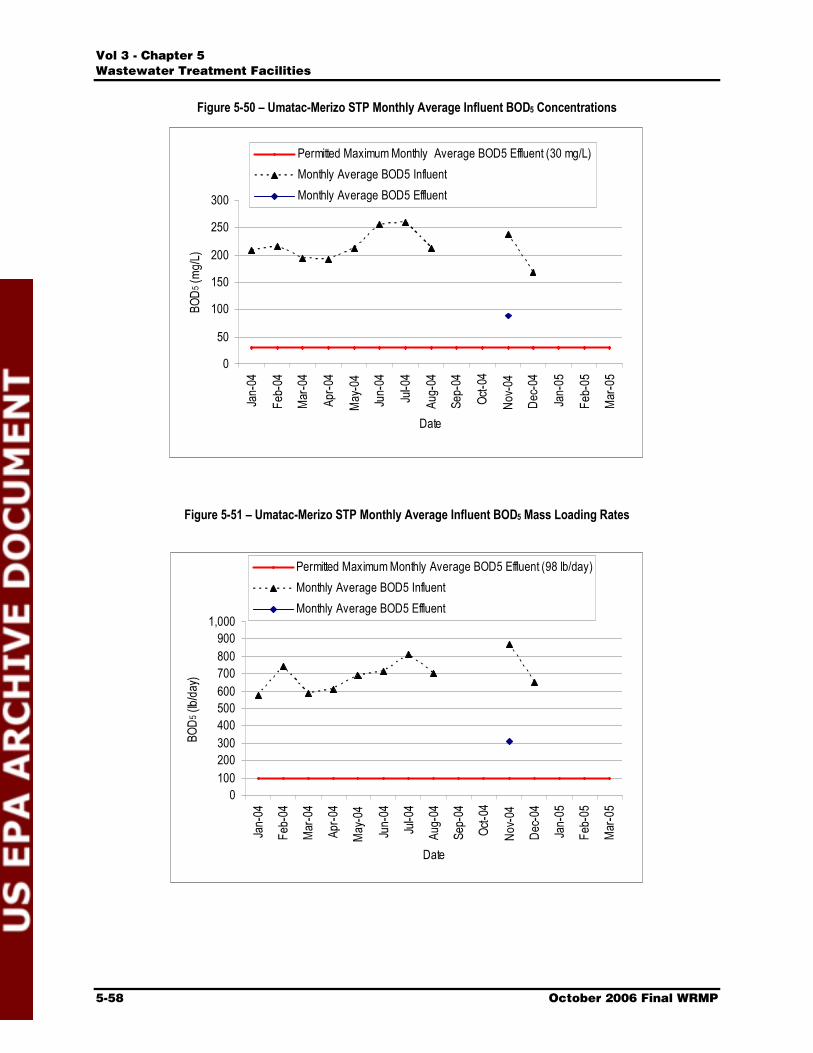
ʱ´ í ó ݸ¿°¬»® ë
É¿¬»©¿¬»® Ì®»¿¬³»²¬ Ú¿½·´·¬·»
ëóëè ѽ¬±¾»® îððê Ú·²¿´ ÉÎÓÐ
Figure 5-50 – Umatac-Merizo STP Monthly Average Influent BOD5 Concentrations
0
50
100
150
200
250
300
Date
Permitted Maximum Monthly Average BOD5 Effluent (30 mg/L) Monthly Average BOD5 InfluentMonthly Average BOD5 Effluent
Figure 5-51 – Umatac-Merizo STP Monthly Average Influent BOD5 Mass Loading Rates
0100200300400500600700800900
1,000
Date
Permitted Maximum Monthly Average BOD5 Effluent (98 lb/day)Monthly Average BOD5 InfluentMonthly Average BOD5 Effluent
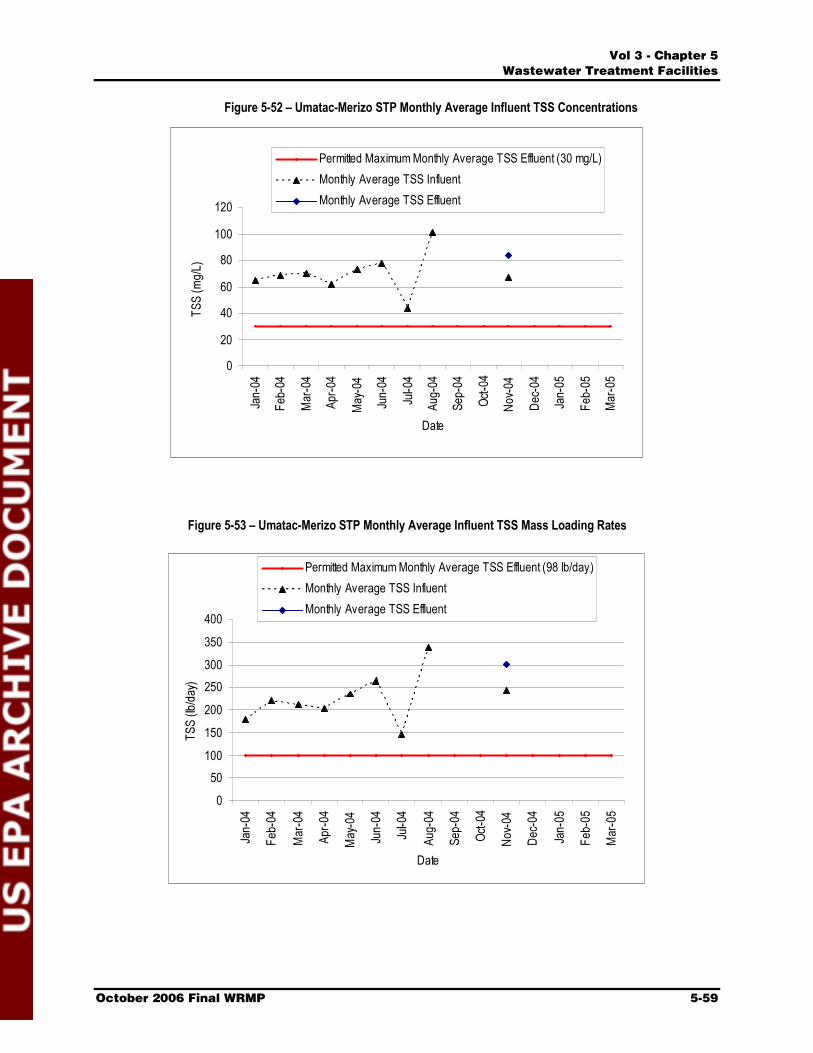
ʱ´ í ó ݸ¿°¬»® ë
É¿¬»©¿¬»® Ì®»¿¬³»²¬ Ú¿½·´·¬·»
ѽ¬±¾»® îððê Ú·²¿´ ÉÎÓÐ ëóëç
Figure 5-52 – Umatac-Merizo STP Monthly Average Influent TSS Concentrations
0
20
40
60
80
100
120
Date
Permitted Maximum Monthly Average TSS Effluent (30 mg/L)Monthly Average TSS InfluentMonthly Average TSS Effluent
Figure 5-53 – Umatac-Merizo STP Monthly Average Influent TSS Mass Loading Rates
0
50100
150
200
250300
350
400
Date
Permitted Maximum Monthly Average TSS Effluent (98 lb/day)Monthly Average TSS InfluentMonthly Average TSS Effluent
ʱ´ í ó ݸ¿°¬»® ë
É¿¬»©¿¬»® Ì®»¿¬³»²¬ Ú¿½·´·¬·»
ëóêð ѽ¬±¾»® îððê Ú·²¿´ ÉÎÓÐ
5.6.3 Capacity Assessment Table 5-5 suggests that the actual flows for the Umatac-Merizo STP (based on the WRMP flow monitoring and modeling) are much less than would be expected from the DMR reports (roughly half), and within the design capacity of the lagoon treatment system. Therefore, the actual mass loading rates may be less than the rates calculated by the flows in the DMR reports. Effluent characterization is necessary to determine the treatment capacity of the existing lagoon system.
5.6.4 Recommended CIP The capacity of the Umatac-Merizo STP is roughly 390,000 gpd, which is sufficient for both existing and future flow predictions (Table 5-5). Given the simple nature of the aerated pond process, additional redundant facilities are not required. However, effluent disposal is provided by an overland evapotransporation/percolation system designed to overflow excess effluent to the Togcha River, which falls under an existing NPDES permit. The pond treatment and disposal polishing system is not capable of producing an effluent that can meet the nutrient (phosphorus and nitrogen) permit limits for the river disposal, so it is important that there be no excess effluent requiring river disposal, or an alternate means of disposal must be established.
GWA has improved the operation of the disposal system and believes that it can be operated at a zero discharge mode; however, it is recommended that the existing disposal system be stress-tested to establish a firm disposal capacity. Both plant flow and applied effluent flow measurements will be necessary for the stress testing. An ongoing flow measurement project will be able to provide the plant flow information, and additional flow measurement equipment will be required on the disposal pumping system to perform stress tests. Permanent flow measurement and recording for the disposal system are recommended to monitor the applied amount and provide historical information for long-term capacity assessment of the disposal system. Since this facility is intended to have a zero discharge disposal system, no disinfection provisions are included in the CIP.
5.7 Northern District STP 5.7.1 Introduction The NDSTP was commissioned in 1979 and is considered a Wastewater Treatment Class III facility according to GEPA. This facility provides primary treatment. It is located on the northwestern coast of the island (see Figure 5-1). A chain link fence surrounds the entire treatment plant to prevent wildlife from entering. The original average design flow capacity is 12.0 mgd, with a peak design flow capacity of 27.0 mgd. Wastewater entering the NDSTP comes from the northern area, including U.S. naval facilities and Andersen Air Force Base. Additional wastewater comes from pumpers and vacuum trucks that collect wastewater from residential and commercial cesspools and septic tanks, and from other pump stations.
In addition to primary solids from its own processes, solids from the Baza Gardens and Hagatna STPs are also processed at this plant. The NDSTP disposes of primary treated effluent through an ocean outfall into the Philippine Sea. Effluent limitations for discharge into the sea are provided under NPDES Permit No. GU0020141 issued in June 30, 1986, by EPA, including requirements under section 301(h) which allow for the discharge of primary treated effluent. Although the permit expired on June 30, 1991, an application for a permit

ʱ´ í ó ݸ¿°¬»® ë
É¿¬»©¿¬»® Ì®»¿¬³»²¬ Ú¿½·´·¬·»
ѽ¬±¾»® îððê Ú·²¿´ ÉÎÓÐ ëóêï
renewal has been submitted by GWA and is under review by EPA. The original renewal allocation received a tentative denial from EPA on April 4, 1997, because of impacts to water quality and the coral reef environment. GWA revised the permit application to include a decision to extend the ocean outfall. Design of the outfall extension has since been completed, and GWA is in the process of proceeding with the construction project. Table 5-12 summarizes the key effluent limits and monitoring requirements from the NPDES permit.
Table 5-12 - Northern District STP NPDES
Discharge Limitations Monitoring Requirements kg/day (lb/day) Other units (Specify)
Effluent Characteristic AverageMonthly
DailyMax
AverageMonthly
DailyMax
Measurement Frequency
Sample Type
Flow – m3/day (mgd) - - - (6 mgd) Continuous - Biochemical Oxygen Demand (5-day)1
1,930 (4,256)
3,860 (8,512)
85mg/L
170mg/L Once/week Composite
Suspended Solids1 1,136 (2,504)
2,272 (5,008)
50mg/L
100mg/L Once/week Composite
Settleable Solids - - 1 mL/L 2 mL/L Once/week Discrete Oil and Grease2 - - - - Once/month Discrete
pH3 Not less than 7.0 standard units nor greater than 9.0 standard units Once/week Discrete
Notes:1. Both the influent and effluent shall be monitored. 2. Oil and grease shall be monitored in the effluent on a monthly basis over a six month period since many toxic organic
pollutants partition into this fraction. If the level of oil and grease is found to be unacceptable, this permit shall be modified to include an effluent limitation and monitoring requirement for this parameter.
3. The discharge shall not cause the pH of the receiving water to deviate more than 0.5 pH units of that which would occur naturally.
Figure 5-54 presents a conceptual schematic process train flow diagram for the NDSTP. The following is a description of the general wastewater treatment process flow stream.
Liquid Stream: Raw wastewater influent comes from a 42-inch-diameter gravity line and raw comminuted wastewater from the Southern Link Pump Station�s 27-inch diameter forcemain. After arriving at the STP, the wastewater is chopped up by a comminutor (currently not in service), then flows through a Parshall flume (equipped with an ultrasonic level sensor for flow measurement, although currently not operational), followed by two rectangular preaeration tanks. It is then split to two rectangular, aerated grit removal tanks, before flowing into the flow divider box and on to the primary clarifiers. As of the summer of 2005, new grit system blowers were being installed, but none of the other preliminary treatment systems were operable. Consequently, flow passed through the back-up, manually cleaned bar screen adjacent to the comminutor. The original design provided for odor control for the headworks building ventilation to be treated by ozonation, but this system is inoperable.
Downstream of the preliminary treatment, wastewater from the divider box is designed to feed the two circular primary clarifiers.
ʱ´ í ó ݸ¿°¬»® ë
É¿¬»©¿¬»® Ì®»¿¬³»²¬ Ú¿½·´·¬·»
ëóêî ѽ¬±¾»® îððê Ú·²¿´ ÉÎÓÐ
Effluent from both primary clarifiers is combined and flows to the chlorine contact tank, passing through an effluent Parshall flume before entering the two parallel chlorine contact tanks.
Final effluent from the chlorine contact tanks then flows into a 48-inch-diameter transmission line that leads to the 30-inch-diameter ocean outfall.
Solids Stream: Four air-operated diaphragm pumps are installed as primary sludge pumps to transfer the primary clarifier sludge to the primary anaerobic digester.
From the primary digester, the stabilized sludge is pumped into the secondary anaerobic digester tank for thickening. None of the gas recirculation or sludge heating and recirculation systems are presently functional.
The thickened secondary sludge is designed to be pumped to two sludge dewatering centrifuges.
Eight sludge beds are also available for sludge drying. Because the dewatering systems (centrifuges) are not operational, the drying beds are used exclusively.
Equipment/Process Out of Service: Influent flow meter
Comminutor, pre-aeration, aerated grit removal
One primary clarifier, chlorination system
Digesters, centrifuges
Effluent flow meter
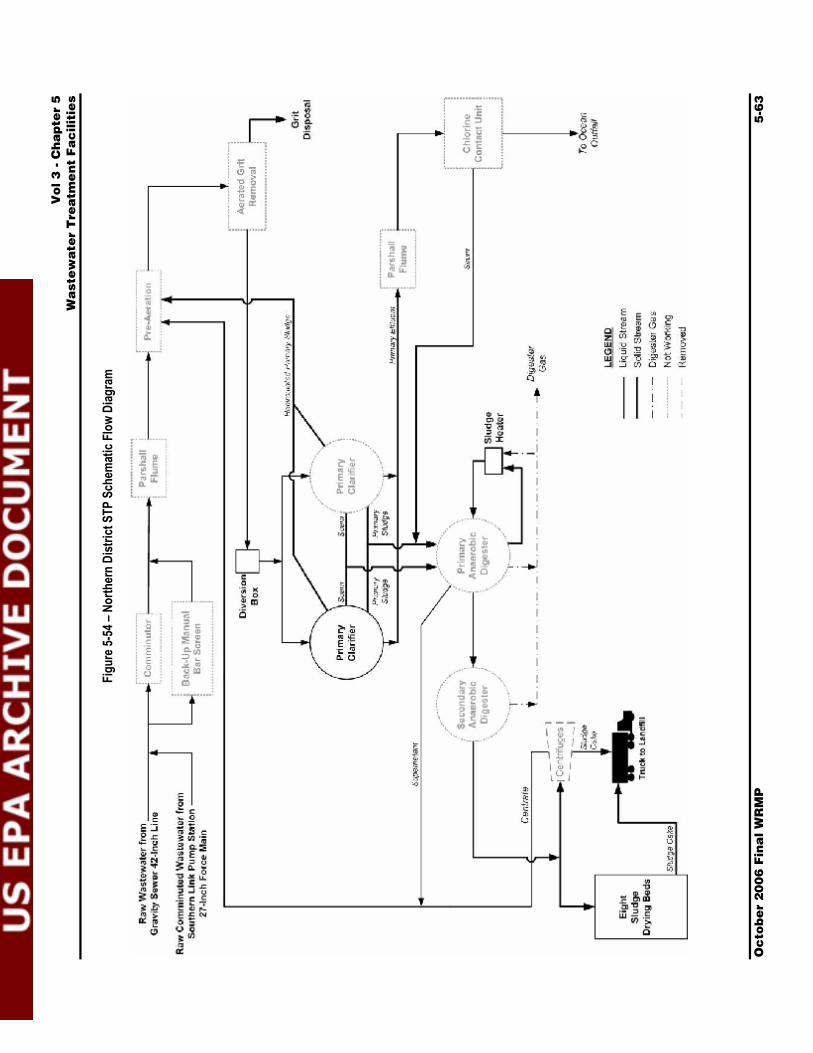
ʱ
´ í
ó Ý
¸¿
°¬»
® ë
É¿
¬»
©¿
¬»®
Ì®»
¿¬³
»²
¬ Ú
¿½
·´·¬
·»
ѽ
¬±¾
»®
îð
ðê
Ú·²
¿´
ÉÎ
ÓÐ
ë
óêí
Figu
re 5-
54 –
North
ern
Dist
rict S
TP S
chem
atic
Flow
Diag
ram
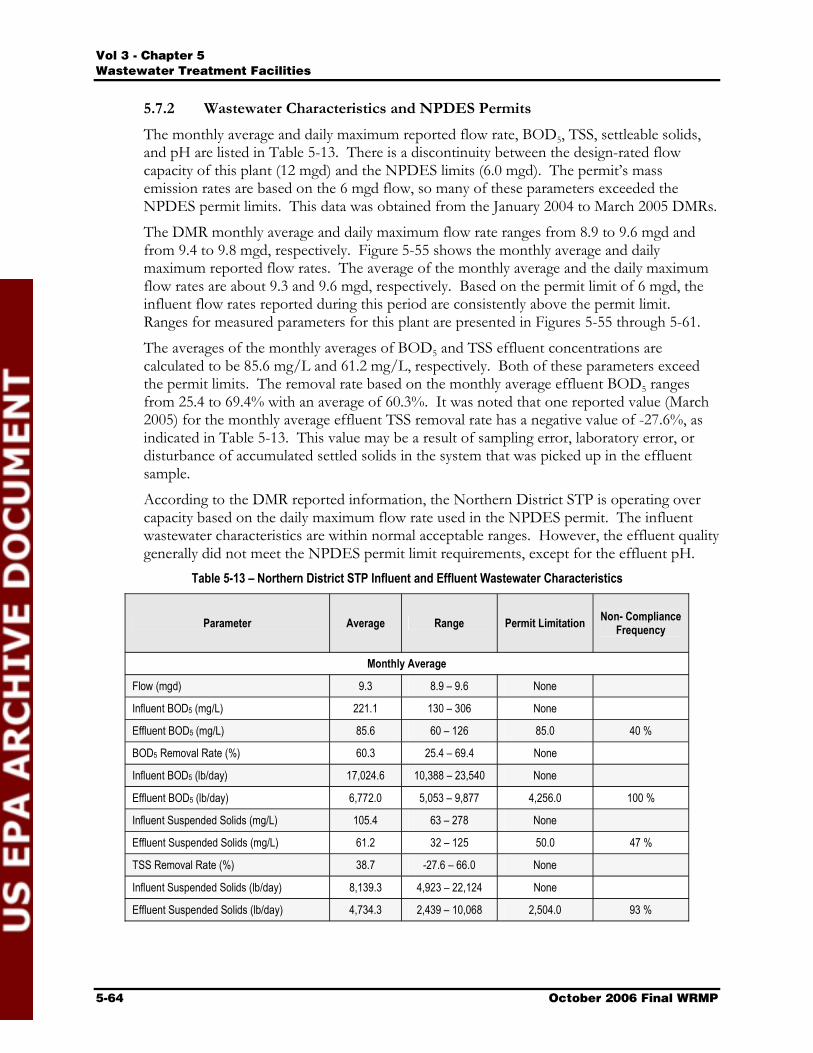
ʱ´ í ó ݸ¿°¬»® ë
É¿¬»©¿¬»® Ì®»¿¬³»²¬ Ú¿½·´·¬·»
ëóêì ѽ¬±¾»® îððê Ú·²¿´ ÉÎÓÐ
5.7.2 Wastewater Characteristics and NPDES Permits The monthly average and daily maximum reported flow rate, BOD5, TSS, settleable solids, and pH are listed in Table 5-13. There is a discontinuity between the design-rated flow capacity of this plant (12 mgd) and the NPDES limits (6.0 mgd). The permit�s mass emission rates are based on the 6 mgd flow, so many of these parameters exceeded the NPDES permit limits. This data was obtained from the January 2004 to March 2005 DMRs.
The DMR monthly average and daily maximum flow rate ranges from 8.9 to 9.6 mgd and from 9.4 to 9.8 mgd, respectively. Figure 5-55 shows the monthly average and daily maximum reported flow rates. The average of the monthly average and the daily maximum flow rates are about 9.3 and 9.6 mgd, respectively. Based on the permit limit of 6 mgd, the influent flow rates reported during this period are consistently above the permit limit. Ranges for measured parameters for this plant are presented in Figures 5-55 through 5-61.
The averages of the monthly averages of BOD5 and TSS effluent concentrations are calculated to be 85.6 mg/L and 61.2 mg/L, respectively. Both of these parameters exceed the permit limits. The removal rate based on the monthly average effluent BOD5 ranges from 25.4 to 69.4% with an average of 60.3%. It was noted that one reported value (March 2005) for the monthly average effluent TSS removal rate has a negative value of -27.6%, as indicated in Table 5-13. This value may be a result of sampling error, laboratory error, or disturbance of accumulated settled solids in the system that was picked up in the effluent sample.
According to the DMR reported information, the Northern District STP is operating over capacity based on the daily maximum flow rate used in the NPDES permit. The influent wastewater characteristics are within normal acceptable ranges. However, the effluent quality generally did not meet the NPDES permit limit requirements, except for the effluent pH.
Table 5-13 – Northern District STP Influent and Effluent Wastewater Characteristics
Parameter Average Range Permit Limitation Non- Compliance Frequency
Monthly Average
Flow (mgd) 9.3 8.9 – 9.6 None
Influent BOD5 (mg/L) 221.1 130 – 306 None
Effluent BOD5 (mg/L) 85.6 60 – 126 85.0 40 %
BOD5 Removal Rate (%) 60.3 25.4 – 69.4 None
Influent BOD5 (lb/day) 17,024.6 10,388 – 23,540 None
Effluent BOD5 (lb/day) 6,772.0 5,053 – 9,877 4,256.0 100 %
Influent Suspended Solids (mg/L) 105.4 63 – 278 None
Effluent Suspended Solids (mg/L) 61.2 32 – 125 50.0 47 %
TSS Removal Rate (%) 38.7 -27.6 – 66.0 None
Influent Suspended Solids (lb/day) 8,139.3 4,923 – 22,124 None
Effluent Suspended Solids (lb/day) 4,734.3 2,439 – 10,068 2,504.0 93 %
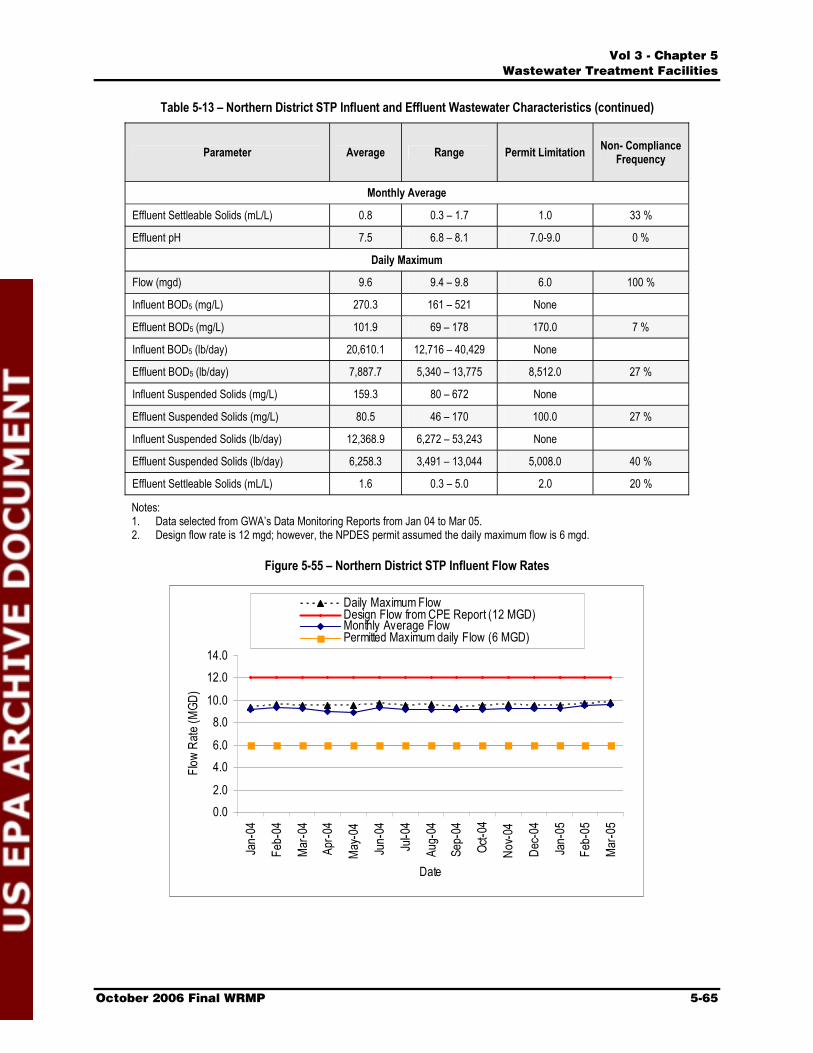
ʱ´ í ó ݸ¿°¬»® ë
É¿¬»©¿¬»® Ì®»¿¬³»²¬ Ú¿½·´·¬·»
ѽ¬±¾»® îððê Ú·²¿´ ÉÎÓÐ ëóêë
Table 5-13 – Northern District STP Influent and Effluent Wastewater Characteristics (continued)
Parameter Average Range Permit Limitation Non- Compliance Frequency
Monthly Average
Effluent Settleable Solids (mL/L) 0.8 0.3 – 1.7 1.0 33 %
Effluent pH 7.5 6.8 – 8.1 7.0-9.0 0 %
Daily Maximum
Flow (mgd) 9.6 9.4 – 9.8 6.0 100 %
Influent BOD5 (mg/L) 270.3 161 – 521 None
Effluent BOD5 (mg/L) 101.9 69 – 178 170.0 7 %
Influent BOD5 (lb/day) 20,610.1 12,716 – 40,429 None
Effluent BOD5 (lb/day) 7,887.7 5,340 – 13,775 8,512.0 27 %
Influent Suspended Solids (mg/L) 159.3 80 – 672 None
Effluent Suspended Solids (mg/L) 80.5 46 – 170 100.0 27 %
Influent Suspended Solids (lb/day) 12,368.9 6,272 – 53,243 None
Effluent Suspended Solids (lb/day) 6,258.3 3,491 – 13,044 5,008.0 40 %
Effluent Settleable Solids (mL/L) 1.6 0.3 – 5.0 2.0 20 %
Notes:1. Data selected from GWA’s Data Monitoring Reports from Jan 04 to Mar 05. 2. Design flow rate is 12 mgd; however, the NPDES permit assumed the daily maximum flow is 6 mgd.
Figure 5-55 – Northern District STP Influent Flow Rates
0.02.0
4.06.0
8.010.0
12.014.0
Date
Daily Maximum FlowDesign Flow from CPE Report (12 MGD) Monthly Average FlowPermitted Maximum daily Flow (6 MGD)

ʱ´ í ó ݸ¿°¬»® ë
É¿¬»©¿¬»® Ì®»¿¬³»²¬ Ú¿½·´·¬·»
ëóêê ѽ¬±¾»® îððê Ú·²¿´ ÉÎÓÐ
Figure 5-56 – Northern District STP Monthly Average BOD5 Concentrations
050
100150200250300350
Date
Monthly Average BOD5 EffluentPermitted Maximum Monthly Average BOD5 Effluent (85 mg/L) Monthly Average BOD5 Influent
Figure 5-57 – Northern District STP Monthly Average BOD5 Mass Loading Rates
0
5,000
10,000
15,000
20,000
25,000
Date
5
Monthly Average BOD5 EffluentPermitted Maximum Monthly Average BOD5 Effluent (4,256 lb/day)Monthly Average BOD5 Influent
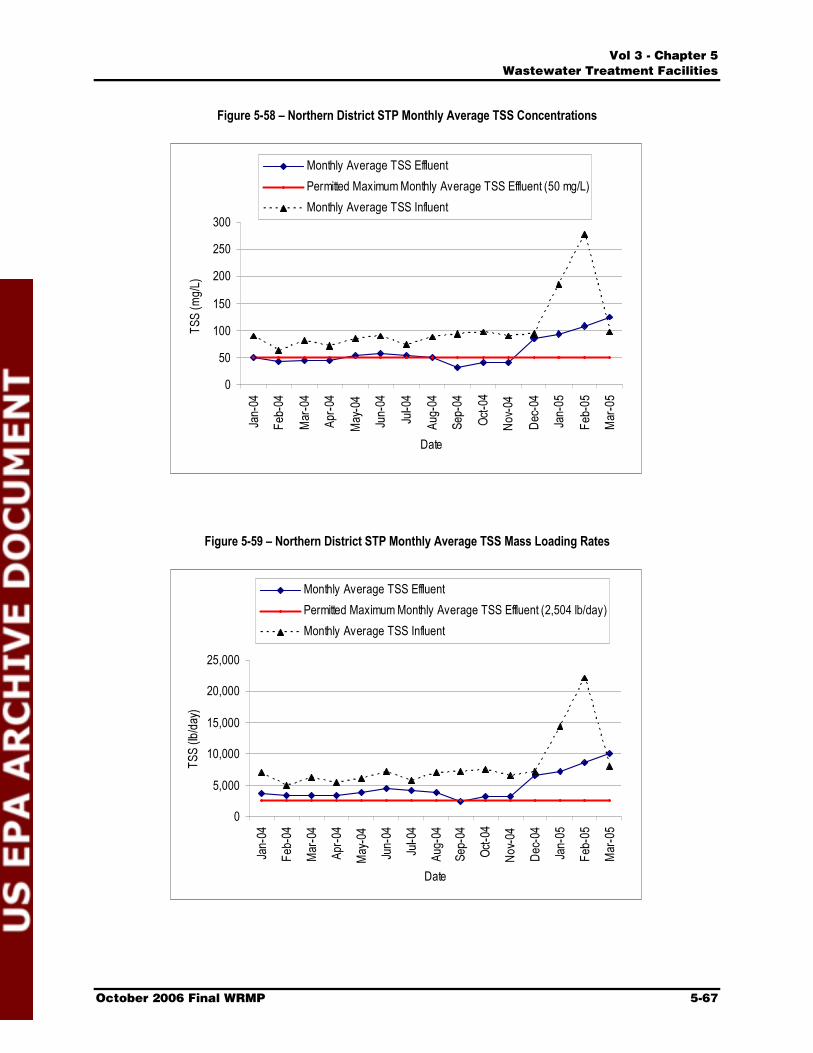
ʱ´ í ó ݸ¿°¬»® ë
É¿¬»©¿¬»® Ì®»¿¬³»²¬ Ú¿½·´·¬·»
ѽ¬±¾»® îððê Ú·²¿´ ÉÎÓÐ ëóêé
Figure 5-58 – Northern District STP Monthly Average TSS Concentrations
0
50
100
150
200
250
300
Date
Monthly Average TSS EffluentPermitted Maximum Monthly Average TSS Effluent (50 mg/L)Monthly Average TSS Influent
Figure 5-59 – Northern District STP Monthly Average TSS Mass Loading Rates
0
5,000
10,000
15,000
20,000
25,000
Date
Monthly Average TSS EffluentPermitted Maximum Monthly Average TSS Effluent (2,504 lb/day)Monthly Average TSS Influent
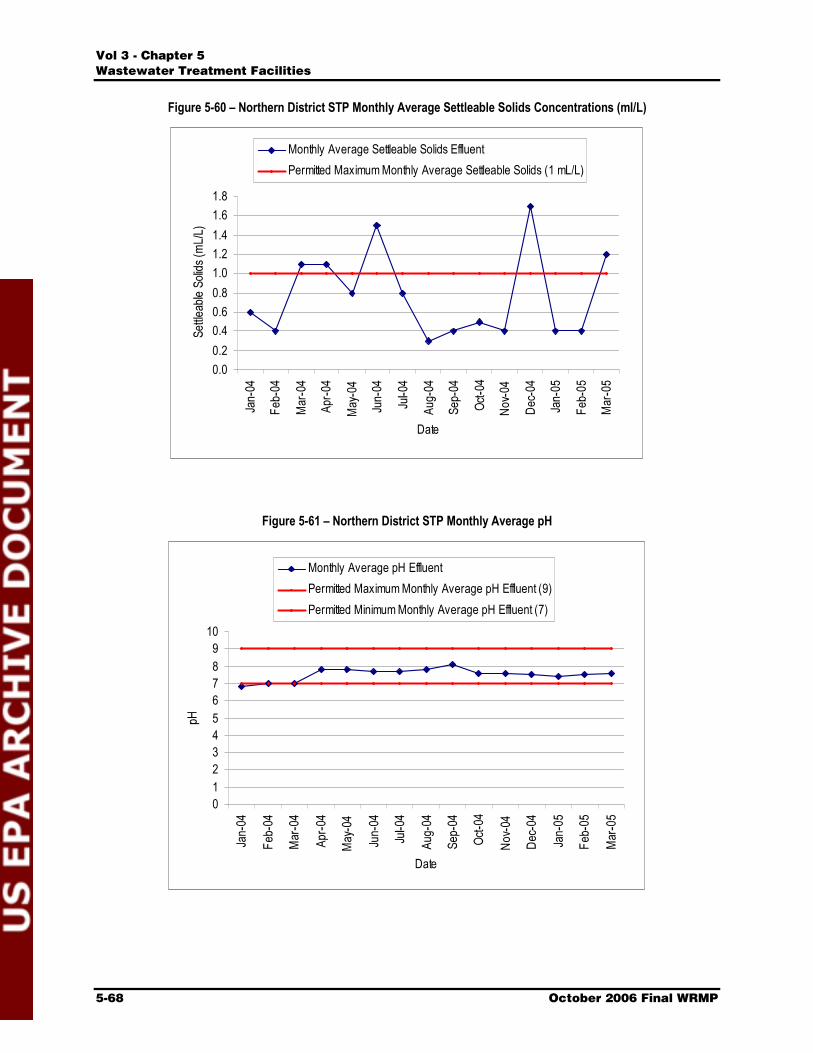
ʱ´ í ó ݸ¿°¬»® ë
É¿¬»©¿¬»® Ì®»¿¬³»²¬ Ú¿½·´·¬·»
ëóêè ѽ¬±¾»® îððê Ú·²¿´ ÉÎÓÐ
Figure 5-60 – Northern District STP Monthly Average Settleable Solids Concentrations (ml/L)
0.00.20.40.60.81.01.21.41.61.8
Date
Monthly Average Settleable Solids EffluentPermitted Maximum Monthly Average Settleable Solids (1 mL/L)
Figure 5-61 – Northern District STP Monthly Average pH
0123456789
10
Date
Monthly Average pH EffluentPermitted Maximum Monthly Average pH Effluent (9)Permitted Minimum Monthly Average pH Effluent (7)
ʱ´ í ó ݸ¿°¬»® ë
É¿¬»©¿¬»® Ì®»¿¬³»²¬ Ú¿½·´·¬·»
ѽ¬±¾»® îððê Ú·²¿´ ÉÎÓÐ ëóêç
5.7.3 Capacity Assessment Table 5-5 shows that the actual flows based on the WRMP flow monitoring and modeling are significantly less than the DMR-reported flows. However, the WRMP monitoring and modeling flow estimate (7.6 mgd) is still greater than the capacity of a single clarifier (roughly 6 mgd). Since only one clarifier has been in service, worse effluent quality would be expected than reported if the much greater DMR flows were correct. Therefore, the master plan monitored flow estimates are more reasonable than the DMR flows.
5.7.4 Recommended CIP The design capacity of the NDSTP is 12.0 mgd, without any primary clarifier redundancy. If redundancy is considered, then the capacity is 6.0 mgd, since there are only two primary clarifiers. The current estimated flow is 7.8 mgd, and the projected year 2025 future flow is 11.9 mgd. Neither of these flows exceeds the original design capacity; however, both exceed the existing capacity if redundancy is considered. Therefore, it is recommended that at least one additional primary clarifier be added to the system so that both current and future flows can be reliably treated even when one primary clarifier is taken off-line for maintenance, repairs, or other reasons.
The existing NPDES permit is based on a flow of 6 mgd. Since both current and future flows exceed this limit, an increased flow limit must be established. GWA has committed to extending the ocean outfall as part of the permit renewal for the NDSTP. The design of the outfall extension has been completed, and this project is proceeding. Rehabilitation of the influent grit removal system is also proceeding.
Although GWA has mentioned it is investigating repairs to the comminutor, replacing the comminutors with mechanically cleaned bar screens is recommended in order to remove materials from the liquid stream that could be a nuisance to the downstream processes, and costs for two are included in the CIP budget. Feasibility and evaluation of sizing, type, etc. should be included in the facilities plan evaluation.
After the ongoing modifications are completed, the aerated grit system should be evaluated to confirm its effectiveness. The ongoing modifications do not address the shortcomings of this type of grit removal systems that was originally designed and constructed in the 1970s. A project to install influent flow measurement equipment is currently proceeding, so no additional costs for this item are included in the CIP budget.
As previously mentioned, this facility should be considered for a centralized STP biosolids facility or alternatively, serve as one of two biosolids facilities, sharing this function with the Hagatna STP. Repair projects for the solids treatment facilities are being considered and costs for the rehabilitation of digesters and centrifuges, with sufficient capacity to treat solids from the other STPs are included in the CIP budget.
The CIP projects list includes an additional primary clarifier to provide redundancy for both current and future flows, new screenings removal equipment, and improvements to the solids handling facilities (as a separate project).
ʱ´ í ó ݸ¿°¬»® ë
É¿¬»©¿¬»® Ì®»¿¬³»²¬ Ú¿½·´·¬·»
ëóéð ѽ¬±¾»® îððê Ú·²¿´ ÉÎÓÐ
5.8 Inarajan STP 5.8.1 Introduction The Inarajan STP is a secondary wastewater treatment facility employing a four-cell aerobic lagoon treatment system. This STP is located in the southern part of the island in the Inarajan area. It was built in 1989, with a design capacity of 0.191 mgd. Effluent disposal is through percolation, so there is no requirement for an NPDES permit. Because there is no NPDES permit, flow and wastewater quality information was not available. Major unit processes include four aerated lagoons, three percolation basins, and six sludge drying beds. Additional equipment includes a weir box, two dosing chambers, a decant well, and portable pumps. Other on-site structures include rest rooms, a generator room, an office, and a laboratory.
Figure 5-62 presents a conceptual schematic process train flow diagram for the Inarajan STP. The general process description of this treatment plant, including liquid and solid streams, is as follows:
Liquid Stream: Raw influent from the influent pump station flows to four aerated lagoons via a 5-inch forcemain. The flow is designed to pass through the lagoons in series and exits the last cell to a weir box unit. The cells can also be operated in parallel. The facilities are designed such that any cell can be completely isolated for maintenance purposes. In the summer of 2005, three of the four cells were in operation. Each cell is aerated by floating mechanical surface aerators. The treated wastewater flows through the weir box to dosing chambers. A 60-degree V-notch weir is equipped with an ultrasonic level sensor to measure the influent flow rate (although the meter is not operational). The dosing chambers are designed to alternate flow into each percolation pond.
Solids Stream: Solids that accumulate in each lagoon are anaerobically stabilized in the lagoon. The stabilized solids are transferred to the decant well for thickening, where they are allowed to settle. The top layer of water is decanted back to cells 1 or 2, and the thickened waste sludge is pumped to the sludge drying beds. Dried sludge is raked and transported by trucks to the landfill.
Equipment/Process Out of Service: No influent flow meter Severe corrosion of the percolation distribution system
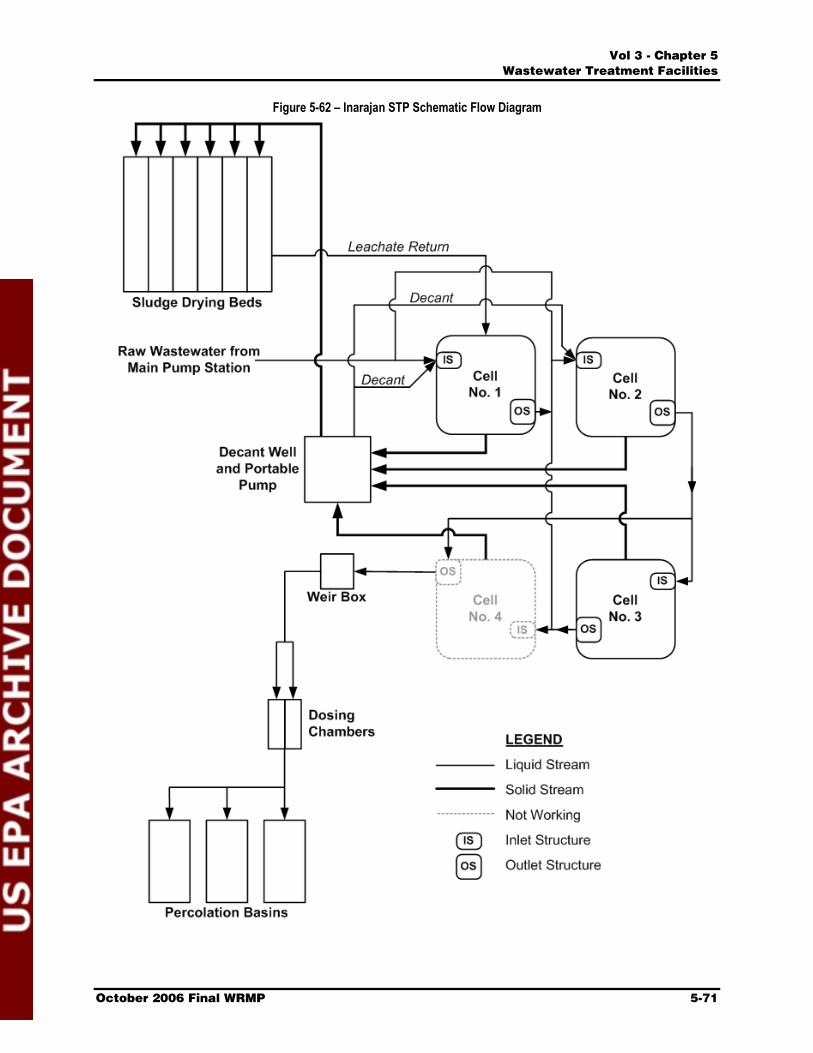
ʱ´ í ó ݸ¿°¬»® ë
É¿¬»©¿¬»® Ì®»¿¬³»²¬ Ú¿½·´·¬·»
ѽ¬±¾»® îððê Ú·²¿´ ÉÎÓÐ ëóéï
Figure 5-62 – Inarajan STP Schematic Flow Diagram

ʱ´ í ó ݸ¿°¬»® ë
É¿¬»©¿¬»® Ì®»¿¬³»²¬ Ú¿½·´·¬·»
ëóéî ѽ¬±¾»® îððê Ú·²¿´ ÉÎÓÐ
5.8.2 Wastewater Characteristics There are no DMRs for Inarajan STP and no plant data available. It is recommended that GWA perform regular testing on influent and effluent flow samples to monitor the treatment process and determine long-term capacity limits.
5.8.3 Capacity Assessment The flow monitoring and modeling estimates indicate that the treatment capacity of the lagoons is much greater than current flows and should be sufficient for future flows.
5.8.4 Recommended CIP The design capacity of the Inarajan STP is 191,000 gpd. The consultant team analysis estimated a capacity of 176,000 gpd based on the lagoons (without redundancy) and a disposal capacity of 64,000 gpd based on percolation testing performed for the WRMP. The design criteria for the facility, including the percolation basins, were not available. To verify the disposal capacity of the existing percolation system for the master plan, a few percolation tests were performed adjacent to the percolation basins (see Appendix 3D � Inarajan Percolation) since it was not possible to test within the percolation basins because of the rock fill. Results from the percolation tests suggest that the percolation basins should have a reliable disposal capacity range of 64,000 to 32,000 gpd. However, the estimated current flows are 70,000 gpd, and it appears that the effluent disposal system does not have a problem with disposing of this quantity.
This discrepancy may be a result of operational and construction factors. The clean water percolation tests described in Appendix 3D scale up to a capacity of 1.6 mgd. Because this was a small scale test, a more reliable but very conservative factor was applied to supply a continuous flow value of 64,000 to 32,000 gpd range. Depending on the actual flows and loading operations, the disposal capacity of the percolation basin will vary greatly. Also, the depth of the native soil where the percolation tests performed compared to the depth of soil in the actual percolation basins may be quite different and result in a greater capacity, since some of the soil appears to be removed and replaced with crushed rock. The recent percolation tests were performed on native soil adjacent to the disposal area because the percolation ring could not be installed in the rocks in the percolation basin. Boring logs for the aerated lagoons suggest a fairly shallow soil layer. Since no construction documents for the percolation basins were available, it is possible that a portion of the soil was removed and replaced by the crushed rock visible on top of the basins (rock depth is unknown). This could result in a much greater percolation rate within the basins than through the native soil adjacent to the basins. Regardless, it is recommended that full-scale stress testing of the disposal system be performed to determine an actual reliable disposal rate. For the purposes of the CIP planning, it is assumed that the disposal rate is at least 70,000 gpd since the system appears to dispose of the current flows without difficulty. The level of treatment received and required by the percolation basin should be a consideration in sizing of future basins.
The future flow projection for the Inarajan STP is 80,000 gpd and is within the limits of the existing system. For current and future flows, automatic mechanically cleaned screens would help reduce solids loading to the ponds and remove larger particles. In addition, the existing effluent disposal/distribution system requires rehabilitation and improvement. Costs for both these improvements were included in the CIP budget.
ʱ´ í ó ݸ¿°¬»® ë
É¿¬»©¿¬»® Ì®»¿¬³»²¬ Ú¿½·´·¬·»
ѽ¬±¾»® îððê Ú·²¿´ ÉÎÓÐ ëóéí
5.9 Pago-Socio STP The Pago-Socio STP was built by a developer to serve 16 homes and was dedicated to GWA for operation and maintenance. It is a Class II facility as designated by GEPA. It consists of a packaged aerated treatment unit and a series of six subsurface percolation pits. Currently, the aeration system is not operating. Since there is no NPDES permit required, flow and wastewater quality data were not available. We concur with GWA�s plan to convert this facility to a pump station site with delivery of pumped sewage to the Hagatna STP.
Pago Socio has a projected population of 127 people in 2025. Based on the WERI data, I estimate 64 properties in the service area, which at 4 people per property would be 256 people. If we assume a per capita peak flow of 400 gpcd (4:1 peaking factor), the pump station�s a firm capacity would need to be 50,000 to 100,000 gpd. About 4,000 ft of force main would be required to deliver the flow to the nearest sewer. In 2003, Guam constructed a pump station together with about 8000 ft of sewer and force main for a construction cost of $1.6 million. Inflated to 2007 at 5 percent annually yields a construction cost of $2,000,000. Additional factors would need to be added for contingency and other services as described in Volume 1, Chapter 15 � CIP Program.
Alternatives and Cost/Benefit Analysis It is beyond the purview of this master plan to do an extensive alternative analysis, however the following system wide recommendations can be made for subsequent consideration in specific preliminary engineering studies identified as the next phase of project development for a number of facilities.
5.9.1 Biosolids Handling Consolidation As noted above, solids are currently being transported to the NDSTP from the Agat-Santa Rita STP and the Baza Gardens STP facilities. The CIP takes into account the recommendation to continue this activity for these plants as well as the potential for others if an Island-wide study finds this to be a viable alternative. The NDSTP has sufficient land to accommodate this approach. Another alternative to be explored in an island-wide study should be to explore the Hagatna STP as a solids treatment site as well.
5.9.2 Conversion of Pago Scio STP The Pago Scio plant has been recommended as a site for a pumping station to carry sewage to an existing line and subsequently to the Hagatna STP. Costing for this alternative is being incorporated into the CIP.
5.9.3 Consolidation with Military Facilities Currently treated effluent from the Agat-Santa Rita STP combines with the U.S. Navy�s Apra Harbor WWTP (not part of the GWA system) effluent, and the combined flow is discharged to the ocean through the Tipalao Bay outfall. GWA has an executed agreement that establishes the conditions for discharge through the joint Navy outfall. GWA considered teaming with the U.S. Navy with a combined facility (Apra Harbor WWTP and Agat-Santa Rita STP) and proceeded to the point of completing design documents. However, this joint facility was not constructed and the future status of the project is unknown. Another on-going joint activity is at the NDSTP which receives wastewater from the U.S. naval facilities and Andersen Air Force Base.
ʱ´ í ó ݸ¿°¬»® ë
É¿¬»©¿¬»® Ì®»¿¬³»²¬ Ú¿½·´·¬·»
ëóéì ѽ¬±¾»® îððê Ú·²¿´ ÉÎÓÐ
Attempts at exploring other alternatives to incorporate joint wastewater collection and treatment have not been successful to date. The WRMP recommends that GWA continue the dialogue, particularly with persistent reports of build-up of military forces on the island.
As with alternative analysis tasks, the activity of cost/benefit ratio analysis is normally performed in the preliminary engineering phase of the recommended projects. This is in accord with general engineering practice.
5.10 Conclusions As reliable process flow measurements and process control analyses become available, it is suggested that the issue of plant capacities be revisited and adjusted to reflect the use of accurate actual process data. GWA has begun to institute training for new operational programs and intends to perform key process control measurements to facilitate operations. This valuable information can be used to develop accurate predictions of unit process capacity. Additionally, as a part of developing the Facilities Plans, stress testing of process units is highly recommended in order to develop an accurate actual capacity for existing systems. Currently, many of the facilities are either not set up for stress testing (single train process) or are undergoing repairs, and stress testing cannot be performed until the repairs are completed.
An island-wide plan for biosolids treatment and disposal should be prepared. Currently, each wastewater treatment facility has been designed to process the biosolids generated at the respective STP. The smaller facilities rely on sludge drying beds for drying biosolids before disposal. Drying beds are historically unreliable in tropical locations where seasonal and significant off-season rain events render them ineffective for sometimes lengthy periods of time. Also, drying beds require manpower for dried solids removal and maintenance. It is recommended that GWA consider centralizing biosolids treatment and disposal. Centralized biosolids processing at both Northern District STP and Hagatna STP, or at NDSTP alone, would be efficient and effective. Although this approach would require transporting sludge from the smaller facilities to these larger treatment plants, trucking of sludge is currently performed for many facilities and the anticipated volumes are manageable.
Although the NDSTP has sufficient land on which to create a single biosolids processing facility for the island, having two facilities provides more flexibility and reliability. Also, because of the future flow projections for Hagatna STP, a significant amount of trucking to NDSTP would be required if it were the only solids processing facility. Stabilization (aerobic digestion) and/or gravity thickening could be performed at the smaller facilities to reduce the transported volumes.
Since the beginning of the WRMP effort, GWA has made substantial progress in repairs and in operations and maintenance of the wastewater treatment facilities. GWA has awarded the Hagatna STP rehabilitation project, made staff changes to improve operations, and, more recently, has begun to gear up for process control by acquiring sampling equipment and formulating a training program. Since much of the laboratory data analyzed by the GWA lab, they have a current contract with MWH Labs to review the laboratory procedures. This has also caused GWA to carefully document the step-by-step procedures used in the analyses. In addition to these efforts, more defined facilities plans or preliminary engineering reports will be required to evaluate, assess, and initiate the recommendations of the WRMP.

ʱ´ í ó ݸ¿°¬»® ë
É¿¬»©¿¬»® Ì®»¿¬³»²¬ Ú¿½·´·¬·»
ѽ¬±¾»® îððê Ú·²¿´ ÉÎÓÐ ëóéë
5.11 Recommendations Because of the insufficient capacity of the Agat-Santa Rita STP, inability to meet NPDES permit requirements, poor condition of the equipment and facilities, and aging of the existing facilities, it is recommended that GWA consider a new facility in order to meet the capacity demand of current flows as well as provide for the future flows.
The 8-mgd capacity of the Hagatna STP is sufficient for the existing flows; however, it would be insufficient for future flow projections thus one additional parallel primary clarifier is recommended to provide reliable treatment for the 2025 flow projections and it is included in the CIP recommendations.
The screenings facilities located at the influent pumping station are no longer functional, so new facilities to provide screenings and also facilities for grit removal should be considered to remove these undesirable elements from the flow stream. Because of its age, current condition, and the difficulty of operating the Baza Gardens STP, it is recommended that a completely new facility be considered. It is recommended that the existing Umatac-Merizo STP disposal system be stress-tested to establish a firm disposal capacity to confirm that it can be operated at a zero discharge mode. There are several recommendations associated with the NDSTP which is the largest of GWA�s treatment facilities. Among them are: - The addition of at least one primary clarifier so that both current and future flows
can be reliably treated even while one primary is taken off-line for maintenance, repairs, or other reasons. Pending plans for military expansion may dictate that two additional units may be necessary to meet future loads and provide redundancy.
- It is also recommended that GWA consider installation of mechanically cleaned bar screens in order to remove materials from the liquid stream that could be a nuisance to the downstream processes. After the ongoing modifications are completed, the aerated grit system should be evaluated to confirm its effectiveness.
- Complete ongoing expansion and refurbishing of existing treatment units to allow this facility to be a regional site for processing biosolids from the NDSTP tributary area as well as imported solids from other island facilities.
A recommendation for the Inarajan STP is to provide mechanically cleaned bar screens to remove large materials from the influent.
GWA has determined that Pago Socio facility will be converted to a pump station site with delivery of pumped sewage to the Hagatna STP.
5.12 CIP Impacts A complete listing of wastewater related CIP projects is featured in Volume 3, Chapter 9 � Recommended Wastewater CIP. The list shows each separate project summary and will act as a record for tracking details for GWA personnel as each item becomes defined over time. Major project categories include:
Agat-Santa Rita STP replacement
Hagatna STP add one parallel primary clarifier
Baza Gardens STP replacement
ʱ´ í ó ݸ¿°¬»® ë
É¿¬»©¿¬»® Ì®»¿¬³»²¬ Ú¿½·´·¬·»
ëóéê ѽ¬±¾»® îððê Ú·²¿´ ÉÎÓÐ
Umatac-Merizo STP disposal system stress-test
Northern District STP: - Addition of at possibly two primary clarifiers - Addition of mechanically cleaned bar screens - Aerated grit system evaluation and possible refurbishing or replacement - Complete refurbishing biosolids processing treatment units
Inarajan STP screenings improvements Pago Socio STP conversion to a pump station site