opportunities for demand response in wastewater treatment facilities – feasibility study · ·...
TRANSCRIPT

Design & Engineering Services
Opportunities for Demand Response in Wastewater Treatment Facilities – Feasibility Study DR 06.04 Draft Report
Prepared by:
Design & Engineering Services, Customer Services Division Southern California Edison
March, 2007

Acknowledgements
Southern California Edison’s Design & Engineering Services (D&ES) group is responsible for this project with collaboration with Tariff & Program Services (TP&S). It was developed as part of Southern California Edison’s Demand Response, Emerging Markets and Technologies program under internal project number DR 06.04. BacGen Technologies, Inc. was the primary subcontractor on this project with guidance by D&ES project manager Roger Sung and with overall guidance and management from Carlos Haiad of D&ES and Lauren Pemberton of TP &S. For more information on this project, contact [email protected].
Disclaimer
This report was prepared by Southern California Edison (SCE) and funded by California utility customers under the auspices of the California Public Utilities Commission (CPUC). Reproduction or distribution of the whole or any part of the contents of this document without the express written permission of SCE is prohibited. This work was performed with reasonable care and in accordance with professional standards. However, neither SCE nor any entity performing the work pursuant to SCE’s authority make any warranty or representation, expressed or implied, with regard to this report, the merchantability or fitness for a particular purpose of the results of the work, or any analyses, or conclusions contained in this report. The results reflected in the work are generally representative of operating conditions; however, the results in any other situation may vary depending upon particular operating conditions.

Opportunities for Demand Response in Wastewater Treatment Facilities – Feasibility Study
ABBREVIATIONS AND ACRONYMS
AL Aerated Lagoon – Facility type whereby the secondary treatment is conducted in earthen basins (lined or non-lined), containing a mixture of suspended bacteria and wastewater. Aerated lagoons are typically loaded at a lower rate (per volume of basin) than activated sludge basins. Aerated lagoons are traditionally aerated by mechanical aerators, however, diffused aeration systems are now also available in the market place.
ASP Activated Sludge Plant – Facility type whereby the secondary treatment is conducted in constructed basins (typically concrete or metal), containing a mixture of suspended bacteria and wastewater. The process is mainly aerobic, whereby process air is provided by diffused aeration or mechanical aerators.
BOD Biological Oxygen Demand
DO Dissolved Oxygen
DOC Department of Corrections
DR Demand Response
hp Horsepower
IC Internal Combustion
kW Kilowatt
LACSD Los Angeles County Sanitation District
Mgd Million gallons per day
PLC Programmable Logic Controller
PV Photovoltaic
SCADA Supervisory Control and Data Acquisition
SCE Southern California Edison
TF Trickling Filter – Facility type with fixed film bacteria. Wastewater is typically pumped up to and distributed at the top of the media column. Air to supply oxygen to the bacteria passes through the media column through natural convective ventilation or through forced air (supplied by fans at the bottom of the column).
VFD Variable Frequency Drive
WwTF Wastewater Treatment Facility
1 Southern California Edison Design & Engineering Services March 2007

Opportunities for Demand Response in Wastewater Treatment Facilities – Feasibility Study
CONTENTS EXECUTIVE SUMMARY _______________________________________________ 3
INTRODUCTION ____________________________________________________ 7
RESULTS _________________________________________________________ 9 Audit Survey Forms................................................................9 Results of the Phone Survey and Data Analysis...........................9 Results of Site Surveys ...........................................................9
Michelson Drive Wastewater Treatment Facility (WwTF), Irvine Ranch Water District ............................................9
Los Alisos, Irvine Ranch Water District ...............................10 City of San Bernardino Municipal Water Department WwTF....10 Los Angeles County Sanitation District, San Jose Creek
WwTF .......................................................................10 Las Virgenes WwTF, Calabasas..........................................11 Carpinteria WwTF............................................................11 Palm Springs WwTF .........................................................12
Potential Sites for Feasibility Study .........................................12 Realistic Strategies...............................................................13 Potential Market Size ............................................................13 Barriers for Implementation...................................................14
SUMMARY AND CONCLUSIONS_______________________________________ 15
APPENDIX A_____________________________________________________ 16
APPENDIX B _____________________________________________________ 20
TABLES Table 1. Phone Survey Results ................................................10 Table 2 Respondent Remarks Pertinent to Phone Survey Results .11
2 Southern California Edison Design & Engineering Services March 2007

Opportunities for Demand Response in Wastewater Treatment Facilities – Feasibility Study
EXECUTIVE SUMMARY
This report addresses the feasibility of applying peak demand response (DR) strategies at wastewater treatment facilities (WwTF). In order to evaluate the feasibility of DR opportunities in wastewater facilities, the following tasks were performed:
• Develop an audit survey form specific to wastewater facilities
• Conduct a phone survey and perform data analysis
• Conduct site visits
• Identify potential wastewater facilities that could be modeled for a feasibility study
• Identify strategies for demand response management
• Identify the potential market size in SCE’s service territory
• Identify barriers for DR implementation
There were 16 WwTF respondents whose information was analyzed for the purposes of this report. Six of these respondents were further evaluated through a site visit, additional data collection, design calculations, and/or an extended phone interview. The main conclusions of the report are as follows:
• Twelve facilities said they had no DR strategies in place at all; three facilities responded that they had ‘manual’ control strategies; and one facility had an automated DR strategy.
• One of the facilities has an extensive automated energy management system, which is clearly the result of years of gradual planning, analysis and implementation by a team of experts. Initial analysis of the sites surveyed over the phone, as well as the sites that were visited, shows that it is likely that a full system analysis is required to determine what strategy would be best suited for each individual facility in order to reduce peak power demand.
• A full system analysis is likely to include a complete inventory of all (large) motors at the facility, the operational duties throughout the day, seasonal changes, a site walk-through and operator interview , as well as a full analysis of the electric rate schedules.
• It is likely that a case-by-case analysis is required for each individual site to find the best demand response (DR) measures.
• It is likely that, for a DR strategy to be successful, a Programmable Logic Controller /Supervisory Control and Data Acquisition (PLC/SCADA) system is required for execution of the DR strategy in order to assure that targeted motors are not switched on during peak demand periods.
• Most facilities with no DR strategies claimed that restriction in process requirements kept them from implementing such strategies. The availability of incentives would not persuade them to implement DR strategies.
3 Southern California Edison Design & Engineering Services March 2007

Opportunities for Demand Response in Wastewater Treatment Facilities – Feasibility Study
• Each of the five facilities that responded ‘yes’ to the question whether an incentive payment would help them implement a DR measure, already had a strategy in mind that would reduce power during peak demand periods.
• Potential market size for DR strategies in wastewater treatment facilities was estimated based on the following assumptions:
o Of the 120 ‘suitable’ wastewater facilities in SCE territory, using extrapolation of current survey data, 19% of these facilities could conceivably be interested in demand response
o The median Peak Demand of the 120 facilities (as listed in the SCE data base) is 510 kW and the average reduction in Peak Demand (i.e. during peak demand hours, noon – 6 pm) is 20%.
Therefore, the estimated total market potential for Peak Demand Reduction Measures is 510 kW x 19% of facilities x 20% reduction x 120 facilities = 2,326 kW.
Given that the on-peak days are from 1st Sunday in June to 1st Sunday in October (a total of 4 months or 84 days), noon to 6:00 p.m., (weekends and holidays are excluded), the total on-peak hours in a given year is 84 x 6 = 504 hours. The total potential energy savings per year = 504 hours x 2,326 kW = 1,172,304 kWh/yr.
4 Southern California Edison Design & Engineering Services March 2007

Opportunities for Demand Response in Wastewater Treatment Facilities – Feasibility Study
INTRODUCTION Wastewater treatment facilities (WwTF) consume a large amount of power. The nature of the treatment process typically demands a high power usage during the day, with demands trailing off during the night and early morning hours. The main reasons for this profile are:
• Most treatment facilities have a diurnal load pattern, with a large peak after the morning ‘rush’ (when people get out of bed) and a smaller load peak in the early evening when most people get home from work. Depending on the retention time in the sewer and pretreatment stages, the peak in power demand usually starts early afternoon (noon to 12:00 p.m.) and reaches its lowest demand in the early morning hours (5:00 to 7:00 a.m.).
• Large facilities typically have around-the-clock staffing; however, medium and small facilities tend to have daytime staffing only. As a result, a number of power-intensive processes, such as sludge centrifuging, sludge decant return and sand filter backwash occur during peak demand periods.
This report addresses the feasibility of applying peak demand response (DR) strategies at wastewater facilities.
Examples of demand response strategies are:
• Making operational changes, such as:
o Switching off aeration in an aerobic digester system during peak demand hours.
o Switching off aerators in a lagoon system.
o Flow balancing to reduce organic loading in the aeration basin during peak hours.
o Chemical dosing in the primary settlement to reduce power demand during peak hours.
o Running sludge dewatering equipment during non-peak hours.
o Returning sludge liquors during low-load hours.
• Shifting to a different power source during peak demand hours (using auxiliary power such as internal combustion (IC) engines using methane or (digester) biogas, storage batteries, solar/wind).
In order to evaluate the feasibility of DR opportunities in WwTF, the following tasks were performed:
• Develop an Audit Survey Form
• Conduct a phone survey and data analysis
• Conduct site visits
• Identify potential wastewater facilities that can model for a feasibility study
• Identify realistic and useful strategies for peak demand response (DR) management
• Identify the potential market size in SCE territory
• Identify barriers for implementation
5 Southern California Edison Design & Engineering Services March 2007

Opportunities for Demand Response in Wastewater Treatment Facilities – Feasibility Study
RESULTS Given the scope of the project, a comprehensive database containing information such as population served, flow rate and power consumption pertaining to the entire SCE wastewater plant customer base was not available. BacGen conducted a database research for small and medium size facilities in 2002-03. This database contains 68 facilities, within SCE territory, varying in size between 0.02 and 16 Mgd.
SCE made available a database of current water and wastewater customer accounts with demand charge of 300 kW and greater. In this database, there are approximately 60 wastewater accounts, with energy consumption between about 50,000 and 27,000,000 kWh/yr. There was some overlap between the 2002-03 and the current databases; therefore, the approximate number of wastewater customer accounts can reasonably assume to be 120.
To obtain a statistically justifiable result, the target was to reach at least twelve of the SCE wastewater customer base (10%)with questions pertinent to peak demand response (DR) strategies.
AUDIT SURVEY FORMS An audit survey form was developed (see Appendix A). This survey was the basis for interviewing the selected facilities.
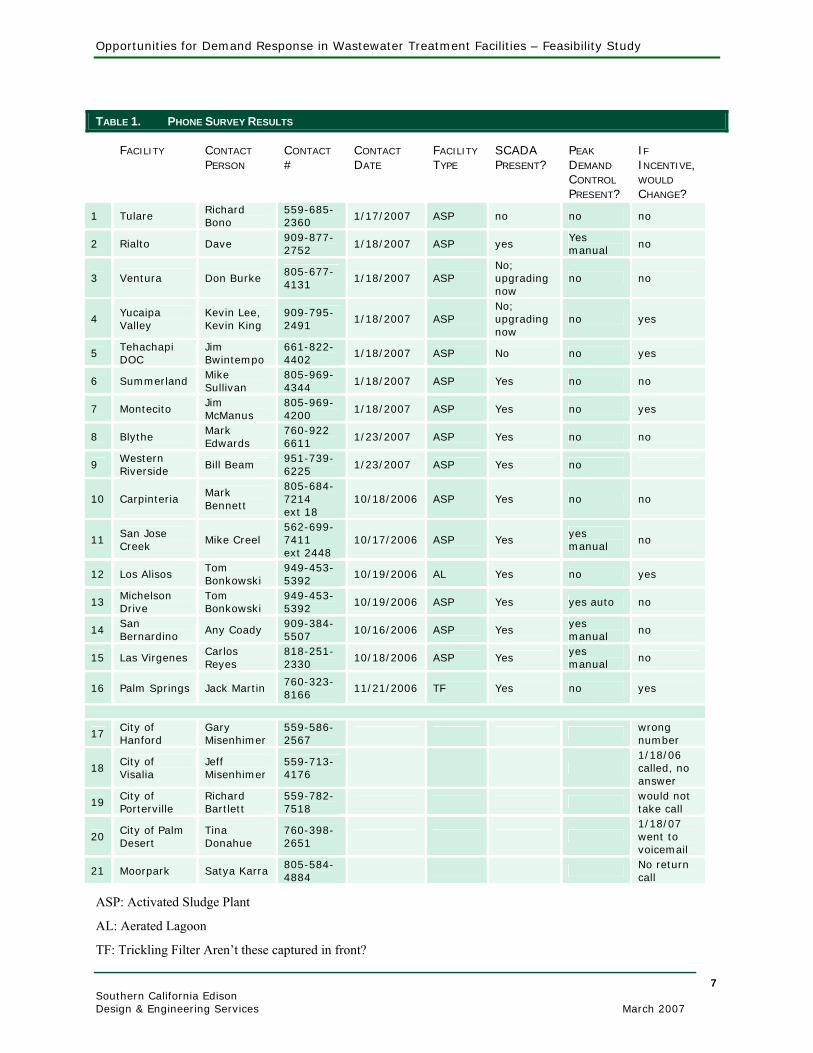
RESULTS OF THE PHONE SURVEY AND DATA ANALYSIS The results of the phone survey can be found in Tables 1 and 2.
6 Southern California Edison Design & Engineering Services March 2007
Opportunities for Demand Response in Wastewater Treatment Facilities – Feasibility Study
TABLE 1. PHONE SURVEY RESULTS
FACILITY CONTACT
PERSON CONTACT
# CONTACT
DATE FACILITY
TYPE SCADA PRESENT?
PEAK
DEMAND
CONTROL
PRESENT?
IF
INCENTIVE, WOULD
CHANGE?
1 Tulare Richard Bono
559-685-2360
1/17/2007 ASP no no no
2 Rialto Dave 909-877-2752
1/18/2007 ASP yes Yes manual
no
3 Ventura Don Burke 805-677-4131
1/18/2007 ASP No; upgrading now
no no
4 Yucaipa Valley
Kevin Lee, Kevin King
909-795-2491
1/18/2007 ASP No; upgrading now
no yes
5 Tehachapi DOC
Jim Bwintempo
661-822-4402
1/18/2007 ASP No no yes
6 Summerland Mike Sullivan
805-969-4344
1/18/2007 ASP Yes no no
7 Montecito Jim McManus
805-969-4200
1/18/2007 ASP Yes no yes
8 Blythe Mark Edwards
760-922 6611
1/23/2007 ASP Yes no no
9 Western Riverside
Bill Beam 951-739-6225
1/23/2007 ASP Yes no
10 Carpinteria Mark Bennett
805-684-7214 ext 18
10/18/2006 ASP Yes no no
11 San Jose Creek
Mike Creel 562-699-7411 ext 2448
10/17/2006 ASP Yes yes manual
no
12 Los Alisos Tom Bonkowski
949-453-5392
10/19/2006 AL Yes no yes
13 Michelson Drive
Tom Bonkowski
949-453-5392
10/19/2006 ASP Yes yes auto no
14 San Bernardino
Any Coady 909-384-5507
10/16/2006 ASP Yes yes manual
no
15 Las Virgenes Carlos Reyes
818-251-2330
10/18/2006 ASP Yes yes manual
no
16 Palm Springs Jack Martin 760-323-8166
11/21/2006 TF Yes no yes
17 City of Hanford
Gary Misenhimer
559-586-2567
wrong number
18 City of Visalia
Jeff Misenhimer
559-713-4176
1/18/06 called, no answer
19 City of Porterville
Richard Bartlett
559-782-7518
would not take call
20 City of Palm Desert
Tina Donahue
760-398-2651
1/18/07 went to voicemail
21 Moorpark Satya Karra 805-584-4884
No return call
ASP: Activated Sludge Plant
AL: Aerated Lagoon
TF: Trickling Filter Aren’t these captured in front?
7 Southern California Edison Design & Engineering Services March 2007

Opportunities for Demand Response in Wastewater Treatment Facilities – Feasibility Study
TABLE 2. RESPONDENT REMARKS PERTINENT TO PHONE SURVEY RESULTS
FACILITY REMARKS 1 Tulare Process requirements prevent shutting off motors
2 Rialto None
3 Ventura We have to keep all motors running because of process demands
4 Yucaipa Valley We are thinking of installing variable frequency drives (VFD’s) 5 Tehachapi DOC We are thinking of installing variable frequency drives 6 Summerland Process requirements prevent shutting off motors
7 Montecito Shut down digester blower during peak demand, more VFD's would be useful, auto DO control in aeration basin is switched off due to technical problems
8 Blythe Drives on blowers and valves automated already
9 Western Riverside
None
10 Carpinteria Could possibly switch off digester aeration several hours per day; auxiliary power not in use due to restriction in air quality permits
11 San Jose Creek Use chemical dosing to reduce peak demand 12 Los Alisos install solar mixers to reduce peak demand
13 Michelson Drive
Sophisticated peak demand control already in place; flow balancing; shifting to different power source disadvantageous because the SCE stand-by demand charges for auxiliary power are too high to make this economically feasible
14 San Bernardino Recently installed two cogen IC engines, has a choice of using biogas or methane for engine driven pumps
15 Las Virgenes Auxiliary power not in use due to restrictions in air quality permits 16 Palm Springs have a choice of using electricity or methane for trickling filter pumps
Tables 1 and 2 show that there were sixteen respondents with information that can be analyzed for the purposes of this report. The main conclusions were as follows:
• Of sixteen respondents, fourteen represented activated sludge plants (ASP), one was an aerated lagoon (AL) and one was a trickling filter (TF) facility.
• Twelve Facilities had a SCADA (Supervisory Control and Data Acquisition ) system for motor control and plant management, two facilities had no SCADA and two facilities were in the process of implementing a SCADA system.
• Twelve facilities had no peak demand response (DR) strategies in place at all; three facilities responded that they had ‘manual’ control strategies such as preventing large motors to switch on during peak demand periods. Only one facility had an automated peak demand control strategy that was fully automated and integrated in the SCADA system.
• Most facilities with no DR strategies in place claimed that restriction in process requirements kept them from implementing such strategies. Some facilities responded that they had already done as much as they could with respect to control strategies, such as adding variable frequency drives (VFDs) on motors. One facility responded that it had implemented dissolved Oxygen (DO) control in the aeration basin but due to technical difficulties, this was no longer in good working order. Two facilities responded they were considering installing additional VFDs to reduce peak demand charges.
• The facilities that responded ‘yes’ to the question whether an incentive payment would help them implement DR strategies, already have a strategy in mind that would reduce power during peak demand periods:
8 Southern California Edison Design & Engineering Services March 2007

Opportunities for Demand Response in Wastewater Treatment Facilities – Feasibility Study
o Yucaipa Valley and Tehachapi Department of Corrections are anticipating the installation of additional VFDs;
o Montecito wants to repair the automatic DO control system;
o Los Alisos (Lake Forest) is considering installing photovoltaic (solar powered) mixers to reduce peak power consumption;
o Palm Springs would like to use biogas for their pump station; however, air quality permit restrictions prevent them from implementing it.
• Of the facilities that responded ‘no’ to the question whether an incentive payment would help them implement DR strategies, most believed that they had already exhausted DR measures; therefore, process requirements are preventing them from implementation of additional measures, whether or not an incentive is available.
RESULTS OF SITE SURVEYS Because interpretation of the phone survey results is somewhat limited, five of the facilities were visited to obtain additional information.(See list in Table 1.) The results are as follows:
MICHELSON DRIVE WASTEWATER TREATMENT FACILITY, IRVINE RANCH WATER DISTRICT
This facility has screening, grit removal, fine bubble diffused plugflow aeration lanes with Turblex® check if it’s brand name blowers, secondary clarifiers and chlorine disinfection. All biosolids are pumped to Orange County Sanitation District for processing. The effluent is used as reclaimed water for various purposes by a large horsepower effluent pump station fed through a forced main. Results of the survey questions can be found in Appendix B.
Of all the facilities that were interviewed, this facility was the most advanced with respect to its ability to use auxiliary power and for managing peak power demand automatically with a SCADA system. Auxiliary power is not currently in use because SCE’s current stand-by charges to backup auxiliary power are too expensive to make this economically feasible.
All large motors included in the site’s energy conservation management system are connected to a Supervisory Control and Data Acquisition (SCADA) system. The SCADA system takes the SCE rate schedules into account. Each motor can be operated to favor a certain rate schedule.
Another feature at this facility is the primary effluent (aeration basin feed) equalization basin. Flow in excess of 12 Mgd is pumped into the equalization basin and every morning, starting at 6 am, is emptied. This results in a constant flow rate to the aeration basins and a relatively stable demand on the blower system, avoiding peaks in blower power demand. However, some additional power is used for pumping water to the equalization basins during the off-peak hours.
9 Southern California Edison Design & Engineering Services March 2007

Opportunities for Demand Response in Wastewater Treatment Facilities – Feasibility Study
LOS ALISOS, IRVINE RANCH WATER DISTRICT This is an aerated lagoon facility that consists of two aerated treatment lagoons and two aerated storage lagoons. The total aeration power is 585 hp (see Appendix B). The organic loading rate in the first two lagoons is similar to activated sludge treatment. Process requirements do not allow switching off the mechanical aerators during peak demand hours.
The best strategy to reduce peak power demand in the first two aerated lagoons is to reduce overall power consumption by replacing the mechanical aerators with diffused aeration. In the aerated storage lagoons, it may be possible to replace some of the mixing power during peak hours with photovoltaic (solar-powered) mixers.
CITY OF SAN BERNARDINO MUNICIPAL WATER DEPARTMENT WWTF This is a 26 Mgd facility with full nitrification/denitrification. (Detailed survey results appear in Appendix B.) Most of the flow, 23 Mgd, is treated in fine bubble aeration circular tanks. The remaining 3 Mgd goes to a mechanically aerated carousel. The sludge is anaerobically digested and the biogas is used to operate IC engine-driven motors or two co-gen engines. Supplemental methane gas is used if deemed cost-effective (determined on a daily basis).
The influent pump station, as well as the aeration blower system, has the ability to run on biogas (from the digesters), natural gas or electricity. Depending on cost (determined on a daily/weekly basis), the energy source with the lowest cost is usually selected. Recently, the facility installed two 750-kW co-gen engines, which were incentivized by SCE. The intended energy strategy was to generate power with the co-gen engines (which are more efficient than the IC engine-driven motors) and switch to electrical power for the inlet pump station and the blowers. New variable frequency drives are being installed on the blowers for more efficient operation. At the time of the interview, the co-gen engines were not operational due to mechanical problems. Biogas was used for the influent pump station and for one of the blowers.
LOS ANGELES COUNTY SANITATION DISTRICT, SAN JOSE CREEK WWTF This facility has two identical treatment facilities, separated by the highway; one on the east side (East facility) and one on the west side (West facility). Results of the site interviews for both facilities are included in Appendix B.
The East facility (57 Mgd) has covered primary sedimentation tanks and aeration basins with ceramic fine pore diffusers (Sanitaire). There are five parallel, four-pass serpentine aeration lanes (20 total). The air that is extracted from the primary tanks is pulled through the blowers causing air treatment to occur by default in the aeration basin (i.e. there is no additional power use for air treatment). There are three 1750-hp Roots dual vane blowers and two 900-hp Roots dual vane blowers (4160V). The West facility (37.5 Mgd) was built with the identical design configurations as in the East facility.
10 Southern California Edison Design & Engineering Services March 2007

Opportunities for Demand Response in Wastewater Treatment Facilities – Feasibility Study
Peak demand switching is prevented by limiting the SCADA system from automatically switching on or off motors, as required for control purposes. Therefore, there are conditions where motors are left on in the event they are needed again during the peak demand period. As a result, the DO control system appears to be unstable (although there are likely to be additional factors) and the DO setpoints are not maintained very well.
The East facility is, in effect, overloaded and therefore some organic load is removed in the primary tanks through chemical dosing, which reduces the organic load in the aeration basins. However, this is not a peak demand strategy as it is practiced around the clock.
LAS VIRGENES WWTF, CALABASAS This 9 Mgd facility has serpentine (three pass) aeration lanes with coarse/medium diffusers that are suspended at the end of a retractable ‘arm’ on the side of the basin (see Appendix B). This facility has three 900-hp Roots dual vane blowers and three 250-hp 5-stage Hoffman centrifugal blowers. These are connected to a SCADA/PLC automatic DO control system. The setpoint is maintained by the with relative accuracy.
Peak demand strategies are not in place at this facility and are not considered highly feasible due to process-related requirements. However, there are a number of energy conservation measures (such as retrofitting with fine pore diffusers) which, if installed, would noticeably reduce peak demand.
Auxiliary power is not in use due to restrictions in air quality regulations. The facility is only permitted to run diesel driven IC engines up to 200 hours per year.
CARPINTERIA WWTF This is a 1.6 Mgd facility with a dual pass aeration basin and fine pore diffusers. There are two 150-hp centrifugal blowers; one is typically in operation (see Appendix B). The primary and secondary waste sludge is digested in an aerobic digester and de-watered with a belt press (in operation approximately 4 hours per week). The aerobic digester is aerated using one 150-hp centrifugal blower.
When asked, the operator for this facility said that the digester aeration could be switched off, perhaps one to two consecutive hours, but not for the entire peak demand period. The current blower system is not suited for frequent switching. A possible alternative to the current blower system is the installation of a new, smaller positive displacement blower with variable frequency drive. Such a system will be better suited for turn-down, frequent switch-off and to deal with level (head loss) differences in the digester.
Auxiliary power is not in use due to restrictions in air quality regulations. The facility is only permitted to run the diesel driven IC engines for up to 200 hours per year.
11 Southern California Edison Design & Engineering Services March 2007

Opportunities for Demand Response in Wastewater Treatment Facilities – Feasibility Study
PALM SPRINGS WWTF No site visit was conducted for this facility. During an extended phone interview, the facility related the following information. This is an 11 Mgd facility with primary sedimentation and trickling filters. Sludge is digested in an anaerobic digester system. The facility has IC-engine driven pumps for the trickling filter pump station (with electrical back-up); however, it has lost the permit to operate these pumps with biogas. Therefore, these pumps are operated on natural gas when this is cheaper than buying power from SCE. The biogas is used for the internal digester boiler. The remainder gas is flared.
The facility might be able to reinstate biogas use in the pump station if it installs a gas cleaning device for the biogas (H2S and siloxanes removal). The current SCE Industrial Energy Efficiency Program does not offer incentives for gas cleaning devices. If there were another program available, this would help offset the cost of air treatment and enable the facility to reuse the energy from biogas.
POTENTIAL SITES FOR FEASIBILITY STUDY The following facilities may have an interest in conducting a feasibility study pertinent to demand response (DR) strategies:
• Los Alisos WwTF, Lake Forest – Currently, this facility is evaluating the implementation of two projects. The replacement of the mechanical aeration system with an automatically controlled diffused aeration system which would reduce power consumption during all times, including peak demand periods, and the installation solar mixers in the third and fourth treatment lagoons while connecting the existing mechanical aerators to the SCADA system to enable an active peak demand response control strategy. Incentive payments are potentially available under the SCE Industry Energy Efficiency (IEE) Program.
• San Jose Creek WwTF, Whittier – This facility has a well developed SCADA system. LACSD has an active energy management program and a full time energy manager. Implementation similar to the Michelson Drive (Irvine) facility may be possible at this LACSD facility. This facility is relatively large and it would take considerable time by a team of experts to make an inventory of all (large) motors at the facility, the operational uses and rate schedules, a strategy to reduce peak demand power for each motor, and implementation in the SCADA system.
• San Bernardino WwTF- This facility has a well developed SCADA system. Implementation similar to the Michelson Drive (Irvine) facility may be possible at this facility. Again, a full investigation would be required to identify potential strategies to reduce peak power.
• Las Virgines WwTF, Calabasas- This facility has a well developed SCADA system. Implementation similar to the Michelson Drive (Irvine) facility may be possible at this facility, after more detailed investigation.
12 Southern California Edison Design & Engineering Services March 2007

Opportunities for Demand Response in Wastewater Treatment Facilities – Feasibility Study
DEMAND RESPONSE STRATEGIES Based on the interviews and site visits, the following strategies have been identified to be realistic:
• An automatic motor control and management system, including rate schedules, implemented in the SCADA system;
• Flow balancing (provided storage tanks are available);
• Solar (PV) mixers in lagoon systems with low biological oxygen demand (BOD) loading;
• Reducing aeration in aerobic digesters during peak demand hours;
• Alternative power resources such as biogas internal combustion (IC) engines and photovoltaics (PV);
• Reducing overall power usage through energy conservation measures (such as automatic DO control or fine-pore diffused aeration retrofit), leading to reduced demand during peak hours.
POTENTIAL MARKET SIZE
It is assumed that the total municipal wastewater facility market segment can be characterized as follows:
o There are 120 ‘suitable’ wastewater facilities in SCE territory (generally, activated sludge, aerated lagoon or trickling filter facilities).
o Usable information was obtained for sixteen of those wastewater facilities.
o Using best judgment, eight of those show potential for further demand reduction.
o It is estimated that out of sixteen facilities, three facilities would be interested in implementing peak demand response measures (19%).
o Based on evaluations of the Lake Forest, Carpinteria and San Bernardino facilities, the average reduction in peak demand (i.e. during peak demand hours, noon – 6 pm) is 20%.
o The median peak demand of the 120 facilities (provided by the SCE database) is 510 kW.
o The estimated total market potential for peak demand reduction measures is 510 kW x 19% of facilities x 20 % reduction x 120 facilities = 2,326 kW.
o Given that the on-peak days are from 1st Sunday in June to 1st Sunday in October (a total of 4 months or 84 days), noon – 6 pm, (weekends and holidays are excluded), the total on-peak hours in a given year is 84 x 6 = 504 hours. The total potential energy savings per year = 504 hours x 2,326 kW = 1,172,304 kWh/yr.
13 Southern California Edison Design & Engineering Services March 2007

Opportunities for Demand Response in Wastewater Treatment Facilities – Feasibility Study
BARRIERS FOR IMPLEMENTATION The following barriers for the implementation of DR strategies have been identified as a result of the phone and site visit surveys:
• Process requirements/regulations;
• Facility staff’s lack of knowledge, understanding and expertise of the available technologies;
• The required capital for additional equipment, structures or programming;
• A strong belief that everything that can be done has already been done;
• Restrictions with respect to the use of auxiliary power (air quality requirements/regulations);
• Economical restrictions, such as the price of methane for use in IC engine driven motors or auxiliary power stand-by demand charges.
14 Southern California Edison Design & Engineering Services March 2007

Opportunities for Demand Response in Wastewater Treatment Facilities – Feasibility Study
SUMMARY AND CONCLUSIONS • The energy management system at the Michelson WwTF in Irvine is the result of
years of gradual planning, analysis and implementation by a team of experts. Initial analysis of the sites surveyed over the phone, as well as the sites that were visited, show that it is likely that a full system analysis would be required to determine what strategy would be best suited for each individual facility in order to reduce peak power demand. A full system analysis is likely to include a full inventory of all large motors at the facility, their operational duties throughout the day, seasonal changes, a site walk-through and operator interview and a full analysis of the electric rate schedules.
• It is likely that a case-by-case analysis is required to find the best peak demand measures for each individual site.
• It is likely that, for a DR strategy to be successful, a PLC/SCADA system must be installed (e.g., to make sure targeted motors are switched off during DR periods).
• Out of sixteen respondents, twelve facilities indicated that they had no peak demand response (DR) strategies in place at all; three facilities responded that they had ‘manual’ control strategies and only one facility had an automated DR strategy.
• Most facilities with no DR strategies claimed that restrictions in process requirements and air quality regulations inhibit implementing such strategies. The availability of incentives would not persuade them to implement DR strategies.
• Every one of the five facilities that responded ‘yes’ to the question whether an incentive payment would help them implement a DR strategy, already had a strategy in mind that would reduce power during peak demand periods.
15 Southern California Edison Design & Engineering Services March 2007

Opportunities for Demand Response in Wastewater Treatment Facilities – Feasibility Study
16 Southern California Edison Design & Engineering Services March 2007
APPENDIX A
SCE Peak Demand Strategies Feasibility Study Wastewater Facility Survey Form
SCE Customer Name:
Site Name
Site Street Address, City, State, Zip
Primary Contact and Title
Primary Contact Phone #
Fax #
Facility Type
Activated sludge Lagoon Other _________________________
Loading information
Average daily flow (Mgd):_________________________
Facility Design Capacity (Mgd):_____________________
Facility influent type: Municipal Industrial Agricultural Mixed
influent
mg/l or lbs/d*
effluent
mg/l or lbs/d*
permit
mg/l or lbs/d*
BOD or CBOD*
TSS
nitrification Y/N*
ammonia
*please delete

Opportunities for Demand Response in Wastewater Treatment Facilities – Feasibility Study
(Main) Treatment information
Primary Sedimentation Y/N # tanks________Volume/ea:_______________(g or cu ft)*
Secondary clarifiers Y/N # tanks________Volume/ea:_______________(g or cu ft)*
‘Extended aeration’ Y/N
# Main Treatment Basins/Lagoons:____________________________
System configuration (Series, parallel. Please provide sketch if possible):_______________________
Basin/lagoon # surface area depth Volume
(Main treatment) Aeration type
Mechanical Surface aerators (vertical shaft) # ______________ rating__________ hp
Rotor (horizontal shaft) # ______________ rating__________ hp
Other___________________ # ______________ rating__________ hp
Diffused Fine/medium bubble
Coarse bubble
Blower type Centrifugal # ______________ rating__________ hp
Positive Displacement # ______________ rating__________ hp
Typical air flow (cfm)_______________
D ischarge pressure (psi)_____________
(Main treatment) Aeration Control
Blowers: Timers
In let vane SCA DA/plc present Y/N______________
Variable speed control Dynamic DO control Y/N______________
M anual
Mechanical Timers Manual Variable Speed
Sludge Digestion
Tons of sludge produced (per day, please indicate % solids) ___________tons biosolids per day @ ____________% dry solids
Type of digestion: Aerobic Anaerobic #basins___________________
If anaerobic: Co-generation Y/N_____% of site electricity supply? ______ (go to last page)
17 Southern California Edison Design & Engineering Services March 2007

Opportunities for Demand Response in Wastewater Treatment Facilities – Feasibility Study
If aerobic, basin type: tanks sludge lagoons
system configuration (Series, parallel)?_______
basin # surface area or diameter depth Volume
Digester Aeration type
Mechanical Surface aerators (vertical shaft) # ________ hp__________
Rotor (horizontal shaft) # ___________ hp__________
Other___________________ # ___________ hp__________
Diffused Fine/medium bubble
Coarse bubble
Blower type Centrifugal # ________ hp__________
Positive Displacement # _________ hp__________
Typical air flow (cfm)__________
D ischarge pressure (psi)__________
Common air manifold with main treatment Y/N_________________________
Digester Aeration Control
Blowers: timers
In let vane SCA DA/plc present Y/N______________
Variable speed control Dynamic DO control Y/N______________
M anual
Mechanical timers
Variable Speed
M anual
18 Southern California Edison Design & Engineering Services March 2007

Opportunities for Demand Response in Wastewater Treatment Facilities – Feasibility Study
Peak Demand / Load Shedding Strategies
Have you ever considered, or are already practicing any of the following: Do you manually switch off aeration or auxiliary equipment during peak demand periods?
If YES what type of equipment. What frequency/duration?
If NO what are the barriers?
Automatic control to switch off aeration or auxiliary equipment during peak demand periods
If YES what type of equipment. What frequency/duration?
If NO what are the barriers?
Have you implemented operational strategies, like Sand filter back-wash, sludge liquor return, sludge processing equipment, to avoid high power use during peak time?
If YES, what strategies? If NO, what are the barriers?
Do you use Auxiliary Power to offset peak demand charges and power usage?
If YES, what type of auxiliary power?
If NO, what are the barriers?
Are you already a participant of one of the SCE Voluntary Load Shedding Programs?
If YES, how do you deal with voluntary black-outs?
19 Southern California Edison Design & Engineering Services March 2007

Opportunities for Demand Response in Wastewater Treatment Facilities – Feasibility Study
20 Southern California Edison Design & Engineering Services March 2007
APPENDIX B
SCE Customer Name Irvine Ranch Water District Site Name Michelson WwTF Address, City, Zip 3512 Michelson Drive, Irvine, CA 92612 Primary Contact, title Thom Bonkowski Phone # 949-453-5392 fax# 949-476-2854 email [email protected] Main Treatment Sludge Processing screening, grit removal primary sedimentation
6 parallel plugflow lanes, 5 # pockets per lane (1/2 size pocket anoxic, Sanitaire membrane discs (FBDA), Turblex dual vane 1# 500 hp and 3# 250 hp
All Biosolids (primary, secondary, scum removal, etc) is discharged to a trunk sewer and processed by the Orange County Sanitation District.
Secondary clarifiers chemical disinfection Peak Demand Strategies Do you manually switch off aeration or auxiliary equipment during peak demand periods? No, everything is automated Is there automatic control to switch off aeration or auxiliary equipment during peak demand periods We have an automated system in the SCADA that manages motor switching depending on SCE rate schedules.
Have you implemented operational strategies, like sand filter backwash, sludge liquor return, sludge processing equipment, to avoid high power use during peak time?
Yes we have an equalization basin for the primary effluent to enable constant flow through the aeration basins so that peak load in the AB does not coincide with peak electrical rates like at other facilities. Do you use Auxiliary Power to offset peak demand charges and power usage?
We used to but SCE changed the policy regarding Peak Demand Rate Schedules. Even if we use auxiliary power during certain months of the year we still get charged demand charges (>$10,000) so it is cheaper just to keep using SCE power. Are you already a participant of one of the SCE Voluntary Load Shedding Programs? No.

Opportunities for Demand Response in Wastewater Treatment Facilities – Feasibility Study
21 Southern California Edison Design & Engineering Services March 2007
SCE Customer Name Irvine Ranch Water District Site Name Los Alisos Address, City, Zip 22312 Muirlands Blvd, Lake Forest, CA 92630 Primary Contact, title Noah Sanchez Phone # 949-457-8870 fax# 949-457-8874 email [email protected] Main Treatment Sludge Processing screening
2 # aerated lagoons in series, 2# aerated storage lagoons, 1 # non-aerated storage lagoon
plate press for dredged sludge from storage lagoons
585 hp total power demand for surface aerators chemical disinfection Peak Demand Strategies Do you manually switch off aeration or auxiliary equipment during peak demand periods? No. Is there automatic control to switch off aeration or auxiliary equipment during peak demand periods No.
Have you implemented operational strategies, like sand filter backwash, sludge liquor return, sludge processing equipment, to avoid high power use during peak time?
No. Note: It would be BacGen's recommendation that the best way to reduce peak power in the first two lagoons is to reduce overall power. In the last aerated two lagoons, solar powered mixers may work to reduce peak demand. Do you use Auxiliary Power to offset peak demand charges and power usage?
No. Are you already a participant of one of the SCE Voluntary Load Shedding Programs? No.

Opportunities for Demand Response in Wastewater Treatment Facilities – Feasibility Study
22 Southern California Edison Design & Engineering Services March 2007
SCE Customer Name City of San Bernardino Water Dept Site Name San Bernardino WwTF Address, City, Zip 399 Chandler Place, San Bernardino, CA 92408 Primary Contact, title Andy Coady, Environmental Control Officer Phone # 909-384-5507 fax# 909-384-5268 email coady_an@ sbcitywater.org Diffused Aer. Syst Mechanical Aer Syst Sludge Processing 23 Mgd 3 Mgd gas engine driven influent pump station screening, aerated grit removal primary sedimentation primary sedimentation 3 units, FBDA, SCADA, no auto DO control. 2 roots dual vane engine driven and 2 roots electrical 750-hp blowers
anoxic tanks with mixers, 1 carousel, 2 125-hp mechanical aerators (vertical shaft)
anaerobic digesters; 2-750 kW co-generator engines installed in 2005
Secondary clarifiers
tertiary treatment elsewhere chemical disinfection Peak Demand Strategies Do you manually switch off aeration or auxiliary equipment during peak demand periods? No, the operation of the plant is driven by process demands Is there automatic control to switch off aeration or auxiliary equipment during peak demand periods No. Have you implemented operational strategies, like sand filter backwash, sludge liquor return, sludge processing equipment, to avoid high power use during peak time? No, the operation of the plant is driven by process requirements Do you use Auxiliary Power to offset peak demand charges and power usage?
We have engine driven influent pumps (with electrical back-up), engine driven blowers (with electrical back-up) and we installed 2 750 kW co-gen engines which are more efficient than the engine driven motors. Currently the co-gen is not in operation due to mechanical problems. Are you already a participant of one of the SCE Voluntary Load Shedding Programs? No.

Opportunities for Demand Response in Wastewater Treatment Facilities – Feasibility Study
23 Southern California Edison Design & Engineering Services March 2007
SCE Customer Name LACSD Site Name San Jose Creek, Whittier Address, City, Zip 1965 Workman Mill Road, Whittier, CA 90601 Primary Contact, title Michael Creel Phone # 562-699-7411 fax# 562-699-3368 email [email protected] System Configuration East West Sludge grit removal Y Y primary sedimentation Y Y Secondary clarifiers Y Y Chemical Disinfection Y Y
Aeration basins 5 basins, 4 lane serpentine
3 basins, 4 lane serpentine
blowers Roots dual vane Roots dual vane
All sludge is digested centrally at the Carson facility
3 1750-hp 3 1750-hp 2 900-hp
diffusers Sanitaire, ceramic disks
Sanitaire, ceramic disks
Peak Demand Strategies Do you manually switch off aeration or auxiliary equipment during peak demand periods? No, but there is a policy not to switch on large motors during noon-6pm. Is there automatic control to switch off aeration or auxiliary equipment during peak demand periods
No, the opposite: there is manual intervention with the blower control system to make sure they will not switch on during noon-6 pm. Blowers are not allowed to be switched on/off on 'remote' (automatically).
Have you implemented operational strategies, like Sand filter back-wash, sludge liquor return, sludge processing equipment, to avoid high power use during peak time?
We dose chemicals in the primary tanks to reduce load to the aeration basins but this is not just during peak times. Do you use Auxiliary Power to offset peak demand charges and power usage?
No. Are you already a participant of one of the SCE Voluntary Load Shedding Programs? No.

Opportunities for Demand Response in Wastewater Treatment Facilities – Feasibility Study
24 Southern California Edison Design & Engineering Services March 2007
SCE Customer Name Las Virgenes Municipal Water District Site Name Las Virgenes Address, City, Zip 4232 Las Virgenes Road, Calabasas, CA 91302 Primary Contact, title Carlos Reyes, Operations Manager Phone # 818-251-2330 fax# 818-251-2309 email [email protected] Treatment Train Main Treatment Sludge Processing screening, grit removal primary sedimentation 2 basins, 3 pass serpentine, Coarse/medium diffused aeration. 3 900-hp Roots dual vane blowers and 2 250-hp Hoffman centrifugal
Biosolids are pumped to a near-by compost facility
Secondary clarifiers
sand filter chemical disinfection Peak Demand Strategies Do you manually switch off aeration or auxiliary equipment during peak demand periods? We make sure no big motors are switched on. Is there automatic control to switch off aeration or auxiliary equipment during peak demand periods No.
Have you implemented operational strategies, like sand filter backwash, sludge liquor return, sludge processing equipment, to avoid high power use during peak time?
There is an equalization basin in front of the sand filter but this is not operated to favor reducing peak demand. Do you use Auxiliary Power to offset peak demand charges and power usage?
No. Are you already a participant of one of the SCE Voluntary Load Shedding Programs? No.

Opportunities for Demand Response in Wastewater Treatment Facilities – Feasibility Study
25 Southern California Edison Design & Engineering Services March 2007
SCE Customer Name Carpinteria Sanitary District Site Name Carpinteria WwTF Address, City, Zip 5300 6th St, Carpinteria, CA 93013 Primary Contact, title Mark Bennett, Treatment Supervisor Phone # 805-684-7214 fax# 805-566-6599 email [email protected] Treatment Train Main Treatment Sludge Processing screening, grit removal belt press primary sedimentation aerobic digester
FBDA dual pass aeration basin, 2 150-hp centrifugal blowers
1 150-hp centrifugal blower, coarse diffusers
Secondary clarifiers land application chemical disinfection Peak Demand Strategies Do you manually switch off aeration or auxiliary equipment during peak demand periods? We try to make sure that big motors are not switched on during noon- 6 pm. Automatic control to switch off aeration or auxiliary equipment during peak demand periods There is no automatic control pertinent to peak demand strategies.
Have you implemented operational strategies, like sand filter backwash, sludge liquor return, sludge processing equipment, to avoid high power use during peak time? No, there is a day shift only and limited opportunity for such strategies. Do you use Auxiliary Power to offset peak demand charges and power usage?
This is no longer allowed due to air quality permit limitation (max 200 hours per year). Auxiliary power can be used for emergencies only. Are you already a participant of one of the SCE Voluntary Load Shedding Programs? No.