chapter 7 sampling distributionschapter 7 sampling distributions 7.3 sample means. learning...
TRANSCRIPT

The Practice of Statistics, 5th Edition
Starnes, Tabor, Yates, Moore
Bedford Freeman Worth Publishers
CHAPTER 7Sampling Distributions
7.3
Sample Means
Learning Objectives
After this section, you should be able to:
The Practice of Statistics, 5th Edition 2
FIND the mean and standard deviation of the sampling distribution
of a sample mean. CHECK the 10% condition before calculating the
standard deviation of a sample mean.
EXPLAIN how the shape of the sampling distribution of a sample
mean is affected by the shape of the population distribution and the
sample size.
If appropriate, use a Normal distribution to CALCULATE
probabilities involving sample means.
Sample Means
The Practice of Statistics, 5th Edition 3
The Sampling Distribution of
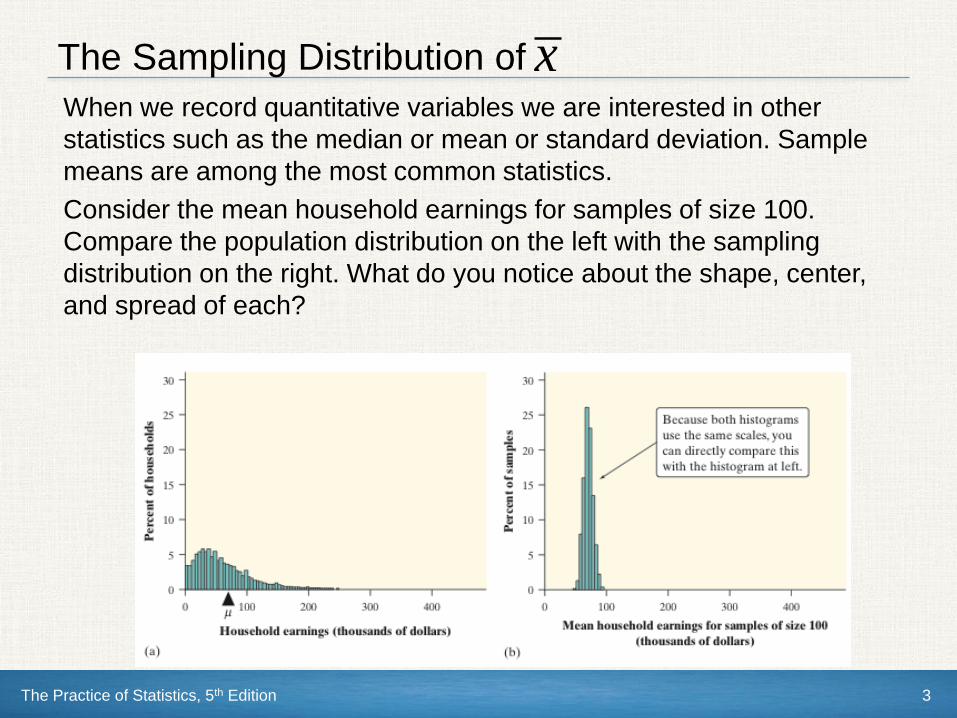
When we record quantitative variables we are interested in other
statistics such as the median or mean or standard deviation. Sample
means are among the most common statistics.
Consider the mean household earnings for samples of size 100.
Compare the population distribution on the left with the sampling
distribution on the right. What do you notice about the shape, center,
and spread of each?
x

The Practice of Statistics, 5th Edition 4
The Sampling Distribution of
When we choose many SRSs from a population, the sampling
distribution of the sample mean is centered at the population mean µ
and is less spread out than the population distribution. Here are the
facts.
Sampling Distribution of a Sample Mean
as long as the 10% condition is satisfied: n ≤ (1/10)N.
x
The standard deviation of the sampling distribution of x is
s x =s
n
The mean of the sampling distribution of x is mx = m
Suppose that x is the mean of an SRS of size n drawn from a large population
with mean m and standard deviation s. Then :
Note: These facts about the mean and standard deviation of x are true
no matter what shape the population distribution has.

The Practice of Statistics, 5th Edition 5
Sampling From a Normal Population
We have described the mean and standard deviation of the sampling
distribution of the sample mean x but not its shape. That's because the
shape of the distribution of x depends on the shape of the population
distribution.
In one important case, there is a simple relationship between the two
distributions. If the population distribution is Normal, then so is the
sampling distribution of x . This is true no matter what the sample size is.
Sampling Distribution of a Sample Mean from a Normal Population
Suppose that a population is Normally distributed with mean m
and standard deviation s . Then the sampling distribution of x
has the Normal distribution with mean m and standard
deviation s / n, provided that the 10% condition is met.
The Practice of Statistics, 5th Edition 6
The Central Limit Theorem
Most population distributions are not Normal. What is the shape of the
sampling distribution of sample means when the population distribution
isn’t Normal?
It is a remarkable fact that as the sample size increases, the distribution
of sample means changes its shape: it looks less like that of the
population and more like a Normal distribution!
When the sample is large enough, the distribution of sample means is
very close to Normal, no matter what shape the population distribution
has, as long as the population has a finite standard deviation.
Draw an SRS of size n from any population with mean m and finite
standard deviation s. The central limit theorem (CLT) says that when n
is large, the sampling distribution of the sample mean x is approximately
Normal.

The Practice of Statistics, 5th Edition 7
The Central Limit Theorem
Consider the strange population distribution
from the Rice University sampling distribution
applet.
Describe the shape of the sampling
distributions as n increases. What do you
notice?

The Practice of Statistics, 5th Edition 8
The Central Limit Theorem
Normal/Large Condition for Sample Means
If the population distribution is Normal, then so is the
sampling distribution of x . This is true no matter what
the sample size n is.
If the population distribution is not Normal, the central
limit theorem tells us that the sampling distribution
of x will be approximately Normal in most cases if
n ³ 30.
The central limit theorem allows us to use Normal probability
calculations to answer questions about sample means from many
observations even when the population distribution is not Normal.
As the previous example illustrates, even when the population
distribution is very non-Normal, the sampling distribution of the sample
mean often looks approximately Normal with sample sizes as small as
n = 25.

The Practice of Statistics, 5th Edition 9
The Sampling Distribution of
x

Section Summary
In this section, we learned how to…
The Practice of Statistics, 5th Edition 10
FIND the mean and standard deviation of the sampling distribution of
a sample mean. CHECK the 10% condition before calculating the
standard deviation of a sample mean.
EXPLAIN how the shape of the sampling distribution of a sample
mean is affected by the shape of the population distribution and the
sample size.
If appropriate, use a Normal distribution to CALCULATE probabilities
involving sample means.
Sample Means