children with disabilities factsheet - tower hamlets · children with disabilities factsheet ......
TRANSCRIPT
Children with disabilities factsheet
Tower Hamlets Joint Strategic Needs Assessment 2012-2013 UPDATED QUARTER
Executive Summary This factsheet is concerned with the health and well-being of children with physical and learning disabilities. Separate fact sheets exist on Learning Disability (all ages), Diabetes (all ages), Epilepsy (all ages), Asthma (all ages), Autism and Consanguinity. Measuring disability in childhood is difficult, because the notion of disability is multi-dimensional, dynamic and contested. Definitions vary across different settings. Most robust estimates and local data suggest that there are approximately 2,000 children and young people aged 0-19 with a disability in Tower Hamlets. In 2013, 1,562 children who attended a school in Tower Hamlets had statements of SEN, equivalent to 3.6% of the school population. The number of pupils with a statement of SEN maintained by the Local Authority, but not included in that figure (i.e. with a statement of SEN but who attended a school out of borough), increased by 21.2% between 2009 and 2013. Statemented and non-statemented SEN levels are higher than both England and London. The impact of disability upon a child and it’s family are multiple: 1. Greater exposure to the social determinants of poor health, specifically poverty; 2. Health inequalities in access to services and outcomes; 3. Specific health impacts aside from the child’s disability; 4. Multiple impairments; 5. Increased risk of harm through neglect and violence; 6. Social barriers and exclusion.
There are a number of factors affecting the presentation of children with disabilities that will have an impact on future service provision: 1. The proportion of children identified as having a disability has remained broadly constant – however the
number of children identified as having a disability is increasing due to the increasing 0-19 population; 2. An increasing number of children with statements of SEN are staying in education beyond 16 years; 3. Children with disabilities are being identified by services earlier. The Children and Families Bill (2013) represents a profoundly new approach to special educational needs and disability and is being implemented from 2014.
Recommendations 1. Review and learn from joint and single agency commissioning (and from what works well at Joint
Commissioning Panel) to support the development of integrated services; including where appropriate to local circumstances use of section 75s, pooled budgets and joint appointments to overcome some of the complexity of funding & providing Education, Health and Care Plans;
2. For commissioners to be cognisent of new statutory obligations (Children and families Bill & the NHS Mandate) to work collaboratively and jointly commission services for children – using the Health & wellbeing board as the mechanism/vehicle to facilitate this.
Page 2 of 31
- Need to ensure sustainable provision of appropriately skilled nursing staff to support children’s medical needs during their short breaks and develop a sustainable response to issues arising around care during transport;
3. Experience of transition still needs to be improved, in particular issues around preparing children and young people and their families for the reality that eligibility for adult services is more restricted – what might supporting families and CWD to build resilience and independence look like?
4. Need to review and address the challenges around meeting the accommodation needs of families and young people;
5. Family finding for Looked After Children with disabilities (approximately 26/year); 6. Review provision of services to meet mental health needs of adolescents with learning disabilities
(prevalence of depression is higher in adolescents with learning disability than in than in their peers) in order to identify additional commissioning needs e.g. increasing counseling support for adolescents with disabilities, delivered by appropriately qualified practitioners.
7. Ensure that post diagnosis support (as delivered in Childrens’ Centres and by Childrens’ Society) is replicated and accessible at further key transition points during the parent/carer and child’s journey.
1. What is disability in childhood? The UN Convention on the Rights of Persons with Disabilities defines disabilities as “long-term physical, mental, intellectual or sensory impairments which in interaction with various barriers may hinder [a person's] full and effective participation in society on an equal basis with others.”1 Article 7 draws attention to the rising profile of childhood disability and the need “to ensure the full enjoyment by children with disabilities of all human rights and fundamental freedoms on an equal basis with other children.” This view of disability is consistent with UNICEF's focus on protection of children with disabilities against discrimination2 and with the framework of the International Classification of Functioning, Disability and Health, in which disability is regarded as an “an umbrella term for impairments, activity limitations and participation restrictions…the interaction between individuals with a health condition (e.g. cerebral palsy, Down syndrome and depression) and personal and environmental factors (e.g. negative attitudes, inaccessible transportation and public buildings, and limited social supports).” 3 The specific and unique aspects of disability in childhood require disability to be set in the context of delays, deviations, and variations in expected growth and development.4 In the UK, one study estimated that 7.3% of children aged under 18 years old were reported to be disabled as defined by the Disability Discrimination Act (DDA).5 The DDA is superseded by the Equality Act (2010), section 6 of which states that a person is disabled if they have a disability which is defined as:
Physical or mental impairment;
Impairment that has a substantial and long term adverse effect on their ability to carry out normal day-to-day
1 UN enable. Frequently asked questions regarding the Convention on the Rights of Persons with Disabilities.
http://www.un.org/disabilities/default.asp?id=151. (accessed July 30, 2013). 2 UNICEF. Child info: monitoring the situation of children and women. http://www.childinfo.org/disability.html. (accessed
July 17, 2013). 3 World Health Organization (WHO) International Classification of Functioning, Disability and Health (2001)
4 The International Classification of Functioning, Disability and Health for Children and Youth (ICF-CY)
5 Blackburn CM et al. Prevalence of childhood disability and the characteristics and circumstances of disabled children in the
UK: secondary analysis of the Family Resources Survey. BMC Pediatrics. Apr 2010.
Page 3 of 31
activities; A child with a progressive degenerative condition meets the criteria if their condition is likely to result in a 'substantial and long term adverse effect' in the future, even if it does not currently do so. It also includes those who would have such difficulties or problems if they did not take medication. Local education services play a significant role in supporting children with a range of disabilities. Children are considered to have special educational needs (SEN) if they have a learning difficulty that calls for special educational provision to be made for them, with three levels of SEN: • School Action – extra or different help is provided to the child; • School Action Plus – extra or different help is provided to the child, plus the class teacher and school’s Special Educational Needs Coordinator (SENCO) receive advice or support from outside specialists, e.g., an educational psychologist; • Statement of SEN – the pupil has a statement of SEN, a legal document that specifies the child’s needs and the extra help they should receive. The categories “School Action” and “School Action Plus” will cease to exist once the Children and Families Bill is passed (2014). Separate fact sheets exist on Learning Disability (all ages), Diabetes (all ages), Epilepsy (all ages), Asthma (all ages), Autism and Consanguinity.
Types of disability There is a wide spectrum of disabilities that can affect children. These can broadly be categorised into physical and learning disabilities, although there is often an overlap between the two. Physical disability There are many physical disabilities that can affect children, such as delayed walking, deafness or visual impairment. Cerebral palsy (CP) is the most common physical disability in childhood.6 Approximately 2 per 1,000 infants in developed countries are born with the condition, which provides an umbrella term for a broad group of non-progressive motor impairment conditions secondary to lesions or anomalies of the brain arising in the early stages of development. There are other conditions that may not usually be considered as disabilities but are chronic in nature and therefore can have an impact on the child's development indirectly (e.g. through days lost at school, inability to partake fully in physical activities, need to take medication regularly). These include asthma or diabetes for example. Global development delay Clinically the term “global developmental delay” means a significant delay7 in two or more of the four main developmental domains (gross and fine motor skills, speech and language, social and personal and activities of daily living, performance and cognition). In the United Kingdom the term global developmental delay is usually reserved for younger children (under 5 years of age) while learning disability is usually applied to older children, when IQ testing is more valid and reliable (although formal testing of IQ is rarely performed in clinical practice and the child’s assessment is based on functional abilities).
6 Rosenbaum P; Cerebral palsy: what parents and doctors want to know. BMJ. 2003 May 3;326(7396):970-4.
7 Defined as performance two or more standard deviations below the mean on age appropriate standardised norm-
referenced testing.
Page 4 of 31
Global developmental delay affects 1-3% of children. About 1% (95% confidence interval 90-141/10 000) of children have an autism spectrum disorder,8 1-2% a mild learning disability, 0.3-0.5% a severe learning disability, and 5-10% have a specific learning disability in a single domain.9, 10 (There is some disagreement about categories of severity, possibly stemming from international differences in definitions of learning disabilities, and international mixtures of research evidence in epidemiological studies.) Again, there is a significant list of associated conditions, the most well-known being Down's syndrome. The effects may be far-reaching, with speech and communication problems which can result in (or be associated with) behavioural problems. Associated physical problems are common. Autism Autistic Spectrum Disorder (ASD) is a lifelong developmental disorder characterised by impairments in social interaction, social imagination and communication. The spectrum includes autism and Asperger’s syndrome. People with ASD may have a range of very different needs; some people may be non-verbal or have a severe learning disability, whilst those with Asperger’s syndrome often have an average or above average IQ. The National Autistic Society states that “estimates of the proportion of people with autism spectrum disorders (ASD) who have a learning disability, (IQ less than 70) vary considerably, and it is not possible to give an accurate figure. Some very able people with ASD may never come to the attention of services as having special needs, because they have developed strategies to overcome any difficulties with communication and social interaction, and found fulfilling employment.” See Tower Hamlets’ Autism JSNA for further information. ADHD ADHD is a heterogeneous behavioural syndrome characterised by the core symptoms of hyperactivity, impulsivity and inattention. While these symptoms tend to cluster together, some people are predominantly hyperactive and impulsive, while others are principally inattentive. Two main diagnostic criteria are in current use – the International Classification of Mental and Behavioural Disorders 10th revision (ICD-10) and the Diagnostic and Statistical Manual of Mental Disorders 4th edition (DSM-IV). ICD-10 uses a narrower diagnostic category, which includes people with more severe symptoms and impairment. DSM-IV has a broader, more inclusive definition, which includes a number of different ADHD subtypes.11 Sensory impairment ‘Sensory impairment,’ is a term used to encompass visual impairment (those who are sight impaired or severely sight impaired) and hearing impaired (those who are profoundly deaf, deafened or hard of hearing). Sensory impairments may be congenital or acquired at any age.
Risk factors Global Development Delay/Learning Disabilities may be caused by genetic factors, infection prior to birth, brain injury at birth, brain infection, brain damage after birth or have an unknown cause.12 One report found that nationally SEN associated with learning disabilities is more common among boys, children from poorer families and among some minority ethnic groups. Moderate and severe learning difficulties are
8 Baird G, Simonoff E, Pickles A, Chandler S, Loucas T, Meldrum D, Charman T. Prevalence of disorders of the autism
spectrum in a population cohort of children in South Thames: the special needs and autism project (SNAP). Lancet2006;368:210-5. 9 Blanchard LT, Gurka MJ, Blackman JA. Emotional, developmental, and behavioural health of American children and their
families: a report from the 2003 national survey of children’s health. Paediatrics2006;117:e1202-12. 10
Horridge KA. Assessment and investigation of the child with disordered development. Arch Dis Child Educ Pract Ed 2011;96:9-20. 11
NICE CG72 Attention deficit hyperactivity disorder (ADHD) 12
The child with general learning disability: for parents and teachers (Factsheet 10), Royal College of Psychiatrists, 2004
Page 5 of 31
more common among Traveller and Gypsy/Romany children. Profound multiple learning difficulties are more common among Pakistani and Bangladeshi children (who account for 62.5% of the 0-17 year old population in Tower Hamlets).13 However, for school aged pupils with statements of SEN across England as a whole in 2013, 2.5% were Asian (2.7% were Bangladeshi) compared to 3.1% White (3.2% White British)14 (see Table 6 and Figure 1 in appendix). In Tower Hamlets 45.9% of children under the age of 16 live in families in receipt of out of work benefits or tax credits where their reported income is less than 60% median income in 2010 (compared to 21.1% in England). There is a well-established link between socioeconomic deprivation and the prevalence of mild or moderate learning difficulties15 reflected in lower income, poorer housing, higher unemployment and a greater reliance on welfare benefits. Some evidence of a link between severe learning difficulties and poverty has been reported.16 High levels of material and social deprivation have been found amongst South Asian people with learning disabilities and their families. It has been suggested that such deprivation may combine with other factors – such as inequalities in access to maternal health care, misclassification and higher rates of environmental or genetic risk factors – to produce the much higher prevalence rates.17, 18 Genetic risk factors may also play a role in influencing the prevalence of certain physical disabilities (those associated with autosomal recessive conditions for example), but it is important to note that how these factors play out locally to influence the prevalence of disability in Tower Hamlets is not straightforward.
What is the impact of disability in childhood? Health inequalities People with disabilities report seeking more health care than people without disabilities and have greater unmet needs, and hence experience poorer health than the general population, differences which are to a large extent avoidable, and thus represent health inequalities. Five key determinants of health inequalities for people with disabilities have been identified: 19 1. Greater risk of exposure to social determinants of poorer health such as poverty, poor housing,
unemployment and social disconnectedness. 2. Increased risk of health problems associated with specific genetic and biological causes of learning
disabilities. 3. Communication difficulties and reduced health literacy. 4. Personal health risks and behaviours such as poor diet and lack of exercise. 5. Deficiencies relating to access to healthcare provision. It is to be expected that children with learning disabilities would have poorer health, not because of their learning disability per se but because they are more likely than their non-disabled peers to be exposed to a range of ‘social determinants’ of poorer health. It has been estimated that increased exposure to low socio-
13
Emerson E, Hatton C, Robertson J, Roberts H et al (2010) People with Learning Disabilities in England 2010 14
Department for Education, Special Educational Needs in England 2013 15
Emerson E (1997) ‘Is there an increased prevalence of severe learning disabilities among British Asians?’ Ethnicity and Health, 2:317–321. 16
Mir, G., Nocon, A., Ahmad, W., et al (2001) Learning Difficulties and Ethnicity. London: Department of Health. 17
Baxter C (1998) ‘Learning difficulties’, pp. 231–242 in: Rawaf S and Bahl V, (eds.) Assessing Health Needs of People from Minority Ethnic Groups, London: Royal College of Physicians/Faculty of Public Health Medicine. 18
Emerson E (1997) Ibid 19
Emerson, E., Baines, S., Allerton, & Welsh, V. (2011). Health Inequalities and People with Learning Disabilities in the UK: 2011. Durham: Improving Health & Lives: Learning Disability Observatory.

Page 6 of 31
economic position/poverty may account for:
20–50% of the increased risk for poorer physical and mental health among British children and adolescents with learning disabilities;
29-43% of the increased risk for conduct difficulties and 36-43% of the increased risk for peer problems among Australian children with learning disabilities or borderline learning functioning;
a significant proportion of increased rates of self-reported antisocial behavior among adolescents with learning disabilities;
32% of the increased risk for conduct difficulties and 27% of the increased risk for peer problems among a nationally representative sample of 3 year old British children with developmental delay.20
Inequalities in access and outcomes Health promotion and prevention activities often don’t target people with disabilities21, 22 and people with disabilities are particularly vulnerable to deficiencies in health care services. 23 Depending on the group and setting, people with disabilities may experience greater vulnerability to secondary conditions, co-morbidities, age-related conditions, engaging in health risk behaviors (such as smoking, poor diet and physical inactivity) and have higher rates of premature death.
Specific health impacts aside from the child’s disability The risk of children being reported by their main carer to have fair/poor general health is 2.5-4.5 times greater for children with learning disabilities when compared to their non-disabled peers. 24 A number of syndromes associated with learning disabilities are also associated with specific health risks. Mental health problems and challenging behaviours are more prevalent among people with autistic spectrum disorders, obesity and sleep problems are more prevalent among people with Down’s Syndrome; the prevalence of epilepsy rises from .5% - 1% in the general population to up to 35% among those with moderate learning disability and 30% among those with severe and profound disability. Studies suggest that the prevalence of depression is higher in adolescents with learning disability than in typically developing adolescents,25 and children and young people with learning disabilities are 6 times more likely to have mental health conditions than other young people.26
Multiple impairments Many people experience multiple types of impairment, for example:
People with learning disabilities are 8-200 times more likely to have a visual impairment compared with the general population;
Approximately 40% of people with learning disabilities are reported as having a hearing impairment;
People with Down’s syndrome are at particularly high risk of developing vision and hearing loss;
It has been estimated that between 20-33% of people with learning disabilities also have an autistic spectrum disorder (ASD), and that 55% of children aged 10-14 with ASD also have learning disabilities. 27
20
Ibid 21
Department of Health (2005) Vaccination services: reducing inequalities in uptake. London: Department of Health 22
Peckham C, Bedford H, Seturia Y et al. (1989) The Peckham report – national immunization study: factors influencing immunisation uptake in childhood. London: Action Research for the Crippled Child 23
Heslop P, Blair P, Fleming P, Hoghton M, Marriott A, Russ L. Confidential inquiry into premature deaths of people with learning disabilities (CIPOLD): final report. Mar 2013. www.bris.ac.uk/cipold/fullfinalreport.pdf 24
Emerson E, Baines S, Allerton L, Welch V (2011) ibid 25
ibid 26
The Mental Health of Children and Adolescents with Learning Disabilities in Britain (2007), Institute for Health Research, Lancaster University 27
Emerson et al (2011) ibid
Page 7 of 31
Increased risk of harm Children with disabilities are three to four times more likely to be victims of violence: 3.7 times more likely for combined measures of violence, 3.6 times for physical violence and 2.9 times for sexual violence. Children with mental or intellectual disabilities were found to be 4.6 times more likely to be victims of sexual violence than peers without disabilities.28 Parenting a child with additional needs is associated with increased stress levels in parents, and local research suggests that this is the case in Tower Hamlets also.29
Social barriers and exclusion A disabled child’s quality of life is determined not solely by their impairments (and subsequent health and social care needs), but the other barriers that often result in them being excluded from family and community activities such as poverty, negative attitudes and a disabling environment, for example, unequal access to education, healthcare, leisure activities, transport and housing.
2. What is the Policy Context? National policy A number of UK statutes influence services for children and young people with disabilities, setting out the broad legal framework and establishing the rights of children with learning difficulties and disabilities, most notably: Children Act 1989 - Children with disabilities are children 'in need' as defined by section 17(10(c)) of the Act and are entitled to a range of support services depending on their circumstances. Section 17(11) of the Act states '...a child is disabled if he is blind, deaf or dumb or suffers from mental disorder of any kind or is substantially and permanently handicapped by illness, injury or congenital deformity or such other disability as may be prescribed.' This definition that also applies to children under the two following Acts:
Disabled Persons (Services, Consultation and Representation) Act 1986 (section 16)
Chronically Sick and Disabled Persons Act 1970 (section 28a) Section 25 of the Children and Young Persons Act 2005 requires local authorities to provide Short Breaks for Disabled Children. From April 2011, a new legal duty came into force on local authorities to provide a range of Short Break services including:
Overnight care in the homes of disabled children or elsewhere
Day time care in the homes of disabled children or elsewhere
Educational or leisure activities for disabled children outside their homes
Services available to assist carers in the evenings, at weekends and during the schools holidays. Health commissioners and provider NHS Trusts have statutory responsibilities defined in the Equality Act 2010, the Mental Capacity Act 2005 and the Health and Social Care Act 2008 (Regulated Activities) Regulations 2010, as well as the UN Convention on the Rights of Persons with Disabilities.
28
Jones L, Bellis MA, Wood S, Hughes K et al. (2012) Prevalence and risk of violence against children with disabilities: a systematic review and meta-analysis of observational studies. The Lancet - 8 September 2012 ( Vol. 380, Issue 9845, Pages 899-907 ) DOI: 10.1016/S0140-6736(12)60692-8. http://www.thelancet.com/journals/lancet/article/PIIS0140-6736(12)60692-8/fulltext?_eventId=login 29
Sheddena S, Taylora V, Pajaka R, Corredor-Lopez P 2013. Parenting children with disabilities is hard. Does parenting style contribute to experience of parental stress in parents of children with additional needs? LBTH Disabled Childrens’ Outreach Service
Page 8 of 31
The Mandate from the Government to the NHS Commissioning Board (2012), requests that the NHS CB “support children and young people with special educational needs or disabilities, to ensure that these children and young people have access to the services identified in their agreed care plan and that, from April 2014, their parents are able to ask for a personal budget based on a single assessment across health, social care and education” as part of its objectives. Most, but not all, children with disabilities will be assessed as having Special Educational Needs (SEN). The provision for these children falls within Part IV of the Education Act 1996 as amended by more recent legislation such as the Special Educational Needs and Disability Act 2001. Provision for these pupils is guided by the SEN Code of Practice (2001). The current UK Government published the Support and aspiration: A new approach to special educational needs and disability Green Paper in 2011 in order to address weaknesses that it perceived as being inherent in the current system of education provision for children with special needs, namely that children did not have a voice, teachers were given insufficient training and support, too many assessments were involved, appropriate support could be too difficult to access and that the appeals process was costly. Draft legislation was presented to Parliament in September 2012. The Children and Families Bill (2013) takes forward the Coalition Government’s commitments to improve services for vulnerable children and support strong families. It sets out to reform the systems for adoption, looked after children, family justice and special educational needs. It takes forward the reform programme set out in Support and aspiration: A new approach to special educational needs and disability. Key measures relating to SEND are:
Replacing SEN statements and Learning Difficulty Assessments (for 16 to 25 year-olds) with a single, simpler 0 to 25 assessment process and Education, Health and Care Plan from 2014. Statutory protections comparable to the Statement extended to 25 (if in further education).
Revised Code of Practice
Requiring local authorities to publish a local offer showing the support available to disabled children and young people and those with SEN, and their families. This must include information on the education, health and care services available locally.
Giving parents or young people with Education, Health and Care Plans the right to a personal budget for their support
Local Authorities and Clinical Commissioning Groups must make arrangements for joint commissioning
Local policy Tower Hamlets Health and Well-Being Strategy The strategic vision is “to improve health and wellbeing through all stages of life to reduce health inequalities and promote choice, control and independence”. Within the priority area ‘Maternity and Early Years’ the strategy prioritises ‘early detection and treatment of disability and illness’ and that ‘all parents and children achieve positive physical and emotional development milestones’. Within the 4th priority area - long term conditions and cancer which includes disabilities the strategy identifies ‘increasing identification, diagnosis of learning disability’, ‘ensuring robust and integrated care and support, including a focus on improved housing options and support for young people’ and ‘improving engagement and understanding of carers by primary care services including improved recognition of specific needs of carers, increased use of carers’ registers, and greater provision of health checks’ as priorities. The Tower Hamlets Children and Families Plan 2012-2015 sets out the vision all children and young people to be safe and healthy, achieve their full potential, be active and responsible citizens and emotionally and
Page 9 of 31
economically resilient for their future. To help us achieve this vision for children with disabilities, the London Borough of Tower Hamlets and Tower Hamlets NHS promote inclusion by ensuring services in universal settings can be accessed by children with disabilities and additional needs. Additional services are targeted to the needs of those with more complex needs and there is a commitment to services being timely, accessible, coordinated and responsive to the needs of children, young people and their carers.
3. What are the effective interventions? Commissioning services for people with learning disabilities is a substantial test of working together in effective partnerships and, through this, securing better health and support for local people while safeguarding this most vulnerable group of the population. Commissioning services for people with learning disabilities is complex as many people have a wide range of needs that can be the responsibility of a number of services.30 The Children and Families Bill (2013) sets out the vision that:
Children’s SEN are picked up early and support is routinely put in place quickly – Early Support for complex needs and systems from the start
Staff have the knowledge, understanding and skills to provide the right support for children and young people who have SEN or are disabled;
Parents know what they can reasonably expect their local school, college, LA & local services to provide, without having to fight for it;
Aspirations for children and young people are raised through an increased focus on life outcomes, including employment;
For more complex needs, an integrated assessment and a single Education, Health and Care Plan are in place from birth to 25;
There is greater control for parents and young people over the services they and their family use. Health Inequalities and People with Learning Disabilities in the UK: 2011 Learning Disabilities Public Health Observatory - translates the key messages from previous review into advice for commissioners. Sets out a number of key commissioning actions including:
Ensuring that the health inequalities faced by people with learning disabilities are carefully documented in the Joint Strategic Needs Assessment (JSNA);
Taking action to commission with all relevant partner agencies, services which address the determinants of health inequalities where these are linked to: - social factors such as poverty and poor housing - specific conditions - poor communication and understanding of health issues - individual lifestyles - the way healthcare is delivered.
Improving the number and quality of annual health checks;
Ensuring that requisite reasonable adjustments are implemented in all health care settings;
Raising awareness of healthy lifestyles with people who have learning disabilities, their families and paid supporters;
Measuring progress using tools such as the Performance and Self- Assessment Framework (Department of Health 2009).
30
Royal College of General Practitioners (2012) Improving the Health and Wellbeing of People with Learning Disabilities: An Evidence-Based Commissioning Guide for Clinical Commissioning Groups (CCGs). http://www.rcgp.org.uk/ (accessed 02/09/2013)
Page 10 of 31
The Government’s Mandate to the NHS Commissioning Board (2012) says: “The NHS Commissioning Board’s objective is to ensure that CCGs work with local authorities to ensure that vulnerable people, particularly those with learning disabilities and autism, receive safe, appropriate, high quality care. The presumption should always be that services are local and that people remain in their communities; we expect to see a substantial reduction in reliance on inpatient care for these groups of people.” (para. 4.5) The Joint Commissioning Panel for Mental Health has published good practice guidance on Commissioning mental health services for people with learning disabilities31. The full range of mental health services should be accessible to people with learning disabilities and mental health problems, and mental health and learning disability services should work together to ensure that there is a single point of access and robust local pathways for people with overlapping needs that are delivered in the least restrictive way possible. The JSNA should include information about the needs of people with learning disabilities and mental health problems, and Health and Wellbeing Boards should facilitate joint working. Healthy Child Programme (0-19) + “Getting it right for children, young people and families”32 is a new national framework for the school nursing service to be adapted to meet local health needs and circumstances. The National Service Framework for Children, Young People and Maternity Services (2004) set standards in children’s health and social care services health support for disabled children and their families. There are specific standards to address the requirements of children and young people who are disabled and/or have complex health needs and their families (standard 8), and to address the needs of children and young people who are ill (standard 6). The mental health and psychological wellbeing of disabled children and young people, particularly those with learning disability, are addressed in Standard 9. Standard 8 sets out that disabled children and young people need to receive co-ordinated, high quality child and family centred services based on assessed needs that help promote social inclusion and enable children and families to live ordinary lives whenever possible. Aiming high for disabled children: better support for families (2007) set out what good services for children and young people with a disability and their families should look like, including:
Improved provision of information and greater transparency in decision making;
Putting families in control of the design and delivery of their care package and services;
Supporting disabled children and young people and their families and carers to shape services;
Ensuring that services are responsive and provide timely support;
Ensuring early intervention through good prioritisation of needs;
Provision of good joined-up care across services;
Provision of high-quality vital services for disabled children and young people – e.g. short breaks, wheel chairs and equipment;
Ensuring that children, families and carers have a consistent experience, independent of the service they are using.
The Children’s Trust Tadworth and Every Disabled Child Matters have produced a charter for Health and Wellbeing Boards (2013) setting out the following commitments in relation to understanding and meeting the needs of children with disabilities:
To have detailed and accurate information on the disabled children and young people living in our area, and provide public information on how we plan to meet their needs
to engage directly with disabled children and young people and their participation is embedded in the
31
Joint Commissioning Panel for Mental Health (2013). Mental health services for people with learning disabilities 32
Department of Health (March 2012). Getting it right for children, young people and families. Maximising the contribution of the school nursing team: Vision and Call to Action. London. Department of Health. https://www.gov.uk/government/uploads/system/uploads/attachment_data/file/216464/dh_133352.pdf
Page 11 of 31
work of our Health and Wellbeing Board
to engage directly with parent carers of disabled children and young people and their participation is embedded in the work of our Health and Wellbeing Board
to set clear strategic outcomes for our partners to meet in relation to disabled children, young people and their families, monitor progress towards achieving them and hold each other to account
to promote early intervention and support for smooth transitions between children and adult services for disabled children and young people
to work with key partners to strengthen integration between health, social care and education services, and with services provided by wider partners
to provide cohesive governance and leadership across the disabled children and young people’s agenda by linking effectively with key partners
“Services for people with learning disabilities and challenging behaviour or mental health needs” (2007) 33 This good practice guidance sets out the actions that should be taken in order to effectively meet the needs of people with challenging behaviour. The guidance contained in this document supports the agenda set out in 'Valuing People' (2001) and the focus on personalisation and prevention in social care. NICE guidance PH12: Social and emotional wellbeing in primary education (2008) PH20: Social and emotional wellbeing in secondary education (2009) PH21: Reducing differences in the uptake of immunisations (2009) PH28: Looked-after children and young people (2010) PH40: Social and emotional wellbeing: early years (2012) CG72: Attention deficit hyperactivity disorder: Diagnosis and management of ADHD in children, young people and adults (2008, modified 2013) CG145: Spasticity in children and young people with non-progressive brain disorders: Management of spasticity and co-existing motor disorders and their early musculoskeletal complications (2012) CG158: Antisocial behaviour and conduct disorders in children and young people: recognition, intervention and management (2013) CG170: Autism - management of autism in children and young people (2013)
4. What is the local picture? Prevalence estimates vary considerably and although a range of UK administrative, population census and survey sources contain data, the availability of current reliable quantitative data to inform public health planning and the commissioning and provision of services at national and local level has been limited.34,35,36,37, 38
33
Mansell, J. (2007). Services for People with Learning Disabilities and Challenging Behaviour or Mental Health Needs. Report of a project group (revised edition). 34
Read J, Blackburn C, Spencer N: Disabled children in the UK: a quality assessment of quantitative data sources. Child: Care, Health and Development 2010, 36(1):130-141. 35
Office for National Statistics: The health of children and young people, Chapter 10, Disability. 2004 http://www.statistics.gov.uk/children/downloads/disability.pdf. London: National Statistics Online 36
Gordon D, Parker R, Loughran F, Heslop P: Disabled Children in Britain: A Re-Analysis of the OPCS Disability Surveys. London: The Stationery Office; 2000. 37
Prime Minister's Strategy Unit: Improving the life chances of disabled people. London: The Stationery Office; 2005. 38
HM Treasury/Department for Education and Skills: Aiming high for disabled children: Better support for families. 2007 http://www.hmtreasury.gov.uk/media/C/2/cyp_disabledchildren180507.pdf

Page 12 of 31
Prevalence of disability Table 1 suggests that there is a confluence of estimates and local data from the more robust sources of between 1,600 and 2,000 children and young people with a disability in Tower Hamlets. The Secondary analysis of Family Resources Survey (2010) is nonetheless interesting as the analysis is of a large sample of children (16,000) and the overall estimate of prevalence might be expected to be fairly reliable. Table 1: Summary of main sources of data relating to prevalence and numbers of children with disabilities
Data Source
Age Range Covered
Number of people in Tower Hamlets with a disability
Prevalence (percentage of the population)
Census 2011 0-15 1,966 3.9%
DWP Disability Living Allowance (2013) 0-17 1,850 3.2% (based on total population 57,3000 GLA 2013 estimate)
Tower Hamlets Council Children with Disabilities Register (2012/13)
0-19 1,728 2.7% (based on total population of 62,500 GLA 2012/13 mid-year estimate)
Secondary analysis of 2004/05 Family Resources Survey (2010) (National estimate of prevalence applied to TH population)
0-18 4,770 (4509 – 5032) 7.3% (6.9 - 7.7)
Census 2011 “activity limiting health problems or disabilities” The 2011 ONS Census analysis describes the health of the population of England and Wales in respect to activity limiting health problems or disabilities.39 2.1% (1,040) of children aged 0-15 in Tower Hamlets are reported as having an activity limiting health problem or disability that limits their day to day activities a little and 1.8% that limit day to day activities a lot (926). These are broadly similar responses as London and England. Therefore 1,966 children aged 0-15 in Tower Hamlets report having a health problem or disability that limits their day to day activity at least a little. National prevalence estimates A number of surveys suggest a national prevalence ranging from 3.0% to 7.7% of children aged 0-18 with a disability. This would translate to between 1,729 and 4,439 of the 0-18 population in Tower Hamlets (see table 2 in Appendix 1). One analysis40 of national data (The Family Resources Survey) suggested a 7.3% (95% CI 6.9, 7.7) prevalence of children with a DDA-defined disability, 8.8% of boys and 5.8% of girls, with the lowest prevalence being in the 0-4 age group (3.7%) then increasing (8.2% in the 5-11 age group) to 9.5% between the 12-15 and falling off in the 16-18 age group to 8.5%. The report found that the prevalence of DDA-defined disability among UK children appeared to increase across income quintiles, with the highest prevalence of childhood disability found among those in the poorest income quintile.41
39
Office for National Statistics http://www.ons.gov.uk/ons/rel/census/2011-census/key-statistics-and-quick-statistics-for-wards-and-output-areas-in-england-and-wales/rpt-disability-short-story.html 40
Blackburn CM et al. Prevalence of childhood disability and the characteristics and circumstances of disabled children in the UK: secondary analysis of the Family Resources Survey. BMC Pediatrics. Apr 2010. 41
Ibid
Page 13 of 31
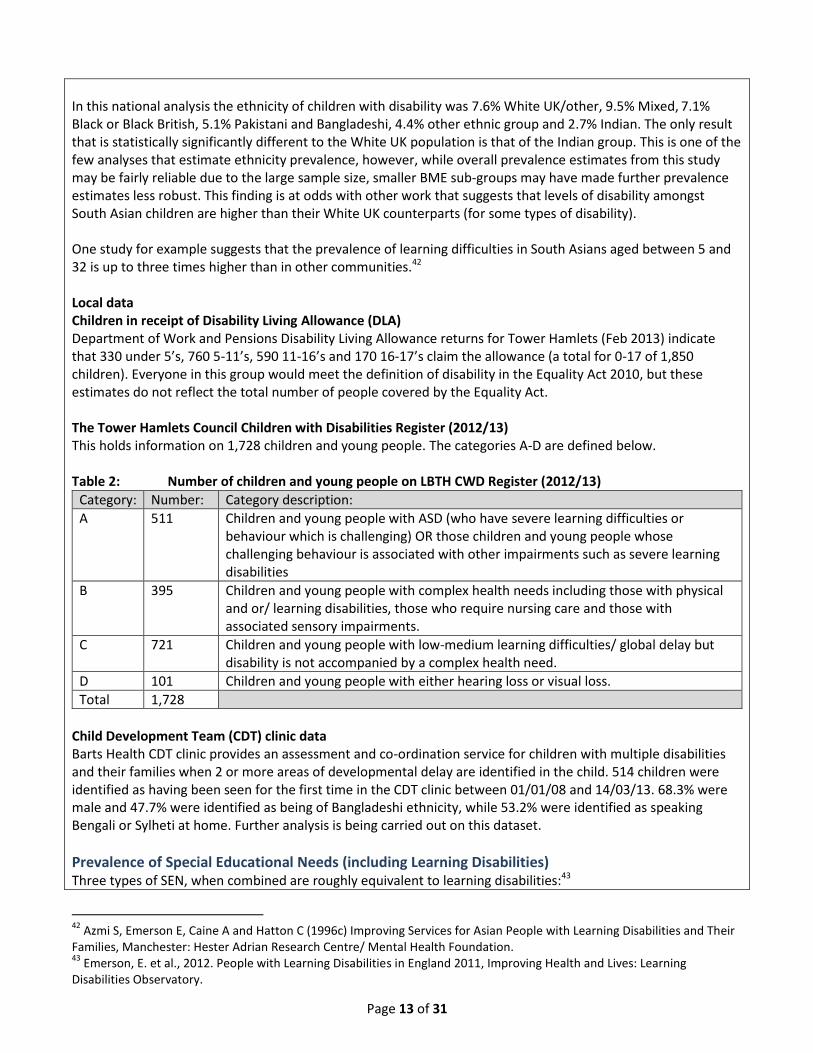
In this national analysis the ethnicity of children with disability was 7.6% White UK/other, 9.5% Mixed, 7.1% Black or Black British, 5.1% Pakistani and Bangladeshi, 4.4% other ethnic group and 2.7% Indian. The only result that is statistically significantly different to the White UK population is that of the Indian group. This is one of the few analyses that estimate ethnicity prevalence, however, while overall prevalence estimates from this study may be fairly reliable due to the large sample size, smaller BME sub-groups may have made further prevalence estimates less robust. This finding is at odds with other work that suggests that levels of disability amongst South Asian children are higher than their White UK counterparts (for some types of disability). One study for example suggests that the prevalence of learning difficulties in South Asians aged between 5 and 32 is up to three times higher than in other communities.42 Local data Children in receipt of Disability Living Allowance (DLA) Department of Work and Pensions Disability Living Allowance returns for Tower Hamlets (Feb 2013) indicate that 330 under 5’s, 760 5-11’s, 590 11-16’s and 170 16-17’s claim the allowance (a total for 0-17 of 1,850 children). Everyone in this group would meet the definition of disability in the Equality Act 2010, but these estimates do not reflect the total number of people covered by the Equality Act. The Tower Hamlets Council Children with Disabilities Register (2012/13) This holds information on 1,728 children and young people. The categories A-D are defined below. Table 2: Number of children and young people on LBTH CWD Register (2012/13)
Category: Number: Category description:
A 511 Children and young people with ASD (who have severe learning difficulties or behaviour which is challenging) OR those children and young people whose challenging behaviour is associated with other impairments such as severe learning disabilities
B 395 Children and young people with complex health needs including those with physical and or/ learning disabilities, those who require nursing care and those with associated sensory impairments.
C 721 Children and young people with low-medium learning difficulties/ global delay but disability is not accompanied by a complex health need.
D 101 Children and young people with either hearing loss or visual loss.
Total 1,728
Child Development Team (CDT) clinic data Barts Health CDT clinic provides an assessment and co-ordination service for children with multiple disabilities and their families when 2 or more areas of developmental delay are identified in the child. 514 children were identified as having been seen for the first time in the CDT clinic between 01/01/08 and 14/03/13. 68.3% were male and 47.7% were identified as being of Bangladeshi ethnicity, while 53.2% were identified as speaking Bengali or Sylheti at home. Further analysis is being carried out on this dataset.
Prevalence of Special Educational Needs (including Learning Disabilities) Three types of SEN, when combined are roughly equivalent to learning disabilities:43
42
Azmi S, Emerson E, Caine A and Hatton C (1996c) Improving Services for Asian People with Learning Disabilities and Their Families, Manchester: Hester Adrian Research Centre/ Mental Health Foundation. 43
Emerson, E. et al., 2012. People with Learning Disabilities in England 2011, Improving Health and Lives: Learning Disabilities Observatory.

Page 14 of 31
Moderate learning difficulty;
Severe learning difficulty ;
Profound Multiple Learning difficulty. While there is a reasonable amount of information on children with SEN and the type of need that they have (as set out in the tables below) it is important to insert the caveat that not all of this data is linked to a readily replicable definition (referring in particular to tables 7 and 8). Table 3: Summary of main sources of data relating to prevalence and numbers of children with SEN and Learning Disabilities
Data Source
Age Range Covered
Number of people in Tower Hamlets with a disability
Prevalence
Special Educational Needs with Statement Department of Education 2013 (based on where child attends school)
44
School aged children
1,562 3.6%
Special Educational Needs (without statement) Department of Education 2013 (based on where child attends school)
45
School aged children
7,067 16.2%
Learning Disabilities Observatory (2010) (National estimate of prevalence applied to TH population)
7-15 1,711 7.5%
The Learning Disabilities Observatory calculated (using 2010 school census) how many schoolchildren aged 7-15 may be expected to have learning disabilities in Tower Hamlets.46 If Tower Hamlets’ prevalence reflected the national prevalence then the numbers of children that would be expected to have learning disabilities in Tower Hamlets would be as in table 4. Table 4: National prevalence of children with learning disabilities and numbers expected in Tower Hamlets
Category Rate Estimated number of children (aged 7-15) in Tower Hamlets (2010 figures – total of 22,703 children)
Severe Learning Difficulties 37.9/10,000 86
Profound and Multiple Learning Difficulties 13.2/10,000 30
Moderate Learning Difficulties 647/10,000 1,469
Autistic Spectrum Disorder 55.5/10,000 126
Total / 1,711
Number of children with Special Educational Needs In 2013 1,562 children (all schools) who attended a school in Tower Hamlets had statements of SEN, 3.6% of pupils. 664 of state funded primary and 496 of state funded secondary school age children had statements of SEN. This is equivalent to 2.7% of the primary and 3.2% of the secondary school population. Both statemented and non-statemented SEN levels are higher than both England and London.
44
Special educational needs in England: January 2013 Department for Education, Published 30 July 2013. https://www.gov.uk/government/publications/special-educational-needs-in-england-january-2013 45
Ibid 46
The LDO methodology can be found at http://www.improvinghealthandlives.org.uk/projects/howmanyhavelearningdisabilities/about
Page 15 of 31
The percentage of pupils with statements of SEN is consistently higher for Tower Hamlets (3.6% in 2013) than for the neighboring boroughs of Newham (.8%) and Hackney (3.2%). See tables 4-5 in Appendix 1. A further 183 pupils had a statement of SEN maintained by the London Borough of Tower Hamlets in 2013 (i.e. with a statement of SEN but who attended a school out of borough), an increase of 21.2% between 2009 and 2013. See table 6 in Appendix 1. In practice, many children with SEN are also defined as having a disability under the Equality Act. However, not all disabled children have an SEN and not all children with SEN have a disability. Tables 5 and 6 summarise the primary need of children referred into the Educational Psychology Service of under 5’s, and the main presenting need of older children at the end of 2012. Table 5: Primary need at referral under 5’s, 2011-12 academic year (Sept 2011 – Aug 2012)
Primary need Number %
Global Development Delay 39 33%
Speech and Language need 25 21%
Autism 31 26%
Physical 8 7%
Hearing impairment 6 5%
Visual impairment 3 3%
Behavioural, Emotional and Social Development 1 1%
Insufficient information 6 5%
Total 119 100%
Table 6: Main presenting need at the conclusion of the statutory assessment process 2011/12
academic year (aged 5 - 18)
Primary need Number %
Speech, language and communication needs 480 29.3
Autistic Spectrum Disorder 267 16.3
Global Developmental Delay 265 16.2
Behavioural, Emotional and Social Development 211 12.9
Hearing Impairment 90 5.5
Physical Disability 80 4.9
Profound Multiple Learning Disability 70 4.3
Severe Learning Disability 68 4.1
Medical condition 53 3.2
Visual Impairment 36 2.2
Specific Learning Disability 19 1.2
Total 1639 100.0
Tables 6 and 7 summarise the type of need for those children who have a statement or ‘School Action Plus’ at primary and secondary school in Tower Hamlets. Learning disabilities There were 563 school-aged children identified as having a learning disability in Tower Hamlets in 2013. There are large differences between the numbers of children in some categories and those estimated as ‘expected’ (1,585) by the Learning Disability Observatory (table 4 above). Further analysis is needed to ascertain whether
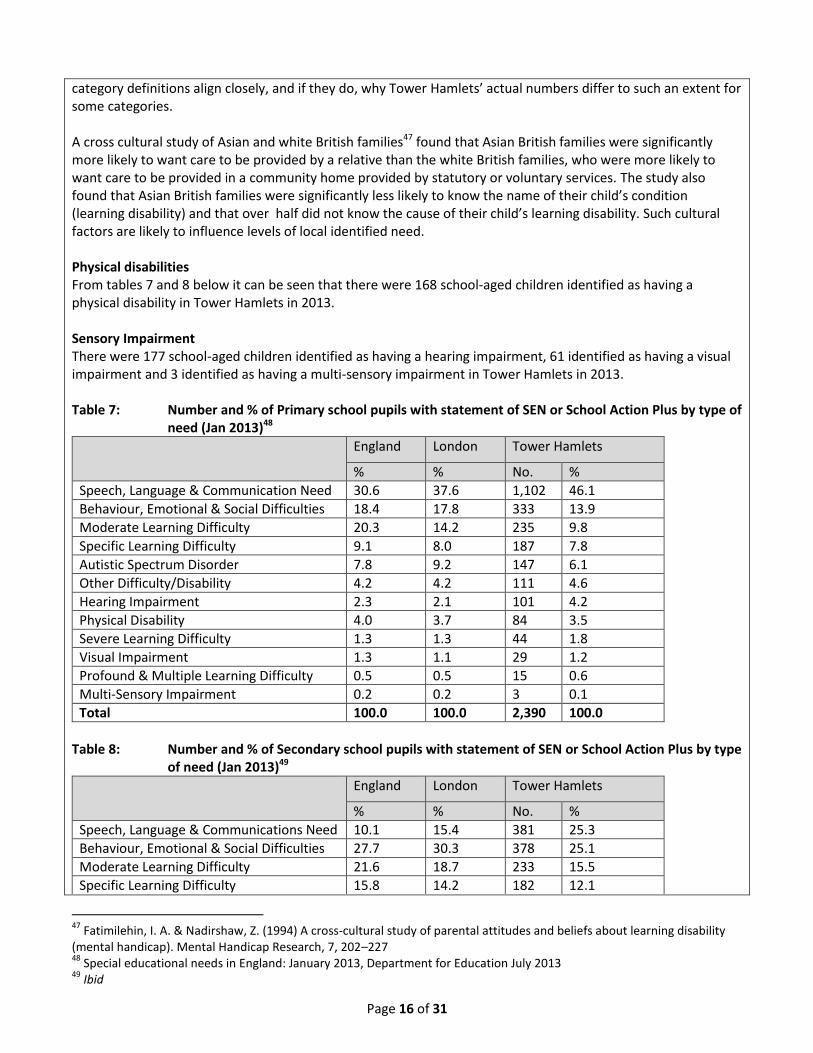
Page 16 of 31
category definitions align closely, and if they do, why Tower Hamlets’ actual numbers differ to such an extent for some categories. A cross cultural study of Asian and white British families47 found that Asian British families were significantly more likely to want care to be provided by a relative than the white British families, who were more likely to want care to be provided in a community home provided by statutory or voluntary services. The study also found that Asian British families were significantly less likely to know the name of their child’s condition (learning disability) and that over half did not know the cause of their child’s learning disability. Such cultural factors are likely to influence levels of local identified need. Physical disabilities From tables 7 and 8 below it can be seen that there were 168 school-aged children identified as having a physical disability in Tower Hamlets in 2013. Sensory Impairment There were 177 school-aged children identified as having a hearing impairment, 61 identified as having a visual impairment and 3 identified as having a multi-sensory impairment in Tower Hamlets in 2013. Table 7: Number and % of Primary school pupils with statement of SEN or School Action Plus by type of need (Jan 2013)48
England London Tower Hamlets
% % No. %
Speech, Language & Communication Need 30.6 37.6 1,102 46.1
Behaviour, Emotional & Social Difficulties 18.4 17.8 333 13.9
Moderate Learning Difficulty 20.3 14.2 235 9.8
Specific Learning Difficulty 9.1 8.0 187 7.8
Autistic Spectrum Disorder 7.8 9.2 147 6.1
Other Difficulty/Disability 4.2 4.2 111 4.6
Hearing Impairment 2.3 2.1 101 4.2
Physical Disability 4.0 3.7 84 3.5
Severe Learning Difficulty 1.3 1.3 44 1.8
Visual Impairment 1.3 1.1 29 1.2
Profound & Multiple Learning Difficulty 0.5 0.5 15 0.6
Multi-Sensory Impairment 0.2 0.2 3 0.1
Total 100.0 100.0 2,390 100.0
Table 8: Number and % of Secondary school pupils with statement of SEN or School Action Plus by type of need (Jan 2013)49
England London Tower Hamlets
% % No. %
Speech, Language & Communications Need 10.1 15.4 381 25.3
Behaviour, Emotional & Social Difficulties 27.7 30.3 378 25.1
Moderate Learning Difficulty 21.6 18.7 233 15.5
Specific Learning Difficulty 15.8 14.2 182 12.1
47
Fatimilehin, I. A. & Nadirshaw, Z. (1994) A cross‐cultural study of parental attitudes and beliefs about learning disability (mental handicap). Mental Handicap Research, 7, 202–227 48
Special educational needs in England: January 2013, Department for Education July 2013 49
Ibid
Page 17 of 31
Physical Disability 3.9 3.1 84 5.6
Hearing Impairment 2.9 2.4 76 5.0
Autistic Spectrum Disorder 9.8 8.0 54 3.6
Other Difficulty/Disability 5.7 5.4 49 3.3
Visual Impairment 1.5 1.3 32 2.1
Severe Learning Difficulty 0.9 0.8 29 1.9
Profound & Multiple Learning Difficulty 0.1 0.2 7 0.5
Multi-Sensory Impairment 0.1 0.1 x x
Total 100.0 100.0 1,505 100.0
Attention deficit hyperactivity disorder (ADHD) Literature suggests that using the narrower criteria (of ICD-10, hyperkinetic disorder), 1–2% of children and young people might be expected to experience severe ADHD. This would represent between 375 and 750 5-17 year olds in Tower Hamlets. Using the broader criteria (DSM-IV, ADHD), 3–9% of school-age children and young people (between 1,125 and 3,375 5-17 year olds in Tower Hamlets might be expected to experience ADHD. (This assumes a total Tower Hamlets school age (i.e. 5-17) population of 37,500).
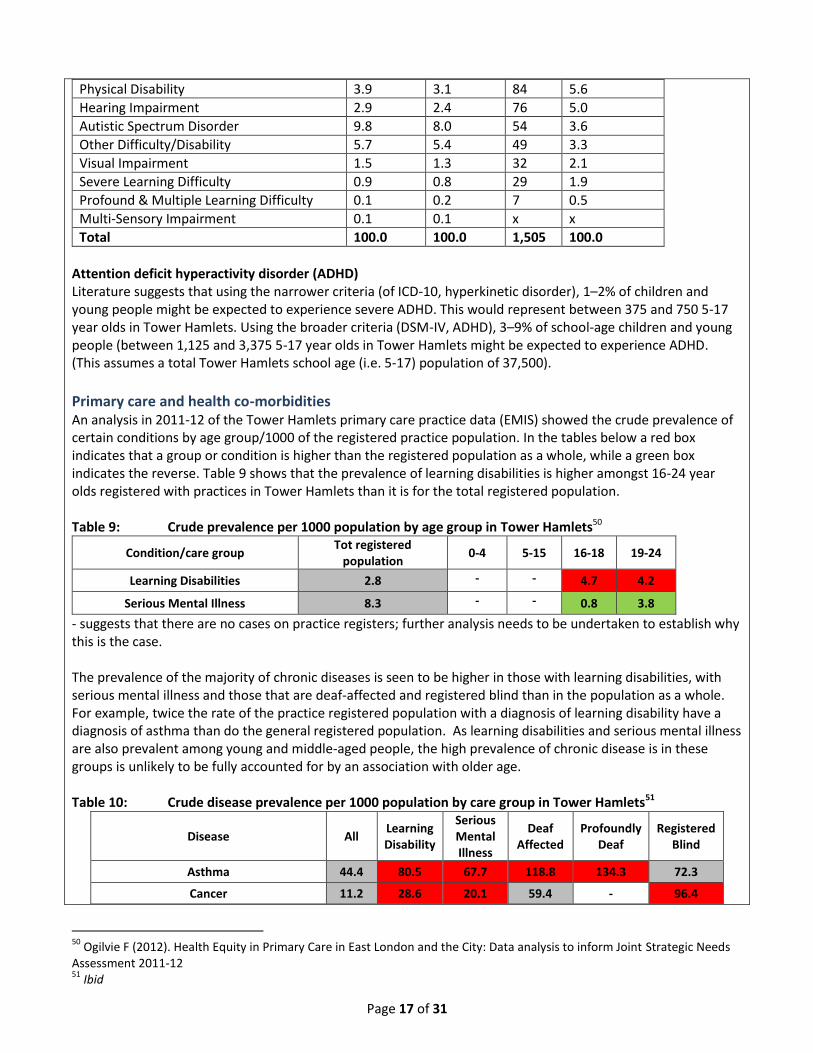
Primary care and health co-morbidities An analysis in 2011-12 of the Tower Hamlets primary care practice data (EMIS) showed the crude prevalence of certain conditions by age group/1000 of the registered practice population. In the tables below a red box indicates that a group or condition is higher than the registered population as a whole, while a green box indicates the reverse. Table 9 shows that the prevalence of learning disabilities is higher amongst 16-24 year olds registered with practices in Tower Hamlets than it is for the total registered population. Table 9: Crude prevalence per 1000 population by age group in Tower Hamlets50
Condition/care group Tot registered
population 0-4 5-15 16-18 19-24
Learning Disabilities 2.8 - - 4.7 4.2
Serious Mental Illness 8.3 - - 0.8 3.8
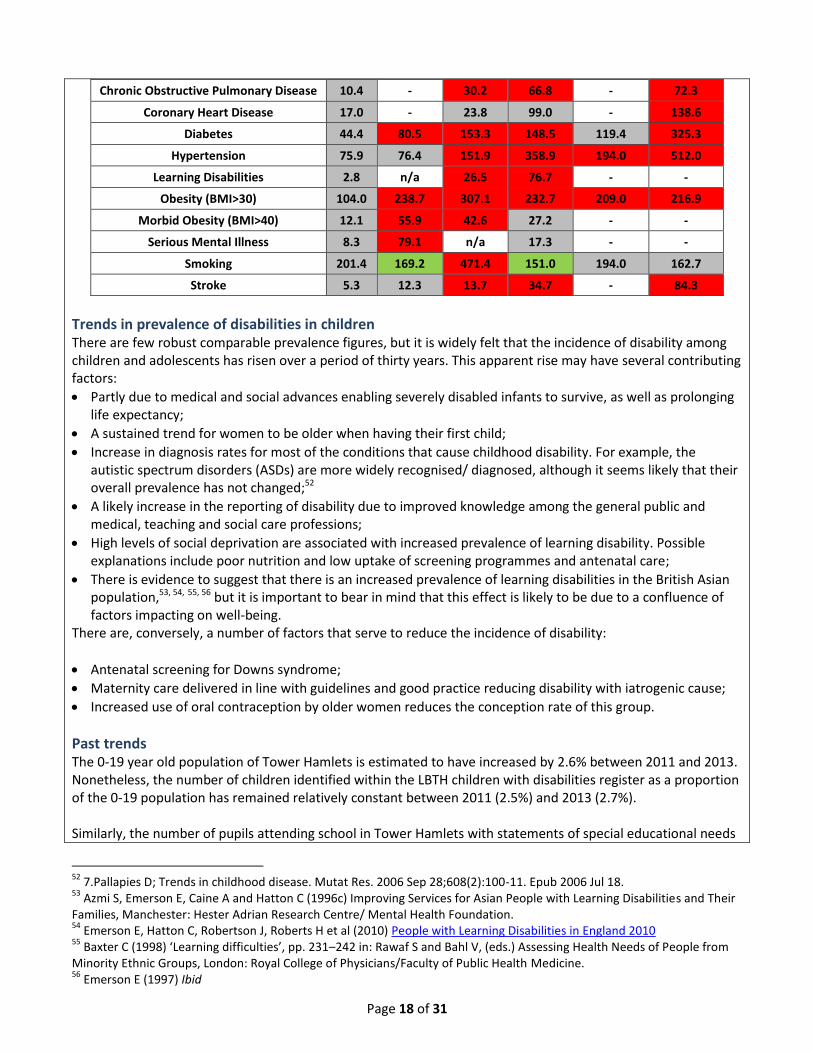
- suggests that there are no cases on practice registers; further analysis needs to be undertaken to establish why this is the case. The prevalence of the majority of chronic diseases is seen to be higher in those with learning disabilities, with serious mental illness and those that are deaf-affected and registered blind than in the population as a whole. For example, twice the rate of the practice registered population with a diagnosis of learning disability have a diagnosis of asthma than do the general registered population. As learning disabilities and serious mental illness are also prevalent among young and middle-aged people, the high prevalence of chronic disease is in these groups is unlikely to be fully accounted for by an association with older age. Table 10: Crude disease prevalence per 1000 population by care group in Tower Hamlets51
Disease All Learning Disability
Serious Mental Illness
Deaf Affected
Profoundly Deaf
Registered Blind
Asthma 44.4 80.5 67.7 118.8 134.3 72.3
Cancer 11.2 28.6 20.1 59.4 - 96.4
50
Ogilvie F (2012). Health Equity in Primary Care in East London and the City: Data analysis to inform Joint Strategic Needs Assessment 2011-12 51
Ibid
Page 18 of 31
Chronic Obstructive Pulmonary Disease 10.4 - 30.2 66.8 - 72.3
Coronary Heart Disease 17.0 - 23.8 99.0 - 138.6
Diabetes 44.4 80.5 153.3 148.5 119.4 325.3
Hypertension 75.9 76.4 151.9 358.9 194.0 512.0
Learning Disabilities 2.8 n/a 26.5 76.7 - -
Obesity (BMI>30) 104.0 238.7 307.1 232.7 209.0 216.9
Morbid Obesity (BMI>40) 12.1 55.9 42.6 27.2 - -
Serious Mental Illness 8.3 79.1 n/a 17.3 - -
Smoking 201.4 169.2 471.4 151.0 194.0 162.7
Stroke 5.3 12.3 13.7 34.7 - 84.3
Trends in prevalence of disabilities in children There are few robust comparable prevalence figures, but it is widely felt that the incidence of disability among children and adolescents has risen over a period of thirty years. This apparent rise may have several contributing factors:
Partly due to medical and social advances enabling severely disabled infants to survive, as well as prolonging life expectancy;
A sustained trend for women to be older when having their first child;
Increase in diagnosis rates for most of the conditions that cause childhood disability. For example, the autistic spectrum disorders (ASDs) are more widely recognised/ diagnosed, although it seems likely that their overall prevalence has not changed;52
A likely increase in the reporting of disability due to improved knowledge among the general public and medical, teaching and social care professions;
High levels of social deprivation are associated with increased prevalence of learning disability. Possible explanations include poor nutrition and low uptake of screening programmes and antenatal care;
There is evidence to suggest that there is an increased prevalence of learning disabilities in the British Asian population,53, 54, 55, 56 but it is important to bear in mind that this effect is likely to be due to a confluence of factors impacting on well-being.
There are, conversely, a number of factors that serve to reduce the incidence of disability:
Antenatal screening for Downs syndrome;
Maternity care delivered in line with guidelines and good practice reducing disability with iatrogenic cause;
Increased use of oral contraception by older women reduces the conception rate of this group.
Past trends The 0-19 year old population of Tower Hamlets is estimated to have increased by 2.6% between 2011 and 2013. Nonetheless, the number of children identified within the LBTH children with disabilities register as a proportion of the 0-19 population has remained relatively constant between 2011 (2.5%) and 2013 (2.7%). Similarly, the number of pupils attending school in Tower Hamlets with statements of special educational needs
52
7.Pallapies D; Trends in childhood disease. Mutat Res. 2006 Sep 28;608(2):100-11. Epub 2006 Jul 18. 53
Azmi S, Emerson E, Caine A and Hatton C (1996c) Improving Services for Asian People with Learning Disabilities and Their Families, Manchester: Hester Adrian Research Centre/ Mental Health Foundation. 54
Emerson E, Hatton C, Robertson J, Roberts H et al (2010) People with Learning Disabilities in England 2010 55
Baxter C (1998) ‘Learning difficulties’, pp. 231–242 in: Rawaf S and Bahl V, (eds.) Assessing Health Needs of People from Minority Ethnic Groups, London: Royal College of Physicians/Faculty of Public Health Medicine. 56
Emerson E (1997) Ibid
Page 19 of 31
has increased year on year, by 15% (from 1,355 to 1,562) between 2009 and 2013, but the proportion of pupils that this represents has remained relatively constant (table 4 in Appendix). There has been a downward trend in the proportion of children with SEN without statements since 2009. There has been an increase of 21.2% between 2009 and 2013 in pupils with a statement of SEN maintained by the London Borough of Tower Hamlets (i.e. with a statement of SEN but who attended a school out of borough. The Educational Psychology Service reports that there has been a significant increase in notifications over recent years and that those children are being referred at an earlier age, with the majority being under three. It is not clear whether this increase is due to an increase in the number of children with additional needs, better awareness amongst health professionals of SEN procedures for young children with additional needs or parents connecting with services whilst their child is at an earlier age.
Future trends The 0-17 year old population in Tower Hamlets is projected to increase by approximately 8% between 2013 and 2018, from 60,000 to 65,200 0-17 year olds57 and hence the numbers of children with disabilities may be expected to rise by a similar proportion. However, data from the LBTH Short Breaks register indicates that the number of children identified as having a disability (falling under category A, B, C or D) was 1533 in 2011, 1660 in 2012 and 1728 in 2013, representing 2.6%, 2.8% and 2.8% of the 0-17 population respectively (not reflecting the presumed rise in line with population size increases). There are therefore a number of key factors feeding into the prevalence of children with disabilities locally, and number of children known to local services: 1. An increase in the population of 0-19 year olds in Tower Hamlets; 2. The proportion of children identified on key local databases has remained constant – i.e. the number of
children identified as having a disability is increasing, but the rate as a proportion of the whole 0-19 year old population has remained constant;
3. An increasing number of children with statements of SEN are staying in education beyond 16 years; 4. Children with disabilities are being identified by services earlier.
5. What is being done locally to address this issue? Services for disabled children in Tower Hamlets are provided by integrated teams across the LBTH Education, Social Care and Wellbeing Directorate, ‘Health’ and the Voluntary and Community Sector to meet the needs of disabled children with a timely and coordinated approach. Tower Hamlets Integrated Service for Disabled Children and Families produces a directory of services and annual short breaks statement for disabled children and young people and their families.
Social care Children with Disabilities Team LBTH Children’s Social Care has a specialist disabled children's team. The service's main work is with children who have severe learning and/or physical disabilities, children within the autistic spectrum and children who are deaf. In 2013 a total of 142 referrals were made to the team (6.6% of all referrals to children’s social care) and a total of 329 children were on the team’s caseload. Approximately 5% of those children had a Child Protection Plan
- Social Workers – assessment and intervention, designated Child in Need if child has disability - Disabled Children’s Outreach Service (early and crisis intervention)
57
GLA 2012 Round SHLAA Borough Projections incorporating DCLG 2011 household formation rates, (June 2013)

Page 20 of 31
- Externally commissioned short breaks provision, plus some internal Council short break services including Inclusion Officer for access to universal services
- Personal care
Tower Hamlets Short breaks Tower Hamlets’ offer is that all disabled children and young people have access to one short break of their choice. This will either be a specialist short break (for children in either category A or B) or a short break in a universal setting. Access to more than one specialist short break requires a Social Care assessment. Transition Transitions Team in the Community Learning Disability Service (CLDS) Transitions Workers in Children’s Social Care attend SEN reviews for children with disabilities known to Children’s Social Care from age 16 to support transition planning (aim is to build capacity and engage from 14 years of age).
Health Tower Hamlets Clinical Commissioning Group Commission a range of services for children and young people including; Children’s Community Nursing Team, Speech and Language Therapy, Physiotherapy, Occupational Therapy, Audiology, School Nursing for Children with Continuing Care needs, Richard House Children’s Hospice, and acute inpatient and outpatient services. A specialist community continence services is being developed to review and treat children and young people with enuresis, constipation and long term continence problems. The national best practice tariff for children’s diabetes will come into effect from 2013/14 which will result in an increase in funding to Barts Health for their children’s diabetes service, based on them continuing their current best practice in this area. Child Development Team (CDT) The Child Development Team within Bart’s Health NHS Trust provides an assessment and co-ordination service for children with multiple disabilities and their families where there are 2 or more areas of developmental delay identified in the child. All children who meet the referral criteria should be referred to this single service. A clinical decision is made on an individual basis of when to refer to the Clinical Genetics Service at Great Ormond Street Hospital and genetic tests and genetic counseling are carried out as deemed appropriate. Autism Spectrum Disorder Assessment Service (ASDAS) multi-disciplinary service including specialist paediatricians, speech and language therapists, occupational therapists and social workers. The team’s role is to complete diagnostic assessments of children when it is thought that the child may have an autism spectrum disorder (ASD) and signpost/advise families. Child and Adolescent Mental Health Services Tower Hamlets CAMHS provides mental health assessment and treatment services to all children and young people who are experiencing serious risks to their emotional and psychological wellbeing and development. For children with difficulties such as Autistic Spectrum Disorder, brain injury or learning difficulties, where there is a concern about a significant mental health difficulty there is a dedicated Neuro-developmental Care Pathway. Children with a physical disability and significant mental health difficulties receive a service through the Emotional and Behavioural Care Pathway. Primary care and General Practice GPs play a key role in recognition of developmental problems in the young child (e.g. at the 6 week check), in referral on to specialist services (CAMHS and secondary care), in treatment (e.g. prescribing complex and multiple drug regimes) and coordination of care for children with disability (including a role of transition of care
Page 21 of 31
to adult services). The GP will also often provide referral, treatment and coordination of care for the parent or carer of the child with disabilities. The childhood immunisation schedule below is delivered by community based nursing team and primary care: 2 months: 5-in-1 (DTaP/IPV/Hib) vaccine; Pneumococcal (PCV) vaccine; Rotavirus vaccine; 3 months: 5-in-1 (DTaP/IPV/Hib) vaccine, third dose; Pneumococcal (PCV) vaccine, second dose; 4 months: 5-in-1 (DTaP/IPV/Hib) vaccine, third dose, Pneumococcal (PCV) vaccine, second dose; 12-13 months: Hib/Men C booster, Measles, mumps and rubella (MMR) vaccine, Pneumococcal (PCV) vaccine, third dose; 2 and 3 years: Flu vaccine (annual); 3 years and 4 months: Measles, mumps and rubella (MMR) vaccine, second dose, 4-in-1 (DTaP/IPV) pre-school booster. Maintaining high rates of immunisation coverage in childhood are a key prevention measure for disability. Health Visitors play a significant role in the early identification of children with disabilities through the Healthy Child Programme. School Health The school health team screens all children in Reception year classes (aged 4-5 years) for vision and hearing abnormalities. The childhood immunisation team provides HPV vaccine at 12-13 years, 3-in-1 (Td/IPV) teenage booster at 13-18 years and Meningitis C booster at 13-15 years. The school health team currently provides targeted support to those children who require follow up after screening, and those children whose needs are brought to the attention of the Service through any other means, are offered additional targeted healthcare and support by the Service and referred on to other services as required. Children and young people with long term conditions receive:
Care plans
Access to information, support and advice
Access to specialist services as required
Support to improve self-care
Effective transition plans.
Education School based support – Primary and Secondary Advisory Teachers Support for Learning Service A team of Specialist Teachers and four instructors supporting schools to work with pupils with SEN and their parents (pre-school to 19). Following delegation of SEN resources to schools in 2000 SLS central funding is used to do advisory work to build school capacity for inclusion of pupils with SEN in mainstream settings. Teams are deaf and partially hearing (398 on locally; vision impaired; physically disabled or with serious medical condition; language and communication difficulties; specific learning difficulties (including dyslexia); behaviour difficulties. Educational Psychology Under 5 casework Educational Psychology Service (EPS) responds to SEN notifications on behalf the Local Authority. EPS works with families, pre-schools settings and other professionals. They offer advice on assessment of the child’s additional needs and any required interventions. The service received 119 referrals in 2011/12. It received a higher number of notifications for under 5’s than in previous years with an increasing number for children under two years of age. The majority of notifications come from CDT/ASDAS. The commonest category of SEN is speech, language and communication difficulties

Page 22 of 31
with many of these children having or undergoing assessment for Autism or ASD. School aged casework Every maintained school in Tower Hamlets has a link Educational Psychologist (EP) who provides psychological advice for all cases where there is reason to believe that a pupil may have significant SEN. The EPs also support schools in their planning and implementation of individual arrangements for some targeted pupils through 8 week planning meetings or Annual Reviews of statements of SEN. Table 10: Educational Psychology school aged casework 2011/12
Special Mainstream Out of borough
M F M F M F Total
Nursery 9 3 78 18 0 0 108
Primary 26 3 462 201 30 11 733
Secondary 39 6 146 30 42 21 284
Total 74 12 686 249 72 32 1125
Tower Hamlets has a number of in borough specialist schools for children and young people: Cherry Trees School - for primary age boys (5 – 11 years) with behavioural, emotional and social difficulties (BESD); Ian Mikardo High School - for young people aged 11 - 16 with severe and complex BESD and statements of special educational need; Phoenix Primary and Secondary School – special school for children aged 5 – 16 years with severe language and communication difficulties whose needs lie within the autistic spectrum; Stephen Hawking School - special school for approximately 75 pupils aged 2 - 11 years. The majority of the children at the school have profound and multiple learning difficulties. A significant number of children have additional sensory and physical impairments. Barts Health provide nursing, physiotherapy, occupational therapy and speech and language therapy input. Additional high level support from LBTH peripatetic teachers for the hearing and visually impaired. Beatrice Tate School - school provides education for approximately 60 pupils aged 11-19, all of who have a Statement of Special Educational Need and whose needs cannot be met within mainstream schools. Educational Psychologist, Psychiatrists, Attendance and Welfare Advisor, Social Workers from the Specialist Disability Team, Physiotherapists, Occupational Therapists, Speech Therapists, Audiologist, Optometrist, School Dental Team and a full time School Nurse (paediatric nurse). Bowden House – residential school for children aged 10-16 with severe and complex BESD and statements of special educational need;
Voluntary and Community Sector Disability Advocacy Service (provided by Children’s Society) Works with young disabled people aged 11 to 21 to provide independent, personal and health advocacy. Family Support for ASD (provided by National Autistic Society) Provides support to the parents or carers of children and young people (0-19) with an autism spectrum disorder (ASD) living in the borough. Parents' Advice Centre (PAC): provides the parent partnership service for Tower Hamlets. Offers mediation, advocacy and telephone support for parents/carers of children and young people with Special Educational Needs (SEN) and supports parents of children with SEN through transition and the admission system. Currently works with children aged 0-19, from 2014 will work with 0-24 year olds and their brief will widen to include health, social care and education as well as young people (16 years +) themselves. Provide support to a number of support groups including PACSEN, Bengali and Somali Parent Support groups and the ADHD parenting

Page 23 of 31
programme (an 8 week training and support programme run by parents). They have also delivered an annual Independent Volunteer training programme in order to build local capacity, of which 3 have run, each has a 6 month 3 hour/week volunteering commitment.
6. What evidence is there that we are making a difference? Quality Assurance
LBTH’s 2 overnight short break providers have been graded as outstanding by the Care Quality Commission;
LBTH’s 3 special schools have been graded outstanding by Ofsted;
Tower Hamlets council is sector champion for the national short breaks programme. Outcomes The Tower Hamlets Children and Families Plan 2012-15 contains detailed priorities for achieving its vision for all children and young people at each life stage, from maternity and early years through to transitioning into adulthood. It sets out indicators for positive outcomes for all children and young people; meeting all those indicators for children and young people with disabilities may be considered to be evidence of improvement. There are specific indicators that will indicate progress in relation to children and young people with disabilities – these outcomes are either specific to them, or are in relation to an issue which the evidence indicates may be more prevalent amongst the children with disabilities population. These specific indicators are set out below for each life stage for children and young people. See below for specific outcomes.
Impact on indicators Public Health Outcomes Framework Those outcome indicators marked with ‘*’ are shared with Tower Hamlets Children and Families Plan 2012-15. 1.1 Percentage of children in relative poverty (living in households where income is less than 60 per cent of median household income before housing costs) 1.2 School readiness 1.3 Pupil absence 1.4 First time entrants to the youth justice system 1.5 16-18 year olds not in education, employment or training* 2.7 Hospital admissions caused by unintentional and deliberate injuries in under 18s 2.8 Emotional well-being of looked after children 2.10 Self-harm* 2.21 Access to non-cancer screening programmes, sub-indicators 2.21i and 2.21ii - screening coverage or uptake for infectious diseases in pregnancy (including screening for HIV, hepatitis B, syphilis and rubella susceptibility)* 2.23 Self-reported well-being 3.3 Population vaccination coverage (sub-indicators 3.3i to 3.3xii relating to childhood immunisations) 4.2 Tooth decay in children aged 5
NHS Outcomes Framework Domain 2 Enhancing quality of life for people with long-term conditions Overarching indicator 2 Health related quality of life for people with long term conditions(EQ5D) Improvement areas Ensuring people feel supported to manage their condition 2.1 Proportion of people feeling supported to manage their condition Improving functional ability in people with long term conditions 2.2 Employment of people with long term conditions Reducing time spent in hospital by people with long term conditions

Page 24 of 31
2.3.ii Unplanned hospitalisation for asthma, diabetes and epilepsy in under19s* Enhancing quality of life for carers 2.4 Health related quality of life for carers (EQ5D) Enhancing quality of life for people with mental illness 2.5 Employment of people with mental illness
Other indicators NI146 Increase in proportion of Adults with Learning Disabilities in Employment
Local indicators set out in Tower Hamlets Children and Families Plan 2012-15 Maternity and Early Years
Early detection and treatment of disability and illness
All parents and children achieve positive physical and emotional development milestones
Improving levels of speech and language development amongst the most vulnerable children in the borough Childhood
Children with disabilities and their families are supported following diagnosis
Good and improving key stage 2 attainment of level 4 English and maths and good levels of progression between key stage 1 and 2 in English and in Maths all pupils with SEN
Young people
All young people with mental health needs have access to appropriate services
Good and improving key stage 4 attainment (5 or more A*-C grade GCSEs including English and maths) for all pupils with SEN
Preparing for adulthood
Increasing numbers of young people with disabilities are securing appropriate, safe housing
Deliver financial literacy sessions and explore how financial literacy and welfare reform programmes can be tailored to vulnerable groups
Tailor existing parenting programmes to parents/carers of children with a disability as they prepare for adulthood
Ensure timely transition plans for young people with disabilities
Provide effective support to meet the emotional needs of young people with a disability, learning difficulty and/or life threatening medical condition as they face the challenges of approaching adulthood
7. What is the perspective of the public on support available to them? National The Children and Young People’s Health Outcomes Forum, Disability and Palliative Care Subgroup, stressed that many families highlighted difficulties in accessing services, fragmentation of services (particularly a lack of join-up between health, social service and education services) and sporadic good practice, such as the provision of a key worker approach to help with joining up care. The VIPER project - a three-year Big Lottery Fund funded research project, which started in summer 2010, set out to explore the participation of disabled children and young people in decision-making about services. Local Tower Hamlets Integrated Services for Children with Disabilities hold an annual Primary and Secondary (relating to schools/age) Children’s Forum Consultation Fun Days in 2011, giving young people the opportunity to try a range of sporting activities and using the opportunity to consult on a particular theme (‘choices’ in 2012, ‘friendship’ in 2013).

Page 25 of 31
Tower Hamlets Local Voices58 consultation and engagement project was conducted in 2013 to help understand the concerns, views and aspirations of local disabled people and to:
Inform the review of the previous Disability Equality Scheme;
Better understand disabled people's priorities for a forthcoming Single Equality Scheme;
Develop an ongoing model for consulting with disabled people. While the consultation involved adults rather than children, young people or their carers, the following overarching themes emerged and felt relevant to children and people and their carers:
Negative attitudes towards disabled people;
Inaccessible, poor information;
Lack of participation and voice. With priority scores ranging from 1-9 (with 7-9 being very high) the specific issues of welfare and benefits, social care and getting out and about were rated very high, crime, anti-social behaviour and safety rated 6, Health and healthcare and housing both rated 5 and jobs, volunteering and training rated 4. Much concern expressed was with regard to the current political, social and particularly economic discourse on ‘welfare’ and also specifically disability, social care was the top area of concern for survey respondents, with many services valued highly but some issues were reported and a sense of inadequate levels of support were expressed. Similarly for health, the second highest area of concern, some positive experiences, but more concerns (poor experience of services, concerns about staff attitudes and awareness) from older people. Part of the scope for the project was “developing a model to increase the representation and involvement of disabled people in decision making, service design and scrutiny” and the report makes recommendations as to how this could be approached. PACSEN Parents’ Workshop on Transitions (2013) Parents and carers voiced concerns about:
The stage at which the ‘front door’ into Adults Services is opened. Parents’ and carers’ experience is that this is not until the young person is aged 18, and it needs to be earlier;
Young people in receipt of Children’s Services not meeting the eligibility for Adults Services, particularly young people with ASD not being eligible for services if they don’t have also have a learning disability;
Service decisions being made without a professional who knows the child being present and occasionally poor communication of decisions;
Insufficient mental health support for young people during the transition period;
Access to appropriate housing and further education options. The following quotes from children, young people and parents/carers were made about the specialist short breaks providers during 2012/13:
“John tried lots of new activities with Jo, things he wouldn’t do normally because he’s quite clear about what he likes and dislikes. He went to a Tibetan Festival with Jo, something he would never have tried by himself…. John has really enjoyed spending time with his befriender, he’s much more confident, social and I’ve notice that having a friendship with Jo has helped his self-esteem. He’s much happier in himself. It’s been good for him to have time away from us doing things he enjoys and getting that social contact which has been lacking in the last couple of years.”
“Maryam has found a way to calm herself when feeling anxious, she counts to 10 in her head when she feels
58
Local Voices: Hearing the voice of disabled people in Tower Hamlets (2013). Local Voices, Real DPO Ltd, [email protected]
Page 26 of 31
frustration in her starting to rise and it helps her stay calm and not lose it.... It’s really helping her. Maryam’s confidence grows every time she sees Sarah [befriender]…”
“Pleasant environment and helpful staff. My son straight away started activities, which enables me to go home and attend to other children.”
“Sonya always comes back with something that she has brought from her outdoor trips and is excitedly showing it off. It gives Sonya a chance to socialise and gives me a break because I have younger children to look after. I know she really enjoys coming to Discovery Home, I can see it from her expressions.”
8. What more do we need to know? Barts Health Children’s Disability Team are further analysing CDT clinical data in order to be able to provide
population level information on diagnosis, genetics referrals and the level of developmental delay experienced;
Assurance as to whether relevant staff have the skills and knowledge to facilitate disabled children’s participation, including skills associated with working within a social model of disability (e.g. addressing accessibility issues such as making information accessible or removing barriers faced by young people with communication needs);
Analysis of potential cost savings and improved outcomes by having Occupational Therapy/dietetics support co-located;
How to reduce number of hospital appointments for children with disabilities and building outreach/care within the community;
Better understanding of the best ways of involving disabled young people in the services they use, and of how they would like to participate;
The number and profile of Looked After Children with disabilities;
ADHD: Clarity on the Tower Hamlets ADHD pathway, referral routes and multi-modal identification and intervention; further local research is required to establish local prevalence and the apparent discrepancy between national prevalence estimates and the local clinical picture;
Rates of children and young people from Tower Hamlets in the Youth Justice System and whether these reflect national estimates that they are over-represented.59
9. What are the priorities for improvement? 1. Review and learn from joint and single agency commissioning (and from what works well at Joint
Commissioning Panel) to support the development of integrated services; including use of section 75s, pooled budgets and joint appointments to overcome some of the complexity of funding & providing Education, Health and Care Plans;
2. For commissioners to be cognisent of new statutory obligations (Children and families Bill & the NHS Mandate) to work collaboratively and jointly commission services for children – using the Health & wellbeing board as the mechanism/vehicle to facilitate this. - Need to ensure sustainable provision of appropriately skilled nursing staff to support children’s medical needs during their short breaks and develop a sustainable response to issues arising around care during transport;
3. Experience of transition still needs to be improved, particular issues around preparing children and young people and their families for the reality that eligibility for adult services is more restricted – what might supporting families and CWD to build resilience and independence look like?
4. Need to review and address the challenges around meeting the accommodation needs of families and young people;
5. Family finding for Looked After Children with disabilities (approximately 26/year); 6. Review provision of services to meet mental health needs of adolescents with learning disabilities
59
Seen and Heard: supporting vulnerable children in the youth justice system (2010). Prison Reform Trust and the Association of Youth Offending Team Managers
Page 27 of 31
(prevalence of depression is higher in adolescents with learning disability than in than in their peers) in order to identify additional commissioning needs e.g. increasing counseling support for adolescents with disabilities, delivered by appropriately qualified practitioners.
7. Ensure that post diagnosis support (as delivered in Childrens’ Centres and by Childrens’ Society) is replicated and accessible at further key transition points during the parent/carer and child’s journey.
10. Contacts / Stakeholder Involvement
Contacts
NAME CONTACT DETAILS
AUTHORS
Simon Twite, LBTH Public Health Harriet Potemkin, LBTH Commissioning Manager, Children with Disabilities
UPDATED BY
SIGNED OFF BY
Stakeholders
Representatives from the Children with Disabilities Strategic Group, including the Service Manager, Integrated Service for Disabled Children and representatives from the Support for Learning Service, CAMHs, Youth Services, Parents Advice Centre, Children’s Commissioning Team, Family Support Forum and Tower Hamlets CCG Children and Young People’s Programme Board have been consulted during production of this JSNA. Their expertise and insights have been invaluable and are much appreciated.
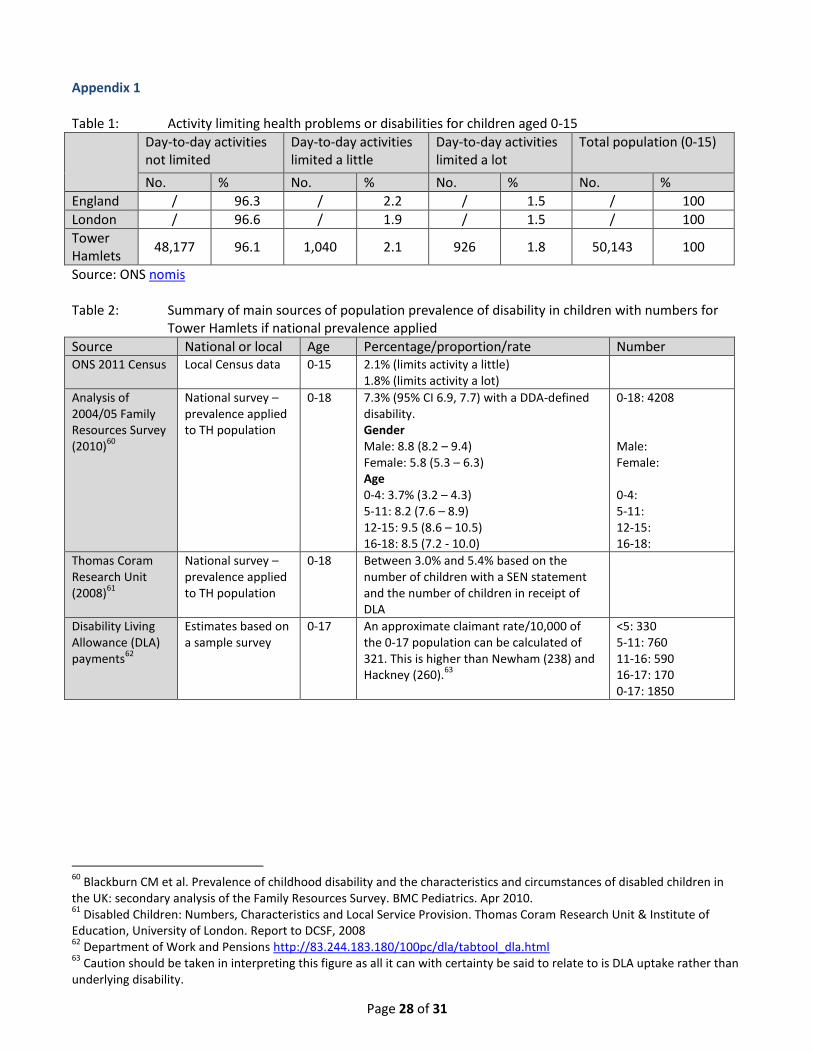
Page 28 of 31
Appendix 1 Table 1: Activity limiting health problems or disabilities for children aged 0-15
Day-to-day activities not limited
Day-to-day activities limited a little
Day-to-day activities limited a lot
Total population (0-15)
No. % No. % No. % No. %
England / 96.3 / 2.2 / 1.5 / 100
London / 96.6 / 1.9 / 1.5 / 100
Tower Hamlets
48,177 96.1 1,040 2.1 926 1.8 50,143 100
Source: ONS nomis Table 2: Summary of main sources of population prevalence of disability in children with numbers for Tower Hamlets if national prevalence applied
Source National or local Age Percentage/proportion/rate Number ONS 2011 Census Local Census data 0-15 2.1% (limits activity a little)
1.8% (limits activity a lot)
Analysis of 2004/05 Family Resources Survey (2010)
60
National survey – prevalence applied to TH population
0-18 7.3% (95% CI 6.9, 7.7) with a DDA-defined disability. Gender Male: 8.8 (8.2 – 9.4) Female: 5.8 (5.3 – 6.3) Age 0-4: 3.7% (3.2 – 4.3) 5-11: 8.2 (7.6 – 8.9) 12-15: 9.5 (8.6 – 10.5) 16-18: 8.5 (7.2 - 10.0)
0-18: 4208 Male: Female: 0-4: 5-11: 12-15: 16-18:
Thomas Coram Research Unit (2008)
61
National survey – prevalence applied to TH population
0-18 Between 3.0% and 5.4% based on the number of children with a SEN statement and the number of children in receipt of DLA
Disability Living Allowance (DLA) payments
62
Estimates based on a sample survey
0-17 An approximate claimant rate/10,000 of the 0-17 population can be calculated of 321. This is higher than Newham (238) and Hackney (260).
63
<5: 330 5-11: 760 11-16: 590 16-17: 170 0-17: 1850
60
Blackburn CM et al. Prevalence of childhood disability and the characteristics and circumstances of disabled children in the UK: secondary analysis of the Family Resources Survey. BMC Pediatrics. Apr 2010. 61
Disabled Children: Numbers, Characteristics and Local Service Provision. Thomas Coram Research Unit & Institute of Education, University of London. Report to DCSF, 2008 62
Department of Work and Pensions http://83.244.183.180/100pc/dla/tabtool_dla.html 63
Caution should be taken in interpreting this figure as all it can with certainty be said to relate to is DLA uptake rather than underlying disability.
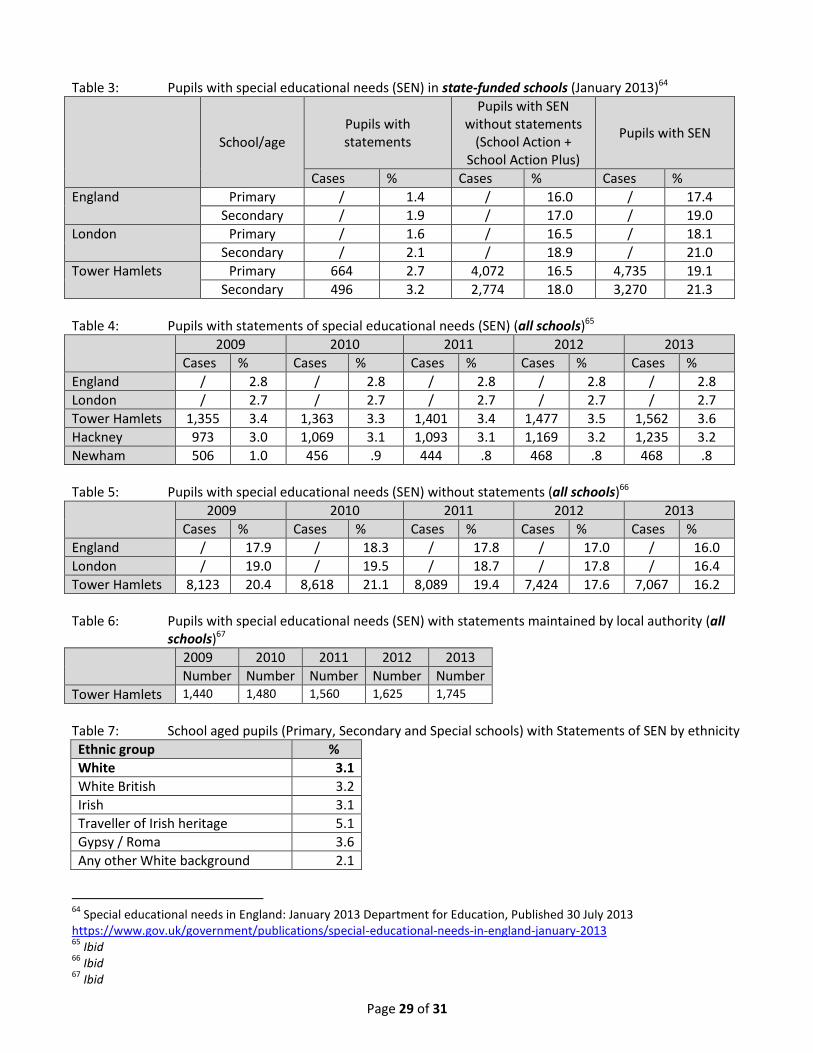
Page 29 of 31
Table 3: Pupils with special educational needs (SEN) in state-funded schools (January 2013)64
School/age Pupils with statements
Pupils with SEN without statements
(School Action + School Action Plus)
Pupils with SEN
Cases % Cases % Cases %
England Primary / 1.4 / 16.0 / 17.4
Secondary / 1.9 / 17.0 / 19.0
London Primary / 1.6 / 16.5 / 18.1
Secondary / 2.1 / 18.9 / 21.0
Tower Hamlets Primary 664 2.7 4,072 16.5 4,735 19.1
Secondary 496 3.2 2,774 18.0 3,270 21.3
Table 4: Pupils with statements of special educational needs (SEN) (all schools)65
2009 2010 2011 2012 2013
Cases % Cases % Cases % Cases % Cases %
England / 2.8 / 2.8 / 2.8 / 2.8 / 2.8
London / 2.7 / 2.7 / 2.7 / 2.7 / 2.7
Tower Hamlets 1,355 3.4 1,363 3.3 1,401 3.4 1,477 3.5 1,562 3.6
Hackney 973 3.0 1,069 3.1 1,093 3.1 1,169 3.2 1,235 3.2
Newham 506 1.0 456 .9 444 .8 468 .8 468 .8
Table 5: Pupils with special educational needs (SEN) without statements (all schools)66
2009 2010 2011 2012 2013
Cases % Cases % Cases % Cases % Cases %
England / 17.9 / 18.3 / 17.8 / 17.0 / 16.0
London / 19.0 / 19.5 / 18.7 / 17.8 / 16.4
Tower Hamlets 8,123 20.4 8,618 21.1 8,089 19.4 7,424 17.6 7,067 16.2
Table 6: Pupils with special educational needs (SEN) with statements maintained by local authority (all schools)67
2009 2010 2011 2012 2013
Number Number Number Number Number
Tower Hamlets 1,440 1,480 1,560 1,625 1,745
Table 7: School aged pupils (Primary, Secondary and Special schools) with Statements of SEN by ethnicity
Ethnic group %
White 3.1
White British 3.2
Irish 3.1
Traveller of Irish heritage 5.1
Gypsy / Roma 3.6
Any other White background 2.1
64
Special educational needs in England: January 2013 Department for Education, Published 30 July 2013 https://www.gov.uk/government/publications/special-educational-needs-in-england-january-2013 65
Ibid 66
Ibid 67
Ibid
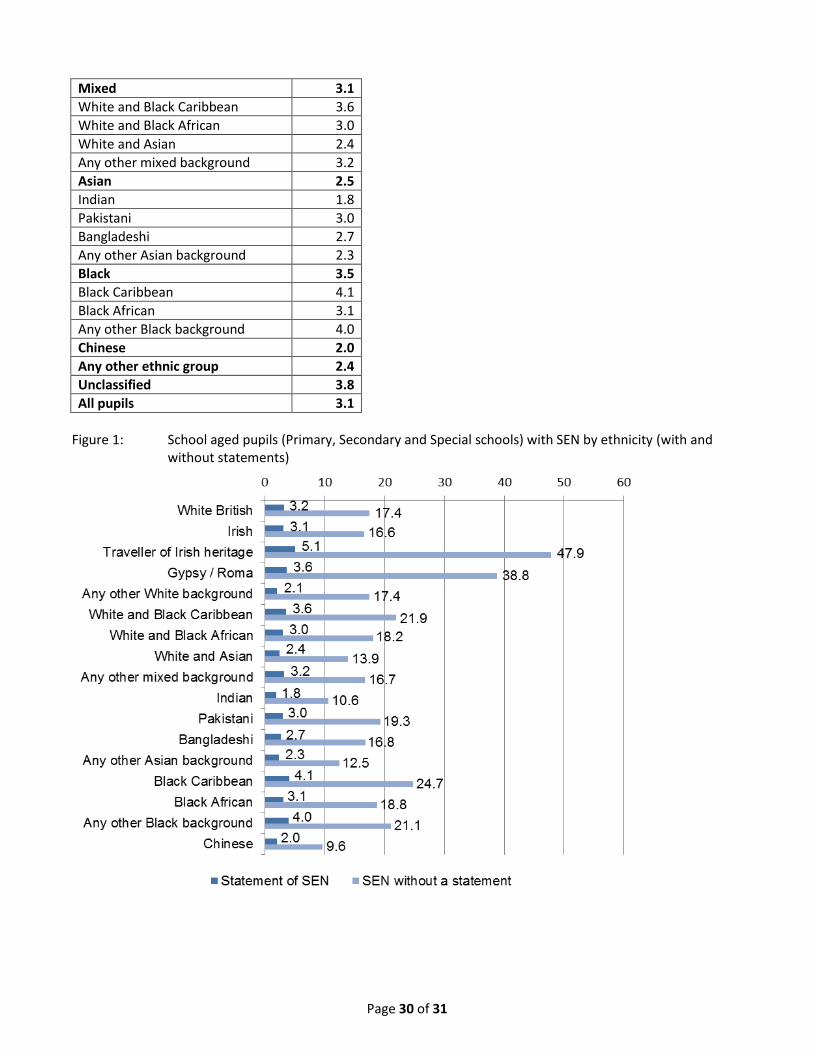
Page 30 of 31
Mixed 3.1
White and Black Caribbean 3.6
White and Black African 3.0
White and Asian 2.4
Any other mixed background 3.2
Asian 2.5
Indian 1.8
Pakistani 3.0
Bangladeshi 2.7
Any other Asian background 2.3
Black 3.5
Black Caribbean 4.1
Black African 3.1
Any other Black background 4.0
Chinese 2.0
Any other ethnic group 2.4
Unclassified 3.8
All pupils 3.1
Figure 1: School aged pupils (Primary, Secondary and Special schools) with SEN by ethnicity (with and
without statements)
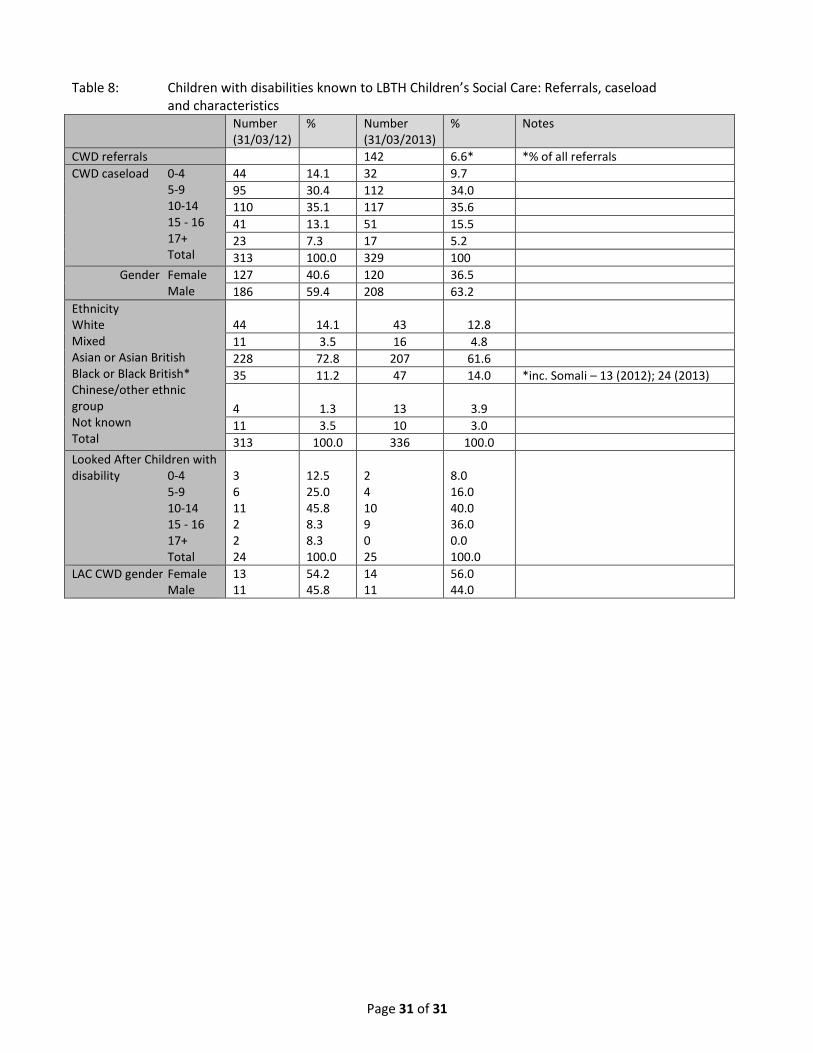
Page 31 of 31
Table 8: Children with disabilities known to LBTH Children’s Social Care: Referrals, caseload and characteristics Number
(31/03/12) % Number
(31/03/2013) % Notes
CWD referrals 142 6.6* *% of all referrals
CWD caseload 0-4 5-9 10-14 15 - 16 17+ Total
44 14.1 32 9.7
95 30.4 112 34.0
110 35.1 117 35.6
41 13.1 51 15.5
23 7.3 17 5.2
313 100.0 329 100
Gender Female Male
127 40.6 120 36.5
186 59.4 208 63.2
Ethnicity White Mixed Asian or Asian British Black or Black British* Chinese/other ethnic group Not known Total
44
14.1
43
12.8
11 3.5 16 4.8
228 72.8 207 61.6
35 11.2 47 14.0 *inc. Somali – 13 (2012); 24 (2013)
4 1.3 13 3.9
11 3.5 10 3.0
313 100.0 336 100.0
Looked After Children with disability 0-4 5-9 10-14 15 - 16 17+ Total
3 6 11 2 2 24
12.5 25.0 45.8 8.3 8.3 100.0
2 4 10 9 0 25
8.0 16.0 40.0 36.0 0.0 100.0
LAC CWD gender Female Male
13 11
54.2 45.8
14 11
56.0 44.0