cieh food poverty - front cover - safefood.eu ·...
TRANSCRIPT


Food Poverty and Policy in Northern IrelandAuthors: Purdy J., McFarlane G., Harvey H., Rugkasa J. andWillis K.
Food |foōd|nounany nutritious substance that people or animalseat or drink, or that plants absorb, in order tomaintain life and growth: cans of cat food | babyfoods.
Phrasesfood for thought something that warrantsserious consideration.
Originlate Old English fōda, of Germanic origin; relatedto fodder.
Poverty | päv rtē|nounthe state of being extremely poor: thousands offamilies are living in abject poverty.• the state of being inferior in quality orinsu cient in amount: the poverty ofher imagination.• the renunciation of the right to individualownership of property as part of a religious vow.
OriginMiddle English: from Old French poverte, fromLatin paupertas, from pauper ‘poor.’
e


On behalf of the Public Health Alliance for the island of Ireland, we would liketo express our sincere thanks and appreciation to all those who have beeninvolved in this research project and the production of this report.
Particular thanks are due to the collaborating research organisations and theirrepresentatives who participated in the management of this project as well asproviding input to the Research Advisory Group. They were as follows:
Dr Joanna Purdy Public Health AllianceGary McFarlane Public Health Alliance
Chartered Institute of Environmental HealthDr Harold Harvey University of UlsterJorun Rugkasa Institute of Public Health in IrelandKim Willis Chartered Institute of Environmental Health
We would also like to extend our thanks to the additional members of theResearch Advisory Group, listed below, for their continual support andguidance throughout the duration of the study.
Dr Sinead Furey General Consumer CouncilMs Andrea Marnoch Food Standards Agency NIMr Damien Martin Department of Health Social
Services and Public SafetyDr Thomas Quigley Safefood
We are particularly grateful to those who participated in the stakeholderinterviews, giving generously of their time to share their knowledge andunderstanding of food poverty, explain the various initiatives they have beeninvolved in and discuss their view of current government policy. We wouldalso like to thank Mrs Patricia Allison for the transcription of the interviewrecordings.
A very special word of thanks is extended to the focus group participants,those members of the public, who allowed us the privilege of meeting withthem and kindly gave of their time to openly and honestly discuss the issue offood poverty and share their experiences with us.
We would also like to extend our thanks and appreciation to Miss DonnaDrummond (Chartered Institute of Environmental Health) for the substantial
administrative support throughout the duration of this research study and toMiss Helen Gilmore (Chartered Institute of Environmental Health) and MissElaine McMackin (QUB Student) for their assistance and input to theproduction of the report and associatedlaunch event.
Finally, we are also grateful to the following individuals for their important rolein the production of this report:
Ms Hilary Curley EditorMs Mary O’Meara proof readingMrs Vanessa Goucher proof reading
01
Food Poverty - fact or fiction?
Acknowledgements

This welcome and insightful report comes at an opportune time in thedevelopment of Northern Ireland. As Northern Ireland moves towardsmore self determination it provides a case for the new administration totackle the food poverty/insecurity and consequent social exclusion thatimpact on a large proportion of its population. It is important toremember that over half of Northern Ireland’s population have incomes ofless than £300 per week with a high concentration of individuals below the60% of the United Kingdom median and 50% of the United Kingdommean.1
Compared to the rest of the UK, NI’s income distribution is biased towardsthe lower end. What this means is that there is a greater percentage on lowincomes and dependant on benefits in NI than the rest of the UK.
The picture is complicated by the existence of areas of deprivation side byside with affluent areas in NI. These areas of deprivation have traditionallyexperienced the withdrawal of basic services and amenities, including thefood retailers, who increasingly site their stores either out of town, for carowning consumers, or in areas where richer people live or work. Not allpoor households live in such areas of multiple deprivation, but many doand the likelihood increases as income falls. Equally not all poorhouseholds experience an unhealthy diet, some by dent of personal skills,imagination and use of resources, such as growing their own food, eat welland clearly care about what they eat. But, in order to achieve this they haveto adopt strategies that those in more fortunate circumstances do not haveto resort to as a means for survival.
The great strength of this report is that it locates food poverty not withinpersonal consumer or choice agendas but by using multiple data sets andperspectives it shows the complexity of the issues and points out thatstructures matter. While individual issues such as cooking skills can be afactor in acerbating food poverty they are not the only factor and simplytackling individual aspects of food poverty will not address the overallissue of moving people out of food poverty. It you are on the high end ofthe income scale and can’t cook then you can buy your way out of theproblem by buying healthy (processed) foods and fresh fruit, if you arepoor, you can’t afford to try out new things and if you can’t cook then youhave a double burden, but cooking skills will only help people manage inalready dire circumstances. To get access to a healthy diet can necessitatethe expense (in time as well as money) of travel by car or public transport.Thus the price of transport is an additional or externalised cost.
The important aspect here of food poverty, that no research canadequately capture, is the daily grind and struggle to manage on aninadequate budget and the effect this has on morale and self esteem. Foodpoverty is hidden from public view, it is hard to talk about not havingenough while those around you seem to be partaking in a food culturethat is exciting and built on excess.
The way forward demands a combination of policies and actions linked tothese, so that the vulnerable in our society have sufficient resources toafford and access healthy food in line with their cultural and preferredtastes. Benefits and income levels should to be set against minimumhealthy eating criteria, welfare schemes such as free school meals and theWelfare Food Scheme should be revised and extended to remove stigma.Tackling food poverty needs to be seen in a public health light where thebenefits accruing from tackling food poverty are measured in future healthgains.
The conclusions and recommendations to this report demand action andnot just the development of another ‘strategy’. There is clearly a lot ofpolicy activity in NI and the solution lies in tying up the various policies toaddress food poverty and some other problems at the same time. Theconsequences of food poverty are enormous, we are in a situation wherepublic spending is increasingly being devoted to risk aversion and thesymptoms ( e.g. preventing obesity) but not to risk prevention (such aspublic health or redistribution to rectify inequalities). Tackling foodpoverty needs to be re-conceptualised not as a cost but as an investmentin the future health of vulnerable groups in our society.
Finally I wish to thank and congratulate the authors of this report for itsclarity of vision and demonstration of a clear set of actions to tackle theproblem, to paraphrase a famous philosopher, the point is not to describethe problem but to change it and this admirable report provides us with ablueprint to do exactly that.
Martin CaraherReader in Food and Health PolicyCentre for Food PolicyCity University
1Department for Social Development (2007) Households Below AverageIncome: An analysis of the income distribution in Northern Ireland 2005/06.Belfast: Department for Social Development.
Foreword

Food Poverty - fact or fiction?
03
‘Everyone has the right to a standard of living adequate for the health andwell being of himself and of his family, including food, clothing, housingand medical care and necessary social services.’
For most developed nations many health, social and economic indicatorssuggest things have never been better. Generally, life expectancy is high,national wealth is on an upward trajectory and food is in abundance. Whyis it then, that in a rich country like Northern Ireland almost 30 percent livein poverty and many marginalised and socially disadvantaged groups areoften without a nutritious and enjoyable diet, suffering the associatedpoor health and social consequences? Northern Ireland, like the Republicof Ireland, does indeed experience food poverty and this is shameful.
There is a misconception that poor dietary choice is the fault of thefeckless poor. Individuals and families are embedded within social,economic and political systems that shape dietary choices. The experienceof food poverty is strongly affected by structural, financial andpsychosocial matters that often arise through exclusionary processesleading to unemployment, low incomes, poor housing and familybreakdown. Unless policy and practice responses address these ‘causes ofthe causes’ and pay attention to structural and material factors, littleimpact will be made in the prevention of food poverty.
Colleagues in the Public Health Alliance, Ireland have compiled a rich andpowerful report that supports such action on the societal causes of foodpoverty. It highlights that many of the causes of food poverty lie outsidethe health sector, with a clear need for joined up government action withcommunity involvement. Together with the growing evidence base in theRepublic of Ireland such as the food poverty work commissioned by theCombat Poverty Agency and the Standard of Healthy Living on the Islandof Ireland study commissioned by the Food Safety Promotions Board, itwill provide a scientific basis for public health action that goes beyondindividual level skill development and will assist in striving towards socialjustice and health for all.
Sharon Friel PhDPrincipal Research FellowWHO Commission on Social Determinants of Health
Foreword

Food Poverty - fact or fiction?
05

The incidence of food poverty is intrinsically bound up with that of income,poor dietary intake, lifestyle patterns and health inequalities. While extensiveresearch on this issue has been conducted in Great Britain and to somedegree in the Republic of Ireland, food poverty in Northern Ireland has notbeen explored to any great extent.
This study aims to address this deficit and documents the current state offood poverty in Northern Ireland particularly highlighting inequalities indietary behaviour. There are a number of specific objectives related to theproject:
• To document the nature and extent of social inequality in food and foodpoverty in Northern Ireland using existing data;
• To identify and assess current policy responses to food poverty inNorthern Ireland;
• To identify priority areas and make recommendations for current andfuture policy;
• To heighten awareness at both strategic and operational level of the issueof food poverty and the implications for public health and stimulateaction on the same; and
• To provide clearer understanding and create opportunities for an allisland collaboration to tackle food poverty.
1.1 Methodology
A number of different research tools were used during the course of thisstudy:
(a) Analysis of existing food consumption and expenditure data:
An extensive review and analysis of a wide range of data sets relating to foodconsumption and expenditure patterns as well as data on consumer attitudesto food, diet and health. This data was collated, reviewed and analysed fromthe following sources:• Expenditure and Food Survey (2005)1
• Food Standard’s Agency Consumer Attitudes Survey (2005)• Safefood Consumer Tracking Survey (2004)• Health Promotion Agency’s Health and Lifestyle Survey (2002)• Invest NI and Bord Bia Periscope Research (2005)
• Bord Bia and Food Strategy Implementation Partnership (FSIP) ShopperSurvey (2006)
(b) Analysis of the current policy environment
An extensive review of existing government policies considered relevant tofood poverty, was undertaken. They related to diet, public health, healthinequalities, poverty, education, sustainable development, agriculture,transport and social development and were examined with the followingquestions in mind:
• Is there any reference to diet / health / nutrition?• Is there any specific reference to food poverty?• Does the policy paper highlight / address any of the key factors
contributing to food poverty?• Is there any evidence of building on progress to date?• Do the proposals documented in the policy paper go far enough?• To what extent will these proposals affect the lives of those experiencing
food poverty?• Have any key issues been omitted?• Is the focus of the policy paper on one particular area, with a lesser focus
on other areas?• Is there evidence of a joined up approach to tackling food poverty at a
national / local level?• Is food poverty being addressed within the context of health
inequalities?• Is there over emphasis on any one area of food poverty?• What evidence is there of all island collaboration to address the issue of
food poverty?
(c) Interviews with key stakeholders
The purpose of these interviews was to collate a wide range of perspectiveson interviewees’ knowledge and awareness of food poverty in terms of thecontributory factors, its effects on health, those most at risk or likely to beexperiencing food poverty, and the implementation of strategies and/orinitiatives developed to tackle food poverty. Key stakeholders includedrepresentatives from the relevant government departments, statutory andpublic bodies, academics, private sector and the community and voluntarysectors (see appendix 1 for list of organisations represented).
Chapter 1 - Introduction

A subsequent seminar for key stakeholders was held in October 2006. Thisevent attracted wide representation from those who had previouslyparticipated in the interviews. A report was produced and disseminated toparticipants following the event.
(d) Focus groups comprising of people at risk or likely to beexperiencing food poverty
A series of focus groups were conducted with those considered to be at riskor likely to be experiencing food poverty2. The purpose of the focus groupswas to identify the dynamics of food poverty at micro level involving thecomplex life situations of people who experience food poverty and how theymanage their diet in the context of competing demands in terms ofeconomic, social and cultural factors.
A total of 10 focus groups were conducted, representing each of the targetgroups. Ethical approval was obtained from the University of Ulster ResearchGovernance Filter Committee to conduct focus groups as part of this researchstudy.
1.2 Structure of the report
The report starts off with an exploration of food poverty in Chapter 2. It looksat the incidence of poverty generally in Northern Ireland, explains what foodpoverty is and explains the link between food poverty and social exclusion.
Chapter 3 is devoted to the subject of health and how it is affected by foodpoverty. It provides detailed information on the nutrient and foodconsumption patterns of people in Northern Ireland analysed in a number ofdifferent ways: (a) by income (b) by employment status (c) by householdcomposition and (d) by household reference person – referring to the age ofthe person who participated in the survey from that household.
The majority of this report is devoted to examining the factors that contributeto food poverty in Chapter 4. These are broken down into economic, socialand physical factors and each section provides a comprehensive analysistouching on all the elements that affect or are affected by food poverty. At
the end of the chapter, feedback from the focus groups held with key targetgroups is provided. This data paints a picture of the every day reality andissues experienced by the people of Northern Ireland who are particularlyvulnerable to food poverty.
Chapter 5 documents and analyses the various Government policies andinitiatives that have an impact on food poverty.
Finally, Chapter 6 draws a series of conclusions from the preceding chapterscoupled with recommendations.
1The Expenditure and Food Survey (EFS) is national survey of food expenditurepatterns from which consumption data and nutritional intake can bedetermined. For the purposes of this research, the Northern Ireland data wasextrapolated from the national UK sample. However, due to the way in which thedata is analysed and made available, it is not possible to conduct any furtherstatistical analysis of the Northern Ireland sub-set and therefore the resultspresented in this report are of a descriptive and comparative nature.
2Earlier analysis of the Expenditure and Food Survey data revealed that loneparent families, large families (4+ children), older people and low incomehouseholds (particularly those where the head of household was unemployed)were most likely to have the poorest dietary intake and most likely to be spendingthe least amount of money, but greater proportion of their household budget onfood. It was agreed that representatives from each of these target groups shouldbe invited to participate in the focus groups.
07
Food Poverty - fact or fiction?
Chapter 2 - Understanding food poverty
2.1 Poverty in Northern Ireland
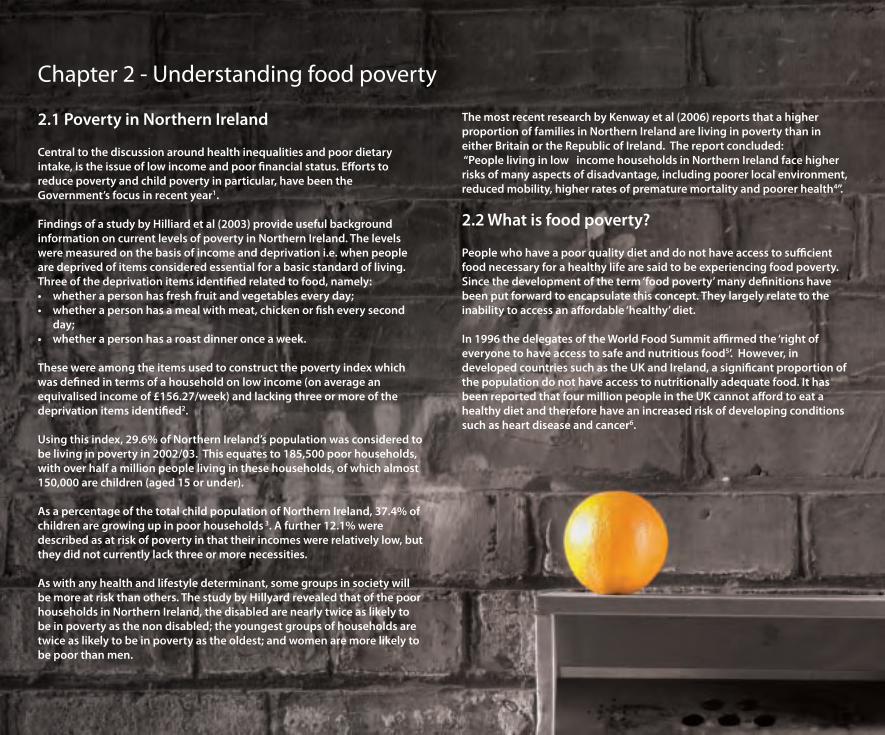
Central to the discussion around health inequalities and poor dietaryintake, is the issue of low income and poor financial status. Efforts toreduce poverty and child poverty in particular, have been theGovernment’s focus in recent year1.
Findings of a study by Hilliard et al (2003) provide useful backgroundinformation on current levels of poverty in Northern Ireland. The levelswere measured on the basis of income and deprivation i.e. when peopleare deprived of items considered essential for a basic standard of living.Three of the deprivation items identified related to food, namely:• whether a person has fresh fruit and vegetables every day;• whether a person has a meal with meat, chicken or fish every second
day;• whether a person has a roast dinner once a week.
These were among the items used to construct the poverty index whichwas defined in terms of a household on low income (on average anequivalised income of £156.27/week) and lacking three or more of thedeprivation items identified2.
Using this index, 29.6% of Northern Ireland’s population was considered tobe living in poverty in 2002/03. This equates to 185,500 poor households,with over half a million people living in these households, of which almost150,000 are children (aged 15 or under).
As a percentage of the total child population of Northern Ireland, 37.4% ofchildren are growing up in poor households 3. A further 12.1% weredescribed as at risk of poverty in that their incomes were relatively low, butthey did not currently lack three or more necessities.
As with any health and lifestyle determinant, some groups in society willbe more at risk than others. The study by Hillyard revealed that of the poorhouseholds in Northern Ireland, the disabled are nearly twice as likely tobe in poverty as the non disabled; the youngest groups of households aretwice as likely to be in poverty as the oldest; and women are more likely tobe poor than men.
The most recent research by Kenway et al (2006) reports that a higherproportion of families in Northern Ireland are living in poverty than ineither Britain or the Republic of Ireland. The report concluded:“People living in low income households in Northern Ireland face higherrisks of many aspects of disadvantage, including poorer local environment,reduced mobility, higher rates of premature mortality and poorer health4”.
2.2 What is food poverty?
People who have a poor quality diet and do not have access to sufficientfood necessary for a healthy life are said to be experiencing food poverty.Since the development of the term ‘food poverty’ many definitions havebeen put forward to encapsulate this concept. They largely relate to theinability to access an affordable ‘healthy’ diet.
In 1996 the delegates of the World Food Summit affirmed the ‘right ofeveryone to have access to safe and nutritious food5’. However, indeveloped countries such as the UK and Ireland, a significant proportion ofthe population do not have access to nutritionally adequate food. It hasbeen reported that four million people in the UK cannot afford to eat ahealthy diet and therefore have an increased risk of developing conditionssuch as heart disease and cancer6.
Food Poverty - fact or fiction?
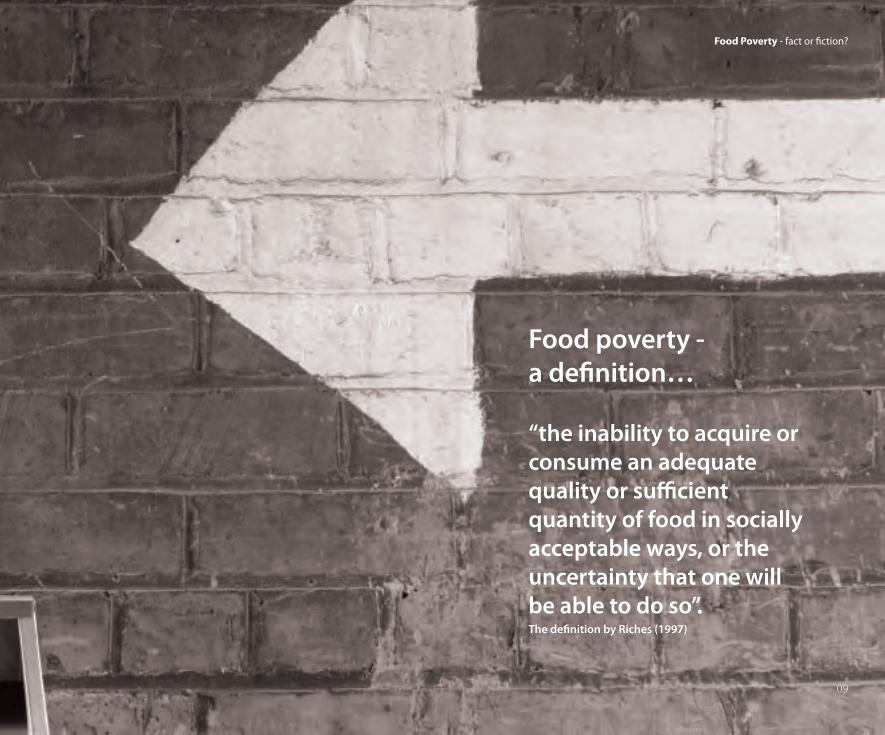
Food poverty -a definition…
“the inability to acquire orconsume an adequatequality or sufficientquantity of food in sociallyacceptable ways, or theuncertainty that one willbe able to do so”.The definition by Riches (1997)
09

In a recent study of food poverty in Ireland, Friel and Conlon (2004) definedfood poverty as “the inability to access a nutritionally adequate diet and therelated impacts on health, culture and social participation”. The definition byRiches (1997) goes somewhat further in suggesting that food poverty is “theinability to acquire or consume an adequate quality or sufficient quantity of foodin socially acceptable ways, or the uncertainty that one will be able to do so”.
An earlier definition by Anderson (1990) also captured the issues highlightedby more recent authors, with emphasis on the limited or uncertain availabilityof nutritionally adequate and safe foods and the inability to acquireacceptable foods in socially acceptable ways. Leather (1997) provides a moredetailed definition of food poverty, with references to specific issues of price,income and money management, as well as geographical, social, practicaland cultural access to good quality, affordable food.
Definitions by the Food Poverty Network and National Food Alliance (2000)describe food poverty as having a lack of money, inadequate shoppingfacilities and poor transport culminating in people being denied healthy foodchoices or being unable to eat an adequate diet.
With many definitions highlighting the negative aspects and effects of foodpoverty, in contrast, Maxwell (1996) considers the issue in terms of foodsecurity. He describes food security as “access to sufficient, affordable, safe andnutritious food necessary and appropriate for a healthy life, and the security ofknowing such access is sustainable in the future”.
It is important to take account of the latter part of this definition, andconsider the implications for sustaining a healthy diet, especially for lowincome consumers. Measures can be put in place to alleviate the immediateeffects of food poverty, but addressing the longer term issues, presents aparticular challenge for Government and those working directly withindividuals and communities experiencing food poverty.
Food poverty is a complex and multi-factorial issue. Food poverty does notonly negatively affect dietary intake, but has important implications in termsof lifestyle patterns, social interaction and ultimately health status.
2.3 Factors contributing to food poverty
Food poverty is determined primarily by issues of access and availability andthe factors contributing to food poverty can be broadly categorised aseconomic, social and physical (see Chapter 4).
The inability to access the necessary finance, coupled with inadequatephysical resources and networks (i.e. local supermarkets, access to transport)are at the centre of the food poverty issue. Availability of information tofacilitate healthy food choices, the variety of food products available forpurchase and the skills and facilities available to prepare and cook food fromfresh, raw ingredients are also important in determining dietary intake. Inaddition to these factors, the inability of consumers to purchase and eat foodin a way appropriate to their culture and societal norms is now considered amajor determinant of food poverty.
With a wide and varied range of factors contributing to food poverty, it isimpossible to quantify the effect of each on dietary intake and nutritionalstatus. Some authors argue that economic considerations have the greatestimpact on food purchased and consumed7, whilst others would placeconsiderable emphasis on the impact of radical changes in food retailing onthe dietary intake of consumers8.
Chapter 2 - Understanding food poverty

2.4 Food poverty and social exclusion
Food poverty is a not an isolated issue that results in poor dietary intake andsubsequent ill health. Food poverty is an outcome of the wider effects ofsocial exclusion. Social exclusion is a combination of linked problems such asunemployment, discrimination, poor skills, low incomes, poor housing, highcrime, bad health and family breakdown9. Just as income poverty has aconstraining effect on the way people live their lives, so food poverty affectssocial behaviour and causes or exacerbates social exclusion.10
The Social Exclusion Unit located in the Office of the Deputy Prime Minister,London (2004) highlighted the five key problems that continue to drive socialexclusion.
These are:• low educational attainment among some groups;• economic inactivity and concentrations of worklessness;• health inequalities;• concentrations of crime and poor quality environments in some areas; and• homelessness.
The key drivers of social exclusion also contribute to the prevalence of foodpoverty in disadvantaged communities. Dowler (2003) has commented thatpoverty and deprivation have contributed synergistically to food poverty. Thisview is endorsed by several UK authors who have argued that social exclusionis an integral part of food poverty because those affected are forced to adoptfood consumption patterns and food acquisition strategies that fall outsidesocial norms.11
Cornell et al (1996) add to the discussion, by highlighting that the social andcontextual pressures make the exercise of individual choice more difficult forsome people than others. Dowler (2001) suggests that the focus of attentionneeds to be firstly, on accessibility, affordability and practicality. Secondly,there is the challenge of relevance and motivation: how to enableparticipation and ownership of practices and activities whose purpose isoften future well being, as well as present pleasure, for those whose mainfocus is survival, both of the household unit, and in terms of daily living.
Food poverty constitutes a major barrier to consuming and sustaining ahealthy diet and ultimately securing good health status and is thereforeinextricably linked to social exclusion.
2.5 Summary
• People living in poverty are particularly at risk of poor dietary intake andhealth inequalities.
• 29.6% of Northern Ireland’s population was living in poverty in 2002/2003.
• Some groups are more at risk than others such as people with disabilities,the youngest groups of households and women.
• Food poverty is about the inability to access an affordable ‘healthy’ diet. Itis a complex and cross cutting issue touching on finance, education,transport, literacy, culture, retailing and planning.
• Food poverty is an outcome of the wider effects of social exclusionresulting from problems such as unemployment, poor skills, low incomes,poor housing, high crime, bad health and family breakdown.
11
Food Poverty - fact or fiction?
In both the north and the south ofIreland, the all causes mortality rate inthe lowest occupational class was100 - 200% higher than the rate in thehighest occupational class.Institute of Public Health (2001)

There are many factors which affect our health, including: income, early lifeexperience, education, employment, housing and environmental conditions,stress, social support and food and nutrition.12 The impact of these influenceson health is greater for some groups in society than others. People on lowincomes, with poor employment opportunities or low levels of education areat an increased risk of ill health and likely to experience signifigantinequalities in terms of their health status. This is what is known as healthinequality i.e. poorer health and a shorter lifespan as a result of being lesswell off.
Inequalities in health emerge as a result of many aspects of daily life and inparticular though poor dietary intake and inadequate nutritional status. Inthe evidence presented to the Independent Inquiry into Inequalities inHealth, by Sir Donald Acheson, Nelson (1999) reported “there is good evidencethat inequalities in access to and consumption of a healthy diet lead toinequalities in health”. This has been endorsed by James et al (1997) withevidence from past studies concerned with variations in health across a rangeof nutritional exposures.
Potential health issues which may arise through poor diet as a result of notbeing able to access good quality, nutritious food i.e. food poverty, is likely toresult in a range of other health problems. Typically, diet related healthproblems include hypertension, diabetes, heart disease, stroke and somecancers.13
Dietary consumption patterns which are more likely to contribute to theonset of these conditions and diseases, are typified by high intakes of fat,sugar and salt and low consumption of essential vitamins, minerals anddietary fibre. Diets of this nature tend to be more prevalent among lowincome consumers and are generally comprised of low cost energy fromfoods that are high in fat and refined sugars and low in vegetables and fruit.14
James et al (1997) have reported that such diets are lower in essentialnutrients such as calcium, iron, magnesium, folate and vitamin C. This studyalso noted that new nutritional knowledge on the protective role ofantioxidants and other dietary factors suggests that there is scope forenormous health gain if a diet rich in vegetables, fruit, unrefined cereal, fishand small quantities of quality vegetable oils could be made more accessibleto those who are less well off.
Whilst obesity is not a direct outcome of food poverty, it is clear that there arestrong associations between both. The causes of overweight and obesity arewell understood and widely documented. A diet high in fat and sugar,coupled with little or no physical activity, results in an energy imbalance andultimately excessive weight gain over time.
Research suggests that overweight and obesity is more prevalent amongthose in the lower income groups and with low levels of education15. Theinability to access nutritious, affordable foods often results in an over relianceon low cost, high energy alternatives. These foods typically comprise readymeals, processed meat products and snack foods such as crisps,confectionary, cakes and biscuits. Based on these observations, parallels canbe drawn between the incidence of food poverty and obesity.
The extent of the emerging obesity epidemic has received much publicity inrecent years. Overweight and obesity among adults and children is a growingproblem, which appears to have reached epidemic levels.16
A major study by the Food Standards Agency (FSA) in 2007 (Low Income Dietand Nutrition Survey – LIDNS) which investigated the dietary habits andnutritional status of the low income population in the UK provides valuabledata not previously available with such a large sample. It revealed thefollowing key dietary patterns among the low income population sample:• Consumption of oily fish is substantially lower than the current
recommendation by FSA to consume at least one portion a week.• Younger children (aged 2-10 years) tended to consume more whole milk,
yogurt and other dairy products than older children.• Older children (aged 11-18 years) had a higher consumption of processed
meat products compared to younger children.• People on low incomes were less likely to consume wholemeal bread and
vegetables.• People on low incomes tended to consume more fat spreads and oils; non
diet soft drinks; red meat; pizza; processed meats; whole milk; and sugar.• People on low incomes consumed fewer portions of fruit and vegetables
than the general population.
Earlier studies which examined fruit and vegetable consumption across theentire population revealed the UK had the lowest per capita intake of fresh
Chapter 3 - Food poverty and health

13
Food Poverty - fact or fiction?
fruit and vegetables of the EU member states.17 Surveys in 15EU countries show that low income households have thelowest fruit and vegetables intakes.18 Findings from the WHOGlobal Burden of Disease study estimated that the currentlow fruit and vegetable intake causes up to 31% of heartdisease and 19% of stroke.19
The awareness of the health benefits of fruit and vegetableconsumption has been increasing over the last decade, withclear evidence of the protective effect for coronary heartdisease, stroke, diabetes, obesity and some cancers. Studiesshow that people who consume larger amounts of fruit andvegetables have lower rates of coronary heart disease andthat there are also beneficial effects in reducing rates ofdisease recurrence.20
However, consumption of the recommended intake of fruitand vegetables and other ‘healthy’ food products remains lowamong low income consumers in particular. The reasons forlow intakes of good quality, nutritional food are many and arean important consideration in the existence of food povertyin developed societies.
3.1 Diet and food consumption
The 2005 Expenditure Food Survey (EFS) (Office of NationalStatistics) is a survey of food expenditure patterns across theUK which assists in identifying food consumption patternsand nutritional intake. For the purposes of this study, the datafor Northern Ireland (NI) has been extracted from the maindata set in order to allow specific analysis. The survey foundan overall general trend emerging of a high intake ofsaturated fat and protein, lower than recommended intake offibre and high salt consumption. When the data for NI isconsidered, it can be seen that:
Gro
ssN
orm
alW
eekl
yH
ouse
hold
Inco
me
£’s
(200
3-20
04)
Sour
ce:N
orth
ern
Irel
and
Stat
istic
san
dRe
sear
chA
genc
y–
Cent
ralS
urve
yU
nit
£116£236
£389
£599
£1259£1300
0
Income Quintile
1Lowest
2 3 4 5Highest
• The overall sample population of Northern Ireland has a higher thanrecommendedenergy intake when it came to food and drink eaten outside the home.
• Protein intake was over one and a half times the recommended intake.• Consumption of sodium was twice the recommended intake.• The energy intake from fat was one and a half times the recommended allowance.• Energy intake from carbohydrate was also higher than the recommended intake.• Fibre intake was just over three quarters of the recommended daily allowance.
The data was also examined across a range of variables to compare and contrast thediet and food consumption patterns of people living in different situations. Thecategories chosen were (a) Income (see Table 1) (b) Household Composition (c)Employment Status (d) Age of Household Reference Person. 3
Table 1 Income Quintile

The following sections present the analysis of the data specific to NI asextracted from the EFS according to the four variables outlined on theprevious page. For each parameter, the data is summarised under twoheadings, namely (i) overall nutrient intake and (ii) food consumption (i.e.information relating to the specific type of foodstuffs that are consumedand contribute towards overall diet).
3.1.1 Income
Table 2 Nutrient intake by income (see diagram opposite)
(a) Nutrient intake
Evidence from the EFS showed that as a person’s income increased, theirenergy intake decreased except for those in the highest income bracket(as shown in Table 2).
People in income bracket 2 had the highest energy intake from fat whilethose at the higher end of the income scale had the highest energy intakefrom protein. This suggests a higher intake of meat, meat products and/orfish which are good sources of protein.
People at the lower end of the income scale had the highest energyintake from carbohydrate sources and also had a high consumption offibre, both of which could indicate a high intake of bread and cerealproducts. These are a cheap source of energy requiring minimal storageand preparation and therefore indicative of higher consumption patterns.
Although not documented in detail in this report, interestingly, it is themiddle earners people in the third income bracket – that had the lowestdaily nutrient intake. There is a considerable body of evidence to suggestthat as socio economic status increases dietary intake improves.21
However, based on this data set, there is no consistent pattern in relationto improvements in nutrient intake as income increases.
For the middle income earners, this could be attributed to a number offactors: they are more likely to be families who have other householdexpenses such as a mortgage, childcare, cars and education which drawson resources which would otherwise be used to purchase more nutritious
Table 2 Nutrient Intake by IncomeChapter 3 - Food poverty and health
10
2500
0
100
2 3 4 5
1 2 3 4 5
2414
.6(1
0.1)
2375
.8(1
0.0)
2252
.4(9
.5)
2245
.7(9
.4)
2302
.7(9
.7)
Ener
gyKc
al(M
J)
Income Quintile
Income Quintile
Ener
gy%
Fat
Prot
ein
Carb
ohyd
rate
36.0
13.2
52.1
37.1
13.4
51.0
36.0
13.0
51.2
36.3
13.5
50.1
36.1
13.6
51.0

15
Food Poverty - fact or fiction?
food; alternatively, this could reflect that the middle income earners areperhaps endeavouring to balance a busy home/work life schedule andtherefore are more reliant on convenience foods which are often of poornutritional quality, resulting in lower than expected nutrient intake.
(b) Food consumption
Note: A diagramatical analysis of high patterns of food consumptionaccross each of the four variables can be found on page xx.
Persons in the lowest income bracket had a higher than average intake ofmilk and cream than those in all other income brackets. The opposite wasobserved for consumption of cheese, with those at the top end of theincome scale consuming the greatest quantity. This could be attributedprimarily to the cost of cheese and it’s availability as a speciality itemwhich costs more.
Interestingly, the largest average weekly intake of all carcass meat (itshould be noted that carcass meat includes minced meat) was consumedby people in the second lowest income bracket. There was a trendtowards increased consumption of bacon, ham and canned meats bylower income earners, which could be attributed to ease of storage andpreparation. Larger quantities of mutton, lamb and pork were consumedby people at the higher end of the income scale.
Consumption of prepared meats, pies and sausage rolls was similar acrossall income brackets with people in the second highest income bracketlikely to consume ready made meals. The high consumption is likely to bedue to minimal preparation and cooking, as a result of limited time toprepare a meal from fresh, raw ingredients.
There was also a greater consumption of takeaway meat based meals andpizzas as income quintile increased. This is likely to be due to the additionaldisposable income available to purchase ready prepared foods in additionto a lifestyle requirement for convenience. Again, this could be attributedto the demand for convenience among ‘cash rich, time poor’ consumers.Intake of chips cooked at home and takeaway chips was highest amongpeople in the lower income categories and lowest among people in the
0
20
1 2 3 4 5Income Quintile
Fibr
e(g
)
15.214.8
13.3
14.1 14.0
3Age of Household Reference Person refers to the age ofthe person who participated in the survey from thathousehold. Results relating to age of household referenceperson should be interpreted with caution since youngerage groups will have more children in the household,while older groups may not and this in turn may skew thefindings. These limitations are taken into account in theanalysis.
4Readers are referred to EFS and www.dardni.gov.uk forfurther information.
5Carcass meat is defined as boned, unprocessed, raw meat(includes minced meat).

Chapter 3 - Food poverty and health
highest income bracket. This could be attributed to a number of factors,including lower levels of knowledge of good dietary intake among lowerincome groups, or an inclination towards chips as a convenience food.
In terms of processed potato products, consumption of crisps and potatosnacks was highest amongst income bracket 4. Similarly, average weeklyconsumption of vegetable based ready meals was greatest amongst incomebracket 5.
Fish consumption varied across the income quintiles, with people in themiddle income bracket having the greatest average weekly intake of totalfish. This finding contrasts quite significantly with the general dietarypatterns of this group.
Consumption of sugar and preserves is greatest amongst people on lowerincomes with a greater intake of bread, sweet breads, cakes, buns, pastriesand biscuits. Consumption of breakfast cereals varied, with a trend towardsincreased consumption as income quintile increased. The same was alsoobserved for consumption of rice and pasta.
Consumption of canned vegetables such as peas and baked beans decreasedas income increased. Overall consumption of green vegetables and saladswas highest amongst those at the higher income level. Consumption of readyprepared fresh leafy salads was greatest in income brackets 4 and 5. This maybe due primarily to the cost of these food items and the level of convenienceassociated with prepared salads, which is attractive to the ‘cash rich, timepoor’ consumer.
Consumption of vegetables such as mushrooms, stir fry vegetables and stemvegetables. Consumption of these foods was most common among those atthe higher income levels which are indicative of the lifestyle patterns,increased variety within the diet and a wider range of cooking methods usedby higher income consumers.
Fruit intake was similar across all income categories for oranges, apples, pearsand bananas. Notable differences were observed however in relation toconsumption of stoned fruits, grapes, soft fruits and melon, with a tendencytowards increased consumption among those on higher income. This could
be attributed to their high cost of these particular fruits compared to oranges,apples, pears and bananas.
Consumption of hot beverages was greatest amongst people on the lowestincomes. This may be because many people in this income bracket are retiredand are more likely to have a higher intake of hot beverages, in conjunctionwith high intakes of bread, cakes and pastries. Consumption of these foodtypes is consistent with perhaps linked social and cultural activities such asmeeting with friends etc. Alcohol intake was highest among income bracket 4and lowest in 1 and 2, which is likely to be due to the increased incomeamong the higher income quintiles.
3.1.2 Household composition
Table 3 - Nutrient intake by household composition. See opposite page.
(a) Nutrient intake
Persons in households with two adults and four or more children had thelowest energy intake. This could be attributed to the number of persons inthe household, placing additional strain on perhaps already limited resourcesfor food. Similarly, lower energy intakes were also observed amonghouseholds with children compared to those without. This was also evident inhouseholds with four or more adults, which may typically represent studenthouseholds with limited finances for food.
The lowest proportion of energy from carbohydrate was evident inhouseholds with two adults and one child whilst the highest carbohydrateenergy source was apparent in households with one adult and one child. Thiscould be attributed to high consumption of bread and cereals which areinexpensive, versatile, high energy foods, which are readily available,requiring minimal storage and preparation.
The lowest intake of fibre was apparent in households with 2 adults and 4 ormore children whilst the highest intake was in single adult households.

17
Food Poverty - fact or fiction?
Table 3 Nutrient intake by household composition
34.8 13.6 51.9
35.2 13.1 53.9
37.1 13.6 49.4
38.4 13.6 48.7
36.1 13.3 51.7
37.7 12.7 52.0
36.5 11.9 53.3
37.7 13.5 52.5
36.4 13.8 50.3
36.8 13.9 49.4
32.2 13.1 52.9
1
2
3
4
5
6
7
8
9
10
11
1
2
3
4
5
6
7
8
9
10
11
0
0
2700
0 20100
1 2 3 4 5 6 7 8 9 10 11
17.1
11.6
16.7
14.8
12.9
11.3
10.7
15.2
12.9
13.9
12.4
Ener
gyKc
al(M
J)
Household composition
Household
composition
Household
composition
Energy % Fibre (g)
2617
.6(1
1.0)
1036
.0(8
.6)
2597
.5(1
0.9)
2444
.4(1
0.3)
2064
.3(8
.7)
1953
.5(8
.2)
1867
.4(7
.9)
2609
.3(1
1.3)
2086
.0(8
.8)
2216
.1(9
.3)
2015
.4(8
.5)
Fat Protein Carbohydrate
Table Key1 1 adult
2 1 adult & 1+ children
3 2 adults
4 2 adults & 1 child
5 2 adults & 2 children
6 2 adults & 3 children
7 3 adults & 4+ children
8 3 adults
9 3 adults & 1-2 children
10 3 adults & 3+ children
11 4+ adults

Chapter 3 - Food poverty and health
Finally, vitamin and mineral intakes tended to be higher among adult onlyhouseholds and those households with three or fewer children. It wasparticularly evident that households comprised of two adults and four ormore children had the lowest intakes of all vitamins and minerals.Households comprised of one adult and one or more children demonstrateda similar trend, with lower nutrient intakes than all other households.6 In bothcases these findings can be attributed to the limited resources available tospend on good quality nutritious food and the difficulty experienced inphysically accessing fresh, nutritious food items.
(b) Food consumption
Note: A diagramatical analysis of high patterns of food consumption accrosseach of the four variables can be found on page xx.
The average weekly consumption of milk and cream products was highestamong single adult households. Similarly, consumption of cheese washighest among one and two person households.
Households with three adults and up to three children have the highestconsumption of beef and veal, whilst consumption of mutton, lamb and porkwas highest amongst households with two adults and one child.Consumption of carcass meat was lowest for households with two adults andfour or more children. This could be due to limited resources as carcass meatis generally more expensive than processed meat products.
In terms of prepared meat products, such as sausage rolls, meat pies, readymeals and takeaway meat products, the general trend would suggest highintake among households with three adults, with the same group also havingthe overall highest intake of non carcass meat.
Consumption of both homemade and takeaway chips was highest amongsthouseholds with one adult and one or more children. Total consumption ofprocessed potato products was also highest amongst these households.
Consumption of pizza, pasta and takeaway rice was highest amongsthouseholds with 4 adults. Whilst further investigation is needed to determinethe age and employment status of these adults, early indications would
suggest that these dietary patterns would reflect the diet and lifestylepatterns of students or young professionals.
Consumption of fish was highest among single person households, withlowest average weekly intake among households with one adult and at leastone or more children.
Fruit intake was lowest amongst households with one adult and one or morechildren and highest for one and two adult households.
Interestingly, the highest consumption of potatoes was in households withtwo or three adults, whilst households with children tended to have thelowest intake of potatoes. Similarly, consumption of fresh green vegetablesand other fresh vegetables was higher in one and two adult households.
There was a trend for high bread consumption among single adulthouseholds (many of which could be comprised of older persons),particularly brown and wholemeal varieties. A similar trend was also observedin relation to consumption of cakes, buns and pastries with the highestintakes reported in households with two and three adults. Consumption ofsugar and preserves was highest amongst single adult households (many ofwhich could be comprised of retired persons).
Households comprised of one or two adults had the highest consumption ofmuesli and high fibre breakfast cereals, whilst households with one adult andat least one child had the highest intake of sweetened breakfast cereals.Overall, single adult households had the highest consumption of breakfastcereals, whilst households with two adults and four or more children had theleast. This observation contrasts with expected high levels of breakfast cerealsamong households with children.
Consumption of hot beverages was highest amongst single adulthouseholds. This finding coincides with the observations and earliercomments in relation to high intakes of bread, preserves, cakes, buns andpastries among the same group all of which tend to be eaten with hotbeverages.
19
Food Poverty - fact or fiction?
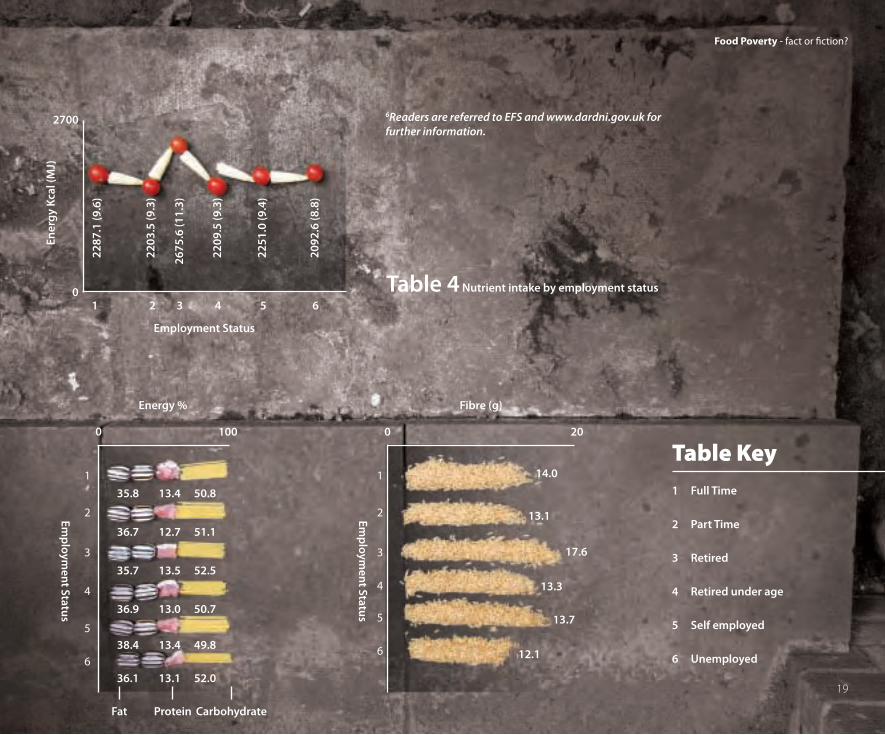
Table 4 Nutrient intake by employment status
35.8 13.4 50.8
36.7 12.7 51.1
35.7 13.5 52.5
36.9 13.0 50.7
38.4 13.4 49.8
36.1 13.1 52.0
1 2 3 4 5 6
Employment Status
Ener
gyKc
al(M
J)
Energy % Fibre (g)
0
2700
0 0 20100
2287
.1(9
.6)
2203
.5(9
.3)
2675
.6(1
1.3)
2209
.5(9
.3)
2251
.0(9
.4)
2092
.6(8
.8)
Fat Protein Carbohydrate
1
2
3
4
5
6
1
2
3
4
5
6
Table Key1 Full Time
2 Part Time
3 Retired
4 Retired under age
5 Self employed
6 Unemployed
14.0
13.1
17.6
13.3
13.7
12.1
Employm
entStatus
Employm
entStatus
6Readers are referred to EFS and www.dardni.gov.uk forfurther information.

Chapter 3 - Food poverty and health
Households with one adult and at least one child had the highest intake ofsoft drinks, almost twice the intake of households with two adults only.Consumption of chocolate bars tended to be higher in households withchildren and overall consumption of confectionery was highest in householdswith two adults and two children.
Alcohol intake was highest amongst households with three adults and threeor more children, also having the highest intake of lagers, table wine andchampagne. The highest intake of beer was observed among householdswith four adults, with the assumption that these households may be aspreviously suggested, comprised of students or young professionals.
3.1.3 Employment status
Table 4 - Nutrient intake by employment status. See previous page.
(a) Nutrient intake
The highest energy intake was reported among retired persons, whilstunemployed persons had the lowest calorie intake. It is worthy of note thatthose in the unemployed group had the lowest percentage energy intakefrom protein sources and the highest from carbohydrate sources comparedwith other groups. This is comparable with findings from the previoussections, where it was observed that lower income households appeared tobe more reliant on bread and cereal products, which are inexpensive, easy toaccess, store and prepare and possibly less able to afford meat, chicken or fishwhich are good sources of protein.
Vitamin and mineral intakes were similar for all employment groups,although, retired persons generally had a higher intake than all other groups.Retired persons had a notably higher intake of fibre, compared to all otherpersons, which correlates with the high consumption of bread and cerealproducts. Sodium intake was also highest amongst retired persons but allconsumers groups had a higher than recommended intake.7
(b) Food consumption
Note: A diagramatical analysis of high patterns of food consumption accrosseach of the four variables can be found on page xx.
Consumption of milk and cream was highest among retired persons and thelowest consumption was observed among fulltime employees. Cheeseconsumption was highest amongst full time employees, whilst unemployedpersons had the lowest intake.
Total consumption of carcass meat was highest amongst retired persons andthe lowest intake was reported among unemployed persons. Retired personsalso had the highest consumption of bacon and ham and cooked poultry,whilst those in the unemployed category tended to have the lowestconsumption.
There was a trend for unemployed persons to have a higher consumption ofmeat pies, complete ready meals and other convenience products.Consumption of the same was also high for full time employees. It could beconcluded that ready meals and similar convenience type products may bepurchased by the unemployed due to lack of skills and/or lack of motivationto prepare a meal from fresh, raw ingredients, whilst for fulltime employees,limited time and a busy lifestyle may lead to a greater reliance onconvenience foods.
Consumption of all fish was highest amongst the retired group and lowestamongst unemployed persons.
Retired persons also had the highest consumption of eggs, all fats, sugar andpreserves, cakes, pastries and biscuits. The lowest consumption for these foodcategories was evident amongst unemployed persons.
Consumption of homemade chips was highest amongst the unemployedgroup. A similar pattern was evident in relation to intake of crisps, with thehighest consumption reported in the unemployed group and the lowestintake reported among the retired group.

21
Food Poverty - fact or fiction?
A clear trend was apparent in terms of fruit consumption with retired personshaving the highest consumption of nine out of ten fruits, and similarlyunemployed persons having the lowest consumption for the sameproportion of fruit. In contrast, those in the unemployed category had thehighest consumption of tinned fruit and fruit products, in particular fruitjuices.
Retired persons consumed almost twice the quantity of potatoes andvegetables compared to unemployed persons. A similar pattern ofconsumption was also apparent in relation to intake of vegetables such asturnips, swede, other root vegetables, onions, leeks and mushrooms, withretired persons having the highest intake and unemployed persons havingthe lowest intake.
Overall consumption of bread was highest among the retired andunemployed groups. Retired persons had the highest consumption of brownand wholemeal bread varieties, whilst those in the unemployed group hadthe highest consumption of white bread, approximately four times greaterthan the Northern Ireland average.
People in part time employment have the highest intake of breakfast cerealswhilst those in the unemployed category had the lowest intake.Consumption of rice and pasta was highest amongst full time employees,whilst pizza consumption, both home cooked and takeaway, was highest inthe unemployed sector.
Consumption of hot beverages such as tea and coffee was highest amongstretired persons and lowest amongst the unemployed sector. In contrasthowever, unemployed persons had the highest consumption of soft andalcoholic drinks, in particular beer and lagers. In fact, those in theunemployed sector had a higher alcohol intake compared with those in fulltime employment.
7Readers are referred to EFS and www.dardni.gov.uk for further information
3.1.4 Age of household reference person
Table 5 - Nutrient Intake by Age of Household Reference Person.
See next page
(a) Nutrient intake
Total nutrient intake among the 65 – 74 age group was highest in relation toenergy, protein, fat, carbohydrate, cholesterol and fibre. The over 75 agegroup had a lower energy intake from fat and protein but a higher intakefrom carbohydrate sources. This could be due to the fact that older personsmay be no longer able to prepare meals and are more reliant on bread andcereal based products to form the greatest part of their diet.
The 65 – 74 year old group also had the highest intake of all vitamins andminerals. However, a higher than recommended intake of sodium was alsoobserved. The youngest age group appeared to consume the least amount ofvitamins and minerals.
(b) Food consumption
Note: A diagramatical analysis of high patterns of food consumption accrosseach of the four variables can be found on page xx.
Consumption of milk and cream was highest amongst those aged 65-74, withthe lowest consumption reported among those aged 40-49. Intake of allcheese was lowest amongst the youngest age group (under 30) and highestamongst those aged 50-64.
Consumption of all carcass meat tended to be higher among olderconsumers. In particular, intake of beef and veal and mutton and lamb washighest amongst those aged 65-74 and lowest amongst those under 30. Porkintake was highest in age group 50-64 and also lowest in the under 30 agegroup. People over the age of 75 had the highest intake of bacon and ham,cooked poultry and canned meats with youngest age group having thelowest intake.

Table 5 Nutrient intake by age of household reference person
Table Key
1 Under 30
2 30-39
3 40-49
4 50-64
5 65-74
6 75+
1 2 3 4 5 6
1986
.8(8
.4)
2094
.0(8
.8)
2320
.0(9
.8)
2566
.4(1
0.8)
2714
.7(1
1.4)
2443
.9(1
0.3)
11.5
12.5
13.9
16.3
17.7
17.1
35.6 14.7 50.6
36.4 14.5 50.9
36.8 14.5 50.8
36.9 14.3 50.1
35.8 14.1 52.1
34.3 13.8 54.7
0
00
2800
Age of household reference person
Ener
gyKc
al(M
J)
Energy % Fibre (g)
Age
ofhouseholdreference
person
Age
ofhouseholdreference
person
0100 18
1
2
3
4
5
6
1
2
3
4
5
6

33% Bread, Cerealand Potatoes
33% Fruit andVegetables
7% Foods containing fatand sugar
Meat Fish and12% Alternatives
Milk and DairyProducts 15%
23
Food Poverty - fact or fiction?
Consumption of takeaway foods, chips, crisps, ready meals and burgers waslowest amongst those aged 65 plus and highest in younger age groups.Similarly, consumption of home cooked and takeaway pizza was also highestamong the under 30 age group.
Consumption of fish was highest amongst those aged 65-74 and lowestamong the 30-39 category.
Intake of fat, particularly saturated fat, such as butter, was higher by those inthe age group 65+. Consumption of sugar and preserves was higher amongthose aged 65 or over and lowest among those aged under 39. Thesefindings are comparable with those relating to employment status whichrevealed a high intake of sugar and preserves among retired persons andsingle adult households.
Consumption of potatoes was also reported to be highest amongst olderpersons, with those aged over 75 consuming over twice the quantity ofpotatoes compared with those aged under 30. A similar pattern ofconsumption was also apparent in relation to intake of fresh vegetables.
It was also observed that older persons had a higher intake of vegetablebased ready meals and takeaway vegetable products. This could beattributed to the minimal preparation required with such products. Inaddition to older consumers having a higher intake of vegetables, the samealso had the highest intake of fruit, whilst those under age 30 had the lowestintake.
The same trend was also apparent in relation to consumption of breadincluding white, brown and wholemeal varieties. Consumption of cakes,buns, pastries and biscuits was also higher among older people. Intake ofbreakfast cereals, in particular sweetened breakfast cereals was higher amongthe under 30 category. Rice and pasta are the main sources of carbohydrateintake for younger consumers.
Consumption of hot beverages, in particular, tea, was highest among the over75 age group. Soft drinks consumption was highest for those aged 40-49 andunder 30. Alcohol intake, especially beer, lager and ciders was highestamongst those under 39, whilst intakes of wine were highest in the age
groups 50-64. These groups also had the highest overall consumption ofalcohol, whilst the over 65s had the lowest consumption.
3.3 Diet comparison with healthy eating guidelines
The Balance of Good Health Guidelines was first published by the HealthEducation Authority in consultation with the Department of Health and in co-operation with regional health departments for Scotland, Wales and NorthernIreland in 1994. The guidelines have since been published by the FoodStandards Agency in conjunction with the Department of Health to helppeople to understand and enjoy healthy eating.
The Guidelines recommend the following food categories should form theidentified proportion of the diet:

Table 6 Household cluster - Standard of healthy living Table 7 Respective contribution of food group to cluster diets
in Northern Ireland
Table KeyFoods high in Fats and Sugar
Meat, Fish and Poultry
Milk, Cheese and Yogurt
Fruit and Vegetables
Cereals, Breads and Potatoes
Cluster Key Social Characteristic
Cluster 1 Smaller householdsLowest quintile for income
Cluster 2 Unskilled occupational class‘Other’ social class categorisation
Cluster 3 Managerial households‘Other’ social class categorisation
Cluster 4 Professional households
Cluster 5 Large householdsProfessional households
Cluster 6 Large householdsAlcohol consumption
The Friel et al (2005) report – Standard of Healthy Living on the Island ofIreland, clustered households for the purpose of data analysis. Six clusterswere identified:
The report then went on to document the contribution of various foodgroups to the diet of each of the clusters, as illustrated in the followingchart.
Respective Contribution of Food Group to Cluster Diets in Northern Ireland
Cluster
1 2 3 4 5 6
100%
90%
80%
70%
60%
50%
40%
30%
20%
10%
0%
Chapter 3 - Food poverty and health
13
13
16
19
40
13
15
22
19
32
13
13
16
19
40
13
13
16
19
40
13
13
16
19
40
13
13
16
19
40

25
Food Poverty - fact or fiction?
All clusters, except cluster 6 are meeting or exceeding the recommendedintake of bread, cereals and potatoes. In terms of fruit and vegetables intakecluster 4, 5 and 6 have a higher consumption than clusters 1, 2 and 3. Theseupper end clusters tended to be comprised of professional households, withhigher disposable income and better levels of education, both of which arecorrelated with increasing fruit and vegetable consumption. It should benoted however, that none of the clusters are meeting the recommended dailyfruit and vegetable allowance as recommended by the Guidelines (33%).
Milk, cheese and yogurt intake formed a greater proportion of the diet for allclusters, especially clusters 2, 3, 4 and 6. The findings reported earlier in thischapter noted that the intake of whole milk and cream tended to be higheramong lower income groups and consumption of cheese was greater in thehigher income groups. In the above chart, the data are presented collectivelyand therefore, it is not possible to distinguish between income groups interms of their consumption of specific dairy products.
Consumption of meat, fish and poultry was at the recommended level or justin excess of the recommended dietary intake. The proportion of foods high infat and sugars was almost twice the recommended intake for all clusters,highlighting that foods in this category form a disproportionately high part ofthe diet of the whole population of Northern Ireland.
3.4 Summary
• People on low incomes with poor employment opportunities or lowlevels of education are at an increased risk of ill health and likely toexperience inequalities in terms of their health status.
• Potential health issues which may arise through poor diet as a result ofnot being able to access good quality, nutritious food i.e. food poverty,can include hypertension, diabetes, heart disease, stroke and somecancers.
• A diet high in fat, sugar and salt and a low consumption of essentialvitamins, minerals and dietary fibre, is more likely to contribute to theonset of these conditions and diseases.
• While obesity is not a direct outcome of food poverty, it is clear there arestrong associations between both.
• People on low incomes have a high consumption of: milk and cream;bacon, ham and canned meats; crisps and other potato snacks; foods highin fat and oils; sugar and preserves; bread, cake, buns; canned vegetables,fruit (apples, pears, oranges, bananas) and hot beverages.
• People at the higher income levels have a high consumption of: cheeseand yogurts; carcass meat; takeaway meals; vegetable based ready meals;cereals; rice and past; green and other fresh vegetables; prepared salads;soft and stoned fruits (grapes, melons).
• The highest energy intake was reported among retired persons, whilstunemployed persons had the lowest calorie intake. The same trend wasobserved in relation to protein, fat, carbohydrate and fibre.
• People who are unemployed consume high proportions of: milk andcream; meat products (pies, sausages, burgers, sausages); takeawaymeals; chips; crisps and snacks; ready meals; pastries.
• People in the 65+ age group consequently consumed high levels of: milkand cream; carcass meat; bacon, ham and canned meats; potatoes; readymade meals; fish; sugar and preserves; breads; pastries; vegetables; fruitand hot beverages.
• At the other end of the scale, people under the age of 30 consumed largeamounts of: take away meals; chips and other snacks; canned vegetables.
• People in Northern Ireland are not meeting the recommended daily fruitand vegetable allowance as recommended by the Balance of Good HealthGuidelines. They are however, by and large, meeting therecommendations with regard to consumption of bread and potatoes.

Did you know thatin the UnitedKingdom…20% of adults eat less than 1 portion of fruit and vegetables per day.Cereal food choices for people on low incomes are dominated by whitebread, biscuits, breakfast cereals (not wholegrain or high fibre), buns,cakes and pastries.
The majority of fat spreads used by people on low incomes are notpolyunsaturated. Children are more likely than adults to eat sausages (45%versus 31%), coated chicken and turkey (40% versus 13%) and burgers andkebabs (28% versus 14%).
Bananas were the fruit most commonly eaten by adults (35%), whilst inchildren it was apples and pears (not canned) (41%).
People aged 50 and over were at least twice as likely to consume oily fishdishes compared with other age groups.
Men consumed more foods from the meat and potato groups andwholegrain and high fibre breakfast cereals than women.Women consumed more water, skimmed milk, yoghurt, dairy desserts,salad, raw vegetables and “other fruits” than men.8
8This data is extracted from the most recent survey (2007) of the FoodStandard’s Agency entitled ‘Low Income, Diet and Nutrition Survey’. The datapresented represents a UK wide sample
Chapter 3 - Food poverty and health

27
Food Poverty - fact or fiction?

Chapter 3 - Food poverty and health
Table 8 High consumption patterns
It should be noted that the table only indicates high consumption patterns.
Income Quintile
1 2 3 4 5 1A 1A1C 2A 2A1C
Milk and Cream x x x
Yoghurt and fromage frais x
Cheese x x x x
Carcass meat (ie boned, unprocessed raw meat) x x x x x
Bacon, ham and canned meats x
Meat products (Pies; sausages; burgers; sausage rolls)
Takeaway meat based meals and pizzas x x x x x x x
Chips (home cooked and takeaway) x x x x x x x x x x x x
Crisps and other potato based snacks x x x x x x x x x x x
Solid fats and oils x x x
Potatoes x x x x x x
Ready meals x x x x
Vegetable based ready meals x
Fish x x x
Sugar and preserves x x x
Breads x x x x x x
Sweet breads; cakes; buns; pastries and biscuits x x x x x x
Breakfast Cereals x x x
Rice and pasta x
Canned vegetables x
Green vegetables x x x x
Other fresh vegetables (mushrooms; stem veg etc) x x x x
Prepared leaf salads x x
Fresh Fruit (apple;pear;orange;banana) x x x
Soft and stoned Fruit (dates; grapes;melon etc) x
Hot beverages (tea and coffee) x