cim financial services ltd independent …. cim gro… · · 2016-01-15this report is made solely...
TRANSCRIPT

This report is made solely to the members of Cim Financial Services Limited (the “Company”), as a body, in accordance with Section 205 of the Companies Act 2001. Our audit work has been undertaken so that we might state to the Company's members those matters we are required to state to them in an auditors’ report and for no other purpose. To the fullest extent permitted by law, we do not accept or assume responsibility to anyone other than the Company and the Company's members as a body, for our audit work, for this report, or for the opinions we have formed.
Report on the Financial Statements
We have audited the group financial statements of Cim Financial Services Limited and its subsidiaries (the “Group”) and the Company’s separate financial statements on pages 54 to 125 which comprise the Statements of Financial Position at 30 September 2015, Statements of Profit or Loss, Statements of Profit or Loss and Other Comprehensive Income, Statements of Changes in Equity and Statements of Cash Flows for the year then ended, and a summary of significant accounting policies and other explanatory notes.
Directors’ Responsibility for the Financial Statements
The directors are responsible for the preparation and fair presentation of these financial statements in accordance with International Financial Reporting Standards and in compliance with the requirements of the Companies Act 2001, and for such internal control as the directors determine is necessary to enable the preparation of the financial statements that are free from material misstatement, whether due to fraud or error.
Auditors’ Responsibility
Our responsibility is to express an opinion on these financial statements based on our audit. We conducted our audit in accordance with International Standards on Auditing. Those Standards require that we comply with ethical requirements and plan and perform the audit to obtain reasonable assurance whether the financial statements are free from material misstatement.
An audit involves performing procedures to obtain audit evidence about the amounts and disclosures in the financial statements. The procedures selected depend on the auditors’ judgement, including the assessment of the risks of material misstatement of the financial statements, whether due to fraud or error. In making those risk assessments, the auditors consider internal control relevant to the Company’s preparation and fair presentation of the financial statements in order to design audit procedures that are appropriate in the circumstances, but not for the purpose of expressing an opinion on the effectiveness of the Company’s internal control. An audit also includes evaluating the appropriateness of accounting policies used and the reasonableness of accounting estimates made by the directors, as well as evaluating the overall presentation of the financial statements.
52 2015 - CIM ANNUAL REPORT
CIM FINANCIAL SERVICES LTD
INDEPENDENT AUDITORS’ REPORT TO THE MEMBERS

Report on the Financial Statements (Cont'd)
We believe that the audit evidence we have obtained is sufficient and appropriate to provide a basis for our audit opinion.
Opinion
In our opinion, the financial statements on pages 54 to 125 give a true and fair view of the financial position of the Group and of the Company at 30 September 2015, and of their financial performance and their cash flows for the year then ended in accordance with International Financial Reporting Standards and comply with the Companies Act 2001.
Report on Other Legal and Regulatory Requirements
Companies Act 2001
We have no relationship with, or interests in, the Company or any of its subsidiaries, other than in our capacity as auditors and dealings in the ordinary course of business.
We have obtained all information and explanations we have required.
In our opinion, proper accounting records have been kept by the Company as far as it appears from our examination of those records.
Financial Reporting Act 2004
The directors are responsible for preparing the Corporate Governance Report. Our responsibility is to report on the extent of compliance with the Code of Corporate Governance as disclosed in the Annual Report and whether the disclosure is consistent with the requirements of the Code.
In our opinion, the disclosure in the Annual Report is consistent with the requirements of the Code.
BDO & CO Ameenah Ramdin, FCCA, ACAChartered Accountants Licensed by FRC
9 December 2015
Port Louis, Mauritius.
2015 - CIM ANNUAL REPORT 53CIM FINANCIAL SERVICES LTD
INDEPENDENT AUDITORS’ REPORT TO THE MEMBERS
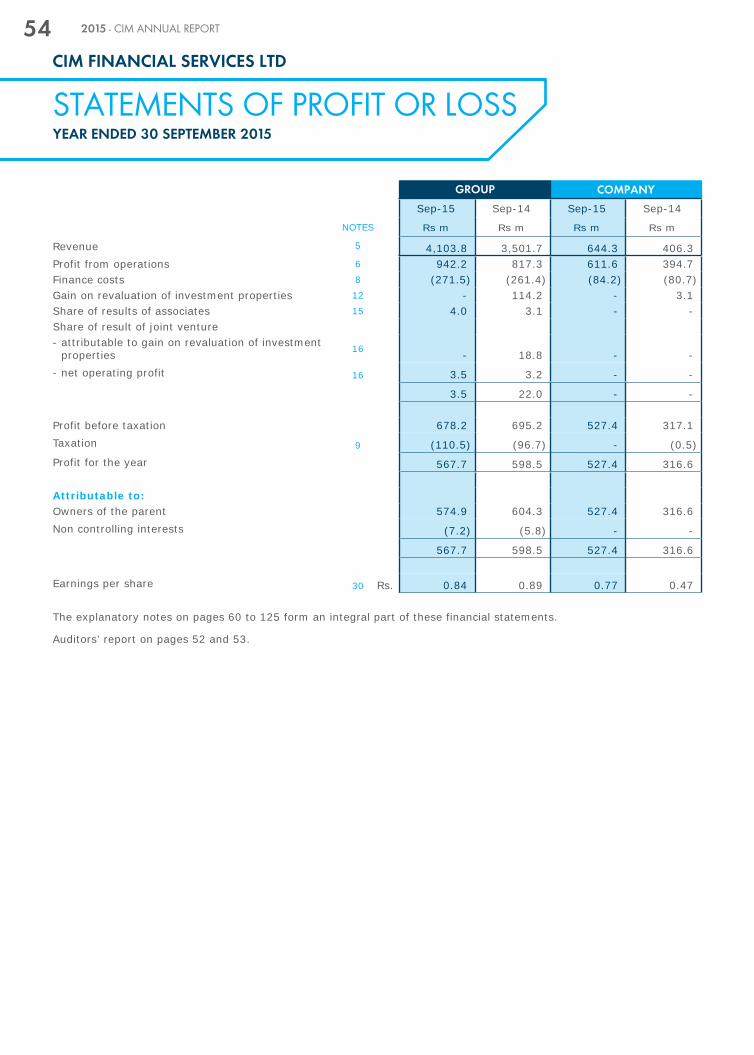
STATEMENTS OF PROFIT OR LOSSYEAR ENDED 30 SEPTEMBER 2015
GROUP COMPANY
Sep-15 Sep-14 Sep-15 Sep-14
NOTES Rs m Rs m Rs m Rs m
Revenue 5 4,103.8 3,501.7 644.3 406.3 Profit from operations 6 942.2 817.3 611.6 394.7 Finance costs 8 (271.5) (261.4) (84.2) (80.7)Gain on revaluation of investment properties 12 - 114.2 - 3.1 Share of results of associates 15 4.0 3.1 - - Share of result of joint venture- attributable to gain on revaluation of investment
properties 16 - 18.8 - - - net operating profit 16 3.5 3.2 - -
3.5 22.0 - -
Profit before taxation 678.2 695.2 527.4 317.1 Taxation 9 (110.5) (96.7) - (0.5)Profit for the year 567.7 598.5 527.4 316.6
Attributable to:Owners of the parent 574.9 604.3 527.4 316.6 Non controlling interests (7.2) (5.8) - -
567.7 598.5 527.4 316.6
Earnings per share 30 Rs. 0.84 0.89 0.77 0.47
The explanatory notes on pages 60 to 125 form an integral part of these financial statements.
Auditors’ report on pages 52 and 53.
54 2015 - CIM ANNUAL REPORT
CIM FINANCIAL SERVICES LTD

STATEMENTS OF PROFIT OR LOSS AND OTHER COMPREHENSIVE INCOMEYEAR ENDED 30 SEPTEMBER 2015
GROUP COMPANY
Sep-15 Sep-14 Sep-15 Sep-14
NOTES Rs m Rs m Rs m Rs m
Profit for the year 567.7 598.5 527.4 316.6
Other comprehensive income 10
Items that will not be reclassified to Profit or Loss:Gain on revaluation of land and buildings - 176.9 - - Remeasurement of defined benefit obligations (5.7) (3.4) - -
Items that may be reclassified subsequently to Profit or Loss: Exchange difference on translation of foreign entities 7.7 2.2 - - Movement in reserves of associates 15 (0.3) - - - Losses arising on cash flow hedges (2.1) (0.7) (2.1) (0.7)Other comprehensive income for the year, net of tax (0.4) 175.0 (2.1) (0.7)Total comprehensive income for the year 567.3 773.5 525.3 315.9
Attributable to:Owners of the parent 574.5 685.9 525.3 315.9 Non controlling interests (7.2) 87.6 - -
567.3 773.5 525.3 315.9
The explanatory notes on pages 60 to 125 form an integral part of these financial statements.
Auditors’ report on pages 52 and 53.
2015 - CIM ANNUAL REPORT 55CIM FINANCIAL SERVICES LTD

STATEMENTS OF FINANCIAL POSITION30 SEPTEMBER 2015
GROUP COMPANY
Sep-15 Sep-14 Sep-15 Sep-14
NOTES Rs m Rs m Rs m Rs m
ASSETSNon current assetsProperty, plant and equipment 11 1,491.7 1,423.9 - - Investment properties 12 533.7 556.1 30.8 30.8 Intangible assets 13 646.4 661.6 0.3 - Investment in subsidiary companies 14 - - 1,902.1 1,831.3 Investments in associates 15 92.0 26.5 16.2 16.2 Investment in joint venture 16 95.2 91.7 - - Investments in financial assets 17 385.2 753.2 232.2 309.7 Non current receivables 18 121.5 81.8 755.4 540.0 Net investment in leases and other credit agreements 19 2,130.6 1,913.0 - - Retirement benefit assets 27 10.1 9.6 - -
5,506.4 5,517.4 2,937.0 2,728.0 Current assetsInventories 20 422.4 338.2 - - Net investment in leases and other credit agreements 19 2,285.1 1,993.5 - - Consumable biological assets 21 1.8 1.5 - - Trade and other receivables 22 1,302.7 1,165.8 934.3 710.7 Investments in financial assets 17 290.0 - - - Bank balances and cash 23 953.9 608.6 24.6 2.8
5,255.9 4,107.6 958.9 713.5 10,762.3 9,625.0 3,895.9 3,441.5
EQUITY AND LIABILITIESCapital and reservesStated capital 24 680.5 680.5 680.5 680.5 Retained earnings 2,018.5 1,693.6 1,346.2 1,029.8 Other reserves 318.6 280.0 (5.6) (3.5)Equity attributable to owners of the parent 3,017.6 2,654.1 2,021.1 1,706.8 Non controlling interests 391.0 398.2 - - Total equity 3,408.6 3,052.3 2,021.1 1,706.8
Non current liabilitiesBorrowings 25 2,490.7 2,113.5 1,138.2 920.1 Deferred taxation 26 7.0 3.2 0.5 0.5 Retirement benefit obligations 27 107.4 90.0 - -
2,605.1 2,206.7 1,138.7 920.6 Current liabilitiesBorrowings 25 2,992.4 3,083.3 486.4 570.0 Trade and other payables 28 1,582.1 1,142.0 113.6 135.2 Dividend payable 29 136.1 108.9 136.1 108.9 Current tax liabilities 38.0 31.8 - -
4,748.6 4,366.0 736.1 814.1 7,353.7 6,572.7 1,874.8 1,734.7
10,762.3 9,625.0 3,895.9 3,441.5
These financial statements have been approved for issue by the Board of Directors on 9 December 2015.
Timothy Taylor Paul Leech Chairman Director & Group CEO
The explanatory notes on pages 60 to 125 form an integral part of these financial statements.
Auditors’ report on pages 52 and 53.
56 2015 - CIM ANNUAL REPORT
CIM FINANCIAL SERVICES LTD

STA
TEM
ENTS
OF
CH
AN
GES
IN E
QU
ITY
30
SEP
TEM
BER
20
15
NO
TES
Sta
ted
capi
tal
Cap
ital
rese
rves
R
eval
uatio
n re
serv
es
Oth
er
rese
rves
R
etai
ned
earn
ings
A
ctua
rial
lo
sses
Att
ribu
tabl
e to
ow
ners
of
the
pare
nt
Non
co
ntro
lling
in
tere
sts
Tot
al e
quity
R
s m
R
s m
R
s m
R
s m
R
s m
R
s m
R
s m
R
s m
R
s m
GR
OU
P
At 1
Oct
ober
201
4 6
80.5
2
09.0
8
2.5
(0.
9) 1
,693
.6
(10
.6)
2,6
54.1
3
98.2
3
,052
.3
Prof
it/(lo
ss)
for
the
year
-
-
-
-
574
.9
-
574
.9
(7.
2) 5
67.7
O
ther
com
preh
ensi
ve in
com
e fo
r th
e ye
ar10
-
-
-
5.3
-
(
5.7)
(0.
4) -
(
0.4)
Tota
l com
preh
ensi
ve in
com
e fo
r th
e ye
ar -
-
-
5
.3
574
.9
(5.
7) 5
74.5
(
7.2)
567
.3
Div
iden
ds29
-
-
-
-
(21
1.0)
-
(21
1.0)
-
(21
1.0)
Tran
sfer
s -
3
9.0
-
-
(39
.0)
-
-
-
-
Tota
l tra
nsac
tions
with
ow
ners
of p
aren
t -
3
9.0
-
-
(25
0.0)
-
(21
1.0)
-
(21
1.0)
At 3
0 Se
ptem
ber
2015
68
0.5
2
48
.0
82
.5
4.4
2
,01
8.5
(
16
.3)
3,0
17
.6
39
1.0
3
,40
8.6
Sta
ted
capi
tal
Cap
ital
rese
rves
R
eval
uatio
n re
serv
es
Oth
er
rese
rves
R
etai
ned
earn
ings
A
ctua
rial
lo
sses
Att
ribu
tabl
e to
ow
ners
of
the
pare
nt
Non
co
ntro
lling
in
tere
sts
Tot
al e
quity
R
s m
R
s m
R
s m
R
s m
R
s m
R
s m
R
s m
R
s m
R
s m
At 1
Oct
ober
201
3 (a
s re
stat
ed)
680
.5
171
.4
(1.
0) (
2.4)
1,3
07.9
(
7.2)
2,1
49.2
3
14.4
2
,463
.6
Prof
it/(lo
ss)
for
the
year
-
-
-
-
604
.3
-
604
.3
(5.
8) 5
98.5
O
ther
com
preh
ensi
ve in
com
e fo
r th
e ye
ar10
-
-
83.
5 1
.5
-
(3.
4) 8
1.6
93.
4 1
75.0
To
tal c
ompr
ehen
sive
inco
me
for
the
year
-
-
83.
5 1
.5
604
.3
(3.
4) 6
85.9
8
7.6
773
.5
Div
iden
ds29
-
-
-
-
(17
6.9)
-
(17
6.9)
-
(17
6.9)
Tran
sfer
s -
3
7.6
-
-
(37
.6)
-
-
-
-
Chan
ges
in o
wne
rshi
p in
tere
st in
su
bsid
iarie
s -
-
-
-
(
4.1)
-
(4.
1) (
3.8)
(7.
9)To
tal t
rans
actio
ns w
ith o
wne
rs o
f par
ent
-
37.
6 -
-
(
218.
6) -
(
181.
0) (
3.8)
(18
4.8)
At 3
0 Se
ptem
ber
2014
68
0.5
2
09
.0
82
.5
(0
.9)
1,6
93
.6
(1
0.6
) 2
,65
4.1
3
98
.2
3,0
52
.3
The
expl
anat
ory
note
s on
pag
es 6
0 to
125
for
m a
n in
tegr
al p
art
of t
hese
fin
anci
al s
tate
men
ts.
Aud
itors
’ rep
ort
on p
ages
52
and
53.
2015 - CIM ANNUAL REPORT 57C
IM F
INA
NC
IAL
SERV
ICES
LTD

STATEMENTS OF CHANGES IN EQUITY30 SEPTEMBER 2015
NOTES Stated capital
Hedging reserves
Retained earnings Total equity
Rs m Rs m Rs m Rs m
COMPANYAt 1 October 2014 680.5 (3.5) 1,029.8 1,706.8 Profit for the year - - 527.4 527.4 Other comprehensive income 10 - (2.1) - (2.1)Dividends 29 - - (211.0) (211.0)At 30 September 2015 680.5 (5.6) 1,346.2 2,021.1
At 1 October 2013 680.5 (2.8) 890.1 1,567.8 Profit for the year - - 316.6 316.6 Other comprehensive income 10 - (0.7) - (0.7)Dividends 29 - - (176.9) (176.9)At 30 September 2014 680.5 (3.5) 1,029.8 1,706.8
The explanatory notes on pages 60 to 125 form an integral part of these financial statements.
Auditors’ report on pages 52 and 53.
58 2015 - CIM ANNUAL REPORT
CIM FINANCIAL SERVICES LTD

STATEMENTS OF CASH FLOWSYEAR ENDED 30 SEPTEMBER 2015
NOTES GROUP COMPANY
Sep-15 Sep-14 Sep-15 Sep-14
Rs m Rs m Rs m Rs m
CASH FLOWS FROM OPERATING ACTIVITIESCash generated from/(absorbed in) operations 31 629.5 280.7 (9.9) 83.1 Interest paid (271.5) (261.4) (84.6) (76.8)Interest received 157.2 168.2 67.6 69.9 Income tax paid (101.1) (88.6) - - Net cash flow generated from/(used in) operating activities 414.1 98.9 (26.9) 76.2
CASH FLOWS FROM INVESTING ACTIVITIESDividends received 27.8 - 570.5 340.5 Purchase of financial assets - (308.0) - (300.0)Proceeds from sale of financial assets 74.0 13.3 74.0 - Purchase of property, plant and equipment (145.8) (189.2) - - Proceeds from sale of property, plant and equipment 8.2 14.9 - - Purchase of intangible assets (9.9) (20.2) - - Purchase of investment properties (9.2) (0.2) - - Loans granted - - (607.0) (176.6)Loans recovered - - 240.8 120.0 Disposal of subsidiary, net of cash disposed - (0.2) - - Acquisition of subsidiary, net of cash acquired 32 (4.9) (3.2) (7.8) (3.2)Investment in subsidiaries 14 - - (63.0) - Acquisition of associates 15 (63.1) - - - Net cash flow (used in)/generated from investing activities (122.9) (492.8) 207.5 (19.3)
CASH FLOW FROM FINANCING ACTIVITIESNet (repayments of)/proceeds from borrowings (222.0) 633.3 126.2 (8.3)Net funds from deposits 358.5 10.4 - - Dividends paid to shareholders of Company (183.8) (149.7) (183.8) (149.7)Net cash (used in)/generated from financing activities (47.3) 494.0 (57.6) (158.0)
Net increase/(decrease) in cash and cash equivalents 243.9 100.1 123.0 (101.1)
Cash and cash equivalents - opening 374.6 274.5 150.0 251.1
Cash and cash equivalents - closing 23 618.5 374.6 273.0 150.0
The explanatory notes on pages 60 to 125 form an integral part of these financial statements.
Auditors’ report on pages 52 and 53.
2015 - CIM ANNUAL REPORT 59CIM FINANCIAL SERVICES LTD

1. GENERAL INFORMATION
Cim Financial Services Ltd is a limited liability company incorporated on 15 July 2005 and domiciled in Mauritius. The principal activity of the Company is the holding of investments. As at 30 September 2015, its holding company is Cim Holdings Ltd and its registered address is Taylor Smith House, Old Quay D Road, Port Louis. The Company’s place of business is at 33, Edith Cavell Street, Port-Louis. These financial statements have been prepared for the year ended 30 September 2015.
2. SIGNIFICANT ACCOUNTING POLICIES
(a) Basis of preparation
The financial statements comply with the Companies Act 2001 and have been prepared in accordance with International Financial Reporting Standards (IFRS). The financial statements include the consolidated financial statements of the parent company and its subsidiary companies (the “Group”) and the separate financial statements of the parent company (the “Company”). The financial statements are presented in Mauritian Rupees and all values are rounded to the nearest million (Rs m), except when otherwise indicated. These policies have been consistently applied to all the years presented, unless otherwise stated and where necessary, comparative figures have been amended to conform with changes in presentation in the current year.
The financial statements are prepared under the historical cost convention except that:
- land and buildings are carried at revalued amounts;
- investment properties are stated at fair value;
- investments held-for-trading and available-for-sale financial assets are stated at fair value;
- held-to-maturity financial assets are carried at amortised cost; and
- consumable biological assets are stated at fair value.
Amendments to published Standards and Interpretations effective in the reporting period
Amendments to IAS 32, ‘Offsetting Financial Assets and Financial Liabilities’, clarify the requirements relating to the offset of financial assets and financial liabilities. The amendment is not expected to have any impact on the Group’s financial statements.
Amendments to IFRS 10, IFRS 12 and IAS 27, ‘Investment Entities’, define an investment entity and require a reporting entity that meets the definition of an investment entity not to consolidate its subsidiaries but instead to measure its subsidiaries at fair value through Profit or Loss in its consolidated and separate financial statements. Consequential amendments have been made to IFRS 12 and IAS 27 to introduce new disclosure requirements for investment entities. As the Company is not an investment entity, the standard has no impact on the Group’s financial statements.
IFRIC 21, ‘Levies’, sets out the accounting for an obligation to pay a levy that is not income tax. The interpretation addresses what obligating event gives rise to pay a levy and when should a liability be recognised. The Group is not subject to levies so the interpretation has no impact on the Group’s financial statements.
60 2015 - CIM ANNUAL REPORT
CIM FINANCIAL SERVICES LTD
EXPLANATORY NOTES30 SEPTEMBER 2015

2. SIGNIFICANT ACCOUNTING POLICIES (CONT’D)
(a) Basis of preparation (cont’d)
Amendments to published Standards and Interpretations effective in the reporting period (cont’d)
Amendments to IAS 36, ‘Recoverable amount disclosures for non-financial assets’, remove the requirement to disclose the recoverable amount of a cash-generating unit (CGU) to which goodwill or other intangible assets with indefinite useful lives had been allocated. The amendment has no impact on the Group’s financial statements.
Amendments to IAS 39, ‘Novation of derivatives and continuation of hedge accounting’, provide relief from the requirement to discontinue hedge accounting when a derivative designated as a hedging instrument is novated under certain circumstances. The amendments also clarify that any change to the fair value of the derivative designated as a hedging instrument arising from the novation should be included in the assessment and measurement of hedge effectiveness. The amendment has no impact on the Group’s financial statements.
Defined Benefit Plans: Employee Contributions (Amendments to IAS 19) applies to contributions from employees or third parties to defined benefit plans and clarifies the treatment of such contributions. The amendment distinguishes between contributions that are linked to service only in the period in which they arise and those linked to service in more than one period. The objective of the amendment is to simplify the accounting for contributions that are independent of the number of years of employee service, for example employee contributions that are calculated according to a fixed percentage of salary.
Entities with plans that require contributions that vary with service will be required to recognise the benefit of those contributions over employees’ working lives. The amendment has no impact on the Group’s financial statements.
Annual Improvements 2010-2012 Cycle
IFRS 2, ‘Share based payments’ amendment is amended to clarify the definition of a ‘vesting condition’ and separately defines ‘performance condition’ and ‘service condition’. The amendment has no impact on the Group’s financial statements.
IFRS 3, ‘Business combinations’ is amended to clarify that an obligation to pay contingent consideration which meets the definition of a financial instrument is classified as a financial liability or equity, on the basis of the definitions in IAS 32, ‘Financial instruments: Presentation’. It also clarifies that all non-equity contingent consideration are measured at fair value at each reporting date, with changes in value recognised in Profit or Loss. The amendment has no impact on the Group’s financial statements.
IFRS 8, ‘Operating segments’ is amended to require disclosure of the judgements made by management in aggregating operating segments. It is also amended to require a reconciliation of segment assets to the entity’s assets when segment assets are reported. The amendment has no impact on the Group’s financial statements.
IFRS 13 (Amendment), ‘Fair Value Measurement’ clarifies in the Basis for Conclusions that short-term receivables and payables with no stated interest rates can be measured at invoice amounts when the effect of discounting is immaterial. The amendment has no impact on the Group’s financial statements.
2015 - CIM ANNUAL REPORT 61CIM FINANCIAL SERVICES LTD
EXPLANATORY NOTES30 SEPTEMBER 2015

2. SIGNIFICANT ACCOUNTING POLICIES (CONT’D)
(a) Basis of preparation (cont’d)
Amendments to published Standards and Interpretations effective in the reporting period (cont’d)
Annual Improvements 2010-2012 Cycle (cont’d)
IAS 16,‘Property, plant and equipment’ and IAS 38, ’Intangible assets’ are amended to clarify how the gross carrying amount and the accumulated depreciation are treated where an entity uses the revaluation model. The amendment has no impact on the Group’s financial statements.
IAS 24,‘Related party disclosures’ is amended to include, as a related party, an entity that provides key management personnel services to the reporting entity or to the parent of the reporting entity (the ‘management entity’). Disclosure of the amounts charged to the reporting entity is required. The amendment has no impact on the Group’s financial statements.
Annual Improvements 2011-2013 Cycle
IFRS 1, ‘First-time Adoption of International Financial Reporting Standards’ is amended to clarify in the Basis for Conclusions that an entity may choose to apply either a current standard or a new standard that is not yet mandatory, but permits early application, provided either standard is applied consistently throughout the periods presented in the entity’s first IFRS financial statements. The amendment has no impact on the Group’s financial statements, since the Group is an existing IFRS preparer.
IFRS 3,‘Business combinations’ is amended to clarify that IFRS 3 does not apply to the accounting for the formation of any joint venture under IFRS 11. The amendment has no impact on the Group’s financial statements.
IFRS 13,‘Fair value measurement’ is amended to clarify that the portfolio exception in IFRS 13 applies to all contracts (including non-financial contracts) within the scope of IAS 39 or IFRS 9. The amendment has no impact on the Group’s financial statements.
IAS 40,‘Investment property’ is amended to clarify that IAS 40 and IFRS 3 are not mutually exclusive. IAS 40 assists users to distinguish between investment property and owner-occupied property. Preparers also need to consider the guidance in IFRS 3 to determine whether the acquisition of an investment property is a business combination. The amendment has no impact on the Group’s financial statements.
Standards, Amendments to published Standards and Interpretations issued but not yet effective
Certain standards, amendments to published standards and interpretations have been issued that are mandatory for accounting periods beginning on or after 1 January 2015 or later periods, but which the Group has not early adopted.
62 2015 - CIM ANNUAL REPORT
CIM FINANCIAL SERVICES LTD
EXPLANATORY NOTES30 SEPTEMBER 2015

2. SIGNIFICANT ACCOUNTING POLICIES (CONT’D)
(a) Basis of preparation (cont’d)
Standards, Amendments to published Standards and Interpretations issued but not yet effective (cont’d)
At the reporting date of these financial statements, the following were in issue but not yet effective:
IFRS 9 Financial Instruments
Defined Benefit Plans: Employee Contributions (Amendments to IAS 19)
IFRS 14 Regulatory Deferral Accounts
Accounting for Acquisitions of Interests in Joint Operations (Amendments to IFRS 11)
Clarification of Acceptable Methods of Depreciation and Amortisation (Amendments to IAS 16 and IAS 38)
IFRS 15 Revenue from Contract with Customers
Agriculture: Bearer Plants (Amendments to IAS 16 and IAS 41)
Equity Method in Separate Financial Statements (Amendments to IAS 27)
Sale or Contribution of Assets between an Investor and its Associate or Joint Venture (Amendments to IFRS 10 and IAS 28)
Annual Improvements to IFRSs 2012-2014 Cycle
Investment Entities: Applying the Consolidation Exception (Amendments to IFRS 10, IFRS 12 and IAS 28)
Disclosure Initiative (Amendments to IAS 1)
Where relevant, the Group is still evaluating the effect of these Standards, amendments to published Standards and Interpretations issued but not yet effective, on the presentation of its financial statements.
The preparation of financial statements in conformity with IFRS requires the use of certain critical accounting estimates. It also requires management to exercise its judgement in the process of applying the Group’s accounting policies. The areas involving a higher degree of judgement or complexity, or areas where assumptions and estimates are significant to the financial statements, are disclosed in Note 4.
(b) Investments in subsidiaries
Separate financial statements of the investor
In the separate financial statements of the investor, investments in subsidiary companies are carried at cost.
The carrying amount is reduced to recognise any impairment in the value of individual investments.
Consolidated financial statements
Subsidiaries are all entities (including structured entities) over which the Group has control. The Group controls an entity when the Group is exposed to, or has right to variable returns from its involvement with the entity and has the ability to affect those returns through its power over the entity. Subsidiaries are fully consolidated from the date on which control is transferred to the Group. They are de-consolidated from the date that control ceases.
The acquisition method of accounting is used to account for business combinations by the Group. The consideration transferred for the acquisition of a subsidiary is the fair values of the assets transferred, the liabilities incurred and the equity interests issued by the Group. The consideration transferred includes the fair value of any asset or liability resulting from a contingent consideration arrangement. Acquisition-related costs are expensed as incurred. Identifiable assets acquired and liabilities and contingent liabilities assumed in a business combination are measured initially at their fair values at the acquisition date. On an acquisition-by-acquisition basis, the Group recognises any non controlling interest in the acquiree at fair value or at the non controlling interest’s proportionate share of the acquiree’s net assets.
2015 - CIM ANNUAL REPORT 63CIM FINANCIAL SERVICES LTD
EXPLANATORY NOTES30 SEPTEMBER 2015

2. SIGNIFICANT ACCOUNTING POLICIES (CONT’D)
(b) Investments in subsidiaries (cont’d)
Consolidated financial statements (cont’d)
The excess of the consideration transferred, the amount of any non controlling interest in the acquiree and the acquisition-date fair value of any previous equity interest in the acquiree (if any) over the fair value of the Group’s share of the identifiable net assets acquired is recorded as goodwill. If the cost of acquisition is less than the fair value of the net assets of the subsidiary acquired in the case of a bargain purchase, the difference is recognised directly in Profit or Loss as a bargain purchase gain.
Inter-company transactions, balances and unrealised gains on transactions between Group companies are eliminated. Unrealised losses are also eliminated. Accounting policies of subsidiaries have been changed where necessary to ensure consistency with the policies adopted by the Group.
Transactions with non controlling interests
The Group treats transactions with non controlling interests as transactions with equity owners of the Group. For purchases from non controlling interests, the difference between any consideration paid and the relevant share acquired of the carrying value of net assets of the subsidiary is recorded in equity. Gains or losses on disposals to non controlling interests are also recorded in equity.
Disposal of subsidiaries
When the Group ceases to have control or significant influence, any retained interest in the equity is remeasured to its fair value with the change in carrying amount recognised in Profit or Loss. The fair value is the initial carrying amount for the purposes of subsequently accounting for retained interest as an associate, joint venture or financial asset. In addition, any amount previously recognised in Other Comprehensive Income in respect of that entity is accounted for as if the Group had directly disposed of the related assets or liabilities. This may mean that amounts previously recognised in Other Comprehensive Income are reclassified to Profit or Loss.
(c) Investments in associates
Separate financial statements of the investor
In the separate financial statements of the investor, investments in associated companies are carried at cost. The carrying amount is reduced to recognise any impairment in the value of individual investments.
Consolidated financial statements
An associate is an entity over which the Group has significant influence but not control, or joint control, generally accompanying a shareholding between 20% and 50% of the voting rights. Investments in associates are accounted for using the equity method except when classified as held-for-sale. Investment in associates are initially recognised at cost as adjusted by post acquisition changes in the Group’s share of the net assets of the associate less any impairment in the value of individual investments.
Any excess of the cost of acquisition and the Group’s share of net fair value of the associate’s identifiable assets and liabilities recognised at the date of acquisition is recognised in goodwill, which is included in the carrying amount of the investment. Any excess of the Group’s share of the net fair value of identifiable assets and liabilities over the cost of acquisition, after assessment, is included as income in the determination of the Group’s share of the associate’s profit or loss.
64 2015 - CIM ANNUAL REPORT
CIM FINANCIAL SERVICES LTD
EXPLANATORY NOTES30 SEPTEMBER 2015

2. SIGNIFICANT ACCOUNTING POLICIES (CONT’D)
(c) Investments in associates (cont’d)
Consolidated financial statements (cont’d)
When the Group’s share of losses exceeds its interest in an associate, the Group discontinues recognising further losses, unless it has incurred legal or constructive obligation or made payments on behalf of the associate.
Unrealised profits and losses are eliminated to the extent of the Group’s interest in the associate. Unrealised losses are also eliminated unless the transaction provides evidence of an impairment of the asset transferred.
Where necessary, appropriate adjustments are made to the financial statements of associates to bring the accounting policies used in line with those adopted by the Group.
If the ownership interest in an associate is reduced but significant influence is retained, only a proportionate share of the amounts previously recognised in Other Comprehensive Income is reclassified to Profit or Loss where appropriate.
Dilution gains and losses arising in investments in associates are recognised in Profit or Loss.
(d) Investment in joint venture
Separate financial statements of the investor
In the separate financial statements of the investor, investments in joint venture are carried at cost. The carrying amount is reduced to recognise any impairment in the value of individual investments.
Consolidated financial statements
A joint venture is a joint arrangement whereby the parties that have joint control of the arrangement have rights to the net assets of the joint arrangements. Joint control is the contractually agreed sharing of control of an arrangement, which exists only when decisions about the relevant activities require unanimous consent of the parties sharing control. Joint ventures are accounted for using the equity method.
(e) Revenue recognition
Revenue is measured at the fair value of the consideration received or receivable stated net of discounts, returns, value added taxes, rebates and other similar allowances and after eliminating sales within the Group.
(i) Sales of goods
Sales of goods are recognised when the goods are delivered and titles have passed, at which time all of the following conditions are satisfied:
- the Group has transferred to the buyer the significant risks and rewards of ownership of the goods;
- the Group retains neither continuing managerial involvement to the degree usually associated with ownership nor effective control over the goods sold;
- the amount of revenue can be measured reliably;
- it is probable that the economic benefits associated with the transaction will flow to the Group; and
- the costs incurred or to be incurred in respect of the transaction can be measured reliably.
2015 - CIM ANNUAL REPORT 65CIM FINANCIAL SERVICES LTD
EXPLANATORY NOTES30 SEPTEMBER 2015

2. SIGNIFICANT ACCOUNTING POLICIES (CONT’D)
(e) Revenue recognition (cont’d)
(ii) Rendering of services
Revenue from rendering of services are recognised in the accounting year in which the services are rendered.
(iii) Other revenues
Other revenues earned by the Group are recognised on the following bases:
- Income in respect of hire purchase and credit sales agreements is accounted for in Profit or Loss over the periods in which the instalments are receivable, using the annuity method. The unearned income in respect of future instalments, is deducted from trade receivables
- Management fees are recognised as the services are provided
- Brokerage and commission receivable accrues in accordance with the substance of the relevant agreements
- Interest income is accrued on a time proportion basis using the effective interest method
- Dividend income accrues when the shareholders’ right to receive payment is established
- Rental income is recognised in accordance with the substance of the relevant agreement
- Lease income is recognised over the term of the lease using the net investment method, which reflects a constant periodic rate of return
- Rental income in respect of operating leases is recognised on a straight line basis over the lease term.
(f) Inventories
Inventories are valued at lower of cost and net realisable value.
Cost is determined at the weighted average method. The cost of finished goods and work in progress comprises raw materials, direct labour, other direct costs and related production overheads, but excludes interest expenses. Net realisable value is the estimate of the selling price in the ordinary course of business, less the costs of completion and selling expenses.
(g) Leases
(i) Leases are classified as finance leases where the terms of the lease transfer substantially all the risks and rewards of ownership to the lessee. All other leases are classified as operating leases. Payments made under operating leases (net of any incentives received from the lessor) are charged to the Profit or Loss on a straight-line basis over the period of the lease. Leases also include contracts for the hire of an asset that contain a provision giving the hirer an option to acquire title to the asset upon the fulfilment of agreed conditions.
(ii) Finance leases - lessor
Finance leases granted are accounted for in the Statement of Financial Position as investment at an amount equal to the net investment in the leases, after deduction of allowances for credit impairment for bad and doubtful debts. The difference between the gross receivable and the present value of the receivable is recognised as unearned finance income. Lease income is recognised over the term of the lease using the net investment method, which reflects a constant periodic rate of return.
(iii) Operating leases - lessor
Assets leased out under operating leases are included in property, plant and equipment in the Statement of Financial Position. They are depreciated over their expected useful lives on a basis consistent with similar assets. Rental income is recognised in Profit or Loss on a straight line basis over the lease term.
66 2015 - CIM ANNUAL REPORT
CIM FINANCIAL SERVICES LTD
EXPLANATORY NOTES30 SEPTEMBER 2015

2. SIGNIFICANT ACCOUNTING POLICIES (CONT’D)
(g) Leases (cont’d)
(iv) Finance leases - lessee
Property, plant and equipment obtained under finance leases are capitalised at lessee’s inception at the lower of the fair value of the leased property and the present value of the minimum lease payments and are depreciated over their useful lives. The corresponding liabilities, net of finance charges, are included as finance lease obligations. The finance charge is recognised in Profit or Loss over the lease period and calculated at a constant periodic rate of interest on the remaining balance of the liability.
(h) Foreign currencies
(i) Functional and presentation currency
Items included in the financial statements of each of the Group’s entities are measured using the currency of the primary economic environment in which the entity operates (functional currency). The consolidated financial statements are presented in Mauritian rupees, which is the Group’s functional and presentation currency.
(ii) Transactions and balances
Foreign currency transactions are translated into Mauritian Rupees using exchange rates prevailing at the dates of the transactions. Foreign exchange gains and losses resulting from the settlement of such transactions and from the translation at year-end exchange rates of monetary assets and liabilities denominated in foreign currencies are recognised in Profit or Loss, except when deferred in Other Comprehensive Income as qualifying cash flow hedges.
Non-monetary items that are measured at historical cost in a foreign currency are translated using the exchange rate at the date of the transaction.
Non-monetary items that are measured at fair value in a foreign currency are translated using the exchange rates at the date the fair value was determined.
Translation differences on non-monetary financial assets, such as equities classified as available for sale, are included in Other Comprehensive Income.
(iii) Group companies
The results and financial position of the Group entities that have a functional currency different from Mauritian Rupee are translated into the presentation currency as follows:
- assets and liabilities for each Statement of Financial Position presented are translated at the closing rate at the reporting date;
- income and expenses for each statement representing Profit or Loss and other comprehensive income are translated at average exchange rates;
- all resulting exchange differences are recognised in Other Comprehensive Income.
On disposal of foreign entities, such translation differences are recognised in the Profit or Loss as part of the gain or loss.
(i) Investment properties
Investment properties held to earn rentals or for capital appreciation or both and not occupied by the Group are measured initially at cost, including transaction costs. Subsequent to initial recognition, investment properties are carried at fair value representing open-market value determined regularly by external valuers. Changes in fair values are included in Profit or Loss in the period in which they arise.
Investment properties are derecognised when they are disposed of or when the investment properties are permanently withdrawn from use and no future economic benefit is expected from its disposal. The difference between the net disposal proceeds and the carrying amount of the asset is recognised in Profit or Loss in the period of derecognition.
2015 - CIM ANNUAL REPORT 67CIM FINANCIAL SERVICES LTD
EXPLANATORY NOTES30 SEPTEMBER 2015

2. SIGNIFICANT ACCOUNTING POLICIES (CONT’D)
(j) Property, plant and equipment
Property, plant and equipment is stated at cost, net of accumulated depreciation and accumulated impairment losses, if any. Such cost includes the cost of replacing part of the property, plant and equipment and borrowing costs for long-term construction projects if the recognition criteria are met. When significant parts of the property, plant and equipment are required to be replaced at intervals, the Group recognises such parts as individual assets with specific useful lives and depreciation, respectively. Likewise, when a major inspection is performed, its cost is recognised in the carrying amount of the property, plant and equipment as a replacement if the recognition criteria are satisfied. All other repairs and maintenance costs are recognised in Profit or Loss as incurred.
An item of property, plant and equipment and any significant part initially recognised is derecognised upon disposal or when no future economic benefits are expected from its use or disposal. Any gain or loss arising on derecognition of the asset (calculated as the difference between the net disposal proceeds and the carrying amount of the asset) is included in Profit or Loss when the asset is derecognised.
Land and buildings held for use in the production or supply of goods or services or for administrative purposes, are stated in the Statement of Financial Position at fair value based on valuation performed regularly.
Increases in the carrying amount arising on revaluation of land and buildings are credited to Other Comprehensive Income and shown as revaluation reserves in shareholder’s equity. Decreases that offset previous increases of the same amount are charged in Other Comprehensive Income and debited against revaluation reserves in equity; all other decreases are charged to Profit or Loss.
An asset’s carrying amount is written down immediately to its recoverable amount if the asset’s carrying amount is greater than its estimated recoverable amount.
Gains and losses on disposal are determined by comparing the proceeds with the carrying amount and are recognised in Profit or Loss. When revalued assets are sold, the amounts included in revaluation reserves are transferred to retained earnings.
Depreciation on property, plant and equipment are calculated on the straight line method to write off the costs or revalued amounts of the assets to their residual values as follows:
%
Buildings 2 - 4
Improvement to buildings 15
Plant & equipment 15 - 100
Vehicles 15 - 25
Land is not depreciated.
The assets’ residual values, useful lives and depreciation method are reviewed and adjusted prospectively, if appropriate, at the end of each reporting period.
(k) Intangible assets
(i) Goodwill
Goodwill arising on an acquisition of a business is carried at cost as established at the date of acquisition of the business less accumulated impairment losses, if any.
Goodwill is tested annually for impairment.
On disposal of a subsidiary, the attributable amount of goodwill is included in the determination of the gains and losses on disposal.
Goodwill is allocated to cash-generating units for the purpose of impairment testing.
68 2015 - CIM ANNUAL REPORT
CIM FINANCIAL SERVICES LTD
EXPLANATORY NOTES30 SEPTEMBER 2015

2. SIGNIFICANT ACCOUNTING POLICIES (CONT’D)
(k) Intangible assets (cont’d)
(ii) Computer software
Costs that are directly associated with identifiable software which will generate economic benefits beyond one year are recognised as intangible assets and are amortised over their estimated useful lives.
Amortisation rates are as follows:
%
Software 12 - 50
(l) Impairment of non-financial assets
Assets that have an indefinite useful life are not subject to amortisation and are tested annually for impairment.
Assets that are subject to amortisation are reviewed for impairment whenever events or changes in circumstances indicate that the carrying amount may not be recoverable. Any impairment loss is recognised for the amount by which the carrying amount of the asset exceeds its recoverable amount. The recoverable amount is the higher of an asset’s fair value less costs to sell and value in use. For the purposes of assessing impairment, assets are grouped at the lowest levels for which there are separately identifiable cash flows (cash-generating units).
(m) Current and deferred income tax
The tax expense for the period comprises of current and deferred tax. Tax is recognised in Profit or Loss, except to the extent that it relates to items recognised in Other Comprehensive Income or directly in equity.
Current Tax
The current income tax charge is based on taxable income for the year calculated on the basis of tax laws enacted or substantively enacted by the end of the reporting period.
Deferred Tax
Deferred income tax is provided in full, using the liability method, on temporary differences arising between the tax bases of assets and liabilities and their carrying amounts in the financial statements. However, if the deferred income tax arises from initial recognition of an asset or liability in a transaction, other than a business combination, that at the time of the transaction affects neither accounting nor taxable profit or loss, it is not accounted for.
Deferred income tax is determined using tax rates that have been enacted or substantively enacted at the reporting date and are expected to apply in the period when the related deferred income tax asset is realised or the deferred income tax liability is settled.
Deferred tax assets are recognised to the extent that it is probable that future taxable profit will be available against which deductible temporary differences can be utilised.
For the purposes of measuring deferred tax liabilities and deferred tax assets for investment properties that are measured using the fair value model, the carrying amounts of such properties are presumed to be recovered entirely through sale, unless the presumption is rebutted. The presumption is rebutted when the investment property is depreciable and is held within a business model whose objective is to consume substantially all of the economic benefits embodied in the investment property over time rather than through sale.
(n) Retirement benefits
(i) State plan and defined contribution pension plans
A defined contribution plan is a pension plan under which the Group pays fixed contributions into a separate entity. The Group has no legal or constructive obligations to pay further contributions if the fund does not hold sufficient assets to pay all employees the benefits relating to employee service in the current and prior periods.
Contributions to the National Pension Scheme and the Group’s defined contribution pension plan are expensed to the Profit or Loss in the period in which they fall due.
2015 - CIM ANNUAL REPORT 69CIM FINANCIAL SERVICES LTD
EXPLANATORY NOTES30 SEPTEMBER 2015

2. SIGNIFICANT ACCOUNTING POLICIES (CONT’D)
(n) Retirement benefits (cont’d)
(ii) Defined benefit pension plans and other retirement benefits
The following pension benefits are also in place:
- The Group contributes to a pension plan in respect of some employees who have a No Worse Off Guarantee (NWOG) that their benefits would not be worse than what they would have earned under a previous defined benefit plan
- The Group recognises a net liability for employees whose benefits under the current pension plan are not expected to fully offset the retirement gratuity obligations under the Employment Rights Act 2008
- The Group recognises a liability in respect of employees who are not members of any supplementary pension plan and are entitled to retirement gratuities under the Employment Rights Act 2008
- The Group recognises a liability in respect of pensions paid out of cash flow for some former employees.
A defined benefit plan is a pension plan that is not a defined contribution plan. Typically, defined benefit plans define an amount of pension benefit that an employee will receive on retirement usually dependent on one or more factors such as age, years of service and compensation.
The liability recognised in the Statement of Financial Position in respect of defined benefit pension plans is the present value of the defined benefit obligation at the end of the reporting period less the fair value of plan assets. The defined benefit obligation is calculated annually by independent actuaries using the projected unit credit method.
Remeasurement of the net defined benefit liability, which comprises actuarial gains and losses arising from experience adjustments and changes in actuarial assumptions, the return on plan assets (excluding interest) and the effect of the asset ceiling (if any, excluding interest), is recognised immediately in Other Comprehensive Income in the period in which they occur. Remeasurements recognised in Other Comprehensive Income shall not be reclassified to Profit or Loss in subsequent period.
The Group determines the net interest expense on the net defined benefit liability for the period by applying the discount rate used to measure the defined benefit obligation at the beginning of the annual period to the net defined benefit liability, taking into account any changes in the net defined liability during the period as a result of contributions and benefit payments. Net interest expense is recognised in Profit or Loss.
Service costs comprising current service cost, past service cost, as well as gains and losses on curtailments and settlements are recognised immediately in Profit or Loss.
For employees who are not covered or who are insufficiently covered by the current pension plan, the net present value of gratuity on retirement payable under the Employment Rights Act 2008 (as amended) is calculated by an actuary and provided for. The obligations arising under this item are not funded.
(o) Provisions
Provisions are recognised when the Group has a present legal or constructive obligation as a result of past events and when it is probable that this obligation will result in an outflow of economic benefits that can be reasonably estimated. Provisions for restructuring costs are recognised when the Group has a detailed formal plan for the restructuring which has been notified to affected parties.
The amount recognised as a provision is the best estimate of the consideration required to settle the present obligation at the end of the reporting period, taking into account the risks and uncertainties surrounding the obligation. When a provision is measured using the cash flows estimated to settle the present obligation, its carrying amount is the present value of those cash flows (when the effect of the time value of money is material).
70 2015 - CIM ANNUAL REPORT
CIM FINANCIAL SERVICES LTD
EXPLANATORY NOTES30 SEPTEMBER 2015
2. SIGNIFICANT ACCOUNTING POLICIES (CONT’D)
(p) Financial instruments
Financial assets and financial liabilities are recognised on the Group’s Statement of Financial Position when the Group has become a party to the contractual provisions of the instrument.
(i) Investment in financial assets
The Group classifies its financial assets depending on the purpose for which the investments were acquired.
Management determines the classification of its financial assets at initial recognition.
Purchases and sales of financial assets are recognised on trade-date, the date on which the Group commits to purchase or sell the asset. Investments are initially measured at fair value plus transaction costs for all financial assets except held-for-trading financial assets.
Held-to-maturity financial assets
Held-to-maturity investments are non-derivative financial assets with fixed or determinable payments and fixed maturities that the Group’s management has the positive intention and ability to hold to maturity. Subsequent to initial recognition, held-to-maturity investments are measured at amortised cost using the effective interest method less any impairment.
Available-for-sale financial assets
Available-for-sale financial assets are non-derivatives that are either designated in this category or not classified in any of the other categories. They are included in non current assets unless management intends to dispose of the investment within twelve months of the end of the reporting period. They are carried at fair value. Unrealised gains and losses arising from change in fair value are recognised in Other Comprehensive Income. On disposal of available-for-sale financial assets, the gain or loss arising from the difference between the sale proceeds and the previous carrying amount adjusted for any prior adjustment that had been reported in equity to reflect the fair value of that asset, is recognised in Profit or Loss.
Fair value for quoted financial assets is based on market quotation. If the market for a financial asset is not active and for unquoted financial assets the Group establishes fair value by using recognised and acceptable valuation techniques. Financial assets are categorised according to a fair value hierarchy as follows:
Level 1 financial assets are those with unadjusted quoted prices in active markets for identical investments.
Level 2 financial assets include those with quoted prices for similar investments in active markets, quoted prices for identical or similar assets in markets that are not active, inputs other than quoted prices that are observable for the asset (i.e. interest rates or yields) and inputs that are derived from or corroborated by observable market data.
2015 - CIM ANNUAL REPORT 71CIM FINANCIAL SERVICES LTD
EXPLANATORY NOTES30 SEPTEMBER 2015

2. SIGNIFICANT ACCOUNTING POLICIES (CONT’D)
(p) Financial instruments (cont’d)
(i) Investment in financial assets (cont’d)
Available-for-sale financial assets (cont’d)
Level 3 financial assets include those with unobservable inputs that reflect directors’ assumptions about what factors market participants would use in pricing such investments. These inputs are based on the best information available including the Group’s own information.
Other financial assets
All other financial assets other than those mentioned previously, including investment in subsidiaries by the Company, are stated at cost net of any impairment in value. Impairment in value of the investment portfolio or any surpluses or losses arising on disposal are accounted for in Profit or Loss.
(ii) Non current receivables
Long term receivables with fixed maturity terms are measured at amortised cost using the effective interest rate method, less provision for impairment. The carrying amount of the asset is reduced by the difference between the asset’s carrying amount and the present value of estimated cash flows discounted using the original effective interest rate. The amount of loss is recognised in Profit or Loss. Long term receivables without fixed maturity terms are measured at cost.
(iii) Borrowings
Borrowings are recognised initially at fair value being their issue proceeds net of transaction costs incurred. Borrowings are subsequently stated at amortised cost; any difference between the proceeds and the redemption value is recognised in Profit or Loss over the period of the borrowings using the effective interest method.
Borrowings are classified as current liabilities unless the Group has an unconditional right to defer settlement of the liability for at least twelve months after the end of the reporting period.
(iv) Trade and other receivables
Trade receivables are recognised initially at fair value and subsequently measured at amortised cost using the effective interest method, less provision for impairment. A provision for impairment of trade receivables is established when there is objective evidence that the Company will not be able to collect all amounts due according to the original terms of receivables. The amount of provision is recognised in Profit or Loss.
(v) Trade and other payables
Trade and other payables are stated at fair value and subsequently measured at amortised cost using the effective interest method.
(vi) Cash and cash equivalents
Cash and cash equivalents include cash in hand, deposits held at call with banks, other short-term highly liquid investments with original maturities of three months or less, and bank overdrafts. Bank overdrafts are shown within borrowings in current liabilities on the Statement of Financial Position.
72 2015 - CIM ANNUAL REPORT
CIM FINANCIAL SERVICES LTD
EXPLANATORY NOTES30 SEPTEMBER 2015

2. SIGNIFICANT ACCOUNTING POLICIES (CONT’D)
(p) Financial instruments (cont’d)
(vii) Derivative financial instruments and hedging activities
Derivatives are initially recognised at fair value on the date a derivative contract is entered into and are subsequently remeasured at their fair value. The method of recognising the resulting gain or loss depends on whether the derivative is designated as a hedging instrument, and if so, the nature of the item being hedged. The Group designates certain derivatives as either:
(a) hedges of the fair value of recognised liabilities (fair value hedge);
(b) hedges of a particular risk associated with a recognised liability or a highly probable forecast transaction (cash flow hedge).
The Group documents at the inception of the transaction the relationship between hedging instruments and hedged items, as well as its risk management objectives and strategy for undertaking various hedging transactions. The Group also documents its assessment, both at hedge inception and on an ongoing basis, of whether the instruments that are used in hedging transactions are highly effective in offsetting changes in fair values or cash flows of hedged items.
Fair value hedge
Changes in the fair value of derivatives that are designated and qualify as fair value hedges are recorded in Profit or Loss, together with any changes in fair value of the hedged asset or liability that are attributable to the hedged risk.
If the hedge no longer meets the criteria for hedge accounting, the adjustment to the carrying amount of a hedged item for which the effective interest method is used is amortised to Profit or Loss over the period to maturity.
Cash flow hedge
The effective portion of changes in the fair value of derivatives that are designated and qualify as cash flow hedges is recognised in Other Comprehensive Income. The gain or loss relating to the ineffective portion is recognised immediately in Profit or Loss.
Amounts accumulated in equity are transferred to Profit or Loss in the periods when the hedged item affects Profit or Loss. When a hedging instrument expires or is sold, or when a hedge no longer meets the criteria for hedge accounting, any cumulative gain or loss existing in equity at that time remains in equity and is recognised when the forecast transaction is ultimately recognised in Profit or Loss. When a forecast transaction is no longer expected to occur, the cumulative gain or loss that was reported in equity is immediately transferred to Profit or Loss.
(viii) Impairment of financial assets
Financial assets classified as available-for-sale
The Group assesses at the end of each reporting period whether there is objective evidence that a financial asset or a group of financial assets is impaired. In the case of equity investments classified as available-for-sale, a significant or prolonged decline in the fair value of the security below its cost is considered in determining whether the securities are impaired. If any such evidence exists for available-for-sale financial assets, the cumulative loss, measured as the difference between acquisition cost and the current fair value, less any impairment loss on that previously recognised in equity, is removed from equity and recognised in Profit or Loss. Impairment loss for the Group is recognised in Profit or Loss.
Financial assets carried at amortised cost
For receivables category, the amount of the loss is measured as the difference between the asset’s carrying amount and the present value of estimated future cash flows (excluding future credit losses that have not been incurred) discounted at the financial asset’s original effective interest rate. The carrying amount of the asset is reduced and, the amount of the loss is recognised in Profit or Loss. If a held-to-maturity investment has a variable interest rate, the discount rate for measuring any impairment loss is the current effective interest rate determined under the contract.
2015 - CIM ANNUAL REPORT 73CIM FINANCIAL SERVICES LTD
EXPLANATORY NOTES30 SEPTEMBER 2015

2. SIGNIFICANT ACCOUNTING POLICIES (CONT’D)
(p) Financial instruments (cont’d)
(viii) Impairment of financial assets (cont’d)
Financial assets carried at amortised cost (cont’d)
If, in a subsequent period, the amount of the impairment loss decreases and the decrease can be related objectively to an event occurring after the impairment was recognised, the previously recognised impairment loss is reversed through the Profit or Loss to the extent that the carrying amount of the investment at the date the impairment is reversed does not exceed what the amortised cost would have been had the impairment not been recognised.
(q) Stated capital
Ordinary shares are classified as equity. Incremental costs directly attributable to the issue of new shares or options are shown in equity as deduction, net of taxes, from proceeds. Where any group company purchases its equity share capital (treasury shares), the consideration paid, including any directly attributable incremental costs (net of income taxes) is deducted from equity attributable to the Company’s equity holders until the shares are cancelled or reissued. When such shares are subsequently reissued, any net consideration received is included in equity attributable to the Company’s equity holders.
(r) Segment reporting
Segment information presented relate to operating segments that engage in business activities for which revenues are earned and expenses incurred.
(s) Dividend distribution
Dividend distribution to the Company’s shareholders is recognised as a liability in the Group’s financial statements in the period in which the dividends are declared.
(t) Biological assets
Consumable biological assets are stated at their fair value less costs to sell and relates to livestock.
(u) Exceptional items
Exceptional items are disclosed separately in the financial statements where it is necessary to do so to provide further understanding of the financial performance of the Group. They are material items of income or expense that have been shown separately due to the significance of their nature or amount.
(v) Impairment of leases and other credit agreements
Allowance for credit losses consists of specific and portfolio provision for credit losses and is determined based on the Group’s best estimate of impairment in respect of leases and other credit agreements.
An allowance for impairment is established if there is objective evidence that the Group will not be able to collect the amount due according to the original contractual terms of the lease and other credit agreements. The amount of the provision is the difference between the carrying amount at the time the lease and other credit agreement are considered doubtful and the recoverable amount.
The provision amount also covers losses when there is objective evidence that probable losses are present in components of the lease and other credit agreements portfolio at the reporting date. They have been estimated based on the future specific losses inherent in the leases and upon historical patterns of losses in each component and the economic climate in which the clients operate. When a lease or other credit agreements are uncollectible, they are written off against the related provision for impairment; subsequent recoveries are credited to Profit or Loss.
Statutory and regulatory loss reserve requirements that exceed these amounts are dealt with in the general risk reserve as an appropriation of retained earnings.
74 2015 - CIM ANNUAL REPORT
CIM FINANCIAL SERVICES LTD
EXPLANATORY NOTES30 SEPTEMBER 2015

EXPLANATORY NOTES30 SEPTEMBER 2015
3. FINANCIAL RISK MANAGEMENT
3.1 Financial risk factorsThe Group’s activities expose it to a variety of financial risks, including the effects of changes in debt, foreign currency exchange rates and interest rates.
The Group’s overall risk management programme focuses on the unpredictability of financial markets and seeks to minimise potential adverse effects on the financial performance of the Group. The Group covers to the extent possible exposures through certain hedging operations. Written principles have been established throughout the Group for overall risk management, as well as written policies covering specific areas, such as foreign exchange risk, interest rate risk, credit risk and investing excess liquidity.
(a) Foreign exchange risk
The Group operates internationally and is exposed to foreign exchange risk arising from various currency exposures primarily with respect to certain major currencies. Entities in the Group use forward contracts to hedge their exposure to foreign currency risk. Each subsidiary is responsible for hedging the net position in each currency by using currency borrowings and external forward currency contracts, under advice from the Group Treasury.
The Group also hedges the foreign currency exposure of its contract commitments to purchase certain goods and services from abroad.
Exposure in major currencies are as follows:
Equivalent in Rs m Equivalent in Rs mGROUP COMPANY
EURO USDMUR & others Total EURO USD
MUR & others Total
Sep-15Non current financial assets 101.2 95.5 2,637.9 2,834.6 - - 2,905.9 2,905.9 Non current financial liabilities (104.0) (33.2) (2,460.9) (2,598.1) - - (1,138.2) (1,138.2)Long term exposure (2.8) 62.3 177.0 236.5 - - 1,767.7 1,767.7 Current financial assets 71.4 255.1 4,505.2 4,831.7 5.0 17.8 936.1 958.9 Current financial liabilities (9.7) (101.2) (4,637.7) (4,748.6) - (45.0) (691.1) (736.1)Short term exposure 61.7 153.9 (132.5) 83.1 5.0 (27.2) 245.0 222.8 Total net exposure 58.9 216.2 44.5 319.6 5.0 (27.2) 2,012.7 1,990.5
Sep-14Non current financial assets 127.6 37.1 2,711.1 2,875.8 - - 2,697.2 2,697.2 Non current financial liabilities (131.3) (71.3) (2,000.9) (2,203.5) - (31.8) (888.3) (920.1)Long term exposure (3.7) (34.2) 710.2 672.3 - (31.8) 1,808.9 1,777.1 Current financial assets 57.1 233.0 3,477.8 3,767.9 - 22.0 691.5 713.5 Current financial liabilities (37.6) (74.8) (4,253.6) (4,366.0) - (63.5) (750.6) (814.1)Short term exposure 19.5 158.2 (775.8) (598.1) - (41.5) (59.1) (100.6)Total net exposure 15.8 124.0 (65.6) 74.2 - (73.3) 1,749.8 1,676.5
2015 - CIM ANNUAL REPORT 75CIM FINANCIAL SERVICES LTD

3. FINANCIAL RISK MANAGEMENT (CONT’D)
3.1 Financial risk factors (cont’d)
(a) Foreign exchange risk (cont’d)
The sensitivity of the net result for the year and equity in regards to the Group’s financial assets and liabilities and the USD to Rupee and EURO to Rupee exchange rate is shown below.
If Rupee had weakened/strengthened by 3% and 2% against USD and EURO respectively, the financial impact would be as follows:
GROUP COMPANY
Sep-15 Sep-14 Sep-15 Sep-14
Rs m Rs m Rs m Rs m
Net result for the year (+/-) 6.5 1.1 0.5 0.6 Equity (+/-) 1.2 2.9 1.2 2.9
(b) Interest rate risk
The Group’s income and operating cash flows are influenced by changing market interest rates. The Group’s borrowings and lendings are contracted at fixed and variable rates.
In order to mitigate any interest rate risk, the company engaged in leasing activities has a portfolio of fixed and floating leases and deposits.
The sensitivity of the net result for the year and equity to a reasonably possible change in interest of + or - 0.5% (2014: +/-0.5%), with effect from the beginning of the year, is shown below. These changes are considered to be reasonably possible based on observations of current market conditions.
GROUP COMPANY
Sep-15 Sep-14 Sep-15 Sep-14
Rs m Rs m Rs m Rs m
Net result for the year (+/-) 15.4 15.8 8.1 7.4
(c) Credit risk
Credit risk is the risk of financial loss if a customer or counterparty to a financial instrument fails to meet its contractual obligations, and arises principally from the Group’s lease and other credit arrangements, which include hire purchase contracts, and trade and other receivables. The amounts presented in the Statements of Financial Position are net of allowances for doubtful receivables, estimated by management based on prior experience, Bank of Mauritius guidelines and the current environment. In respect of the lease and other credit arrangements, impaired facilities are individually assessed for provisioning and a portfolio provision is made based on the Bank of Mauritius guidelines.
The Group has policies in place to ensure that credit sales of products and services are made to customers after a credit assessment has been carried out and credit terms agreed (refer to note 22 for trade receivables). The Group has no significant concentration of credit risk, with exposure spread over a large number of customers. Credit facilities to customers are monitored and the Group has policies in place to identify defaults and recover amounts due. The maximum exposure to credit risk at the reporting date is the fair value of each class of receivables.
76 2015 - CIM ANNUAL REPORT
CIM FINANCIAL SERVICES LTD
EXPLANATORY NOTES30 SEPTEMBER 2015
3. FINANCIAL RISK MANAGEMENT (CONT’D)
3.1 Financial risk factors (cont’d)
(c) Credit risk (cont’d)
Leases and other credit agreements
Leases and hire purchase and other credit arrangements granted are effectively secured as the rights to the leased/hired assets revert to the lessor in the event of default. There are two types of leases, finance lease and operating lease. Most of the assets financed are motor vehicles and the rest are various types of equipment. Period of lease normally vary between 3 - 7 years and are mostly given at fixed rates.
As at 30 September 2015, leases and other credit agreements, which are mainly more than 6 months overdue, of Rs 256.0m (2014: Rs 222.0m) were individually determined to be impaired. The amount of specific provision was Rs 155.6m (2014: Rs 128.1m). The fair value of the collateral on impaired leases is estimated at Rs 138.1m (2014: Rs 147.8m). The individually impaired receivables mainly relate to customers with a history of default.
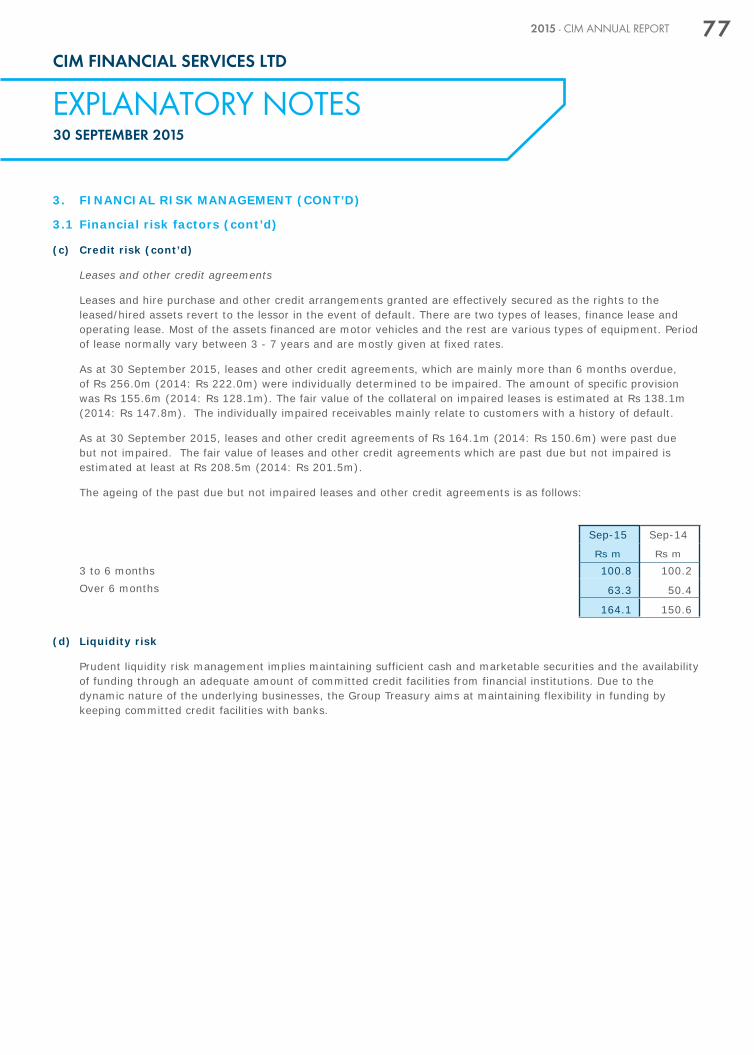
As at 30 September 2015, leases and other credit agreements of Rs 164.1m (2014: Rs 150.6m) were past due but not impaired. The fair value of leases and other credit agreements which are past due but not impaired is estimated at least at Rs 208.5m (2014: Rs 201.5m).
The ageing of the past due but not impaired leases and other credit agreements is as follows:
Sep-15 Sep-14
Rs m Rs m
3 to 6 months 100.8 100.2Over 6 months 63.3 50.4
164.1 150.6
(d) Liquidity risk
Prudent liquidity risk management implies maintaining sufficient cash and marketable securities and the availability of funding through an adequate amount of committed credit facilities from financial institutions. Due to the dynamic nature of the underlying businesses, the Group Treasury aims at maintaining flexibility in funding by keeping committed credit facilities with banks.
2015 - CIM ANNUAL REPORT 77CIM FINANCIAL SERVICES LTD
EXPLANATORY NOTES30 SEPTEMBER 2015

EXPLANATORY NOTES30 SEPTEMBER 2015
3. FINANCIAL RISK MANAGEMENT (CONT’D)
3.2 Fair value estimationThe nominal value less credit adjustments of receivables and payables are assumed to approximate their fair values.
The fair value of financial liabilities for disclosure purposes is estimated by discounting the future contractual cash flows at the current market interest rate that is available to the Group for similar financial instruments.
3.3 Capital risk managementThe Group and the Company aim at distributing an adequate dividend whilst ensuring that sufficient resources are maintained to continue as a going concern and for expansion. The ratio of debt to equity is used to manage capital risk and is kept at a reasonable level.
GROUP COMPANY
Sep-15 Sep-14 Sep-15 Sep-14
Rs m Rs m Rs m Rs m
Debt (note 25(a)) 5,483.1 5,196.8 1,624.6 1,490.1 Less: Bank balances & cash (note 23) (953.9) (608.6) (24.6) (2.8)
4,529.2 4,588.2 1,600.0 1,487.3
Equity 3,017.6 2,654.1 2,021.1 1,706.8
Debt/Equity ratio 1.5 1.7 0.8 0.9
There were no changes in the Group’s approach to capital risk management during the year.
78 2015 - CIM ANNUAL REPORT
CIM FINANCIAL SERVICES LTD

4. SIGNIFICANT ACCOUNTING JUDGEMENTS AND ESTIMATES
In applying the Group’s accounting policies, the following judgements and estimates have been used with significant impacts on amounts recognised in the financial statements:
Revaluation of property, plant and equipment and investment properties
The Group carries its investment properties at fair value, with changes in fair value being recognised in Profit or Loss. In addition, it measures land and buildings at revalued amounts with changes in fair value being recognised in Other Comprehensive Income. The Group engaged independent valuation specialists to determine fair value as at 30 September 2014. The valuers used depreciated replacement cost approach for buildings and the sales comparison approach for land. The directors have reassessed the fair values of the investment properties at 30 September 2015.
The key assumptions used to determine the fair value are further explained in Notes 11 and 12.
Impairment of Goodwill
Goodwill is tested annually for impairment and carried at cost less accumulated impairment losses. For acquired goodwill the value of the investment is based on a discounted cash flow method. The discount rate is estimated by management using currently available rate of interest and an estimate of the risk premium.
Pension Benefits
The present value of the pension obligations depends on a number of factors that are determined on an actuarial basis using a number of assumptions. The assumptions used in determining the net cost (income) for pensions include the discount rate. Any changes in these assumptions will impact the carrying amount of pension obligations.
The Group determines the appropriate discount rate at the end of each year. This is the interest rate that should be used to determine the present value of estimated future cash outflows expected to be required to settle the pension obligations.
Other key assumptions for pension obligation are based in part on current market conditions. Additional information is disclosed in Note 27.
Fair value estimation
In assessing the fair value of financial instruments, the Group uses a variety of methods and makes assumptions that are based on market conditions existing at the end of each reporting date. The face value less any estimated credit adjustments for financial assets and financial liabilities with a maturity of less than one year are assumed to approximate their fair values. The fair values of those assets and liabilities not presented in the Group’s and the Company’s Statements of Financial Position at their fair values are not materially different from their carrying amounts.
Fair value of securities not quoted in active market
The fair value of securities not quoted in active market is determined by using valuation techniques including third party transaction values, earnings, net asset value or discounted cash flows, whichever is appropriate.
Provisions for credit losses
The Group makes a provision against its portfolio of leases, hire purchase, credit cards and factoring. The Group follows the guidance under International Financial Reporting Standards and the Bank of Mauritius Guidelines in order to determine its best estimate of the provision required. In making this estimate, the Group looks, among other factors, at future specific losses inherent in the facilities, historical patterns of losses and the economic climate in which clients operate.
2015 - CIM ANNUAL REPORT 79CIM FINANCIAL SERVICES LTD
EXPLANATORY NOTES30 SEPTEMBER 2015

4. SIGNIFICANT ACCOUNTING JUDGEMENTS AND ESTIMATES (CONT’D)
Asset lives and residual values
Property, plant and equipment are depreciated over its useful life taking into account residual values, where appropriate. The actual lives of the assets and residual values are assessed annually and may vary depending on a number of factors. In reassessing asset lives, factors such as technological innovation, product life cycles and maintenance programmes are taken into account. Residual value assessments consider issues such as future market conditions, the remaining life of the asset and projected disposal values. Consideration is also given to the extent of current profits and losses on the disposal of similar assets.
Depreciation policies
Property, plant and equipment are depreciated to their residual values over their estimated useful lives. The residual value of an asset is the estimated net amount that the Group would currently obtain from disposal of the asset, if the asset was already of the age and in condition expected at the end of its useful life.
Limitations of sensitivity analysis
Sensitivity analysis in respect of market risk demonstrates the effect of a change in a key assumption while other assumptions remain unchanged. In reality, there is a correlation between the assumptions and other factors. It should also be noted that these sensitivities are non-linear and larger or smaller impacts should not be interpolated or extrapolated from these results.
Sensitivity analysis does not take into consideration that the Group’s assets and liabilities are managed. Other limitations include the use of hypothetical market movements to demonstrate potential risks that only represent the Group’s view of possible near-term market changes that cannot be predicted with any certainty.
Deferred tax on investment properties
For the purposes of measuring deferred tax liabilities or deferred tax assets arising from investment properties, the directors reviewed the Group’s investment property portfolio and concluded that the investment properties are held under a business model whose objective is to consume substantially all of the economic benefits embodied in the investment properties over time. Therefore, the Group has recognised deferred tax on changes in fair value of investment properties.
Fair value estimation
A number of assets and liabilities included in the Group’s financial statements are measured at fair value and utilise market observable inputs and data. Inputs used in determining fair value are categorised into:
Level 1: Quoted prices (unadjusted) in active market for identical assets or liabilities.
Level 2: Observable inputs other than quoted prices included within level 1.
Level 3: Unobservable inputs that are not derived from market data.
In assessing the fair value of financial instruments in level 3, the Group uses a variety of methods and makes assumptions that are based on market conditions existing at the end of each reporting date. The carrying value less any estimated credit adjustments for financial assets and financial liabilities within a maturity of less than one year are assumed to approximate their fair values. The fair values of those assets and liabilities not presented in the Group’s Statements of Financial Position at their fair values are not materially different from their carrying amounts.
80 2015 - CIM ANNUAL REPORT
CIM FINANCIAL SERVICES LTD
EXPLANATORY NOTES30 SEPTEMBER 2015

EXPLANATORY NOTES30 SEPTEMBER 2015
5. REVENUE GROUP COMPANY
Sep-15 Sep-14 Sep-15 Sep-14
Rs m Rs m Rs m Rs m
Revenue is made up of:Sales of goods 2,028.5 1,682.9 - - Sales of services 752.4 635.2 - -
2,780.9 2,318.1 - - Interest income 157.2 168.2 68.1 68.8 Earned income 586.8 557.2 - -
744.0 725.4 68.1 68.8 Commission 154.9 108.9 - - Rent 46.0 40.8 - - Other income 345.8 308.5 - - Investment income - unquoted 32.2 - 576.2 337.5
578.9 458.2 576.2 337.5 4,103.8 3,501.7 644.3 406.3
6. PROFIT FROM OPERATIONS GROUP COMPANY
Sep-15 Sep-14 Sep-15 Sep-14
Rs m Rs m Rs m Rs m
Revenue (note 5) 4,103.8 3,501.7 644.3 406.3 Other income - not part of revenue (note 7) 7.1 2.3 4.0 1.0
4,110.9 3,504.0 648.3 407.3 Cost of sales (1,692.4) (1,406.9) - - Employee benefit expense: Wages, salaries and related expenses (701.4) (627.6) (6.4) (5.5) Pension and other retirement benefit costs (44.1) (35.5) - - Depreciation and amortisation (134.0) (110.1) - - Foreign exchange differences 30.9 27.0 (8.9) 2.0 Other expenses and services (621.4) (533.6) (15.1) (9.1)Impairment of investment (note 17) (6.3) - (6.3) -
942.2 817.3 611.6 394.7
7. OTHER INCOME GROUP COMPANY
Sep-15 Sep-14 Sep-15 Sep-14
Rs m Rs m Rs m Rs m
Other income 2.9 - 1.2 1.0 Profit on disposal of property, plant and equipment 1.4 2.3 - - Profit on disposal of available for sale assets 2.8 - 2.8 -
7.1 2.3 4.0 1.0
8. FINANCE COSTS GROUP COMPANY
Sep-15 Sep-14 Sep-15 Sep-14
Rs m Rs m Rs m Rs m
The finance cost is on:Bank overdrafts 2.3 2.2 - - Bank loans and other loans repayable by instalments Within one year 19.9 6.5 11.0 1.2 After one year and before two years 7.2 11.9 7.2 11.9 After two years and before five years 3.7 10.7 2.2 10.7 Bank loans and other loans not repayable by instalments Within one year 196.8 188.5 22.2 15.3 After one year and before two years - - - - After two years and before five years 41.6 41.6 41.6 41.6
271.5 261.4 84.2 80.7
2015 - CIM ANNUAL REPORT 81CIM FINANCIAL SERVICES LTD

EXPLANATORY NOTES30 SEPTEMBER 2015
9. TAXATION GROUP COMPANY
Sep-15 Sep-14 Sep-15 Sep-14
Rs m Rs m Rs m Rs m
Provision on the profit for the year at 15% (2014:15%) 110.3 93.0 - - Over provision (3.2) - - - Movement in deferred taxation (note 26) 3.4 3.7 - 0.5
110.5 96.7 - 0.5
The effective tax rate differs from that determined by applying the statutory income tax rate to profit before impairment of investment. This is due primarily to different tax rates, non deductible expenses and tax exempt income.
GROUP COMPANY
Sep-15 Sep-14 Sep-15 Sep-14
% % % %
Reconciliation of effective tax rate is as follows:Tax rate applicable 15.0 15.0 15.0 15.0 Non deductible expenses 2.4 1.7 0.9 1.4 Tax - exempt income (1.1) (2.7) (15.9) (16.2)Effective tax rate 16.3 14.0 - 0.2
82 2015 - CIM ANNUAL REPORT
CIM FINANCIAL SERVICES LTD

10. OTHER COMPREHENSIVE INCOME
Revaluation Surplus
Hedging Reserve
Translation Reserve
Actuarial gains/
(losses) Total Rs m Rs m Rs m Rs m Rs m
GROUPYear ended 30 September 2015
Items that will not be reclassified to Profit or Loss:Remeasurement of defined benefit obligations (note 27) - - - (5.3) (5.3)Deferred tax on remeasurement of defined benefit obligations - - - (0.4) (0.4)
Items that may be reclassified subsequently to Profit or Loss: Exchange difference on translation of foreign entities - - 7.7 - 7.7 Movement in reserves of associates - - (0.3) - (0.3)Cash flow hedges (note 25(d))Losses arising during the year - (8.3) - - (8.3)Reclassification adjustment in Profit or Loss - 6.2 - - 6.2
Other comprehensive income for the year, net of tax - (2.1) 7.4 (5.7) (0.4)
Revaluation Surplus
Hedging Reserve
Translation Reserve
Actuarial gains/
(losses) Total Rs m Rs m Rs m Rs m Rs m
GROUPYear ended 30 September 2014
Items that will not be reclassified to Profit or Loss:Gains on revaluation of land and buildings (note 11) 177.3 - - - 177.3
Deferred tax on gains on revaluation of buildings (0.4) - - - (0.4)Remeasurement of defined benefit obligations (note 27) - - - (3.6) (3.6)Deferred tax on remeasurement of defined benefit obligations - - - 0.2 0.2
Items that may be reclassified subsequently to Profit or Loss: Exchange difference on translation of foreign entities - - 2.2 - 2.2 Cash flow hedges (note 25(d))Losses arising during the year - (1.5) - - (1.5)Reclassification adjustment in Profit or Loss - 0.8 - - 0.8
Other comprehensive income for the year, net of tax 176.9 (0.7) 2.2 (3.4) 175.0
2015 - CIM ANNUAL REPORT 83CIM FINANCIAL SERVICES LTD
EXPLANATORY NOTES30 SEPTEMBER 2015

EXPLANATORY NOTES 30 SEPTEMBER 2015
10. OTHER COMPREHENSIVE INCOME (CONT’D)Hedging Reserve
COMPANY Rs m
Year ended 30 September 2015Items that may be reclassified subsequently to Profit or Loss: Cash flow hedges (note 25(d)) Losses arising during the year (8.3) Reclassification adjustment in Profit or Loss 6.2
(2.1)Year ended 30 September 2014Items that may be reclassified subsequently to Profit or Loss: Cash flow hedges (note 25(d)) Losses arising during the year (1.5) Reclassification adjustment in Profit or Loss 0.8
(0.7)
Revaluation surplus
The revaluation arises on the revaluation of property, plant and equipment.
Hedging reserve
The hedging reserve comprises the effective portion of the cumulative net change in the fair value of cash flow hedging instruments related to hedged transactions that have not yet occurred.
Translation reserve
The translation reserve comprises all foreign currency differences arising from the translation of the financial statements.
Actuarial gains/(losses)
The actuarial gains/(losses) reserve represents the cumulative remeasurement of defined benefit obligation recognised.
84 2015 - CIM ANNUAL REPORT
CIM FINANCIAL SERVICES LTD

11. PROPERTY, PLANT AND EQUIPMENT
(a) GROUP Land and Buildings
Plant and Equipment Vehicles Total
Cost or Valuation Rs m Rs m Rs m Rs m
At 1 October 2013 906.9 380.1 237.6 1,524.6 Additions 6.5 136.2 46.5 189.2 Scrapped assets - (21.6) - (21.6)Transfer (note 12) 32.8 3.0 - 35.8 Disposals - (56.5) (28.1) (84.6)Revaluation surplus 169.1 - - 169.1 At 30 September 2014 1,115.3 441.2 256.0 1,812.5 Additions 3.9 124.9 17.0 145.8 Acquisition through business combination (note 32) - 1.7 0.7 2.4 Scrapped assets - (0.2) - (0.2)Transfer (note 12) 31.6 - - 31.6 Disposals - (2.1) (34.0) (36.1)At 30 September 2015 1,150.8 565.5 239.7 1,956.0
Land and Buildings
Plant and Equipment Vehicles Total
Depreciation and impairment Rs m Rs m Rs m Rs m
At 1 October 2013 4.4 302.0 103.1 409.5 Charge for the year 3.8 41.5 35.4 80.7 Scrapped assets - (21.3) - (21.3)Disposal adjustment - (50.9) (21.2) (72.1)Adjustment on revaluation (8.2) - - (8.2)At 30 September 2014 - 271.3 117.3 388.6 Charge for the year 3.4 62.1 38.0 103.5 Acquisition through business combination (note 32) - 1.4 0.3 1.7 Scrapped assets - (0.2) - (0.2)Disposal adjustment - (2.1) (27.2) (29.3)At 30 September 2015 3.4 332.5 128.4 464.3 Carrying valueAt 30 September 2015 1,147.4 233.0 111.3 1,491.7 At 30 September 2014 1,115.3 169.9 138.7 1,423.9
Bank borrowings of some subsidiaries are secured by floating charges on their respective assets.
2015 - CIM ANNUAL REPORT 85CIM FINANCIAL SERVICES LTD
EXPLANATORY NOTES30 SEPTEMBER 2015
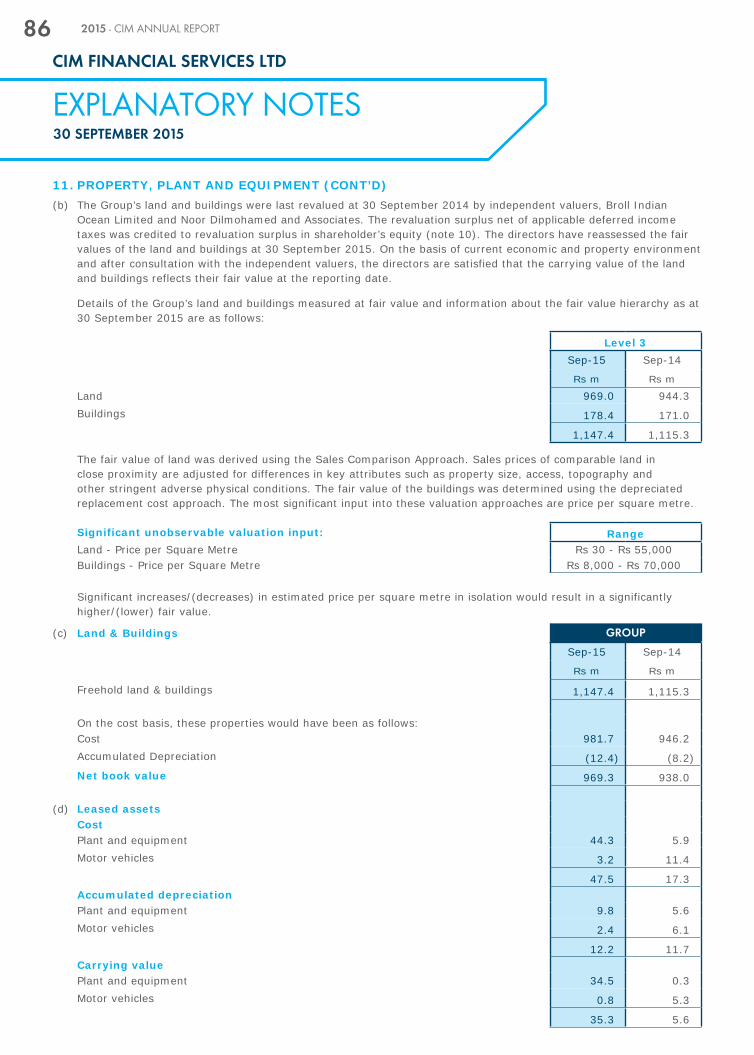
EXPLANATORY NOTES30 SEPTEMBER 2015
11. PROPERTY, PLANT AND EQUIPMENT (CONT’D)(b) The Group’s land and buildings were last revalued at 30 September 2014 by independent valuers, Broll Indian
Ocean Limited and Noor Dilmohamed and Associates. The revaluation surplus net of applicable deferred income taxes was credited to revaluation surplus in shareholder’s equity (note 10). The directors have reassessed the fair values of the land and buildings at 30 September 2015. On the basis of current economic and property environment and after consultation with the independent valuers, the directors are satisfied that the carrying value of the land and buildings reflects their fair value at the reporting date.
Details of the Group’s land and buildings measured at fair value and information about the fair value hierarchy as at 30 September 2015 are as follows:
Level 3Sep-15 Sep-14
Rs m Rs m
Land 969.0 944.3 Buildings 178.4 171.0
1,147.4 1,115.3
The fair value of land was derived using the Sales Comparison Approach. Sales prices of comparable land in close proximity are adjusted for differences in key attributes such as property size, access, topography and other stringent adverse physical conditions. The fair value of the buildings was determined using the depreciated replacement cost approach. The most significant input into these valuation approaches are price per square metre.
Significant unobservable valuation input: RangeLand - Price per Square Metre Rs 30 - Rs 55,000Buildings - Price per Square Metre Rs 8,000 - Rs 70,000
Significant increases/(decreases) in estimated price per square metre in isolation would result in a significantly higher/(lower) fair value.
(c) Land & Buildings GROUP
Sep-15 Sep-14
Rs m Rs m
Freehold land & buildings 1,147.4 1,115.3
On the cost basis, these properties would have been as follows:Cost 981.7 946.2 Accumulated Depreciation (12.4) (8.2)Net book value 969.3 938.0
(d) Leased assetsCost Plant and equipment 44.3 5.9Motor vehicles 3.2 11.4
47.5 17.3Accumulated depreciationPlant and equipment 9.8 5.6Motor vehicles 2.4 6.1
12.2 11.7Carrying valuePlant and equipment 34.5 0.3Motor vehicles 0.8 5.3
35.3 5.6
86 2015 - CIM ANNUAL REPORT
CIM FINANCIAL SERVICES LTD

EXPLANATORY NOTES30 SEPTEMBER 2015
12. INVESTMENT PROPERTIES GROUP COMPANY
Sep-15 Sep-14 Sep-15 Sep-14
Rs m Rs m Rs m Rs m
At 1 October 556.1 477.5 30.8 27.7 Additions 9.2 0.2 - - Transfer (note 11) (31.6) (35.8) - - Revaluation surplus - 114.2 - 3.1 At 30 September 533.7 556.1 30.8 30.8
Bank borrowings of some subsidiaries are secured by floating charges on their respective assets.
(a) The Group and Company’s investment properties have been revalued at their fair value on 30 September 2014 by Broll Indian Ocean Limited, an independent chartered valuer. The different valuation methods used are:
(i) sales comparison approach for land;
(ii) depreciated replacement cost approach for buildings.
The directors have reassessed the fair values of the investment properties at 30 September 2015. On the basis of current economic and property environment and after consultation with the independent valuers, the directors are satisfied that the carrying value of the investment properties reflects their fair value at the reporting date.
Details of the Group and Company’s investment properties, which are classified as level 3 on the fair value hierarchy as at 30 September 2015 are as follows:
GROUP COMPANY
Sep-15 Sep-14 Sep-15 Sep-14
Rs m Rs m Rs m Rs m
Land 300.9 323.0 - - Buildings 232.8 233.1 30.8 30.8
533.7 556.1 30.8 30.8
Significant unobservable valuation input: Range
Land - Price per Square Metre Rs 2,000 - Rs 55,000
Buildings - Price per Square Metre Rs 8,000 - Rs 70,000
Significant increases/(decreases) in estimated price per square metre in isolation would result in a significantly higher/(lower) fair value.
The following have been recognised in Profit or Loss:
GROUP COMPANY
Sep-15 Sep-14 Sep-15 Sep-14
Rs m Rs m Rs m Rs m
Rental income 51.9 40.8 - - Direct operating expenses arising from investment properties that generate rental income 10.0 11.1 - - Direct operating expenses that did not generate rental income 8.9 9.5 - -
2015 - CIM ANNUAL REPORT 87CIM FINANCIAL SERVICES LTD

EXPLANATORY NOTES30 SEPTEMBER 2015
13. INTANGIBLE ASSETSGoodwill on acquisition Software Total
Rs m Rs m Rs m
a) GROUPCost At 1 October 2013 1,094.0 214.4 1,308.4 Additions - 20.2 20.2 At 30 September 2014 1,094.0 234.6 1,328.6 Additions - 9.9 9.9 Acquisition through business combination (note 32) 5.4 - 5.4 Scrapped assets - (1.6) (1.6)At 30 September 2015 1,099.4 242.9 1,342.3
Amortisation/Impairment At 1 October 2013 500.7 136.9 637.6 Charge for the year - 29.4 29.4 At 30 September 2014 500.7 166.3 667.0 Charge for the year - 30.5 30.5 Scrapped assets - (1.6) (1.6)At 30 September 2015 500.7 195.2 695.9
Carrying valueAt 30 September 2015 598.7 47.7 646.4
At 30 September 2014 593.3 68.3 661.6
At the end of the reporting period, the Group assessed the recoverable amount of goodwill and determined that there is no further impairment of goodwill. The recoverable amount was arrived at based on a forecasted cash flow, a risk free rate of 6.0% (2014: 6.5%), a risk premium of 7.5% (2014: 6.5%) and took into consideration the market and economic conditions.
Software TotalRs m Rs m
b) COMPANY
Cost/net book valueAdditions 0.3 0.3 At 30 September 2015 0.3 0.3
14. INVESTMENT IN SUBSIDIARY COMPANIES
COMPANY
Sep-15 Sep-14
(a) Rs m Rs m
At 1 October 1,831.3 1,823.0 Additions 70.8 8.3 At 30 September 1,902.1 1,831.3
88 2015 - CIM ANNUAL REPORT
CIM FINANCIAL SERVICES LTD
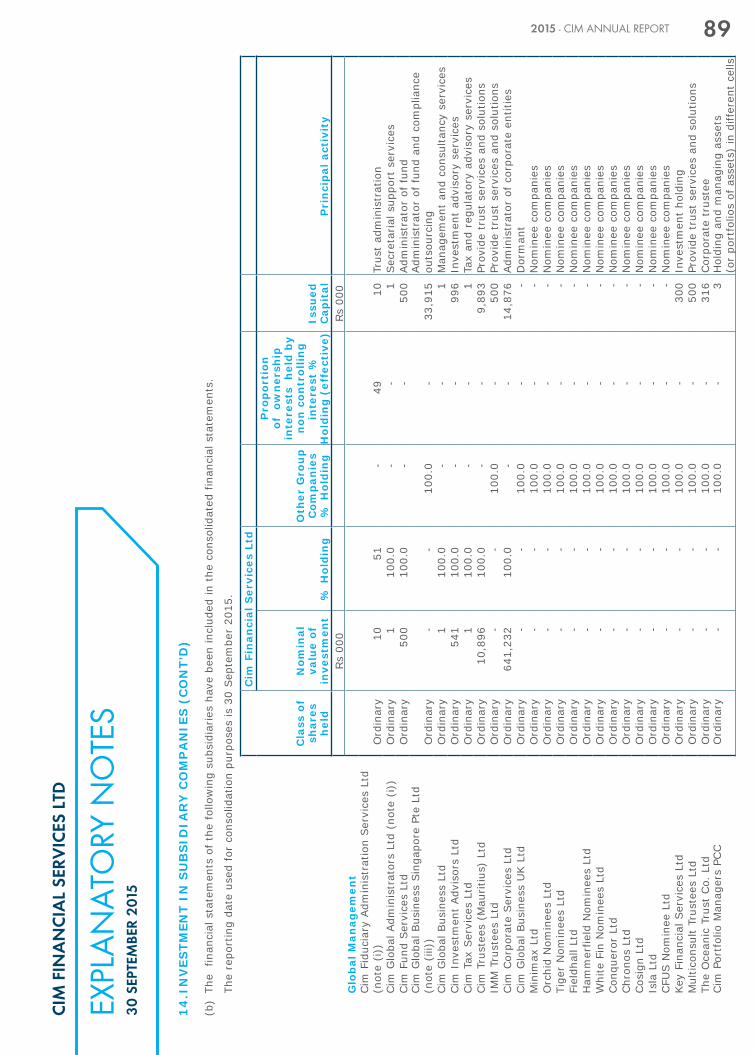
EXPL
AN
ATO
RY N
OTE
S3
0 S
EPTE
MBE
R 2
015
14
.IN
VES
TMEN
T IN
SU
BS
IDIA
RY
CO
MP
AN
IES
(C
ON
T’D
)
(b)
The
fin
anci
al s
tate
men
ts o
f th
e fo
llow
ing
subs
idia
ries
hav
e be
en in
clud
ed in
the
con
solid
ated
fin
anci
al s
tate
men
ts.
The
repo
rtin
g da
te u
sed
for
cons
olid
atio
n pu
rpos
es is
30
Sep
tem
ber
2015
.
Cim
Fin
anci
al S
ervi
ces
Ltd
Cla
ss o
f sh
ares
h
eld
Nom
inal
va
lue
of
inve
stm
ent
% H
old
ing
Oth
er G
rou
p
Com
pan
ies
% H
old
ing
Pro
por
tion
of
ow
ner
ship
in
tere
sts
hel
d b
y n
on c
ontr
ollin
g
inte
rest
%
Hol
din
g (
effe
ctiv
e)Is
sued
C
apit
alP
rin
cip
al a
ctiv
ity
Rs
000
Rs
000
Glo
bal
Man
agem
ent
Cim
Fid
ucia
ry A
dmin
istr
atio
n Ser
vice
s Lt
d (n
ote
(i))
Ord
inar
y 1
0 5
1 -
4
9 10
Trus
t ad
min
istr
atio
nCim
Glo
bal A
dmin
istr
ator
s Lt
d (n
ote
(i))
Ord
inar
y 1
1
00.0
-
-
1
Sec
reta
rial
sup
port
ser
vice
sCim
Fun
d Ser
vice
s Lt
dO
rdin
ary
500
1
00.0
-
-
5
00
Adm
inis
trat
or o
f fu
ndCim
Glo
bal B
usin
ess
Sin
gapo
re P
te L
td
(not
e (i
ii))
Ord
inar
y -
-
10
0.0
-
33,
915
Adm
inis
trat
or o
f fu
nd a
nd c
ompl
ianc
e ou
tsou
rcin
gCim
Glo
bal B
usin
ess
Ltd
Ord
inar
y 1
1
00.0
-
-
1
M
anag
emen
t an
d co
nsul
tanc
y se
rvic
esCim
Inv
estm
ent
Adv
isor
s Lt
d O
rdin
ary
541
1
00.0
-
-
9
96
Inve
stm
ent
advi
sory
ser
vice
sCim
Tax
Ser
vice
s Lt
dO
rdin
ary
1
100
.0
-
-
1
Tax
and
regu
lato
ry a
dvis
ory
serv
ices
Cim
Tru
stee
s (M
auritiu
s) L
tdO
rdin
ary
10,
896
100
.0
-
-
9,8
93
Prov
ide
trus
t se
rvic
es a
nd s
olut
ions
IMM
Tru
stee
s Lt
dO
rdin
ary
-
-
100.
0 -
5
00
Prov
ide
trus
t se
rvic
es a
nd s
olut
ions
Cim
Cor
pora
te S
ervi
ces
Ltd
Ord
inar
y 6
41,2
32
100
.0
-
-
14,
876
Adm
inis
trat
or o
f co
rpor
ate
entit
ies
Cim
Glo
bal B
usin
ess
UK L
tdO
rdin
ary
-
-
100
.0
-
-
Dor
man
tM
inim
ax L
tdO
rdin
ary
-
-
100.
0 -
-
N
omin
ee c
ompa
nies
Orc
hid
Nom
inee
s Lt
dO
rdin
ary
-
-
100.
0 -
-
N
omin
ee c
ompa
nies
Tige
r N
omin
ees
Ltd
Ord
inar
y -
-
10
0.0
-
-
Nom
inee
com
pani
esFi
eldh
all L
tdO
rdin
ary
-
-
100.
0 -
-
N
omin
ee c
ompa
nies
Ham
mer
field
Nom
inee
s Lt
dO
rdin
ary
-
-
100.
0 -
-
N
omin
ee c
ompa
nies
Whi
te F
in N
omin
ees
Ltd
Ord
inar
y -
-
10
0.0
-
-
Nom
inee
com
pani
esCon
quer
or L
tdO
rdin
ary
-
-
100.
0 -
-
N
omin
ee c
ompa
nies
Chr
onos
Ltd
Ord
inar
y -
-
10
0.0
-
-
Nom
inee
com
pani
esCos
ign
Ltd
Ord
inar
y -
-
10
0.0
-
-
Nom
inee
com
pani
esIs
la L
tdO
rdin
ary
-
-
100.
0 -
-
N
omin
ee c
ompa
nies
CFU
S N
omin
ee L
tdO
rdin
ary
-
-
100.
0 -
-
N
omin
ee c
ompa
nies
Key
Fina
ncia
l Ser
vice
s Lt
dO
rdin
ary
-
-
100.
0 -
3
00
Inve
stm
ent
hold
ing
Mul
ticon
sult
Trus
tees
Ltd
Ord
inar
y -
-
10
0.0
-
500
Pr
ovid
e tr
ust
serv
ices
and
sol
utio
nsTh
e O
cean
ic T
rust
Co.
Ltd
Ord
inar
y -
-
10
0.0
-
316
Cor
pora
te t
rust
eeCim
Por
tfol
io M
anag
ers
PCC
Ord
inar
y-
-10
0.0
-3
Hol
ding
and
man
agin
g as
sets
(o
r po
rtfo
lios
of a
sset
s) in
diff
eren
t ce
lls
2015 - CIM ANNUAL REPORT 89C
IM F
INA
NC
IAL
SERV
ICES
LTD
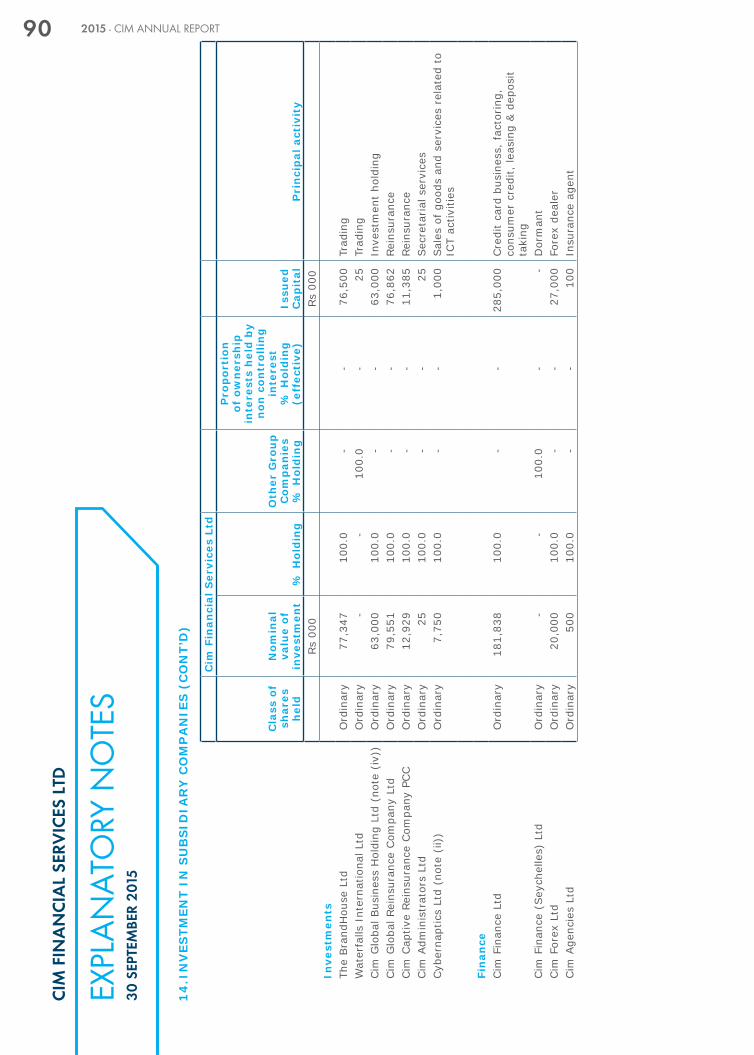
EXPL
AN
ATO
RY N
OTE
S3
0 S
EPTE
MBE
R 2
015
14
.IN
VES
TMEN
T IN
SU
BS
IDIA
RY
CO
MP
AN
IES
(C
ON
T’D
)
Cim
Fin
anci
al S
ervi
ces
Ltd
Cla
ss o
f sh
ares
h
eld
Nom
inal
va
lue
of
inve
stm
ent
% H
old
ing
Oth
er G
rou
p
Com
pan
ies
% H
old
ing
Pro
por
tion
of
ow
ner
ship
in
tere
sts
hel
d b
y n
on c
ontr
ollin
g
inte
rest
%
Hol
din
g
(eff
ecti
ve)
Issu
ed
Cap
ital
Pri
nci
pal
act
ivit
yRs
000
Rs
000
Inve
stm
ents
The
Bra
ndH
ouse
Ltd
Ord
inar
y 7
7,34
7 10
0.0
-
-
76,5
00Tr
adin
gW
ater
falls
Int
erna
tiona
l Ltd
Ord
inar
y -
-
10
0.0
-
25Tr
adin
gCim
Glo
bal B
usin
ess
Hol
ding
Ltd
(no
te (
iv))
Ord
inar
y 6
3,00
0 1
00.0
-
-
6
3,00
0 In
vest
men
t ho
ldin
gCim
Glo
bal R
eins
uran
ce C
ompa
ny L
td
Ord
inar
y 7
9,55
1 10
0.0
-
-
76,8
62Re
insu
ranc
eCim
Cap
tive
Rein
sura
nce
Com
pany
PCC
Ord
inar
y 1
2,92
9 10
0.0
-
-
11,3
85Re
insu
ranc
eCim
Adm
inis
trat
ors
Ltd
Ord
inar
y 2
5 10
0.0
-
-
25
Sec
reta
rial
ser
vice
sCyb
erna
ptic
s Lt
d (n
ote
(ii)
)O
rdin
ary
7,7
50
100.
0 -
-
1,
000
Sal
es o
f go
ods
and
serv
ices
rel
ated
to
ICT
activ
ities
Fin
ance
Cim
Fin
ance
Ltd
Ord
inar
y 1
81,8
38
100.
0 -
-
28
5,00
0Cre
dit
card
bus
ines
s, fac
toring
, co
nsum
er c
redi
t, le
asin
g &
dep
osit
taki
ngCim
Fin
ance
(Sey
chel
les)
Ltd
O
rdin
ary
-
-
100.
0 -
-
D
orm
ant
Cim
For
ex L
tdO
rdin
ary
20,
000
100.
0 -
-
27
,000
Fore
x de
aler
Cim
Age
ncie
s Lt
dO
rdin
ary
500
10
0.0
-
-
100
Insu
ranc
e ag
ent
90 2015 - CIM ANNUAL REPORT
CIM
FIN
AN
CIA
L SE
RVIC
ES L
TD

14
. IN
VES
TMEN
T IN
SU
BS
IDIA
RY
CO
MP
AN
IES
(C
ON
T’D
)
Cim
Fin
anci
al S
ervi
ces
Ltd
Cla
ss o
f sh
ares
h
eld
Nom
inal
va
lue
of
inve
stm
ent
% H
old
ing
Oth
er G
rou
p
Com
pan
ies
% H
old
ing
Pro
por
tion
of
ow
ner
ship
in
tere
sts
hel
d b
y n
on c
ontr
ollin
g
inte
rest
%
Hol
din
g
(eff
ecti
ve)
Issu
ed
Cap
ital
Pri
nci
pal
act
ivit
yRs
000
Rs
000
Pro
per
tyCim
Pro
pert
y D
evel
opm
ent
Ltd
Ord
inar
y 5
19,4
66
100.
0 -
-
51
9,46
6Pr
oper
tyCim
Pro
pert
y H
oldi
ngs
Ltd
Ord
inar
y -
-
10
0.0
-
450,
000
Prop
erty
Sou
th W
est
Saf
ari G
roup
Ltd
(no
te(v
))O
rdin
ary
3,5
01
1.3
52.3
63.
7 26
8,03
2Pr
oper
tyCSBO
2 L
td (
note
(v))
Ord
inar
y 5
35
1.2
52.3
63.
8 43
,790
Prop
erty
Le M
orne
Dev
elop
men
t Cor
p Lt
dO
rdin
ary
89,
012
31.0
49.0
40.
0 25
Prop
erty
San
Pao
lo L
tdO
rdin
ary
83,
258
59.2
-
40.
8 5,
022
Prop
erty
SW
TD B
is L
tdO
rdin
ary
109
,073
66
.8 -
3
3.2
163,
350
Prop
erty
Oth
ers
Cim
Lea
rnin
g Cen
tre
Ltd
Ord
inar
y 1
,000
10
0.0
-
-
1,00
0Le
arni
ng a
nd d
evel
opm
ent
Cim
Man
agem
ent
Ser
vice
s Lt
dO
rdin
ary
100
10
0.0
-
-
100
Man
agem
ent
serv
ices
Cim
Sha
red
Ser
vice
s Lt
d (n
ote
(i))
Ord
inar
y 1
10
0.0
-
-
1
Sup
port
act
iviti
es
Not
e (i
) -
Thes
e co
mpa
nies
wer
e in
corp
orat
ed d
urin
g th
e ye
ar.
Not
e (i
i) -
Thi
s co
mpa
ny w
as a
cqui
red
during
the
yea
r.
Not
e (i
ii) -
Cim
Cor
pora
te S
ervi
ces
Ltd
disp
osed
of
its in
vest
men
t in
Cim
Glo
bal B
usin
ess
Sin
gapo
re P
te L
td t
o Cim
Glo
bal B
usin
ess
Hol
ding
Ltd
dur
ing
the
year
.
Not
e (i
v) -
The
Com
pany
issu
ed 1
,802
,400
sha
res
for
a co
nsid
erat
ion
of R
s 63
m d
urin
g th
e ye
ar.
Not
e (v
) -
Alth
ough
the
Gro
up d
oes
not
own
mor
e th
an o
ne h
alf
of t
he v
otin
g po
wer
of
Sou
th W
est
Saf
ari G
roup
Ltd
and
CSBO
2 L
td,
the
latt
er h
ave
been
con
solid
ated
as
subs
idia
ry s
ince
the
Com
pany
con
trol
is e
stab
lishe
d th
roug
h bo
ard
repr
esen
tatio
n.
2015 - CIM ANNUAL REPORT 91C
IM F
INA
NC
IAL
SERV
ICES
LTD
EXPL
AN
ATO
RY N
OTE
S3
0 S
EPTE
MBE
R 2
015

EXPLANATORY NOTES30 SEPTEMBER 2015
14. INVESTMENT IN SUBSIDIARY COMPANIES (CONT’D)(c) The above subsidiaries are incorporated and operate in Mauritius except for:
Country of incorporation
Cim Global Business Singapore Pte Ltd Republic of SingaporeCim Finance (Seychelles) Ltd Republic of Seychelles
(d) Subsidiaries with non controlling interests
Details for subsidiaries that have non controlling interests:
Name Loss allocated to non controlling
interests during the year
Accumulated non controlling interests
at 30 SeptemberRs m Rs m
2015• South West Safari Group Ltd (6.2) 247.8 • CSBO 2 Ltd (0.1) 31.0 • Le Morne Development Corp Ltd (0.9) 111.9 • San Paolo Ltd - 0.3
2014• Cim Captive Reinsurance Company PCC (0.3) - • South West Safari Group Ltd (4.4) 254.1 • CSBO 2 Ltd (0.1) 31.1 • Le Morne Development Corp. Ltd (1.0) 112.7 • San Paolo Ltd - 0.3
92 2015 - CIM ANNUAL REPORT
CIM FINANCIAL SERVICES LTD

EXPL
AN
ATO
RY N
OTE
S3
0 S
EPTE
MBE
R 2
015
14
.IN
VES
TMEN
T IN
SU
BS
IDIA
RY
CO
MP
AN
IES
(C
ON
T’D
)(e
)S
um
mar
ised
fin
anci
al in
form
atio
n o
n s
ub
sid
iari
es w
ith
non
con
trol
ling
inte
rest
s
(i)
Sum
mar
ised
Sta
tem
ents
of Fi
nanc
ial P
ositi
on,
Sta
tem
ents
of
Prof
it or
Los
s an
d Sta
tem
ents
of
Prof
it or
Los
s an
d O
ther
Com
preh
ensi
ve I
ncom
e
Nam
e C
urr
ent
asse
tsN
on c
urr
ent
asse
tsC
urr
ent
liab
iliti
esN
on c
urr
ent
liab
iliti
esR
even
ue
Loss
Oth
er
com
pre
hen
sive
in
com
e
Tota
l co
mp
reh
ensi
ve
inco
me
Rs
mRs
mRs
mRs
mRs
mRs
mRs
mRs
m
20
15
• Sou
th W
est
Saf
ari G
roup
Ltd
8
.8
421
.7
21.
6 2
0.2
1.7
(
9.8)
-
(9.
8)•
CSBO
2 L
td
-
50.
4 1
.8
-
-
(0.
1) -
(
0.1)
• Le
Mor
ne D
evel
opm
ent
Cor
p Lt
d 1
2.5
299
.1
1.5
3
0.3
1.2
(
2.1)
-
(2.
1)•
San
Pao
lo L
td -
0
.7
-
-
-
-
-
-
• SW
TD B
is L
td 0
.1
-
0.1
-
-
(
0.1)
-
(0.
1)•
Cim
Fid
ucia
ry A
dmin
istr
atio
n Ser
vice
s Lt
d -
-
-
-
3
.6
-
-
-
20
14
• Cim
Glo
bal R
eins
uran
ce
Com
pany
Ltd
-
-
-
-
3.
2 (
0.6)
1.7
1.1
• Cim
Cap
tive
Rein
sura
nce
Com
pany
PCC
-
-
-
-
0.8
(2.
7)0.
2 (
2.5)
• Sou
th W
est
Saf
ari G
roup
Ltd
5.
241
7.1
23.5
-
0.2
(6.
9)14
1.3
134
.4
• CSBO
2 L
td
-
50.4
1.7
-
-
(0.
2)5.
2 5
.0
• Le
Mor
ne D
evel
opm
ent
Cor
p Lt
d13
.429
9.1
2.2
28.3
-
(2.
4) -
(
2.4)
• San
Pao
lo L
td0.
10.
60.
1 -
-
(
0.1)
-
(0.
1)•
SW
TD B
is L
td0.
1 -
0.
1 -
-
-
-
-
Dur
ing
the
year
end
ed 3
0 Sep
tem
ber
2014
, th
e G
roup
bou
ght
addi
tiona
l sha
res
in C
im G
loba
l Rei
nsur
ance
Com
pany
Ltd
and
Cim
Cap
tive
Rein
sura
nce
Com
pany
PC
C s
o th
at it
ow
ned
100%
of th
e sh
areh
oldi
ng a
s at
30
Sep
tem
ber
2014
.
2015 - CIM ANNUAL REPORT 93C
IM F
INA
NC
IAL
SERV
ICES
LTD

EXPLANATORY NOTES30 SEPTEMBER 2015
14. INVESTMENT IN SUBSIDIARY COMPANIES (CONT’D)(e) Summarised financial information on subsidiaries with non controlling interests (cont’d)
(ii) Summarised cash flow information:
Name Operating activities
Investing activities
Financing activities
Net (decrease)/increase in
cash and cash equivalents
Rs m Rs m Rs m Rs m
2015South West Safari Group Ltd (13.3) (5.6) 18.0 (0.9)CSBO 2 Ltd - - - - Le Morne Development Corp Ltd (2.8) - 2.0 (0.8)
2014Cim Global Reinsurance Company Ltd (2.1) 57.8 - 55.7 Cim Captive Reinsurance Company PCC 1.4 - - 1.4 South West Safari Group Ltd (14.0) (7.9) 22.3 0.4 CSBO 2 Ltd 1.4 (1.4) - - Le Morne Development Corp. Ltd (10.2) - 11.1 0.9
The summarised financial information above is the amount before intra-group eliminations.
15. INVESTMENT IN ASSOCIATES
Sep-15 Sep-14
GROUP Rs m Rs m
(a) At 1 October 26.5 23.4 Additions 63.1 - Share of results 4.0 3.1 Reserve movements (0.3) - Dividends (1.3) - At 30 September 92.0 26.5
Made up as follows:Net assets 38.6 26.5
Goodwill 53.4 -
92.0 26.5
94 2015 - CIM ANNUAL REPORT
CIM FINANCIAL SERVICES LTD

EXPL
AN
ATO
RY N
OTE
S3
0 S
EPTE
MBE
R 2
015
15
.IN
VES
TMEN
T IN
AS
SO
CIA
TES
(C
ON
T’D
)(b
)D
etai
ls o
f th
e as
soci
ates
at
the
end
of t
he r
epor
ting
year
are
as
follo
ws:
Nam
eR
epor
tin
g
per
iod
Pri
nci
pal
act
ivit
yP
rin
cip
al p
lace
of
bu
sin
ess
Cou
ntr
y of
in
corp
orat
ion
% H
old
ing
Unq
uote
dD
irec
tIn
dir
ect
20
15
Li &
Fun
g (M
auritiu
s) L
td31
Dec
embe
r Buy
ing
agen
tM
auritiu
sM
auritiu
s40
.00
-
Dod
wel
l (M
auritiu
s) L
td31
Dec
embe
r Buy
ing
agen
tM
auritiu
sH
ong
Kong
40.0
0 -
iVer
y Pa
ymen
t Te
chno
logi
es P
ropr
ieta
ry L
td (
iii)
31 D
ecem
ber
Paym
ent
solu
tions
pro
vide
rSou
th A
fric
aSou
th A
fric
a -
49
.00
Touc
hpoi
nt P
aym
ent
Prop
riet
ary
Lim
ited
(iii)
31 D
ecem
ber
Paym
ent
solu
tions
pro
vide
rSou
th A
fric
aSou
th A
fric
a -
41
.65
Evripa
y (i
ii)31
Dec
embe
r Pa
ymen
t se
rvic
e pr
ovid
erSou
th A
fric
aM
auritiu
s -
61
.75
EvriPa
y ZA (
Prop
riet
ary)
Ltd
(iv
)31
Dec
embe
r Pa
ymen
t se
rvic
e pr
ovid
erSou
th A
fric
aSou
th A
fric
a -
61
.75
EvriPa
y KE
Lim
ited
(iv)
31 D
ecem
ber
Paym
ent
serv
ice
prov
ider
Sou
th A
fric
aSou
th A
fric
a -
61
.75
20
14
Li &
Fun
g (M
auritiu
s) L
td31
Dec
embe
r Buy
ing
agen
tM
auritiu
sM
auritiu
s40
.00
-
Dod
wel
l (M
auritiu
s) L
td31
Dec
embe
r Buy
ing
agen
tM
auritiu
sH
ong
Kong
40.0
0 -
(i)
All
of t
he a
bove
ass
ocia
tes
are
acco
unte
d fo
r us
ing
the
equi
ty m
etho
d.
(ii)
Man
agem
ent
acco
unts
hav
e be
en p
repa
red
at 3
0 Sep
tem
ber
2015
for
the
pur
pose
of
appl
ying
the
equ
ity m
etho
d.
(iii)
iVer
y Pa
ymen
t Te
chno
logi
es P
ropr
ieta
ry L
td h
olds
75%
of
the
equi
ty s
hare
s of
Evr
ipay
and
85%
of
the
equi
ty s
hare
s of
Tou
chpo
int
Paym
ent
Prop
riet
ary
Lim
ited.
(iv)
Evripa
y ho
lds
100%
of th
e eq
uity
sha
res
of E
vriP
ay Z
A (
Prop
riet
ary)
Ltd
and
Evr
iPay
KE
Lim
ited.
2015 - CIM ANNUAL REPORT 95C
IM F
INA
NC
IAL
SERV
ICES
LTD

15
.IN
VES
TMEN
T IN
AS
SO
CIA
TES
(C
ON
T’D
)
(c)
Sum
mar
ised
fin
anci
al in
form
atio
n in
res
pect
of th
e G
roup
’s a
ssoc
iate
d co
mpa
nies
is s
et o
ut b
elow
:
Nam
e C
urr
ent
asse
tsN
on c
urr
ent
asse
tsC
urr
ent
liab
iliti
esN
on c
urr
ent
liab
iliti
esR
even
ue
Pro
fit
for
the
year
Oth
er
com
pre
hen
sive
in
com
e fo
r th
e ye
ar
Tota
l co
mp
reh
ensi
ve
inco
me
for
the
year
Div
iden
d
rece
ived
d
uri
ng
th
e ye
arRs
mRs
mRs
mRs
mRs
mRs
mRs
mRs
mRs
m
2015
Li &
Fun
g (M
aurit
ius)
Ltd
- G
roup
**
73.
2 -
2
.2
-
6.4
2
.3
2.3
8
.6
-
iVer
y Pa
ymen
t Tec
hnol
ogie
s Pr
oprie
tary
Ltd
(iii
) 3
4.1
5.7
1
1.0
-
14.
1 4
.4
(3.
7) -
1
.3
Touc
hpoi
nt P
aym
ent P
ropr
ieta
ry
Lim
ited
(iii)
6.4
0
.8
1.2
-
2
.6
-
(0.
7) (
0.7)
-
Evrip
ay (
iii)
0.8
-
0
.1
-
1.9
1
.9
-
1.9
-
Ev
riPay
ZA
(Pro
prie
tary
) Lt
d (iv
) 0
.5
0.1
1
1.4
0.3
0
.1
(0.
4) 1
.4
1.0
-
Ev
riPay
KE
Lim
ited
(iv)*
** -
-
-
-
-
-
-
-
-
2014
Li &
Fun
g (M
aurit
ius)
Ltd
- G
roup
**
67.
2 0
.1
0.9
-
8
.8
7.8
-
7
.8
-
** F
igur
es in
clud
e Li
& F
ung
Ltd
and
Dod
wel
l Ltd
***
Com
pany
is d
orm
ant
96 2015 - CIM ANNUAL REPORT
CIM
FIN
AN
CIA
L SE
RVIC
ES L
TD
EXPL
AN
ATO
RY N
OTE
S3
0 S
EPTE
MBE
R 2
015

EXPL
AN
ATO
RY N
OTE
S3
0 S
EPTE
MBE
R 2
015
15
.IN
VES
TMEN
T IN
AS
SO
CIA
TES
(C
ON
T’D
)
(d)
Reco
ncili
atio
n of
sum
mar
ised
fin
anci
al in
form
atio
n
Reco
ncili
atio
n of
the
abo
ve s
umm
aris
ed fin
anci
al in
form
atio
n to
the
car
ryin
g am
ount
rec
ogni
sed
in t
he f
inan
cial
sta
tem
ents
:
Nam
e O
pen
ing
n
et a
sset
s 1
Oct
ober
Ad
dit
ion
sP
rofi
t fo
r th
e ye
ar
Oth
er
com
pre
hen
sive
in
com
e fo
r th
e ye
arD
ivid
end
Clo
sin
g n
et
asse
ts 3
0
Sep
tem
ber
Ow
ner
ship
in
tere
stIn
tere
st in
as
soci
ates
Goo
dw
illC
arry
ing
va
lue
Rs
mRs
mRs
mRs
mRs
mRs
m%
Rs
mRs
mRs
m2
01
5Li
& F
ung
(Mau
ritiu
s) L
td -
Gro
up 6
6.4
-
2.3
2
.3
-
71.
0 40
.00
28.
4 -
2
8.4
iVer
y Pa
ymen
t Te
chno
logi
es
Prop
riet
ary
Ltd
(iii)
-
30.
8 4
.4
(3.
7) (
2.7)
28.
8 49
.00
14.
2 4
7.4
61.
6
Touc
hpoi
nt P
aym
ent
Prop
riet
ary
Lim
ited
(iii)
-
6.7
-
(
0.7)
-
6.0
41
.65
2.5
(
2.3)
0.2
Evripa
y (i
ii) -
(
1.2)
1.9
-
-
0
.7
61.7
5 0
.4
0.8
1
.2
EvriPa
y ZA (
Prop
riet
ary)
Ltd
(iv
) -
(
12.1
) (
0.4)
1.4
-
(
11.1
)61
.75
(6.
9) 7
.5
0.6
Ev
riPa
y KE
Lim
ited
(iv)
-
-
-
-
-
-
61.7
5 -
-
-
6
6.4
2
4.2
8
.2
(0
.7)
(2
.7)
95
.4
38
.6
53
.4
92
.0
20
14
Li &
Fun
g (M
auritiu
s) L
td -
Gro
up 5
8.6
-
7.8
-
-
6
6.4
40.0
26.
5 -
2
6.5
Sep
-15
Sep
-14
CO
MP
AN
YRs
mRs
mAt
1 O
ctob
er/3
0 Sep
tem
ber
16.
2 1
6.2
2015 - CIM ANNUAL REPORT 97C
IM F
INA
NC
IAL
SERV
ICES
LTD

EXPLANATORY NOTES30 SEPTEMBER 2015
16. INVESTMENT IN JOINT VENTURE
Sep-15 Sep-14
GROUP Rs m Rs m
At 1 October 91.7 69.7 Share of result- attributable to gain on revaluation of investment properties - 18.8 - net operating profit 3.5 3.2 At 30 September 95.2 91.7
Made up as follows:Net assets 95.2 91.7
(a) Name Reporting period
Percentage holding
Principal activity
Principal place of business
Country of incorporation
Unquoted2015 & 2014
Edith Cavell Properties Ltd 30 September 50.0% Property Mauritius Mauritius
Edith Cavell Properties Ltd is a private company and there is no quoted market price available for its shares.
The above joint venture is accounted for using the equity method.
(b) Summarised financial information in respect of the joint venture is set out below:
Name Current assets
Non current assets
Current liabilities Revenue
Profit for the year
Total com-prehensive income for the year
Dividend received
during the year
Rs m Rs m Rs m Rs m Rs m Rs m Rs m
2015Edith Cavell Properties Ltd 15.0 176.3 0.8 10.0 7.0 7.0 -
2014
Edith Cavell Properties Ltd 8.8 176.5 1.8 9.9 44.1 44.1 -
In 2014, profit for the year included fair value gain on investment properties amounting to Rs 37.6m net of deferred income tax.
98 2015 - CIM ANNUAL REPORT
CIM FINANCIAL SERVICES LTD

EXPLANATORY NOTES30 SEPTEMBER 2015
16. INVESTMENT IN JOINT VENTURE (CONT’D)The above amounts of assets and liabilities include the following:
- Cash and cash equivalent: Rs 7.3m (2014: Rs 2.7m).
- Current financial liabilities (excluding trade and other payables and provision) - Rs 0.3m (2014: Rs 1.2m).
The above profit for the year includes the following:
- Interest income: Rs 0.2m (2014: Rs 0.1m).
- Income tax expense: Rs 1.3m (2014: Rs 1.1m).
(c) Reconciliation of summarised financial information
Reconciliation of the above summarised financial information to the carrying amount recognised in the financial statements:
Name Opening net
assets 1 October
Profit for the year Dividend
Closing net assets
30 SeptemberOwnership
interestInterest in
joint venture
Rs m Rs m Rs m Rs m % Rs m
2015
Edith Cavell Properties Ltd 183.5 7.0 - 190.5 50.0 95.2
2014Edith Cavell Properties Ltd 139.4 44.1 - 183.5 50.0 91.7
(d) Classification of Edith Cavell Properties Ltd as a joint venture
Edith Cavell Properties Ltd is a limited liability company whose legal form confers separation between the parties to the joint arrangement and the Company itself.
Furthermore, there is no contractual arrangement or any other facts and circumstances that indicate that the parties to the joint arrangement have rights to the assets and obligations for the liabilities of the joint arrangement. Accordingly, Edith Cavell Properties Ltd is classified as a joint venture.
(e) There are no commitments or contingent liabilities relating to the Group’s interest in the joint venture.
2015 - CIM ANNUAL REPORT 99CIM FINANCIAL SERVICES LTD

EXPLANATORY NOTES30 SEPTEMBER 2015
17. INVESTMENT IN FINANCIAL ASSETS
Sep-15 Sep-14
Level 1 Level 3 Total Total
GROUP Rs m Rs m Rs m Rs m
(i) Non currentAvailable-for-sale investmentsAt 1 October 0.5 309.7 310.2 10.2 Additions - - - 300.0 Disposals - (71.2) (71.2) - Impairment charge - (6.3) (6.3) - Consolidation adjustment (0.5) - (0.5) - At 30 September - 232.2 232.2 310.2
Sep-15 Sep-14
Rs m Rs m
Held-to-maturity investmentsAt 1 October 8.0 - Additions - 8.0 At 30 September 8.0 8.0 Deposit with banksAt 1 October 435.0 435.0 Transfer (290.0) - At 30 September 145.0 435.0
385.2 753.2 (ii) Current
Deposit with banksTransfer 290.0 - At 30 September 290.0 -
290.0 -
Sep-15 Sep-14
Level 3 Total Total
COMPANY Rs m Rs m Rs m
Non currentAvailable-for-sale investmentsUnquotedAt 1 October 309.7 309.7 9.7 Additions - - 300.0 Disposal (71.2) (71.2) - Impairment charge (6.3) (6.3) - At 30 September 232.2 232.2 309.7
100 2015 - CIM ANNUAL REPORT
CIM FINANCIAL SERVICES LTD

EXPLANATORY NOTES30 SEPTEMBER 2015
18. NON CURRENT RECEIVABLES
GROUP COMPANY
Sep-15 Sep-14 Sep-15 Sep-14
Rs m Rs m Rs m Rs m
(a) Receivable fromSubsidiary companies - - 755.4 540.0 Others 121.5 81.8 - -
121.5 81.8 755.4 540.0
(b) Repayable by instalmentsAfter one year and before two years 57.6 37.7 271.4 150.0 After two years and before five years 62.8 43.9 484.0 390.0 After five years 1.1 0.2 - -
121.5 81.8 755.4 540.0
The carrying amount of non current receivables approximate their fair values and are unsecured.
19. NET INVESTMENT IN LEASES AND OTHER CREDIT AGREEMENTS
GROUP
Finance leases
Other credit agreements Total
Rs m Rs m Rs m
Sep-15Gross investment Within one year 741.5 2,085.9 2,827.4 After one year and before five years 1,500.3 882.5 2,382.8 After five years 43.3 - 43.3
2,285.1 2,968.4 5,253.5 Unearned future finance income (309.6) (316.1) (625.7)
1,975.5 2,652.3 4,627.8 Less provision for credit impairmentPortfolio provision (24.1) (32.4) (56.5)Specific provision (26.7) (128.9) (155.6)
1,924.7 2,491.0 4,415.7
Analysed as follows:Non current assets 1,341.8 788.8 2,130.6 Current assets 582.9 1,702.2 2,285.1
1,924.7 2,491.0 4,415.7
Remaining term to maturityWithin one year 609.6 1,831.1 2,440.7 After one year and before five years 1,325.3 821.2 2,146.5 After five years 40.6 - 40.6
1,975.5 2,652.3 4,627.8
Provision for credit impairmentPortfolio provisionAt 1 October 18.3 23.2 41.5 Provision for credit impairment 5.8 9.2 15.0 At 30 September 24.1 32.4 56.5
Specific ProvisionAt 1 October 34.7 93.4 128.1 Provision for credit impairment 3.9 72.6 76.5 Amounts written off (11.9) (37.1) (49.0)At 30 September 26.7 128.9 155.6
2015 - CIM ANNUAL REPORT 101CIM FINANCIAL SERVICES LTD

EXPLANATORY NOTES30 SEPTEMBER 2015
19. NET INVESTMENT IN LEASES AND OTHER CREDIT AGREEMENTS (CONT’D)
GROUPFinance leases
Other credit agreements Total
Rs m Rs m Rs m
Sep-14Gross investment Within one year 714.6 1,785.9 2,500.5 After one year and before five years 1,443.9 695.3 2,139.2 After five years 56.2 - 56.2
2,214.7 2,481.2 4,695.9 Unearned future finance income (307.1) (312.7) (619.8)
1,907.6 2,168.5 4,076.1 Less provision for credit impairmentPortfolio provision (18.3) (23.2) (41.5)Specific provision (34.7) (93.4) (128.1)
1,854.6 2,051.9 3,906.5
Analysed as follows:Non current assets 1,303.6 609.4 1,913.0 Current assets 551.0 1,442.5 1,993.5
1,854.6 2,051.9 3,906.5
Remaining term to maturityWithin one year 585.8 1,535.8 2,121.6 After one year and before five years 1,268.6 632.7 1,901.3 After five years 53.2 - 53.2
1,907.6 2,168.5 4,076.1
Provision for credit impairmentPortfolio provisionAt 1 October 21.3 29.7 51.0 Provision for credit impairment (3.0) (6.5) (9.5)At 30 September 18.3 23.2 41.5
Specific ProvisionAt 1 October 34.3 66.2 100.5 Provision for credit impairment 0.4 27.2 27.6 At 30 September 34.7 93.4 128.1
102 2015 - CIM ANNUAL REPORT
CIM FINANCIAL SERVICES LTD
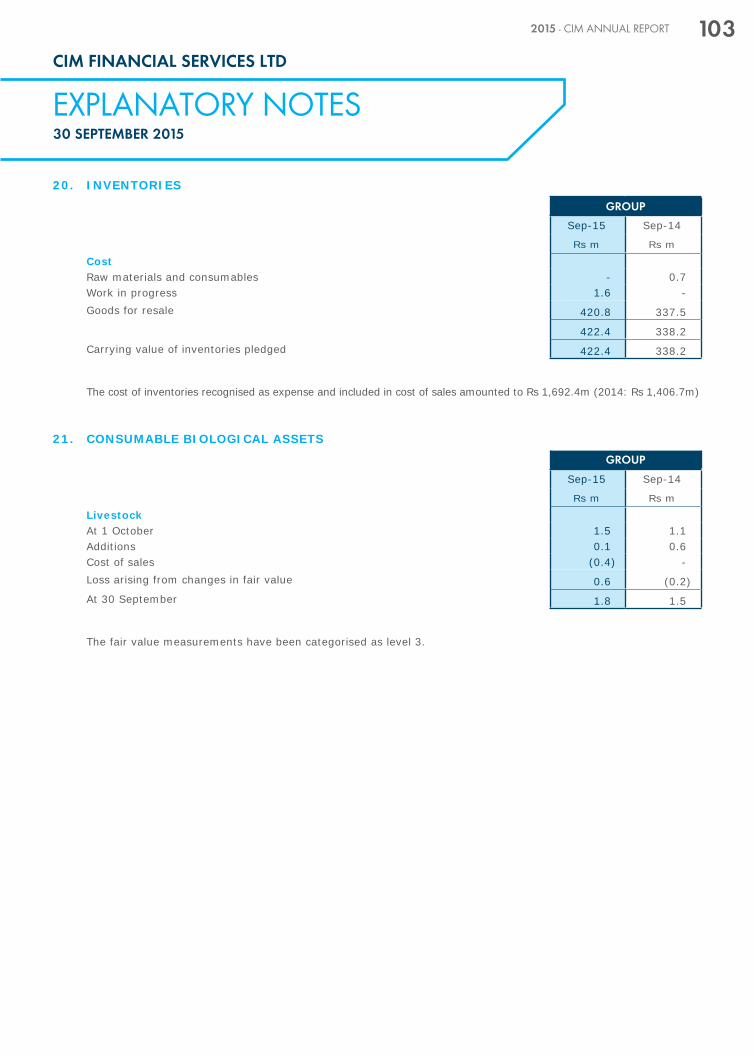
EXPLANATORY NOTES30 SEPTEMBER 2015
20. INVENTORIES
GROUP
Sep-15 Sep-14
Rs m Rs m
CostRaw materials and consumables - 0.7 Work in progress 1.6 - Goods for resale 420.8 337.5
422.4 338.2 Carrying value of inventories pledged 422.4 338.2
The cost of inventories recognised as expense and included in cost of sales amounted to Rs 1,692.4m (2014: Rs 1,406.7m)
21. CONSUMABLE BIOLOGICAL ASSETS
GROUP
Sep-15 Sep-14
Rs m Rs m
LivestockAt 1 October 1.5 1.1 Additions 0.1 0.6 Cost of sales (0.4) - Loss arising from changes in fair value 0.6 (0.2)At 30 September 1.8 1.5
The fair value measurements have been categorised as level 3.
2015 - CIM ANNUAL REPORT 103CIM FINANCIAL SERVICES LTD

22. TRADE AND OTHER RECEIVABLES
GROUP COMPANY
Sep-15 Sep-14 Sep-15 Sep-14
Rs m Rs m Rs m Rs m
Trade receivables 990.4 1,017.5 - - Less impairment (105.2) (130.3) - -
885.2 887.2 - - Prepayments 50.3 35.0 10.0 6.0 Forward foreign exchange contracts 0.1 - - - Other receivables 366.6 243.2 - -
1,302.2 1,165.4 10.0 6.0
Receivable from subsidiary companies - - 22.9 20.9 Receivable from related company 0.5 0.4 - - Loan at call- Subsidiary companies - - 303.1 236.3 Short term loans to subsidiary companies - - 598.3 447.5
0.5 0.4 924.3 704.7
1,302.7 1,165.8 934.3 710.7
The carrying amount of the receivables is considered as a reasonable approximation of fair value.
GROUP
Sep-15 Sep-14
Rs m Rs m
Ageing of trade receivablesLess than 3 months 728.0 761.8 Impairment - -
728.0 761.8
More than 3 months 101.9 85.1 Impairment - -
101.9 85.1
More than 6 months 160.5 170.6 Impairment (105.2) (130.3)
55.3 40.3
885.2 887.2 Impairment of trade receivablesAt 1 October 130.3 146.5 Release made during the year (25.1) (16.2)At 30 September 105.2 130.3
Past due but not impaired 34.2 30.0
104 2015 - CIM ANNUAL REPORT
CIM FINANCIAL SERVICES LTD
EXPLANATORY NOTES30 SEPTEMBER 2015

EXPLANATORY NOTES30 SEPTEMBER 2015
23. CASH AND CASH EQUIVALENTS
GROUP COMPANY
Sep-15 Sep-14 Sep-15 Sep-14
Rs m Rs m Rs m Rs m
Loans at call receivable - - 303.1 236.3 Bank balances and cash 953.9 608.6 24.6 2.8 Loans at call payable - - (54.7) (89.1)Bank overdrafts (335.4) (234.0) - -
618.5 374.6 273.0 150.0
The bank overdrafts are secured by floating charges on the assets of the borrowing companies.
The rate of interest varies between 6.25% and 8.50% (2014: 6.75% and 8.50%).
24. STATED CAPITAL
2015 & 2014
No of sharesOrdinary shares
Million Rs m
At 30 September 2014 & 2015 680.5 680.5
The stated number of ordinary shares is 680,522,310 at no par value. All shares are fully paid and carry voting rights.
25. BORROWINGS
GROUP COMPANY
Sep-15 Sep-14 Sep-15 Sep-14
Rs m Rs m Rs m Rs m
(a) Non current
Bank and other borrowings - Secured 360.0 56.7 360.0 56.7 Bank and other borrowings - Unsecured 226.8 261.2 - - Cash flow hedge (note (d)) - 31.8 - 31.8 Other loans 28.2 81.6 28.2 81.6 Medium Term Note (note (e)) 750.0 750.0 750.0 750.0 Deposits 1,093.8 931.4 - - Finance lease obligations 31.9 0.8 - -
2,490.7 2,113.5 1,138.2 920.1
CurrentBank overdrafts 335.4 234.0 - - Bank and other borrowings - Secured 726.6 842.2 146.7 56.6 Bank and other borrowings - Unsecured 531.1 787.7 250.0 400.0 Cash flow hedge (note (d)) 36.2 63.5 36.2 63.5 Other loans 53.5 49.9 53.5 49.9 Deposits 1,301.5 1,105.4 - - Finance lease obligations 8.1 0.6 - -
2,992.4 3,083.3 486.4 570.0
Total 5,483.1 5,196.8 1,624.6 1,490.1
2015 - CIM ANNUAL REPORT 105CIM FINANCIAL SERVICES LTD

EXPLANATORY NOTES30 SEPTEMBER 2015
25. BORROWINGS (CONT’D)
GROUP COMPANY
Sep-15 Sep-14 Sep-15 Sep-14
Rs m Rs m Rs m Rs m
(b) Repayable otherwise than by instalments: After one year and before two years Deposits 455.8 454.8 - - Others - 72.0 - - After two years and before three years Deposits 444.0 376.9 - - Others 750.0 69.9 750.0 - After three years and before five years Deposits 194.0 99.7 - - Others - 859.3 - 750.0 After five years - 10.1 - - Repayable by instalments: After one year and before two years 202.6 88.4 118.2 141.9 After two years and before three years 193.9 82.4 90.0 28.2 After three years and before five years 249.7 - 180.0 - After five years 0.7 - - -
2,490.7 2,113.5 1,138.2 920.1
GROUP COMPANY
Sep-15 Sep-14 Sep-15 Sep-14
% % % %
(c) The effective interest rates at the end of the reporting period were as follows:Bank overdrafts 6.25 - 8.50 6.75 - 8.50 6.75 6.75 Bank and other borrowings - Secured 4.40 - 6.70 5.55 - 6.70 5.55 - 6.70 5.55 - 6.70Bank and other borrowings - Unsecured 0.75 - 7.50 0.75 - 5.20 4.50 - 4.90 4.50 - 5.20Cash flow hedge 1.82 - 1.85 1.70 - 1.90 1.82 - 1.85 1.70 - 1.90 Other loans 6.90 - 7.15 7.00 - 7.15 6.90 - 7.15 7.00 - 7.15Deposits 3.25 - 8.15 3.03 - 8.30 - - Finance lease obligations 7.50 - 9.75 7.00 - 8.00 - -
106 2015 - CIM ANNUAL REPORT
CIM FINANCIAL SERVICES LTD

25. BORROWINGS (CONT’D)(d) Cash flow hedge loans
GROUP AND COMPANY
Sep-15 Sep-14
Rs m Rs m
At 1 October 95.3 248.8 Repayment of borrowings (61.2) (154.2)Losses recognised in Other Comprehensive Income 8.3 1.5 Reclassification of adjustments for gains from Other Comprehensive Income to Profit or Loss (6.2) (0.8)At 30 September 36.2 95.3
The above USD cash flow hedged loans are secured. Repayment term is by 6-monthly instalments basis over a period of 5 years. Upon repayment of the instalments amounts, the exchange difference will impact Profit or Loss and will be reclassified from reserves to Profit or Loss.
(e) In June 2013, the Company issued its first tranche notes with a nominal amount of Rs 750m under its Medium Term Note Programme. The notes carry a fixed interest rate of 5.55%, payable semi-annually, and are repayable at maturity on 11 June 2018.
The Medium Term Notes are secured by fixed and floating charges on the assets of the Group.
GROUP COMPANY
Sep-15 Sep-14 Sep-15 Sep-14
Rs m Rs m Rs m Rs m
(f) The carrying amounts of the borrowings are denominated in the following currencies:MUR and others 5,252.1 4,878.8 1,588.4 1,394.8 EURO 140.5 162.7 - - USD 81.4 144.5 36.2 95.3 GBP 9.1 10.8 - -
5,483.1 5,196.8 1,624.6 1,490.1
2015 - CIM ANNUAL REPORT 107CIM FINANCIAL SERVICES LTD
EXPLANATORY NOTES30 SEPTEMBER 2015

25. BORROWINGS (CONT’D)(g) The carrying amounts of borrowings are not materially different from their fair rate. The fair values are based on
cash flows discounted on borrowing rates of 1% to 9% and are within level 2 of the fair value hierarchy.
26. DEFERRED TAXATIONDeferred income tax is calculated on all temporary differences under the liability method at 15% (2014: 15%).
(a) There is a legally enforceable right to offset current tax assets against current tax liabilities and deferred income tax assets and liabilities when the deferred income taxes relate to the same fiscal authority. The following amounts are shown in the Statement of Financial Position:
GROUP COMPANY
Sep-15 Sep-14 Sep-15 Sep-14
Rs m Rs m Rs m Rs m
Deferred tax liabilities 21.5 16.4 0.5 0.5 Deferred tax assets (14.5) (13.2) - -
7.0 3.2 0.5 0.5
GROUP COMPANY
Sep-15 Sep-14 Sep-15 Sep-14
Rs m Rs m Rs m Rs m
(b) The movement on the deferred income tax account is as follows:At 1 October 3.2 (0.7) 0.5 - Charged to Other Comprehensive Income 0.4 0.2 - - Charged to Profit or Loss (note 9) 3.4 3.7 - 0.5 At 30 September 7.0 3.2 0.5 0.5
108 2015 - CIM ANNUAL REPORT
CIM FINANCIAL SERVICES LTD
EXPLANATORY NOTES30 SEPTEMBER 2015

26. DEFERRED TAXATION (CONT’D)(c) The movement on the deferred tax assets and liabilities during the year, without taking into consideration the
offsetting of balances within the same fiscal authority on the same entity, is as follows:
GROUP COMPANYAccelerated
capital allowances
Fair value gains and
others TotalFair value
gainsRs m Rs m Rs m Rs m
Deferred tax liabilities:At 1 October 2013 12.7 - 12.7 - Charged to Other Comprehensive Income - 0.4 0.4 - Charged to Profit or Loss 1.1 2.2 3.3 0.5 At 30 September 2014 13.8 2.6 16.4 0.5 Charged to Profit or Loss 5.1 - 5.1 - At 30 September 2015 18.9 2.6 21.5 0.5
GROUPRetirement
benefit obligation
Impairment and
provisions TotalRs m Rs m Rs m
Deferred tax assets:At 1 October 2013 (9.3) (4.1) (13.4)Credited to Other Comprehensive Income (0.2) - (0.2)(Credited)/charged to Profit or Loss (0.2) 0.6 0.4 At 30 September 2014 (9.7) (3.5) (13.2)Charged to Other Comprehensive Income 0.4 - 0.4 Credited to Profit or Loss (1.7) - (1.7)At 30 September 2015 (11.0) (3.5) (14.5)
2015 - CIM ANNUAL REPORT 109CIM FINANCIAL SERVICES LTD
EXPLANATORY NOTES30 SEPTEMBER 2015

EXPLANATORY NOTES30 SEPTEMBER 2015
27. RETIREMENT BENEFIT OBLIGATIONS GROUP
Sep-15 Sep-14
Rs m Rs m
Amounts recognised in the Statements of Financial Position:Pension benefits (note (a)) (10.1) (9.6)Unfunded pension schemes (note (b)) 45.6 43.5 Other retirement benefits (note (c)) 61.8 46.5
97.3 80.4
Analysed as follows:Non current assets (10.1) (9.6)Non current liabilities 107.4 90.0
97.3 80.4
Amounts charged to Profit or Loss: Pension benefits (note (a)) 0.9 0.5 Unfunded pension schemes (note (b)) 3.2 3.2 Other retirement benefits (note (c)) 14.5 9.7 Total included in employee benefit expense (note 6) 18.6 13.4
Amounts charged to Other Comprehensive Income:Pension benefits (note (a)) (0.7) 0.9 Unfunded pension schemes (note (b)) 5.1 3.6 Other retirement benefits (note (c)) 0.9 (0.9)
5.3 3.6
110 2015 - CIM ANNUAL REPORT
CIM FINANCIAL SERVICES LTD

27. RETIREMENT BENEFIT OBLIGATIONS (CONT’D)(a) Pension benefits
The Group operates a final salary defined benefit pension plan for some employees. The assets are held separately from the Group under the control of the Management Committee of Rogers Money Purchase Retirement Fund (RMPRF). The Group contributes to the pension plan in respect of some employees who have a No Worse Off Guarantee (NWOG) so that their benefits would not be worse than what they would have earned under a previous defined benefit plan.
GROUP
Sep-15 Sep-14
Rs m Rs m
(i) Amounts recognised in the Statements of Financial Position are as follows:Present value of funded obligations 38.3 37.8 Fair value of plan assets (48.4) (47.4)Asset in the Statements of Financial Position (10.1) (9.6)
The reconciliation of the opening balances to the closing balances for the net defined benefit liability is as follows: At 1 October (9.6) (10.2)Charged to Profit or Loss 0.9 0.5 (Credited)/charged to Other Comprehensive Income (0.7) 0.9 Contributions paid (0.7) (0.8)At 30 September (10.1) (9.6)
(ii) Amounts recognised in Profit or Loss and Other Comprehensive Income are as follows: Service cost: Current service cost 1.7 1.3 Net interest on net defined benefit asset (0.8) (0.8) Components of amount recognised in Profit or Loss 0.9 0.5
Return on plan assets above interest cost (0.1) (2.0) Liability experience loss/(gain) 0.6 (3.3) Liability (gain)/loss due to change in financial assumptions (1.2) 6.2 Components of amount recognised in Other Comprehensive Income (0.7) 0.9
Actual return on plan assets 3.8 5.6
2015 - CIM ANNUAL REPORT 111CIM FINANCIAL SERVICES LTD
EXPLANATORY NOTES30 SEPTEMBER 2015

EXPLANATORY NOTES30 SEPTEMBER 2015
27. RETIREMENT BENEFIT OBLIGATIONS (CONT’D)
GROUP
Sep-15 Sep-14
Rs m Rs m
(a) Pension benefits (cont’d)
(iii) Movements in the defined benefit obligations over the year is as follows:At 1 October 37.8 39.7 Current service cost 1.7 1.3 Interest expense 2.9 2.8 Benefits paid on settlement (1.9) (8.9)Other benefits paid (1.6) - Liability experience loss/(gain) 0.6 (3.3)Liability (gain)/loss due to change in financial assumptions (1.2) 6.2 At 30 September 38.3 37.8
(iv) Movements in the fair value of plan assets over the year is as follows:At 1 October 47.4 49.9Interest income 3.7 3.6Employer contribution 0.7 0.8Benefits paid (3.5) (8.9)Return on plan assets excluding interest income 0.1 2.0At 30 September 48.4 47.4
(v) Sensitivity analysis on defined benefit obligation at end of yearIncrease due to 1% decrease in discount rate 25.7 24.9
Decrease due to 1% increase in discount rate 20.2 20.3
112 2015 - CIM ANNUAL REPORT
CIM FINANCIAL SERVICES LTD

27. RETIREMENT BENEFIT OBLIGATIONS (CONT’D)(a) Pension benefits (cont’d)
(v) Sensitivity analysis on defined benefit obligation at end of year (cont’d)The above sensitivity analysis has been carried out by recalculating the present value of obligation at end of period after increasing or decreasing the discount rate while leaving all other assumptions unchanged. The results are particularly sensitive to a change in discount rate due to the nature of the liabilities being the difference between a minimum Defined Benefit liability and the projected Defined Contribution liabilities, the latter being Rs 100.5m as at 30 September 2015. Any similar variation in the other assumptions would have shown smaller variations in the defined benefit obligation.
The sensitivity analysis may not be representative of the actual change in the defined benefit obligation as it is unlikely that the change in assumptions would occur in isolation of one another as some of the assumptions may be correlated.
GROUP
Sep-15 Sep-14
% %
(vi) Allocation of plan assets at end of year:Equity - local quoted 36 33 Equity - overseas quoted 29 25 Debt - local unquoted 27 30 Debt - overseas quoted 1 2 Property - local 2 2 Cash and other 5 8
100 100
(vii) Future cashflows- The funding policy is to pay contributions to an external legal entity at the rate recommended by the entity’s
actuaries.
- Expected employer contributions to post-employment benefit plans for the year ending 30 September 2016 are Rs 0.6m.
- The weighted average duration of the defined benefit obligations ranges between 5 years and 16 years.
2015 - CIM ANNUAL REPORT 113CIM FINANCIAL SERVICES LTD
EXPLANATORY NOTES30 SEPTEMBER 2015

EXPLANATORY NOTES30 SEPTEMBER 2015
27. RETIREMENT BENEFIT OBLIGATIONS (CONT’D)
GROUP
(a) Pension Benefits (cont’d)Sep-15 Sep-14
(viii) Principal actuarial assumptions at end of year:
Discount rate 7.0% 8.0%Future salary increases 5.5% 6.5%Future pension increases 1.0% 2.0%Average retirement age (ARA) 60 60 - 65 Average life expectancy for:- Male at ARA 19.5 years 19.5 years
- Female at ARA 24.2 years 24.2 years
The Plan exposes the Group to normal risks associated with defined benefit pension plans such as investment, interest, longevity and salary risks.
- Investment risk
The plan liability is calculated using a discount rate determined by reference to government bond yields; if the return on plan assets is below this rate, it will create a plan deficit and if it is higher, it will create a plan surplus. Currently the Plan has a relatively balanced investment in equity securities, debt instruments and real estate to leverage the return generated by the plan assets.
- Interest risk
A decrease in the bond interest rate will increase the plan liability; however, this may be partially offset by an increase in the return on the plan’s debt investments and a decrease in inflationary pressures on salary and pension increases.
- Longevity risk
The plan liability is calculated by reference to the best estimate of the mortality of plan participants both during and after their employment. An increase in the life expectancy of the plan participants will increase the plan liability.
- Salary risk
The plan liability is calculated by reference to the future projected salaries of plan participants. As such, an increase in the salary of the plan participants above the assumed rate will increase the plan liability whereas an increase below the assumed rate will decrease the liability.
There has been no plan amendment, curtailment or settlement during the year.
114 2015 - CIM ANNUAL REPORT
CIM FINANCIAL SERVICES LTD

27. RETIREMENT BENEFIT OBLIGATIONS (CONT’D)(b) Unfunded pension schemes
Unfunded pension schemes comprise of pensions paid out of cash flow.
GROUP
Sep-15 Sep-14
Rs m Rs m
(i) Amounts recognised in the Statements of Financial Position are as follows:
Present value of unfunded obligation 45.6 43.5
Liability in the Statements of Financial Position 45.6 43.5
(ii) Amounts recognised in Profit or Loss and Other Comprehensive Income are as follows: Net interest on net defined benefit liability
3.2 3.2
Components of amount recognised in Profit or Loss 3.2 3.2
Liability experience loss 2.9 3.6
Liability loss due to change in financial assumptions 2.2 -
Components of amount recognised in Other Comprehensive Income 5.1 3.6
(iii) Movements in liability recognised in Statements of Financial Position:At 1 October 43.5 43.1 Interest expense 3.2 3.2 Other benefits paid (6.2) (6.4)Liability experience loss 2.9 3.6 Liability loss due to change in financial assumptions 2.2 - At 30 September 45.6 43.5
(iv) Sensitivity Analysis on defined benefit obligation at end of periodIncrease due to 1% decrease in discount rate 2.8 2.6
Decrease due to 1% increase in discount rate 2.5 2.3
The above sensitivity analysis has been carried out by recalculating the present value of obligation at end of period after increasing or decreasing the discount rate while leaving all other assumptions unchanged. Any similar variation in the other assumptions would have shown smaller variations in defined benefit obligation.
The sensitivity analysis may not be representative of the actual change in the defined benefit obligation as it is unlikely that the change in assumptions would occur in isolation of one another as some of the assumptions may be correlated.
2015 - CIM ANNUAL REPORT 115CIM FINANCIAL SERVICES LTD
EXPLANATORY NOTES30 SEPTEMBER 2015

27. RETIREMENT BENEFIT OBLIGATIONS (CONT’D)(b) Unfunded pension schemes (cont’d)
(v) Future cash flows- The funding policy is to pay benefits out of the Group’s cashflow as and when due
- Expected employer contributions to post-employment benefit plans for the year ending 30 September 2016 are Rs 6.5m
- The weighted average duration of the defined benefit obligations is 6 years.
GROUP
Sep-15 Sep-14
(vi) Principal actuarial assumptions at end of year:Discount rate 7.0% 8.0%Future pension increases 2.5% 3.5%Average retirement age (ARA) 60 60 Average life expectancy for:- Male at ARA 19.5 years 19.5 years
- Female at ARA 24.2 years 24.2 years
(c) Other retirement benefits
Other retirement benefits comprise full and residual retirement gratuities.
GROUP
Sep-15 Sep-14
Rs m Rs m
(i) Amounts recognised in the Statements of Financial Position are as follows:Present value of unfunded obligation 61.8 46.5Liability in the Statements of Financial Position 61.8 46.5
116 2015 - CIM ANNUAL REPORT
CIM FINANCIAL SERVICES LTD
EXPLANATORY NOTES30 SEPTEMBER 2015

EXPLANATORY NOTES30 SEPTEMBER 2015
27. RETIREMENT BENEFIT OBLIGATIONS (CONT’D)
GROUP
Sep-15 Sep-14
Rs m Rs m
(c) Other retirement benefits (cont’d)
(ii) Amounts recognised in Profit or Loss and Other Comprehensive Income are as follows:Service cost:Current service cost 6.6 4.6Past service cost 4.2 2.1
10.8 6.7
Net interest on net defined benefit liability 3.7 3.0 Components of amount recognised in Profit or Loss 14.5 9.7 Liability experience loss/(gain) 0.8 (1.3) Liability loss due to change in financial assumptions 0.1 0.4 Components of amount recognised in Other Comprehensive Income 0.9 (0.9)
(iii) Movements in liability recognised in Statements of Financial Position:At 1 October (as restated) 46.5 37.7 Current service cost 6.6 4.6 Past service cost 4.2 2.1 Interest expense 3.7 3.0 Other benefits paid (0.1) - Liability experience gains 0.8 (1.3)Liability loss due to change in financial assumptions 0.1 0.4 At 30 September 61.8 46.5
(iv) Sensitivity Analysis on defined benefit obligation at end of periodIncrease due to 1% decrease in discount rate 21.2 19.1
Decrease due to 1% increase in discount rate 16.7 15.0
The above sensitivity analysis has been carried out by recalculating the present value of obligation at end of period after increasing or decreasing the discount rate while leaving all other assumptions unchanged. Any similar variation in the other assumptions would have shown smaller variations in defined benefit obligation.
The sensitivity analysis may not be representative of the actual change in the defined benefit obligation as it is unlikely that the change in assumptions would occur in isolation of one another as some of the assumptions may be correlated.
In relation to the residual retirement gratuities, the results are particularly sensitive to a change in discount rate due to the nature of liabilities being the difference between the pure retirement gratuities under the Employment Rights Act 2008 and the deductions allowable, being five times the annual pension provided and half the lump sum received by the member at retirement from the pension fund with reference to the Company’s share of contributions. The latter’s amount is Rs 143.8m as at 30 September 2015.
(v) Future cashflows- The funding policy is to pay benefits out of the Group’s cashflow as and when due
- Expected employer contributions to post-employment benefit plans for the year ending 30 September 2016 are Rs 0.4m
- The weighted average duration of the defined benefit obligations ranges between 13 years and 35 years.
2015 - CIM ANNUAL REPORT 117CIM FINANCIAL SERVICES LTD

EXPLANATORY NOTES30 SEPTEMBER 2015
27. RETIREMENT BENEFIT OBLIGATIONS (CONT’D)
GROUP
Sep-15 Sep-14(c) Other retirement benefits (cont’d)
(vi) Principal actuarial assumptions at end of year:Discount rate 7.0% 8.0%Future salary increases 5.0%-5.5% 6.0%-6.5%Future pension increases 1.0% 2.0%Average retirement age (ARA) 60 60 Average life expectancy for:- Male at ARA 19.5 years 19.5 years
- Female at ARA 24.2 years 24.2 years
(d) Contribution to the defined contribution plans amounted to Rs 25.5m (2014: Rs 22.1m).
28. TRADE AND OTHER PAYABLES
GROUP COMPANY
Sep-15 Sep-14 Sep-15 Sep-14
Rs m Rs m Rs m Rs m
Trade payables 650.1 505.1 - - Accruals 194.1 259.7 14.7 14.7 Other payables 728.4 303.6 32.3 24.7
1,572.6 1,068.4 47.0 39.4 Amount payable to- Related companies 9.3 73.6 - - - Subsidiary companies - - 11.9 6.7 - Joint venture 0.2 - - - Loan at call - Subsidiary companies - - 54.7 89.1
9.5 73.6 66.6 95.8
1,582.1 1,142.0 113.6 135.2
The carrying amount of the payables is considered as a reasonable approximation of fair value.
29. DIVIDENDS
COMPANY
2015 2014
Rs m Rs m
Amounts recognised as distributions to equity holders in the year:Final dividends payable of Rs 0.20 per share (2014: Rs 0.16 per share) 136.1 108.9 Interim dividends paid of Rs 0.11 per share (2014: Rs 0.10 per share) 74.9 68.0
211.0 176.9
118 2015 - CIM ANNUAL REPORT
CIM FINANCIAL SERVICES LTD

EXPLANATORY NOTES30 SEPTEMBER 2015
30. EARNINGS PER SHARE
GROUP COMPANY
Sep-15 Sep-14 Sep-15 Sep-14
Rs m Rs m Rs m Rs m
Profit attributable to owners of the parent 574.9 604.3 527.4 316.6Number of shares used in calculation 680,522,310 680,522,310 680,522,310 680,522,310Earnings per share Rs 0.84 0.89 0.77 0.47
31. NOTES TO THE STATEMENTS OF CASH FLOWS
GROUP COMPANY
Sep-15 Sep-14 Sep-15 Sep-14
Rs m Rs m Rs m Rs m
Cash generated from operationsProfit before taxation 678.2 695.2 527.4 317.1 Depreciation 103.5 80.7 - - Amortisation 30.5 29.4 - - Impairment of investment 6.3 - 6.3 - Loss on scrapped equipment - 0.3 - - Loss on disposal of subsidiary - 0.1 - - Impairment charge 66.4 1.9 - - Profit on sale of property, plant and equipment (1.4) (2.4) - - Gain on revaluation of investment properties - (114.2) - (3.1)Profit on disposal of financial assets (2.8) - (2.8) - Investment income (32.2) - (576.2) (337.5)Interest expense 271.5 261.4 84.2 80.7 Interest income (157.2) (168.2) (68.1) (68.8)Exchange losses on borrowings 6.2 0.8 6.2 0.8 Fair value gain on forward foreign exchange contracts (0.1) - - - Share results of associates (4.0) (3.1) - - Share result of joint venture (3.5) (22.0) - - Retirement benefit obligations 11.6 6.2 - -
973.0 766.1 (23.0) (10.8)Changes in working capital (excluding the effects of acquisition and disposal of subsidiaries) Inventories (83.5) (54.8) - - Net investment in finance leases and other credit agreements (600.7) (544.9) - - Consumable biological asset (0.3) (0.4) - - Trade and other receivables (92.7) 132.0 0.2 96.5 Trade and other payables 433.7 (17.3) 12.9 (2.6)Cash generated from/(absorbed in) operations 629.5 280.7 (9.9) 83.1
2015 - CIM ANNUAL REPORT 119CIM FINANCIAL SERVICES LTD

EXPLANATORY NOTES30 SEPTEMBER 2015
32. BUSINESS COMBINATIONAcquisition of subsidiary
On 1 October 2014, the Group acquired 100% of the share capital of Cybernaptics Ltd for Rs 7.8m.
Consideration Rs m
Cash 7.8
Total Consideration 7.8
Recognised amounts of identifiable assets acquired and liabilities assumedCash and cash equivalents 2.9 Plant and equipment 0.7 Inventories 0.7 Trade and other receivables 5.1 Trade and other payables (6.4)Taxation (0.2)Finance lease obligation (0.4)Total identifiable net assets 2.4 Goodwill 5.4
Net cash outflow on acquisition of subsdiaryConsideration paid in cash 7.8 Less: cash and cash equivalent balances acquired (2.9)
4.9
The fair value of the ordinary shares issued as part of the consideration paid for the acquisition of the above company was based on its net asset value.
120 2015 - CIM ANNUAL REPORT
CIM FINANCIAL SERVICES LTD

EXPLANATORY NOTES30 SEPTEMBER 2015
33. COMMITMENTS
GROUP
Sep-15 Sep-14
Rs m Rs m
(a) Operating lease - where the Group is the lessorThe future minimum lease receivable under operating leases are as follows: Within one year 36.3 52.6 After one year and before five years 56.1 89.4 Later than 5 years 3.8 8.3
96.2 150.3
(b) Operating lease - where the Group is the lessee
The Group leases equipments under non-cancellable operating lease agreements and the future aggregate minimum lease payments are as follows:
GROUP
Sep-15 Sep-14
Rs m Rs m
Not later than one year 2.7 4.5 Later than one year and not later than five years - 2.3
2.7 6.8
(c) Derivative financial instruments
GROUP
Sep-15 Sep-14
Rs m Rs m
Forward foreign exchange contractsThe notional principal amounts of the outstanding forward foreign exchange contracts are as follows:Foreign exchange contracts purchased 117.5 -
34. EVENTS AFTER THE REPORTING DATEOn 9 December 2015, the board of Cim Financial Services Ltd approved the disposal of its 100% shareholding in The BrandHouse Ltd to Taylor Smith and Sons Ltd and Bentys Ltd, which are related companies, for a considerationofRs225mbasedonanindependentvaluationcarriedoutbyErnst&Young.Thecarryingvalueofthe investment and the share of net assets of The BrandHouse Ltd in the books of the Company and the Group at 30 September 2015 amounted to Rs 77.3m and Rs 178.0m respectively.
35. CONTINGENT LIABILITIES
GROUP
Sep-15 Sep-14
Rs m Rs m
Pending legal matter and guarantees 269.8 270.0
At 30 September 2015, the Company had contingent liabilities in respect of guarantees from which it is anticipated that no material liabilities would arise. The Company has given corporate guarantees amounting to Rs 269.8m (2014: Rs 220m) on behalf of two subsidiary companies.
2015 - CIM ANNUAL REPORT 121CIM FINANCIAL SERVICES LTD

EXPLANATORY NOTES30 SEPTEMBER 2015
36. RELATED PARTY TRANSACTIONS(a) During the year the Group transacted with related parties.
Transactions which are not dealt with elsewhere in the financial statements are as follows:
GROUP COMPANY
Sep-15 Sep-14 Sep-15 Sep-14
Rs m Rs m Rs m Rs m
Sales of goods & services toCompanies with common shareholders 20.5 18.7 - -
Purchase of goods & services fromSubsidiary companies - - 1.0 - Companies with common shareholders 40.4 47.9 - - Joint venture 8.1 9.8 - -
Dividend income, interest income and other incomeSubsidiary companies - - 613.3 403.9 Associates 1.3 - - - Companies with common shareholders 8.5 11.6 - 2.3
Financial chargesSubsidiary companies - - 3.7 3.5 Joint venture 0.2 - 0.2 - Companies with common shareholders 2.2 - - -
Loans payable toCompanies with common shareholders 30.0 30.0 - - Subsidiary companies - - 54.7 85.1 Joint venture 4.0 - 4.0 4.0
Loans and leases receivable fromCompanies with common shareholders 90.0 97.5 - - Subsidiary companies - - 1,657.8 1,223.8
Amount owed byCompanies with common shareholders 0.5 0.4 - - Subsidiary companies - - 22.9 20.9 Joint venture - - - -
Amount owed toCompanies with common shareholders 9.3 73.6 - - Subsidiary companies - - 11.9 6.7 Joint venture 0.2 - - -
Remuneration of key management personnelShort term employee benefit 123.0 103.5 5.9 4.9
Post employment benefits 6.1 5.5 - -
(b) The above transactions have been made on commercial terms and in the normal course of business.
(c) Outstanding balances at the year end are unsecured with interest varying from 0.75% to 9.75% (2014: 0.75% to 8.5%) and settlement occurs in cash and/or through current account. The Group has not recorded any impairment of receivable relating to amounts owed by the related parties (2014: nil).
122 2015 - CIM ANNUAL REPORT
CIM FINANCIAL SERVICES LTD

EXPLANATORY NOTES30 SEPTEMBER 2015
37. BUSINESS SEGMENTSGlobal
Business Finance Property InvestmentsGroup
elimination TotalRs m Rs m Rs m Rs m Rs m Rs m
Year ended 30 September 2015
Revenue 731.7 1,200.6 114.5 2,916.1 (859.1) 4,103.8
Segment profit from operations 274.0 550.3 55.0 62.9 - 942.2
Finance costs (0.5) (234.6) (16.3) (20.1) - (271.5)
Share of results of associates - - - 4.0 - 4.0
Share of result of joint venture
- attributable to gain on revaluation of investment properties - - - - - -
- net operating profit - - 3.5 - - 3.5
- - 3.5 - - 3.5
Profit before taxation 273.5 315.7 42.2 46.8 - 678.2
Taxation (42.0) (49.7) (7.0) (11.8) - (110.5)
Profit for the year 231.5 266.0 35.2 35.0 - 567.7
Assets 497.0 6,949.5 1,809.7 3,673.4 (2,167.3) 10,762.3
Liabilities 424.7 6,179.0 257.7 2,659.6 (2,167.3) 7,353.7
Capital expenditure 56.1 36.7 21.8 50.3 - 164.9
Depreciation & amortisation 15.2 84.7 6.5 27.6 - 134.0
(a) Operating segments are reported in a manner consistent with the internal reporting provided to the Chief Executive Officer.
(b) Product description of above segments:
Global Business - corporate administration, fund administration, tax structuring, trusts, corporate secretarial services and compliance outsourcing.
Finance - consumer credit, leasing, card acquiring and issuing, factoring, deposit taking and foreign exchange dealing.
Property - property management and rentals.
Investments - import and distribution of consumer electronics and household appliances, captive insurance, IT related services, strategy monitoring, support to SBUs, performance monitoring and statutory reporting.
2015 - CIM ANNUAL REPORT 123CIM FINANCIAL SERVICES LTD

EXPLANATORY NOTES30 SEPTEMBER 2015
37. BUSINESS SEGMENTS (CONT’D)
Global Business Finance Property Investments
Group elimination Total
Rs m Rs m Rs m Rs m Rs m Rs m
Year ended 30 September 2014Revenue 631.3 1,082.5 100.4 2,255.2 (567.7) 3,501.7
Segment profit from operations 201.2 473.6 30.3 112.2 - 817.3
Gains on revaluation of investment properties - - 111.1 3.1 - 114.2
Finance costs (0.6) (176.6) (0.8) (83.4) - (261.4)
Share of results of associates - - - 3.1 - 3.1
Share of result of joint venture
- attributable to gain on revaluation of investment properties - - 18.8 - - 18.8
- net operating profit - - 3.2 - - 3.2
- - 22.0 - - 22.0
Profit before taxation 200.6 297.0 162.6 35.0 - 695.2
Taxation (33.9) (47.0) (8.4) (7.4) - (96.7)
Profit for the year 166.7 250.0 154.2 27.6 - 598.5
Assets 393.7 6,027.1 1,852.1 2,373.9 (1,021.8) 9,625.0
Liabilities 253.9 5,285.1 295.6 2,267.2 (1,529.1) 6,572.7
Capital expenditure (8.7) (143.7) (11.4) (45.8) - (209.6)
Depreciation & amortisation 10.0 74.1 7.2 18.8 - 110.1
The Group’s activity is mainly carried out by companies based in Mauritius.
38. ULTIMATE HOLDING COMPANYThe holding and ultimate holding companies of the Company are Cim Holdings Ltd and Elgin Ltd respectively. Both companies are incorporated in Mauritius.
124 2015 - CIM ANNUAL REPORT
CIM FINANCIAL SERVICES LTD

EXPLANATORY NOTES30 SEPTEMBER 2015
39. FINANCIAL SUMMARY
GROUP
Sep-15 Sep-14 Sep-13
Rs m Rs m Rs m
Restated
Statements of Profit or Loss and Other Comprehensive IncomeRevenue 4,103.8 3,501.7 3,246.0 Profit from operations 942.2 817.3 735.3 Finance costs (271.5) (261.4) (272.5)Gain on revaluation of investment properties - 114.2 - Share of results of associates 4.0 3.1 14.9 Share of result of joint venture 3.5 22.0 3.2 Profit before exceptional items 678.2 695.2 480.9 Exceptional items:Profit on disposal of financial assets - - 95.9 Profit before taxation 678.2 695.2 576.8 Taxation (110.5) (96.7) (86.5)Profit for the year 567.7 598.5 490.3
Other comprehensive income for the year, net of tax (0.4) 175.0 (6.4)Total comprehensive income for the year 567.3 773.5 483.9
Profit attributable to:Owners of the parent 574.9 604.3 493.6 Non controlling interests (7.2) (5.8) (3.3)
567.7 598.5 490.3 Total comprehensive income attributable to:Owners of the parent 574.5 685.9 487.2 Non controlling interests (7.2) 87.6 (3.3)
567.3 773.5 483.9
Earnings per share 0.84 0.89 0.72
Statements of Financial PositionNon current assets 5,506.4 5,517.4 4,519.3Current assets 5,255.9 4,107.6 3,833.8
10,762.3 9,625.0 8,353.1
Stated capital 680.5 680.5 680.5Retained earnings 2,018.5 1,693.6 1,307.9Other reserves 318.6 280.0 160.8Non controlling interests 391.0 398.2 314.4Non current liabilities 2,605.1 2,206.7 2,063.3Current liabilities 4,748.6 4,366.0 3,826.2
10,762.3 9,625.0 8,353.1
Stated Capital
Number of ordinary shares - issued and fully paid Units 680,522,310 680,522,310 680,522,310
2015 - CIM ANNUAL REPORT 125CIM FINANCIAL SERVICES LTD

Au
bd
ool R
iad
Ap
pad
oo R
ajes
h
Au
dit
Ren
u
Bol
and
Ch
rist
oph
er F
ran
cis
Bra
tch
Pau
l Han
s
Ch
um
un
Dou
rves
h K
um
ar
Ch
un
g K
ai T
o C
yril
Yin
Ch
oon
Ch
un
g K
im Y
uen
Cliv
e
Clif
ford
Rob
ert
An
thon
y
Cou
acau
d M
ain
gar
d H
erb
ert
Dar
ga
Lou
is A
med
ee
Des
croi
zille
s M
arce
l Viv
ian
Esp
ital
ier-
Noë
l M.M
.Hec
tor
Esp
ital
ier-
Noë
l M.
H.
Ph
ilip
pe
Faku
n S
and
eep
Gow
rea
Gya
nes
hw
arn
ath
Gu
jad
hu
r B
ud
hes
hw
ar
Gu
jjal
u R
ajiv
Har
e O
liver
An
thon
y
Imri
th R
ehm
a D
evi N
arve
ena
Jau
ffre
t O
livie
r Em
man
uel
Kis
tnam
ah N
ages
h
Koo
war
oo N
emra
j
Leec
h P
aul E
rnes
t
Lim
Kon
g J
ean
Pie
rre
Cla
ud
io
Lion
g K
ee L
im T
at V
oon
Low
Kw
an S
ang
Soo
Him
Lutc
hm
iah
Son
ia
Mah
arah
aje
Pan
day
Woo
gra
Ti
oum
itra
Mar
ion
Jac
qu
es E
dw
in
Nab
eeb
oku
s B
ash
ir
Naw
az N
eera
j
Par
eem
amu
n V
anes
ha
Pam
ela
Pad
ayat
chy
Viv
egan
and
a
Pas
cal G
érar
d J
D
Pilo
t Ja
cqu
es C
hri
stia
n J
erom
e
Raf
fray
Nic
olas
Ram
tool
a A
shra
f
Rou
sset
y Y
ann
ick
Ru
ng
apad
iach
y K
amal
am
Pill
ay
Sas
sa B
ilal I
bra
him
Sas
sa H
uss
ayn
Ses
un
gku
r D
har
men
dar
Sh
ahab
ally
Roo
ksan
a B
ibi
Sh
ewar
d G
rah
am
Som
en D
avid
Ste
ph
en L
uc
Cle
men
t
Su
ltu
nti
Asn
ath
Tayl
or C
olin
Geo
ffre
y
Tayl
or A
lexa
nd
er M
atth
ew
Tayl
or P
hili
p S
imon
Tayl
or T
imot
hy
Vee
rasa
my
Sat
yava
rni
Wie
he
L. H
. G
eorg
es
Won
g Y
in S
ang
Ch
arle
s C
lovi
s S
ui F
un
g
CFUS Nominee Ltd A R ACSBO2 Ltd R X X X C X XSouth West Safari Group Limited R X X X C X XCim Global Business Ltd A R R CCim Learning Centre Ltd XCIM Finance Ltd A X X X A X A C RCIM Financial Services Ltd X X X X X X X X X CCim Property Holdings Ltd A X CCim Property Development Ltd A X CCim Forex Ltd R X X X A CCIM Management Services Ltd A XCIM Agencies Ltd C XCim Tax Services Ltd X C A ACim Trustees (Mauritius) Limited A X R A A A ACim Administrators Ltd R A A RIMM Trustees Ltd X X XCim Fund Services Ltd (ex IMM Fund Administrators Ltd ) A X R R A A A A
Minimax Ltd X R A ACim Corporate Services Ltd (ex Multiconsult Ltd) A X R R A A A A
Multiconsult Trustees Ltd A X R A ROrchid Nominees Ltd X R A R ASWTD Bis Ltd R X X XTiger Nominees Ltd X R A R AWaterfalls International Ltd XThe Brandhouse Ltd X X R X XLe Morne Development Corporation Ltd R X X A C X
San Paolo Ltd C XCim Global Business Holdings Ltd R A R ACim Investment Advisors Ltd R X ACim Global Reinsurance Co. Ltd A R R RCim Captive Reinsurance Co. PCC A R R RCim Global Business Singapore Pte X A R XKey Financial Services Ltd XThe Oceanic Trust Co. Ltd XFieldhall Ltd R X R R R XHammerfield Nominees Ltd R X R R R XWhite Fin Nominees Ltd R X R R R XConqueror Ltd R X R R R XChronos Ltd R X R R R XCosign Limited R X R R R XIsla Ltd R X R R R XCim Fiduciary Administration Services Ltd X X A A R A
CIM Global Business UK Limited R ACim Portfolio Managers PCC R A ACim Shared Services Ltd A ACim Global Administrators Ltd R ACybernaptics Ltd X XCim Finance (Seychelles) Ltd A A
C- Chairman X-In office as director A-Appointed as director R-Resigned as director
126 2015 - CIM ANNUAL REPORT
DIRECTORS OFSUBSIDIARY COMPANIES

Au
bd
ool R
iad
Ap
pad
oo R
ajes
h
Au
dit
Ren
u
Bol
and
Ch
rist
oph
er F
ran
cis
Bra
tch
Pau
l Han
s
Ch
um
un
Dou
rves
h K
um
ar
Ch
un
g K
ai T
o C
yril
Yin
Ch
oon
Ch
un
g K
im Y
uen
Cliv
e
Clif
ford
Rob
ert
An
thon
y
Cou
acau
d M
ain
gar
d H
erb
ert
Dar
ga
Lou
is A
med
ee
Des
croi
zille
s M
arce
l Viv
ian
Esp
ital
ier-
Noë
l M.M
.Hec
tor
Esp
ital
ier-
Noë
l M.
H.
Ph
ilip
pe
Faku
n S
and
eep
Gow
rea
Gya
nes
hw
arn
ath
Gu
jad
hu
r B
ud
hes
hw
ar
Gu
jjal
u R
ajiv
Har
e O
liver
An
thon
y
Imri
th R
ehm
a D
evi N
arve
ena
Jau
ffre
t O
livie
r Em
man
uel
Kis
tnam
ah N
ages
h
Koo
war
oo N
emra
j
Leec
h P
aul E
rnes
t
Lim
Kon
g J
ean
Pie
rre
Cla
ud
io
Lion
g K
ee L
im T
at V
oon
Low
Kw
an S
ang
Soo
Him
Lutc
hm
iah
Son
ia
Mah
arah
aje
Pan
day
Woo
gra
Ti
oum
itra
Mar
ion
Jac
qu
es E
dw
in
Nab
eeb
oku
s B
ash
ir
Naw
az N
eera
j
Par
eem
amu
n V
anes
ha
Pam
ela
Pad
ayat
chy
Viv
egan
and
a
Pas
cal G
érar
d J
D
Pilo
t Ja
cqu
es C
hri
stia
n J
erom
e
Raf
fray
Nic
olas
Ram
tool
a A
shra
f
Rou
sset
y Y
ann
ick
Ru
ng
apad
iach
y K
amal
am
Pill
ay
Sas
sa B
ilal I
bra
him
Sas
sa H
uss
ayn
Ses
un
gku
r D
har
men
dar
Sh
ahab
ally
Roo
ksan
a B
ibi
Sh
ewar
d G
rah
am
Som
en D
avid
Ste
ph
en L
uc
Cle
men
t
Su
ltu
nti
Asn
ath
Tayl
or C
olin
Geo
ffre
y
Tayl
or A
lexa
nd
er M
atth
ew
Tayl
or P
hili
p S
imon
Tayl
or T
imot
hy
Vee
rasa
my
Sat
yava
rni
Wie
he
L. H
. G
eorg
es
Won
g Y
in S
ang
Ch
arle
s C
lovi
s S
ui F
un
g
CFUS Nominee Ltd A R ACSBO2 Ltd R X X X C X XSouth West Safari Group Limited R X X X C X XCim Global Business Ltd A R R CCim Learning Centre Ltd XCIM Finance Ltd A X X X A X A C RCIM Financial Services Ltd X X X X X X X X X CCim Property Holdings Ltd A X CCim Property Development Ltd A X CCim Forex Ltd R X X X A CCIM Management Services Ltd A XCIM Agencies Ltd C XCim Tax Services Ltd X C A ACim Trustees (Mauritius) Limited A X R A A A ACim Administrators Ltd R A A RIMM Trustees Ltd X X XCim Fund Services Ltd (ex IMM Fund Administrators Ltd ) A X R R A A A A
Minimax Ltd X R A ACim Corporate Services Ltd (ex Multiconsult Ltd) A X R R A A A A
Multiconsult Trustees Ltd A X R A ROrchid Nominees Ltd X R A R ASWTD Bis Ltd R X X XTiger Nominees Ltd X R A R AWaterfalls International Ltd XThe Brandhouse Ltd X X R X XLe Morne Development Corporation Ltd R X X A C X
San Paolo Ltd C XCim Global Business Holdings Ltd R A R ACim Investment Advisors Ltd R X ACim Global Reinsurance Co. Ltd A R R RCim Captive Reinsurance Co. PCC A R R RCim Global Business Singapore Pte X A R XKey Financial Services Ltd XThe Oceanic Trust Co. Ltd XFieldhall Ltd R X R R R XHammerfield Nominees Ltd R X R R R XWhite Fin Nominees Ltd R X R R R XConqueror Ltd R X R R R XChronos Ltd R X R R R XCosign Limited R X R R R XIsla Ltd R X R R R XCim Fiduciary Administration Services Ltd X X A A R A
CIM Global Business UK Limited R ACim Portfolio Managers PCC R A ACim Shared Services Ltd A ACim Global Administrators Ltd R ACybernaptics Ltd X XCim Finance (Seychelles) Ltd A A
C- Chairman X-In office as director A-Appointed as director R-Resigned as director
2015 - CIM ANNUAL REPORT 127
DIRECTORS OFSUBSIDIARY COMPANIES