climategate is global warming completely made-up?
TRANSCRIPT

ClimateGateClimateGate
Is Global Warming Completely Made-Up?
IntroductionIntroduction
• On November 20, 2009 a computer hacker released 200 MB of data from the University of East Anglia's Hadley Climatic Research Unit (CRU)
• The data included over 1,000 emails and 3,000 documents
• Do these documents cast doubt on the reliability of the global warming data?

Sun
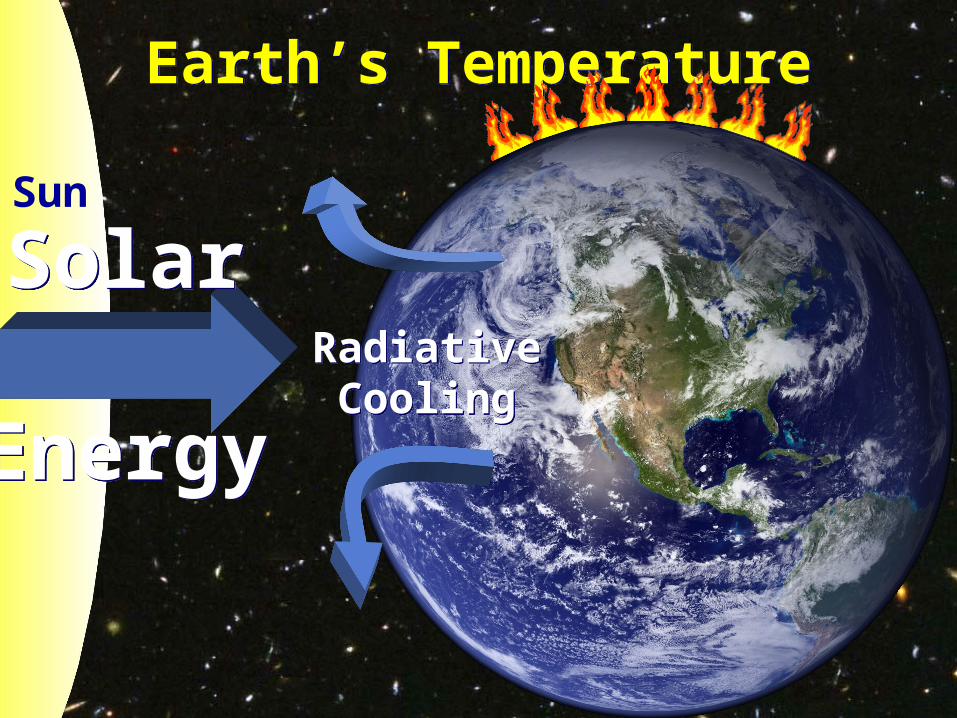
Earth’s TemperatureEarth’s Temperature
Solar
Energy
Solar
Energy
Solar
Energy
Solar
Energy

Sun
Earth’s TemperatureEarth’s Temperature
Solar
Energy
Solar
Energy
RadiativeCooling
RadiativeCooling
Sun
Earth’s TemperatureEarth’s Temperature
Solar
Energy
Solar
Energy
RadiativeCooling
RadiativeCooling

Sun
Earth’s TemperatureEarth’s Temperature
Solar
Energy
Solar
Energy
RadiativeCooling
RadiativeCooling
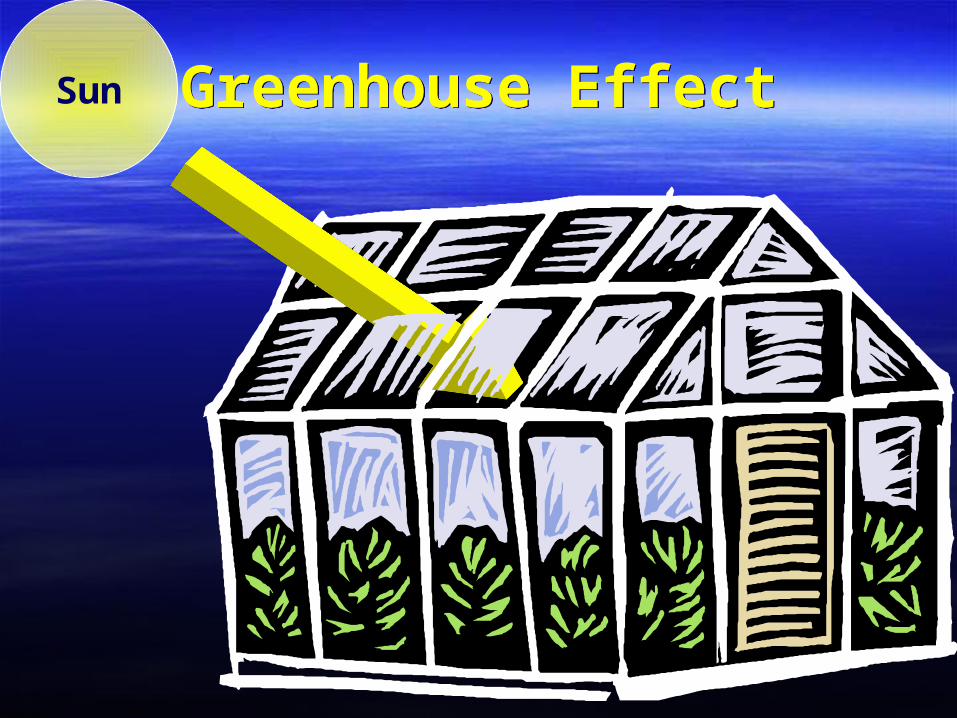
Greenhouse EffectGreenhouse EffectSun

Earth’s Atmospheric GasesEarth’s Atmospheric GasesNitrogen (N2)
Oxygen (O2)
Water (H2O)
Carbon Dioxide (CO2)
>99%
Methane (CH4)
<1%
Non-Greenhouse
Gases
GreenhouseGases
Argon (Ar)
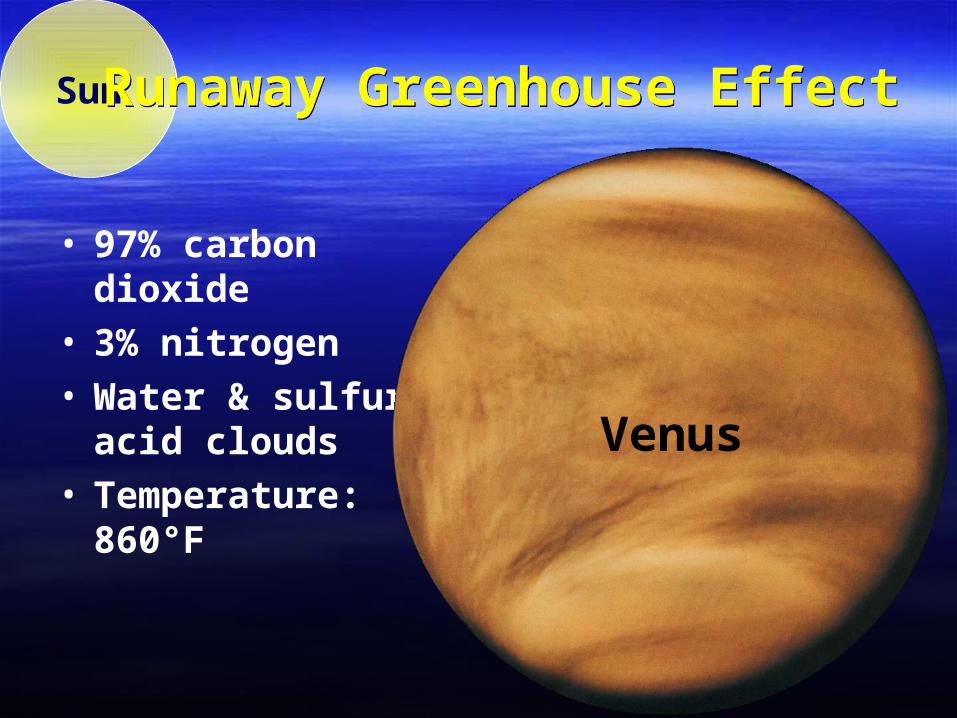
Sun Runaway Greenhouse EffectRunaway Greenhouse Effect
• 97% carbon dioxide• 3% nitrogen• Water & sulfuric
acid clouds• Temperature:
860°F
Venus
Carbon DioxideCarbon Dioxide
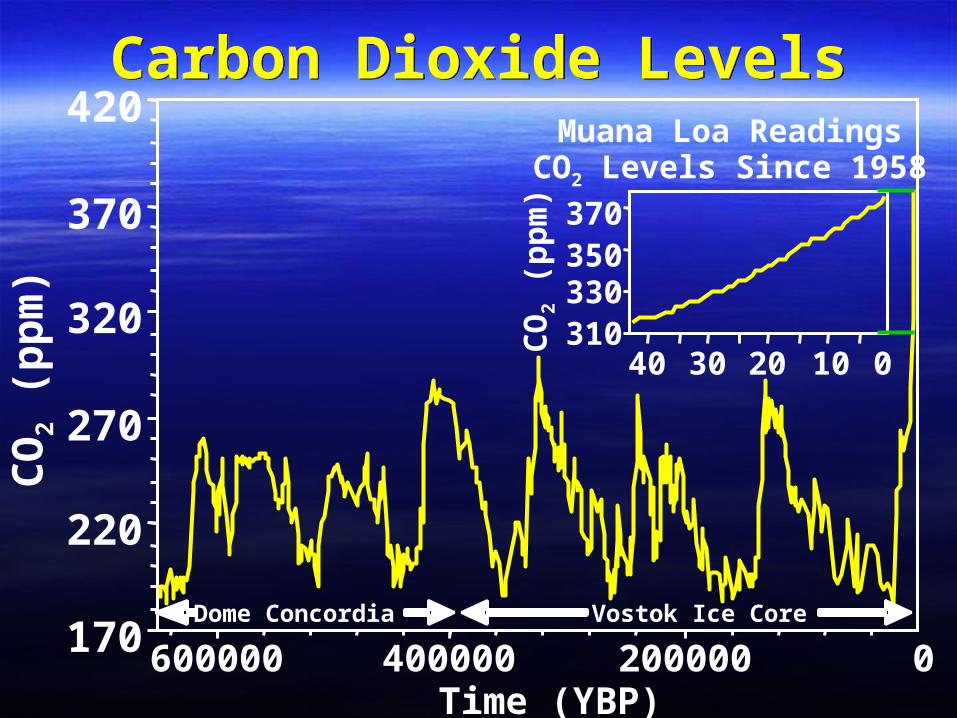
170
220
270
320
370
420
200000400000600000Time (YBP)
CO
2 (p
pm
)
Vostok Ice CoreDome Concordia
Carbon Dioxide LevelsCarbon Dioxide Levels
0
Muana Loa ReadingsCO2 Levels Since 1958
310330350370
10203040
CO
2 (
pp
m)
0

Worldwide Carbon EmissionsWorldwide Carbon EmissionsC
arb
on
(10
9 m
etri
c to
ns)
0
1
2
3
4
5
6
7
8
1750 1800 1850 1900 1950 2000Year
Liquid fuelLiquid fuelTotalTotal
Gas fuelGas fuelSolid fuelSolid fuel

Annual Carbon EmissionsAnnual Carbon Emissions
Annual carbon emissionsAtmospheric CO2
Atmospheric CO2 average
1955 1965 1975 1985 1995 20050
4
6
8
2
Year
Car
bo
n (
109
met
ric
ton
s)
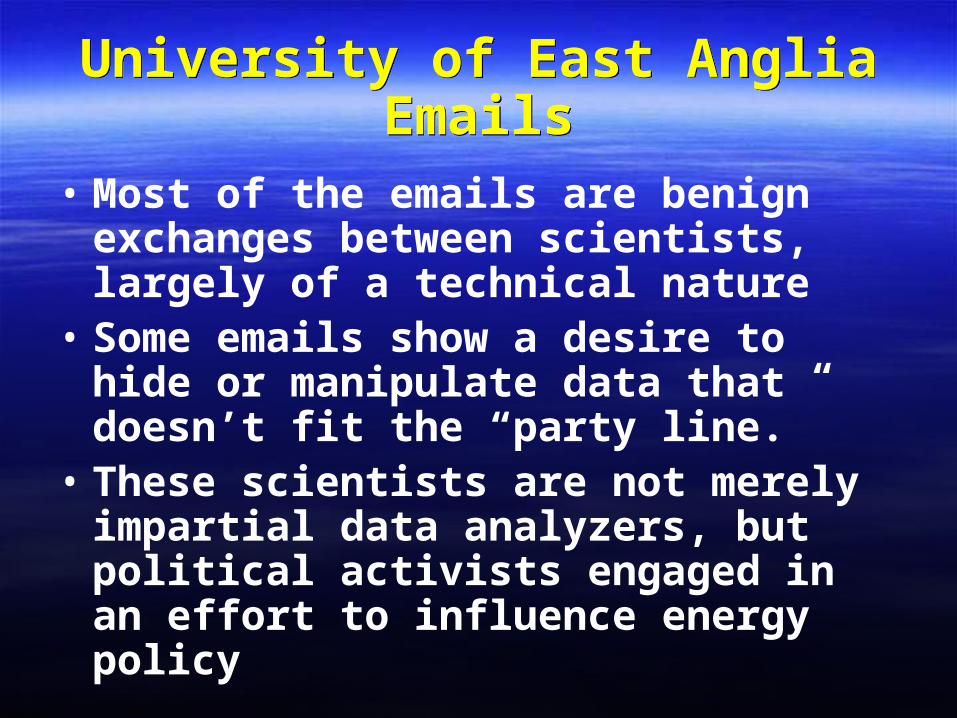
University of East Anglia EmailsUniversity of East Anglia Emails
• Most of the emails are benign exchanges between scientists, largely of a technical nature
• Some emails show a desire to hide or manipulate data that doesn’t fit the “party line.”
• These scientists are not merely impartial data analyzers, but political activists engaged in an effort to influence energy policy

The PlayersThe Players
• Phil: Philip Jones, Head of the CRU
• Mike: Michael Mann, of hockey stick fame
• Keith: Keith Briffa, CRU scientist
• Stephen McIntyre: Global warming critic (ClimateAudit.org, “CA”)

Fixing the Data?Fixing the Data?
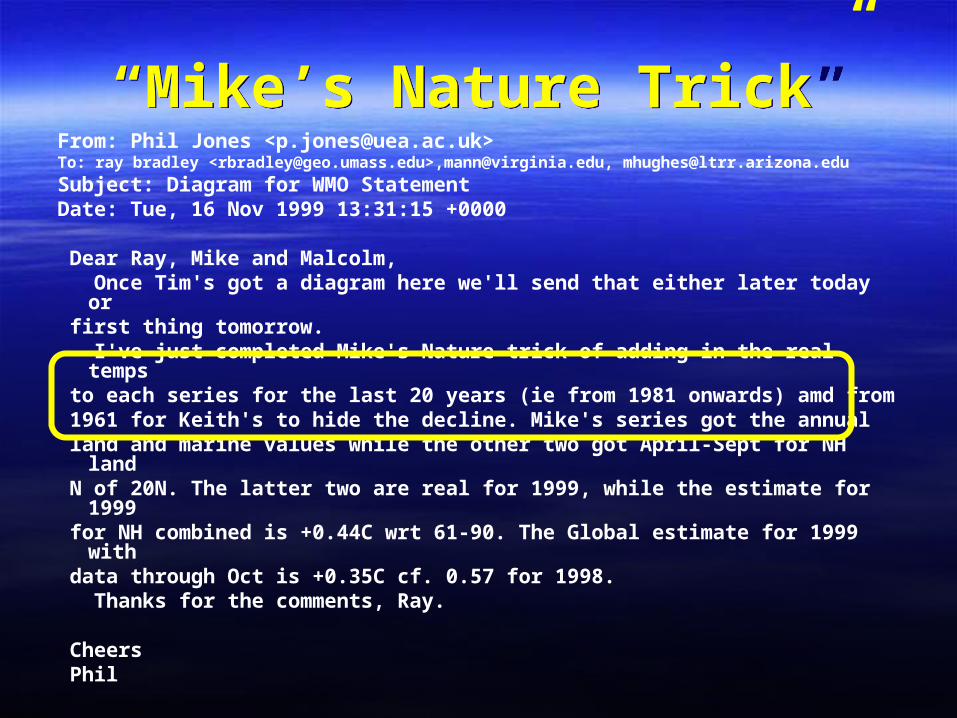
“Mike’s Nature Trick”“Mike’s Nature Trick”From: Phil Jones <[email protected]>To: ray bradley <[email protected]>,[email protected], [email protected]
Subject: Diagram for WMO StatementDate: Tue, 16 Nov 1999 13:31:15 +0000
Dear Ray, Mike and Malcolm, Once Tim's got a diagram here we'll send that either later today or first thing tomorrow. I've just completed Mike's Nature trick of adding in the real temps to each series for the last 20 years (ie from 1981 onwards) amd from 1961 for Keith's to hide the decline. Mike's series got the annual land and marine values while the other two got April-Sept for NH land N of 20N. The latter two are real for 1999, while the estimate for 1999 for NH combined is +0.44C wrt 61-90. The Global estimate for 1999 with data through Oct is +0.35C cf. 0.57 for 1998. Thanks for the comments, Ray.
Cheers Phil

Program Coding (maps24.pro)Program Coding (maps24.pro)
• ; Plots 24 yearly maps of calibrated (PCR-infilled or not) MXD reconstructions
• ; of growing season temperatures. Uses "corrected" MXD - but shouldn't usually
• ; plot past 1960 because these will be artificially adjusted to look closer to
• ; the real temperatures.
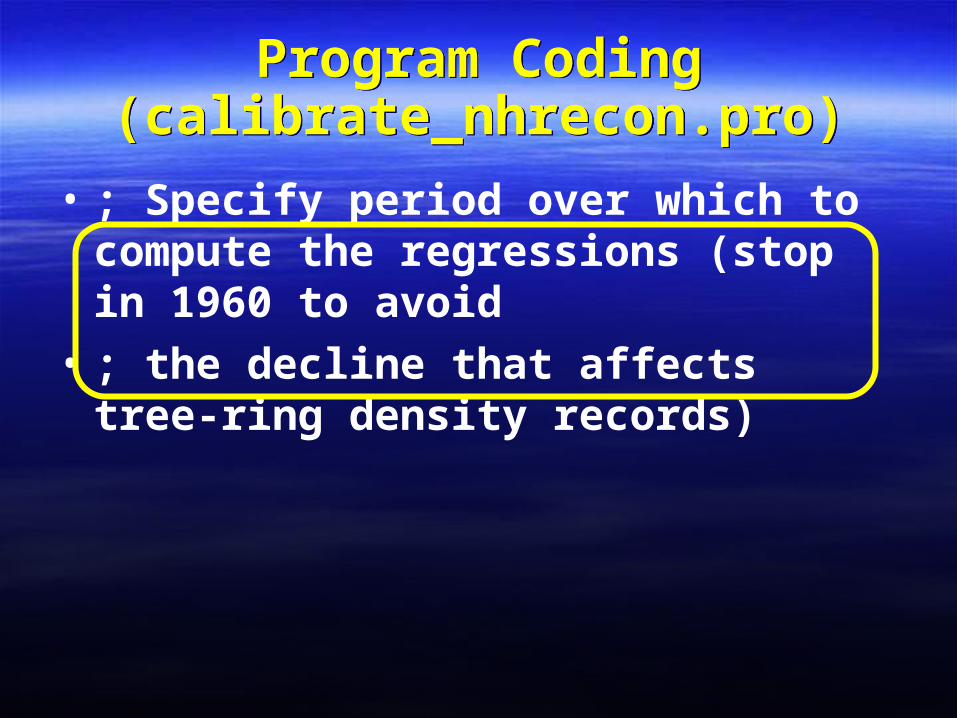
Program Coding (calibrate_nhrecon.pro)
Program Coding (calibrate_nhrecon.pro)
• ; Specify period over which to compute the regressions (stop in 1960 to avoid
• ; the decline that affects tree-ring density records)
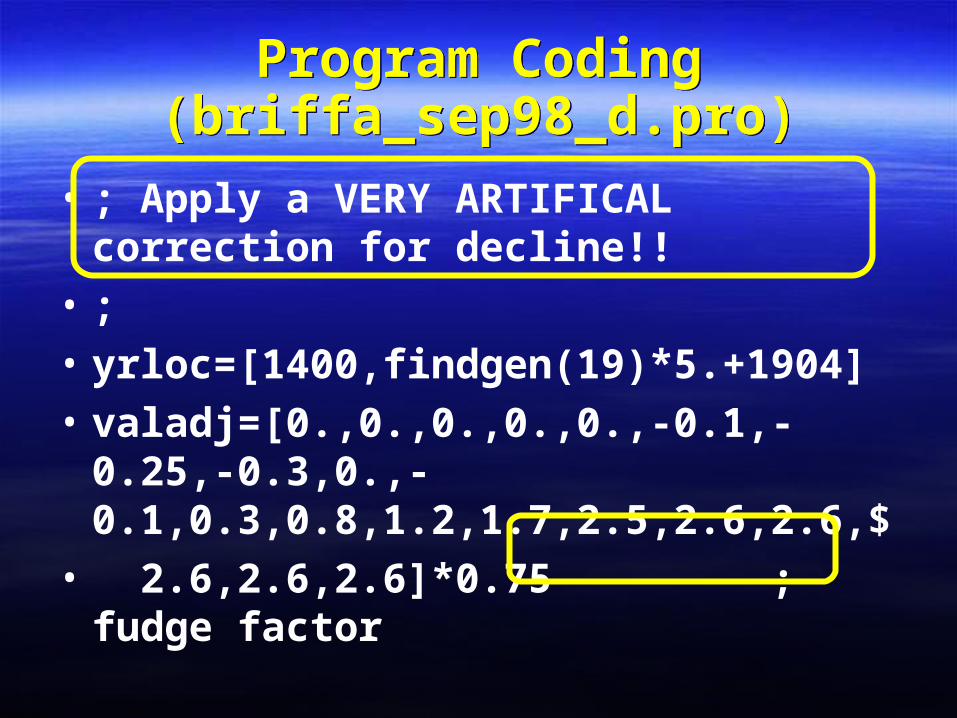
Program Coding (briffa_sep98_d.pro)
Program Coding (briffa_sep98_d.pro)
• ; Apply a VERY ARTIFICAL correction for decline!!
• ;
• yrloc=[1400,findgen(19)*5.+1904]
• valadj=[0.,0.,0.,0.,0.,-0.1,-0.25,-0.3,0.,-0.1,0.3,0.8,1.2,1.7,2.5,2.6,2.6,$
• 2.6,2.6,2.6]*0.75 ; fudge factor

Past Temperatures MeasurementPast Temperatures Measurement
• Proxy – a method that approximates a particular measurement (e.g., temperature) Tree rings Ice cores Pollen records Plant macrofossils Sr/Ca isotope data Oxygen isotopes from speleothem calcite
(stalactites and stalagmites)
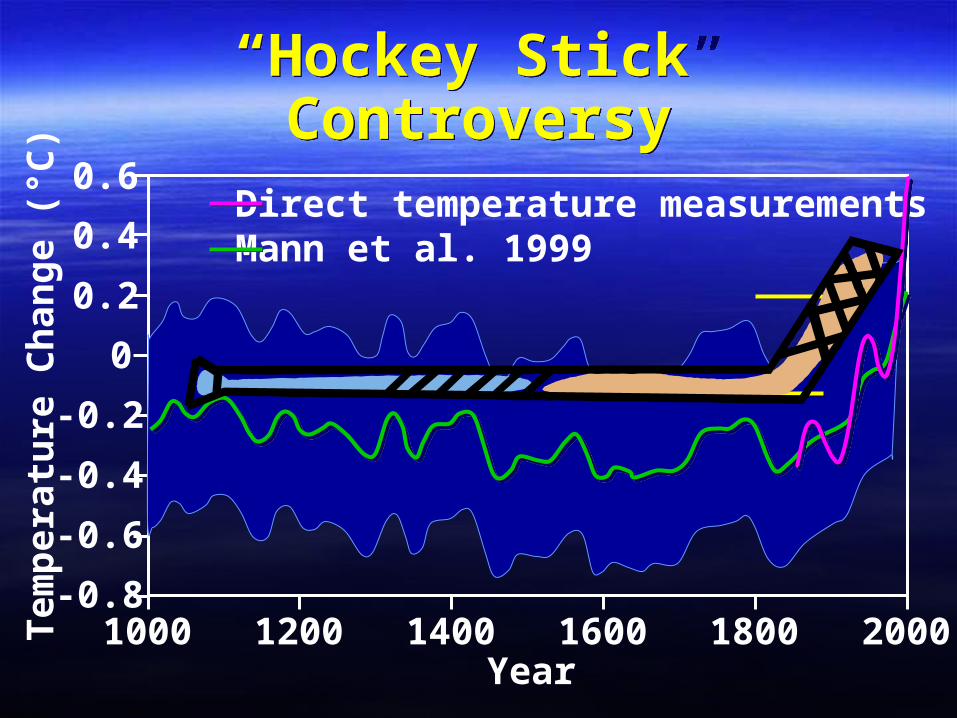
“Hockey Stick” Controversy“Hockey Stick” Controversy
1000 1200 1400 1600 1800 2000-0.8
Year
-0.6
-0.4
-0.2
0
0.2
0.4
0.6
Tem
per
atu
re C
han
ge
(°C
)
Direct temperature measurementsMann et al. 1999
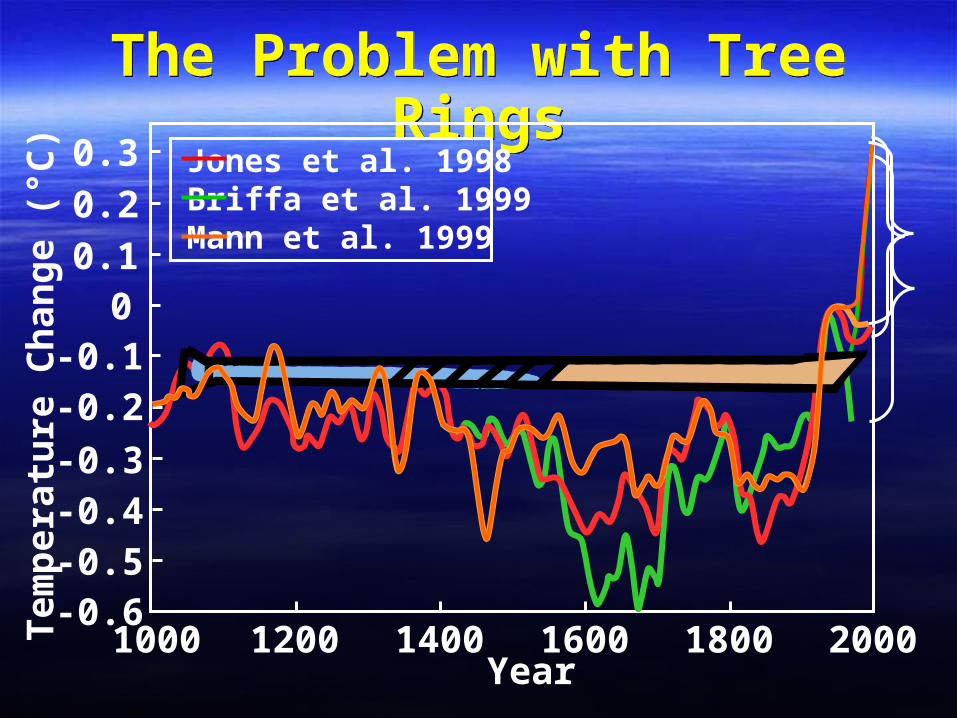
The Problem with Tree RingsThe Problem with Tree Rings
1000 1200 1400 1600 1800 2000-0.6
Year
-0.5-0.4-0.3
00.10.20.3
Tem
per
atu
re C
han
ge
(°C
)
-0.2-0.1
Jones et al. 1998Briffa et al. 1999Mann et al. 1999
What Influences Tree Rings?What Influences Tree Rings?
• Temperature
• Rainfall
• Carbon dioxide concentration
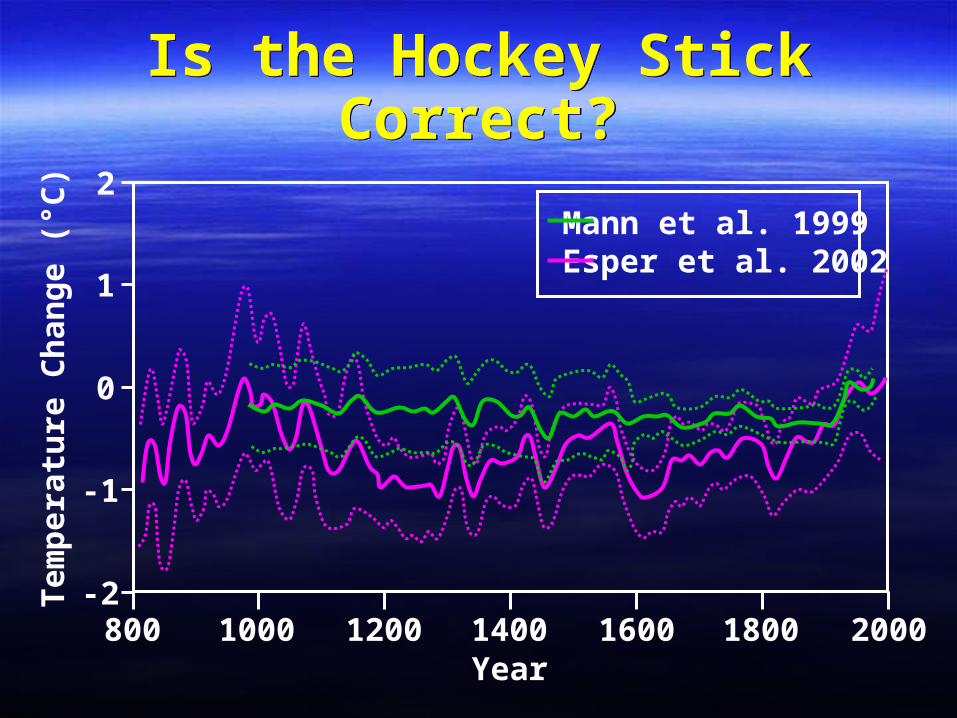
Mann et al. 1999Esper et al. 2002
800 1000 1200 1400 1600 1800-2
-1
0
1
2
Tem
per
atu
re C
han
ge
(°C
)
2000Year
Is the Hockey Stick Correct?Is the Hockey Stick Correct?

Is the Hockey Stick Correct?Is the Hockey Stick Correct?
-1.2
-1.0
-0.8
-0.6
-0.4
-0.2
0.0
0.2
0.4
0 400 800 1200 1600 2000Year
Tem
per
atu
re C
han
ge
(°C
)
Mann et al. 1999Esper et al. 2002Moberg et al. 2005Mann et al. 2008
Medieval Warm PeriodMedieval Warm Period

Responses/RebuttalsResponses/RebuttalsFrom Real Climate:
• “…the ‘trick’ is just to plot the instrumental records along with reconstruction so that the context of the recent warming is clear. Scientists often use the term “trick” to refer to a “a good way to deal with a problem”, rather than something that is “secret”, and so there is nothing problematic in this at all.”

Past TemperaturesPast Temperatures

-0.6
-0.4
-0.2
0.0
0.2
0.4
0.6
0.8
1880 1900 1920 1940 1960 1980 2000Year
M
ean
Tem
per
atu
re (
°C)
Recorded Worldwide Temperatures
Recorded Worldwide Temperatures
FlatDecreasing
Flat
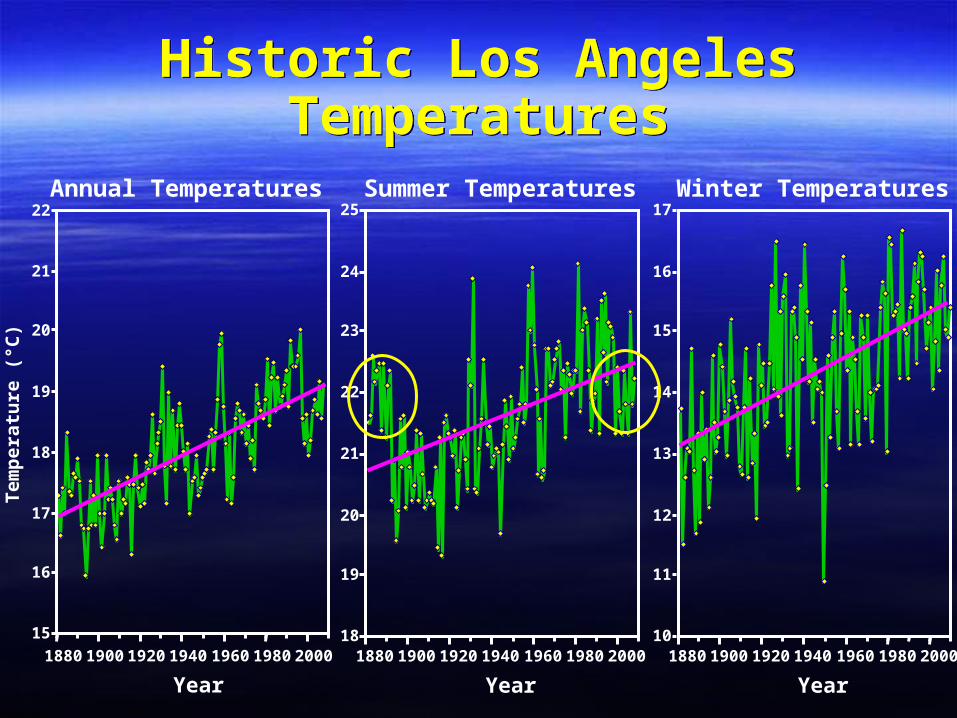
Winter Temperatures
10
11
12
13
14
15
16
17
1880 1900 1920 1940 1960 1980 2000
Year
Summer Temperatures
18
19
20
21
22
23
24
25
1880 1900 1920 1940 1960 1980 2000
Year
Annual Temperatures
15
16
17
18
19
20
21
22
1880 1900 1920 1940 1960 1980 2000
Year
Tem
per
atu
re (
°C)
Historic Los Angeles Temperatures
Historic Los Angeles Temperatures
Temperature History of the EarthTemperature History of the Earth
• For the past 3 million years, the earth has been experiencing ~100,000 year cycles of glaciation followed by ~10,000 year interglacial periods
• These climate periods are largely the result of cycles in the earth’s orbit – precession, obliquity, and eccentricity
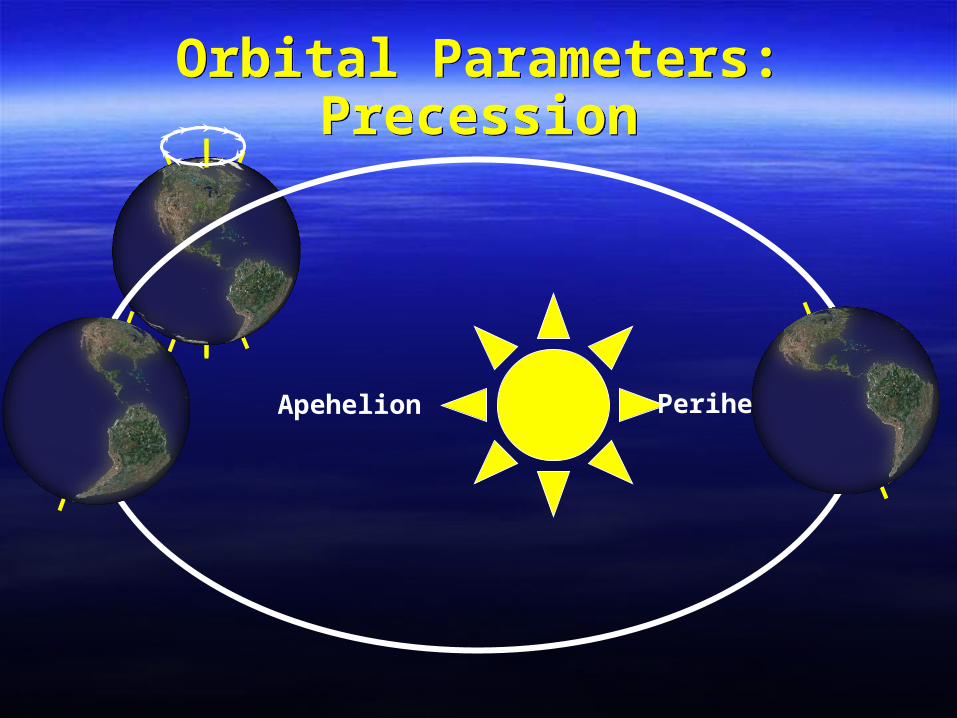
Orbital Parameters: PrecessionOrbital Parameters: Precession
PerihelionApehelion
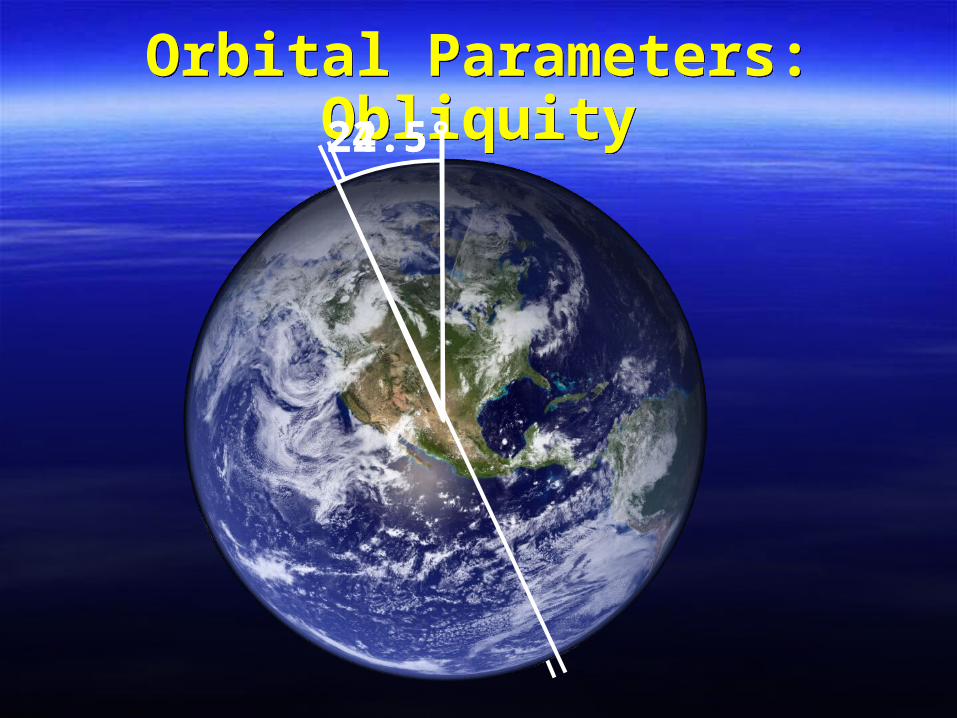
Orbital Parameters: ObliquityOrbital Parameters: Obliquity22.5°24.5°

Orbital Parameters: EccentricityOrbital Parameters: Eccentricity
PerihelionApehelionApehelion
Minimum: 0.005Minimum: 0.005
Maximum: 0.061Maximum: 0.061
Not to scale!Not to scale!To Scale!To Scale!
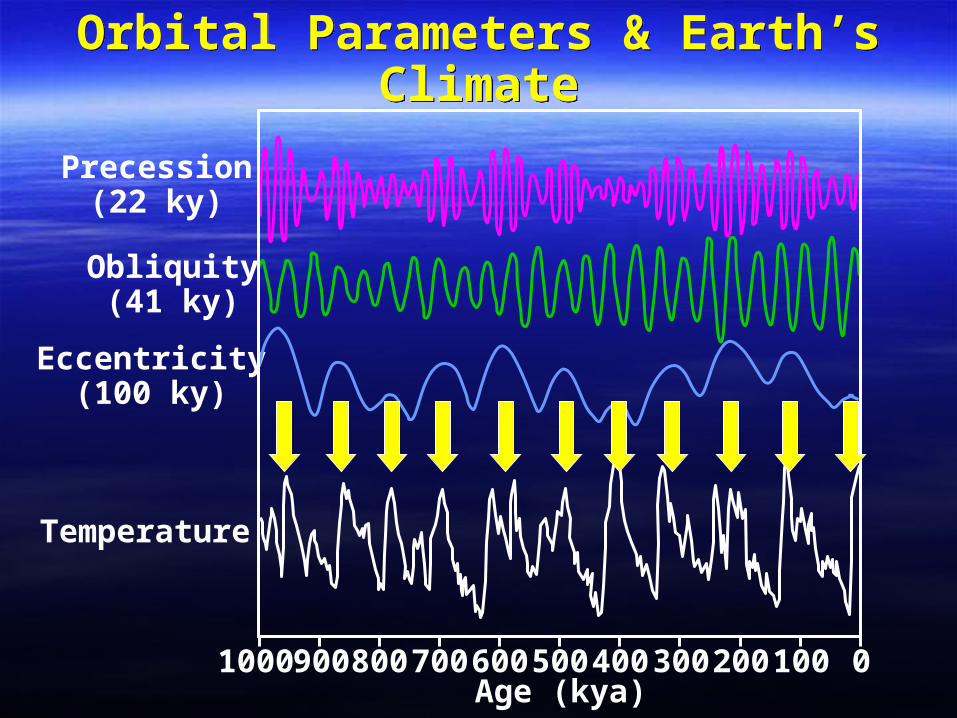
Orbital Parameters & Earth’s ClimateOrbital Parameters & Earth’s Climate
Age (kya)1000900 800 700 600 500 400 300 200 100 0
Eccentricity(100 ky)
Temperature
Obliquity(41 ky)
Precession(22 ky)
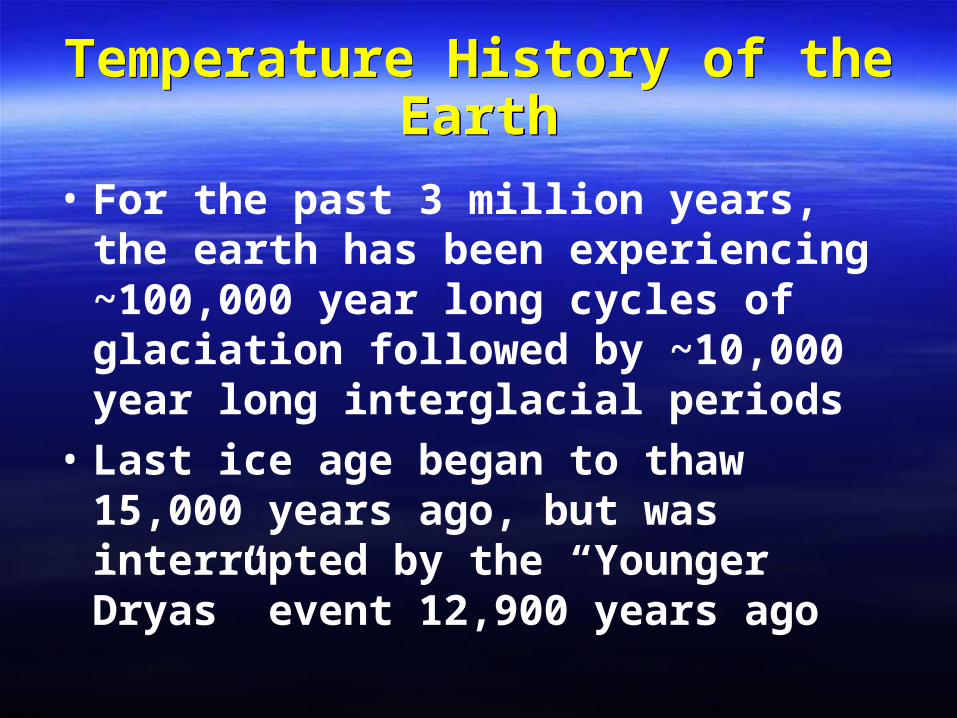
Temperature History of the EarthTemperature History of the Earth
• For the past 3 million years, the earth has been experiencing ~100,000 year long cycles of glaciation followed by ~10,000 year long interglacial periods
• Last ice age began to thaw 15,000 years ago, but was interrupted by the “Younger Dryas” event 12,900 years ago

YoungerDryas
YoungerDryas
Younger Dryas EventYounger Dryas Event
-55-55
-50-50
-45-45
-40-40
-35-35
-30-30
-25-25
05101520Age (kya)
Tem
per
atu
re (
°C)
Tem
per
atu
re (
°C)
0.050.05
0.100.10
0.150.15
0.200.20
0.250.25
0.300.30
0.350.35
Sn
ow
Acc
um
ula
tio
n (
m/y
r)S
no
w A
ccu
mu
lati
on
(m
/yr)
Little Ice AgeLittle Ice AgeIce Age
Medieval WarmMedieval Warm
Manipulating Data?Manipulating Data?
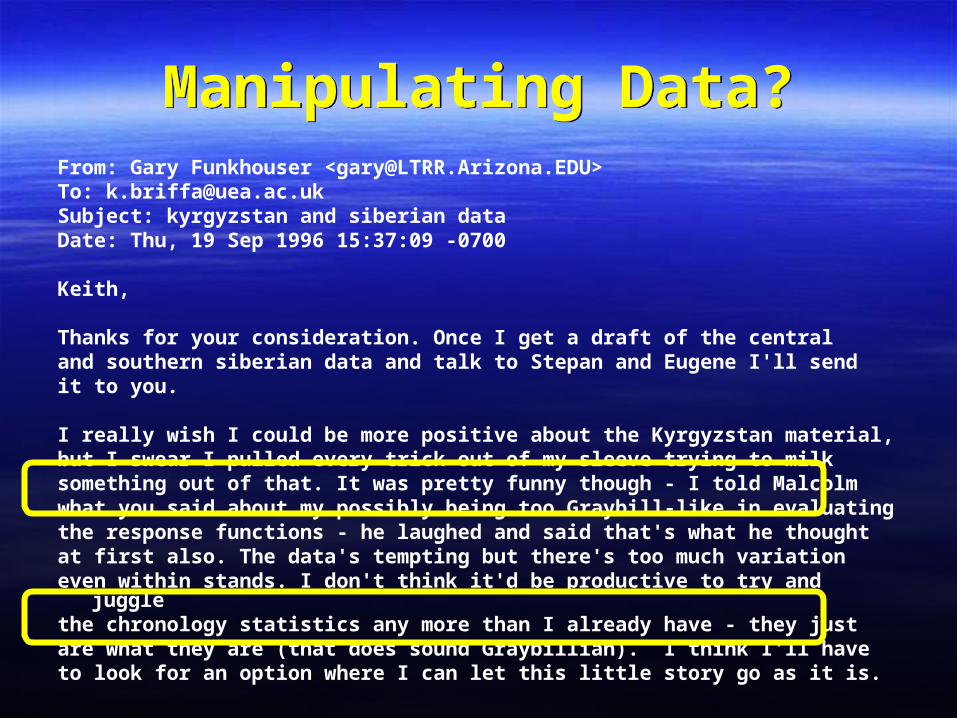
Manipulating Data?Manipulating Data?From: Gary Funkhouser <[email protected]>To: [email protected]: kyrgyzstan and siberian dataDate: Thu, 19 Sep 1996 15:37:09 -0700
Keith,
Thanks for your consideration. Once I get a draft of the central and southern siberian data and talk to Stepan and Eugene I'll sendit to you.
I really wish I could be more positive about the Kyrgyzstan material,but I swear I pulled every trick out of my sleeve trying to milk something out of that. It was pretty funny though - I told Malcolmwhat you said about my possibly being too Graybill-like in evaluatingthe response functions - he laughed and said that's what he thoughtat first also. The data's tempting but there's too much variation even within stands. I don't think it'd be productive to try and juggle the chronology statistics any more than I already have - they justare what they are (that does sound Graybillian). I think I'll have to look for an option where I can let this little story go as it is.

Manipulating Data?Manipulating Data?From: Keith Briffa <[email protected]>To: [email protected]: the Yamal dataDate: Thu Oct 31 12:01:04 1996
Dear Rashit,
In looking at the data I now see that you have only sent data from abot 350bc onwards. What is the situation with the earlier data. I am very interested in the details of the 1st millennium B.C. and especially this period from about 500 to 100 B.C. We still have a gap in the Tornetrask data at about 350 B.C.
I was of the opinion that this period was very low growth in the chronology of yours shown by Stepan in Cambridge - but it does not seem so low in the chronology he gave me. What are your thoughts on this and is it possible to get the earlier data when you are happy with them?Thanks
very best wishes Keith
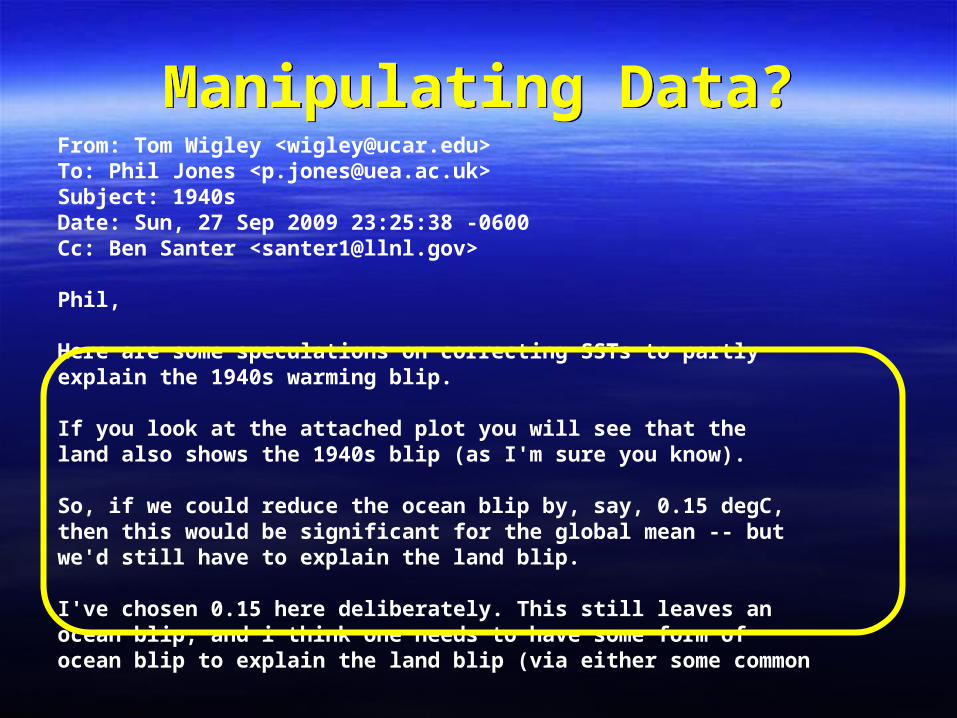
Manipulating Data?Manipulating Data?From: Tom Wigley <[email protected]>To: Phil Jones <[email protected]>Subject: 1940sDate: Sun, 27 Sep 2009 23:25:38 -0600Cc: Ben Santer <[email protected]>
Phil,
Here are some speculations on correcting SSTs to partlyexplain the 1940s warming blip.
If you look at the attached plot you will see that theland also shows the 1940s blip (as I'm sure you know).
So, if we could reduce the ocean blip by, say, 0.15 degC,then this would be significant for the global mean -- butwe'd still have to explain the land blip.
I've chosen 0.15 here deliberately. This still leaves anocean blip, and i think one needs to have some form ofocean blip to explain the land blip (via either some common

Politicking?Politicking?From: Joseph Alcamo <[email protected]>
To: [email protected], [email protected]
Subject: Timing, Distribution of the Statement
Date: Thu, 9 Oct 1997 18:52:33 0100
Reply-to: [email protected]
Mike, Rob,
Sounds like you guys have been busy doing good things for the cause.
I would like to weigh in on two important questions --
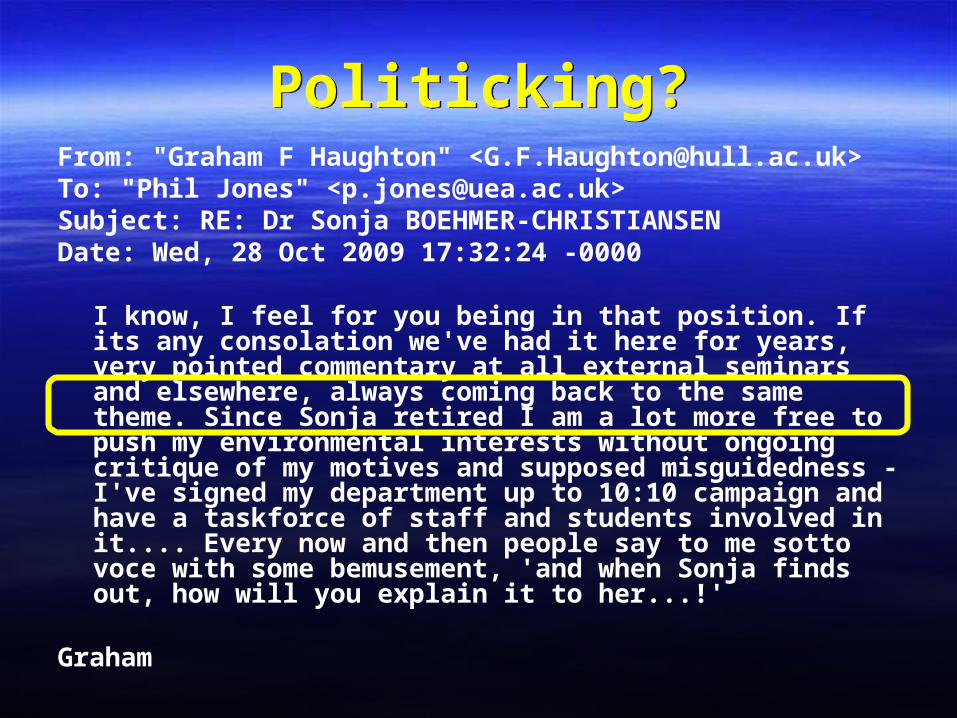
Politicking?Politicking?From: "Graham F Haughton" <[email protected]>To: "Phil Jones" <[email protected]>Subject: RE: Dr Sonja BOEHMER-CHRISTIANSEN Date: Wed, 28 Oct 2009 17:32:24 -0000
I know, I feel for you being in that position. If its any consolation we've had it here for years, very pointed commentary at all external seminars and elsewhere, always coming back to the same theme. Since Sonja retired I am a lot more free to push my environmental interests without ongoing critique of my motives and supposed misguidedness - I've signed my department up to 10:10 campaign and have a taskforce of staff and students involved in it.... Every now and then people say to me sotto voce with some bemusement, 'and when Sonja finds out, how will you explain it to her...!'
Graham

Politicking?Politicking?From: [email protected]
To: [email protected], [email protected], [email protected], [email protected], [email protected], [email protected], [email protected]
Subject: Re: climate of the last millennia...
Date: Tue, 6 Oct 1998 11:06:20 -0400 (EDT)
Dear all,
I just wanted to thank Keith for his comments. They are right on target.
There is indeed, as many of us are aware, at least one key player in the
modeling community that has made overly dismissive statements about the
value of proxy data as late, because of what might be argued as his/her
own naive assessment/analysis of these data. This presents the danger of
just the sort of backlash that Keith warns of, and makes all the more
pressing the need for more of a community-wide strategizing on our part.
I think the workshop in Jan that Peck is hosting will go far in this
regard, and I personally am really looking forward to it!

Politicking?Politicking?From: Michael Mann <[email protected]>
To: Phil Jones <[email protected]>
Subject: Re: attacks against Keith
Date: Wed, 30 Sep 2009 11:06:20 -0400
Cc: Gavin Schmidt <[email protected]>, Tim Osborn <[email protected]>
Hi Phil,
lets not get into the topic of hate mail. I promise you I could fill your inbox w/ a very
long list of vitriolic attacks, diatribes, and threats I've received.
Its part of the attack of the corporate-funded attack machine, i.e. its a direct and highly
intended outcome of a highly orchestrated, heavily-funded corporate attack campaign. We saw
it over the summer w/ the health insurance industry trying to defeat Obama's health plan,
we'll see it now as the U.S. Senate moves on to focus on the cap & trade bill that passed
congress this summer. It isn't coincidental that the original McIntyre and McKitrick E&E
paper w/ press release came out the day before the U.S. senate was considering the McCain
Lieberman climate bill in '05.

Not Releasing DataNot Releasing DataTestimony of Stephen McIntyre
Phil Jones (CRU):“We have 25 or so years invested in the work. Why should I make the data available to you, when your aim is to try and find something wrong with it?”
Written submission of Stephen McIntyre before the Subcommittee on oversight and investigations, Energy and Commerce Committee, United States House of Representatives, July 19, 2006.
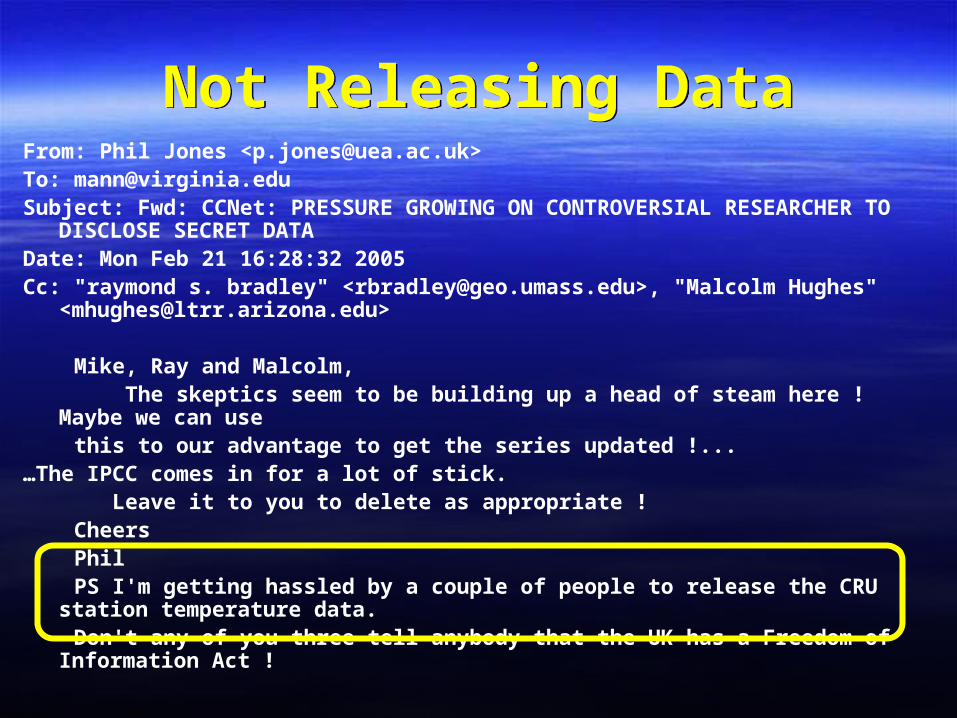
Not Releasing DataNot Releasing DataFrom: Phil Jones <[email protected]>To: [email protected]: Fwd: CCNet: PRESSURE GROWING ON CONTROVERSIAL RESEARCHER TO
DISCLOSE SECRET DATADate: Mon Feb 21 16:28:32 2005Cc: "raymond s. bradley" <[email protected]>, "Malcolm Hughes"
Mike, Ray and Malcolm, The skeptics seem to be building up a head of steam here ! Maybe we can use this to our advantage to get the series updated !...…The IPCC comes in for a lot of stick. Leave it to you to delete as appropriate ! Cheers Phil PS I'm getting hassled by a couple of people to release the CRU station temperature
data. Don't any of you three tell anybody that the UK has a Freedom of Information Act !

Not Releasing DataNot Releasing DataFrom: Phil Jones <[email protected]>To: Tom Wigley <[email protected]>Subject: Re: FOIADate: Fri Jan 21 15:20:06 2005
Tom, I'll look at what you've said over the weekend re CCSP. I don't know the other panel members. I've not heard any more about it since agreeing a week ago. As for FOIA Sarah isn't technically employed by UEA and she will likely be paid by Manchester Metropolitan University. I wouldn't worry about the code. If FOIA does ever get used by anyone, there is also IPR to consider as well. Data is covered by all the agreements we sign with people, so I will be hiding behind them. I'll be passing any requests onto the person at UEA who has been given a post to deal with them. Cheers Phil

Not Releasing DataNot Releasing DataFrom: Phil Jones <[email protected]>To: [email protected], Tom Wigley <[email protected]>Subject: Re: Schles suggestionDate: Wed Dec 3 13:57:09 2008
Ben, When the FOI requests began here, the FOI person said we had to
abide by the requests. It took a couple of half hour sessions - one at a screen, to convince them otherwise showing them what CA was all about. Once they became aware of the types of people we were dealing with, everyone at UEA (in the registry and in the Environmental Sciences school - the head of school and a few others) became very supportive. I've got to know the FOI person quite well and the Chief Librarian - who deals with appeals. The VC is also aware of what is going on - at least for one of the requests, but probably doesn't know the number we're dealing with. We are in double figures.
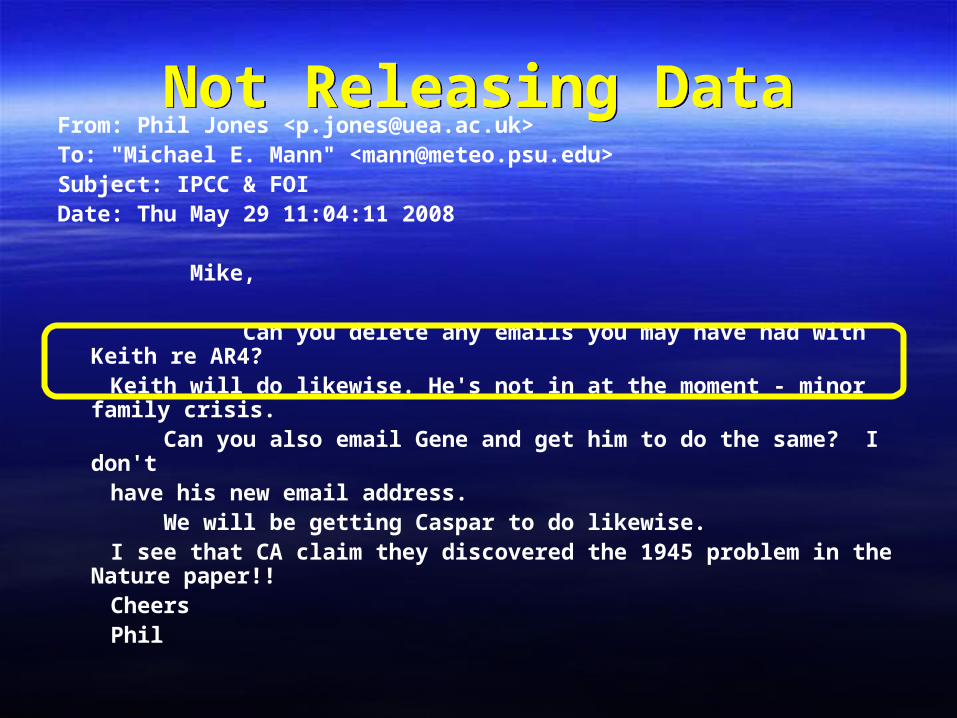
Not Releasing DataNot Releasing DataFrom: Phil Jones <[email protected]>To: "Michael E. Mann" <[email protected]>Subject: IPCC & FOIDate: Thu May 29 11:04:11 2008
Mike,
Can you delete any emails you may have had with Keith re AR4? Keith will do likewise. He's not in at the moment - minor family crisis. Can you also email Gene and get him to do the same? I don't have his new email address. We will be getting Caspar to do likewise. I see that CA claim they discovered the 1945 problem in the Nature
paper!! Cheers Phil

Covering UpCovering UpFrom: Phil Jones <[email protected]>To: "Michael E. Mann“, "raymond s. bradley" Subject: A couple of thingsDate: Fri May 9 09:53:41 2008
Mike, Ray, Caspar,
A couple of things - don't pass on either…
…2. You can delete this attachment if you want. Keep this quiet also, but this is the person who is putting in FOI requests for all emails Keith and Tim have written and received re Ch 6 of AR4. We think we've found a way around this. I can't wait for the Wengen review to come out with the Appendix showing what that 1990 IPCC Figure was really based on. The Garnaut review appears to be an Australian version of the Stern Report. This message will self destruct in 10 seconds! Cheers Phil

Covering UpCovering UpFrom: Phil Jones <[email protected]>To: [email protected]: CLIMATIC CHANGE needs your advice - YOUR EYES ONLY !!!!!Date: Fri Jan 16 13:25:59 2004
Mike, This is for YOURS EYES ONLY. Delete after reading - please !
I'm trying to redress the balance. One reply from Pfister said you should make all available !! Pot calling the kettle black - Christian doesn't make his methods available. I replied to the wrong Christian message so you don't get to see what he said. Probably best. Told Steve separately and to get more advice from a few others as well as Kluwer and legal.
PLEASE DELETE - just for you, not even Ray and Malcolm
Cheers Phil

Covering UpCovering UpDate: Fri, 16 Jan 2004 12:37:29 +0000 To: Christian Azar <[email protected]>,
[email protected] From: Phil Jones <[email protected]> Subject: Re: AW: CLIMATIC CHANGE needs your advice Dear Steve et al, I've been away this week until today. Although the responses so far all make
valid points, I will add my thoughts... Back to the question in hand: 1. The papers that MM refer came out in Nature in 1998 and to a lesser extent in
GRL in 1999. These reviewers did not request the data (all the proxy series) and the code. So, acceding to the request for this to do the review is setting a VERY dangerous precedent.
Mike has made all the data series and this is all anyone should need. Making model code available is something else.

Bad MannersBad MannersFrom: Ben Santer <[email protected]>To: [email protected]: Re: CEI formal petition to derail EPA GHG endangerment finding…Date: Fri, 09 Oct 2009 11:07:56 -0700
Dear Phil,
I've known Rick Piltz for many years. He's a good guy. I believe he used to work with Mike MacCracken at the U.S. Global Change Research Program.
I'm really sorry that you have to go through all this stuff, Phil. Next time I see Pat Michaels at a scientific meeting, I'll be tempted to beat the xxxx out of him. Very tempted.
I'll help you to deal with Michaels and the CEI in any way that I can. The only reason these guys are going after you is because your work is of crucial importance - it changed the way the world thinks about human effects on climate. Your work mattered in the 1980s, and it matters now.
With best wishes,Ben

Bad MannersBad MannersFrom: Scott Rutherford <[email protected]>To: "Michael E. Mann" <[email protected]>Subject: Re: Soon & BaliunasDate: Wed, 12 Mar 2003 10:53:07 -0500Cc: Tom Crowley <[email protected]>, Phil Jones <[email protected]>, Malcolm Hughes <[email protected]>,
[email protected], [email protected], [email protected]
<x-rich>Dear All,
…Finally, Tom's suggestion of Eos struck me as a great way to get ashort, pointed story out to the most people (though I have no feel forthe international distribution). My sense (being relatively new tothis field compared to everyone else) is that within the neo- andmesoclimate research community there is a (relatively small?) group ofpeople who don't or won't "get it" and there is nothing we can doabout them aside from continuing to publish quality work in qualityjournals (or calling in a Mafia hit). Those (e.g. us) who areengrossed in the issues and are aware of all the literature should beable to distinguish between well done and poor work. Should then theintent of this proposed contribution be to education those who are notdirectly involved in MWP/LIA issues including those both on theperifery of the issue as well as those outside? If so, then the issuethat Phil raised about not letting it get buried is significant and Ithink Eos is a great way to get people to see it.
Cheers,Scott
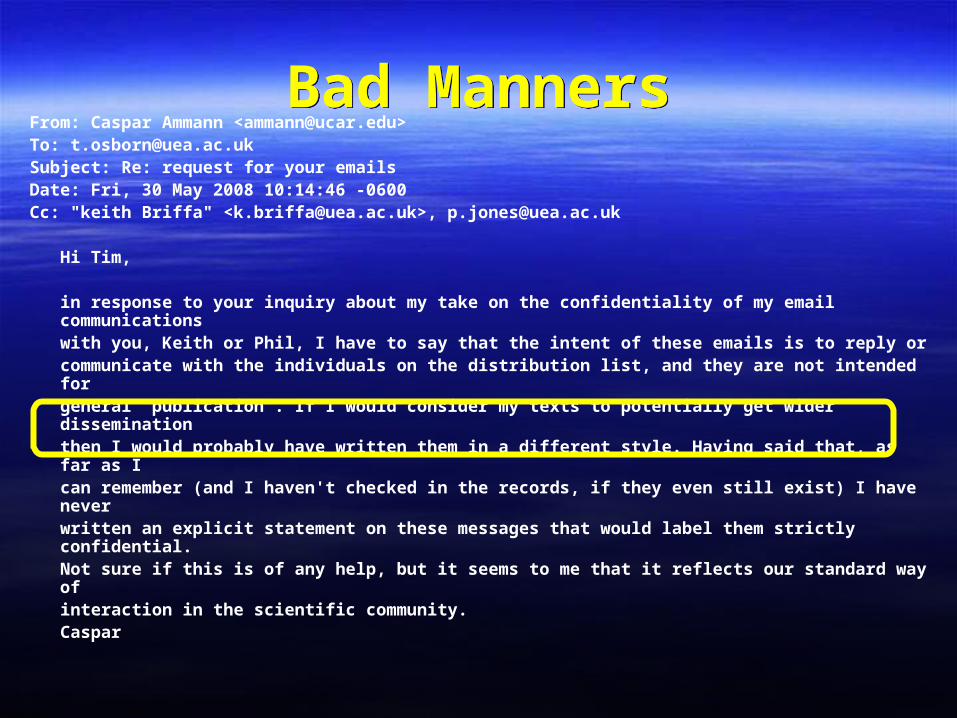
Bad MannersBad MannersFrom: Caspar Ammann <[email protected]>To: [email protected]: Re: request for your emailsDate: Fri, 30 May 2008 10:14:46 -0600Cc: "keith Briffa" <[email protected]>, [email protected]
Hi Tim,
in response to your inquiry about my take on the confidentiality of my email communications
with you, Keith or Phil, I have to say that the intent of these emails is to reply or communicate with the individuals on the distribution list, and they are not intended for general 'publication'. If I would consider my texts to potentially get wider dissemination then I would probably have written them in a different style. Having said that, as far as I can remember (and I haven't checked in the records, if they even still exist) I have never written an explicit statement on these messages that would label them strictly confidential. Not sure if this is of any help, but it seems to me that it reflects our standard way of interaction in the scientific community. Caspar
Responses/RebuttalsResponses/RebuttalsFrom Real Climate:
• “It is tempting to point fingers and declare that people should not have been so open with their thoughts, but who amongst us would really be happy to have all of their email made public?”
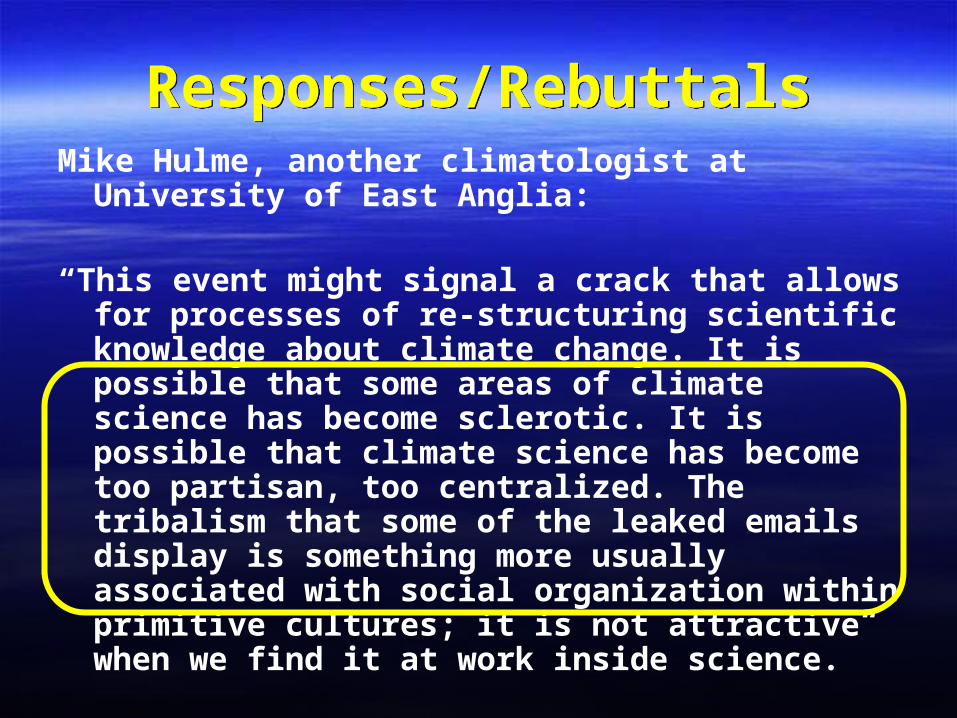
Responses/RebuttalsResponses/RebuttalsMike Hulme, another climatologist at University of East
Anglia:
“This event might signal a crack that allows for processes of re-structuring scientific knowledge about climate change. It is possible that some areas of climate science has become sclerotic. It is possible that climate science has become too partisan, too centralized. The tribalism that some of the leaked emails display is something more usually associated with social organization within primitive cultures; it is not attractive when we find it at work inside science.”

Climate Studies ResearchClimate Studies Research
NASA's Goddard Institute of Space Studies (GISS) National Oceanic and Atmospheric Administration
(NOAA) State of the Canadian Cryosphere (SOCC) Environmental Protection Agency (EPA) Royal Society of the United Kingdom (RS) American Geophysical Union (AGU) American Institute of Physics (AIP) National Center for Atmospheric Research
(NCAR) American Meteorological Society (AMS) Canadian Meteorological and Oceanographic
Society (CMOS

Gregor Mendel’s PeasGregor Mendel’s Peas
• Mendel was the founder of modern genetic inheritance
• His 1866 paper established the rules of inheritance for genetic traits
• Subsequent analysis revealed that his results were “too good,” with only 1 in 100,000 chance that his results could have been so close to the theoretical ratios by chance
Gregor Mendel’s PeasGregor Mendel’s Peas
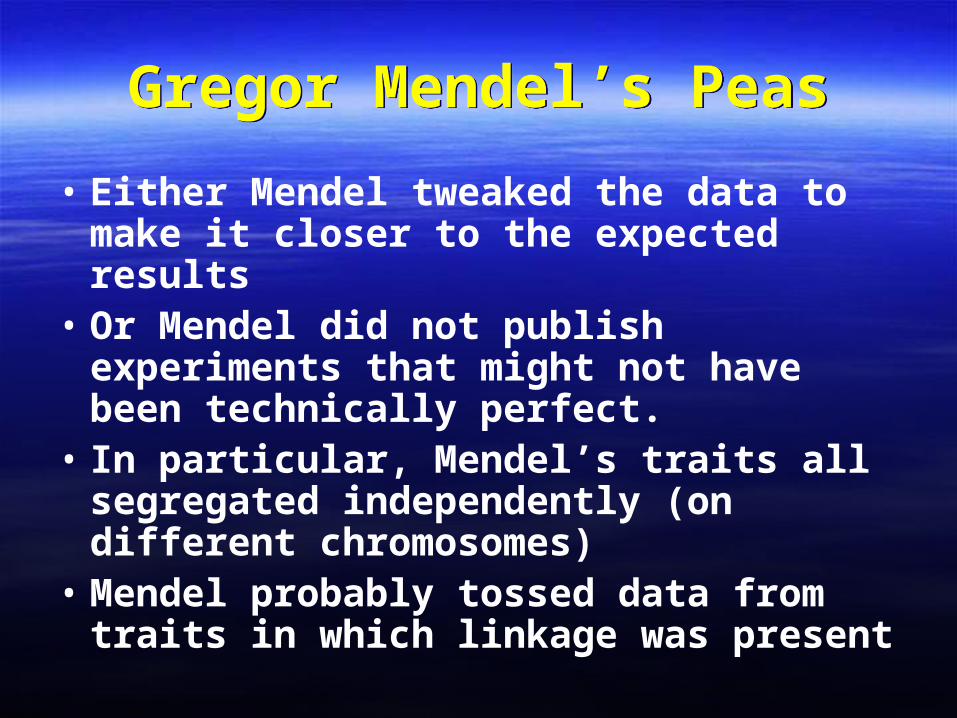
• Either Mendel tweaked the data to make it closer to the expected results
• Or Mendel did not publish experiments that might not have been technically perfect.
• In particular, Mendel’s traits all segregated independently (on different chromosomes)
• Mendel probably tossed data from traits in which linkage was present
ConclusionsConclusions
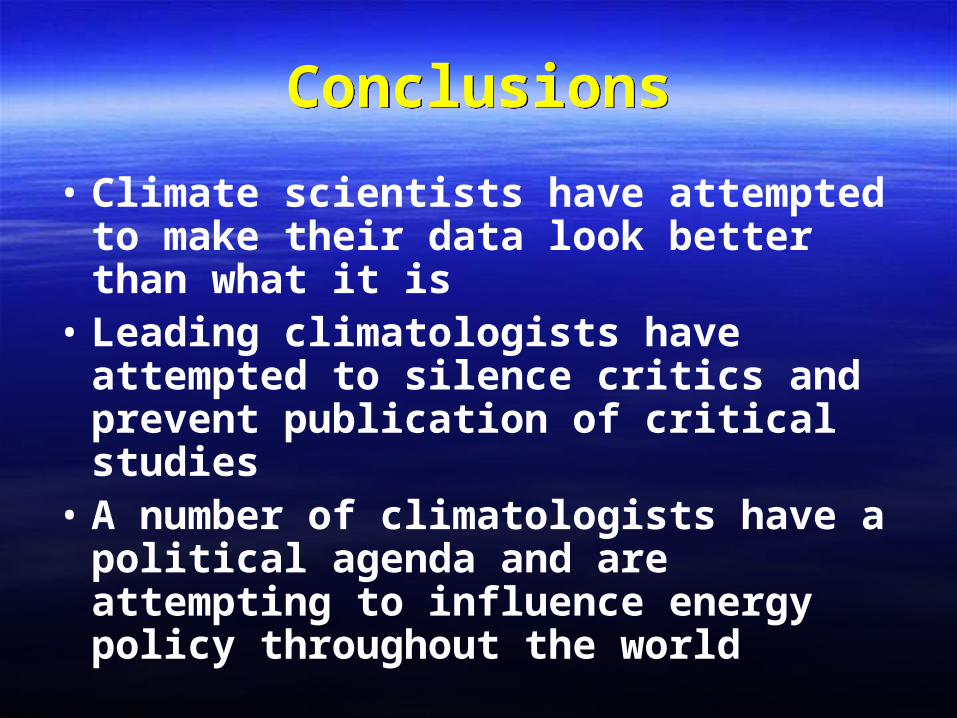
• Climate scientists have attempted to make their data look better than what it is
• Leading climatologists have attempted to silence critics and prevent publication of critical studies
• A number of climatologists have a political agenda and are attempting to influence energy policy throughout the world

Global Warming MythsGlobal Warming Myths

Global Warming Has Stopped?Global Warming Has Stopped?
-0.2
0.0
0.2
0.4
0.6
0.8
1975 1980 1985 1990 1995 2000 2005Year
M
ean
Tem
per
atu
re (
°C)
1365.2
1365.4
1365.6
1365.8
1366.0
1366.2
1366.4
1366.6
1366.8
So
lar
Irra
dia
nce
(W
/m2)
2010
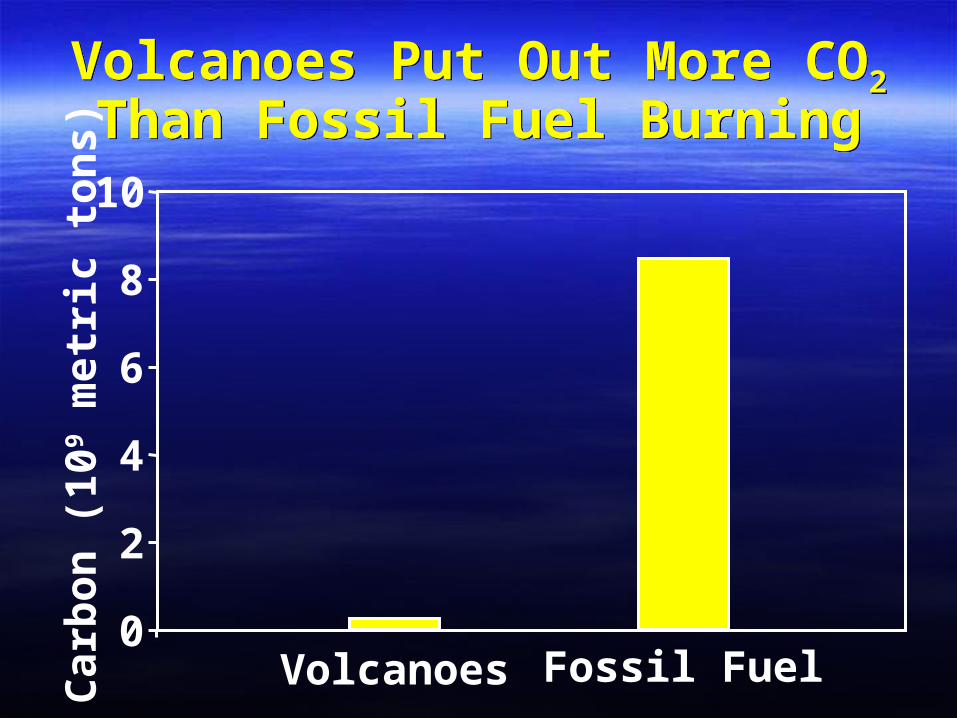
Volcanoes Put Out More CO2 Than Fossil Fuel Burning
Volcanoes Put Out More CO2 Than Fossil Fuel Burning
0
2
4
6
8
10
Car
bo
n (
109
met
ric
ton
s)
Fossil FuelVolcanoes

Global Warming is Caused by Sunspots
Global Warming is Caused by Sunspots
-0.6
-0.4
-0.2
0.0
0.2
0.4
0.6
0.8
1880 1900 1920 1940 1960 1980 2000Year
M
ean
Tem
per
atu
re (
°C)
0
50
100
150
200
250
Su
nsp
ots
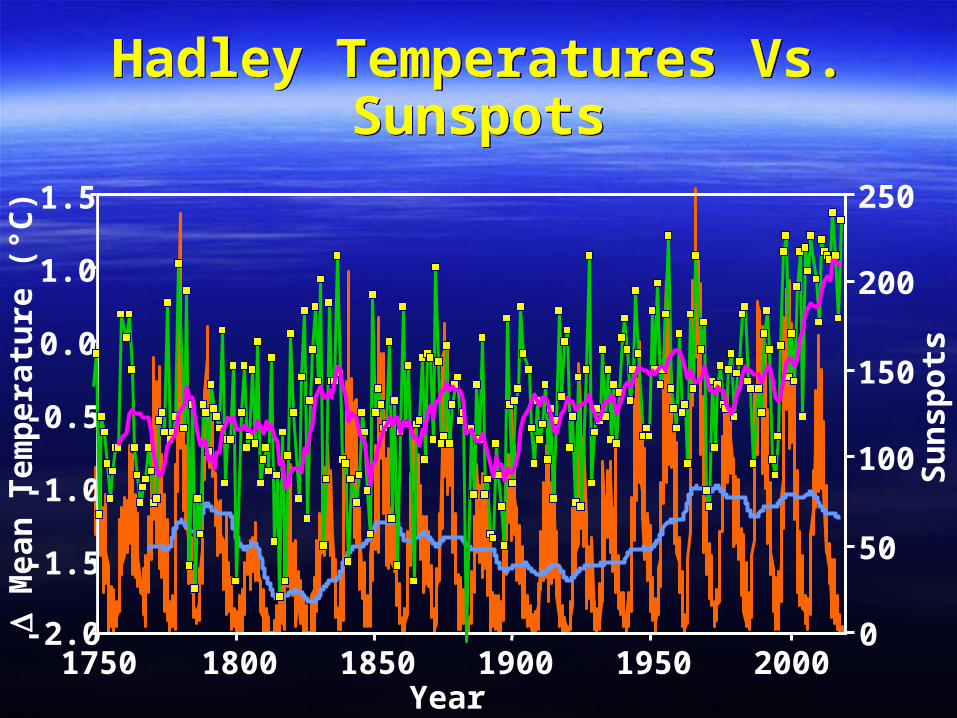
Hadley Temperatures Vs. Sunspots
Hadley Temperatures Vs. Sunspots
-2.0
-1.5
-1.0
-0.5
0.0
1.0
1.5
1750 1800 1850 1900 1950 2000Year
M
ean
Tem
per
atu
re (
°C)
0
50
100
150
200
250
Su
nsp
ots

Global Warming is Caused by GCR
Global Warming is Caused by GCR
-0.4
-0.2
0.0
0.2
0.4
0.6
0.8
1.0
1950 1960 1970 1980 1990 2000 2010Year
M
ean
Tem
per
atu
re (
°C)
3000
3200
3400
3600
3800
4000
4200
4400
4600
Gam
ma
Co
smic
Ray
s

CO2 Vs. Sea LevelCO2 Vs. Sea LevelCO2 Vs. TemperatureCO2 Vs. Temperature
0100000200000300000400000500000Time (ybp)
-120
-100
-80
-60
-40
-20
0
20
40
Re
lativ
e S
ea L
eve
l
180
200
220
240
260
280
300
320
CO
2 (
ppm
v)
-10
-8
-6
-4
-2
0
2
4
6
Te
mp
era
ture
Rohling et al. 2009. Antarctic temperature and global sea level closely coupled over the last five glacial cycles. Nature Geoscience 2:500.

-4.1 -4 -2 -1 -.5 -.2 .2 .5 1 2 4 4.1
Global Warming is Due to Urban Heat Islands
Global Warming is Due to Urban Heat Islands
2009 Temperature Changes Compared to 1951-1980
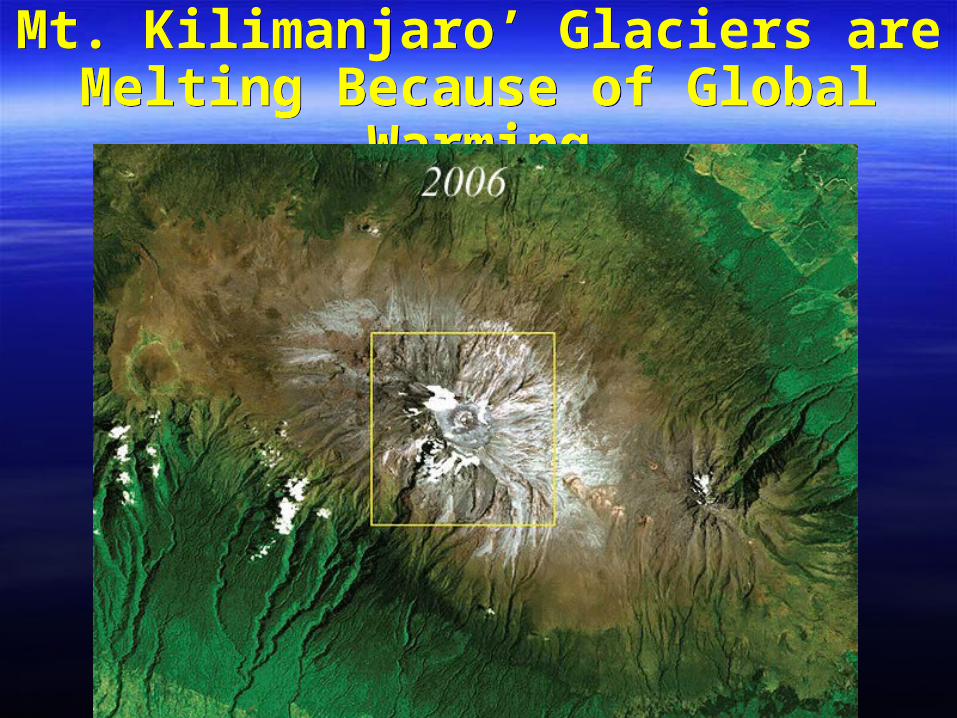
Mt. Kilimanjaro’ Glaciers are Melting Because of Global Warming
Mt. Kilimanjaro’ Glaciers are Melting Because of Global Warming
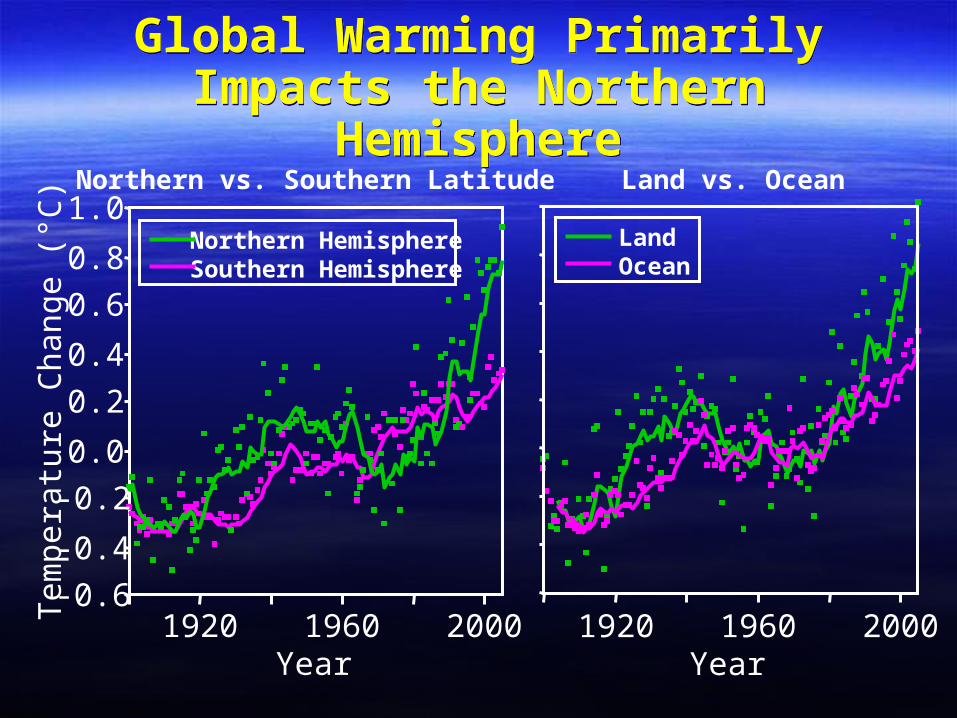
Global Warming Primarily Impacts the Northern Hemisphere
Global Warming Primarily Impacts the Northern Hemisphere
-0.6
-0.4
-0.2
0.0
0.2
0.4
0.6
0.8
1.0
1920 1960 2000Year
Tem
pera
ture
Cha
nge
(°C
)
Northern vs. Southern Latitude
Northern HemisphereSouthern Hemisphere
1920 1960 2000Year
Land vs. Ocean
LandOcean

Sea Levels Will Rise 5-6 ft?Sea Levels Will Rise 5-6 ft?
• Present rate is 1.8 ± 0.3 mm/yr (7.4 in/century)
• Accelerating at a rate of 0.013 ± 0.006 mm/yr2
• If acceleration continues, could result in 12 in/century sea level rise
• Scenarios claiming 1 meter or more rise are unrealistic
• Recently, the California State Lands Commission said that sea levels could rise 55 inches this century, inundating ports
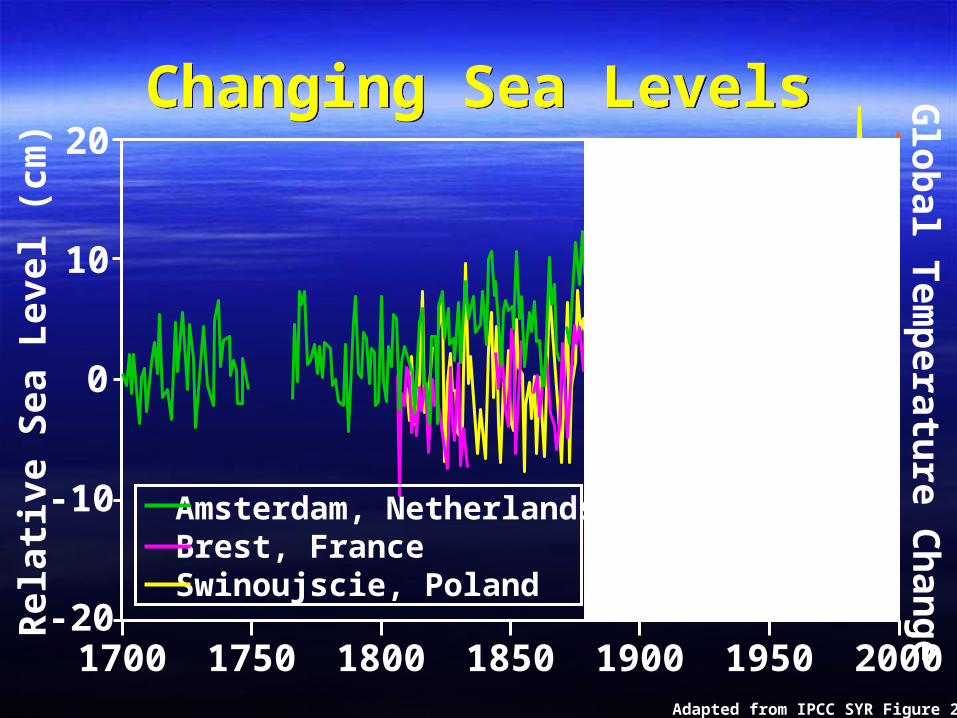
Changing Sea LevelsChanging Sea Levels
1700 1750 1800 1850 1900 1950 2000-20
-10
0
10
20
Rel
ativ
e S
ea L
evel
(cm
)
Adapted from IPCC SYR Figure 2-5
Amsterdam, NetherlandsBrest, FranceSwinoujscie, Poland
Glo
bal T
emp
erature C
han
ge

How Much Temperature Increase?
How Much Temperature Increase?
• Global warming alarmists propose up to 9°C increase this century
• Two studies put the minimum at 1.5°C and maximum at 4.5°C or 6.2°C
• Another study puts the minimum at 2.5°C

Predictions Vs. RealityPredictions Vs. RealityT
(°C
)
1.5
1.0
0.5
0
-0.4
Date1960 1970 1980 1990 2000 2010 2019
Annual Mean Global Temperature Change
OBSERVEDSCENARIO ASCENARIO BSCENARIO C
Hansen, J. 1988. Journal Of Geophysical Research 93:9241.
Exponential Increase in carbon emissionsExponential Increase in carbon emissions
Moderate reduction in carbon emissionsModerate reduction in carbon emissions
Drastic reduction in carbon emissionsDrastic reduction in carbon emissions
Observed temps through 1988Observed temps through 1988

Temperature ExtrapolationTemperature ExtrapolationT
(°C
)1.5
1.0
0.5
0
-0.4
Date1980 2000 2020 2040 2060 2080 2100
2.5
2.0
1960

ConclusionsConclusions
• Global warming is occurring
• The majority of the warming is probably due to human activity
• Some warming is probably due to cyclical solar/orbital variation