clothes dryer automatic termination sensor … clothes dryer automatic termination sensor evaluation...
TRANSCRIPT

Clothes Dryer Automatic Termination Sensor Evaluation Volume 1: Characterization of Energy Use in Residential Clothes Dryers
September 2014
W TeGrotenhuis, Ph.D.
PNNL-23621

PNNL-23621
Clothes Dryer Automatic Termination Sensor Evaluation Volume 1: Characterization of Energy Use in Residential Clothes Dryers
W TeGrotenhuis, Ph.D. September 2014 Prepared for the U.S. Department of Energy under Contract DE-AC05-76RL01830 Pacific Northwest National Laboratory Richland, Washington 99352


Executive Summary
The U.S. Department of Energy’s (DOE) test procedure for clothes dryers (10 CFR Part 430 Subpart B, Appendix D1) (D1 procedure) requires manually stopping the drying cycle when the clothes reach between 5% and 2% remaining moisture content (RMC). Today, many dryers have automatic termination controls that determine when to end the cycle when the load is dry, but the automatic termination features are not accurately accounted for in the efficiency measurements that are required for use to certify products for the U.S. market. In August 2013, DOE published a Final Rule that appended a new optional test procedure in 10 CFR 430 subpart B, Appendix D2 (D2 procedure) that calls for automatic termination cycles to run to end-of-cycle. With the D2 procedure, whether a dryer meets efficiency standards depends in part on the efficacy of its sensors and controls at detecting when a load is dry. However, prior testing of automatic termination controls has shown that dryers may be over-drying loads, and thus significantly affecting efficiency. Four residential clothes dryers currently available on the market were tested in order to evaluate their efficiency and the effectiveness of current automatic termination sensors and control strategies using the new D2 procedure.
The measured energy factor (EF) for each of the 4 dryers tested—two standard electrics, one compact electric, and a standard gas dryer—using the current D1 procedure and new D2 procedure were compared to the energy conservation standards for clothes dryers that will be required on January 1, 2015.1 The EF is based on the active mode drying cycle energy use, whereas the standards apply to the combined energy factor (CEF) that includes standby and off-mode energy use. Because the CEF of a dryer is less than the EF, it is necessary but not sufficient that the EF exceed the minimum CEF for a dryer to meet the DOE energy conservation standards. None of the 4 dryers tested achieved an EF that would allow them to meet the January 2015 CEF standards using the new D2 procedure, while all of them met the requirements with the current D1 procedure.
Tests were performed with the dryers sitting on a platform scale that provided a real-time measure of the RMC, which was used to determine how much energy was consumed after the clothes were dry (defined as less than 2% RMC for DOE test load, less than 5% RMC for Association of Home Appliance Manufacturers (AHAM) test loads). On average for the four dryers tested, in excess of 20% of the total energy was consumed after the clothes were dry during the D2 procedure tests using the DOE test load. Further, results show that if 20% to 84% of this excess energy was saved, then the three electric dryers would have EF values that exceed the January 2015 CEF standards levels when tested using the D2 procedure. However, for the standard gas dryer tested, saving all of the energy associated with over drying would not be sufficient for the dryer to meet the 2015 CEF standard and additional efficiency improvements are needed. Additional testing with two AHAM test loads and analyses of energy breakdown provide additional insights. It is concluded from the results that it is feasible for clothes dryers to improve efficiency with advances in moisture detection and automatic termination algorithms.
An investigation of a new automatic termination algorithm that uses a low-cost humidity sensor located in the dryer exhaust is reported in Volume 2 of this report. The concept was demonstrated using a
1 The appendix D1 test procedure will be required for compliance with the January 1, 2015 energy conservation standards. The optional appendix D2 test procedure may be used early to show compliance with the January 1, 2015 standards.
iii

standard electric vented dryer and a standard gas dryer. The new algorithm stopped the cycles earlier than the dryer’s existing termination algorithms in 9 of 16 tests, saving between 5 and 24% of energy use.
iv

Acknowledgements
Many thanks to those who contributed to accomplishing the work reported in this document. Richard Pratt with assistance from Nicole Stanton led the effort to acquire data from the existing sensors; procure and install the humidity sensors; and accomplish other electrical engineering tasks such as installing power supplies to stabilize voltage. Vinh Nguyen performed the majority of the dryer testing with assistance from Kevin Gervais and Jacob Fricke. Austin Winkelman, Gregory Carter, Randal Berg, and Dave Winiarski helped to establish the testing facility and install all the necessary equipment and services to perform testing according to the DOE test procedures. Dustin Caldwell and Jair Lizarazo-Adarme created the data acquisition and control system and implement the new automatic termination algorithm. Dennis Stiles and Dale King provided programmatic support. Also, thanks to James Battaglia and Constantin von Wentzel of Navigant for their helpful consultation and recommendations of low-cost humidity sensors.
v


Contents
Executive Summary .......................................................................................................................... iii Acknowledgements ............................................................................................................................. v 1.0 Introduction ............................................................................................................................. 1.1
1.1 Objectives ........................................................................................................................ 1.1 1.2 Background ..................................................................................................................... 1.1 1.3 Test Procedures ............................................................................................................... 1.2
2.0 Summary of Results................................................................................................................. 2.1 2.1 Drying Time, Energy Factor, and Final Remaining Moisture Content ........................... 2.1 2.2 Energy Consumption from Over Drying ......................................................................... 2.4 2.3 Energy Breakdown of the Automatic Termination Cycles ............................................. 2.9
3.0 Test Procedures........................................................................................................................ 3.1 3.1 Installation (Section 2.1 of Appendix D2) ...................................................................... 3.1 3.2 Test Clothes (Section 2.6 of Appendix D2) .................................................................... 3.7 3.3 Test Loads (Section 2.7 of Appendix D2) ....................................................................... 3.7 3.4 Dryer Pre-conditioning (Section 2.8 of Appendix D2) ................................................... 3.8 3.5 Test Procedure (Section 3 of Appendix D2) ................................................................... 3.9 3.6 Data Recording (Section 3.4 of Appendix D2) ............................................................... 3.9 3.7 Remaining Moisture Content (RMC) ............................................................................ 3.10
4.0 References ............................................................................................................................... 4.1
vii

Figures
2.1. Summary of EF results for the 4 dryers using the 3 test loads with high temperature (left) and medium temperature (right) setting ................................................................................... 2.4
2.2. Summary of final RMC results for the 4 dryers using the 3 test loads with high temperature (left) and medium temperature (right) settings ........................................................................ 2.4
2.3. Cumulative energy consumption and the RMC curve calculated from the weight of the dryer along with a trend-line fit to a 5th order polynomial (Poly.) for a test with Test Unit 1 with the AHAM 1992 load on COTTONS and high temperature settings ...................................... 2.5
2.4. Results from analyses of D2 procedure results using DOE test loads ..................................... 2.8 2.5. Comparison of energy consumed after the test load reaches 5% RMC as a percentage of total
energy consumed by the cycle ................................................................................................. 2.8 2.6. Example of warm-up, bulk dry, and high heat (combined with cool down) stages of an
automatic termination cycle from testing of Test Unit 1 with the AHAM 1992 load on COTTONS and high temperature settings ............................................................................... 2.9
2.7. Summary of the energy breakdown analyses from Table 2.4 ................................................ 2.12 3.1. Back of the Test Unit 1 with exhaust simulator installed ........................................................ 3.1 3.2. Environmental chamber used for dryer testing ........................................................................ 3.2 3.3. Variac used for modulating voltage ......................................................................................... 3.5 3.4. Power load banks for stabilizing power voltage ...................................................................... 3.6 3.5. Sample voltage trace from a D2 procedure test using Test Unit 2........................................... 3.6 3.6. Natural gas supply set-up from a compressed gas cylinder ..................................................... 3.7 3.7. LG washing machine and Spinex machines for spinning test loads to less than 57.5%
RMC ........................................................................................................................................ 3.8
Tables
1.1. Control panel settings used for performing the D2 procedure tests ......................................... 1.4 2.1. Summary of test results for the Test Unit 1 including averages, standard deviation (SD), and
standard deviation as a percent of the average (%SD) of the drying time, final RMC, and EF ............................................................................................................................................. 2.1
2.2. Summary of test results for the other three dryers including drying time, final RMC, and EF ............................................................................................................................................. 2.3
2.3. Amount of energy used after the test load is dried to 5% RMC and 2% RMC as a percentage of the total energy consumed ................................................................................................... 2.7
2.4. Compilation of the energy breakdown between the warm-up, bulk dry, and high heat stages of the automatic termination cycles ....................................................................................... 2.11
3.1. Compilation of test conditions for each D2 and D1 procedure test, including minimum and maximum chamber temperature, relative humidity and voltage .............................................. 3.3
viii

1.0 Introduction
1.1 Objectives
The U.S. Department of Energy (DOE) rulemaking activities [1,2] have included efforts to update and revise test procedures for determining energy efficiency of residential clothes dryers. One of the objectives of this work is to assess how a remaining moisture content (RMC) 1 level of 5% that is acceptable to consumers drying laundry loads under real-world conditions (i.e., with laundry loads of varying weights, composition, and size) translates to the final RMC measured with the DOE test load under the test conditions specified in the test procedures of Appendices D1 and D2 of Subpart B of 10 CFR Part 430 [3]. Relating the final RMC of the DOE test loads to the final RMC of real-world test loads is necessary for setting appropriate requirements for final RMC level in the test procedure. Currently, in Appendix D2 to Subpart B of 10 CFR Part 430, DOE has adopted a final RMC of 2% for the DOE test loads to represent 5% final RMC under real-world conditions.
The Appendix D2 test procedure (D2 procedure) incorporates methods for more accurately measuring the effects of automatic termination, which was proposed by DOE as more representative of actual consumer use, and so that measured energy efficiencies include the efficacy of sensors and algorithms at stopping cycles when the clothes are dry but without over-drying.
The context is the desire for DOE to identify efficiency standards for residential clothes dryers that account for the effectiveness of automatic cycle termination. DOE determined through information received from the industry and through dryer testing that the uniformity and composition of the DOE test loads cause them to be dried to a lower final RMC than real-world test loads having more varied clothes weights, compositions, and sizes. However, the reproducibility of testing with the DOE test loads makes them preferable to other standard loads that may be more representative of real-world conditions.
The results and analyses in Volume 1 of this report are from testing of 4 commercially-available residential clothes dryers using the D1 and D2 procedures. The objective is to determine the extent of over-drying and the opportunity for energy savings. Volume 2 contains results from an investigation of a new automatic termination algorithm that uses a low-cost humidity sensor located in the dryer exhaust. The concept was demonstrated using a standard electric vented dryer and a standard gas dryer. Overall, the new algorithm stopped the cycles earlier than the dryer’s existing termination algorithms in 9 of 16 tests, saving between 5 and 24% of energy use.
1.2 Background
Historically, clothes dryer efficiency standards have focused on the bulk drying phase by manually terminating tests when the DOE test load reaches between 5% and 2.5% RMC before entering the cool down phase [1]. Test procedures for measuring dryer energy factor (EF) have applied a field-use factor to account for the additional energy used after the end of the test to the end-of-cycle. Many dryer models
1 Remaining moisture content (RMC)— weight of moisture in the clothes as a percent of the bone dry weight of the clothes—is the metric used to determine the dryness of a dryer load. A final RMC of 5% is used to represent the level acceptable in real-world conditions with loads of varying size and composition. The current D1 procedure requires manually stopping a cycle with the final RMC between 5 and 2.5%. The new D2 procedure runs automatic cycles to end-of-cycle and requires the final RMC to be below 2% to compensate for the DOE test load.
1.1

have automatic termination cycles that use sensors to determine when to stop the cycle based on load dryness. These sensors are typically thermistors measuring air temperature entering or leaving the drum or contact moisture sensors. Contact moisture sensors detect the moisture content of cloth touching the sensor. During the high-heat phase—after the bulk drying phase and before the cool down phase—of automatic termination cycles, the dryer controls determine when the load is dry and when to end the cycle. Currently, applying a constant field-use factor, rather than testing to the end-of-cycle, does not allow measured energy efficiency to be impacted by the effectiveness of the termination controls, so over-drying does not affect the measured EF.
The efficacy of a dryer’s control program at determining when the load is dry impacts consumer experience in addition to the energy efficiency of the appliance. If the cycle ends too soon, the user experiences a partially wet load and may choose to not use automatic cycle settings, which could lead to higher energy consumption. Although not necessarily perceived by the consumer, if the control program prolongs the cycle and the load continues to be heated, energy is expended unnecessarily.
The DOE issued a Final Rule on August 14, 2013 [2] that included a new optional procedure for clothes dryer testing (Appendix D2 of 10 CFR 430 subpart B) [3]. The new procedure specifies using automatic termination settings if available, and running the cycle to the end-of-cycle. This includes the energy consumed by the dryer after the load reaches 2% RMC until the end-of-cycle in the EF calculation. Because the existing D1 procedure applies a field-use factor of 1.04 for dryers equipped with automatic termination, if the extra energy exceeds 4% of the energy used during the existing D1 tests, EFs will be lower with the revised procedure.
Energy consumed by the heaters and motor after a load is dry represents inefficiency and an opportunity for energy savings. Past dryer testing has shown extensive over-drying of DOE test loads [1]. Test data have shown that energy consumption can be 11–72% greater than that required to dry a DOE load to 5% RMC, and 4–62% greater than that required to reach 2% RMC [1]. Therefore, dryers currently on the market typically consume more than 4% of the energy after the load is dry, indicating the EFs are lower with the revised test procedure that allows automatic termination cycles to run to end-of-cycle.
Both the magnitude and variability of the extra energy consumption imply a significant opportunity for improving the energy efficiency of residential clothes dryers in the U.S. By transitioning to a test procedure that accounts for all of the energy used during the automatic termination cycle, such as the new D2 procedure, manufacturers would be incentivized to improve their automatic termination cycles.
1.3 Test Procedures
A series of tests were performed on commercially available residential clothes dryers following the two test procedures prescribed in Appendix D1 and Appendix D2 of Subpart B of 10 CFR Part 430 [3]. The Appendix D1 test procedure was issued in the January 6, 2011 Final Rule [4], amended in the August 14, 2013 Final Rule [2], and is required for compliance beginning on January 1, 2015. The Appendix D2 test procedure was added in the August 14, 2013 Final Rule [2]. The D2 procedure is currently optional and may be used early to show compliance with the January 1, 2015 energy conservation standard for residential clothes dryers.
1.2

DOE energy conservation standards for residential clothes dryers require meeting the minimum CEF which includes the EF and standby and off-mode energy use. The focus of this work was on energy consumption during drying cycles with different test loads and dryer settings, so standby and off-mode energy use were not measured and results are reported for EF only. The CEF of a dryer is less than the EF, so it is necessary but not sufficient that the EF exceed the minimum CEF for a dryer to meet DOE energy conservation standards. This is relevant when EF results are compared to 2015 CEF standards below.
Four dryers were selected for testing, including 2 standard vented electric dryers, 1 compact vented electric dryer, and 1 standard vented gas dryer. Test Unit 1 was a 7.0-cubic-foot vented front-load dryer with automatic cycle settings that allow for a choice of 17 cycles. The dryer was equipped with dual thermistor sensors and a contact moisture sensor located at the front of the drying compartment near the door. Test Unit 2 was a 7.5-cubic-foot vented front-load dryer with multiple options for automatic cycles, and was also equipped with two thermistors and sensor bars for moisture detection located at a fixed location at ther front of the drying compartment. Test Unit 3 was a 3.7-cubic-foot vented front-load compact dryer with 6 choices for automatic drying cycles. Unit 3 was equipped with two thermistors and a contact moisture sensor located inside the drum on one of the vanes, and had the feature of periodically reversing the direction of drum rotation during a cycle. Test Unit 4 was a 7.3-cubic-foot front-load gas dryer with 10 selections for sensor dry cycles and additional adjustable temperature, dryness, and other settings. Unit 4 was equipped with one thermistor and a contact moisture located at a fixed location in the drying compartment.
Testing was performed with the standard DOE test loads [3], the Association of Home Appliance Manufacturers (AHAM) Standard HLD-1-2009 test loads (AHAM 2009) [5], and the AHAM Standard HLD-1-1992 test loads (AHAM 1992) [6]. The DOE load is very uniform consisting of a single cloth type composed of 50/50 cotton and polyester and of uniform cloth ply and dimensions. The AHAM 2009 load is a mixture of cotton bed sheets, pillow cases, and towels, which are more varied in cloth ply and a larger range of cloth sizes. The AHAM 1992 load is the most varied in cloth size and composition and is more similar to typical laundry because it uses items of actual clothing with different fabrics and varying thicknesses. Dryer settings were selected following the D2 procedure, which prescribes Cottons or Normal cycle setting at the highest temperature setting and normal dryness level. If the final RMC was greater than 2% for the DOE loads or greater than 5% for the AHAM loads, then the test was rerun at the highest dryness setting. Additional tests were performed using the medium temperature settings. The actual dryer settings used are summarized in Table 1.1. The scope included performing 3 replicate tests at the same conditions for some of the tests in order to evaluate reproducibility of the results.
Additional data not prescribed by the D1 or D2 procedure were measured and recorded during testing. Power consumption, supply voltage, exhaust temperature and humidity, and ambient temperature and humidity were all recorded at 1-second intervals by a data acquisition system. The dryers were placed on a platform scale, and the weight recorded during each test to calculate the instantaneous RMC of the load. The scale data provided information on the RMC of the load during the cycle, in addition to the initial and final RMC obtained from weighing just the load, as prescribed in the D1 and D2 procedures. The scale data enabled analyses of energy consumption including determining the amount of energy consumed after the load was dry.
Section 2.0 summarizes the results from the testing and subsequent analysis. Insights from the results provide the foundation for the subsequent tasks that will begin to evaluate the state-of-the-art and
1.3

potential for improving automatic termination of clothes dryer cycles. Section 3.0 provides details of the test equipment, methods and procedures used in following the D1 and D2 procedures.
Table 1.1. Control panel settings used for performing the D2 procedure tests. The dryness setting was changed to the highest setting when the normal setting did not achieve the required final RMC.
Test Unit
Dryer Cycle Setting Temp. Setting
Dryness Setting
1 Vented Electric Standard Dryer COTTONS HIGH NORMAL COTTONS MEDIUM NORMAL
2 Vented Electric Standard Dryer NORMAL HIGH NORMAL NORMAL MEDIUM NORMAL
3 Vented Electric Compact (240V) Dryer 1,2
NORMAL TURBO NORMAL
NORMAL FULL LOAD NORMAL 4 Vented Gas Dryer3 HEAVY DUTY HIGH NORMAL COTTONS/NORMAL MEDIUM NORMAL
1 Test Unit 3 can be operated with 208V or 240V power, but review of wiring schematics indicates that all electric components operate with only one 120V leg, so both voltage configurations are functionally identical. 2 Per the Operating Manual for Test Unit 3, the higher temperature setting is labeled TURBO and the medium temperature setting is FULL LOAD. 3 The temperature setting of Test Unit 4 could not be adjusted independent of the cycle setting.
1.4

2.0 Summary of Results
The dryer testing results are provided in this section, with additional details regarding the testing protocols in Section3.0. In addition to EF, final RMC, and drying time, results are included that break down energy use into the different stages of the drying cycle, as well as the amount of energy that was consumed after the loads were dry—when the RMC was below either 2% or 5%, depending on load type. This information represents the opportunity for saving energy, as well as a measure of the challenge of saving enough energy to meet the January 2015 energy conservation standards using the D2 procedure.
2.1 Drying Time, Energy Factor, and Final Remaining Moisture Content
Results for Test Unit 1 are summarized in Table 2.1. Replicate tests were performed with this dryer for both the D2 and D1 procedures, in order to analyze repeatability. Repeatability was good for the EF, which had 2% to 4% standard deviations with all test loads and both procedures. There is a trend of lower EF repeatability when the load composition becomes less uniform with the AHAM 2009 and 1992 loads (noted in the table as A2009 and A1992, respectively). This is consistent with the industry desire to keep the DOE test load for better repeatability in testing dryer compliance with efficiency standards [1]. Drying time also has good repeatability and the same trend toward higher variability with the AHAM loads.
The final RMC at the end-of-cycle is consistently below the requirement for dryness in all of the D2 procedure tests (<2% RMC for the DOE load, <5% RMC for the AHAM load). There is a trend toward higher final RMC with the more assorted AHAM loads. Variability is higher for final RMC than the other metrics, particularly with the AHAM 1992 load, but this is predominantly due to the low moisture content—variability around zero will give high percent variability. The test data indicate that the DOE load dries to well below 2% RMC and the AHAM loads to well below 5% RMC on the high temperature setting.
Table 2.1. Summary of test results for the Test Unit 1 including averages, standard deviation (SD), and standard deviation as a percent of the average (%SD) of the drying time, final RMC, and EF. Tests were performed using the D2 and D1 procedures.
Test Test Load
Temp Setting
#Tests Drying time (minutes)
Final RMC (%)
EF (lbs/kWh)
Avg SD %SD Avg SD %SD Avg SD %SD
D2 DOE High 3 39.7 0.43 1% 0.58 0.09 16% 3.22 0.05 2%
D2 DOE Medium 1 37.6 0.50 3.41
D2 A2009 High 3 40.2 1.28 3% 0.74 0.05 6% 3.03 0.08 3%
D2 A2009 medium 1 38.9 0.92 3.18
D2 A1992 High 3 36.6 2.02 6% 1.53 0.87 57% 3.27 0.13 4%
D2 A1992 medium 1 36.0 2.38 3.36
D1 DOE High 3 23.0 0.25 1% 3.76 1.02 27% 3.99 0.06 2%
2.1

Table 2.2 summarizes results for the D1 and D2 procedures for the other three dryers where only one test was performed for each test load at each setting. All of the dryers achieved high enough EF levels with the D1 procedure to likely meet the 2015 CEF standards1, even though CEF for a given dryer is lower than EF due to the inclusion of standby and off-mode energy use in the CEF metric. EF data from the D2 procedure are summarized in Figure 2.1 for all four dryers and all three loads. The 2015 CEF standards are also included for comparison with results for the DOE test load on high temperature setting in order to show that none of the dryers can meet the 2015 CEF standards with the D2 procedure (i.e., the measured EF values, even without the inclusion of standby and off mode energy consumption, were already below the 2015 CEF standard levels). There is also no consistent trend that the DOE load gives higher EFs than the other loads, albeit the DOE load must be dried to at least 2% RMC while the other loads were considered dry at 5% RMC. While the final RMC that is required for a valid test is different between the loads, the dryers are allowed to run normally to the end-of-cycle using the same settings for all loads. The different levels of dryness only become relevant when a load does not reach the required final RMC for that load, in which case, the load is rerun on the highest dryness setting. The only case where this occurred was with Test Unit 3 on the medium temperature setting using the AHAM 1992 load.
1 2015 CEF standards for the clothes dryer product classes tested are 3.73 lbs/kWh for vented electric, standard (4.4 ft3 or greater capacity), 3.27 lbs/kWh for Vented Electric, Compact (240V) (less than 4.4 ft3 capacity), and 3.30 lbs/kWh for vented gas. The EF and CEF metrics are not directly comparable because the CEF metric includes standby and off-mode energy use whereas the EF metric does not.
2.2

Table 2.2. Summary of test results for the other three dryers including drying time, final RMC, and EF.
Dryer Test Test Load Temp Setting
Drying time (mins)
RMC (%)
EF (lbs/kWh)
Test Unit 2
D2 DOE high 37.34 0.47 3.41
D2 DOE medium 34.25 0.47 3.63
D2 AHAM 2009 high 35.91 0.86 3.34
D2 AHAM 2009 medium 35.52 2.25 3.45
D2 AHAM 1992 high 36.85 1.66 3.23
D2 AHAM 1992 medium 35.52 4.85 3.66
D1 DOE high 23.10 4.41 4.01
Test Unit 3
D2 DOE turbo 33.20 0.62 3.19
D2 DOE full load 36.80 0.59 2.96
D2 AHAM 2009 turbo 35.97 1.98 2.56
D2 AHAM 2009 full load 35.63 3.10 3.06
D2 AHAM 1992 turbo 33.22 4.94 2.83
D2 AHAM 1992 full load1 45.08 1.26 2.26
D1 DOE turbo 29.45 3.38 3.69
Test Unit 4
D2 DOE high 38.77 0.58 2.54
D2 DOE medium 35.45 0.78 2.79
D2 AHAM 2009 high 37.67 0.73 2.49
D2 AHAM 2009 medium 36.25 1.31 2.64
D2 AHAM 1992 high 41.27 0.81 2.38
D2 AHAM 1992 medium 33.03 2.79 2.86
D1 DOE high 21.93 2.59 3.35 1AHAM 1992 test load did not dry to less than 5% RMC with Test Unit 3 set on medium (FULL LOAD) temperature and normal dryness settings. Per the D2 procedure instructions, the test was rerun on the highest dryness setting, EXTRA DRYNESS.
2.3

Figure 2.1. Summary of EF results for the 4 dryers using the 3 test loads with high temperature (left) and
medium temperature (right) settings. The 2015 CEF standards are included for comparison. 1Note: The AHAM 1992 test with Test Unit 3 on medium temperature setting was rerun with Extra Dryness setting.
All 4 of the dryers consistently dried the DOE load to well below 1% RMC, as shown in Figure 2.2. In addition, 3 of the 4 dryers consistently dried the AHAM loads well below 5% RMC with the D2 procedure, which specifies the high temperature setting. The exception is Test Unit 3, which barely reached 5% RMC. Using the medium temperature setting, the DOE load was still over dried. Higher final RMC levels were obtained with the other loads on medium temperature settings, indicating less over-drying in those cases. Test Unit 2 barely made 5% RMC on medium, while Test Unit 3 did not reach 5% and had to be rerun on the highest dryness setting. Note that Test Unit 3 had the moisture sensor on one of the drum vanes, where the sampling of clothes for moisture content is likely to be more reliable than when the moisture sensor is located at a fixed location at the front or rear of the drum enclosure.
Figure 2.2. Summary of final RMC results for the 4 dryers using the 3 test loads with high temperature
(left) and medium temperature (right) settings. 1Note: AHAM 1992 test with Test Unit 3 on medium temperature setting ws rerun with Extra Dryness setting.
2.2 Energy Consumption from Over Drying
The dryers were placed on a platform scale, with weight recorded every second during the drying cycles. The scale weight was used to calculate the RMC of the test load. The raw signal was noisy because of the rotation of the drum and agitation of the load, so the data acquisition system maintained a 30-second running average of the weight, which is the value that was recorded and used for calculating
2.4

RMC. An example of RMC data is shown in Figure 2.3. Even with the running average, the data are noisy, so a fifth order polynomial equation was fit to the data. The curve fit was used to identify the approximate time in the cycle when the load reached 5% and 2% RMC, as indicated by vertical lines in Figure 2.3.
Cumulative energy consumption was calculated by integrating the power data that were also recorded every second. An energy consumption curve is shown in Figure 2.3. The energy consumed after the load was dry (i.e., after RMC curve reached 5% or 2% RMC) is excess energy that represents potential for energy savings by better equipping the dryers to detect when the clothes are dry. The excess energy is all of the energy consumed after the vertical lines cross the energy consumption curves in Figure 2.3.
Figure 2.3. Cumulative energy consumption and the RMC curve calculated from the weight of the dryer
along with a trend-line fit to a 5th order polynomial (Poly.) for a test with Test Unit 1 with the AHAM 1992 load on COTTONS and high temperature settings. Vertical lines indicate where the RMC trend-line crosses 5% RMC and 2% RMC.
The excess energy consumed in over drying the test loads is compiled in Table 2.3. Averages are provided for the cases where duplicate tests were performed with the same test load and dryer settings (Test Unit 1, a standard, vented dryer on high temperature setting). Percentages of the total cycle energy that was consumed after the loads were dry are reported, and the amount of that over drying energy would need to be saved for the EF to equal the 2015 CEF standards. As discussed above, because the CEF of a dryer is less than the EF, it is necessary but not sufficient that the EF exceed the minimum CEF for a dryer to meet the DOE energy conservation standards. In addition, the EFs that would be achieved if all of the over drying energy were saved are also included in Table 2.3. Tests where the RMC curve did not reach 5% or 2% RMC according to the scale measurements are left blank in Table 2.3. This can occur even when the RMC based on the measured final weight of the load indicates the load had reached 5% or 2%, which is attributed to errors in the scale measurements. In addition, discrepancies between the RMC from the scale measurements and the RMC obtained from the measured final load weight can lead to
2.5

projections of energy savings even when the final RMC is above 5% or 2%, as in the case of Test Unit 1 with the AHAM 1992 load on medium temperature setting and Test Unit 3 with the AHAM 2009 load on the full load temperature setting that required the highest dryness setting to meet the D2 procedure requirement for final RMC.
Figure 2.4 focuses on the D2 procedure that defines 2% RMC in the DOE test load as a dry load. The D2 procedure also instructs that the high temperature setting be used. Figure 2.4 shows that the 2015 CEF standards can probably be met with the electric dryers if energy currently used in over-drying the loads were saved. The bar chart on the left shows that the current EF is below the CEF standards, but the maximum EF is greater than the CEF standards. This is not true for Test Unit 4, the standard gas dryer, where the maximum EF is slightly lower than the 2015 CEF standard for gas dryers.
The relative difficulty of achieving the 2015 CEF standards by reducing over drying is indicated by the right bar chart in Figure 2.4. The fraction of energy used in over drying is only about 15% to 20% of the total cycle energy consumed, but the electric dryers could achieve EFs that equal the CEF standards if 20% to 80% of the excess over-drying energy were saved. On the other hand, efficiency gains in addition to reducing over drying are needed for Test Unit 4 to meet the 2015 CEF standard with the D2 procedure.
2.6

Table 2.3. Amount of energy used after the test load is dried to 5% RMC and 2% RMC as a percentage of the total energy consumed. Also included are the excess energy savings that would need to be saved to meet the 2015 CEF standards along with the maximum EF if all the excess energy was saved. 1Note: The AHAM 1992 test with Test Unit 3 on medium temperature setting was rerun with Extra Dryness setting.
D2 Results Energy Used after 5% RMC Energy Used after 2% RMC
Test Load
Temp Setting
Final RMC (%)
EF (lbs/
kWhr) % of Total
% savings for 2015
CEF
Max EF
(lbs/ kWhr)
% of Total
% savings for 2015
CEF
Max EF
(lbs/ kWhr)
Test Unit 1
AHAM 2009 high 0.74 3.03 25% 75% 4.07 18% 104% 3.73
AHAM 2009 medium 0.92 3.18 20% 76% 3.95 14% 107% 3.69
AHAM 1992 high 1.53 3.27 16% 77% 3.90 10% 132% 3.63
AHAM 1992 medium 2.38 3.36 13% 77% 3.86 5% 212% 3.52
DOE high 0.58 3.22 27% 51% 4.41 21% 66% 4.08
DOE medium 0.50 3.41 22% 40% 4.36 15% 57% 4.02
Test Unit 2
AHAM 2009 high 0.86 3.34 10% 105% 3.71 2% 452% 3.42
AHAM 2009 medium 2.25 3.45 8% 96% 3.74 AHAM 1992 high 1.66 3.23 8% 176% 3.50 AHAM 1992 medium 4.85 3.66
DOE high 0.47 3.41 18% 48% 4.15 10% 84% 3.80
DOE medium 0.47 3.63 16% 18% 4.29 9% 30% 4.00
Test Unit 3
2009 AHAM turbo 1.98 2.56 15% 149% 3.00 6% 381% 2.71
2009 AHAM full load 3.10 3.06 8% 76% 3.34 1% 827% 3.09
1992 AHAM turbo 4.94 2.83 4% 378% 2.94 1992 AHAM 1 full load 1.26 2.26 28% 112% 3.12 16% 189% 2.70
DOE turbo 0.66 3.15 25% 14% 4.20 18% 19% 3.86
DOE full load 0.59 2.96 29% 32% 4.18 23% 41% 3.84
Test Unit 4
AHAM 2009 high 0.73 2.49 22% 118% 3.17 12% 206% 2.84
AHAM 2009 medium 1.31 2.64 13% 157% 3.04 AHAM 1992 high 0.81 2.38 17% 167% 2.87 30% 279% 2.65
AHAM 1992 medium 2.79 2.86 DOE high 0.58 2.54 30% 80% 3.61 23% 102% 3.31
DOE medium 0.78 2.79 16% 99% 3.34 9% 173% 3.08
2.7

Figure 2.4. Results from analyses of D2 procedure results using DOE test loads. On the left is a
comparison of the measured EF, 2015 dryer standards for CEF, and the maximum EF if all energy consumed after reaching 2% RMC were saved. On the right are the percentage of the total energy that was consumed after reaching 2% RMC and the percentage of that over drying energy that would need to be saved for the EF to meet the 2015 CEF standards based on estimation of RMC from the dryer weight measurements.
Over-drying of the AHAM test loads with greater assortments of fabrics and cloth sizes compared to the DOE test load, is shown in Figure 2.5, where dryness is defined as 5% RMC. Over-drying occurs consistently with all load types on the high temperature setting, but there is a general trend of less over-drying with the AHAM test loads. On the high temperature setting, excess energy decreases from 18-29% with the DOE test load to 10-25% with the AHAM 2009 test load and 3-17% with the AHAM 1992 test load. On the medium temperature settings, the excess energy use is less than on high temperature settings. This illustrates that over-drying does not occur consistently, but may depend more on load type and size. Any improvements to moisture sensing or automatic termination algorithms will need to be sensitive to the potential of under drying, which would have a detrimental impact on consumer satisfaction.
Figure 2.5. Comparison of energy consumed after the test load reaches 5% RMC as a percentage of total
energy consumed by the cycle. Results are included for 4 dryers using 3 test loads and the temperature set on high (left) and medium (right). 1Note: AHAM 1992 test with Test Unit 3 on medium temperature setting was rerun with Extra Dryness setting.
2.8

2.3 Energy Breakdown of the Automatic Termination Cycles
The data collected can also provide insights into the drying cycles, including the energy breakdown between the warm-up, bulk drying, high heat, and cool-down phases. The amount of the energy used in the final stages of the drying cycle is relevant for devising strategies to improve automatic termination.
When a cycle starts, most of the energy is used to heat up the wet load, the heating elements, and the rest of the dryer. The beginning warm-up stage of a typical drying cycle is indicated in Figure 2.6. Next, during the bulk drying stage, the exhaust gas temperature normally stabilizes, the heaters are normally on continuously, and the exhaust air is at high relative humidity. During this phase, there is very little sensible duty, and the latent duty of evaporating water consumes the energy. At the end of the bulk drying phase, the latent duty decreases, which shifts the energy input to sensible duty, causing the dryer and contents to heat and the exhaust temperature to rise, as shown for a sample cycle in Figure 2.6. At this point, the dryer goes into a high heat phase where the heaters or gas burner are modulated to prevent overheating of the load, which is observed in the power profile in Figure 2.6. Typically, there is a cool-down phase at the end where the heaters are turned off to allow the clothes to cool before ending the cycle. With the heaters off, there is minimal energy used, so the cool-down phase is combined with the high-heat phase in this analysis. The RMC data calculated from the scale measurements are also included in Figure 2.6. The increase in RMC during the cool-down phase is indicative of over-drying during the high heat stage.
Figure 2.6. Example of warm-up, bulk dry, and high heat (combined with cool down) stages of an
automatic termination cycle from testing of Test Unit 1 with the AHAM 1992 load on COTTONS and high temperature settings. The power profile on the right shows when one or both heating elements are on along with the RMC data obtained from the scale measurements.
A procedure was used to divide the cycles into warm-up, bulk dry, and high heat phases. The exhaust temperature was plotted, and the transition from warm-up to bulk dry was selected by observing when the
2.9

exhaust temperature leveled off. This is represented by the orange line for the example in Figure 2.6. Next, a point was selected where the exhaust temperature first started to rise, which is the light blue line in Figure 2.6. The exhaust temperature was averaged between the orange and light blue lines. The point at which the exhaust temperature reached 5°F higher than the average temperature was defined as the transition from bulk dry to high heat.
The breakdown of energy consumption between the drying phases is compiled in Table 2.4. Averages are provided for the cases where duplicate tests were performed with the same test load and dryer settings. The percentage breakdown of energy is also shown in bar charts in Figure 2.7. The charts on the left are for high temperature settings and the charts on the right are for medium temperature settings.
The warm-up stage is consistently 30-40% of the energy consumption for the standard dryers. The RMC calculated from the scale weight and the exhaust relative humidity at the end of the phase are included in Table 2.4. By the end of the warm-up stage, the load has already dropped from 57.5% RMC to around 35-40%, which means 30-40% of the total latent duty has also been accomplished. This implies that the inefficiency of heating up the dryer and load is not a large parasitic energy cost.
Test Unit 3 behaved somewhat differently. It used a smaller fraction of energy in the warm-up phase, closer to 30% on high temperature and 20% on low temperature. This was also reflected in the higher RMC at the end of the warm-up stage. This is attributed to the lower bulk dry phase operating temperature. The exhaust ran at 85-90°F on high temperature (turbo) setting and closer to 80°F on medium (full load), while the other dryers all ran with an exhaust temperature 100-110°F on both settings. In addition to running cooler, Test Unit 3 also had a lower exhaust RH on average. When the exhaust is not saturated, the air can have evaporated more water, which contributes to lower energy efficiency.
The exhaust RH was still fairly high at the end of the bulk dry phase, indicating that significant drying was still occurring when the exhaust temperature begins to rise. This corresponded to relatively high RMC for the AHAM loads but low RMC for the DOE loads. All of the DOE loads were below 5% RMC with the standard dryers at the end of bulk drying and several were completely dry according to the 2% RMC requirement. The fabric composition, thinness, and consistency of the DOE test clothes likely makes it easier to remove moisture uniformly from the DOE test load. This results in the DOE load being dryer with a lower RMC at the end of the bulk dry phase when drying slows down and the exhaust temperature begins to rise. Again, Test Unit 3 was different because of the drum reversals. In many tests, there was a very short bulk dry phase, as defined here, because the exhaust temperature gradually increased throughout most of the cycle.
2.10

2.11
Table 2.4. Compilation of the energy breakdown between the warm-up, bulk dry, and high heat stages of the automatic termination cycles. RMC and RH give indications of the load dryness and the drying rate at the end of the stages. Test procedure results and the energy consumption by the motor over the entire cycle are also included. (Note, stage energy includes motor energy used during that stage.)
Test Procedure Results Motor Warm-up Stage Bulk Dry Stage High Heat Stage
Dryer Test Load Temp Setting
Drying time (min)
RMC (%)
EF (lbs/kWh)
Cycle Energy (W-hr)
% of Total
Stage Energy
(%Total)
Final RMC (%)
Final RH (%)
Stage Energy
(%Total)
Final RMC (%)
Final RH (%)
Stage Energy (%Total)
Test Unit 1
2009 AHAM High 40.19 0.74 3.03 162 5.9% 32.3% 35.1 87.1 32.9% 10.4 66.4 34.8%
2009 AHAM medium 38.87 0.92 3.18 164 6.2% 37.3% 34.1 91.0 30.1% 12.0 65.6 32.7%
1992 AHAM High 36.56 1.53 3.27 154 6.0% 35.6% 37.3 92.2 30.2% 13.9 67.5 34.2%
1992 AHAM medium 35.97 2.38 3.36 142 5.6% 29.9% 40.4 95.3 36.0% 16.2 65.7 34.1%
DOE High 39.69 0.58 3.22 161 6.2% 31.1% 37.3 100.5 48.6% 1.6 72.3 20.3%
DOE medium 37.57 0.50 3.41 155 6.3% 30.6% 39.8 101.0 57.9% 0.6 64.1 11.5%
Test Unit 2
2009 AHAM high 35.91 0.86 3.34 137 5.4% 34.1% 39.2 74.7 46.4% 9.2 50.6 19.4%
2009 AHAM medium 35.52 2.25 3.45 135 5.5% 36.7% 39.8 76.1 34.7% 19.9 60.6 28.6%
1992 AHAM high 36.85 1.66 3.23 138 5.2% 37.4% 37.7 65.7 36.1% 14.0 45.9 26.6%
1992 AHAM medium 35.52 4.85 3.66 136 5.9% 38.5% 39.1 79.7 29.2% 21.7 53.7 32.3%
DOE high 37.34 0.47 3.41 139 5.6% 39.7% 34.9 86.3 46.8% 3.3 69.4 13.4%
DOE medium 34.25 0.47 3.63 129 5.5% 38.4% 35.8 100.6 52.2% 2.4 66.3 9.4%
Test Unit 3
2009 AHAM turbo 35.97 1.98 2.56 100 8.5% 29.8% 38.1 48.6 46.6% 9.3 34.1 23.7%
2009 AHAM full load 35.63 3.10 3.06 98 10.0% 21.0% 43.1 46.0 25.0% 27.1 51.2 54.0%
1992 AHAM turbo 33.22 4.94 2.83 88 8.4% 32.7% 35.1 60.4 28.0% 18.0 46.4 39.3%
1992 AHAM full load 45.08 1.26 2.26 122 9.2% 22.2% 46.8 64.1 22.2% 26.2 68.3 66.4%
DOE turbo 33.45 0.66 3.15 91 9.5% 20.4% 42.2 71.6 43.2% 11.5 62.4 36.5%
DOE full load 36.80 0.59 2.96 101 10.0% 18.7% 43.0 63.2 28.0% 20.4 72.0 53.4%
Test Unit 4
2009 AHAM high 37.67 0.73 2.49 176 5.2% 32.3% 36.0 102.7 31.9% 12.7 67.3 36.3%
2009 AHAM medium 36.25 1.31 2.64 170 5.3% 36.9% 35.5 83.3 37.6% 10.6 56.6 25.5%
1992 AHAM high 41.27 0.81 2.38 192 5.4% 38.7% 31.2 71.4 29.5% 11.2 50.7 31.7%
1992 AHAM medium 33.03 2.79 2.86 154 5.2% 34.3% 39.5 93.6 37.1% 16.7 62.4 28.7%
DOE high 38.77 0.58 2.54 180 5.4% 31.2% 35.1 79.6 47.8% 1.1 58.3 21.0%
DOE medium 35.45 0.78 2.79 166 5.5% 35.3% 37.6 92.1 51.8% 3.8 62.4 12.9%
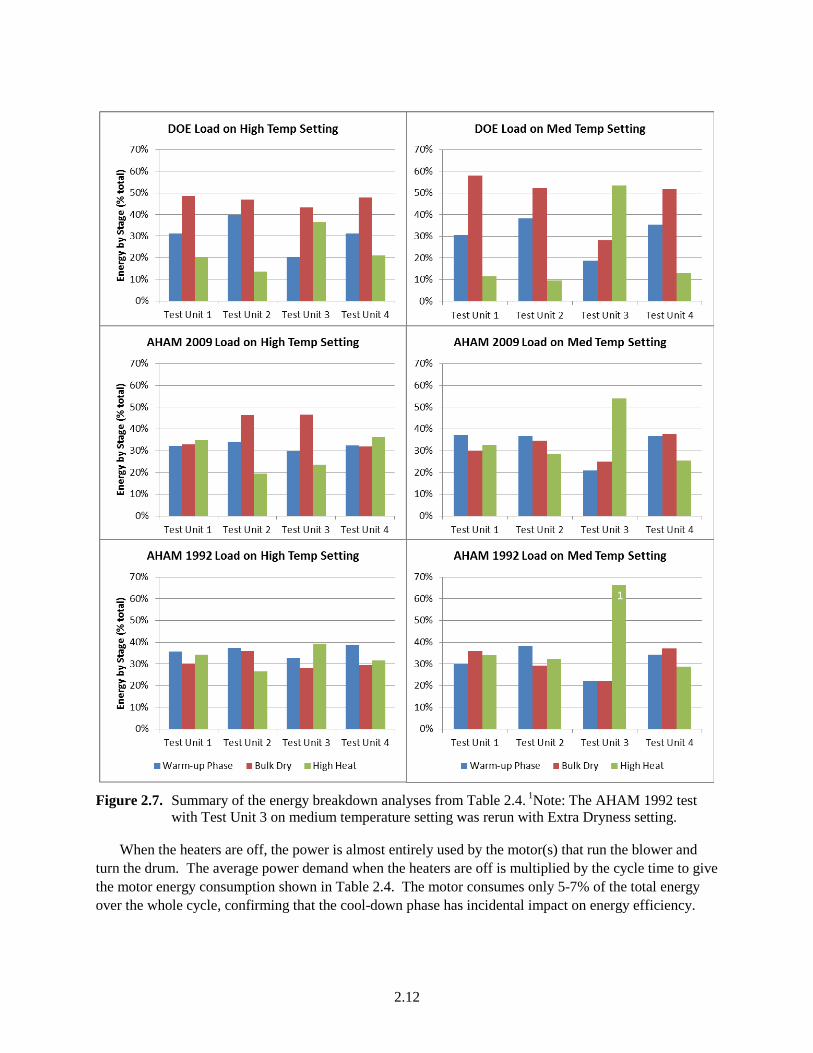
Figure 2.7. Summary of the energy breakdown analyses from Table 2.4. 1Note: The AHAM 1992 test
with Test Unit 3 on medium temperature setting was rerun with Extra Dryness setting.
When the heaters are off, the power is almost entirely used by the motor(s) that run the blower and turn the drum. The average power demand when the heaters are off is multiplied by the cycle time to give the motor energy consumption shown in Table 2.4. The motor consumes only 5-7% of the total energy over the whole cycle, confirming that the cool-down phase has incidental impact on energy efficiency.
2.12

Overall, the energy breakdown shows that a significant percentage of the energy is consumed during the high heat phase, and the pursuit of higher efficiency should be focused on this phase in order to meet future energy conservation standards.
2.13


3.0 Test Procedures
This section provides information about the test capabilities and procedures that were used to perform testing according to the Test Procedures for Clothes Dryers in Appendix D1 and Appendix D2 of 10 CFR 230 subpart B [3]. All section references are to Appendix D2 of 10 CFR 230 Part B except where noted.
3.1 Installation (Section 2.1 of Appendix D2)
All of the tested dryers are vented, so according to Section 2.1.2, the dryers were installed with an exhaust gas simulator described in Section 3.3.5.1 of AHAM HLD-1-2009 [5]. Figure 3.1 shows a picture of the simulator installed on Test Unit 1. A probe used to measure exhaust temperature and relative humidity was inserted into the simulator at the transition between the straight section and the taper. .
Figure 3.1. Back of the Test Unit 1 with exhaust simulator installed
Section 2.2.1 requires maintaining room conditions at 75 ± 3°F and relative humidity at 50 ±10%. Ambient conditions were controlled by placing the dryers in an environmental chamber (shown in Figure 3.2). A second probe for measuring chamber temperature and RH, which were recorded every 1 second, was hung from the ceiling of the chamber above the dryers.
Test conditions are provided in Table 3.1 for all of the tests reported here. As indicated in Table 3.1, the D1 tests use timed-dry settings instead of dryness settings that are applicable only for automatic termination cycles used in the D2 tests. The average, minimum, and maximum temperature, as well as RH, are reported for each test from the data recorded at 1 Hz. Only one test did not meet the room condition requirements. One of the D1 procedure tests with Test Unit 1 exceeded 60% RH, as indicated by the entry in red. The chamber was outside the specified range of 50±10% RH for 7.4 minutes of the
3.1

22.7 minute test. This D1 test does not impact the energy analyses provided in this report, which are based only on data from the D2 procedure testing of automatic termination cycles.
Figure 3.2. Environmental chamber used for dryer testing
3.2

3.3
Table 3.1. Compilation of test conditions for each D2 and D1 procedure test, including minimum and maximum chamber temperature, relative humidity and voltage.
Test Conditions
Room Temperature (°F)
Room RH (%) Voltage2
Dryer Test Test Load Temp Setting
Dryness Setting Average Min Max Average Min Max Min Max
Test Unit 1
D2 A2009 high normal 74.9 74.5 75.3 47.4 45.7 49.0 235.7 242.7
D2 A2009 high normal 74.0 73.0 75.7 47.7 44.8 49.2 236.0 242.1
D2 A2009 high normal 74.0 73.0 75.2 47.9 43.6 50.0 236.2 244.1
D2 A2009 medium normal 74.3 73.8 74.9 47.6 45.8 49.5 236.7 242.4
D2 A1992 high normal 74.2 73.4 75.3 47.6 43.3 52.8 236.0 242.9
D2 A1992 high normal 73.8 73.0 75.0 45.3 43.2 47.1 235.2 242.9
D2 A1992 high normal 73.8 72.6 74.8 46.0 42.5 51.9 234.8 242.8
D2 A1992 medium normal 74.8 73.9 75.5 47.7 45.7 49.2 234.7 243.4
D2 DOE high normal 74.3 73.3 75.2 48.1 45.0 50.8 232.7 246.1
D2 DOE high normal 74.4 73.7 75.3 46.2 44.0 48.1 232.4 246.3
D2 DOE high normal 74.0 72.9 74.9 45.5 42.9 48.5 233.1 246.7
D2 DOE medium normal 74.1 73.1 75.1 45.7 43.2 48.6 236.8 243.6
D1 DOE high timed 75.3 74.1 76.2 47.6 45.6 51.2 235.7 247.9
D1 DOE high timed 73.8 73.3 74.3 47.2 46.6 48.5 237.2 243.4
D11 DOE high timed 73.7 73.1 75.2 57.0 47.0 63.9 235.4 246.0
Test Unit 2
D2 A2009 high normal 74.5 74.1 75.3 46.4 45.3 47.6 237.8 249.9
D2 A2009 medium normal 74.3 73.5 74.8 47.3 46.0 48.4 231.6 245.3
D2 A1992 high normal 74.6 73.9 75.2 47.5 46.0 49.2 232.0 248.5
D2 A1992 medium normal 74.7 73.4 75.3 47.2 43.6 49.5 232.2 247.8
D2 DOE high normal 74.3 73.7 75.6 46.4 44.5 48.4 238.2 248.4
D2 DOE medium normal 74.5 74.0 74.9 46.9 42.9 48.9 231.4 247.8
D1 DOE high timed 74.8 74.5 75.0 47.5 45.6 49.3 237.0 247.8

3.4
Test Conditions
Room Temperature (°F)
Room RH (%) Voltage2
Dryer Test Test Load Temp Setting
Dryness Setting Average Min Max Average Min Max Min Max
Test Unit 2
D2 A2009 turbo normal 74.4 73.5 75.2 49.6 44.5 55.2 205.7 209.2
D2 A2009 full load normal 74.1 73.7 74.6 46.2 44.1 50.1 206.8 209.4
D2 A1992 turbo normal 74.1 73.5 74.5 48.4 45.9 51.2 205.6 209.0
D2 A1992 full load extra dry 74.3 73.9 74.8 47.9 44.8 49.8 206.2 208.9
D2 DOE turbo normal 74.0 73.5 74.2 47.5 44.5 49.6 206.7 209.5
D2 DOE full load normal 73.9 73.4 74.6 47.3 43.0 49.1 203.4 208.8
D1 DOE high timed 73.9 73.7 74.1 48.5 47.3 49.7 205.4 209.5
Test Unit 3
D2 A2009 high normal 74.0 73.4 74.3 46.1 44.5 48.2 115.4 120.3
D2 A2009 medium normal 75.0 74.2 75.3 46.4 44.3 48.6 117.5 120.4
D2 A1992 high normal 74.4 73.5 74.8 44.6 43.3 45.8 118.4 120.1
D2 A1992 medium normal 75.0 74.6 75.3 46.0 44.3 47.9 116.6 120.2
D2 DOE high normal 73.9 73.3 74.2 46.1 44.3 48.1 118.9 120.2
D2 DOE medium normal 74.7 74.1 75.2 46.4 44.7 49.0 118.9 120.2
D1 DOE high timed 74.8 74.2 75.2 46.1 43.0 48.2 118.7 120.2
1 The RH of the test chamber was above 60% during 7.4 minutes of this test, which is outside of the test procedure range of 50±10% RH. 2 The voltage supply briefely spiked outside of the ±1% range allowed for by the test procedure when the heaters turned off and on.

Section 2.3.1 requires the electric supply to be maintained within 1% of the 120/240V, 120/208V, or 120 volts, as applicable. Voltage was regulated using the Variac shown in Figure 3.3. The Variac was effective at maintaining the voltage to within 1% under steady load conditions. However, when the heaters would turn on or off, the change in load would cause a shift in the voltage outside of the allowable range. A solution was implemented using the power load banks shown in Figure 3.4. By adding load banks to the electric circuit, the load on the Variac was kept more constant, which stabilized the voltage to the dryers. A transient still occurred when the heaters turned off and on, but the magnitude and duration of the transients were significantly reduced. A voltage transducer was installed on the power circuit to the dryers, and voltage was recorded every second. An example voltage trace is shown in Figure 3.5, which shows brief spikes in voltage when a heater turns on or off. The minimum and maximum voltages shown in Table 3.1 that are outside the allowable ±1% range are due to transients. As Figure 3.5 illustrates, the voltage remained within tolerances for the majority of the time during the tests.
Figure 3.3. Variac used for modulating voltage
3.5

Figure 3.4. Power load banks for stabilizing power voltage
Figure 3.5. Sample voltage trace from a D2 procedure test using Test Unit 2
Test Unit 4 was operated with natural gas from a compressed gas cylinder per the instructions in Section 2.3.2.1. The cylinder was obtained from Oxarc, an industrial gas supplier, who filled the cylinder from a Cascade Natural Gas supply line. The HHV of the gas was 1022 Btu/scf based on Cascade test data for the supply meter. The gas supply was configured with a pressure regulator on the bottle, followed by a gas flow meter and a second pressure regulator for controlling pressure to the dryer between 7 and 10 inches water column. A picture of the natural gas supply is shown in Figure 3.6. The gas flow meter was calibrated for the cylinder gas using a DryCal calibration kit. Gas flow rate was recorded every second and integrated over the cycle time to obtain a total gas volume consumed. The exhaust simulator was not used with the gas dryer because the dryer air had to be exhausted outside of the
3.6

chamber and the building. An exhaust fan was used to prevent the ducting pressure drop from applying back pressure on the gas dryer, which was confirmed with a pressure drop measurement made between the chamber and the dryer exhaust port.
Figure 3.6. Natural gas supply set-up from a compressed gas cylinder
3.2 Test Clothes (Section 2.6 of Appendix D2)
Test clothes were procured from SDL ATLAS LLC for each of the three load types. The clothes were preconditioned by the supplier per the instructions in Section 2.6.3 of Appendix D2. Sufficient items were acquired to assemble all 3 load types, the DOE [3], the AHAM Standard HLD-1-2009 [5], and the AHAM Standard HLD-1-1992 [6] test loads.
3.3 Test Loads (Section 2.7 of Appendix D2)
Test load preparations started with a bone drying procedure per Section 1.6. The test dryer was operated with the test load on timed dry for 10 minutes on high heat. The load was removed, immediately weighed, and the weight recorded. The load was returned to the dryer, operated on high-heat timed dry for an additional 10 minutes, and re-weighed. This procedure was repeated until the change in load weight was less than 1% between consecutive weighings. In most cases, the load was bone dry after the second 10 minutes. Any adjustments to load weight were made by adding or removing clothes per instructions for that load type. If clothes were added, the bone drying procedure was repeated. The final weight was recorded on the data sheet as the Bone Dry weight.
The bone dry load was then cooled by replacing it in the dryer and operating it on the no-heat mode for approximately 5 minutes. This facilitated meeting the requirement for 60±5°F during the dampening step. Procured distilled water was used for dampening the test load in order to meet the hardness specification in Section 2.7. A mixture of room temperature and refrigerated distilled water at an
3.7

approximate ratio of 1:1 was added to the test load in a large tub. The load was agitated by hand for approximately 2 minutes to thoroughly dampen all of the clothes. A handheld thermocouple was used to measure the water temperature, which was recorded on the datasheet.
Next, the entire contents of the tub, including the dampened clothes and unabsorbed water, were dumped into an LG, Model WT4870CW, washing machine that is shown in Figure 3.7. The load was then spun down by operating the washing machine in the Spin Only setting on high speed. The DOE test loads required approximately 11 minutes to reach less than 57.5% RMC. The AHAM 1992 and 2009 loads would not reach 57.5% RMC despite repeated 13 minute spinning cycles with the washing machine on high speed. Consequently, after a single 13 minute spinning cycle, the AHAM loads were moved from the washing machine to 2 Spinex high speed spinners, also shown in Figure 3.7. Trial and error was used to determine the appropriate time with the Spinex spinners for each cloth type to reach 57.5% RMC. Due to capacity limitations, the test loads had to be divided into multiple Spinex loads. By segregating the clothes types in the Spinex loads and adjusting the spinning time by cloth type, the moisture content of the test load was kept more uniform.
Figure 3.7. LG washing machine and Spinex machines for spinning test loads to less than 57.5% RMC
The final weight of the test load after spinning was recorded on the datasheet, and the RMC was calculated from the bone dry weight. If the moisture content was less than 52.5%, the test load was re-dampened and the spinning process repeated. A spray bottle was used to add water until the test load RMC was 57.5±0.33%. For the AHAM loads, the moisture content was recorded for each Spinex load after spinning, and any water that was added was preferentially sprayed on the driest cloth types. The final wet load weight was recorded on the datasheet, which was used to confirm that the starting RMC was within the required range.
3.4 Dryer Pre-conditioning (Section 2.8 of Appendix D2)
The dryers were operated in non-heat mode to pre-condition the dryers prior to testing. The temperature probe inserted into the exhaust simulator was used as the discharge temperature. This temperature was displayed in a chart on the Labview control panel. When the temperature did not change by more than 1°F for 10 minutes, the dryer pre-conditioning step was terminated.
3.8

3.5 Test Procedure (Section 3 of Appendix D2)
The dryer settings were adjusted according to the specific test being conducted. Table 1.1 gives the specific settings used for the D2 procedure tests for each dryer. For the D1 procedure tests, a timed-dry setting was used on the highest temperature for the maximum time. The Save Data button was pressed on the LabView control screen to begin recording data every 1 second for the duration of the test. Immediately after recording the starting RMC, the test load was loaded into the dryer using the technique specified in Section 2.7, and the start button was pressed. The power draw from the motor start-up signaled the Labview program when the cycle started, which triggered a timer for the cycle duration. The power signal also triggered the end of the cycle when the motor turned off. The cycle time from the LabView control screen was recorded on the datasheet. The Labview program integrated the power consumption over the cycle time, and the total power consumption at the end of the cycle was also recorded. The drying cycles were allowed to run to end-of-cycle for the D2 procedure tests. The RMC that was calculated from the scale weight, as described below, was charted on the control screen. The operator was responsible for monitoring the RMC during the D1 procedure tests, and manually turning off the dryer when the RMC was below 5%.
Once the dryer stopped, the test load was immediately removed from the dryer and weighed on the calibrated lab scale. This final dry weight was recorded on the datasheet, which then calculated the final RMC and the EF. For the D2 procedure, if the final RMC of the DOE loads was greater than 2%, then the test was repeated using the highest dryness setting. This never occurred for any of the tests conducted. If the final RMC of the AHAM loads was greater than 5%, then the test was repeated with the highest dryness setting. This only occurred once with Test Unit 3 on the medium temperature setting (FULL LOAD setting) with the AHAM 1992 test load.
3.6 Data Recording (Section 3.4 of Appendix D2)
Data recording occurred both with a LabView data acquisition system logging data signals every 1 second, and by the operator making entries on a datasheet. The data acquisition system recorded temperature and relative humidity of the environmental chamber and the exhaust air passing through the exhaust simulator. A power transducer and a voltage meter in the power circuit to the dryer recorded voltage and instantaneous power to the dryer. For the gas dryer tests, the mass flow rate natural gas from the compressed gas cylinder was recorded. Lastly, a 30-second running average of the scale weight was recorded. The data acquisition system also performed calculations that were recorded in the data log file. The dryer power was integrated over the duration of the cycle to give the total electric power consumption. Similarly, total gas consumption was obtained by integrating the mass flow meter readings. The RMC calculated from the scale weight was also recorded.
Post processing of the data file provided additional information that was recorded on the datasheet. Average, minimum, and maximum chamber temperature and RH were calculated over the duration of the test, as were the minimum and maximum voltage. Drying cycle time and power and gas consumption were also obtained from post processing, as a check on the LabView results.
A number of manual readings were taken by the operator and entered into the datasheet. Most of these were weights obtained from the lab scale to determine RMC of the test load, including bone dry, initial RMC, and final RMC. Other entries in the datasheets included the amount of water added during dampening, water soak temperature, spinning times, and load compositions.
3.9

3.7 Remaining Moisture Content (RMC)
Two methods were used to measure the remaining moisture content of the test load. The first RMC measurement followed the D1 and D2 procedures and the second method utilized a platform scale to measure the weight of the dryer that was used to calculate RMC. The test procedure RMC was calculated by:
100%l
tpl bd
mRMCm m
= ×− (1)
where ml is the mass of the test load measured on a laboratory scale, and mbd is the mass of test load after following the bone drying procedure.
The dryer scale RMC was calculated by :
( )s e bdds
bd
m t m mRMC
m− −
= (2)
where ms(t) is the mass of the dryer plus test load that was recorded from the platform scale while the test cycle was performed. The empty weight of the dryer, me, was obtained by operating the dryer empty in no-heat mode prior to each test and average the scale weight over a period of time which was at least 30 seconds.
3.10

4.0 References
[1] 78(1) FR 152-185. January 2, 2013. "Energy Conservation Program: Test Procedures for Residential Clothes Dryers" U.S. Department of Energy, Federal Register. [2] 78(157) FR 49608-49651. August 14, 2013. "Energy Conservation Program: Test Procedures for Residential Clothes Dryers" U.S. Department of Energy, Federal Register. [3] 10 CFR 430 subpart B Appendix D. 2014. "Uniform Test Method for Measuring the Energy Consumption of Clothes Dryers" U.S. Environmental Protection Agency, Code of Federal Regulations. [4] 76(4) FR 972-1036. January 6, 2011. "Energy Conservation Program for Consumer Products: Test Procedures for Clothes Dryers and Room Air Conditioners; Final Rule" U.S. Department of Energy, Federal Register. [5] AHAM HLD-1-2009. 2009. "Household Tumble Type Clothes Dryers." Association of Home Appliance Manufacturers, Washington, DC. [6] AHAM HLD-1-1992. 1992. "Household Tumble Type Clothes Dryers." Association of Home Appliance Manufacturers, Washington, DC.
4.1


