commercial vehicle study
TRANSCRIPT

COMMERCIAL VEHICLE STUDY WORKING PAPER
Commercial Vehicle Surveys: To Measure Commodities or Truck Trips?
Purpose of the Working Paper
Commercial vehicles constitute a measurable and growing portion of roadway VMT, and are
challenging for urban areas to include in their travel demand forecasts. In addition, information
about the type and amount of commercial vehicle travel is critical to congestion management and
safety planning. This discussion attempts to set out some of the most common issues in
developing a study of commercial vehicles, and offers data on truck travel characteristics from
various studies around the US. This discussion will be helpful to urban areas considering a
commercial vehicle survey, both in informing the design of such a study and in providing some
comparative data for benchmarking.
Acknowledgements
Much of this discussion is taken from a document called “Commodities or Truck Trips, A
working Paper” written by Nancy McGuckin and John Hamburg (1996) as training material for
traffic engineers and transportation planners in the consulting firm of Barton-Aschman
Associates. This document re-visits and updates that original piece, any errors the responsibility
of Nancy McGuckin.

COMMERCIAL VEHICLE STUDY WORKING PAPER
Overview
The predominant mode used for freight transportation is truck. Freight activity can be measured
by weight (tons or ton-miles), by volume, or by value. When measuring domestic freight by ton-
miles, rail becomes increasingly important as a mode. Considering all freight movement, both
intercity and local, trucks account for almost 80 percent of the freight revenues in the U.S.
"Revenues" refers to fees for transportation spent by shippers.
Nationally, about 40 percent of goods movement is between cities (inter-urban) which leaves 60
percent within the local area (intra-urban). There may be factors that drive a local area's share of
intercity travel higher, such as agricultural export, a large cargo airport, and geographic
peculiarities. A rule of thumb is that rail is economical for goods movement over distances of
750 miles or more, although some opportunity may exist for the 250 to 750 mile range. The rail
penetration of the market for goods movement over 750 miles is only about 25 percent, generally
because of the poor on-time performance of rail, especially with the growing need to support
'just-in-time' manufacturing operations. Another constraint to the growth of rail shipping is the
poor performance of rail in the management of fragile goods.
The majority of truck traffic (60 percent) is typically within the confines of a single urban area.
Many things require transportation of goods to dispersed local destinations. The competition of
providers to deliver goods and services to stores, homes, and businesses either saves the
consumer money, or offers greater convenience and choice. Given recent trends, it is unlikely
that the portion of freight moved by trucks within city limits will fall significantly; on the
contrary intra-urban truck traffic will probably continue to grow.
The ease and efficiency of goods movement in a region in intricately linked to the metropolitan
economy. Business and industrial location choices are not only tied to market access, but to
dependable transportation facilities for the distribution of products to consumers. Despite its
importance, few regions have examined and planned their transportation networks with goods
movement in mind. The link between goods movement and economic development has long
been acknowledged, but few regions examine the goods movement network as an economic asset
or try to integrate transportation development with area wide economic development goals. If
planning agencies wish to include issues related to truck travel in the planning process a study of
the commodities moving by truck and/or a truck trip generation survey would be required to
obtain locally-specific data. Many areas include trucking and intermodal operators specifically in
the outreach process. Uses of the data collected in truck surveys are outlined in the next section.

COMMERCIAL VEHICLE SURVEY WHITE PAPER
It should be noted that measuring commodity flow as a basis to estimate truck trips has limited utility
in developing trip generation models. Commodity flow (especially as tracked by large, national
commodity-flow databases, such as the Census CFS) does not always translate into trip estimates for
the following reasons:
The amount of trucks moving empty can be between 25 and 35 percent of the truck trips
in a region.
The geography of goods flow which includes:
o Trips within a study area (Internal only) comprise about 60% of all truck trips
when large and small trucks are included. The goods moving fully within an
area are not accounted for by most large commodity flow databases.
o Trips from outside an area to inside an area (External-Internal) depend so much
on the area location, size, and characteristics. These would be partially
accounted for by large commodity flow databases.
o Goods moving through an area can often be tracked from goods flow databases
Regional and seasonal differences in commodity amount and type, destination type and
location, etc.
The growth of intermodal shipments which makes tracking mode (train/truck) difficult
using large commodity databases:
Growth of container shipments, separation of truck and goods
Greater economy/efficiency on rail means more rail-truck distribution within an area.
Growth of imports through water ports and truck to rail movements (Drayage)
At this point in the state of the practice of surveying and forecasting truck travel, the recommended
design includes directly measuring truck trips, and obtaining data on commodities for the sampled
trips. This allows a linkage of the smaller local survey to the larger national commodity survey, and
also allows the local travel demand model to identify truck-generators within the study area and use a
four-step approach to generate and distribute truck travel based on land-use forecasts.
Uses of Truck Trip Data
Potential applications for freight truck trip information include:
Congestion Management and Safety
Document origins, destinations, and routes used by freight trucks traveling through
congested urban areas
Provide base data to evaluate opportunities to reduce freight truck traffic through urban
areas during peak commute periods
Provide base data to evaluate other policies relating to truck route prohibitions in urban
areas
Corridor Planning
Identify highway corridors most critical to key industries
Pinpoint major freight truck generators for specific corridors
Document routes most widely utilized for national and international trade
Provide base data to project freight truck traffic growth and decline for specific
corridors

COMMERCIAL VEHICLE SURVEY WHITE PAPER
Provide base data to estimate the economic value of specific commodities shipped in
specific corridors
Intermodal System Planning
Delineate essential highways linked to rail, air, deep water and river ports
Evaluate intermodal systems most critical to key industries
Track geographic proximity of intermodal facilities relative to the origins and
destinations of trucks utilizing those facilities
Provide base data to project changes in highway usage that would results from rail-line
abandonment or closing of key river ports
Document highway segments with the highest average freight cargo volumes and
weights
Provide base data to project future changes in freight cargo volumes and weights on
specific highway segments
Commercial Vehicles and Safety
Accidents are always a concern. The mix of trucks and other transport on a busy road can pose special
dangers. Overall, a few facts from NHTSA put truck accidents into perspective:
Large trucks account for 3 percent of all registered vehicles, 7 percent of total vehicle miles
traveled, and 8 percent of vehicles involved in fatal crashes.
Large trucks are more likely to be involved in a fatal, multiple vehicle crash than were
passenger vehicles
Most of the fatal crashes involving large trucks occurred in rural areas (63 percent), during
daytime (66 percent) and on weekdays (80 percent).
In the majority (72 percent for the most current data) of cases involving a two-vehicle fatal
crash between a large truck and another vehicle, police reported one or more contributing
factor for the other vehicle driver and none for the truck driver. In 17 percent, one or more
factors were reported for the truck driver and none for the other driver. In 9 percent of the
cases, factors were reported for both drivers, and in 2 percent no contributing factors were
cited for earthier driver.
Most truckers are well-trained and careful drivers. However, while cars have gotten lighter over the
last decades to increase fuel efficiency, allowable truck loads has increased leading to greater weight
disparity. The weight of vehicles impacts stopping time and distance, which can be critical in traffic.
In addition, distracted driving, greater congestion, just in time delivery, and other factors may all play
a role in truck safety. If safety is a special concern in the area, information on the amount and details
of the types of crashes—especially fatal crashes—can be assembled1. Table 1 shows the most recent
data on the amount and type of fatal crashes involving large trucks for the nation as a whole.
1 For example, NHTSA publishes Traffic Safety Facts annually and the TIFA data is public use

COMMERCIAL VEHICLE SURVEY WHITE PAPER
Table 1 - Percent and Type of Fatal Crashes Involving Large Trucks
Crash Type Fatal
Number Percent
Large Truck Rear-Ending Passenger Vehicle 172 4.6%
Passenger Vehicle Rear-Ending Large Truck 627 16.6%
Large Truck Crossing Center Median (Head-On) 127 3.4%
Passenger Vehicle Crossing Center Median (Head-On) 646 17.1%
Large Truck Striking Passenger Vehicle (Other) 1165 30.9%
Passenger Vehicle Striking Large Truck (Other) 857 22.7%
Other Collision 178 4.7%
Total 3,772 100.00% Source: analysis by author on Trucks in Fatal Accidents (TIFA) 2009 public sas file
Meeting with the '100 Biggest Trucking Firms'--Collecting Data from Secondary Sources
One method which has worked well in assessing the feasibility of policy changes affecting trucks and
truck travel goes directly to the representatives of the largest trucking firms in the study area. This
method is based on focus groups or workshops, or series of meetings, attended by high representatives
of the largest firms to discuss specific problems and potential solutions. However, if the current
problems associated with trucks primarily stem from safety and regulation issues, the offenders will
largely be from smaller, independent truckers or firms. These smaller operators are harder to identify
and much harder to incorporate into the planning process.
If a dialogue with the largest trucking firms is considered useful, the first step in this process would be
to identify the largest trucking firms in the study area.
The American Trucking Association (ATA), the Chamber of Commerce, Dun & Bradstreet, or other
sources could prove useful in identifying potential participants. For this methodology to work well,
recruiting for the workshops or meetings must be from top-level agency or transportation consultants
to top-level executives in the targeted firms. A first contact letter would be mailed to the contact
person, once identified, setting out the agenda of such a meeting, and offering an invitation. This
letter should be followed up by a telephone call to help the contact at the firm identify the best
participant, and to answer any questions about the process. This telephone call is instrumental in
eliciting participation by the right parties.
This method has the advantage of incorporating the community of truck owners/operators into the
planning process, and of using existing data and consolidating it for travel planning. This approach
may be used in conjunction with a direct survey of commercial vehicles. The weakness of this
approach is the lack of quantitative rigor—it should be considered a qualitative approach, and the data
collected from the owners/operators used as strategic, rather than specific, information.
Collecting Primary Data on Truck Trips
If more quantitative data is required—for example to provide inputs into a truck trip generation
model—then a quantitative survey must be conducted. The commercial vehicle survey, formerly

COMMERCIAL VEHICLE SURVEY WHITE PAPER
referred to as the truck and taxi survey, was an important component of the comprehensive studies of
the 1960's and 70's. More recently the lean budget years, coupled with the fact that truck travel is
typically 10 to 12 percent of all trips, tended to diminish the perceived need for the conduct of this
type of survey. However, concerns about improving air quality, safety, and congestion has refocused
interest in collecting better information about commercial vehicle travel in urban areas.
Significant differences in trip characteristics make it inappropriate to factor resident auto trip tables to
account for commercial vehicles. Household and truck activity are not directly related, and in some
cases mutually exclusive--such as truck limitations in residential areas. The logical solution is to base
the activity of these vehicles on employment density and type, rather than household density as is the
case with person trips.
Information on the cargo carried by sampled vehicles is generally obtained in the format of Standard
Transportation Cargo Codes (STCC), now North American Industry Classification System (or
NAICS, at: http://www.census.gov/eos/www/naics/ ) but a truck trip survey is not designed to be a
cargo or goods movement survey. The design of the survey will lead to the analysis of commercial
vehicle trip characteristics for development of a truck trip model. The detail on the type and amount
of goods obtained in this small sample survey is not sufficient to make references about the total
amount and type of goods in an urban area.
Experience in conducting and analyzing a number of commercial vehicle surveys, for estimating trip
generation and trip attraction as well as air quality forecasting, has led to a set of critical design issues
that surface over and over again. Some of these issues are briefly discussed below.
Critical Design Issues in a Commercial Vehicle Survey
How to Develop a Universe?
The first step in the design of a survey of trucks making trips in the study area is to determine the
universe from which to pull a sample. A listing of trucks garaged in the area must be established
before the sample can be identified. It seems as if one could select trucks from a DMV file, for
instance. However, some of the trucks making trips in the region are registered in the region, and
some of the trucks making trips in the region are registered in other counties adjacent to the study
area, or even in other states. Some of the trucks registered in the region are actually garaged
elsewhere. Some trucks are registered in the region but leased to other operators who may or may not
be identifiable. Some trucks are making stops in the region, and others are simply traveling through.
In addition, using the DMV files does not provide a robust sample because tractor cabs and trailers
can be separated, and licensed separately. For most study areas, multiple state listings would have to
be included, since trucks registered in one area (due to different licensing fees) are often garaged in
others. To effectively use the DMV file, if that is the choice, requires that the separate vehicle listings
be combined under the same garage address, so recruiting is efficient. This can entail a lot of sifting
and sorting to aggregate the separate vehicles into their correct garage location. The telephone
number or contact is not listed on most vehicle registration files, therefore once garage locations are
developed the site must be manually looked up. We’ve hit a number of snags at this point, with
business registration names differing from site location names, or sites just not appearing in any
telephone listing (industrial sites especially).

COMMERCIAL VEHICLE SURVEY WHITE PAPER
Due to these difficulties the survey approach may want to use an alternate two-stage methodology that
uses lists of businesses developed from D&B files, or other business lists. A sample of the
businesses in the directory can be telephoned and screened as to whether or not a commercial vehicle
is garaged at that location. An inventory of all commercial vehicles garaged at the recruited business
location would be compiled, with the license plate number of each vehicle. In this method a sample
vehicle is chosen from the inventory of vehicles by matching a random digit to the last number of the
license plate.
Generally, between 10 and 25 percent of the contacted sites have a commercial vehicle, but the
terminology and definition of such vehicles needs to be clearly stated to ensure that the estimation of
the universe is correct. The number/percent of sites with vehicles are tracked by industry type, area
type, and other pertinent variables, and some data about the number and type of vehicles at each site is
obtained. The final number of truck trips generated by sampled vehicles at the participating sites is
first raised to the total number of vehicles at the sampled sites, and then to the total estimated vehicles
and sites within the strata (industry type/area type).
Although this method is sound it is time-consuming and costly per trip record obtained. Careful
thought is required in planning a commercial vehicle survey about how to develop a robust universe
of garage locations and vehicles, and how to select a representative sample of each.
Most employers do not own or lease commercial vehicles: in a recent Denver study 74% had no
commercial vehicle garaged at the location, while 26% of the employers garaged one or more
commercial vehicle(s) at their business locations. Based on these data, Table 2 shows an estimate of
the number of vehicles by industry type for the study area. These data may be considered transferable
for the purposes of establishing a survey design. A table similar to this should be prepared from the
screening call data to estimate the number of commercial vehicles garaged in the specific geographic
area of interest. Of course, the data should be collected using the local planning areas’ land-use types
in as much detail as possible.
Table 2 - Estimated Number of Vehicles by Type of Business (Data from Denver Commercial
Vehicle Survey)
Type of Business
(SIC Designation):
Number of
Businesses
(D&B Summary)
Estimated Number
with at Least One
Commercial
Vehicle
Mean
Number of
Trucks per
Site
Total Estimated
Trucks at
Commercial Sites
Industrial (1-4999)
18,168
4,542
7.9
35,882
Retail (50-5999)
21,768
5,442
3.2
17,414
Service (70-8999)
35,918
8,980
3.7
33,226
Office and Govt.
(60-6799, 91-9799)
9,323
2,330
6.4
14,912
Total
85,177
21,294
4.8
101,434

COMMERCIAL VEHICLE SURVEY WHITE PAPER
Survey Methodology
Once a universe of sites with commercial vehicles has been developed, and a sample of vehicles
within a representative assortment of sites selected as a sample, the truck survey can be designed. The
approach to this type of survey resembles a home interview survey--the truck is equivalent to the
household member who keeps track of each trip made during a sample day, and the commercial
(garage) location is equivalent to the household location. The trip generation is tied to the garage
location (by industry type and area type).
The survey methodology can also be compared to the household travel survey--a vehicle at the
sampled site is randomly selected, the owner/operator is recruited to participate in the survey, and the
participant driver(s) record all of the trips made in the sampled vehicle during a 24-hour period on a
travel diary. The owner/operator is then re-contacted and a trained interviewer collects the survey
data. One method we have used in the past is similar to the household travel survey--a telephone
recruit, mail-out of the survey packet, and a telephone retrieval of trip data. This method has worked
well, with some modifications to the recruiting procedures, and with allowing a mail-back of the
survey form when a telephone interview cannot be arranged.
Expansion
The expansion of the sample data is a two-stage process. First the sampled trucks are raised to
represent all of the trucks garaged at the sample location, to estimate a trip rate per site by industry
type. The trip rate is applied to the proportion of sites of that type which have trucks (as estimated
from the universe). This gives a control total for the number of internally generated truck trips linked
to employment by type in the study area.
As a second control total, the consultant team has developed an expansion technique using estimates
of total truck VMT by facility type. The details are attached as Appendix A.
Vehicle Weight
There is a lot of confusion about collecting the weight of the vehicle, especially for input into an air
quality model. Generally we ask for the empty weight and the loaded weight, but these data may or
may not be known with precision by the driver/operator, especially of the smaller vehicles. Larger
vehicles usually have better information on tare weight and cargo weight. For input into air quality
analysis software the weights of the vehicle and the fuel-type determine the type of truck or
designation category:

COMMERCIAL VEHICLE SURVEY WHITE PAPER
Table 3 - Truck Type Categories as Defined by Weight
Designation:
Weight (GVW)
Fuel Type
Light Duty Gas Trucks Type 1
6,000 lbs
Gasoline
Light Duty Gas Trucks Type 2
6,001-8,500 lbs
Gasoline
Heavy Duty Gas Vehicles
8,501 and over lbs
Gasoline
Light Duty Diesel Vehicles
8,500 and less lbs.
Diesel
Heavy Duty Diesel Vehicles
8,501 and over lbs
Diesel
The Gross Vehicle Weight (GVW) is different than the weight listed on the DMV file, for air-quality
analysis the GVW is the empty weight of the vehicle plus the weight of the vehicle when fully loaded.
However, the weight obtained from the driver/owner on the sample day should be carried in the data
file. Up to one-half of the vehicles which make trips on the sample day will not be carrying any
freight, for these trucks the parameters given as defaults in air quality analysis (such as Mobile5) will
overestimate the GVW.
Definition of Vehicle Types
Defining and categorizing trucks and other commercial vehicles in the study area is not as
straightforward as it would appear. As shown in Table 3, vehicles are often classified by a
combination of fuel type and weight. The FHWA classification scheme is by silhouette for manual
classification counts. Automatic classification counters use number of axles, and of course cannot
determine fuel type.
The Texas models incorporate only trucks with three-axles and more, since axles were an easy match
to automatic vehicle counters. The North Carolina models include cars used commercially, pickups
and vans, and panel trucks as well as big trucks. The trip rates, lengths, routes, land-use at destination,
etc. is very different for each vehicle type. For example, Table 4 shows the average miles driven on
the survey day by vehicle type, and the average trip length in minutes from reported data by vehicle
type (this data is from Triad, North Carolina where commercial cars, vans, and trucks were included
in the sample frame).

COMMERCIAL VEHICLE SURVEY WHITE PAPER
Table 4 - Average Miles Driven on the Survey Day by Vehicle Type (Data form Triad, North
Carolina Commercial Vehicle survey)
Vehicle Type
Miles Driven on
Survey Day
Average Travel Time per
Trip (mins)
Single Unit Truck
98.44
18.93
Combination Truck
181.06
38.19
Pickup Truck
57.52
17.85
Van
69.21
37.97
Car
76.98
18.46
Overall
84.79
23.93
Table 5 presents the estimated proportion of total vehicle miles of travel by eight classifications in the
Houston-Galveston Region. These classifications use the fuel type and weight as illustrated in the
discussion on vehicle weight and shown in Table 3.
Table 5 - Proportionate Distribution of VMT by Vehicle Classification (Houston-Galveston
Commercial Vehicle Survey)
Designation:
Proportion of VMT
Light Duty Gas Vehicles (Cars)
51.3 %
Light Duty Diesel Vehicles (Cars)
0.5 %
Light Duty Gas Trucks Type 1
28.9 %
Light Duty Gas Trucks Type 2
7.9 %
Heavy Duty Gas Vehicles
7.1 %
Light Duty Diesel Vehicles
0.4 %
Heavy Duty Diesel Vehicles
3.7 %
Motorcycles
0.2 %
COMMERCIAL VEHICLE SURVEY WHITE PAPER
Using similar proportions from classification counts done in the region, an estimate of the total
vehicle miles of travel by vehicles classified as trucks (the non-shaded rows) may be developed. After
removing the estimated truck vehicle miles of travel made by trucks passing through the study area –
usually estimated from an external survey-- the total vehicle miles of travel for each classification of
truck would be divided by the vehicle miles of travel for the surveyed trucks to calculate an expansion
factor. The details of this approach are discussed in Appendix A.
Vehicles to Include in the Survey
In addition to the question of how to define vehicle types, there is a question of what specific vehicles
to include in the sample frame. Many vehicles besides heavy duty trucks will use diesel fuel and turn
up in classification counts by axle. Some of these vehicles may not be included in the sample, and
information on these types can be collected separately or not at all:
Transit buses on fixed routes can be analyzed for the VMT from available data
VMT estimates for school buses can be ascertained from mileage accrual--direct
contact with service providers (school districts or independent contractors)
Post Office vehicle's VMT can be obtained from mileage accruals or analyzed from the
Post Office forms 3997 and 4533 for local and regional routes. Postal vehicles are 1
percent of all trucks, but can be 2 percent of all trips within a study area (CATS). The
routes will be analyzed for the amount of travel on neighborhood streets, and the
amount on collectors and more major facilities.
Police Vehicle's VMT can be obtained by directly contacting each precinct for mileage
accrual.
Rental and leased trucks at leasing stations (U-Haul, etc.). Although mileage is
obtained on the rental record, these trips may or may not be within the study area--
these data should be obtained from a separate visitor survey.
Fire Station Vehicles and Emergency Medical Service (EMS) Vehicles have widely
variant trip characteristics. We recommend that these vehicles not be surveyed.
Garbage Trucks travel primarily on neighborhood roads and alleys. We recommend
that these trucks not be surveyed.
The determination of which vehicles to include is a critical step in the survey design process. The
resources required in obtaining the VMT data from all providers and sources listed above are
considerable.
Other Considerations
To assist in air quality modeling—which requires an estimate of hot and cold starts—information on
whether or not the vehicle was turned off at the destination should be collected for each trip end. It is
not too surprising that nearly 30 percent of the sampled vehicles did not turn off their engine at the
stop. Table 6 shows these data by land-use type.

COMMERCIAL VEHICLE SURVEY WHITE PAPER
Table 6 - Percent of Trips by Whether Vehicle Was Turned Off at Destination (data from the Triad,
North Carolina Survey)
Industry Type
YES
NO
Trips
Percent
Trips
Percent
Industrial
841
79.2%
221
20.8%
Retail
444
84.6%
81
15.4%
Special Retail
122
64.9%
66
35.1%
Service
495
76.7%
150
23.3%
Office
131
79.9%
33
20.1%
Other (Unclass.)
13
92.9%
1
7.1%
Total
2046
78.8%
552
21.2%
To understand the pattern of business activity and its link to truck and commercial vehicle traffic, it is
critical to spend some time assessing the types of businesses in the study. The NAICs codes are
helpful; but local areas use many designations of business types. As long as the socio-demographic
forecast uses the same designations, the future truck trips can be linked to future land use. For
example, using the first two digits of the NAICs code (in parentheses) businesses in a study area can
be grouped into different categories:
NAICs category 1 (Basic Industries) include:
Utilities (22), construction (23), manufacturing (31), transportation and warehousing (48), and
wholesale trade (42).
NAICs category 2 (Service 1) includes:
Information (51), finance and insurance (52), and professional and technical services (54)
NAICs category 3 (Service 2) includes:
Management of companies (55), Arts/Entertainment/Recreation (71), and Other Services (81)
NAICs category 4 (Retail) includes:
Retail trade (44) and Accommodation and Food Service (72)
NAICs category 5 (Not Sampled) include:
Educational Services (61), Health Care and Social Assistance (62), Waste management and
remediation (56), Agriculture and Forestry (11), Mining (21)
The last group of businesses need not be included in the sample. Data to estimate the number and type
of vehicles serving establishments in this last group can be collected from public sources. For
instance, the number of school buses and their daily trip making characteristics (Educational Services)
should be available from the local school board or transportation agency. Large hospitals will share
information about the number of EMS vehicles, the number of garbage trucks and their daily activity
may be available from local area contractors. In addition, the number and type of postal service
vehicles (especially for larger facilities) needs to be collected to enhance the sampled estimates.
Responsibility for the collection of these data lies with the local planning area, and attention to this

COMMERCIAL VEHICLE SURVEY WHITE PAPER
segment of the total trip generation will greatly enhance the estimates obtained from the sample
survey.
Cargo Type
Cargo is usually tracked by the Standard Classification of Transported Goods (SCTG), but real life
experience indicates that the use of these codes is cumbersome and the resulting data too fine for
meaningful analysis. The number of trips by commodity type in each of the categories is so small that
the categories will most likely be substantially combined to produce robust numbers of trips.
Typically, these commodity proportions are then analyzed as attractions to various land-uses. In
addition, many independent carriers are not sure what they're carrying (classified as “Other”), or like
UPS they are carrying an assortment (Freight All Kinds). Small carriers (vans and panel trucks)
which represent a good proportion of the commercial trips in an area may be carrying non-classified
goods (flowers/take-out-meals/catering equipment/lawn equipment/etc.) Another issue eluded to
earlier concerns the amount of trucks moving empty. Table 7 shows the percent of trips by cargo type
destined to various land-uses.
Table 7 - Cargo by Land Use at Destination - Percent of Trips (Data from Triad, North Carolina
Commercial Vehicle Survey)
Cargo Type
Office
/Com
Retail
W-house/
Manuf.
Utility
Const-
ruction
Other
Empty 32.1 23.2 32.8 7.5 3.1 1.4
Food 5.7 80.4 4.6 9.3 -- --
Tobacco/Textiles/
Apparel 8.6 10.0 75.7 2.9 2.9 --
Conc./Lumber./Paper
or Furniture 60.0 7.3 24.8 2.4 4.2 1.2
Petr./Nat. Gas or Coal 8.6 16.7 58.0 12.3 2.5 1.9
Mach./Equip or
Supplies 5.6 6.9 30.6 56.9 -- --
Waste or
Scrap/HAZMAT 6.1 39.4 43.9 4.5 1.5 4.5
FAK (Freight All
Kinds) 21.7 31.9 33.9 9.4 0.3 2.9
Other 22.6 23.7 36.0 11.2 1.1 4.7
N/A 44.4 20.5 13.0 20.3 0.7 0.7
Total
26.2
26.1
32.1
11.9
1.7
2.0
Some areas, such as Portland, have developed a simplified classification system based on
combinations of STCC codes, and some areas, such as the CATS planning region in Chicago, have
simply added categories as needed. The coding and classification of cargo are critical elements of the
survey design.
Sample Size
COMMERCIAL VEHICLE SURVEY WHITE PAPER
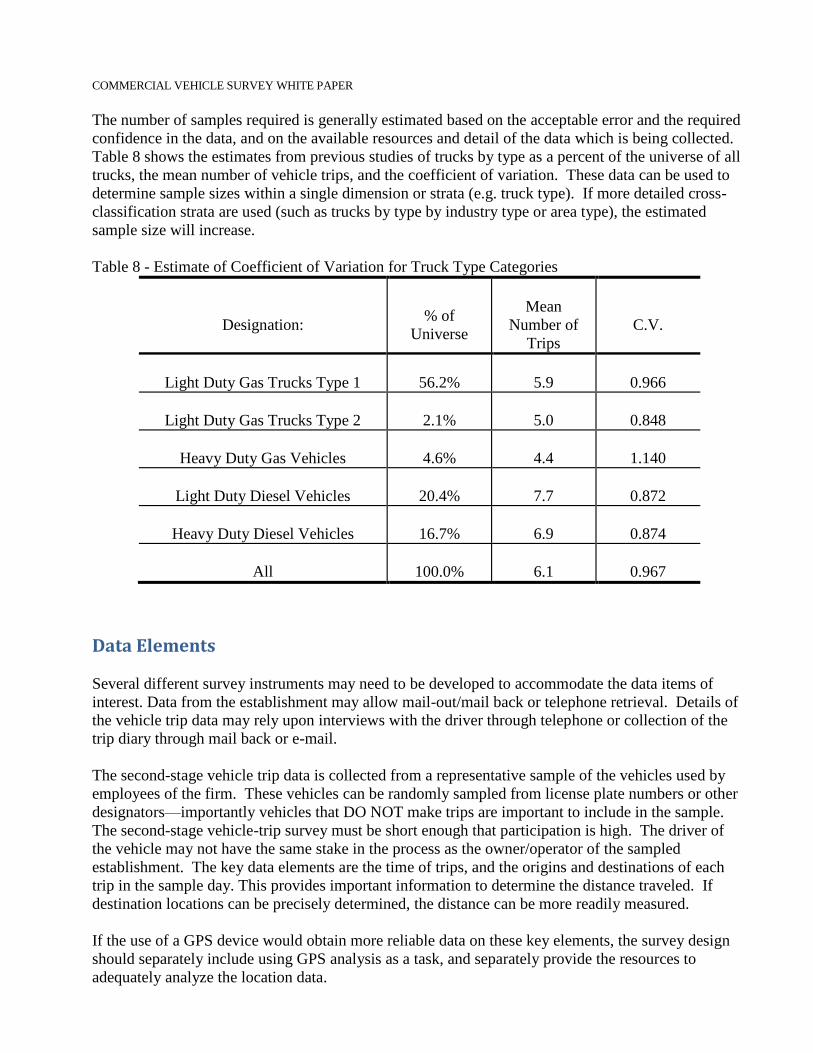
The number of samples required is generally estimated based on the acceptable error and the required
confidence in the data, and on the available resources and detail of the data which is being collected.
Table 8 shows the estimates from previous studies of trucks by type as a percent of the universe of all
trucks, the mean number of vehicle trips, and the coefficient of variation. These data can be used to
determine sample sizes within a single dimension or strata (e.g. truck type). If more detailed cross-
classification strata are used (such as trucks by type by industry type or area type), the estimated
sample size will increase.
Table 8 - Estimate of Coefficient of Variation for Truck Type Categories
Designation:
% of
Universe
Mean
Number of
Trips
C.V.
Light Duty Gas Trucks Type 1
56.2%
5.9
0.966
Light Duty Gas Trucks Type 2
2.1%
5.0
0.848
Heavy Duty Gas Vehicles
4.6%
4.4
1.140
Light Duty Diesel Vehicles
20.4%
7.7
0.872
Heavy Duty Diesel Vehicles
16.7%
6.9
0.874
All
100.0%
6.1
0.967
Data Elements
Several different survey instruments may need to be developed to accommodate the data items of
interest. Data from the establishment may allow mail-out/mail back or telephone retrieval. Details of
the vehicle trip data may rely upon interviews with the driver through telephone or collection of the
trip diary through mail back or e-mail.
The second-stage vehicle trip data is collected from a representative sample of the vehicles used by
employees of the firm. These vehicles can be randomly sampled from license plate numbers or other
designators—importantly vehicles that DO NOT make trips are important to include in the sample.
The second-stage vehicle-trip survey must be short enough that participation is high. The driver of
the vehicle may not have the same stake in the process as the owner/operator of the sampled
establishment. The key data elements are the time of trips, and the origins and destinations of each
trip in the sample day. This provides important information to determine the distance traveled. If
destination locations can be precisely determined, the distance can be more readily measured.
If the use of a GPS device would obtain more reliable data on these key elements, the survey design
should separately include using GPS analysis as a task, and separately provide the resources to
adequately analyze the location data.

COMMERCIAL VEHICLE SURVEY WHITE PAPER
Some data must come from the driver, however, such as the purpose of the trip (at a minimum
whether work-related or personal) and whether and what commodities were carried or what services
were provided for each trip. In many cases the trip might be simply a person traveling to a different
site.
The survey design should develop an initial list of data items required and then questions for each
stage of the survey. Some examples of questions at different stages include the items listed here (the
first four bullets are generally part of the establishment master file and just need to be verified with
the sampled businesses):
Firm name, address, contact person if available, telephone number
Geocoded location and area type (this is what you are adding to the file
6 digit SIC and NAICS codes
Employment size and sales ranges
Data Items for the Establishment:
Total Number of Employees
How long has this establishment been at this location?
Whether any vehicles are used by employees of this establishment during their normal duties
that are parked at the establishment over night, number of vehicles
Whether employees take vehicles home at night or use their own vehicles during their normal
duties, number of vehicles
Number of Employees that use vehicles as part of their normal duties
Basic use of the vehicles for this establishment:
o Package and Mail Delivery
o Freight Distribution
o Construction Transport
o Safety/Utility Vehicles
o Public Service Vehicles
o Business Services
o Personal Services
o Rental Cars
The number by type of vehicles used at this establishment, with license plate number or
unique identifier such as make/model/year/color (for sampling of vehicles):
o Motorcycle
o Car (passenger/station wagon)
o Pick-up
o Van
o SUV
o Panel Truck/Step van
o Combination Truck
o Other Truck
For Trucks:
o Weight (empty and loaded)
o Fuel type (gas/diesel/other)

COMMERCIAL VEHICLE SURVEY WHITE PAPER
Whether a manifest or GPS is used by drivers (if so, can we obtain the trip data for the sample
day(s)?)
Number/percent of vehicles used for goods movement
Type of commodity/goods carried
Land-use at destinations
Number of vehicle movements by trip type (deliver/pick-up/other) in an average day, per
vehicle for non-stationary vehicles
Number/percent of vehicle stationary in an average day
Number of deliveries to the site in an average week by type of vehicle
Number of commercial vehicle trips destined to the site that are not delivering goods in an
average week
Odometer reading for each sampled vehicle at begin and end of the survey day
If needed (at the establishment level):
Do the trucks at your facility make...?
Multiple trips by the same truck in and out every day
Travel on a chained series of trips (route) throughout the day, returning to the
site once or twice
Leave the site once and do not return that day
Come in and go out less than once a day
Trips vary/Can’t say
Other (specify)_______
Can the goods movement/truck trip be shifted in time out of the peak period?
What factors play a role in locating this facility:
Access to major freeways
Proximity to major shippers/warehouses
Proximity to major ports
Proximity to the airport
Proximity to rail
Possible concerns or problems (either Likert scale or open-ended):
Does traffic congestion pose a problem for you operation?
Are there locations with inadequate pavement or signage in your area?
Are there locations where it is difficult for trucks to maneuver in your area?
Are there locations where there is inadequate clearance to a bridge or other
vertical structure in your area?
Are there locations where traffic signals are need in your area?
Are there other concerns or problems your trucks experience at or near this
facility?
For the Vehicle Trip Inventory:
The origin location of the vehicle before the first trip of the travel day
The start time of the first trip
The end time of the trip
The type of place at destination (e.g. the sampled establishment, another site of the same
business, an office, retail center, residence, construction site, lunch location, etc.)
Address of destination
Was engine turned off at this stop (Y/N)

COMMERCIAL VEHICLE SURVEY WHITE PAPER
Purpose of the stop (deliver goods, pick-up goods, service call, meeting, personal stop for
driver)
Type of goods or services provides
Start location of next trip (the sampled establishment, the end of last trip, other place)
There are several aspects to the coding of the forms that should be considered.
Use of open ended questions should be avoided, alphanumeric codes are preferable,
There should be editing and correction for illogical answers, and
Trip destinations should be geocoded to determine their distance from the establishment
To the extent possible all survey forms should be self coding for the respondent, open ended questions
are difficult to process.
Conclusions and Recommendations
“Commercial Vehicles” and “Commercial Travel” include a wide range of vehicle types and trips--
everything from small package delivery, government services, personal services (such as plumbers,
lawn care, and realtors), and rental cars. Commercial vehicles have important differences in travel
behavior, especially by time of day and geography, when compared to private vehicle activity. It is
seldom advised to ‘factor’ home-based trip generation model inputs to account for commercial vehicle
activity.
Some of the pressing questions related to commercial vehicle assessment and forecasting include2:
How much of the traffic in an area is attributable to commercial vehicle movements?
How are commercial vehicle trips distributed, both by land-use of the origins and destinations
of trips, and by time of day of trip-making?
Can commercial vehicle trips be classified into meaningful categories, and tied to business
files (establishment data) to aid in forecasting?
What economic/demographic/land-use factors influence the magnitude and type of
commercial vehicle travel?
What data are needed to estimate and forecast commercial vehicle trips? What method (and
with what resources) can acquire the needed data?
Urban areas struggle with the common issues in conducting these surveys and using the data wisely.
Experience in conducting surveys of regional truck travel for input into the truck travel forecasting
model offer some general common findings3:
1) Trip length distribution and the truck size were related: generally the larger the truck the
longer the average trip length.
2) Number of daily trips and size of truck were related: generally, the larger the truck the fewer
number of average daily trips.
2 “The Magnitude and Distribution of Commercial Vehicles in Urban Transportation”, Maren Outwater, Nazul Islam, and Bruce Spear, TRB 2005 3 Truck Travel in the San Francisco Bay Area, prepared for Caltrans District 4 and Alameda County, prepared by Barton-Aschman Associates, December 1995
COMMERCIAL VEHICLE SURVEY WHITE PAPER
3) Daily peak patterns: truck travel is heaviest in the midday period and declines prior to the P.M.
commute period.
4) Trucks primarily serve commercial land uses: a majority of truck trips are destined for retail
establishments (25 percent), manufacturers (20 percent), or terminals/warehouses (20 percent).
However, a growing segment of truck travel (especially smaller panels and vans) is destined to
residential locations.
5) Local area characteristics determine truck travel type, for instance Chicago is a central hub for
truck and rail whereas Phoenix is on a through route connecting the east coast and southern
California.
This white paper has outlined some of the thorny issues related to designing and conducting a
commercial vehicle survey. The determination of the universe of garage locations is usually an
obstacle in the sample design, with the choice falling between using the vehicle registration file, and
developing a universe from a listing of businesses in the area. The creation of a strategic panel of the
largest truck owners is valuable as a policy tool, but does not garner specific quantitative information
about truck movements need to develop trip generation rates for existing garage locations and future
land-uses.
The generation of truck trips is tied to the amount and type of employment, allowing the forecast of
truck travel to be part of the socioeconomic forecast for the study area. The expansion of the data can
be made to the vehicle registrations, but a more precise method has been developed using sample
VMT by truck type and facility type and raising it to total truck VMT by facility type. This method
provides an accurate description of all truck travel in the region (shown in Appendix A).
This white paper summarizes a few of the more detailed findings from previous commercial vehicle
surveys with the idea to help planning agencies and consultants who may be developing future
commercial vehicle studies. Carefully designed and executed commercial vehicle surveys can obtain
critical information relevant to air quality, safety, and congestion. Hopefully, learning from the past
will shed light on the future, and the considerations set out here will help develop robust commercial
vehicle studies to obtain information for inclusion in a metropolitan forecast model.

COMMERCIAL VEHICLE SURVEY WHITE PAPER
Appendix A
Estimating Truck VMT by Functional Class of Roadway for Truck Survey Expansion
I. Estimation of truck VMT by Functional Class of Highway and Type of Truck using
vehicle counts at a sample of locations within a region.
If an estimate of total VMT by each stratum could be made, the mean percentage of trucks for each
would require fewer counts than the than the sample size suggested here. The following discussion
assumes that estimates of VMT by functional class and geography are not available.
The estimation of regional VMT is often accomplished by multiplying the length of a link by the count of
the vehicles traveling that link and summarizing the product across all links in the network. Such an
approach requires an estimate of the lengths of all links in a network and the number of trips traveling
each link. These data are not typically available. However, an unbiased estimate of VMT can be
obtained from vehicle counts at a sample of points in the region provided the road mileage in the region
is known.
Where:
VMT=VMT is the vehicle miles of travel on the roadway system,
Ʃ = summation
Vi = volume of vehicles counted at point (i) on the roadway system, and
n = number of sample count locations
L = mileage of roadway system
The standard error of the estimate of VMT is a function of the standard deviation of the mean of the
counts on that roadway. This approach can be extended to class of highway f and type of vehicle k
system.
Where:
VMTfk = estimated vehicle miles for functional class f and vehicle type k.
Lf = mileage of roadway system for that functional class
Ʃ = summation
Vi = volume of vehicles (k) counted at point (i) on the roadway system, and
n = number of sample count locations

COMMERCIAL VEHICLE SURVEY WHITE PAPER
The sample size requirement for count locations is a function of the precision and the level of
confidence desired. The precision is a function of the sample size, as shown below.
Where:
σ = Standard error of the mean count
= mean
σ = standard deviation of the counts
n = number of sample counts
The relative error is the ratio of the standard error of the mean to the mean. Typically the
confidence level is 90%, which is associated with 1.645 standard errors of the mean, or 95% which
is associated with 1.96 standard errors of the mean. If we wish to have a relative error of ± 5% at
the 90% confidence level, we can solve for the required sample size knowing the mean and the
standard deviation (which we do not know) or the coefficient of variation which we may estimate.
For example (this uses the equation above as a starting point):
= Coefficient of Variation
= Relative Error =
=
(For one standard error)
Then for 90% confidence level:
And if C.V. equals .9 and the relative error (e) is +/- 10 percent, then:
Of course, depending on the value of C.V. the required sample size (n) will be larger or smaller.
Below is an illustration of the effect on sample size for alternative values of coefficient of variation
and relative precision of ± 10% and ± 5% at the 90% confidence level.

COMMERCIAL VEHICLE SURVEY WHITE PAPER
Table 1 shows that depending on the variability of the truck counts, and assuming a standard
distribution, reasonable numbers of count locations can be used to estimate regional VMT by trucks.
For example, if the C.V is 1.1 the total number of sample locations would be estimated at 527 for a
relative error of +/- 10 percent. On the other hand, if C.V. = .7 the total sample count locations
would be 133-188.
Table 1 Sample Sizes for Alternative Coefficient of Variation for ± 10% and ± 5% at 90% Confidence Level
Coefficient of Variation Relative Error
± 10% ± 5%
1.1 327 465
1.0
.9
.8
.7
.6
.5
271
219
173
133
97
68
384
311
246
188
138
96
Truck Type
If the truck type will be separately analyzed then the type selected must serve some analytic purpose
or scheme including: accident analysis, emission calculations, loading/capacity analyses, etc. First
and foremost, the truck types must be accurately recognized by an observer counting traffic.
Classifying trucks by the number of axles is a time honored tradition. So also is configuration;
tractor, tractor-trailer, dump, tanker, etc. While there is more interest in items such as diesel or
gasoline, gross weight, etc. for air quality analysis, these attributes are difficult to assess as a vehicle
rolls by at 30 - 55 miles per hour. The counts of trucks by type must be manual classifications or
sophisticated counting devises that can, at least distinguish between light, medium, and heavy
vehicles.
Functional Class of Roadway
The amount and type of truck traffic varies by the type of roadway, therefore the roadways should
be separately classified. Typically, roadways are classified by volumes, such as:
•Interstate/Freeway
•Collectors
•Other Principal Arterials
•Local
•Minor Arterials
However, five classes might be too many to use for expansion by the time the number of truck types
and geographic types are considered. Table 2 shows the number of miles in each functional class

COMMERCIAL VEHICLE SURVEY WHITE PAPER
for the three counties in a recent study in North Carolina. Table 3 shows the number and percent by
area type. Table 4 shows the roadway miles summed by roadway type and the percent each
roadway contributes to the overall system. Table 5 shows the average percent of trucks on each
roadway type and the number of observations in three other areas in North Carolina.
Table 2 Functional Roadway Classification Mileage for Triad Study
Roadway
Classification
Forsyth County Guilford County Davidson and Randolph
Counties
Urb Rur Urb Rur Urb Rur
Interstates 16.17 7.14 30.23 10.62 11.56 3.26
Freeways 41.07 -- 86.10 -- 9.14 --
Other Principal
Arterials
37.04 30.01 83.43 28.28 27.08 24.87
Minor Arterials 82.87 24.50 270.70 18.97 72.30 24.87
Collectors 120.16 157.76 135.86 243.88 36.06 123.03
Local 1058.74 442.76 1218.18 763.24 289.07 366.71
Total 1356.05 662.17 1824.5 1064.99 445.21 542.74
Table 3 Total Roadway Mileage by Roadway Type
Urban Rural All
Interstates 57.96 1.6 21.02 .9 78.98 1.3
Freeways 136.31 3.8 -- -- 136.31 2.3
Other Principal
Arterials
147.55 4.1 83.16 3.7 230.71 3.9
Minor Arterials 425.87 11.7 68.34 3.0 494.21 8.4
Collectors 292.08 8.17 524.67 23.1 816.75 13.9
Local 2565.99 70.8 1572.71 69.2 4138.70 70.2
Total 3625.76 10.01 226.90 99.9 5895.66 100.0
Table 4 Functional Classification Mileage and Percent by Roadway Type
Roadway
Classification
Forsyth County Guilford County Davidson and
Randolph Counties
Total
num % num % num % num %
Interstates/
Freeways
64.38 3.2 126.95 3.9 23.96 2.4 215.29 3.7
Other Principal
Arterials
67.05 3.3 111.71 3.4 51.95 5.3 230.71 3.9
Minor Arterials 107.37 5.3 289.67 8.9 97.17 9.8 494.21 8.4
Collectors 277.92 13.8 379.74 11.6 159.09 16.1 816.75 13.9
Local 1501.50 74.4 1981.42 72.2 655.78 66.4 4138.70 70.2
Total 2018.22 100.0 2889.49 100.0 987.95 100.0 5895.66 100.1

COMMERCIAL VEHICLE SURVEY WHITE PAPER
Table 5 Number of Observations and Average Truck Percent by Functional Class in Three North Carolina Areas 4/
Roadway
Classification
Greensboro Fayetteville Gastonia Average
num % num % num % num %
Interstates/
Freeways
2 27.40 2 23.16 2 26.33 2 25.63
Other Principal
Arterials
21 17.55 7 17.98 22 13.47 17 16.3
Minor Arterials 21 15.47 16 16.23 17 14.22 18 15.3
Collectors 13 11.68 3 15.01 --- --- 8 13.4
Local 63 13.26 25 14.10 6 13.62 31 13.6
Total 120 --- 53 --- 47 --- 76 ---
The predominant roadway type in terms of mileage is clearly the local streets with 70 percent of the
mileage overall. Interstates and Freeways together have 5.2% of the urban mileage versus .9% of
the rural mileage. Other principal arterials have about 4% of the mileage (4.1% for urban and 3.7%
for rural). There appears to be a significant difference in minor arterials and collectors when viewed
from urban versus rural. Urban minor arterials contribute 11.7% of the mileage versus only 3.0%
for rural minor arterials. But rural collectors are 23.1% of rural mileage while urban collectors are
only 8.1% of urban mileage.
Stratification
If the volume counts at different locations tend to be less variable than they are overall grouping
counts into strata such as type of roadway will increase the precisian of the estimated VMT.
Moreover, because the purpose is to estimate VMT by trucks or class of truck, truck type is a logical
and required assessment for stratification. The three strata classes would be:
•Truck type; e.g. heavy and light
•Functional Class of roadway
•Geography; e.g. Urban and rural
Depending upon actual volumes, the initial categories of functional class would appear to be:
•Interstate/Freeway
•Other Principal Arterials
•Minor Arterials & Collectors
•Local Streets
4/Estimating Truck Traffic for Analyzing UGM Problems and Opportunities, Arun Chatterjee, Frederick Wegmann,
James Brogan, and Kunchit Piu-Nual, ITE Journal, May 1979, pp. 24-31.

COMMERCIAL VEHICLE SURVEY WHITE PAPER
Note that Interstates/Freeways have a percentage of trucks (26%) that is almost twice that of local
streets.
Allocation of Counts among Strata
A quota design with the same number of counts per cell is suggested. As a straw man, the sample
stratum (each cell) is given the same number of counts. Then there may be some re-assessment.
For instance, if the standard deviation of the count of trucks within a stratum is known or could be
approximated one might adjust the allocation to give fewer samples to the least volatile cells and
more to cells with higher coefficients of variation—for example, some rural roadways have highly
variable truck traffic combined with over-representation in fatal truck crashes. However, the design
should balance the concerns about variability in any one stratum and avoid extreme deviation from
the equal number of counts per cell.
The recommended stratification is by geography and functional class for count locations. Four
functional classes and two area types or 4 x 2 = 8; 17-25 count locations in each of the eight strata.
Table 6 Example Number of Count Locations by Functional Class and Area Type6
Function Class Urban Rural Total
Interstate/Freeway 20 20 40
Other Principal
Arterials
20 20 40
Minor Arterials &
Collect
20 20 40
Local Streets 20 20 40
Total 80 80 160
For expansion, if two or three truck types are used, four functional classes and two or three
geographies, there will be these strata for VMT estimation:
2 x 4 x 2=16 categories
3 x 4 x 2=24 categories
2 x 4 x 3=24 categories
3 x 4 x 3=36 categories
If two levels of geography are employed, the average count per strata will be equal to 20 (160/8).
This argues for holding the strata to 16. If three geographic levels were allowed with the same
overall sample count, the cell count would be 33, which puts one in a more tenuous position in
calculating precision per stratum.

COMMERCIAL VEHICLE SURVEY WHITE PAPER
II. Expanding Sample Truck Percent Data Using VMT Estimates
This section deals with the calculation of factors to raise the sample all trips to represent the
universe of all trips. Two approaches will be described; the first approach is the simpler and draws
directly upon the Houston-Galveston Report. The second method is an elaboration of the first and
more detailed.
A. Through Travel in the Region.
The sample truck data will not include through trips. Because the sample classification counts on
which the VMT estimates are based will include through travel, it will be necessary to remove
through trips. This can be accomplished if there is a network and a through-trip truck table by the
same truck types as used in this study. These can be assigned to the network and the resultant VMT
deducted from the strata estimates by geography, functional class and truck type.
B. Calculate Raising Factors - Method 1
1. Overall Sample Trip VMT - The trip length of each trip is the VMT for that trip. This can be
obtained via odometer readings or from the distance traveled over a least cost path on the
network. This statistic is used in method number 1. The sum of overall sample trip length is
the sample trip VMT.
C. Raising Factors - Method 2
VMT by Stratum - Method 2 requires that the trip length of a sampled truck trip be subdivided into
functional class and geographic components. This is somewhat more complicated but it can
be done using the least cost path method provided the links have been functionally and
geographically classified and into an assignment network.
For example, a trip that travels from origin to destination could use links that result in the mileages
shown in Table 7.

COMMERCIAL VEHICLE SURVEY WHITE PAPER
Table 7 Sample by Roadway Type
Urban Rural Total
Interstate/Freeway 4 0 4
Other Principal Arterial 2 0 2
Minor Arterial & Collections 2 0 2
Local 1 0 1
Total 9 0 9
Thus, this sample trip was nine miles over the road, all of it urban. Other trips would have different
functional class and geography components and different overall lengths.
2 (a).Sample VMT by Truck Type
Sum all sample trip lengths by truck type.
2 (b).Sample trip VMT by Truck Type, Functional Class, and Geography
Sum sample trip VMT components by Strata (Truck type, functional class, and geography).
3 (a). Calculate Raising Factors By Truck Type
Divide VMT by truck type (based on counts) VMT by truck type.
The result is a raising factor to be appended to each sample truck trip of that truck type. This
approach assumes that the distribution of VMT across strata of functional class and geography is
representative.
3 (b). Calculate Raising Factors by Truck Type, Functional Class and Geography - (Method 2)
This approach is much more complicated than method 1 but it is feasible and avoids the assumption
of uniform or average distributions of trip components among strata.
In this approach the sum of individual (sample) trips VMT by truck type by stratum is divided into
the estimate by stratum based on classification counts. These factors are then appended to each
sample record. The factored VMT for a record is calculated as the sum of the products of the factor
and sample VMT for that trip for each stratum. An individual trip raising factor can then be
calculated by dividing the weighted VMT for that trip by the trip length. Also, the weighted stratum
VMT for that sample trip can be aggregated by attributes of the truck itself to obtain a factor for
each stratum.