comparative analysis of classification algorithms on stock … · 2020-01-27 · comparative...
TRANSCRIPT
Comparative Analysis of Classification Algorithms on Stock Market Price Changes
NURSEL SELVER RUZGAR
Ted Rogers School of Management Ryerson University
350 Victoria Street, Toronto, ON M5B 2K3 CANADA
Abstract: - Price change on stock market is very important indicator for investors. In this paper, six Canadian banks’ daily stock market price changes are classified by seven data mining algorithms using Weka. Thirty-seven years of data from 1980 to 2017 obtained from NASDAQ for six Canadian banks with 21 independent variables and one dependent variable, price, are used to classify the daily stock price changes. The numerical data, daily price changes, are converted to nominal data as “up”, “down” and “same” observing the daily price changes according to previous day closing price. To determine which method makes the better classification, all methods run separately for each bank. Then to test the reliability of the techniques, each technique run and compared the original 2018 data. It is seen that, among the seven methods, individually and overall J48 classifies the stock price changes well. Moreover, the results show that J48 algorithm is a promising alternative to the conventional methods for financial prediction. Key-Words: - Classification, Logistic regression, Fuzzyrough-NN, Genetic Programming, J48, Random Forest, Navie Bayes, Navie Net, Weka, Data mining
1 Introduction Today’s life, researchers, practitioners deal with the big data or databases in different fields. To extract information, implicit pattern or knowledge from large data or databases mostly data mining (DM) techniques are used. DM attempts to formulate, analyze and implement basic induction processes that help extract meaningful information and knowledge from unstructured data. DM that aims to reveal valuable information from the overwhelming volume of data and achieve better strategic management and customer satisfaction is the process of using statistical, mathematical, artificial intelligence, and machine learning techniques to extract and identify useful information and knowledge assembled from large databases [1]. DM can be used in different disciplines, such as engineering [2, 3], finance [4], business, banking [5, 6], medicine [7-9], science [10] and social science [11]. DM tasks to uncover the different patterns to perform the analysis include characterization, discrimination, association analysis, classification, regression, cluster analysis, outlier analysis and evaluation analysis [12]. Classification is of the widely used DM method to extract information from various high-dimensional data sets. which is a work
of assessing a data object to include it in a certain class of available classes [13]. The classification includes the following algorithms, K-Nearest Neighbor (K-NN), Bayes, Bayes Net (BN), Navie Bayes (NB), Logistic regression (LR), Simple regression, Decision Tree (DT), J48, Random Forest (RF), Random Tree (RT), Rough Sets (RS), Fuzzy (F), Fuzzy Rough (FR), Fuzzy Rough-NN (FR-NN), Genetic Programming (GP), Associative Classification (AC), Neural Network (NN) and Support Vector Machine (VM) [14]. RS have been used to classify credit ratings in the global banking industry [15]. RS were also used to classify price movements [16], and financial data [17, 18]. FRS have been used for classification of stock markets [19]. GP has been applied in various fields of knowledge, such as pattern recognition, the utilization of the GP [20], DM, function regression, decision rule generation, time series forecasting, etc [21, 22]. GA has been widely employed on time series prediction problems, such as those illustrated in [21, 22]. GP has been also applied to financial time series prediction [23-25]. GP was used for the daily prediction of the exchange rate [23, 25]. Logistic regression (LR) is another popular linear classifier [14]. LR measures the relationship
WSEAS TRANSACTIONS on INFORMATION SCIENCE and APPLICATIONS Nursel Selver Ruzgar
E-ISSN: 2224-3402 174 Volume 16, 2019

between a response variable and independent variables, such as linear regression, LR classifies an observation into one of two classes, and this algorithm analysis can be used when the variables are nominal or binary. LR has been applied in a variety of areas, including the insurance sector [18] and loan performance [26]. Classification trees are not only used in the fields of probability and statistics, but also broadly used in applied fields, such as medicine, computer science, psychology, botany. Graphically displayed results help to the researchers to understand and interpret the results easily. RT, J48, RF, DT are some of the classification tree techniques. For example, RF was used to estimate residential property prices [11] in social sciences. On the other hand, in medicine, Protein datasets were used to calculate the performance of RF, RT, NB and J48 techniques [27] whereas K-NN, J48, NN, NB and VM classification techniques were used to diagnose Chronic Kidney Disease [7]. Besides, in computer science, to identify the operating system processes, DT based learning approach was used [2]. Classification of the price changes in stock markets has been a major interest of researchers and practitioners for many years. Many methods, including LR, cluster analysis, rough sets, fuzzy rough, fuzzy, GP algorithms, and several other techniques, have been used for the classification of price changes [13]. In this paper, seven classification techniques are used to classify the daily stock market closing price change of six Canadian banks: LR, FR-NN, GA, NB, BN, J48 and RF. To perform the analysis, Weka software is used as a tool. Weka allows the user to analyze the data from various perspectives and angles, in order to derive meaningful relationships. In this paper, to determine the best technique for current datasets seven techniques are compared with respect to accuracies, kappa statistics and confusion matrix using Weka 3.7.2 and 3.9.3 tools. The remainder of this paper is organized as follows. After briefly discussing the classification techniques in Section 2, the purpose and methodology are presented in Section 3. Then finding are discussed in Section 4, and conclusion will be given in Section 5.
2 Classification Algorithms Classification is one of the important DM method, which uses mathematical and statistical techniques. Classification is a data mining function that assigns items in a collection to target categories or classes. The main objective of classification is to accurately predict the target class for each data [28]. There are
various DM methods to classify the data. They mainly differ in the statistical assumptions made of the data and type of algorithms needed to construct the classifier [3]. In this section, seven classification algorithms are briefly explained. All methods predict the dependent variable by the independent variables. 2.1 Logistic regression (LR) The LR is a statistical model and a predictive analysis like all regression analyses. LR is applied only when the dependent variable is binary. [14]. LR is a classification algorithm used to assign observations to a discrete set of classes. In cases when categorical results such as successful-unsuccessful, ill-not ill, good-fair-bad are obtained especially as a result of evaluation of data, the logistic regression is a rather suitable statistical method. The logistic regression establishes very useful functional relation with independent variables (it may be cross sectional, continuous and categorical) in case the dependent variable is a categorical variable depended on two situations (it may be more). In this way, it gives opportunity for the categorical classification by using the regression analysis structure [18]. 2.2 Fuzzy Rough-NN (FR-NN) A FRS is a generalization of a rough set, derived from the approximation of a fuzzy set in a crisp approximation space of FRS [29]. The focus is to define lower and upper approximation of the set after the original data set is partitioned into 10 subsets. One of them is retained as testing data and the remaining 9 subsets are used. FRS is used to analyze fuzzy membership degree of moving objects’ predicted position and its k + m nearest neighbor to get more accurate k-nearest neighbor [30]. Jensen and Cornelis extended kNN Fuzzy rough nearest neighbor algorithm (FRS-NN) by using a single test object’s nearest neighbors to construct the fuzzy upper and lower approximations for each decision class [31]. The approach offers many ways in which to construct the fuzzy upper approximations [32, 33]. 2.3 Genetic Programming Algorithms (GP) GP is one of the DM methods widely used for prediction and optimization problems [25]. These algorithms encode a potential solution to a specific problem on a simple chromosome like data structure and apply recombination operators to these structures to preserve the critical information [34]. The steps of operations of GP Algorithm are: (1)-
WSEAS TRANSACTIONS on INFORMATION SCIENCE and APPLICATIONS Nursel Selver Ruzgar
E-ISSN: 2224-3402 175 Volume 16, 2019

initialize the population, (2)-calculate fitness for each chromosome in the population, (3)-reproduce selected chromosomes to form a new population, (4)-perform crossover and mutation on the population, and (5)-loop to second step until some condition is met. The fitness value is proportional to the performance measurement of the function being optimized [34]. In this algorithm, each individual encodes two logical rules which are formed by the attributes that survived after feature selection and the logical operators AND, OR and XOR. Primenta, found that this encoding scheme is very interesting, because it makes the implementation of crossover and mutation operators straightforward [25]. Since all nodes are logical, any node operation replacement operation leads to a valid solution. 2.4 J48 Classifier (J48) J48 is a popular machine learning algorithm based upon J.R. Quilan C4.5 algorithm. All data are of the categorical type and therefore continuous data will not be examined at this stage. The algorithm will however leave room for adaption to include this capability. The algorithm was tested against C4.5 for verification purposes [35]. The J48 algorithm can classify the data with decision tree method has its advantages can process numerical data (continuous) and discrete, can deal with missing attribute values, generates rules easier to interpret, and the fastest of algorithms that use main memory in computer [36]. 2.5 Random Forest (RF) This algorithm is built upon decision tree algorithm. It contains within itself some instances processed decision tree [37], otherwise this is a "forest" that contains some "trees"[38]. RF corresponds to a collection of combined DT {hk(x,Tk)}, where k = 1,2,...,L where L is number the tree and Tk is the training set built at random and identically distributed, hk represents the tree created from the vector Tk and is responsible for producing an output x. DT are tools that use divide-and-conquer strategies as a form of learning by induction [39], Thus, this tool uses a tree representation, which helps in pattern classification in data sets, being hierarchically structured in a set of interconnected nodes. The internal nodes test an input attribute feature in relation to a decision constant and, this way, determine what will be the next descending node. Therefore, the nodes considered as leaves classify the instances that reach them according to the associated label. The trees that make up the Random Forest are built randomly selecting m (value fixed for all nodes) attributes in each node of
the tree; where the best attribute is chosen to divide the node. The vector used for training each tree is obtained using random selection of the instances. Thus, to determine the class of an instance, all the trees indicate an output, where the most voted is selected as the result. So, the classification error depends on the strength of individual trees of the forest and the correlation between any two trees in the forest [40]. 2.6 Navie Bayes (NB) The NB is a classification technique based on Bayesian theorem of probability that computes a likelihood by checking the recurrence of values and blends of values in the historical data. Bayes' Theorem finds the likelihood of an occasion happening given the likelihood of another occasion that has as of now happened. [41]. It is particularly used when the dimensionality of the inputs is high. The NB Classifier is efficient in computing the most possible output based on the input. In this classifier it is possible to add new raw data at runtime and get a better probabilistic classifier [42]. When the class variable is given, NB classifier considers that the presence of an attribute is not related to the presence of any other attribute [43]. NB is a numeric estimator, where precision values are chosen based on analysis of the training set. This classifier will use a default precision of 0.1 for numeric attributes when built classifier is called with zero training instances [44]. 2.7 Bayes Net (BN) BN classifiers are competitive performance classifiers [45] with the added benefit of interpretability. Formally, a BN is composed of directed acyclic graph and conditional probability tables for each variable. NB updateable operate on an assumption of class conditional independence. Constructing a BN is a two-step process, constructing a BN Structure and Learning Conditional Probabilities. BN structure has a set of associated conditional probabilities over the set of variables X={ x1, x2, …, xn}. A BN classifier is simply a BN applied to classification, that is, the prediction of the probability P(A | X) of some discrete (class) variable A given some features X [46]. Weka implements state-of-the-art algorithms for learning BN Structure, such as Local Score Metrics, Conditional Independence Tests, Global Score Metrics and fixed structure. After constructing BN any of the approaches above, using the one of the estimators, Simple Estimator, BMA Estimator, MultiNomnalEstimator and BayesNetEstimators [48] in the Weka DM tool,
WSEAS TRANSACTIONS on INFORMATION SCIENCE and APPLICATIONS Nursel Selver Ruzgar
E-ISSN: 2224-3402 176 Volume 16, 2019

provides utility functions for prediction and inference model evaluation with network scores and cross-validated estimation of predictive performance, and model analysis [46]. 2.8 Weka Software Weka is an efficient DM tool with a vast capacity of analysis that has been introduced by Waikato University, New Zealand under GNU public License. Weka contains many inbuilt algorithms for DM and machine learning. Weka implements algorithms for data preprocessing, classification, clustering, association rules; it also includes a visualization tool [47, 48]. In Weka, we have three basic steps for classification: 1) preparing the data, 2) choose to classify and apply algorithm and 3) analyze the result or output. It supports multiple dataset formats like csv data files, Json Instance files, libsvm data files, Matlab ASCII files etc., with the default being ARFF. Data files making it invariably a strong candidate for DM on heterogeneous types of datasets1[49]. According to the data type (nominal, ordinal or interval), one of the suitable algorithms can be applied to the data set to extract information. Then, to carry out the criteria, some measurements such as kappa statistic, accuracy, root mean square error, ROC, and so on are computed. In the next step, values of the statistical criteria that are compared to classification algorithms are calculated by using a confusion matrix. Confusion matrix presents a visualization of the classification performance based on a table that contains columns representing the instances in a predicted class and rows representing the instances in an actual class. The classification accuracy is the proportion of the total number of predictions that were correct. The classification accuracy is the percent ratio of the number of correctly predicted data points to the total number of data points. In literature, 80% is assumed as the threshold point [50] for financial data. If it is closed to 100% the accuracy is an overwhelming situation to say that the data are perfectly classified. The other criterion is kappa statistic, which is frequently used to test interrater reliability. Like most correlation statistics, the kappa can range from −1 to +1 [51]. Cohen suggested the kappa result can be interpreted as follows: values ≤ 0 as indicating no agreement and 0.01–0.20 as none to slight, 0.21–0.40 as fair, 0.41– 0.60 as moderate, 0.61–0.80 as substantial, and 0.81–1.00 as almost perfect agreement [13].
3 Methodology DM is the process of using statistical, mathematical, artificial intelligence, and machine learning techniques to extract an identify useful information and knowledge assembled from large data bases. Classification is one of the most important DM technique and there are different classification techniques. To find out the best convenient DM technique to classify the stock price changes of six different Canadian banks, Weka was used as a tool. Among the others, seven classifiers of Weka, LR, FR-NN, GP, J48, RF, NB and NN, were used as basis of evaluation or analysis. This paper uses data panel to analyze the data for the period of 1980 to 2018 for six major banks in Canada. The purpose of this paper is to get more accurate and more reliable predicted
stock market price changes to classify the daily stock price changes for six
banks for future predictions to determine which technique among the seven
DM classification techniques most efficiently classifies the daily stock price changes
to find out which method gives the most accurate results when the method applied for each bank’s data separately. [13]
In this study, 3.9.3 and 3.7.2 versions of Weka were used. Weka software utilizes seven classification algorithms. To determine the best classifier, the parameters, accuracy and kappa statistic were used as the measurement method. While implementing the classifiers on the real dataset two test modes, 10-fold cross validation and full training set were considered. All the seven classifiers, mentioned above, were implemented using the real dataset stock price changes of six Canadian Banks separately. In the present study, only classification technique is used for analysis. Classification contains eleven different types of classifiers in Weka: Bayes, Functions, Fuzzy, Genetic Programing, Meta, Mi, Misc, Scripting, Lazy, Rules and Trees. In this paper, seven of them were used as classifiers of stock price changes of each six Canadian banks; under Bayes, NB and BN; under functions, LR; under Genetic Programming, GP; under fuzzy, FR-NN; and under Trees, RF and J48. For this purpose, six large Canadian banks’ stock market daily price changes, over the period from 1980 to 2018, were examined by seven different DM classification techniques using Weka. Data for six banks were obtained from NASDAQ [53]. Each data set has 21 independent variables, and 1 dependent variable. Independent variables are Daily Opening price, Daily Opening bid, Daily
WSEAS TRANSACTIONS on INFORMATION SCIENCE and APPLICATIONS Nursel Selver Ruzgar
E-ISSN: 2224-3402 177 Volume 16, 2019
Opening ask, Daily Closing price, Daily Closing bid, Daily Closing ask, Daily High, Daily Low, Daily Transactions, Daily Volume, Daily Quotes, Daily Quote changes, Daily Return, S&P/TSX Composite Price Index, S&P/TSX Composite Total Return Index, Sector 40 (Financials) Price Index, Sector 40 (Financials) Total Return Index, S&P/TSX 60 Price Index, S&P/TSX 60 Total Return Index, Call Loan Interest Rate and Foreign Exchange Rate (CA$/US$) and the dependent variable is the change in daily closing price according to the previous day’s closing price. The dependent variable is the daily closing price change, which is grouped as “up”, “down” and “same” according to the previous day’s stock market daily closing price. Instead of working with numeric data, daily stock prices were converted to categorical data observing the closing price increase (UP), decrease (DOWN) or remains same (SAME), according to the closing price on the previous day. If the closing price increased relative to the previous day’s closing price, “up” is assigned as the new variable component, if the closing price is decreased relative to the previous day’s closing price, “down” is assigned as the new variable component, and similarly, if the closing price remained the same, “same” is assigned as the new variable component. Classification is a two-step process. In the first step, the training data are analyzed by a classification algorithm. In the second step, test data are used to estimate the accuracy of the classification rules. In this paper, firstly, seven DM classification techniques for the data from 1980 to 2017 were run for each bank separately. Secondly, the predicted values for 2018 from the first run were compared with the real 2018 data to test the validities of models or to see the accuracy of models in how the predicted values were compatible to the real values. It is not known which algorithm is the best for the current problem. That is why different classification techniques should be compared.
4 Findings Seven classification techniques were applied to the data sets for six major banks in Canada from 1980 to 2017 using Weka 3.7.2 and 3.9.3 to determine the best classification technique with the best prediction accuracies. There are various measurement methods in DM that can reflect the predictability of the trained data such as accuracy, kappa statistics, F-measure, sensitivity, precision, recall and ROC curve. This paper evaluates the performance of classification algorithms based on accuracy, kappa statistic which measure the classifier’s prediction capability and confusion matrix. The detailed
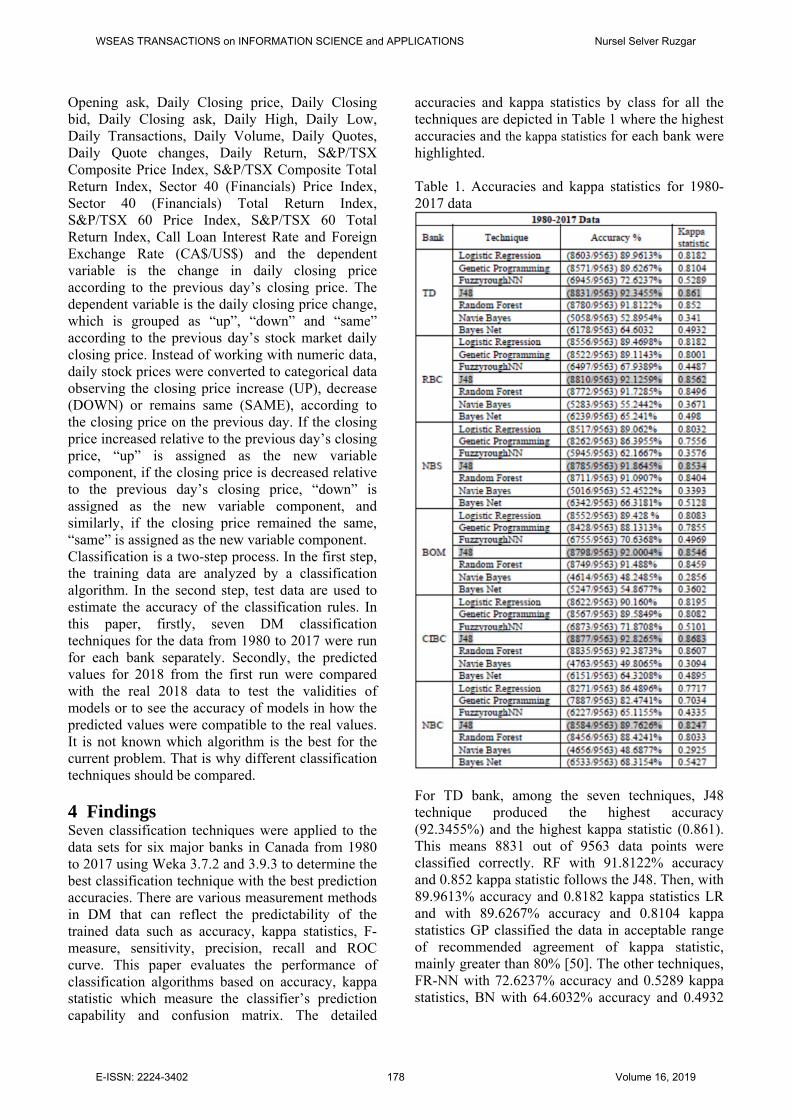
accuracies and kappa statistics by class for all the techniques are depicted in Table 1 where the highest accuracies and the kappa statistics for each bank were highlighted. Table 1. Accuracies and kappa statistics for 1980-2017 data
For TD bank, among the seven techniques, J48 technique produced the highest accuracy (92.3455%) and the highest kappa statistic (0.861). This means 8831 out of 9563 data points were classified correctly. RF with 91.8122% accuracy and 0.852 kappa statistic follows the J48. Then, with 89.9613% accuracy and 0.8182 kappa statistics LR and with 89.6267% accuracy and 0.8104 kappa statistics GP classified the data in acceptable range of recommended agreement of kappa statistic, mainly greater than 80% [50]. The other techniques, FR-NN with 72.6237% accuracy and 0.5289 kappa statistics, BN with 64.6032% accuracy and 0.4932
WSEAS TRANSACTIONS on INFORMATION SCIENCE and APPLICATIONS Nursel Selver Ruzgar
E-ISSN: 2224-3402 178 Volume 16, 2019

kappa statistics and NB with 52.8954% accuracy and 0.341 kappa statistics did not performed well. For RBC bank, among the seven techniques, like TD bank, J48 technique produced the highest accuracy (92.1259%) and the highest kappa statistic (0.8562). It classified 8810 out of 9563 data points correctly. RF with 91.7285% accuracy and 0.8496 kappa statistic follows the J48. Then, with 89.4698% accuracy and 0.8182 kappa statistics LR and with 89.1143% accuracy and 0.8001 kappa statistic GP classified the data in acceptable range of accuracy. The other techniques, FR-NN with 67.9389% accuracy and 0.4487 kappa statistic, BN with 65.241% accuracy and 0.498 kappa statistics and NB with 55.2442% accuracy and 0.3671 kappa statistic did not performed well. For NBS bank, among the seven techniques, like TD and RBC, J48 technique produced the highest accuracy (91.8645%) and the highest kappa statistic (0.8534). This means 8785 out of 9563 data points were classified correctly. RF with 91.0907% accuracy and 0.8404 kappa statistic and then with 89.062% accuracy and 0.8032 kappa statistic LR follow the J48. The other techniques, GP with 86.3955% accuracy and 0.7556 kappa statistic, BN with 66.3181% accuracy and 0.5128 kappa statistic, FR-NN with 62.1667% accuracy and 0.3576 kappa statistic, and NB with 52.4522% accuracy and 0.3393 kappa statistic, respectively, did not performed well. For BOM bank, among the seven techniques, again J48 technique produced the highest accuracy (92.0004%) and the highest kappa statistic (0.8546). It classified 8798 out of 9563 data points correctly. Then, RF with 91.488% accuracy and 0.8459 kappa statistic, and LR with 89.428% accuracy and 0.8083 kappa statistics follow the J48 respectively. On the other hand, the other techniques, GP with 88.1313% accuracy and 0.7855 kappa statistic, FR-NN with 70.6368% accuracy and 0.4969 kappa statistic, BN with 54.8677% accuracy and 0.3602 kappa statistic, and NB with 48.2485% accuracy and 0.2856 kappa statistic, respectively, did not performed well. For CIBC bank, among the seven techniques, again J48 technique produced the highest accuracy (92.8265%) and the highest kappa statistic (0.8683). It classified 8877 out of 9563 data points correctly. Then, with a very small difference, RF with 92.3873% accuracy and 0.8607 kappa statistic, LR with 90.160% accuracy and 0.8195 kappa statistic and GP with 89.5849% accuracy and 0.8082 kappa statistic classified the data for CIBC, respectively. On the other hand, the other techniques, FR-NN with 71.8708% accuracy and 0.5101 kappa statistic, BN with 64.3208% accuracy and 0.4895 kappa
statistic, and NB with 49.8065% accuracy and 0.3094 kappa statistic, respectively, did not performed well. For NBC bank, among the seven techniques, again J48 technique produced the highest accuracy (89.7626%) and the highest kappa statistic (0.8247). It classified 8584 out of 9563 data points correctly. Then, RF with 88.4241% accuracy and 0.8033 kappa statistic is the second-best classifier. The other techniques, LR with 86.4896% accuracy and 0.7717 kappa statistic, GP with 82.4741% accuracy and 0.7034 kappa statistic, BN with 68.3154% accuracy and 0.5427 kappa statistic, FR-NN with 65.1155% accuracy and 0.4335 kappa statistic, and NB with 48.6877% accuracy and 0.2925 kappa statistic did not performed well, respectively. When the techniques are compared for different banks, J48 seems the best classifier according to the accuracy and kappa statistic. After applying each technique, on the output, a confusion matrix is obtained, which presents a visualization of the classification performance based on a table that contains columns representing the instances in a predicted class and rows represent the instances in an actual class [13]. Since the classifier J48 classified thirty-seven years data of each bank, in this paper, the confusion matrices will be given only for J48 technique (Table 2). Table 2 shows the confusion matrix for each bank containing statistical measures used to describe the ability of the classifier to discriminate among the cases with “up”, “down” and “same” classes. The classification accuracy is the proportion of the total number of correct predictions. For example, in the actual case for TD, out of 9563 data points, 8831 stock prices were classified correctly. Where stock prices increased in the previous day, 4527 of them increased; where stock prices decreased in the previous day, 4134 of them decreased; and where stock prices remained same in the previous day, 170 of them remained the same with 92.3455% (=(4527+4134+170)/9563 %) accuracy. In the predicted case for TD, out of 251 prices 247 stock prices were classified correctly. Where the stock prices increased in the previous day, 135 of them increased; where stock prices decreased in the previous day and 112 of them decreased in the previous day with 98.4064% (= (135+112)/251%) accuracy. Similarly, for RBC bank, 8810 real instances out of 9563 with 92.1259% accuracy were classified correctly. Where the stock prices increased in the previous day, 4527 of them increased; where stock prices decreased in the previous day, 4149 of them decreased; and where stock prices remained the same in the previous day, 134 of them remained the same. 249
WSEAS TRANSACTIONS on INFORMATION SCIENCE and APPLICATIONS Nursel Selver Ruzgar
E-ISSN: 2224-3402 179 Volume 16, 2019

prediction instances out of 251 with almost perfect accuracy, 99.2032%, were classified correctly. Where the stock prices increased in the previous day, 135 of them increased; and where stock prices decreased in the previous day, 114 of them decreased. Table 2. J48 classifier Confusion Matrices Reals and Predictions for each bank
For NBS bank, 8785 real instances out of 9563 with 91.8645% accuracy were classified correctly. Where the stock prices increased in the previous day, 4462 of them increased; where stock prices decreased in the previous day, 4131 of them decreased; and where stock prices remained the same in the previous day, 192 of them remained the same. 243 prediction instances out of 251 with 96.8127% accuracy were classified correctly. Where the stock prices increased in the previous day, 114 of them increased; where stock prices decreased in the previous day and 129 of them decreased. For BOM bank, 8798 real instances out of 9563 with 92.0004% accuracy were classified correctly. Where the stock prices increased in the previous day, 4493 of them increased; where stock prices decreased in the previous day, 4151 of them decreased; and where stock prices remained the same in the previous day, 154 of them remained the same. 247 prediction instances out of 251 with 98.4064% accuracy were classified correctly. Where the stock prices increased in the previous day, 136 of them increased; and where stock prices decreased in the previous day, 111 of them decreased. For CIBC bank, 8877 real instances out of 9563 with 92.8265% accuracy were classified correctly. Where the stock prices increased in the previous day, 4516 of them increased; where stock prices decreased in the previous day, 4238 of them decreased; and where stock prices remained the same in the previous day, 123 of them remained the
same. 249 prediction instances out of 251 with almost perfect accuracy, 99.2032%, were classified correctly. Where the stock prices increased in the previous day, 139 of them increased; and where stock prices decreased in the previous day, 110 of them decreased. Finally, for NBC bank, 8584 real instances out of 9563 with 89.7626% accuracy were classified correctly. Where the stock prices increased in the previous day, 4197 of them increased; where stock prices decreased in the previous day, 3957 of them decreased; and where stock prices remained the same in the previous day, 430 of them remained the same. 242 prediction instances out of 251 with 96.4143% accuracy were classified correctly. Where the stock prices increased in the previous day, 129 of them increased; and where stock prices decreased in the previous day, 113 of them decreased. In this paper, after determining the most convenient technique running the seven DM classification technique for the data from 1980 to 2017 for each bank separately, the predicted values for 2018 from the first run were compared with the real 2018 data to test the validities of models or to see the accuracy of models in how the predicted values were compatible to the real values. There were 251 data points for each bank for 2018. The seven techniques result for the 2018 data for each bank summarized in Table 3, where the accuracy and kappa statistic for each technique were given. For TD bank, J48, RF and BN classified the 2018 data with the same accuracy (98.4064%) and kappa statistic (0.968). The other techniques, GP and LR were giving the promising results for the classification whereas FR-NN and NB were not due to low accuracies and kappa statistics. For RBC bank, RF and BN produced the same highest accuracies (99.6016%) and kappa statistics (0.992). While J48 and GP were producing very close accuracies and kappa statistics to RF and BN, two techniques, FR-NN and NB were having very low accuracies in the range of 58%-69% and weak kappa statistics in the range of 0.11 to 0.38. The accuracy (92.4303%) and kappa statistic (0.8491) of LR technique were moderate when it was compared with the other techniques. Like TD bank, the results show that J48, RF and BN techniques producing the same highest accuracies and strong kappa statistics for NBS, CIBC and NBC banks. When compared with J48, RF and BN techniques, GP moderately classified the data of NBS, CIBC and NBC banks. On the other hand, NB and FR-NN techniques were not good classifiers due to low accuracies and weak kappa statistics. However, while LR having moderate accuracy and
WSEAS TRANSACTIONS on INFORMATION SCIENCE and APPLICATIONS Nursel Selver Ruzgar
E-ISSN: 2224-3402 180 Volume 16, 2019

acceptable kappa statistic for CIBC data, it has low accuracies and weak kappa statistics for NBS and NBC. For BOM bank, with the highest accuracy and strong kappa statistic RF technique, then J48 and GP techniques showed promising results, but the other techniques, FR-NN, BN, NB and LR have low accuracies and weak kappa statistic. Table 3. Accuracies and kappa statistics for 2018 data
5 Conclusion Analysed financial data has a crucial role for investors. There exist various DM methods to analyse the financial data, the classification is one of them. In this paper, Weka is used for analysis. There are many in built DM algorithms in Weka used for classification. In this paper, only seven of them were selected and run to classify the daily stock market price changes of six Canadian banks in
the period from 1980 to 2018. The analysis was carried out using Weka 3.7.2 and 3.9.3 software with seven algorithms LR, GP, FR-NN, J48, RF, NB and BN. These algorithms were first run using the 1980 to 2017 data for each bank separately, then the predicted values from the first run were applied to 2018 data for each bank to test how closely the predicted pattern compared to the real values. The performances of algorithms were determined by 10-fold cross validation and full training set and accuracy and kappa statistic were utilized. Then, the confusion matrix for each data set and each bank was obtained to present a visualization of the classification performance based on a table. Selecting a best algorithm depends on data. It is difficult to say a specific one is the best. For this reason, different classification algorithms for the same type of data should be compared. To determine the best technique fits this kind of data, seven techniques were applied for the data of six banks separately, then the comparison of the techniques was done according to each individual bank, then across all the banks. When the techniques were compared for thirty-seven years data, it was seen that the classifier J48 classified six different data with the highest accuracy and strong kappa statistics whereas FR-NN, BN and NB techniques did not classify any of the data well, because they produced low accuracies and weak kappa statistics. The second-best classifier was another tree technique, RF. Then GP and LR followed. The results when each technique was applied and compared with the 2018 real data to test the reliability of the techniques, showed that accuracies and kappa statistics were dramatically increased, which means that each technique can be used for prediction. But, again mostly J48, then RF and BN produced the highest accuracy and kappa statistic. As a conclusion, J48 gives a promising alternative to the conventional methods for financial prediction. For future research, the other test modes should be used with different classification parameters to determine the best fit technique for such financial data. References [1] Kusrini, L.E.T. Algoritma Data Mining, Andi
Publishing, Yogyakarta. Indonesia, 2009. [2] Kumar, A., Kumar, S., Decision Tree based
Learning Approach for Identification of Operating System Processes, WSEAS TRANSACTIONS on COMPUTERS, Volume 13, 2014, pp. 277-288.
WSEAS TRANSACTIONS on INFORMATION SCIENCE and APPLICATIONS Nursel Selver Ruzgar
E-ISSN: 2224-3402 181 Volume 16, 2019

[3] Carrizos, E. and Morales, D.R., Supervised classification and mathematical optimization, Computers & Operations Research, Vol. 40, 2013, pp. 150–165.
[4] Cheng, C. H., Chen, T. L., Wei, L.Y., A hybrid model based on rough sets theory and genetic algorithms for stock price forecasting, Information Sciences, Vol. 180, 2010, pp. 1610–1629.
[5] Dalloshi, P., Badivuku-Pantina, M., Empirical assessment of the impact of banking sector development on firm external financing, using the MELR model, WSEAS TRANSACTIONS on BUSINESS and ECONOMICS, Vol. 15, 2018, pp. 512-521.
[6] Ferreira L., Borenstein D., Righi, M. B., Filho D. Teixeira, A., A fuzzy hybrid integrated framework for portfolio optimization in private banking, Expert Systems with Applications, Vol. 92, 2018, pp. 350–362.
[7] Zeynu, S., Patil, S., Prediction of Chronic Kidney Disease Using Data Mining Feature Selection and Ensemble Method, WSEAS TRANSACTIONS on INFORMATION SCIENCE and APPLICATIONS, Vol. 15, 2018, pp. 168-176.
[8] Ivasic-Kos, M., Ipsic, I., Ribaric, S., Multi-level Image Annotation Using Bayes Classifier and Fuzzy Knowledge Representation Scheme, WSEAS TRANSACTIONS on COMPUTERS, Vol. 13, 2014, pp. 635-644.
[9] Ramamurthy, B. and Chandran, K.R., Shape-BasedImage Retrieval Using Canny Edge Detection and K-Means Clustering Algorithms for Medical Images. International Journal of Engineering Science and Technology, Vol. 3, 2011, pp. 1870–1877.
[10] Singh, P. and Surya, A., Performance Analysis of Clustering Algorithms in Data Mining in Weka, International Journal of Advances in Engineering & Technology, ©IJAET ISSN: 22311963, Vol. 7(6), 2015, pp. 1866-1873.
[11] Zeffora, J., Shobarani. A, R., Statistical Analysis of Random Forest on Real Estate Prediction, International Journal of Innovative Technology and Exploring Engineering (IJITEE) ISSN: 2278-3075, Vol. 8 (8S), June 2019, pp. 640-644.
[12] Sharma, N., Om, H., Early Detection and Prevention of Oral Cancer: Association Rule Mining on Investigations, WSEAS TRANSACTIONS on COMPUTERS, Vol. 13, 2014, pp. 1-8.
[13] Ruzgar, N. S., Classification of Stock Market Price Change by Data Mining, The Journal of
American Academy of Business, Cambridge, Vol. 25(2), 2020, pp.1-9.
[14] Andriansah, Jl. R. C. and Achmad S.Jl. R. C., Comparative Accuracy of Regression Logistic Algorithm and C4.5 Based Chi Squared and Practical Swarm Optimization for Prediction Feasibility of Credit Giving, International Journal of Advance Studies in Computer Science and Engineering, IJASCSE, Vol. 7(7), 2018, pp. 1-7.
[15] Chen, Y-S., Cheng, C.-H., Hybrid models based on rough set classifiers for setting credit rating decision rules in the global banking industry, Knowledge-Based Systems, Vol. 39, 2013, pp. 224–239.
[16] Ruzgar, N. S., Ruzgar B., Unsal, F., An Analysis of Price Movements Using the Rough Set Theory Approach, 19th International Conference on APPLIED MATHEMATICS (AMATH '14), Mathematics and Computers in Science and Engineering Series, Vol. 38, 2014, pp. 91-98.
[17] Ruzgar, N. S., Ruzgar, B., Unsal, F., Rough set theory and discriminant analysis to classify financial data, International Journal of Economics and Statistics, Vol. 3, 2015, pp. 110-116.
[18] Ruzgar, B., Ruzgar, N. S., Classification of the Insurance sector with logistic regression, International Journal of Mathematical Models and Methods in Applied Sciences, Vol. 1(1), 2007, pp. 168-174, ISSN: 1998-0140, http://www.naun.org/journals/m3as/
[19] Xiao-feng, H., Li, S-s., Research on predicting stock price by using fuzzy rough set, International Conference on Management Science & Engineering, 17th Annual Conference Proceedings, Nov. 2010, DOI: 10.1109/ICMSE.2010.5719937 Melbourne, VIC, Australia, pp. 24-26
[20] Grosan, C., Abraham, A., Stock Market Modeling Using Genetic Programming Ensembles, Genetic Systems Programming, Nadia Nedjah et al. (Eds.), Studies in Computational Intelligence, Springer Verlag, Germany, 2006, pp. 131-146.
[21] Alfaro-Cid, E., Sharman, K., Esparcia-Alcázar, A. I., Genetic programming and serial processing for time series classification. Evolutionary Computation, Vol. 22(2), 2014, pp. 265–285.
[22] Kattan, A., Fatima, S., Arif, M., Time-series event-based prediction: An unsupervised learning framework based on genetic programming, Information Sciences, Vol. 301, 2015, pp. 99–123.
WSEAS TRANSACTIONS on INFORMATION SCIENCE and APPLICATIONS Nursel Selver Ruzgar
E-ISSN: 2224-3402 182 Volume 16, 2019
[23] Vasilakis, G. A., Theofilatos, K. A., Georgopoulos, E. F., Karathanasopoulos, A., Likothanassis, S.D., A genetic programming approach for EUR/USD exchange rate forecasting and trading, Computational Economics, Vol. 42(4), 2013, pp. 415–431.
[24] Dabhi, V. K., Chaudhary, S., Financial time series modeling and prediction using postfix-gp., Computational Economics, 2015, pp. 1–35.
[25] Pimenta, A., Nametala, C. A. L., Guimarães, F.G., Carrano, E. G., An Automated Investing Method for Stock Market Based on Multiobjective Genetic Programming, Computational Economics, Vol. 52, 2018, pp. 125–144. https://doi.org/10.1007/s10614-017-9665-9.
[26] Creamer G., Freund Y., Predicting performance and quantifying corporate governance risk for Latin American ADRs and banks, Proceedings of the Financial Engineering and Applications Conference, 2004, pp. 91-101, Cambridge, UK; Acta Press.
[27] Rani, R. R., Manikandan, P., Chitra, R., An Empirical Analysis of Classification Trees Algorithm for Protein Datasets, International Journal of Advanced Research in Computer Science, Vol. 6(6), 2015, pp.34-39.
[28] Wei F., Bifet, A., Mining Big Data: Current Status, and Forecast to the Future, SIGKDD Explorations, Vol. 14(2), 2012.
[29] Jensen, R., Combining rough and fuzzy sets for feature selection, Book published in 2005.
[30] Jensen, R., Prediction of Moving Objects' K-Nearest Neighbor Based on Fuzzy-Rough Sets Theory. In Fuzzy Systems and Knowledge Discovery, Fourth International Conference 1 IEEE., 2007, pp. 407-411.
[31] Jensen, R., Cornelis, C., Fuzzy-Rough Nearest Neighbour Classification, Transactions on Rough Sets, Vol. 13, Springer-Verlag Berlin Heidelberg 2011, pp. 56-72.
[32] Napoles, G., Carlos M., Rafael F., Isel G., Rafael B., Koen V., Fuzzy-Rough cognitive Networks, Neural Networks, Vol. 97/C, 2018, pp. 19-27, Elsevier Science Ltd. Oxford, UK.
[33] Kumar, M., Yadav, N., Fuzzy Rough Sets and Its Application in Data Mining Field, Advances in Computer Science and Information Technology (ACSIT), Vol. 2(3), 2015, pp. 237-240.
[34] Elmi, Z., Faez, K., Goodarzi, M., Goudarzi, N., Feature selection method based on fuzzy entropy for regression in QSAR studies, Research Article, Molecular Physics, Vol. 107(17), 2009, pp. 1787–1798.
[35] Ras Z., Dardzinska A., From Data to Classification Rules and Action, International Journal of Intelligent Systems, Wiley, Vol. 26(6), 2011, pp. 572-590.
[36] G. Kaur and A. Chhabra, “Improved J48 Classification Algorithm for the Prediction of Diabetes,” International Journal of Computer Applications, Vol. 98(22), 2014, pp. 13–17.
[37] Breiman, L., Manual on setting up, using, and understanding random forests, Vol. 3(1), 2002. pp. 18,19
[38] Breiman, L., Friedman, J., Olshen, R., Stone, C., Classification and Regression Trees, (Wadsworth), 1984.
[39] Witten, I. H., Frank, E., Data Mining: Pratical Machine Learning Tools and Techniques. Morgan Kaufmann, 2005.
[40] Fábbio, A. S., Borges, R. A., Fernandes, S., Lucas, A., Ivan, M., Silva, N., Comparison Between Random Forest Algorithm and J48 Decision, International Conference of Data Mining, DMIN'15, pp.146-149.
[41] Naive Bayes, [Online]. Available: https://docs.oracle.com/cd/B28359_01/datamine.111/b28129/algo_nb.htm#i1005770. Accessed: Oct. 25, 2019.
[42] Jalla, H.R., Girija, P.N., A Novel Approach for Horizontal Privacy Preserving Data Mining, Advances in Intelligent Systems and Computing, Springer 2016, pp. 101-111.
[43] Hemlata, International Journal of Advanced Research in Computer Science, 9 (2), March-April 2018, pp. 718-723.
[44] Bouckaert, R. Naive Bayes Classifiers That Perform Well with Continuous Variables, Lecture Notes in Computer Science, Vol.3339, 2004, pp. 1089-1094.
[45] Zaidi, N. A., Cerquides, J., Carman, M. J., Webb, G. I., Alleviating naive Bayes attribute independence assumption by attribute weighting. Journal of Machine Learning Research, Vol. 14, 2013, pp. 1947–1988.
[46] Hansen, K. D., Gentry, J., Long, L., Gentleman, R., Falcon, S., Hahne, F. S. D., Rgraphviz, D., Provides plotting capabilities for R graph objects, 2017. R package version 2.20.0.
[47] Chandrasekar, P., Qian, K., Shahriar, H., Bhattacharya, P., Improving the Prediction Accuracy of Decision Tree Mining with Data Preprocessing, IEEE 41st Annual Computer Software and Applications Conference, 2017, pp. 481-484.
[48] Bouckaert, R. R., Bayesian network classifiers in weka, Department of Computer Science, University of Waikato, 2004.
WSEAS TRANSACTIONS on INFORMATION SCIENCE and APPLICATIONS Nursel Selver Ruzgar
E-ISSN: 2224-3402 183 Volume 16, 2019

[49] Witten, I. H., Frank, E., Trigg, L. E., Hall, M.A., Holmes, G., Cunningham, S. J., Weka: Practical machine learning tools and techniques with Java implementations.1999.
[50] Laurier, C., Meyers, O., Serra, J., Blech, M., Herrera, P. and Serra, X., Indexing music by mood: design and integration of an automatic content-based annotator. Multimedia Tools Applicatrions, Vol. 48, 2010, pp. 161–184.
[51] McHugh, M. L., Interrater reliability: the kappa statistic, Biochem Med (Zagreb), 2012, Vol. 22(3), pp. 276–282.
[52] Cohen, W.W., Fast effective rule induction, in: Proceedings of the 12th International Conference on Machine Learning, 1995, pp. 115–123.
[53] http://clouddc.chass.utoronto.ca.ezproxy.lib.ryerson. ca/ds/cfmrc/displayTSX.do?ed=2018&t=ts&f=daily &lang=en#v2, Accessed: May 4, 2019.
WSEAS TRANSACTIONS on INFORMATION SCIENCE and APPLICATIONS Nursel Selver Ruzgar
E-ISSN: 2224-3402 184 Volume 16, 2019