comparison of the tesla, nlc and clic beam … · comparison of the tesla, nlc and ... may strongly...
TRANSCRIPT
Linear Collider Collaboration Tech Notes
LCC-0111 CERN-AB-Report-2003-006 CLIC Note 555, CERN Fermilab-TM-2200 TESLA Report 2003-02 March 2003
Comparison of the TESLA, NLC and CLIC Beam Collimation System Performance
A. Drozhdin 4 , G. Blair6, L. Keller5, W. Kozanecki2, T. Markiewicz5, T. Murayama5, N. Mokhov4, O. Napoly2, T. Raubenheimer5, D. Schulte3, A. Seryi5, P. Tenenbaum5, N. Walker1, M. Woodley5, F. Zimmermann3
1. DESY, Hamburg, Germany 2. CEA-Saclay, Paris, France
3. CERN, Geneva, Switzerland 4. Fermilab, Batavia, Illinois, USA 5. SLAC, Menlo Park, CA, USA
6. University of London, London, United Kingdom
March 2003
Abstract: This note describes studies performed in the framework of the Collimation Task Force organized to support the work of the International Linear Collider Technical Review Committee. The post-linac beam-collimation systems in the TESLA, JLC/NLC and CLIC linear-collider designs are compared using the same computer code under the same assumptions. Their performance is quantified in terms of beam-halo and synchrotron-radiation collimation efficiency. The performance of the current designs varies across projects and does not always meet the original design goals. However, these comparisons suggest that achieving the required performance in a future linear collider is feasible. The post-TRC plans of the Collimation Task Force are outlined briefly in closing.
Comparison of the TESLA, NLC and CLICBeam-Collimation System Performance
A. Drozhdin4, G. Blair6, L. Keller5, W. Kozanecki2, T. Markiewicz5,T. Maruyama5, N. Mokhov4, O. Napoly2, T. Raubenheimer5, D. Schulte3,
A. Seryi5, P. Tenenbaum5, N. Walker1, M. Woodley5, F. Zimmermann3
1DESY, Germany; 2CEA-Saclay, France; 3CERN, Switzerland;4FNAL, USA; 5SLAC, USA; 6Univ. of London, Great Britain
TESLA Report 2003-02, DESYCLIC Note-555, CERN
CERN-AB-Report-2003-006FERMILAB-TM-2200, FNAL
LCC-Note-0111, SLAC
March 7, 2003
Abstract
This note describes studies performed in the framework of the Collimation Task Force or-ganized to support the work of the International Linear Collider Technical Review Committee.The post-linac beam-collimation systems in the TESLA, JLC/NLC and CLIC linear-colliderdesigns are compared using the same computer code under the same assumptions. Their per-formance is quantified in terms of beam-halo and synchrotron-radiation collimation efficiency.The performance of the current designs varies across projects, and does not always meet theoriginal design goals. But these comparisons suggest that achieving the required performancein a future linear collider is feasible. The post-TRC plans of the Collimation Task Force arebriefly outlined in closing.
1 Introduction
At the nominal parameters of the next generation e+e� linear colliders (see Ref. [1] and Table 1),small fractional beam losses along the transport line, or the presence of particles far from the beamcore in the IP region, may strongly affect the background conditions in the detector, as well ascause irradiation and heating of collider components. The beam halo, which may extend manystandard deviations beyond the beam core, can result in electromagnetic showers and synchrotron
1
radiation reaching the detector, as well as in the generation of muon background from particlesthat are intercepted by physical apertures along the entire beam line.
All machine designs need to remove this halo to a certain “collimation depth”, which is generallyset by the synchrotron-radiation fan generated by the halo particles in the last few magnets closeto the IP: by definition, all particles within the collimation depth generate photons that should passcleanly through the IR. Halo particles outside of the required collimation depth are removed byphysically intercepting them with “collimators”, which are formed by a thick absorber of manyradiation lengths placed in the optical shadow of a thin spoiler, the thickness of which is gener-ally less than one radiation length. In principle, the loss of particles from the halo should be atcontrolled points along the lattice, i.e. at the absorbers. These locations then become sources ofmuons. How many of these muons eventually reach the detector depends on many factors: distancefrom source to the IP, beam-line layout, tunnel geometry and the use of “muon spoilers”.
We present here a comparison of the collimation-system performance for the three main candidatesof this generation: the JLC/NLC and CLIC designs based on high-frequency room-temperature rfaccelerators and the TESLA design based on a low-frequency superconducting rf accelerator. Theloss pattern from the beam halo and the synchrotron-radiation loads (both from the halo and fromthe core of the beam) are calculated along the beamline and in the IP region. The actual backgroundconditions in the detector (e.g. the number of muons reaching the IR hall) are not evaluated in thispaper.
One of the biggest uncertainties affecting such comparisons is the absolute intensity and the phase-space distribution of the beam halo that one has to assume. The 10�3 fraction of the beam observedin the halo at the SLC (when it was working well) was never quantitatively understood, although itmight be explainable by the absence of pre-linac collimation and by tails coming from the damp-ing rings. Analytic estimates performed for high-energy linear colliders predict a much smallerhalo, of the order of 10�6 of the beam current. However, given the SLC experience, designers ofcollimation systems have taken the conservative approach to build a collimation system that wouldbe able to intercept a fractional halo of 10�3 of the beam. In terms of average power, fully scrapingsuch a halo would dissipate 11.3 kW for TESLA, 6.9 kW for NLC and 4.9 kW for CLIC (for eachbeam).
2 Description of the Collimation Systems
The functional requirements of the collimation system can be summarized as follows.
1. Losses of halo particles in the final focus system must be limited to a level that results in atolerable muon flux in the detector.
2. The beam halo in the final doublet (FD) must be limited to a certain maximum transversesize, such that all the synchrotron radiation (SR) passes freely through the IP region andcleanly exits the nearby magnets of the outgoing-beam line (i.e. the first few magnets of thespent-beam extraction line for crossing-angle machines, or the opposite-side final doublet inthe case of a head-on geometry).
3. The beamline must be protected against damage by as little as one off-energy beam bunchcoming from the linac.
2
It is not possible to stop all the halo particles: edge scattering, non-linear fields at high transverseamplitudes, etc. tend to repopulate the phase space outside the collimation depth. All machinescurrently have a dedicated primary collimation system located upstream of the final focus system(FFS). Additional secondary or “clean-up” collimators are located in the FFS. The maximum num-ber of halo particles that may be intercepted in this secondary system is limited by the muon fluxthe detector can tolerate. The primary system—which intercepts most of the halo – should havehigh enough an “efficiency” to reduce the losses in the secondary system to acceptable levels. Atthe same time, the combination of primary and secondary collimation must bring the halo popula-tion outside the collimation depth in the final doublets within tolerance. It is typically required thatno SR photon (whether produced by the beam core or by the halo) be allowed to hit any detector ormachine component between the entrance to the final doublet on the incoming-beam side, and theexit of the opposite-side final doublet (or of the equivalent magnetic elements in the spent-beamline in the case of a crossing-angle geometry). In addition, no charged halo particles should beallowed to hit material in the same region.
Collimation of the beam requires putting material very close to a beam with a very high energydensity, which in turn creates a risk that a missteered beam might destroy the collimator. In prin-ciple, the collimators can be protected from damage by enlarging the transverse dimensions of thebeam at the collimator locations. In practice, in order to limit the betatron functions in the col-limation region, the design relies on thin (0.5-1 radiation length) spoilers which scrape the halowith minimal heating and enlarge the spot size of a missteered beam via multiple Coulomb scat-tering and energy loss. The enlarged beam is then absorbed in thick (30 radiation lengths) copperabsorbers. Absorbers in the primary collimation section should lie in the shadow of their spoilerpartner; their aperture should be as large as possible to reduce the probability of being hit directlyby a missteered beam, while remaining tight enough to intercept those halo particles that scatteredin the spoilers.
An additional concern is that spoilers and absorbers close to the beam may introduce transversewakefield deflections [2], which would unacceptably degrade the beam quality at the IP. The designof the NLC spoiler is a rotating wheel made of copper and beryllium (Figure 1). The wheelcontains a 0.5 radiation length slab of copper in the longitudinal center, with tapered pieces of Cu-coated beryllium on either side. From the collimation point of view, the spoiler looks like a thinscatterer, while from the wakefield viewpoint, it is a long, tapered metal object which minimizesthe wakefield kick.
Parameters of the collimation systems in TESLA, NLC, and CLIC are listed in Tables 2, 3, and4 respectively. Table 5 lists the physical properties of the spoilers and absorbers for the threemachines. Figures 2, 3 and 4 show the collimator locations, the horizontal dispersion, and thecollimator apertures. The IR-aperture models used for simulating the TESLA and NLC IRs areshown in Figures 5 and 6. The SR requirements determine the collimation apertures in both planesat high-� points in the collimation system. This leads to an effective collimation depth of the”sine-like” trajectories (with respect to the IP) at spoiler settings of 13�x and 80�y for TESLA,15�x and 31�y for NLC, and 11�x and 100�y for CLIC. In some cases the spoiler settings must betighter than the effective collimation depth because of dispersive or higher-order effects. The needfor off-energy collimation leads to the requirement of a high-dispersion point in the system, wherean off-energy pulse can be safely absorbed.
In TESLA the halo is collimated by the betatron collimation system at every 45 degrees in bothplanes. The system consists of four (35 mm long) ”frame shape” titanium spoilers and four (0.5
3
m long) copper absorbers [3, 4, 5]. The spoilers are located at approximately 12�x and 74�y witha safety factor of 1=cos(�=8) in a region with large horizontal and vertical �-functions. Energycollimation is located upstream of the betatron collimation section. It consists of a set of nonlin-ear magnets (sextupoles and octupole) and an off-energy spoiler “spo-m2”and absorber “abs-m2”placed at 1:5% energy deviation in a region with maximum dispersion (Figure 3). Apertures of thebeam delivery section used in the simulations are shown in Figures 4 and 5. It should be notedthat the aperture limitation associated with the TESLA vertex detector (whose nominal radius is15 mm) was not included into the geometry model (the smallest apertures near the IP are the de-tector masks with 12 mm radius).
In NLC the betatron collimation system consists of five spoiler-absorber sets. Energy collimationis done in a high dispersion region downstream of the betatron collimation system [6]. The spoilergaps are set to 10�x and 31�y. A recent development in the NLC collimation system is the use ofoctupole doublets which permit the beam halo in one betatron phase to be reduced in amplitude,while leaving the beam core nearly unaffected. A pair of these doublets has been shown to reducethe transverse size of the halo, at the critical final doublet betatron phase, by a factor of four. Simu-lations performed with these octupoles ON yielded encouraging results. However, in order to limitour comparisons to a single configuration per linear collider concept, only the (more pessimistic)case of NLC collimation with octupoles OFF is presented in this paper.
In CLIC the collimation system consists of an upstream energy collimation system, based on adogleg bend, followed by a betatron collimation system [7]. The spoiler half-gaps are set at 9�x
and 65�y. One should note that CLIC simulations started at a later stage of this comparative study,and that the corresponding system optimization has not been fully completed yet. In particular,the current setting of the energy spoiler (dP/P = 0.005) is very tight, and results in several percentof the primary beam being intercepted at that location. Although clearly unacceptable in a real-istic design, this problem was temporarily neglected, in recognition of the fact that the CLIC-500optimization is still ongoing.
In all collimation systems a small fraction of the halo escapes from the betatron collimation sectionand continues into the FFS. This leads to the requirement for a second stage of collimation at high-� points in the FFS. The secondary-collimation section:
� provides additional safety in suppressing background from large amplitude particles whichmay escape from the first stage, or may be produced by beam-gas scattering between thecollimation section and the FFS;
� keeps the detector background at an acceptable level even for noticeable transverse displace-ments of the beam centroid in the primary-collimation section;
� cleans the beam of large amplitude ”sine-like” trajectories independently of the phase ad-vance between the primary-collimation section and the IP. This leaves open the possibility tomodify, at a later stage, upstream portions of the beam delivery section without excessivelyimpacting the collimation efficiency.
3 Simulation Tools
Particle tracking and beam loss simulations were carried out using the Program STRUCT [8]. Thispackage performs particle tracking and interaction with collimators in circular accelerators and
4
beam lines. Synchrotron radiation and transport along the accelerator are simulated for electronmachines. All lattice components with their strength and aperture restrictions are taken into ac-count. This Monte Carlo code, written in Fortran, allows performance analysis of designed lattices,simulation of the beam loss distribution along the accelerator, and other tracking studies. STRUCThas been used for simulations of the Tevatron, Booster and Main Injector at FNAL, for the JapaneseJHF project, the LHC at CERN, the SSC, and the collimation system in the Muon Collider.
The accelerator or beam line to be studied is described as a sequence of beam elements placedsequentially along a reference orbit. Every element can be misaligned with respect to the referencesystem. This misalignment is described by horizontal and vertical displacements, and by rotationsaround the reference orbit and around the local horizontal and vertical axes.
Physical beam-line elements can include: straight section, quadrupole, rectangular and sectorbending magnet, sextupole, octupole, dipole magnet with gradient, electrostatic deflector or septum-magnet, RF acceleration, bent crystal, target, collimator, and magnetized collimator.
An aperture definition is required for every lattice element. STRUCT allows five types of aperturefor all elements: uniform along the element with rectangular, circular, elliptical and trapezoidal(or pole rotated) cross section. The element may have a variable aperture along its length (a so-called “conical” aperture). In this case the element has a rectangular aperture at any cross sectionalong the element length, and the horizontal and vertical sizes of the aperture are linear functionsof length.
As a check, the performance of the NLC collimation system was evaluated with TURTLE [9] andGEANT3 [10]. The agreement with the results from STRUCT was fully satisfactory.
4 Results
4.1 Methodology
The effectiveness of the collimation system can be quantified in terms of either:
� the fraction of initial halo particles that survive (or are rescattered out of) the primary col-limation system and hit secondary collimators or other aperture limitations closer to the IP.This “primary-collimation efficiency” is relevant when estimating muon backgrounds, andis discussed in Sec. 4.2 below;
or
� the number of halo particles that lie outside the collimation depth when they reach the finaldoublet. This parameter is relevant when estimating synchrotron-radiation backgrounds (aswell as the rate of lost-particle hits close to the detector, if any); these are treated in Secs. 4.3and 4.4.
For simulations of the effectiveness of the three collimation systems and of background conditionsat the IP, the beam halo was represented by a large number of rays (typically 5�105) distributed in
5
phase space in the shape of a ring, with 1=x and 1=y density distributions and covering a machine-dependent range of amplitudes Ax and Ay. The range of amplitudes was chosen so as to appro-priately overlap the design collimation depth1. Such a halo distribution maximizes the fractionof particles that may interact with the spoilers, and it is a more pessimistic assumption than, forexample, a uniformly distributed halo with the same maximal range. The halo was also given aGaussian momentum distribution with typically �(dP=P ) = 1%. Parameters of the initial halodistribution are regrouped in Table 6, and examples of the initial distributions are shown in Figs. 7,8 and 9.
The main results, summarized in Tables 7–10 and Figures 10–13, are discussed in detail below.
4.2 Primary-collimation Efficiency
Figure 10 (left) displays, for each machine, the cumulative particle loss, starting at the IP andintegrating back to the entrance of the collimation system.
� The NLC design achieves a primary-collimation efficiency significantly better than 10�5,resulting in less than 104 particles per train2 being lost in the secondary system.
� In TESLA, with the primary collimation as currently designed, the loss rate in the secondarysystem amounts to about 1% of the initial halo population. Because the TESLA bunch spac-ing is longer than the entire bunch train for the warm machines, TESLA generally quotesbackground rates per bunch crossing. However the subdetector most sensitive to muon back-ground, the time projection chamber (TPC), integrates over 150 bunches, so that for the sameassumed incident halo fraction of 10�3, the effective halo population becomes similar to thatof NLC and the effective loss in the secondary collimation system amounts to 3�107 particlesper sensitivity window.
� The CLIC collimation system achieves a primary-collimation efficiency of about 3� 10�4.
It should be noted that the primary-collimation efficiency, as defined above, is probably too crude afigure of merit for either NLC or CLIC. In these two designs, the losses are rapidly decreasing nearthe end of the primary-collimation section, and (within the assumptions of the present simulations)entirely disappear a few ten meters downstream of it. This indicates that the collimation is actuallymore effective than suggested by the raw numbers in Table 7. The muon flux reaching the detector(updated simulations of which remain to be carried out) will provide a more relevant measure ofprimary-collimation performance.
4.3 Halo Photons
The collimation-system performance achieved at the entrance to the final doublet, and the resultinglevel of halo-induced SR backgrounds, are summarized in Figures 10 (right)–12 and Tables 8–9.They can be characterized as follows.
1It was explicitly checked that the chosen range is large enough to fully populate all accessible regions of phasespace. This is illustrated in the Appendix (Figures 31 and 36).
2It is unlikely that the simulations are fully accurate down to such low loss levels.
6

� In NLC, the edge of the collimation depth is sharply defined; but for no halo photons to hitthe beam pipe near the IP, rather tight collimator settings (�0.2–0.3 mm) are needed (in theabsence of tail-folding octupoles only).
The halo photon flux hitting the FD SR mask (DUMP2) on the incoming-side (Table 8) is lowenough to be of no concern; in addition, these photons are rather soft (< E >� 31KeV),as illustrated in Figure 11. The halo hitting the detector masks and the vertex detector isnegligible (Table 9). Photon losses in the outgoing beam line were not calculated for NLC orCLIC because it was assumed that the crossing-angle geometry provides enough flexibilityfor an ample stay-clear on the spent-beam side. This assumption needs to be validated by amore complete modelling of the warm-machine IRs.
� In TESLA, the boundary of the collimated halo is barely visible (Figure 10 right), in spite ofseveral tight collimator settings, in particular in the secondary-collimation system (see Ta-ble 2). Charged-halo losses on the SR mask DUMP1 amount to about 7400 particles/bunchon the upstream side, and about 250 particles/bunch on the downstream side. In addition,a large number of halo particles (�105/bunch) enter the final doublet outside the collima-tion depth.3 The simulations also indicate that with the collimator configuration simulatedhere (which corresponds to that of Ref. [11]), some SR photons from the halo (> 105 pho-tons/bunch) hit the detector mask located 3 m from the IP; their total energy (158 GeV/bunch,see Table 9) is however small compared to that of beam-beam induced pairs.
More importantly, one observes a sizeable outgoing photon halo (�1.2�105 GeV/bunch,corresponding to about 1.2�107 photons) hitting the downstream SR mask 18 m from the IP:the total energy of the halo photons intercepted by this mask is about half of that depositedby outgoing SR photons from the beam core hitting the same mask (Table 10). Both themean energy (Table 8) and the number of halo photons per pulse is an order of magnitudelarger in TESLA than in NLC, because of significantly stronger bending fields. This remarkalso applies to SR photons radiated by the core of the incoming e� beam.
It should be noted that the aperture limitation associated with the TESLA vertex detector(whose radius is larger than the radius of the detector masks) was not included in the geom-etry model and, therefore, part of the flux currently intercepted by the IP beam pipe and thedownstream detector mask (see Table 9 and Figure 21 in the Appendix) would actually beintercepted by the vertex detector.
� The halo in CLIC-500 appears reasonably well-behaved, and the number of photons hittingthe SR and IR masks is of no concern. This promising performance was however obtainedwith rather tight collimator settings. But detailed simulations of the 500 GeV CLIC systemare only beginning, and its collimator configuration is still very much in flux.
Figure 12 displays the energy spectrum of all halo-induced SR photons at the IP. Although theTESLA spectrum remains the hardest, the mean photon energies in the various LC designs liewithin a factor of three of each other. These photons are substantially harder than those hitting theupstream SR mask (Figure 11), underscoring the importance to avoid intercepting them anywhereclose to the IP.
3The apparent contradiction with Figure II.7.5.3 of Ref. [11], in which no particles are found outside the collimationdepth, remains to be resolved.
7
4.4 Synchrotron Radiation from the Beam Core
A sizeable flux of SR photons produced by the beam core (primarily in the last dipole) hits the SRmasks on either side of the IP (Table 10).
� In NLC, when integrated over the entire bunch train, the flux of SR photons from the corereaches a level that may deserve attention, if only because neither rescattering off mask edgesnor multiple photon bounces were taken into account. Their spectrum (Figure 13) is verysimilar to that of the halo photons on the incoming-beam side (Figure 11).
� In TESLA, about 1010 core photons/bunch hit the SR mask upstream of the IP, depositing109 GeV/effective bunch train. Given that the TESLA TPC typically integrates over about150 bunches, both the halo- and the core-SR flux are cause for serious concern, becausethe simulations at this stage completely neglect back-scattering and edge-scattering of SRphotons off masks and other aperture limitations. It should be noted that the relative intensityof these backgrounds is extremely sensitive to the interrelated aperture settings necessary tosimultaneously accommodate an incoming and an outgoing beam (Figure 6). While it isplausible that the effectiveness of the TESLA collimation system may be further improved,these results underscore the urgent need for more detailed studies.
� In CLIC, the flux of intercepted core SR photons is slightly lower than in NLC, presumablydue to the fact that the CLIC IR has been optimized for 3 TeV c.m. energy.
4.5 Loss Patterns and Halo Characterization
The Appendix regroups additional particle distributions in various locations. These were mostlyuseful for cross-checking the different programs at an early stage of this study, and are presentedhere mainly for future reference.
5 Summary
Comparative studies of the performance of the post-linac beam-collimation systems in the TESLA,NLC and CLIC linear-collider concepts have shown that the performance of the systems as cur-rently designed is not uniform across projects, and that it does not always meet all the design goals.As of this writing, the CLIC and NLC collimation schemes appear the most promising. But sub-stantial improvements of the TESLA collimation system are expected to result from the ongoingoverhaul of their BDS design. Overall, the very existence of an acceptable solution – albeit withthe reservations outlined below – suggests that achieving the required performance in future linearcolliders is feasible.
It should be pointed out that not all the designs are equally mature: in some areas, substantialuncertainties persist, or realistic performance margins remain to be incorporated.
� The tight aperture settings needed to achieve satisfactory collimation efficiency, coupledwith significant beam jitter, can lead to a (possibly unacceptable) luminosity degradation by
8
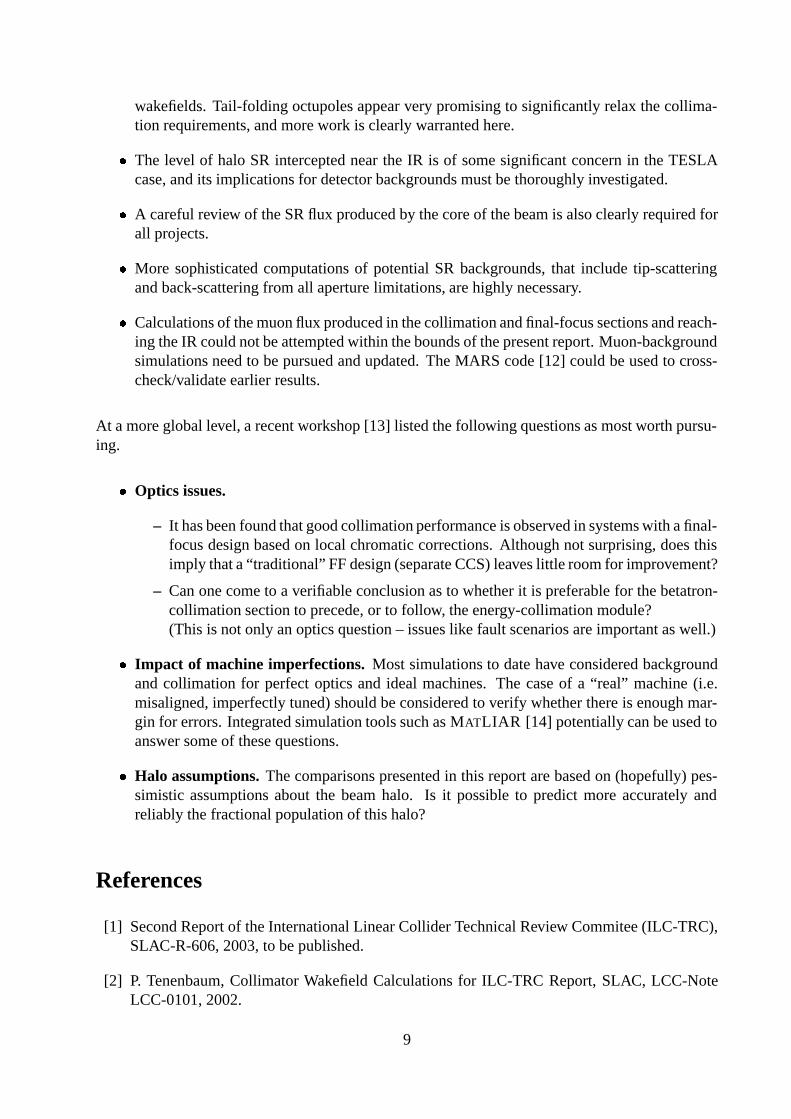
wakefields. Tail-folding octupoles appear very promising to significantly relax the collima-tion requirements, and more work is clearly warranted here.
� The level of halo SR intercepted near the IR is of some significant concern in the TESLAcase, and its implications for detector backgrounds must be thoroughly investigated.
� A careful review of the SR flux produced by the core of the beam is also clearly required forall projects.
� More sophisticated computations of potential SR backgrounds, that include tip-scatteringand back-scattering from all aperture limitations, are highly necessary.
� Calculations of the muon flux produced in the collimation and final-focus sections and reach-ing the IR could not be attempted within the bounds of the present report. Muon-backgroundsimulations need to be pursued and updated. The MARS code [12] could be used to cross-check/validate earlier results.
At a more global level, a recent workshop [13] listed the following questions as most worth pursu-ing.
� Optics issues.
– It has been found that good collimation performance is observed in systems with a final-focus design based on local chromatic corrections. Although not surprising, does thisimply that a “traditional” FF design (separate CCS) leaves little room for improvement?
– Can one come to a verifiable conclusion as to whether it is preferable for the betatron-collimation section to precede, or to follow, the energy-collimation module?(This is not only an optics question – issues like fault scenarios are important as well.)
� Impact of machine imperfections. Most simulations to date have considered backgroundand collimation for perfect optics and ideal machines. The case of a “real” machine (i.e.misaligned, imperfectly tuned) should be considered to verify whether there is enough mar-gin for errors. Integrated simulation tools such as MATLIAR [14] potentially can be used toanswer some of these questions.
� Halo assumptions. The comparisons presented in this report are based on (hopefully) pes-simistic assumptions about the beam halo. Is it possible to predict more accurately andreliably the fractional population of this halo?
References
[1] Second Report of the International Linear Collider Technical Review Commitee (ILC-TRC),SLAC-R-606, 2003, to be published.
[2] P. Tenenbaum, Collimator Wakefield Calculations for ILC-TRC Report, SLAC, LCC-NoteLCC-0101, 2002.
9
[3] R. Brinkmann, A. Drozhdin, D. Schulte, M. Seidel, The TESLA Beam Collimation System,DESY Preprint, December 1995, TESLA 95-25.
[4] A. Drozhdin, O. Napoly, N. Walker, TESLA Beam Collimation System Simulations, May14, 1999, http://www-ap.fnal.gov/�drozhdin/
[5] O. Napoly and N. J. Walker, “TESLA interaction region layout, collimation and extraction,”DESY-TESLA-2001-29, Prepared for 5th International Linear Collider Workshop (LCWS2000), Fermilab, Batavia, Illinois, 24-28 Oct 2000.
[6] P. Raimondi, A. Seryi and P. Tenenbaum, “Tunability of the NLC final focus system,”SLAC-PUB-8895, in Proceedings of the IEEE Particle Accelerator Conference (PAC 2001),Chicago, Illinois, 18-22 Jun 2001.
[7] M. Aleksa et al., “CLIC beam delivery system,” CLIC-NOTE-551, presented at the 26th Ad-vanced ICFA Beam Dynamics Workshop On Nanometer Size Colliding Beams (Nanobeam2002), 2-6 Sep 2002, Lausanne, Switzerland.
[8] I. Baishev, A. Drozhdin, and N. Mokhov, ‘STRUCT Program User’s Reference Manual’,SSCL–MAN–0034 (1994), http://www-ap.fnal.gov/�drozhdin/
[9] D. C. Carey, K. L. Brown and C. Iselin, “TURTLE with MAD input (Trace UnlimitedRays Through Lumped Elements): A computer program for simulating charged particlebeam transport system and DECAY TURTLE including decay calculations,” SLAC-R-544,FERMILAB-PUB-99-232, Sep 1999.
[10] R. Brun, F. Bruyant, M. Maire, A. C. McPherson and P. Zanarini, “Geant3,” CERN-DD/EE/84-1, Sep 1987.
[11] “TESLA Technical Design Report”, DESY-01-011, March 2001.
[12] N. V. Mokhov, “The MARS code system user’s guide version 13(95),” FERMILAB-FN-0628
[13] Collimation Task Force Workshop, SLAC, December 16-18, 2002,http://www-project.slac.stanford.edu/lc/wkshp/colltf2002/
[14] P. Tenenbaum, L. Hendrickson, A. Seryi and G. Stupakov, “Recent developments in the LIARsimulation code,” SLAC-PUB-9263, in Proceedings of the 8th European Particle AcceleratorConference (EPAC 2002), Paris, France, 3-7 Jun 2002.
10
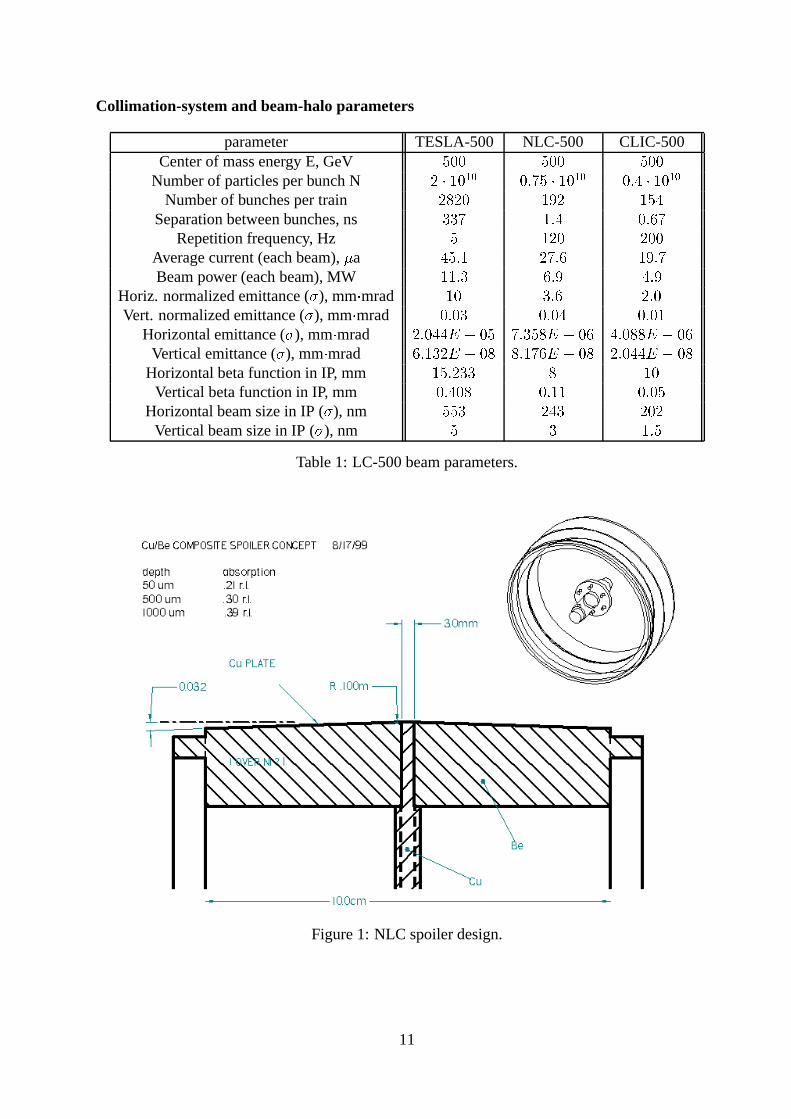
Collimation-system and beam-halo parameters
parameter TESLA-500 NLC-500 CLIC-500Center of mass energy E, GeV 500 500 500
Number of particles per bunch N 2 � 1010 0:75 � 1010 0:4 � 1010
Number of bunches per train 2820 192 154Separation between bunches, ns 337 1:4 0:67
Repetition frequency, Hz 5 120 200Average current (each beam), �a 45:1 27:6 19:7Beam power (each beam), MW 11:3 6:9 4:9
Horiz. normalized emittance (�), mm�mrad 10 3:6 2:0Vert. normalized emittance (�), mm�mrad 0:03 0:04 0:01
Horizontal emittance (�), mm�mrad 2:044E � 05 7:358E � 06 4:088E � 06Vertical emittance (�), mm�mrad 6:132E � 08 8:176E � 08 2:044E � 08
Horizontal beta function in IP, mm 15:233 8 10Vertical beta function in IP, mm 0:408 0:11 0:05
Horizontal beam size in IP (�), nm 553 243 202Vertical beam size in IP (�), nm 5 3 1:5
Table 1: LC-500 beam parameters.
Figure 1: NLC spoiler design.
11
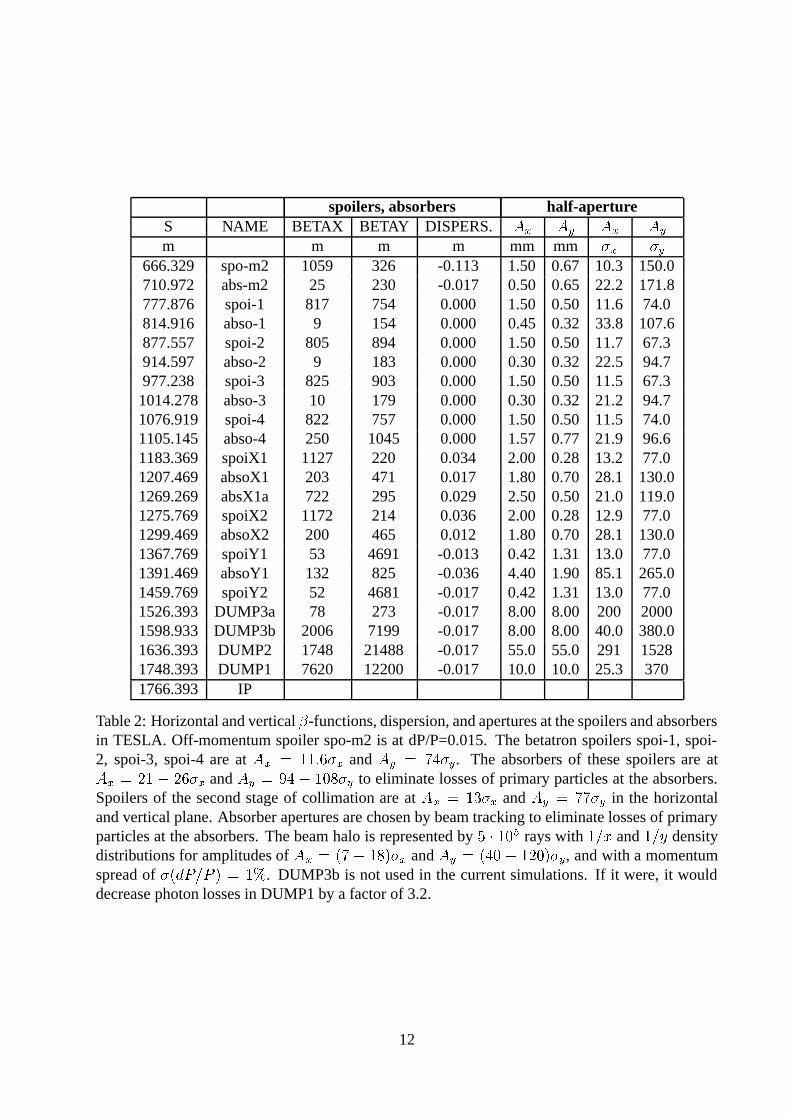
spoilers, absorbers half-apertureS NAME BETAX BETAY DISPERS. Ax Ay Ax Ay
m m m m mm mm �x �y666.329 spo-m2 1059 326 -0.113 1.50 0.67 10.3 150.0710.972 abs-m2 25 230 -0.017 0.50 0.65 22.2 171.8777.876 spoi-1 817 754 0.000 1.50 0.50 11.6 74.0814.916 abso-1 9 154 0.000 0.45 0.32 33.8 107.6877.557 spoi-2 805 894 0.000 1.50 0.50 11.7 67.3914.597 abso-2 9 183 0.000 0.30 0.32 22.5 94.7977.238 spoi-3 825 903 0.000 1.50 0.50 11.5 67.3
1014.278 abso-3 10 179 0.000 0.30 0.32 21.2 94.71076.919 spoi-4 822 757 0.000 1.50 0.50 11.5 74.01105.145 abso-4 250 1045 0.000 1.57 0.77 21.9 96.61183.369 spoiX1 1127 220 0.034 2.00 0.28 13.2 77.01207.469 absoX1 203 471 0.017 1.80 0.70 28.1 130.01269.269 absX1a 722 295 0.029 2.50 0.50 21.0 119.01275.769 spoiX2 1172 214 0.036 2.00 0.28 12.9 77.01299.469 absoX2 200 465 0.012 1.80 0.70 28.1 130.01367.769 spoiY1 53 4691 -0.013 0.42 1.31 13.0 77.01391.469 absoY1 132 825 -0.036 4.40 1.90 85.1 265.01459.769 spoiY2 52 4681 -0.017 0.42 1.31 13.0 77.01526.393 DUMP3a 78 273 -0.017 8.00 8.00 200 20001598.933 DUMP3b 2006 7199 -0.017 8.00 8.00 40.0 380.01636.393 DUMP2 1748 21488 -0.017 55.0 55.0 291 15281748.393 DUMP1 7620 12200 -0.017 10.0 10.0 25.3 3701766.393 IP
Table 2: Horizontal and vertical �-functions, dispersion, and apertures at the spoilers and absorbersin TESLA. Off-momentum spoiler spo-m2 is at dP/P=0.015. The betatron spoilers spoi-1, spoi-2, spoi-3, spoi-4 are at Ax = 11:6�x and Ay = 74�y. The absorbers of these spoilers are atAx = 21 � 26�x and Ay = 94 � 108�y to eliminate losses of primary particles at the absorbers.Spoilers of the second stage of collimation are at Ax = 13�x and Ay = 77�y in the horizontaland vertical plane. Absorber apertures are chosen by beam tracking to eliminate losses of primaryparticles at the absorbers. The beam halo is represented by 5 � 105 rays with 1=x and 1=y densitydistributions for amplitudes of Ax = (7 � 18)�x and Ay = (40� 120)�y, and with a momentumspread of �(dP=P ) = 1%. DUMP3b is not used in the current simulations. If it were, it woulddecrease photon losses in DUMP1 by a factor of 3.2.
12
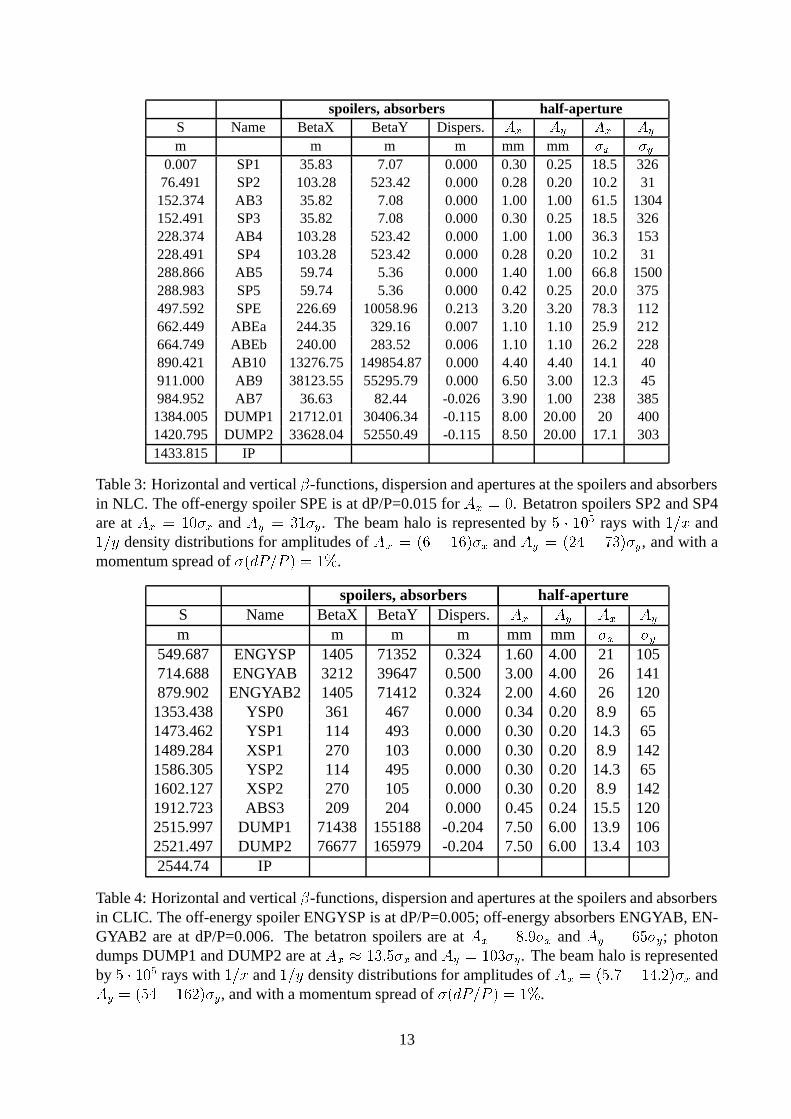
spoilers, absorbers half-apertureS Name BetaX BetaY Dispers. Ax Ay Ax Ay
m m m m mm mm �x �y0.007 SP1 35.83 7.07 0.000 0.30 0.25 18.5 326
76.491 SP2 103.28 523.42 0.000 0.28 0.20 10.2 31152.374 AB3 35.82 7.08 0.000 1.00 1.00 61.5 1304152.491 SP3 35.82 7.08 0.000 0.30 0.25 18.5 326228.374 AB4 103.28 523.42 0.000 1.00 1.00 36.3 153228.491 SP4 103.28 523.42 0.000 0.28 0.20 10.2 31288.866 AB5 59.74 5.36 0.000 1.40 1.00 66.8 1500288.983 SP5 59.74 5.36 0.000 0.42 0.25 20.0 375497.592 SPE 226.69 10058.96 0.213 3.20 3.20 78.3 112662.449 ABEa 244.35 329.16 0.007 1.10 1.10 25.9 212664.749 ABEb 240.00 283.52 0.006 1.10 1.10 26.2 228890.421 AB10 13276.75 149854.87 0.000 4.40 4.40 14.1 40911.000 AB9 38123.55 55295.79 0.000 6.50 3.00 12.3 45984.952 AB7 36.63 82.44 -0.026 3.90 1.00 238 385
1384.005 DUMP1 21712.01 30406.34 -0.115 8.00 20.00 20 4001420.795 DUMP2 33628.04 52550.49 -0.115 8.50 20.00 17.1 3031433.815 IP
Table 3: Horizontal and vertical �-functions, dispersion and apertures at the spoilers and absorbersin NLC. The off-energy spoiler SPE is at dP/P=0.015 for Ax = 0. Betatron spoilers SP2 and SP4are at Ax = 10�x and Ay = 31�y. The beam halo is represented by 5 � 105 rays with 1=x and1=y density distributions for amplitudes of Ax = (6 � 16)�x and Ay = (24 � 73)�y, and with amomentum spread of �(dP=P ) = 1%.
spoilers, absorbers half-apertureS Name BetaX BetaY Dispers. Ax Ay Ax Ay
m m m m mm mm �x �y549.687 ENGYSP 1405 71352 0.324 1.60 4.00 21 105714.688 ENGYAB 3212 39647 0.500 3.00 4.00 26 141879.902 ENGYAB2 1405 71412 0.324 2.00 4.60 26 120
1353.438 YSP0 361 467 0.000 0.34 0.20 8.9 651473.462 YSP1 114 493 0.000 0.30 0.20 14.3 651489.284 XSP1 270 103 0.000 0.30 0.20 8.9 1421586.305 YSP2 114 495 0.000 0.30 0.20 14.3 651602.127 XSP2 270 105 0.000 0.30 0.20 8.9 1421912.723 ABS3 209 204 0.000 0.45 0.24 15.5 1202515.997 DUMP1 71438 155188 -0.204 7.50 6.00 13.9 1062521.497 DUMP2 76677 165979 -0.204 7.50 6.00 13.4 1032544.74 IP
Table 4: Horizontal and vertical �-functions, dispersion and apertures at the spoilers and absorbersin CLIC. The off-energy spoiler ENGYSP is at dP/P=0.005; off-energy absorbers ENGYAB, EN-GYAB2 are at dP/P=0.006. The betatron spoilers are at Ax = 8:9�x and Ay = 65�y; photondumps DUMP1 and DUMP2 are at Ax � 13:5�x and Ay = 103�y. The beam halo is representedby 5 � 105 rays with 1=x and 1=y density distributions for amplitudes of Ax = (5:7� 14:2)�x andAy = (54� 162)�y, and with a momentum spread of �(dP=P ) = 1%.
13
name length mate- name length mate- name length mate-rial rial rial
mm r.l. mm r.l. mm r.l.NLC TESLA CLIC
SP1 117.15 0.5+0.3 Cu+Be spo-m2 35 1 Ti ENGYSP 94 0.5 CSP2 117.15 0.5+0.3 Cu+Be abs-m2 500 35 Cu ENGYAB 429 30 CuAB3 429 30 Cu spoi-1 35 1 Ti ENGYAB2 429 30 CuSP3 117.15 0.5+0.3 Cu+Be abso-1 500 35 Cu YSP0 117.15 0.5+0.3 Cu+BeAB4 429 30 Cu spoi-2 35 1 Ti ABS0(*) 429 30 CuSP4 117.15 0.5+0.3 Cu+Be abso-2 500 35 Cu YSP1 117.15 0.5+0.3 Cu+BeAB5 429 30 Cu spoi-3 35 1 Ti XSP1 117.15 0.5+0.3 Cu+BeSP5 117.15 0.5+0.3 Cu+Be abso-3 500 35 Cu ABS1(*) 429 30 CuSPE 17.8 0.5 Ti spoi-4 35 1 Ti ABS1a(*) 429 30 Cu
ABEa 214.5 15 Cu abso-4 500 35 Cu YSP2 117.15 0.5+0.3 Cu+BeABEb 214.5 15 Cu spoiX1 35 1 Ti XSP2 117.15 0.5+0.3 Cu+BeAB10 429 30 Cu absoX1 500 35 Cu ABS2(*) 429 30 CuAB9 429 30 Cu absX1a 500 35 Cu ABS2a(*) 429 30 CuAB7 214.5 15 Cu spoiX2 35 1 Ti YSP3(*) 117.15 0.5+0.3 Cu+Be
absoX2 500 35 Cu XSP3(*) 117.15 0.5+0.3 Cu+BespoiY1 35 1 Ti YSP4(*) 117.15 0.5+0.3 Cu+BeabsoY1 500 35 Cu XSP4(*) 117.15 0.5+0.3 Cu+BespoiY2 35 1 Ti ABS3 429 30 Cu
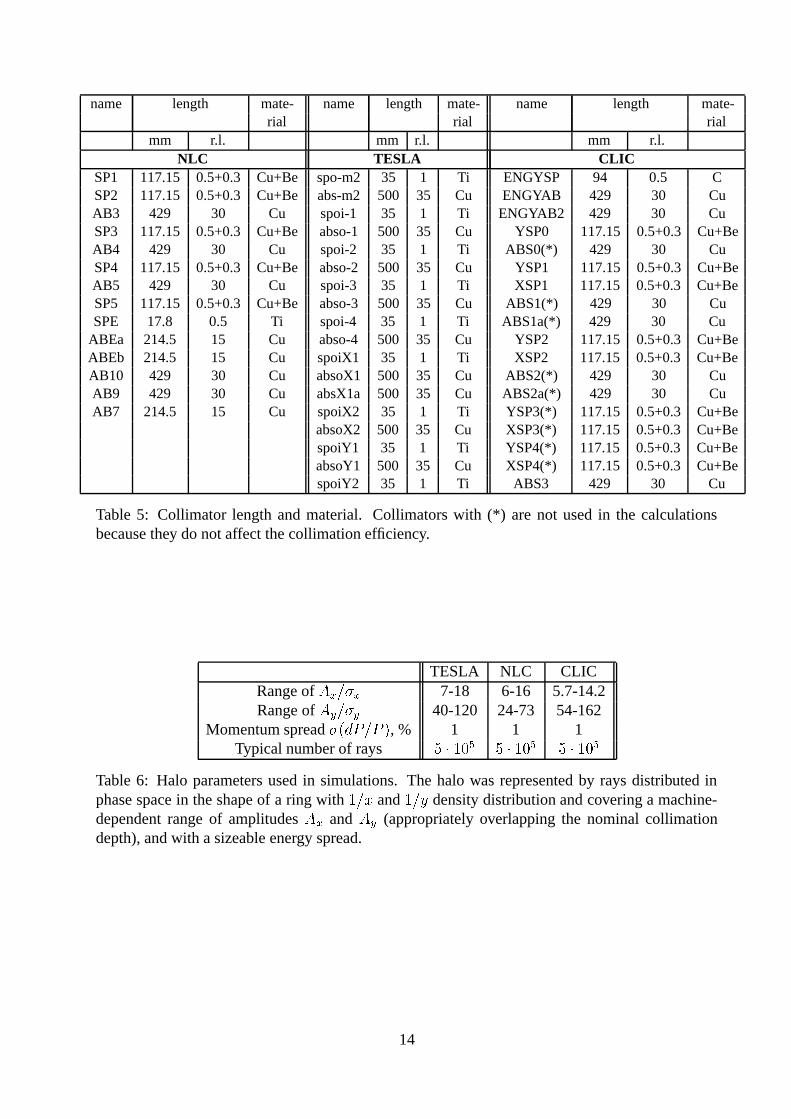
Table 5: Collimator length and material. Collimators with (*) are not used in the calculationsbecause they do not affect the collimation efficiency.
TESLA NLC CLICRange of Ax=�x 7-18 6-16 5.7-14.2Range of Ay=�y 40-120 24-73 54-162
Momentum spread �(dP=P ), % 1 1 1Typical number of rays 5 � 105 5 � 105 5 � 105
Table 6: Halo parameters used in simulations. The halo was represented by rays distributed inphase space in the shape of a ring with 1=x and 1=y density distribution and covering a machine-dependent range of amplitudes Ax and Ay (appropriately overlapping the nominal collimationdepth), and with a sizeable energy spread.
14

0 500 1000 1500 2000 2500
Path length, m
spo-m2
abs-m2
|||
||
|||
spoi1-spoi4
abso1-abso4
spoiX1-spoiY2
absoX1-absoY1
IP
TESLA beam delivery section
0 500 1000 1500 2000 2500
Path length, m
SP1 - SP5
AB3 - AB5
SPE
ABEa,b
AB10,9,7
IP
NLC beam delivery section
0 500 1000 1500 2000 2500
Path length, m
ENGYSP
ENGYAB
ENGYAB2 YSP0 - XSP2
ABS3
IP
||||
||||
CLIC beam delivery section
Figure 2: Collimator locations in the TESLA (top), NLC (middle) and CLIC (bottom) beam deliv-ery systems.
15
-0.15
-0.1
-0.05
0
0.05
0.1
0 200 400 600 800 1000 1200 1400 1600
Dis
pers
ion,
m
Path length, m
TESLA
0 200 400 600 800 1000 1200 1400 1600
Path length, m
-0.2-0.15
-0.1-0.05
00.05
0.10.15
0.20.25
0 200 400 600 800 1000 1200 1400
Dis
pers
ion,
m
Path length, m
NLC
0 200 400 600 800 1000 1200 1400
Path length, m
-0.3-0.2-0.1
00.10.20.30.40.5
0 500 1000 1500 2000 2500
Dis
pers
ion,
m
Path length, m
CLIC
0 500 1000 1500 2000 2500
Path length, m
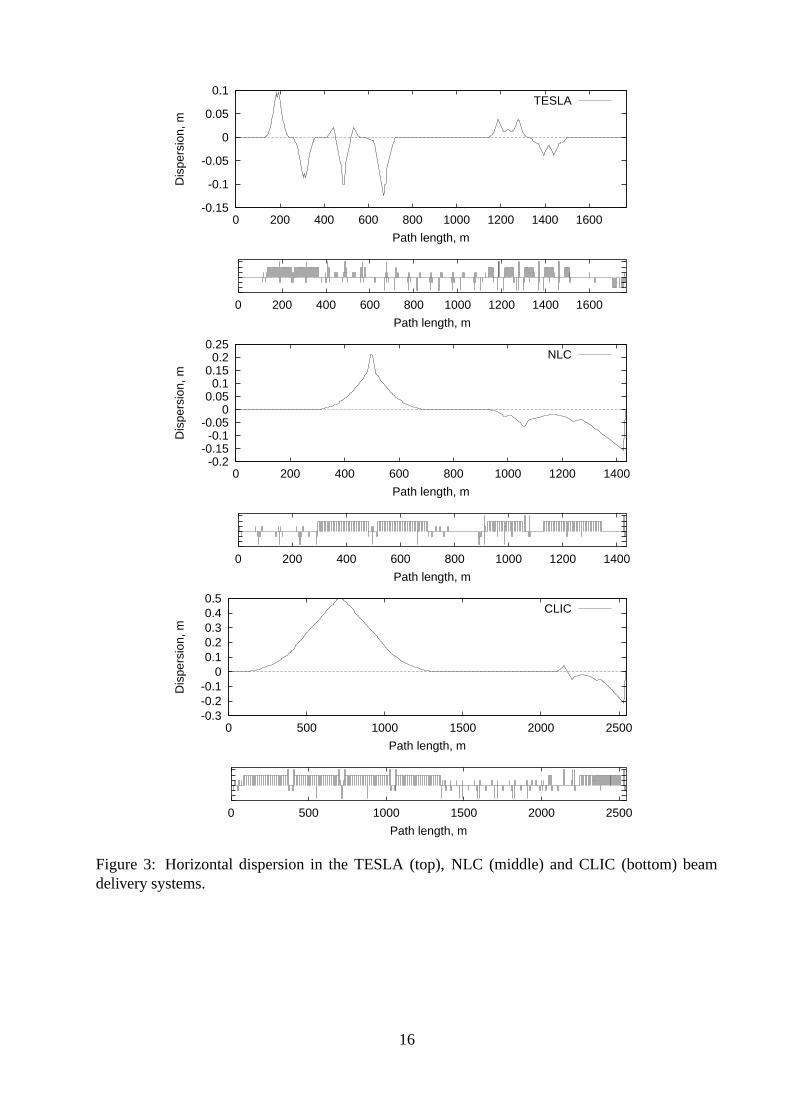
Figure 3: Horizontal dispersion in the TESLA (top), NLC (middle) and CLIC (bottom) beamdelivery systems.
16
-5
0
5
10
15
20
25
30
35
0 200 400 600 800 1000 1200 1400 1600 1800
Ape
rtur
e ha
lf-si
ze, m
m
Path length, m
horizontal, 30 sigmavertcal, 100 sigma
aperturebeam line
-5
0
5
10
15
20
25
30
35
0 200 400 600 800 1000 1200 1400
Ape
rtur
e ha
lf-si
ze, m
m
Path length, m
horizontal, 30 sigmavertcal, 100 sigma
aperturebeam line
-5
0
5
10
15
20
25
30
35
0 500 1000 1500 2000 2500
Ape
rtur
e ha
lf-si
ze, m
m
Path length, m
horizontal, 30 sigmavertcal, 100 sigma
aperturebeam line
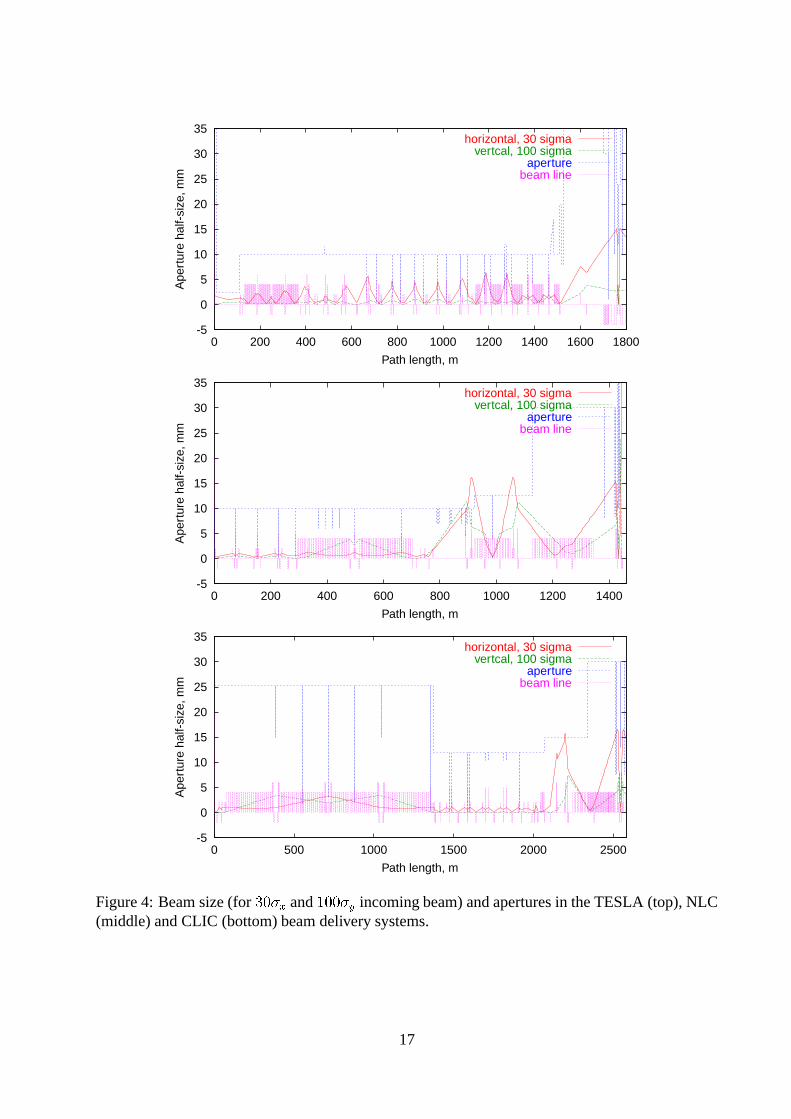
Figure 4: Beam size (for 30�x and 100�y incoming beam) and apertures in the TESLA (top), NLC(middle) and CLIC (bottom) beam delivery systems.
17

2000 mm600400 2000 mm 600 400
QFT1QFT1
IPR24
R12
R12
R24R24
e Beam-
D20 R
22
D20
R90
D26 R
20 R30
2000 mm 820 mm 114 35 62 35 114 820 mm 2000 mm
10 mm
400 mm
IP
R22
10 mrad
R90
e beam-
Figure 5: Aperture map in the IP region for TESLA (top) and NLC (bottom), as modelled in thesimulations for this report. Note the TESLA vertex detector should have been simulated by a15 mm-radius aperture limitation.
18
�������������������������������
�������������������������������
��������������������������������
��������������������������������
��������������������������������
��������������������������������
�������������������������������
�������������������������������
���������������������������������������
���������������������������������������
���������������������������������������
���������������������������������������
������������������������������������������������������������������������������������������������������������
������������������������������������������������������������������������������������������������������������
���������������������������������������������������������������������������������������������������������������������������
���������������������������������������������������������������������������������������������������������������������������
��������������������������������������������������������
��������������������������������������������������������
0
040 120 160 200 280
du
mp
1
20
40
60
80
20
40
60 du
mp
2
12 mm
55 mm
du
mp
4
quads
qu
ad
qu
ad
qu
ad
photons
photons
S, m
beam
IP
70 mm
photons
bend
du
mp
1
sep
arat
or
sep
arat
or
70 mm
70 mm du
mp
2
D20 mm
bend
55 mm
mas
k
X(mm)
50 mm
50 mm
10 mm
photons
du
mp
3d
um
p 3
10 m
m17
mm
200 σx
8 mm
�������������������������������
�������������������������������
��������������������������������
��������������������������������
��������������������������������
��������������������������������
�������������������������������
�������������������������������
���������������������������������������������������������������
���������������������������������������������������������������
���������������������������������������������������������������
���������������������������������������������������������������
���������������������������
���������������������������
���������������������������������������������������������������������
���������������������������������������������������������������������
������������������������������������������������������������������������
������������������������������������������������������������������������
������������������������������������������������������������������������
������������������������������������������������������������������������
��������������������������������������������������������������������������������
��������������������������������������������������������������������������������
0
040 120 160 200 280
20
40
60
80
20
40
60 du
mp
2
55 mm
du
mp
4
quads
qu
ad
qu
ad
qu
ad
photons
photons
S, mIP
70 mm
bend
70 mm
du
mp
2
D20 mm
bend
55 mm
mas
k
sep
tum
mag
net
12 mm
du
mp
1d
um
p 1
sep
arat
or
sep
arat
or
70 mm
(mm)Y
20 m
m
30 mm
30 mm
2 m
m photons
8 mm
10 mm
photons
du
mp
3d
um
p 3
8 mm2000 yσ
extractedbeam
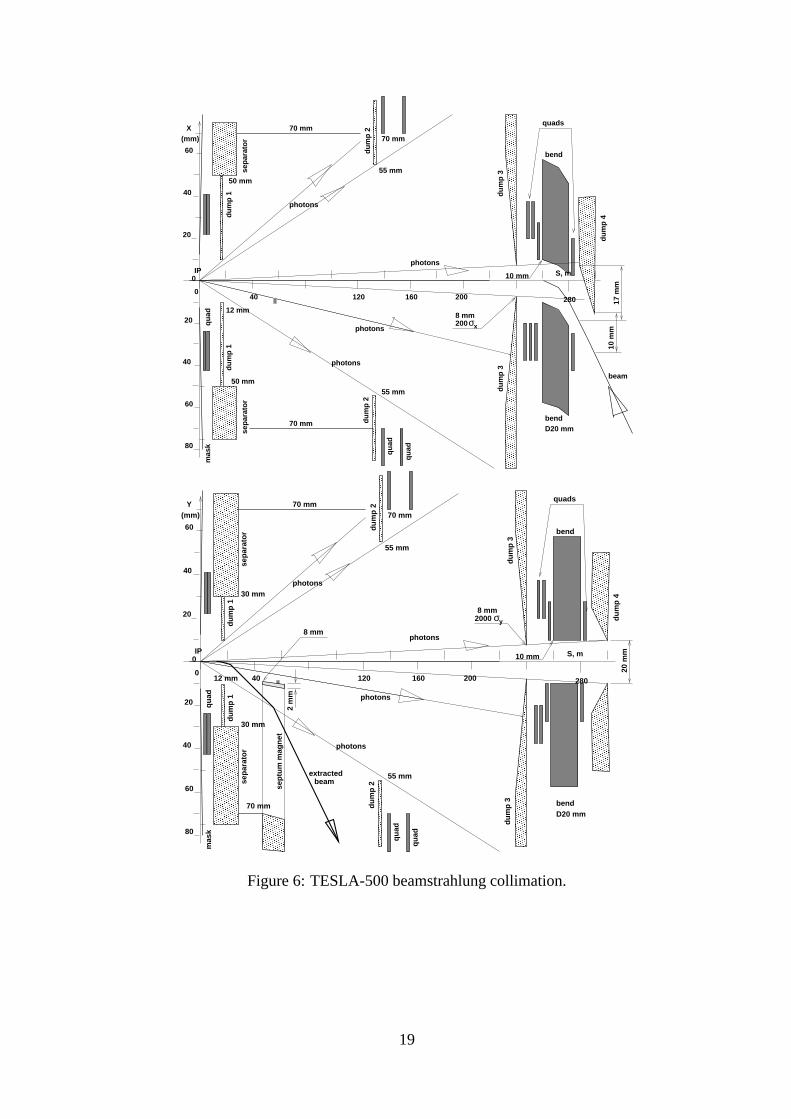
Figure 6: TESLA-500 beamstrahlung collimation.
19

0
200
400
600
800
1000
1200
1400
1600
242 244 246 248 250 252 254 256 258
dN/P
c
Pc, GeV
dP/P(sigma)=0.1
Figure 7: Initial particle population in the phase plane at the BDS entrance and energy distributionused for modelling the beam halo in TESLA. This halo is represented by 5 � 105 rays with 1=x and1=y density distributions for amplitudes of Ax = (7� 18)�x and Ay = (40 � 120)�y, and with amomentum spread of �(dP=P ) = 1%.
20

0
200
400
600
800
1000
1200
1400
1600
242 244 246 248 250 252 254 256 258
dN/d
Pc
Pc, GeV
"gistDP_halo_6.16X24.73G0.010"
Figure 8: Initial particle population in the phase plane at the BDS entrance and energy distributionused for modelling the beam halo in NLC. This halo is represented by 5 � 105 rays with 1=x and1=y density distributions for amplitudes of Ax = (6 � 16)�x and Ay = (24 � 73)�y, and with amomentum spread of �(dP=P ) = 1%.
21

0
200
400
600
800
1000
1200
1400
1600
242 244 246 248 250 252 254 256 258
dN/d
Pc
Pc, GeV
dP/P(sigma)=0.01
Figure 9: Initial particle population in the phase plane at the BDS entrance and energy distributionused for modelling the beam halo in CLIC. This halo is represented by 5 � 105 rays with 1=x and1=y density distributions for amplitudes of Ax = (5:7� 14:2)�x and Ay = (54� 162)�y, and witha momentum spread of �(dP=P ) = 1%.
22
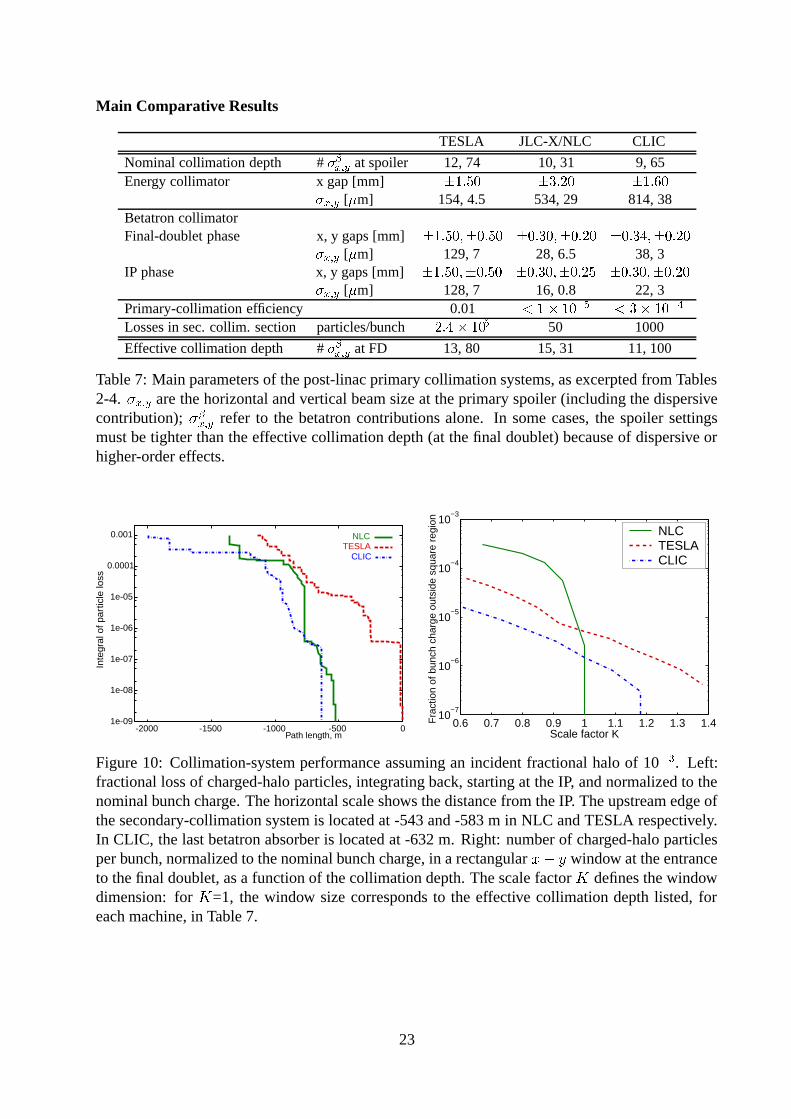
Main Comparative Results
TESLA JLC-X/NLC CLIC
Nominal collimation depth # ��x;y at spoiler 12, 74 10, 31 9, 65Energy collimator x gap [mm] �1:50 �3:20 �1:60
�x;y [�m] 154, 4.5 534, 29 814, 38Betatron collimatorFinal-doublet phase x, y gaps [mm] �1:50;�0:50 �0:30;�0:20 �0:34;�0:20
�x;y [�m] 129, 7 28, 6.5 38, 3IP phase x, y gaps [mm] �1:50;�0:50 �0:30;�0:25 �0:30;�0:20
�x;y [�m] 128, 7 16, 0.8 22, 3Primary-collimation efficiency 0.01 < 1� 10
�5 < 3� 10�4
Losses in sec. collim. section particles/bunch 2:4 � 105 50 1000
Effective collimation depth # ��x;y at FD 13, 80 15, 31 11, 100
Table 7: Main parameters of the post-linac primary collimation systems, as excerpted from Tables2-4. �x;y are the horizontal and vertical beam size at the primary spoiler (including the dispersivecontribution); ��
x;y refer to the betatron contributions alone. In some cases, the spoiler settingsmust be tighter than the effective collimation depth (at the final doublet) because of dispersive orhigher-order effects.
1e-09
1e-08
1e-07
1e-06
1e-05
0.0001
0.001
-2000 -1500 -1000 -500 0
Inte
gral
of p
artic
le lo
ss
Path length, m
NLCTESLA
CLIC
0.6 0.7 0.8 0.9 1 1.1 1.2 1.3 1.410
−7
10−6
10−5
10−4
10−3
Fra
ctio
n of
bun
ch c
harg
e ou
tsid
e sq
uare
reg
ion
Scale factor K
NLCTESLACLIC
Figure 10: Collimation-system performance assuming an incident fractional halo of 10�3. Left:fractional loss of charged-halo particles, integrating back, starting at the IP, and normalized to thenominal bunch charge. The horizontal scale shows the distance from the IP. The upstream edge ofthe secondary-collimation system is located at -543 and -583 m in NLC and TESLA respectively.In CLIC, the last betatron absorber is located at -632 m. Right: number of charged-halo particlesper bunch, normalized to the nominal bunch charge, in a rectangular x� y window at the entranceto the final doublet, as a function of the collimation depth. The scale factor K defines the windowdimension: for K=1, the window size corresponds to the effective collimation depth listed, foreach machine, in Table 7.
23
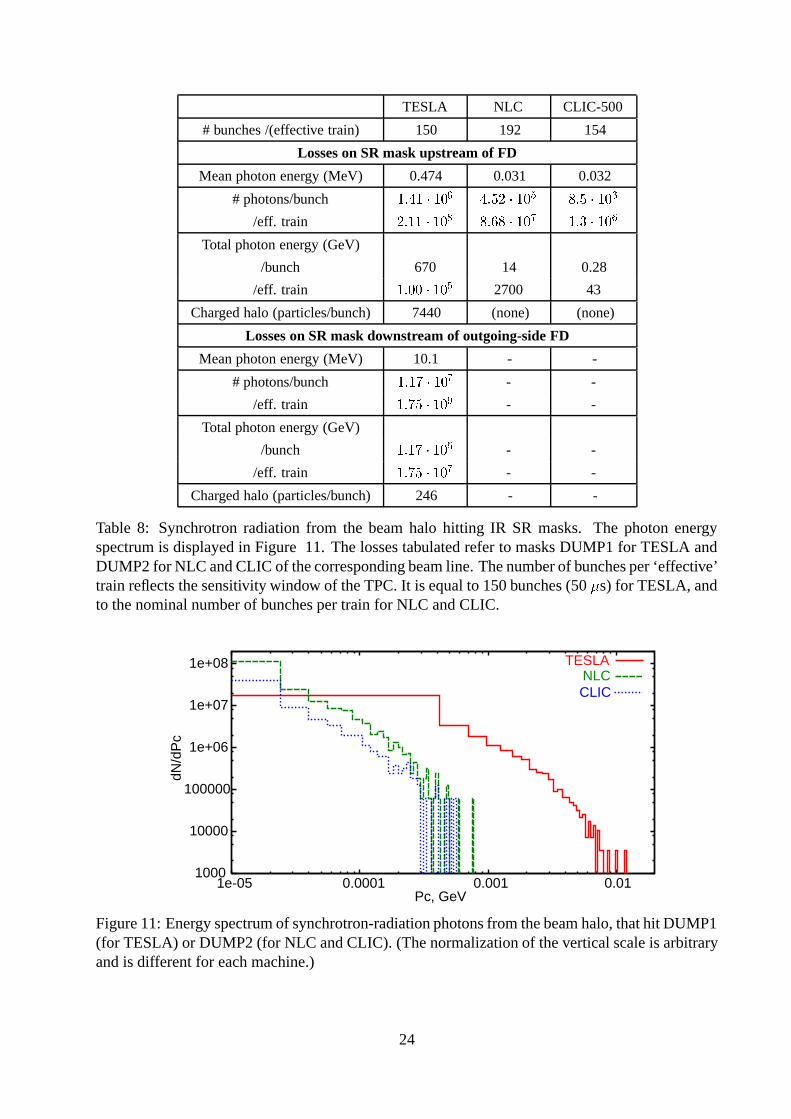
TESLA NLC CLIC-500
# bunches /(effective train) 150 192 154
Losses on SR mask upstream of FD
Mean photon energy (MeV) 0.474 0.031 0.032
# photons/bunch 1:41 � 106 4:52 � 105 8:5 � 103
/eff. train 2:11 � 108 8:68 � 107 1:3 � 106
Total photon energy (GeV)
/bunch 670 14 0.28
/eff. train 1:00 � 105 2700 43
Charged halo (particles/bunch) 7440 (none) (none)
Losses on SR mask downstream of outgoing-side FD
Mean photon energy (MeV) 10.1 - -
# photons/bunch 1:17 � 107 - -
/eff. train 1:75 � 109 - -
Total photon energy (GeV)
/bunch 1:17 � 105 - -
/eff. train 1:75 � 107 - -
Charged halo (particles/bunch) 246 - -
Table 8: Synchrotron radiation from the beam halo hitting IR SR masks. The photon energyspectrum is displayed in Figure 11. The losses tabulated refer to masks DUMP1 for TESLA andDUMP2 for NLC and CLIC of the corresponding beam line. The number of bunches per ‘effective’train reflects the sensitivity window of the TPC. It is equal to 150 bunches (50 �s) for TESLA, andto the nominal number of bunches per train for NLC and CLIC.
1000
10000
100000
1e+06
1e+07
1e+08
1e-05 0.0001 0.001 0.01
dN/d
Pc
Pc, GeV
TESLANLCCLIC
Figure 11: Energy spectrum of synchrotron-radiation photons from the beam halo, that hit DUMP1(for TESLA) or DUMP2 (for NLC and CLIC). (The normalization of the vertical scale is arbitraryand is different for each machine.)
24
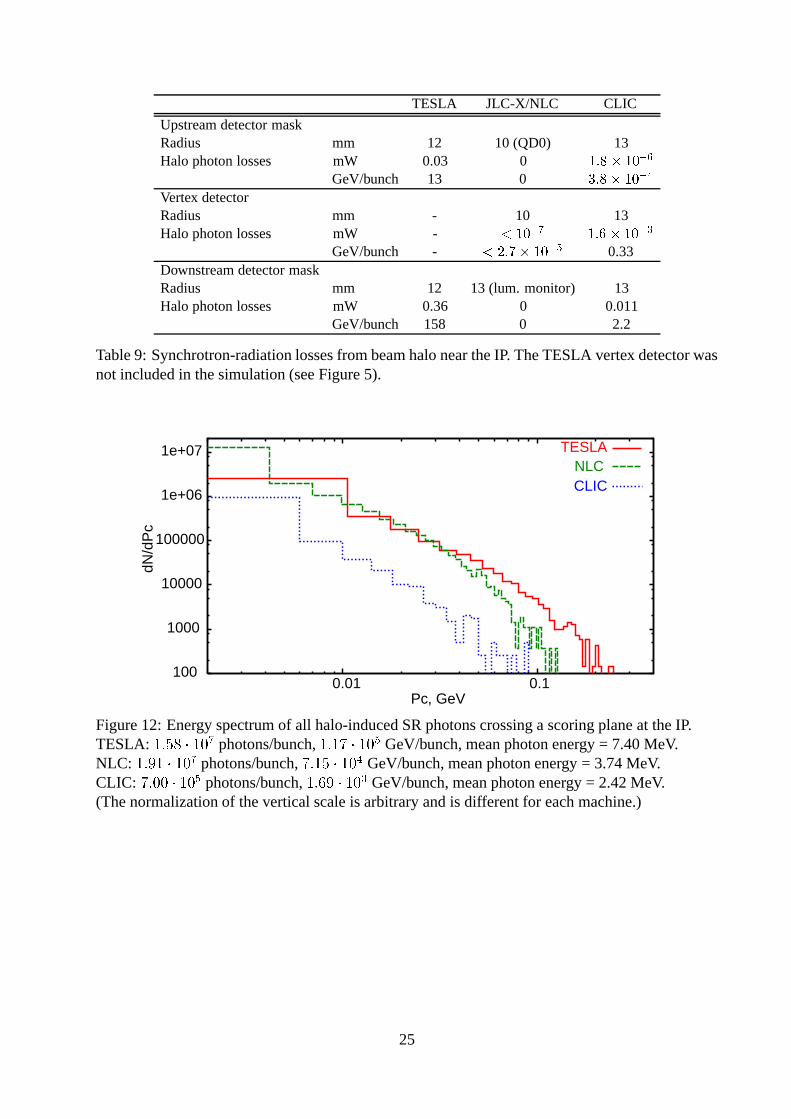
TESLA JLC-X/NLC CLIC
Upstream detector maskRadius mm 12 10 (QD0) 13Halo photon losses mW 0.03 0 1:8 � 10
�6
GeV/bunch 13 0 3:8 � 10�4
Vertex detectorRadius mm - 10 13Halo photon losses mW - < 10
�71:6 � 10
�3
GeV/bunch - < 2:7� 10�5 0.33
Downstream detector maskRadius mm 12 13 (lum. monitor) 13Halo photon losses mW 0.36 0 0.011
GeV/bunch 158 0 2.2
Table 9: Synchrotron-radiation losses from beam halo near the IP. The TESLA vertex detector wasnot included in the simulation (see Figure 5).
100
1000
10000
100000
1e+06
1e+07
0.01 0.1
dN/d
Pc
Pc, GeV
TESLANLCCLIC
Figure 12: Energy spectrum of all halo-induced SR photons crossing a scoring plane at the IP.TESLA: 1:58 � 107 photons/bunch, 1:17 � 105 GeV/bunch, mean photon energy = 7.40 MeV.NLC: 1:91 � 107 photons/bunch, 7:15 � 104 GeV/bunch, mean photon energy = 3.74 MeV.CLIC: 7:00 � 105 photons/bunch, 1:69 � 103 GeV/bunch, mean photon energy = 2.42 MeV.(The normalization of the vertical scale is arbitrary and is different for each machine.)
25

TESLA NLC CLIC-500
# bunches /(effective train) 150 192 154
Losses upstream of FD
Mean photon energy (MeV) 0.450 0.032 0.034
# photons/bunch 1:38 � 1010 0:93 � 109 5:93 � 108
/eff. train 2:07 � 1012 1:79 � 1011 9:13 � 1010
Total photon energy (GeV)
/bunch 6:21 � 106 2:96 � 104 2:03 � 104
/eff. train 9:32 � 108 5:68 � 106 3:13 � 106
Losses downstream of outgoing FD
Mean photon energy (MeV) 0.467 - -
# photons/bunch 4:75 � 108 - -
/eff. train 7:14 � 1010 - -
Total photon energy (GeV)
/bunch 2:22 � 105 - -
/eff. train 3:33 � 107 - -
Table 10: Synchrotron radiation from the beam core hitting IR SR masks. The photon energyspectrum is displayed in Figure 13. The losses tabulated refer to masks DUMP1 for TESLA andDUMP2 for NLC and CLIC of the corresponding beam line. The number of bunches per ‘effective’train reflects the sensitivity window of the TPC. It is equal to 150 bunches (50 �s) for TESLA, andto the nominal number of bunches per train for NLC and CLIC.
1000
10000
100000
1e+06
1e+07
1e+08
1e-05 0.0001 0.001 0.01
dN/d
Pc
Pc, GeV
TESLANLCCLIC
Figure 13: Energy spectrum of synchrotron-radiation photons from the beam core, that hit DUMP1(for TESLA) or DUMP2 (for NLC and CLIC). (The normalization of the vertical scale is arbitraryand is different for each machine.)
26
6 Appendix: Loss Patterns and Halo Characterization
0
50
100
150
200
250
244 246 248 250 252 254 256
dN/d
Pc
Pc, GeV
NLC
0
50
100
150
200
250
300
244 246 248 250 252 254 256
dN/d
Pc
Pc, GeV
TESLA
0
50
100
150
200
250
300
350
400
450
244 246 248 250 252 254 256
dN/d
Pc
Pc, GeV
CLIC
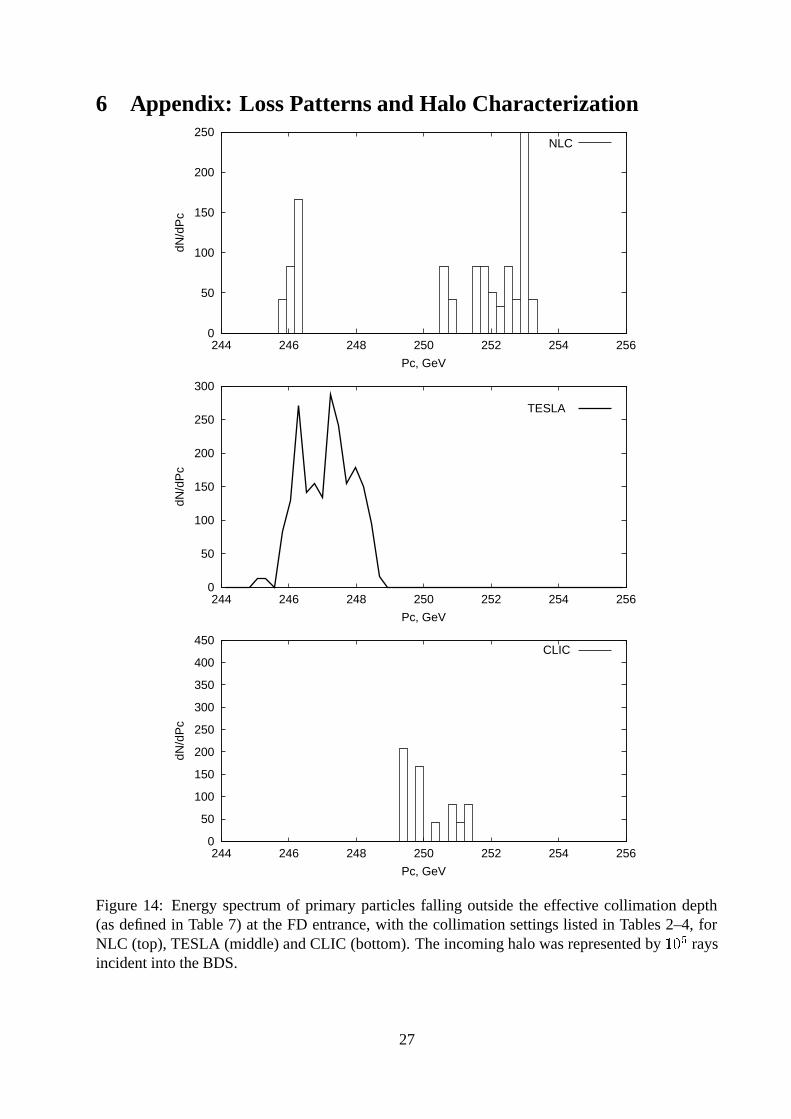
Figure 14: Energy spectrum of primary particles falling outside the effective collimation depth(as defined in Table 7) at the FD entrance, with the collimation settings listed in Tables 2–4, forNLC (top), TESLA (middle) and CLIC (bottom). The incoming halo was represented by 105 raysincident into the BDS.
27
0.0001
0.001
0.01
0.1
1
10
100
1000
10000
100000
600 800 1000 1200 1400 1600 1800
Par
ticle
loss
, W/m
Path length, m
TESLA
600 800 1000 1200 1400 1600 1800
Path length, m
IP
1e-09
1e-08
1e-07
1e-06
1e-05
0.0001
0.001
600 800 1000 1200 1400 1600 1800
Inte
gral
(fr
om IP
) of
par
ticle
loss
, I(lo
st)/
I(to
tal)
Path length, m
TESLA
600 800 1000 1200 1400 1600 1800
Path length, m
IP
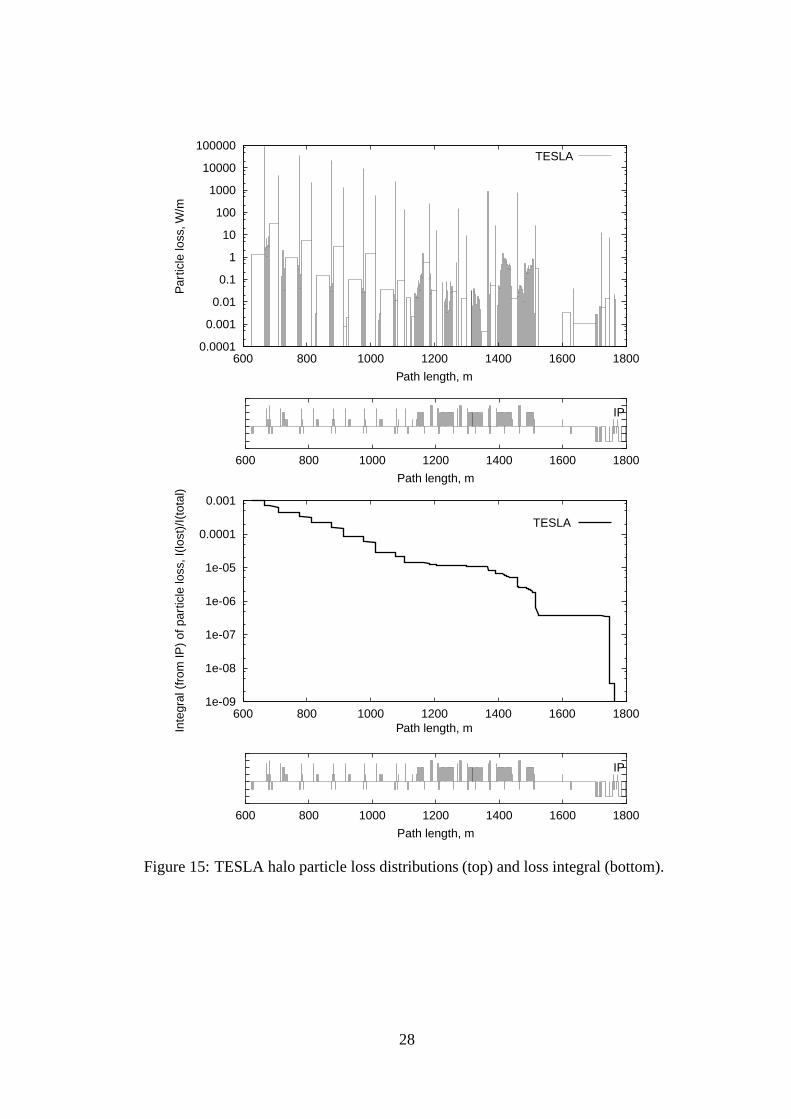
Figure 15: TESLA halo particle loss distributions (top) and loss integral (bottom).
28

0.0001
0.001
0.01
0.1
1
10
100
1000
10000
100000
1e+06
0 200 400 600 800 1000 1200 1400
Par
ticle
loss
, W/m
Path length, m
NLC
0 200 400 600 800 1000 1200 1400
Path length, m
IP
1e-09
1e-08
1e-07
1e-06
1e-05
0.0001
0.001
0 200 400 600 800 1000 1200 1400
Inte
gral
(fr
om IP
) of
par
ticle
loss
, I(lo
st)/
I(to
tal)
Path length, m
NLC
0 200 400 600 800 1000 1200 1400
Path length, m
IP
Figure 16: NLC halo particle loss distributions (top) and loss integral(bottom).
29

0.0001
0.001
0.01
0.1
1
10
100
1000
10000
100000
0 500 1000 1500 2000 2500
Par
ticle
loss
, W/m
Path length, m
CLIC
0 500 1000 1500 2000 2500
Path length, m
1e-07
1e-06
1e-05
0.0001
0.001
0 500 1000 1500 2000 2500
Inte
gral
(fr
om IP
) of
par
ticle
loss
, I(lo
st)/
I(to
tal)
Path length, m
CLIC
0 500 1000 1500 2000 2500
Path length, m
Figure 17: CLIC halo particle loss distributions (top) and loss integral (bottom).
30
1e-07
1e-06
1e-05
0.0001
0.001
0.01
0.1
1
10
600 800 1000 1200 1400 1600 1800
Pho
ton
loss
. W/m
Path length, m
TESLA
600 800 1000 1200 1400 1600 1800
Path length, m
IP
0.0001
0.001
0.01
0.1
1
600 800 1000 1200 1400 1600 1800
Inte
gral
(fr
om IP
) of
pho
ton
loss
, W
Path length, m
TESLA
600 800 1000 1200 1400 1600 1800
Path length, m
IP
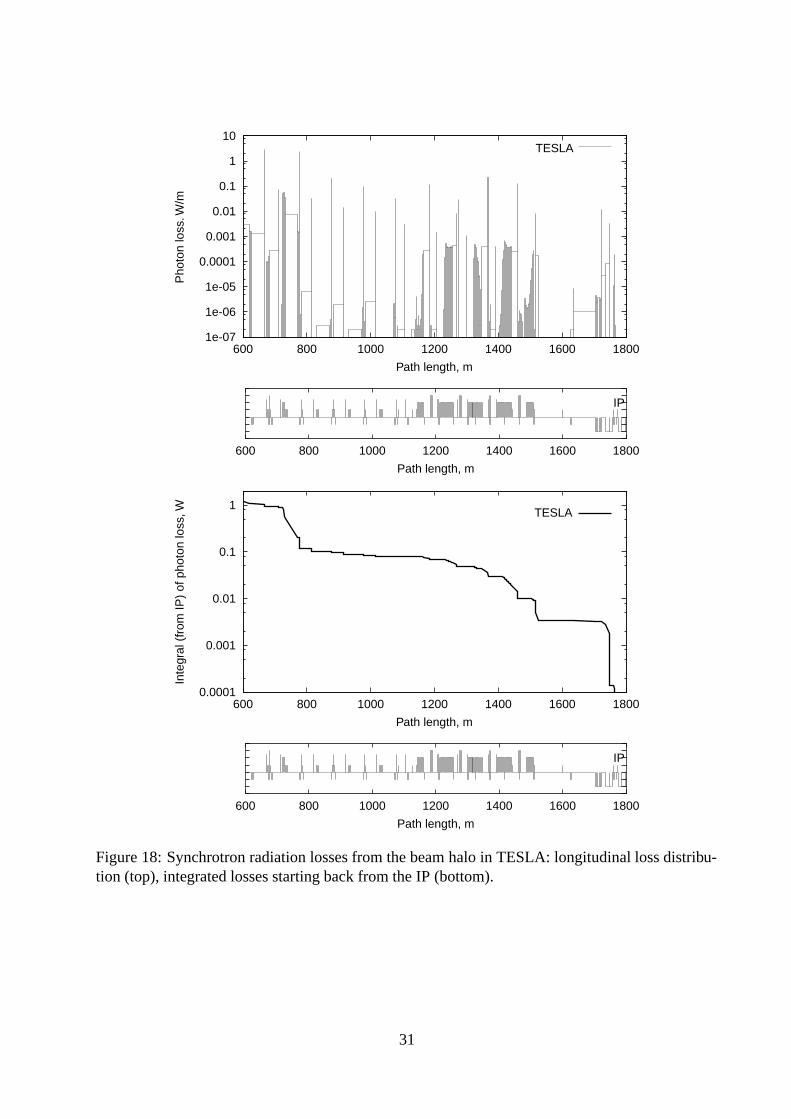
Figure 18: Synchrotron radiation losses from the beam halo in TESLA: longitudinal loss distribu-tion (top), integrated losses starting back from the IP (bottom).
31
1e-12
1e-10
1e-08
1e-06
0.0001
0.01
1
0 200 400 600 800 1000 1200 1400
Pho
ton
loss
. W/m
Path length, m
NLC
0 200 400 600 800 1000 1200 1400
Path length, m
IP
1e-10
1e-08
1e-06
0.0001
0.01
1
0 200 400 600 800 1000 1200 1400
Inte
gral
(fr
om IP
) of
pho
ton
loss
, W
Path length, m
NLC
0 200 400 600 800 1000 1200 1400
Path length, m
IP
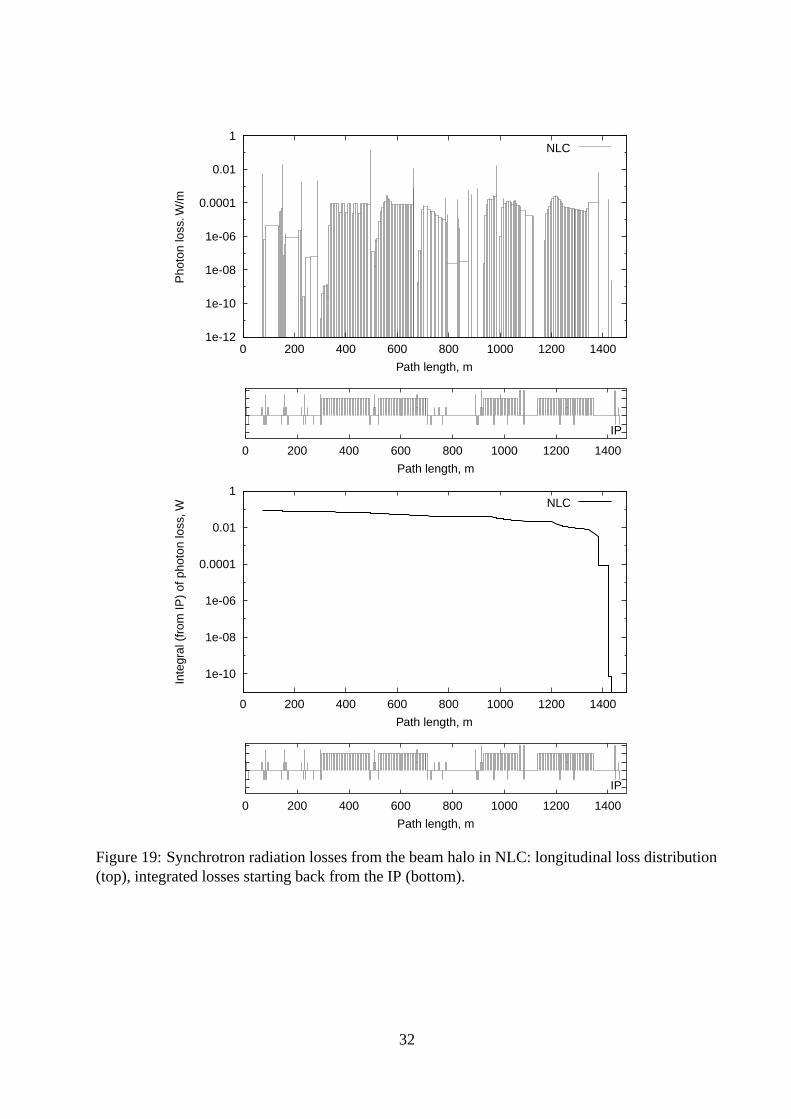
Figure 19: Synchrotron radiation losses from the beam halo in NLC: longitudinal loss distribution(top), integrated losses starting back from the IP (bottom).
32

1e-14
1e-12
1e-10
1e-08
1e-06
0.0001
0.01
1
0 500 1000 1500 2000 2500
Pho
ton
loss
, W/m
Path length, m
CLIC
0 500 1000 1500 2000 2500
Path length, m
0
0.01
0.02
0.03
0.04
0.05
0 500 1000 1500 2000 2500
Inte
gral
(fr
om IP
) of
pho
ton
loss
, W
Path length, m
CLIC
0 500 1000 1500 2000 2500
Path length, m
Figure 20: Synchrotron radiation losses from the beam halo in CLIC: longitudinal loss distribution(top), integrated losses starting back from the IP (bottom).
33

1e-07
1e-06
1e-05
0.0001
0.001
0.01
0.1
1
1700 1720 1740 1760 1780 1800
Pho
ton
loss
. W/m
Path length, m
TESLA
1700 1720 1740 1760 1780 1800
Path length, m
separator separatorseptum-magnet IP
0
0.0005
0.001
0.0015
0.002
0.0025
0.003
0.0035
1700 1720 1740 1760 1780 1800
Inte
gral
(fr
om IP
) of
pho
ton
loss
, W
Path length, m
TESLA
1700 1720 1740 1760 1780 1800
Path length, m
separator separatorseptum-magnet IP
Figure 21: Synchrotron radiation losses from the beam halo near the TESLA IP: longitudinal lossdistribution (top), integrated losses starting back from the IP (bottom). The IP is at 1766.393 m.
34
1e-09
1e-08
1e-07
1e-06
1e-05
0.0001
0.001
0.01
1300 1320 1340 1360 1380 1400 1420 1440
Pho
ton
loss
. W/m
Path length, m
NLC
1300 1320 1340 1360 1380 1400 1420 1440
Path length, m
IPDUMP1 DUMP2bend
1e-11
1e-10
1e-09
1e-08
1e-07
1e-06
1e-05
0.0001
0.001
0.01
1300 1320 1340 1360 1380 1400 1420 1440
Inte
gral
(fr
om IP
) of
pho
ton
loss
, W
Path length, m
NLC
1300 1320 1340 1360 1380 1400 1420 1440
Path length, m
IPDUMP1 DUMP2bend
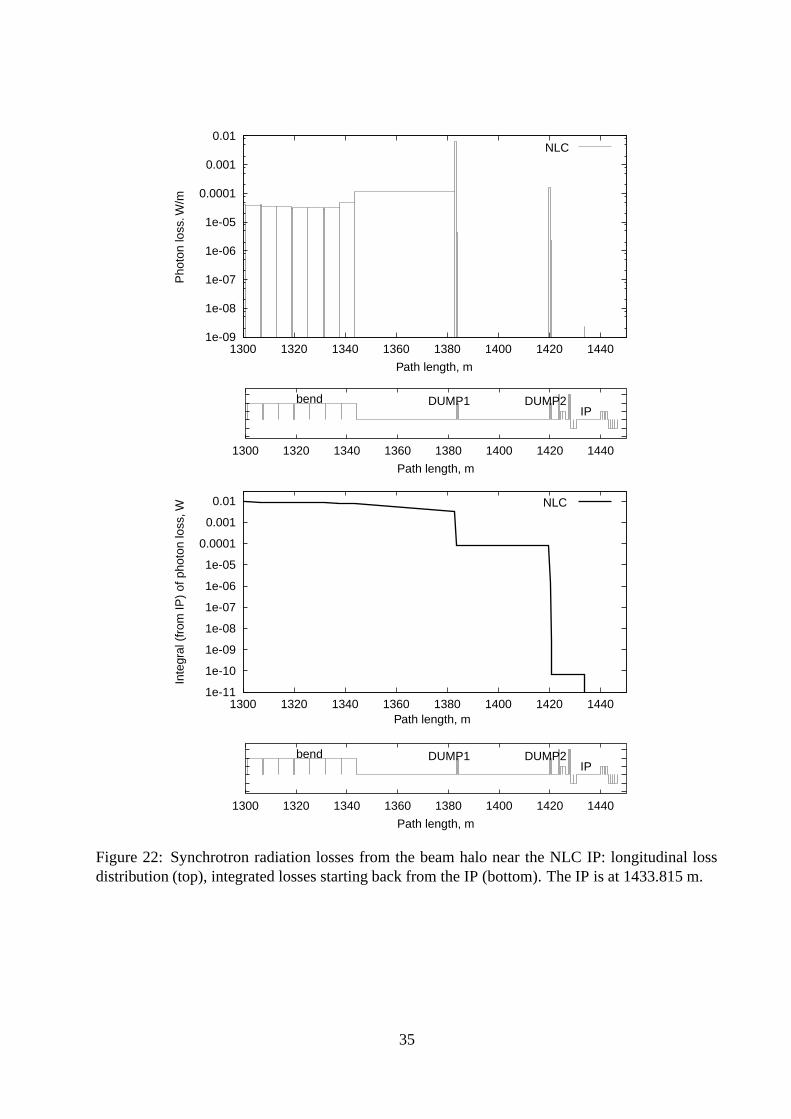
Figure 22: Synchrotron radiation losses from the beam halo near the NLC IP: longitudinal lossdistribution (top), integrated losses starting back from the IP (bottom). The IP is at 1433.815 m.
35

1e-09
1e-08
1e-07
1e-06
1e-05
0.0001
0.001
0.01
0.1
2400 2420 2440 2460 2480 2500 2520 2540 2560 2580
Pho
ton
loss
, W/m
Path length, m
CLIC
2400 2420 2440 2460 2480 2500 2520 2540 2560 2580
Path length, m
1e-08
1e-07
1e-06
1e-05
0.0001
0.001
0.01
0.1
2400 2420 2440 2460 2480 2500 2520 2540 2560 2580
Inte
gral
(fr
om IP
) of
pho
ton
loss
, W
Path length, m
CLIC
2400 2420 2440 2460 2480 2500 2520 2540 2560 2580
Path length, m
Figure 23: Synchrotron radiation losses from the beam halo near the CLIC IP: longitudinal lossdistribution (top), integrated losses starting back from the IP (bottom). The IP is at 2544.74 m.
36
0.0001
0.001
0.01
0.1
1
10
100
1000
10000
0 200 400 600 800 1000 1200 1400 1600 1800
Pho
ton
loss
, W/m
Path length, m
TESLA
0 200 400 600 800 1000 1200 1400 1600 1800
Path length, m
spm1 spm2sp1
sp2sp3
sp4spX1
spX2spY1
spY2
IP
0.001
0.01
0.1
1
10
100
1700 1720 1740 1760 1780 1800
Pho
ton
loss
, W/m
Path length, m
TESLA
1700 1720 1740 1760 1780 1800
Path length, m
septum-magnet separator separatorIP
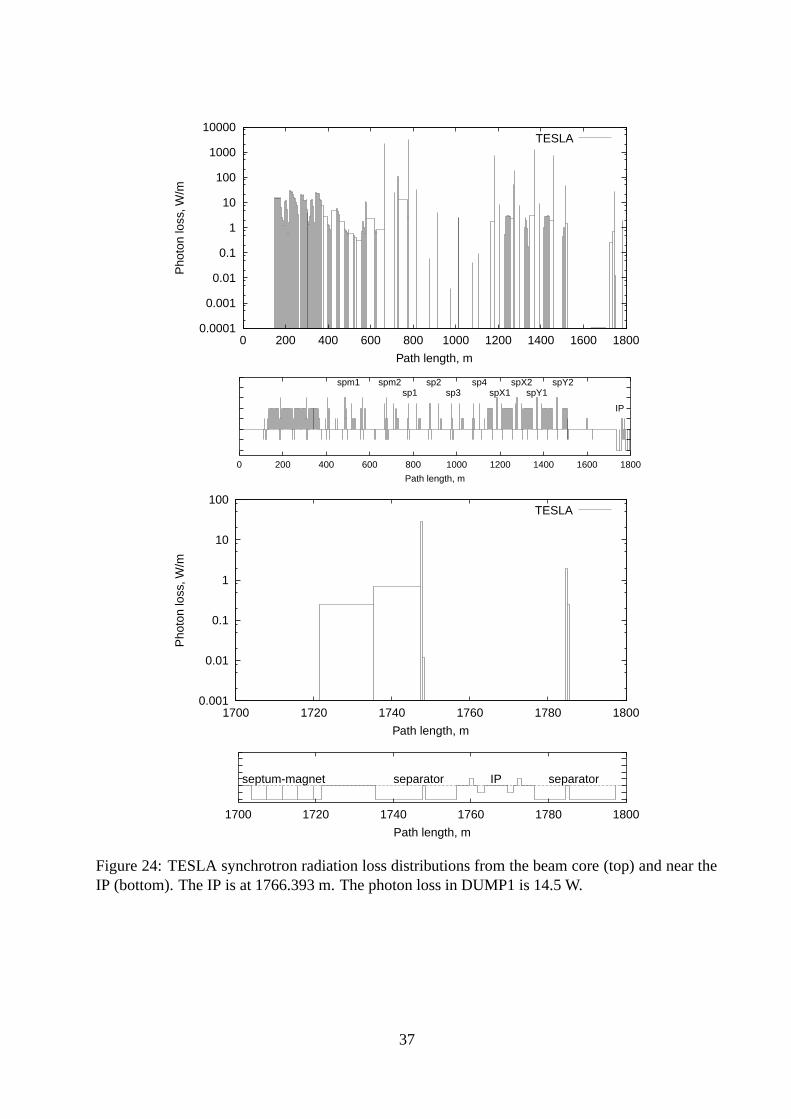
Figure 24: TESLA synchrotron radiation loss distributions from the beam core (top) and near theIP (bottom). The IP is at 1766.393 m. The photon loss in DUMP1 is 14.5 W.
37
0.0001
0.001
0.01
0.1
1
10
100
1000
0 200 400 600 800 1000 1200 1400
Pho
ton
loss
, W/m
Path length, m
NLC
0 200 400 600 800 1000 1200 1400
Path length, m
IP
0.001
0.01
0.1
1
10
1300 1320 1340 1360 1380 1400 1420 1440
Pho
ton
loss
, W/m
Path length, m
NLC
1300 1320 1340 1360 1380 1400 1420 1440
Path length, m
IPDUMP1 DUMP2bend
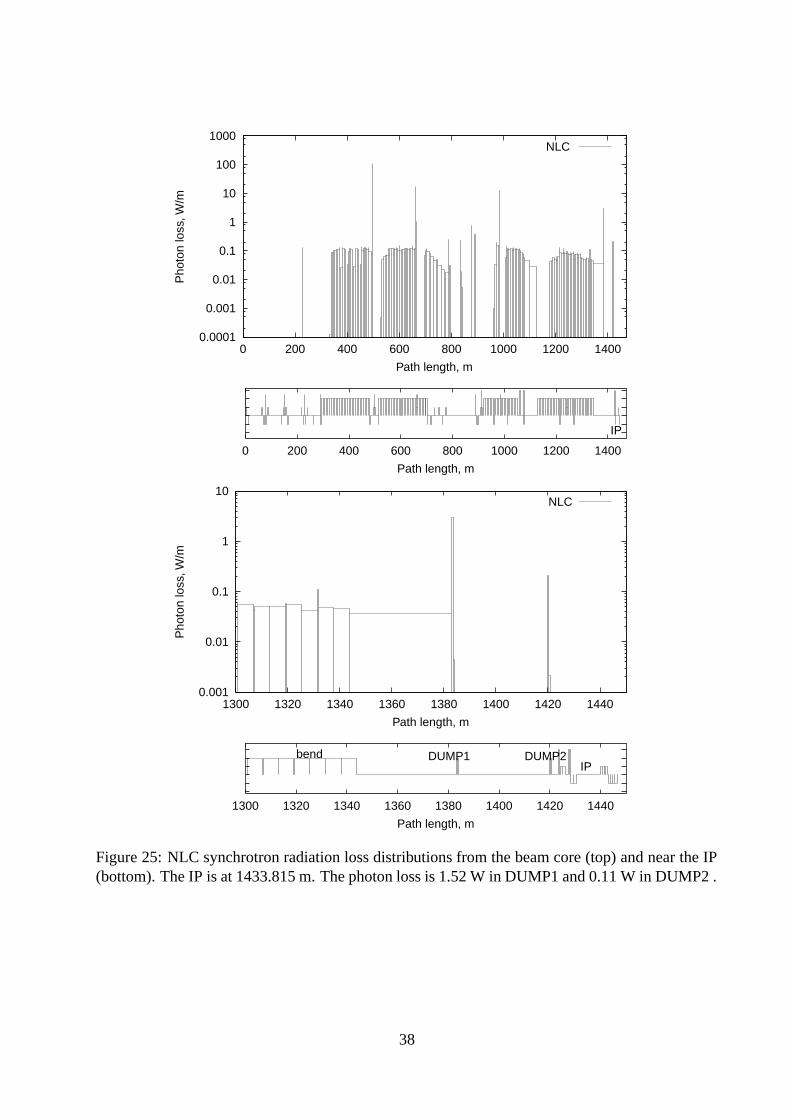
Figure 25: NLC synchrotron radiation loss distributions from the beam core (top) and near the IP(bottom). The IP is at 1433.815 m. The photon loss is 1.52 W in DUMP1 and 0.11 W in DUMP2 .
38
1e-10
1e-08
1e-06
0.0001
0.01
1
100
0 500 1000 1500 2000 2500
Pho
ton
loss
, W/m
Path length, m
CLIC
0 500 1000 1500 2000 2500
Path length, m
0.001
0.01
0.1
1
10
2400 2420 2440 2460 2480 2500 2520 2540 2560 2580
Pho
ton
loss
, W/m
Path length, m
CLIC
2400 2420 2440 2460 2480 2500 2520 2540 2560 2580
Path length, m
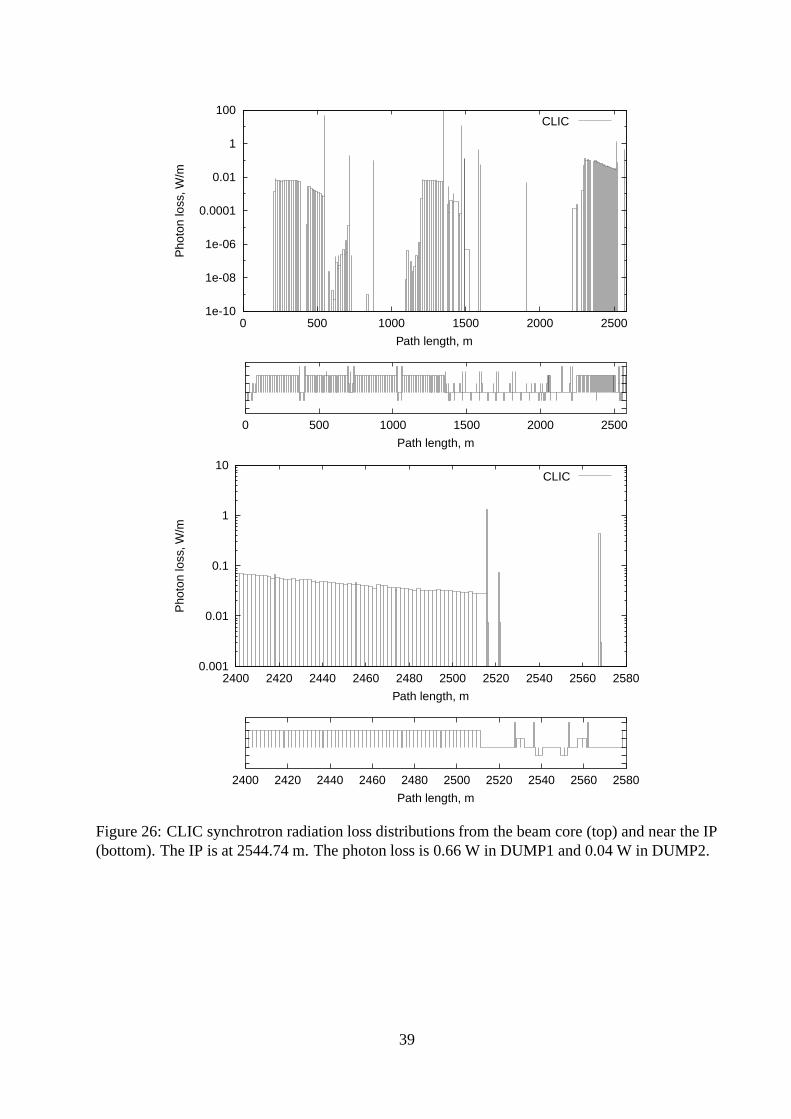
Figure 26: CLIC synchrotron radiation loss distributions from the beam core (top) and near the IP(bottom). The IP is at 2544.74 m. The photon loss is 0.66 W in DUMP1 and 0.04 W in DUMP2.
39

Figure 27: TESLA halo particle population with and without collimation in the phase plane at theFF doublet entrance.
40
0
500
1000
1500
2000
2500
-1870 -1865 -1860 -1855 -1850 -1845 -1840 -1835 -1830 -1825
dN/d
X
X, mm
no collimationwith collimation
0
1000
2000
3000
4000
5000
6000
7000
-5 -4 -3 -2 -1 0 1 2 3 4 5
dN/d
Y
Y, mm
no collimationwith collimation
0
100
200
300
400
500
600
700
800
900
1000
-60 -40 -20 0 20 40 60
dN/d
X
X, sigma
no collimationwith collimation
0
20
40
60
80
100
120
140
160
180
-200 -150 -100 -50 0 50 100 150 200
dN/d
Y
Y, sigma
no collimationwith collimation
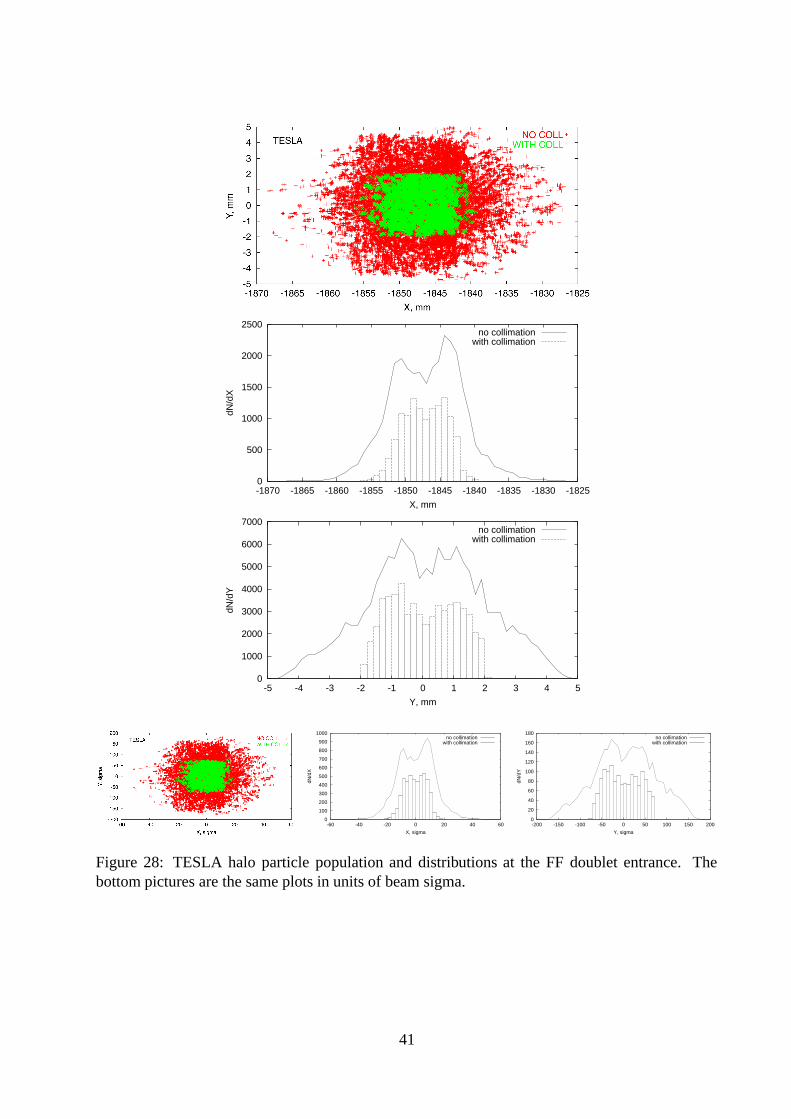
Figure 28: TESLA halo particle population and distributions at the FF doublet entrance. Thebottom pictures are the same plots in units of beam sigma.
41
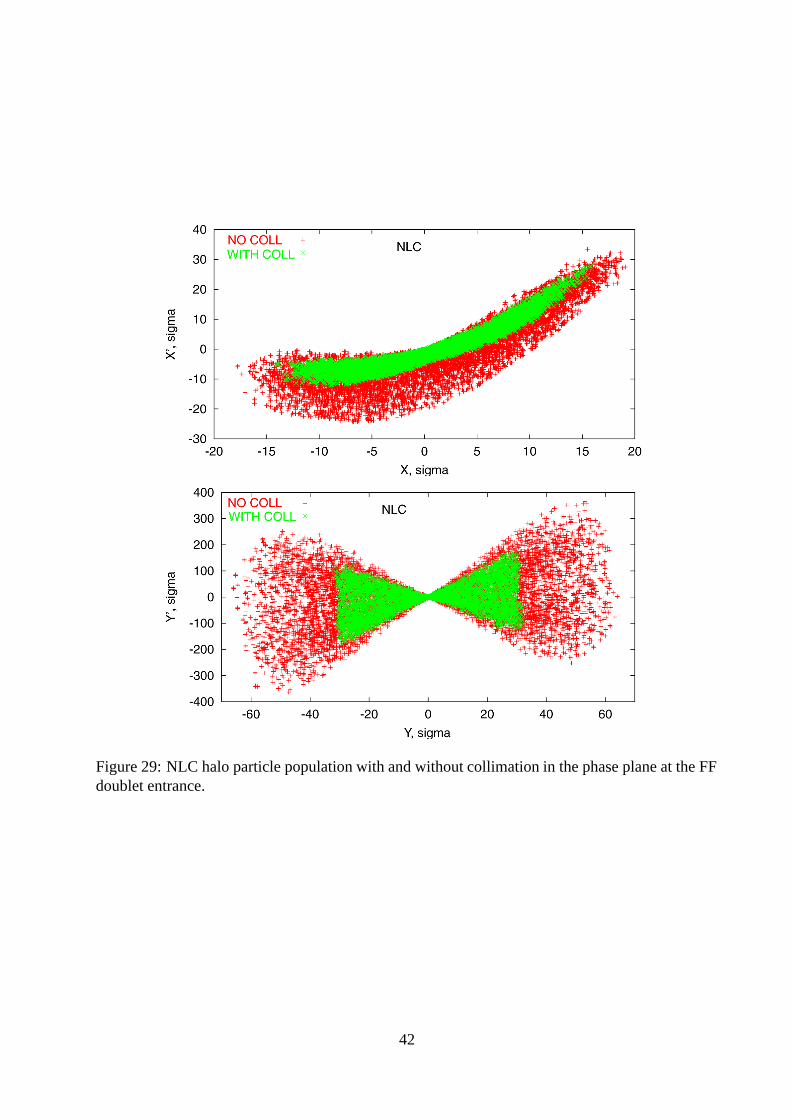
Figure 29: NLC halo particle population with and without collimation in the phase plane at the FFdoublet entrance.
42
0
1000
2000
3000
4000
5000
6000
7000
8000
9000
-2454 -2452 -2450 -2448 -2446 -2444 -2442 -2440 -2438 -2436 -2434
dN/d
X
X, mm
no collimationwith collimation
0
5000
10000
15000
20000
25000
-5 -4 -3 -2 -1 0 1 2 3 4 5
dN/d
Y
Y, mm
no collimationwith collimation
0
500
1000
1500
2000
2500
3000
3500
4000
4500
-20 -15 -10 -5 0 5 10 15 20
dN/d
X
X, sigma
no collimationwith collimation
0
200
400
600
800
1000
1200
1400
-80 -60 -40 -20 0 20 40 60 80
dN/d
Y
Y, sigma
no collimationwith collimation
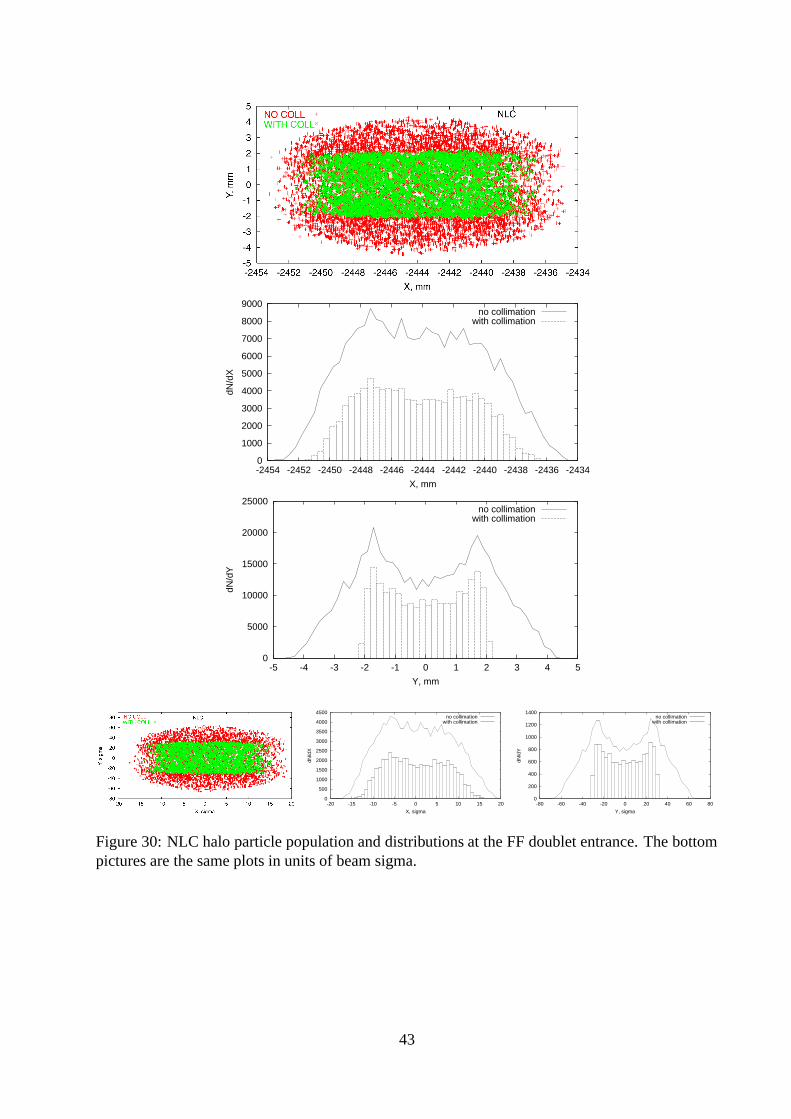
Figure 30: NLC halo particle population and distributions at the FF doublet entrance. The bottompictures are the same plots in units of beam sigma.
43
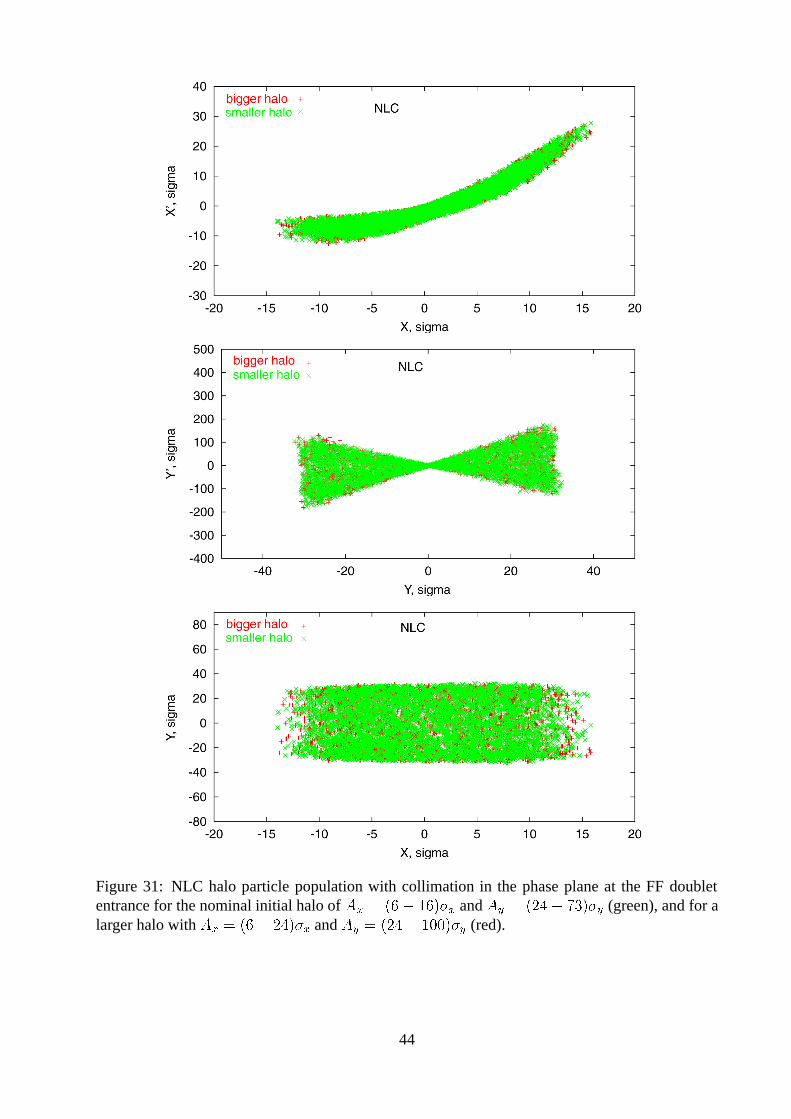
Figure 31: NLC halo particle population with collimation in the phase plane at the FF doubletentrance for the nominal initial halo of Ax = (6� 16)�x and Ay = (24� 73)�y (green), and for alarger halo with Ax = (6� 24)�x and Ay = (24� 100)�y (red).
44
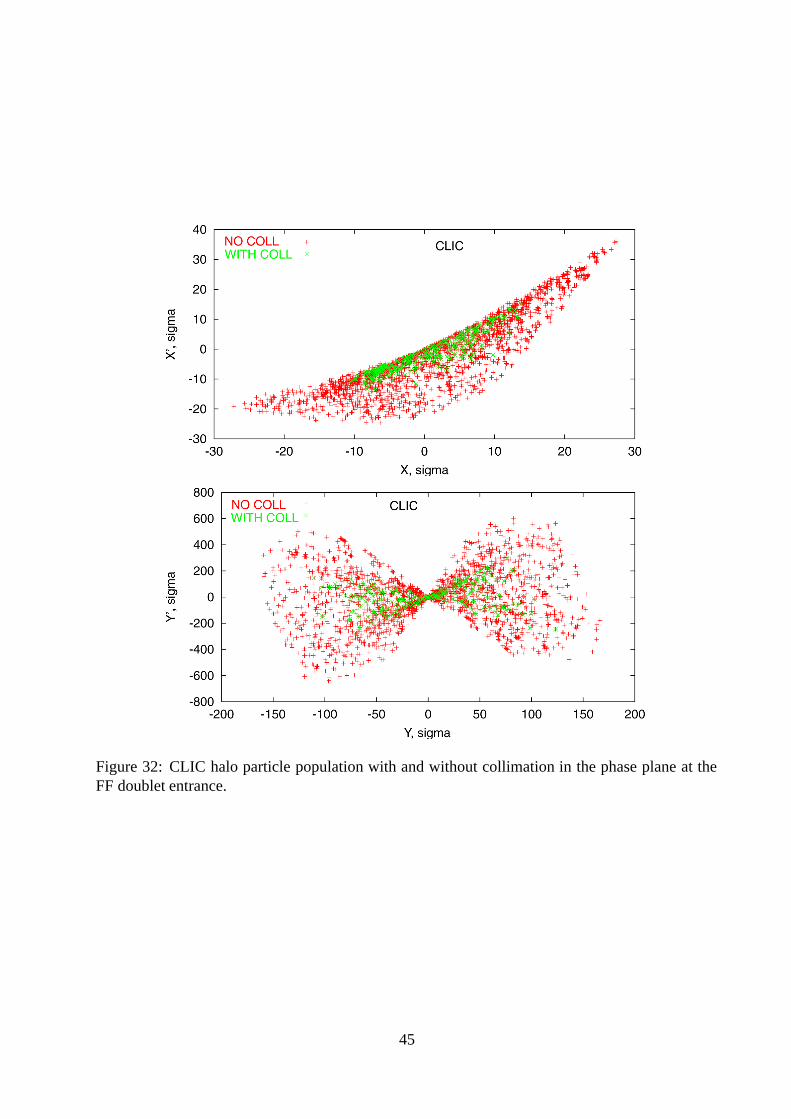
Figure 32: CLIC halo particle population with and without collimation in the phase plane at theFF doublet entrance.
45

0
500
1000
1500
2000
2500
-1770 -1765 -1760 -1755 -1750 -1745 -1740
dN/d
X
X, mm
no collimationwith collimation
0
500
1000
1500
2000
2500
3000
3500
4000
-8 -6 -4 -2 0 2 4 6 8
dN/d
Y
Y, mm
no collimationwith collimation
0
200
400
600
800
1000
1200
1400
1600
-25 -20 -15 -10 -5 0 5 10 15 20 25
dN/d
X
X, sigma
no collimationwith collimation
0
20
40
60
80
100
120
140
160
180
-150 -100 -50 0 50 100 150
dN/d
Y
Y, sigma
no collimationwith collimation
Figure 33: CLIC halo particle population and distributions at the FF doublet entrance. The bottompictures are the same plots in units of beam sigma.
46

Figure 34: TESLA synchrotron radiation population from beam halo in the phase plane at the IP.Green (grey) are photons from the soft bend. The bottom pictures are the same plots in units ofbeam sigma.
47
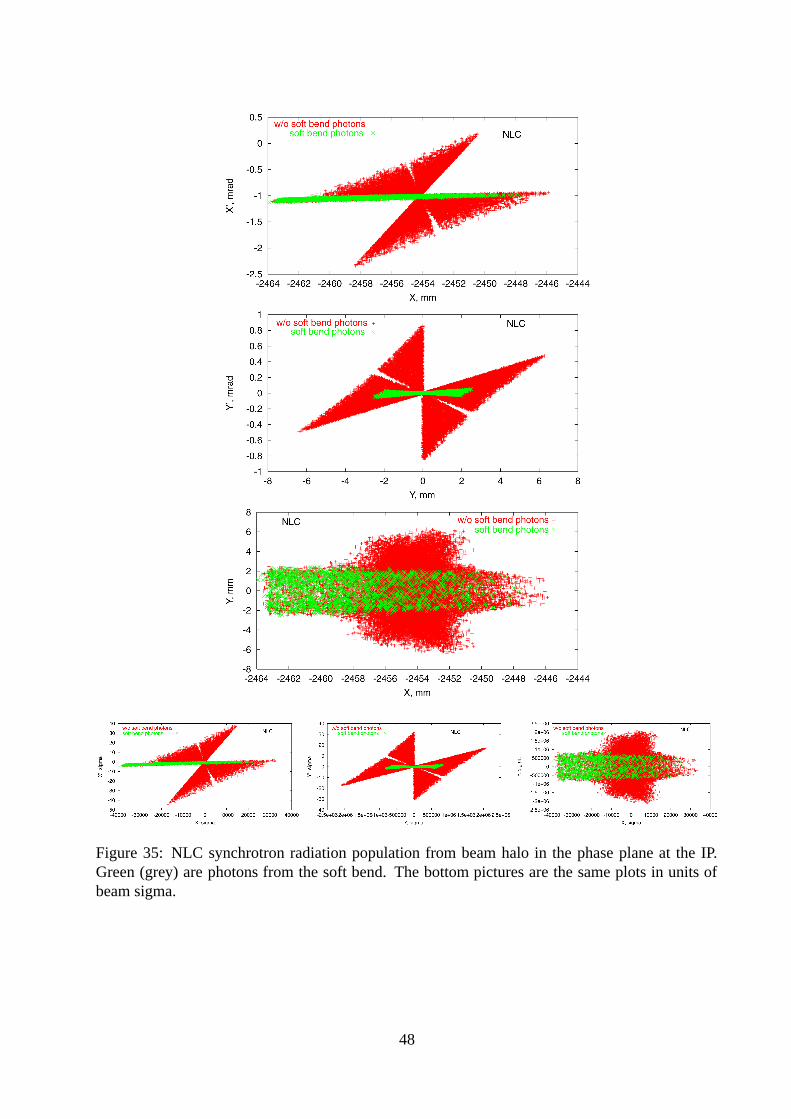
Figure 35: NLC synchrotron radiation population from beam halo in the phase plane at the IP.Green (grey) are photons from the soft bend. The bottom pictures are the same plots in units ofbeam sigma.
48
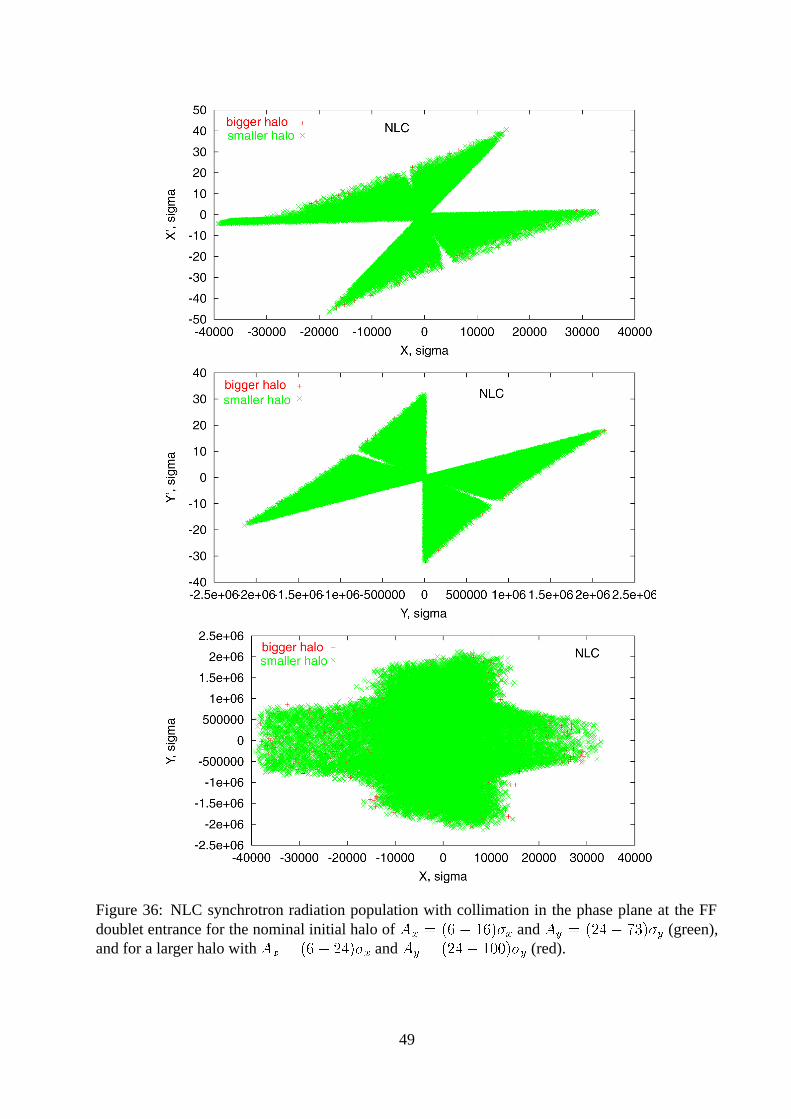
Figure 36: NLC synchrotron radiation population with collimation in the phase plane at the FFdoublet entrance for the nominal initial halo of Ax = (6 � 16)�x and Ay = (24� 73)�y (green),and for a larger halo with Ax = (6� 24)�x and Ay = (24� 100)�y (red).
49
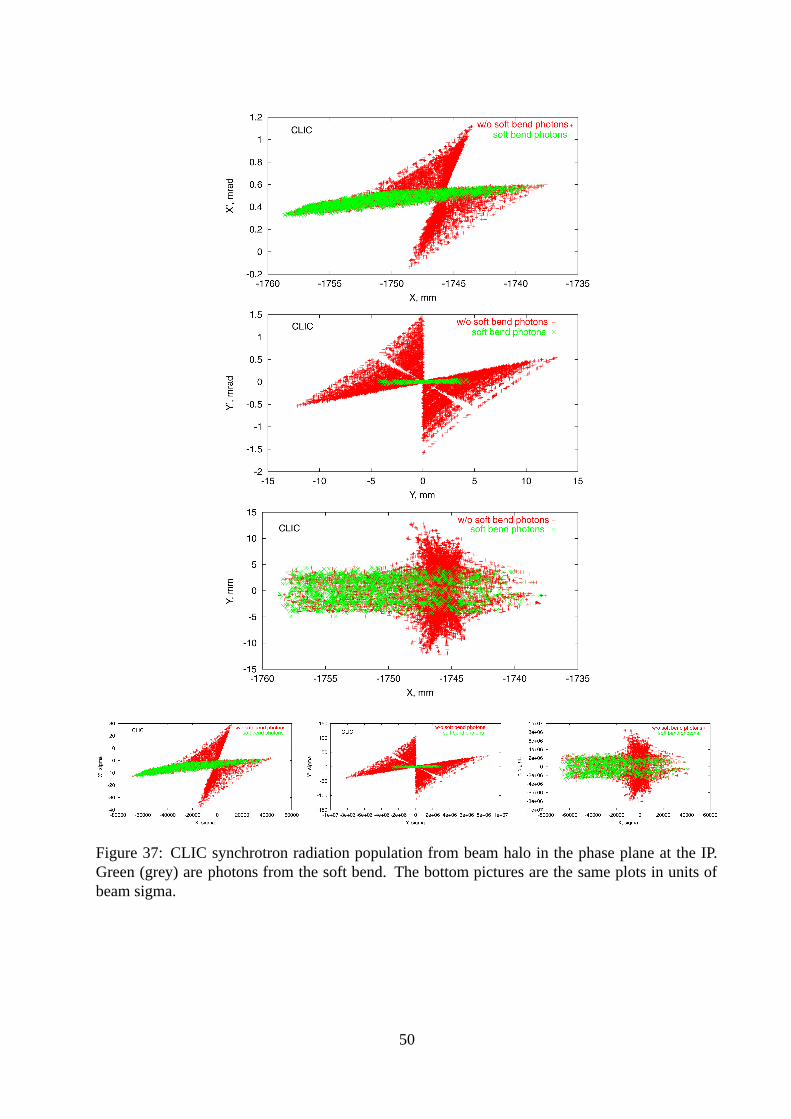
Figure 37: CLIC synchrotron radiation population from beam halo in the phase plane at the IP.Green (grey) are photons from the soft bend. The bottom pictures are the same plots in units ofbeam sigma.
50
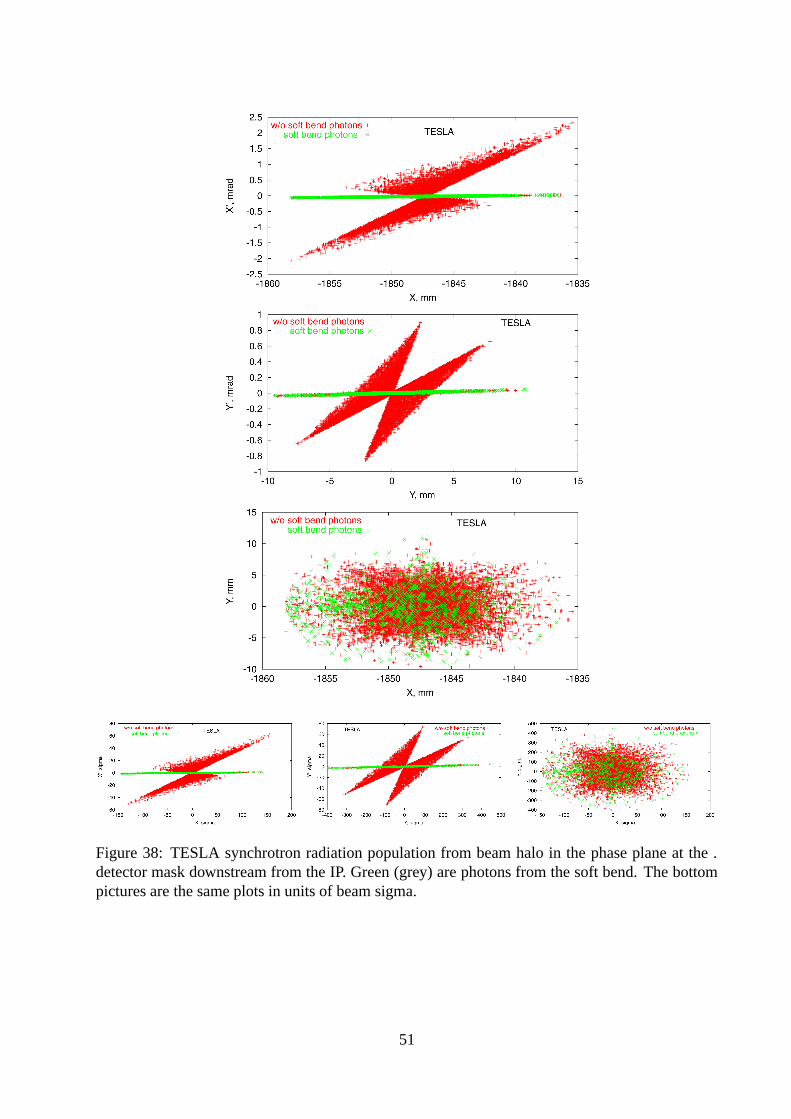
Figure 38: TESLA synchrotron radiation population from beam halo in the phase plane at the .detector mask downstream from the IP. Green (grey) are photons from the soft bend. The bottompictures are the same plots in units of beam sigma.
51

Figure 39: NLC synchrotron radiation population from beam halo in the phase plane at the .luminosity monitor downstream from the IP. Green (grey) are photons from the soft bend. Thebottom pictures are the same plots in units of beam sigma.
52
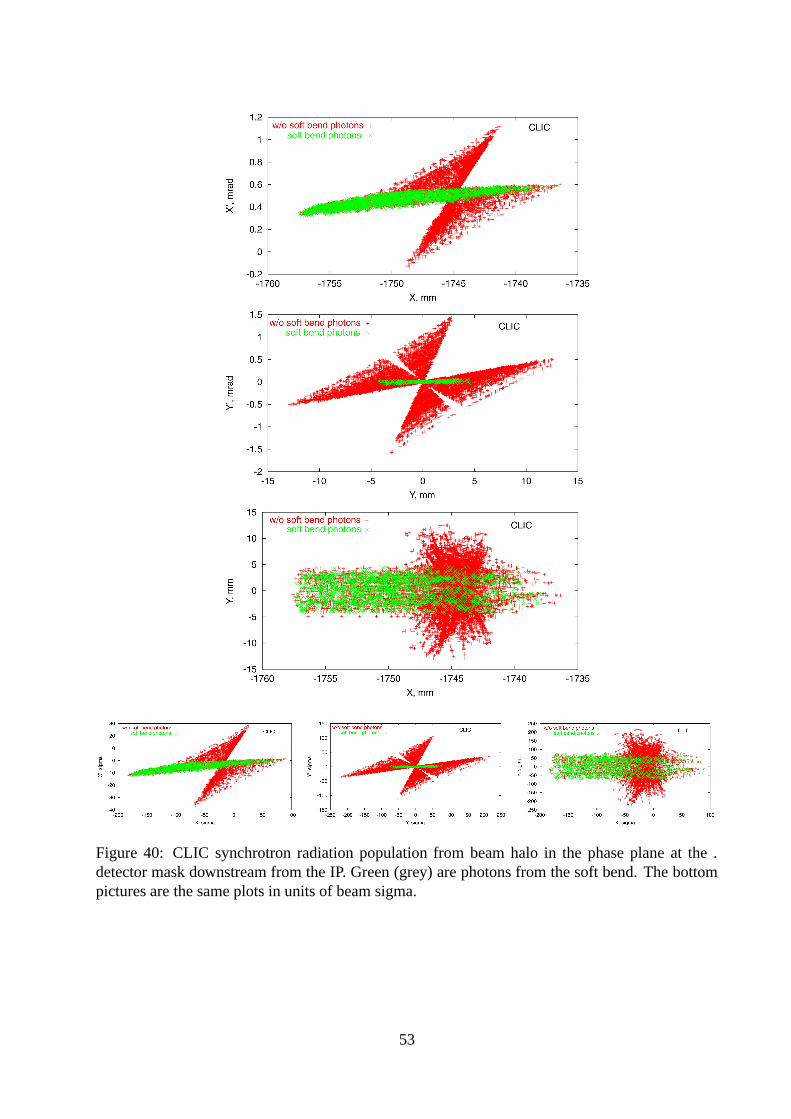
Figure 40: CLIC synchrotron radiation population from beam halo in the phase plane at the .detector mask downstream from the IP. Green (grey) are photons from the soft bend. The bottompictures are the same plots in units of beam sigma.
53