computational fluid dynamics modeling of the nasa titan
TRANSCRIPT

Computational Fluid Dynamics Modeling of
the NASA Titan Wind Tunnel (TWT)
Susan E. H. Sakimoto
Space Science Institute and Department of Geology, University at Buffalo
Devon M. Burr
Earth and Planetary Sciences Department, University of Tennessee-Knoxville
Stephen L. F. Sutton
Earth and Planetary Sciences Department, University of Tennessee-Knoxville
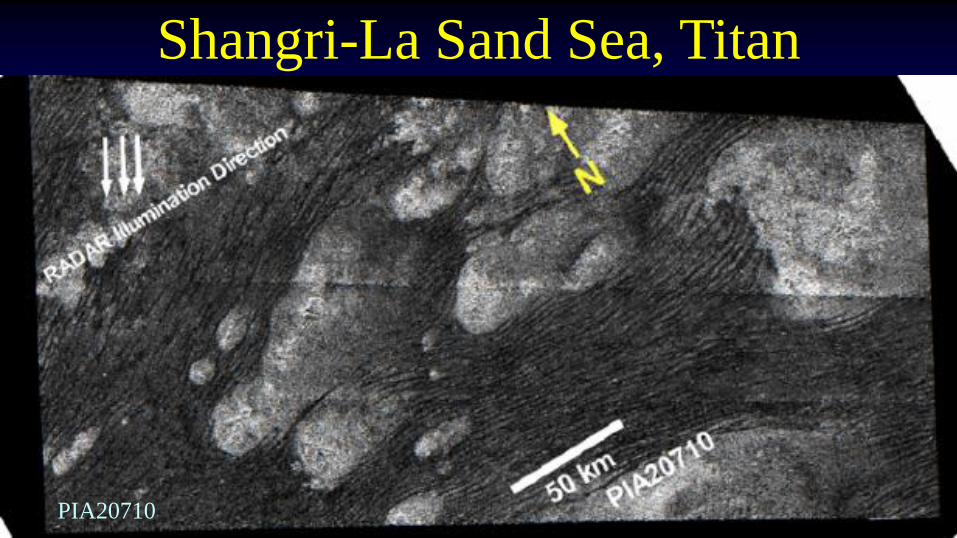
Shangri-La Sand Sea, Titan
PIA20710

Titan Saltation Thresholds• The Titan Wind Tunnel has provided data for
higher-than-predicted saltation threshold wind speeds on Titan. (Burr et al., Nature, 2015)
• This would have a significant effect on wind transport of particles
• Suggests that particle-fluid density ratio is more important for Titan regimes
• New environments reveal new processes we must consider (Burr et al. Aeolian Research 2015)

Wind Tunnel Challenges• Experimental methodology requires successive empirical fits
– Calibration runs may not match experimental runs
• Tunnel configuration changes can be problematic
– Documentation sparse, measurements sparse
• Some regimes are outside tunnel capabilities... But not COMSOL’s

The NASA Titan Wind Tunnel is a legacy instrument, with an 8 inch/ 20 cm steel test section

Titan Wind Tunnel:
Test Section Configuration Changes• Increasing instrumentation
• Multiple test bed plate changes with varying flow effects
More obstructions over time
20 cm

Flow Obstruction
Examples
• Thicker test plate• Varying roughness, connectors
• Equipment below test plate• Flexible tubing location varies
• Platform on top of test plate
• Instruments above test plate and platform
Emily Nield for scale

Flow Obstruction
• Recent question…
Does blocking the sub-
test plate flow entirely
“fix” the obstruction
problem?

We need:Better understanding of the tunnel to:
– Interpret results --> Boundary layer processes
– Detect/explore more of the processes
– Extend TWT analyses to additional parameter space
Approach:
Build a COMSOL model of the Titan
Wind Tunnel for comparison with
experimental data and use for virtual
experiments

Model Setup
• COMSOL Multiphysics
– Turbulent (k-ε) isothermal flow matched to TWT P, T, g conditions
– 2-D slice of tunnel test bed center w/ particle tracing and wall roughness
– Vary test bed shape, obstructions, roughness, particle density ratio
Example of model geometry and FEM mesh with downstream below-plate blockage

Titan Wind Tunnel CFD: Test bed effectsA: Taper end test bed (0.8 cm thickness), 5 m/s, roughness (~3μm)
B: Blunt end test bed (0.8 cm thickness), 5 m/s, , roughness (~3μm)
C: Blunt thicker test bed (1.8 cm thickness), 5 m/s, roughness (~3μm)
A
B
C

Natural log height
version…
Thicker or rougher
plates will:
• Increase
maximum flow
velocity
• Change the
boundary layer
shape
COMSOL Model Results:
Plate Variations

Titan Wind Tunnel CFD: Obstruction effects D: Taper end test bed (0.8 cm), 2 cm obstructed below
E: Taper end test bed (0.8 cm), 2 cm obstructed below + pitot tube base on top
F: Taper end test bed (0.8 cm), 3 cm obstructed below (more tubing)
D
E
F
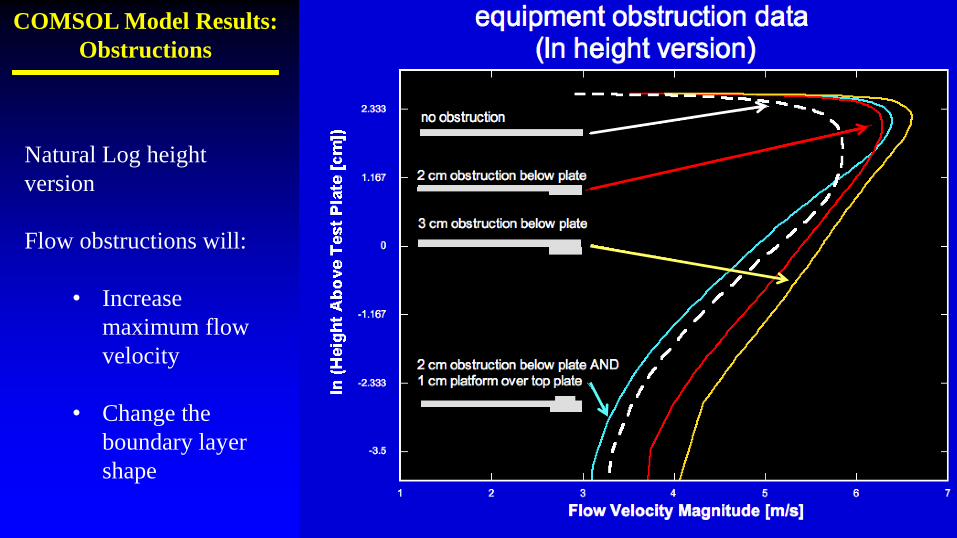
Natural Log height
version
Flow obstructions will:
• Increase
maximum flow
velocity
• Change the
boundary layer
shape
COMSOL Model Results:
Obstructions

Curvature from thick test
bed AND large roughness
COMSOL Model Results:
Summary
Lower Boundary Layer
moves left for:
-above-plate obstruction
-thicker plates (some)
-rougher plates
Lower Boundary Layer
moves right for:
-below-plate obstructions

COMSOL Model Results
and
Wind Tunnel Data
ln(height) vs.
normalized velocity space
Model and data diverge close to
the test plate (within 1 cm)
Need better obstruction model
Investigate different turbulence
and wall model effects
Unobstructed model
Small obstruction model
Wind Tunnel
data for rough
surfaces
Rough surfaces models

SCIENCE LESSONS LEARNED
FOR TITAN WIND TUNNEL INVESTIGATIONS: I
• Be certain that the configuration for the calibration runs
exactly matches the data collection runs
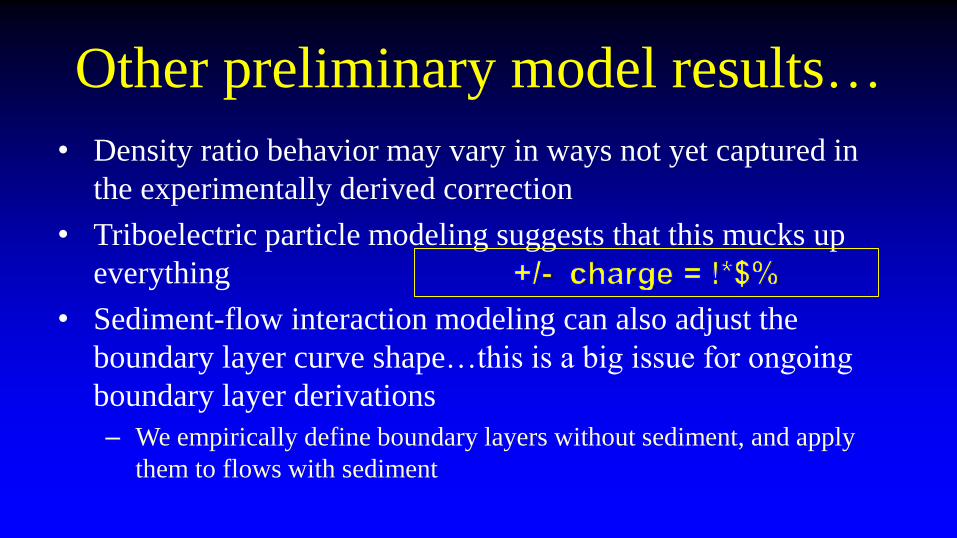
Other preliminary model results…
• Density ratio behavior may vary in ways not yet captured in
the experimentally derived correction
• Triboelectric particle modeling suggests that this mucks up
everything
• Sediment-flow interaction modeling can also adjust the
boundary layer curve shape…this is a big issue for ongoing
boundary layer derivations
– We empirically define boundary layers without sediment, and apply
them to flows with sediment
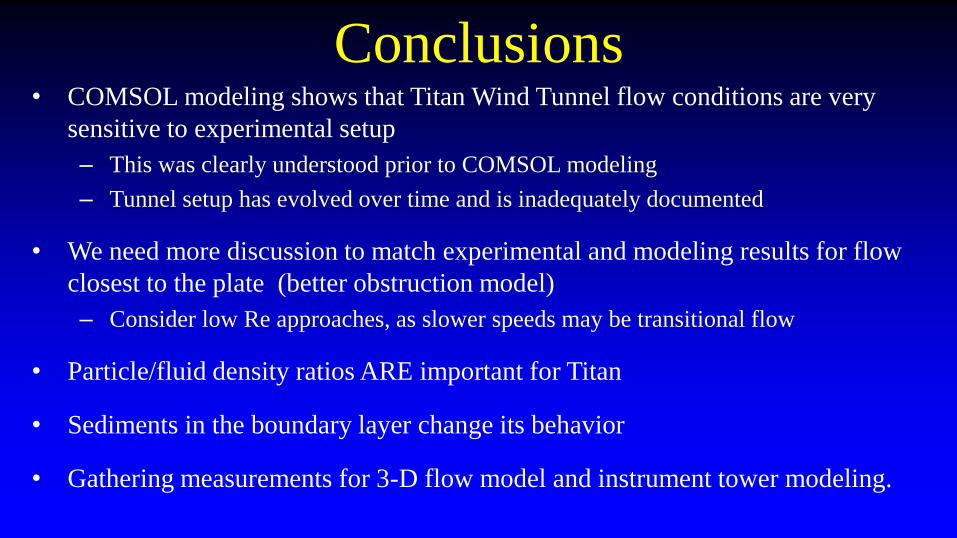
Conclusions• COMSOL modeling shows that Titan Wind Tunnel flow conditions are very
sensitive to experimental setup
– This was clearly understood prior to COMSOL modeling
– Tunnel setup has evolved over time and is inadequately documented
• We need more discussion to match experimental and modeling results for flow
closest to the plate (better obstruction model)
– Consider low Re approaches, as slower speeds may be transitional flow
• Particle/fluid density ratios ARE important for Titan
• Sediments in the boundary layer change its behavior
• Gathering measurements for 3-D flow model and instrument tower modeling.