concepts and applications of krigingmaps.uky.edu/esri-uc/esri_uc_2k12/files/142.pdfwhat is...
TRANSCRIPT

Technical Workshops |
Esri International User Conference San Diego, California
Concepts and Applications of Kriging
Konstantin Krivoruchko Eric Krause
July 24, 2012
Outline
• Intro to interpolation • Exploratory spatial data analysis (ESDA) • Using the Geostatistical Wizard • Validating interpolation results • Empirical Bayesian Kriging • Questions

What is interpolation?
• Predict values at unknown locations using values at measured locations
• Many interpolation methods: kriging, IDW, LPI, etc

What is autocorrelation?
Tobler’s first law of geography: "Everything is related to everything else, but near things are more related than distant things."
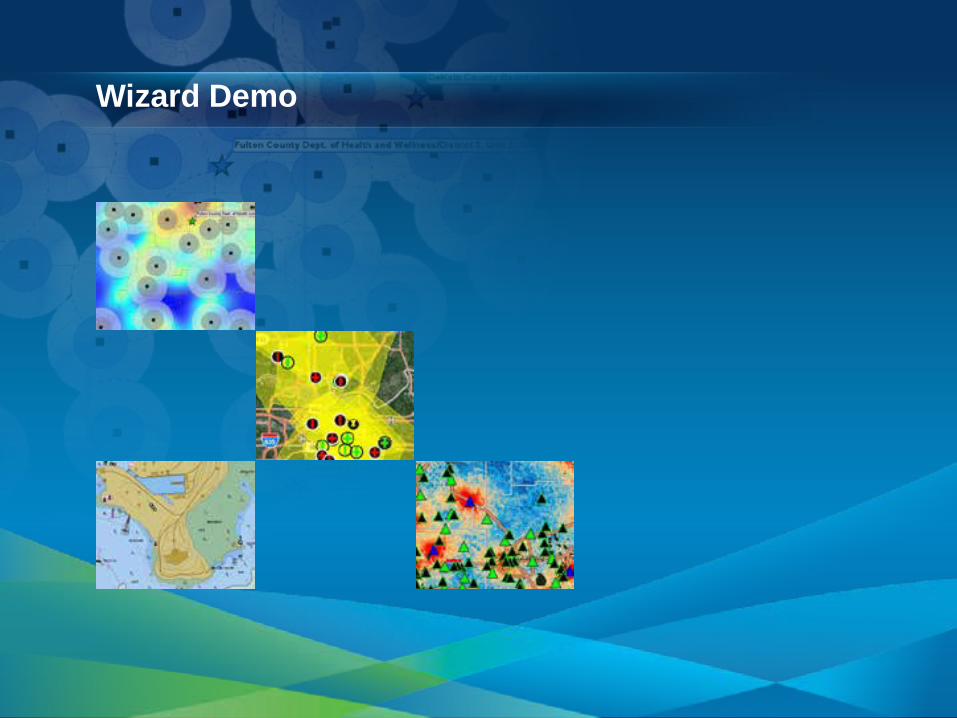
Wizard Demo
What is kriging?
• Kriging is the optimal interpolation method if the data meets certain conditions.
• What are these conditions? - Normally distributed - Stationary - No trends
• How do I check these conditions? - Exploratory Spatial Data Analysis (ESDA)
What is an “optimal” interpolator?
• Estimates the true value, on average • Lowest expected prediction error • Able to use extra information, such as covariates • Filters measurement error • Can be generalized to polygons (Areal interpolation,
Geostatistical simulations) • Estimates probability of exceeding a critical
threshold
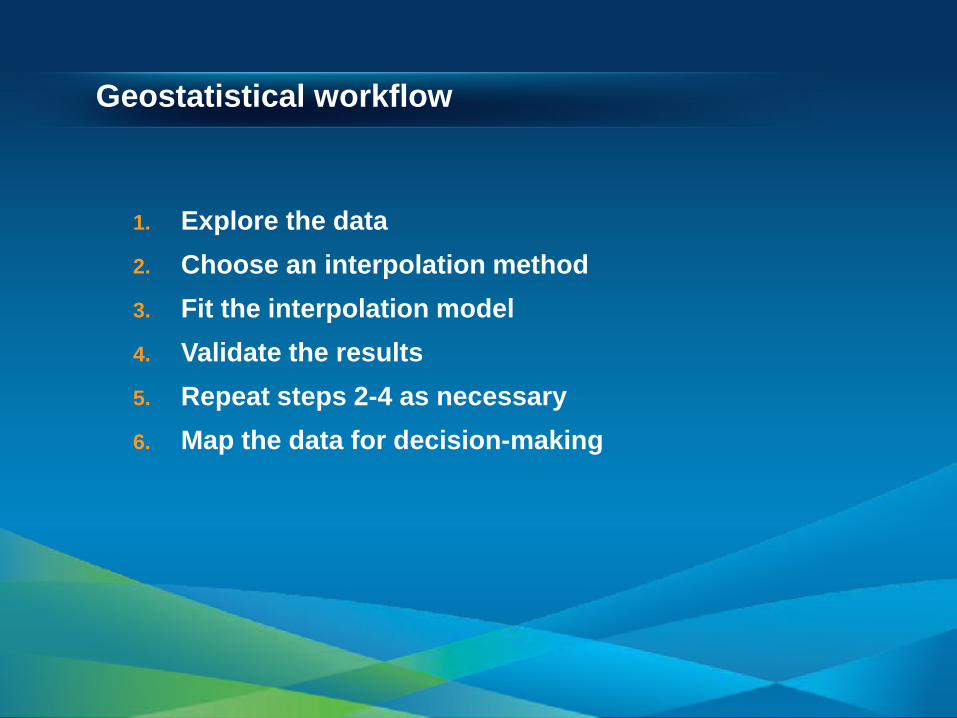
Geostatistical workflow
1. Explore the data 2. Choose an interpolation method 3. Fit the interpolation model 4. Validate the results 5. Repeat steps 2-4 as necessary 6. Map the data for decision-making
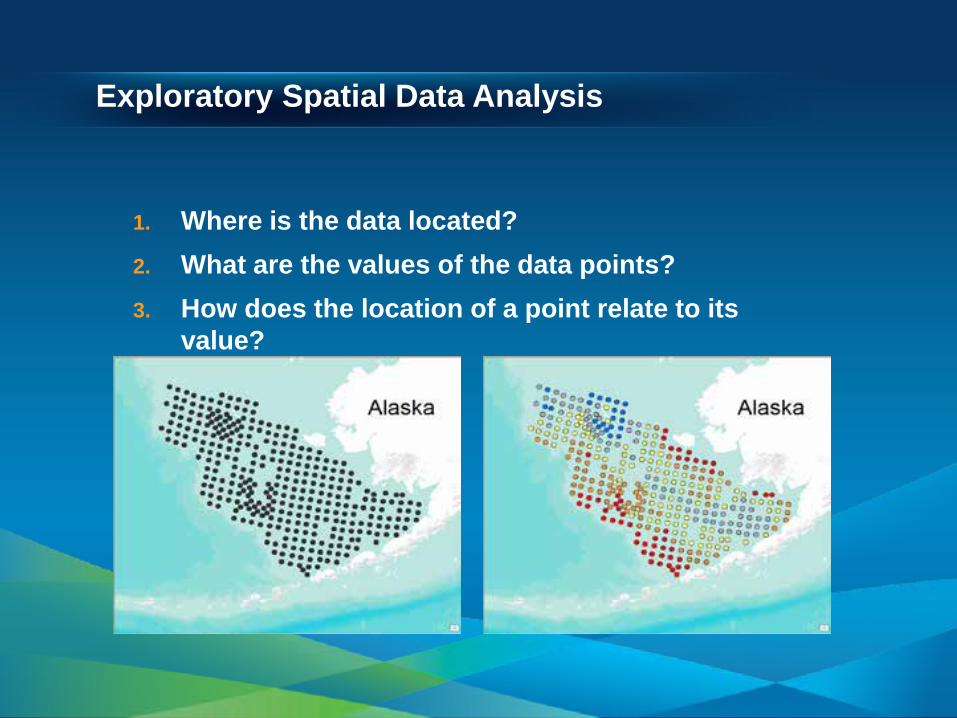
Exploratory Spatial Data Analysis
1. Where is the data located? 2. What are the values of the data points? 3. How does the location of a point relate to its
value?

Does my data follow a normal distribution?
• How do I check? 1. Histogram
- Check for bell-shaped distribution - Look for outliers
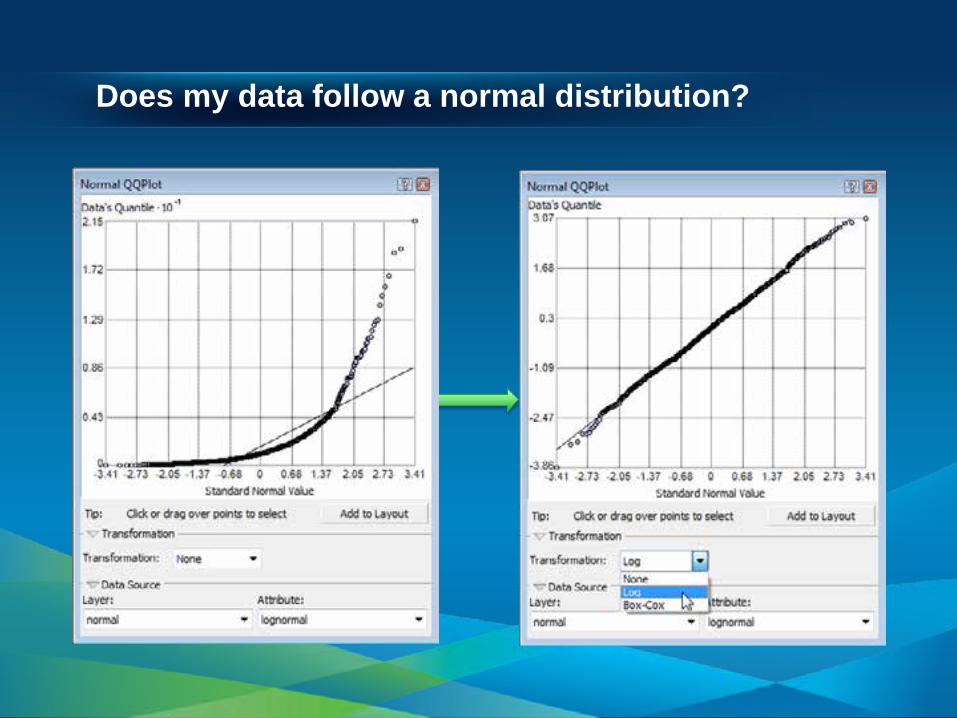
2. Normal QQPlot - Check if data follows 1:1 line
• What can I do if my data is not normally distributed? - Apply a transformation
- Log, Box Cox, Arcsin, Normal Score Transformation
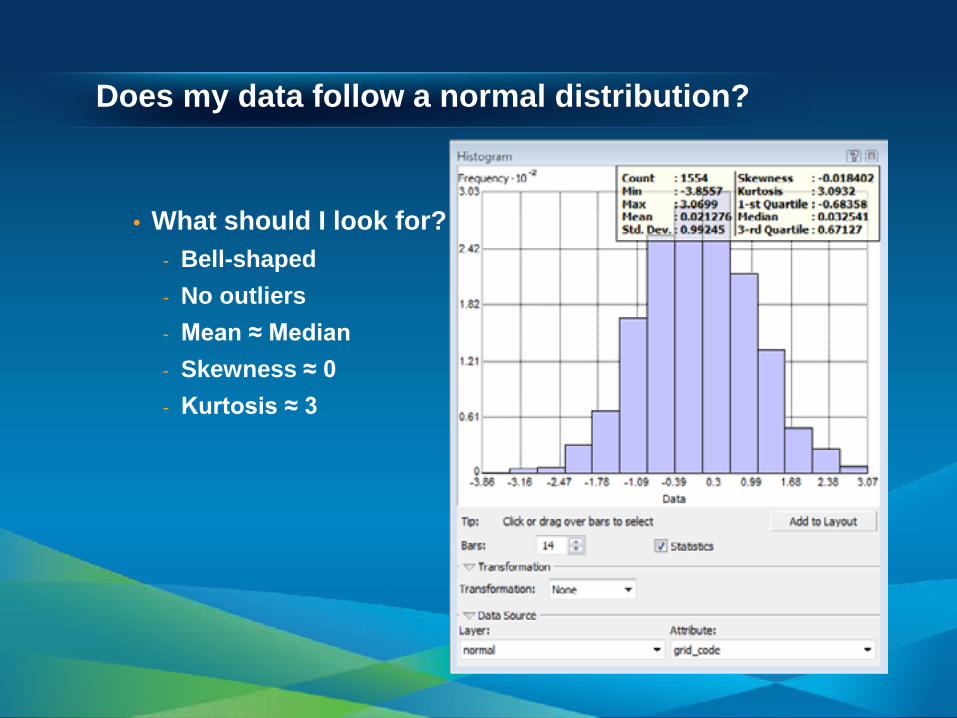
Does my data follow a normal distribution?
• What should I look for? - Bell-shaped - No outliers - Mean ≈ Median - Skewness ≈ 0 - Kurtosis ≈ 3
Does my data follow a normal distribution?
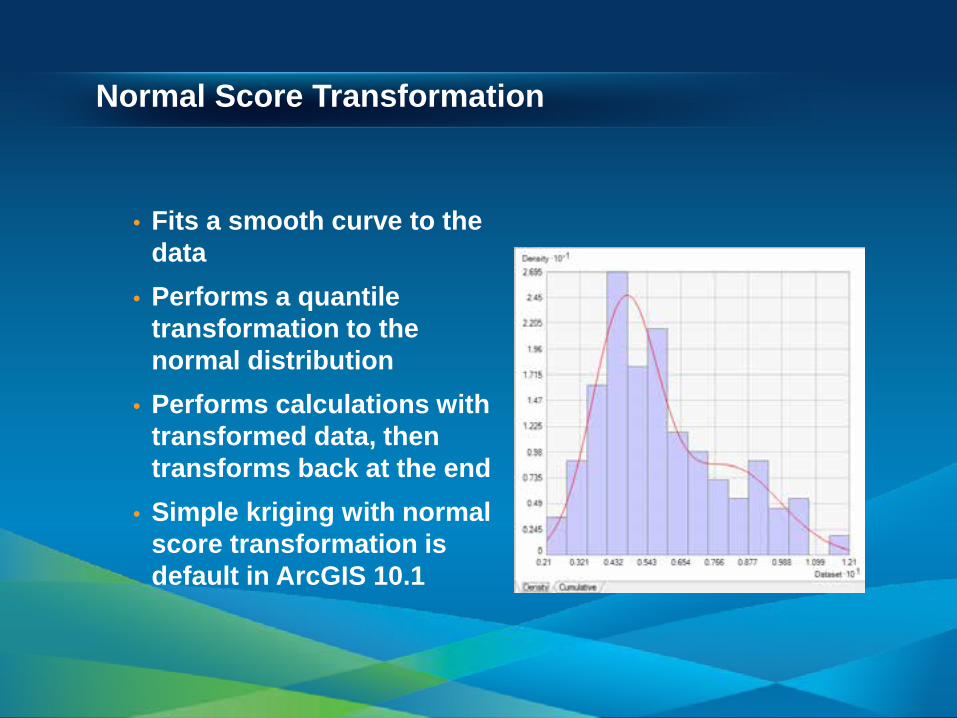
Normal Score Transformation
• Fits a smooth curve to the data
• Performs a quantile transformation to the normal distribution
• Performs calculations with transformed data, then transforms back at the end
• Simple kriging with normal score transformation is default in ArcGIS 10.1
Is my data stationary?
• What is stationarity? - The statistical relationship between two points depends
only on the distance between them. - The variance of the data is constant (after trends have
been removed)
• How do I check for stationarity? - Voronoi Map symbolized by Entropy or Standard
Deviation
• What can I do if my data is nonstationary? - Transformations can stabilize variances - Empirical Bayesian Kriging – New in ArcGIS 10.1
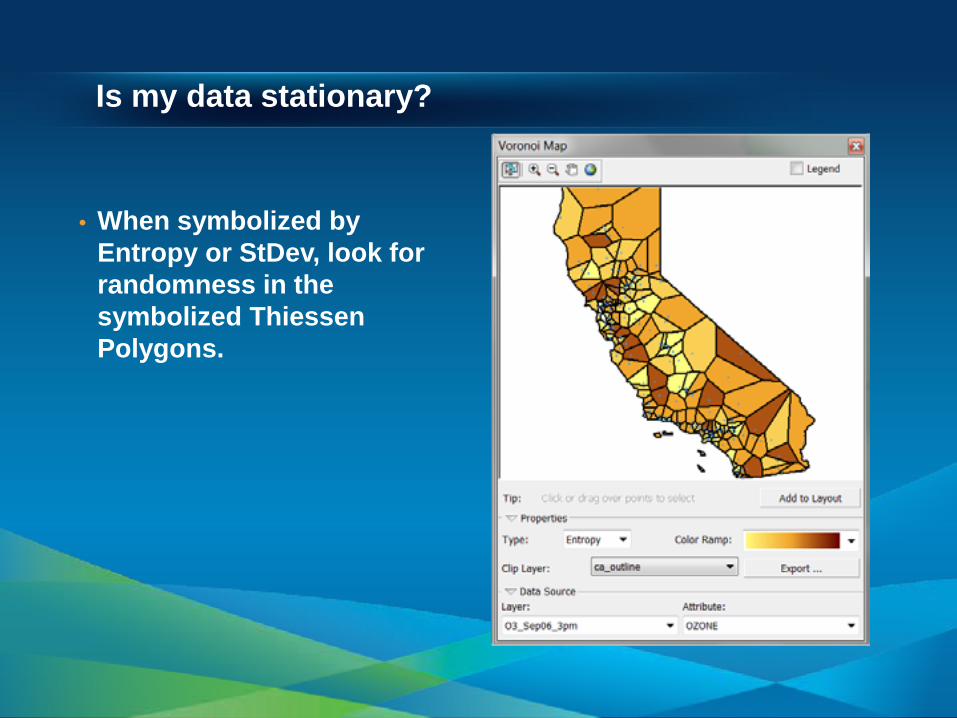
Is my data stationary?
• When symbolized by Entropy or StDev, look for randomness in the symbolized Thiessen Polygons.
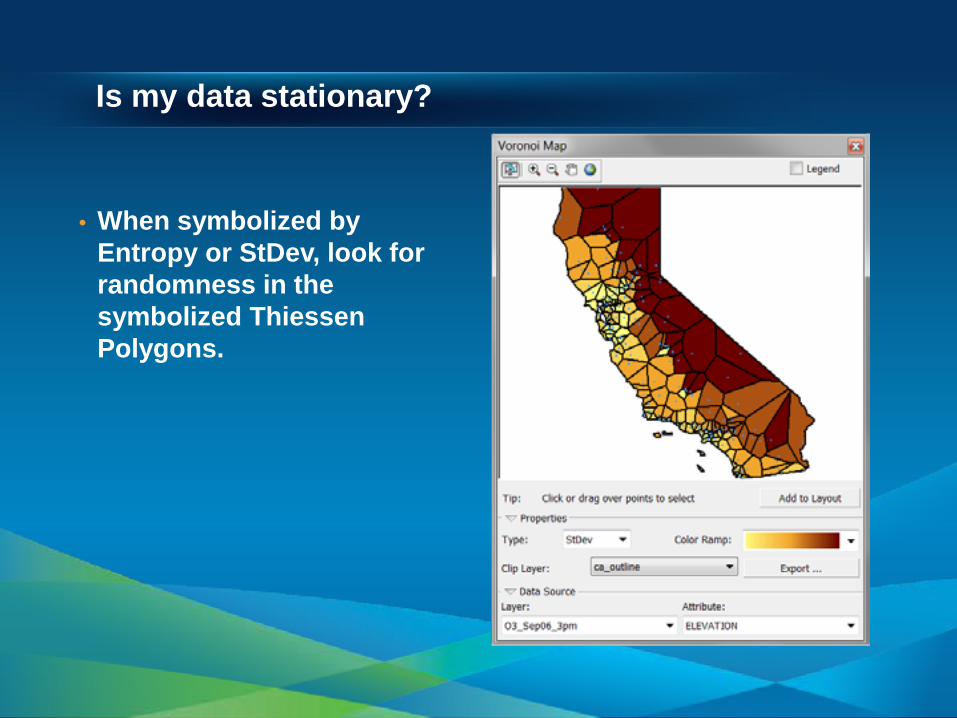
Is my data stationary?
• When symbolized by Entropy or StDev, look for randomness in the symbolized Thiessen Polygons.
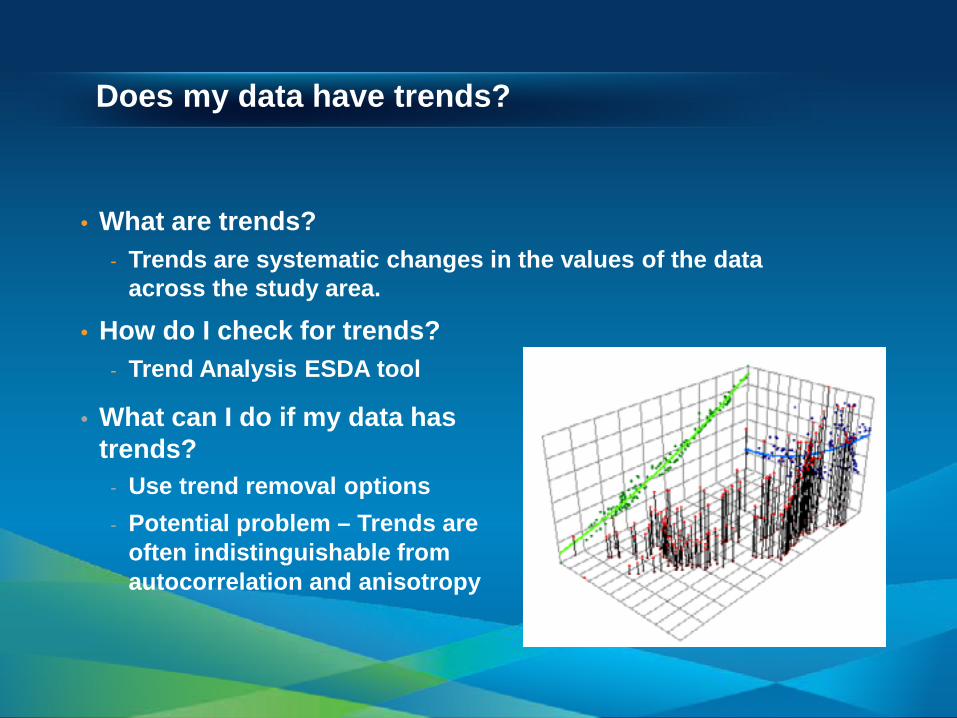
Does my data have trends?
• What are trends? - Trends are systematic changes in the values of the data
across the study area.
• How do I check for trends? - Trend Analysis ESDA tool
• What can I do if my data has trends?
- Use trend removal options - Potential problem – Trends are
often indistinguishable from autocorrelation and anisotropy

ESDA Demo

Semivariogram/Covariance Modeling
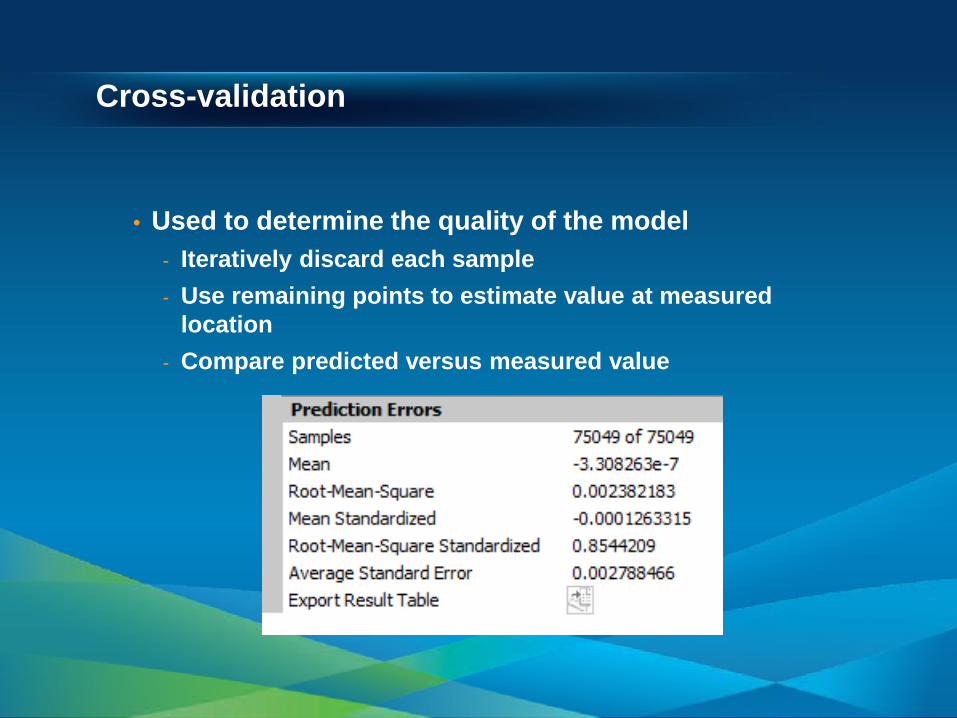
Cross-validation
• Used to determine the quality of the model - Iteratively discard each sample - Use remaining points to estimate value at measured
location - Compare predicted versus measured value

Prediction Error of Predictions Probability Quantile
Kriging output surface types

Kriging Demo
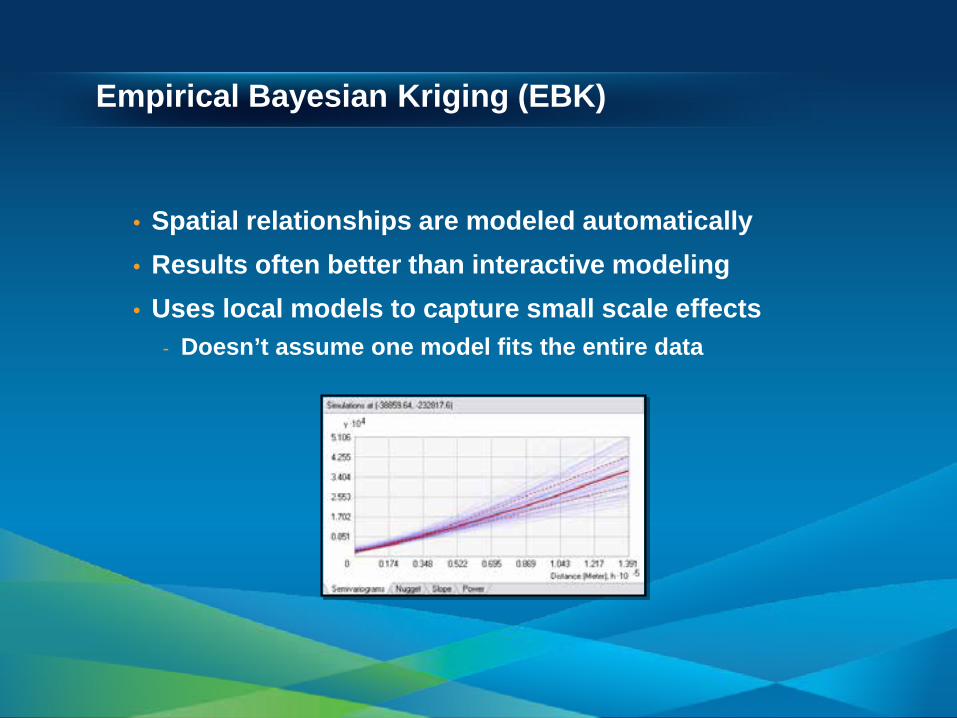
Empirical Bayesian Kriging (EBK)
• Spatial relationships are modeled automatically • Results often better than interactive modeling • Uses local models to capture small scale effects
- Doesn’t assume one model fits the entire data

How does EBK work?
1. Divide the data into subsets of a given size - Controlled by “Subset Size” parameter - Subsets can overlap, controlled by “Overlap Factor”
2. For each subset, estimate the semivariogram 3. Simulate data at input point locations and estimate
new semivariogram 4. Repeat step 3 many times. This results in a
distribution of semivariograms - Controlled by “Number of Simulations”
5. Mix the local surfaces together to get the final surface.
Empirical Bayesian Kriging
• Advantages - Requires minimal interactive modeling - Standard errors of prediction are more accurate than
other kriging methods - More accurate than other kriging methods for small or
nonstationary datasets
• Disadvantages - Processing is slower than other kriging methods - Limited customization
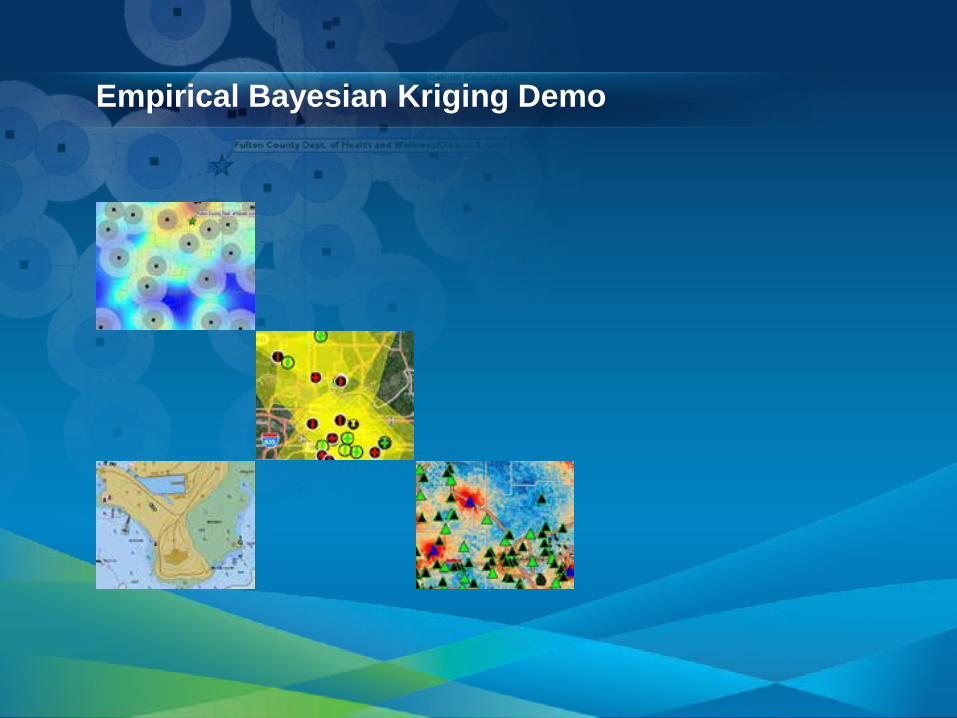
Empirical Bayesian Kriging Demo

Available in the bookstore and from Esri Press

resources.arcgis.com


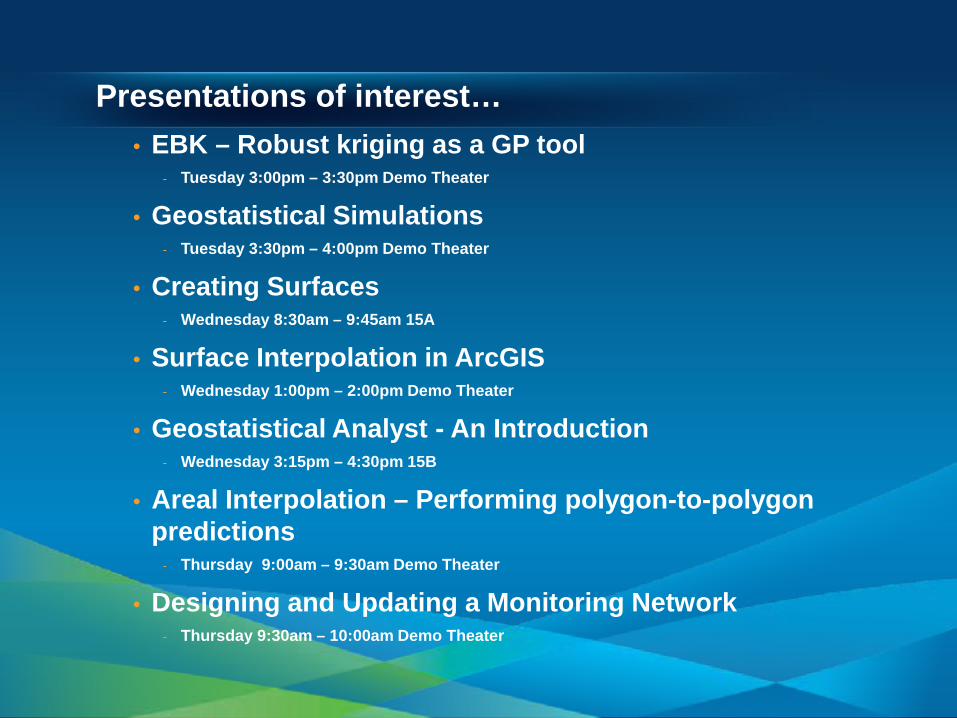
Presentations of interest… • EBK – Robust kriging as a GP tool
- Tuesday 3:00pm – 3:30pm Demo Theater
• Geostatistical Simulations - Tuesday 3:30pm – 4:00pm Demo Theater
• Creating Surfaces - Wednesday 8:30am – 9:45am 15A
• Surface Interpolation in ArcGIS - Wednesday 1:00pm – 2:00pm Demo Theater
• Geostatistical Analyst - An Introduction - Wednesday 3:15pm – 4:30pm 15B
• Areal Interpolation – Performing polygon-to-polygon predictions
- Thursday 9:00am – 9:30am Demo Theater
• Designing and Updating a Monitoring Network - Thursday 9:30am – 10:00am Demo Theater

• Thank you for attending
• Have fun at UC2012
• Open for Questions
• Please fill out the evaluation:
www.esri.com/ucsessionsurveys
Offering ID: 642