course : ecs 204 basic electrical engineering lab v2.pdf · experiment: 05 rc circuit and resonant...
TRANSCRIPT

Sirindhorn International Institute of Technology
Thammasat University at Rangsit
School of Information, Computer and Communication Technology
___________________________________________________________________________
COURSE : ECS 204 Basic Electrical Engineering Lab
INSTRUCTOR : Asst. Prof. Dr. Prapun Suksompong ([email protected])
WEB SITE : http://www2.siit.tu.ac.th/prapun/ecs204/
EXPERIMENT : 05 RC Circuit and Resonant RLC Circuit
___________________________________________________________________________
I. OBJECTIVES
1. To investigate RC circuit with voltage step input.
2. To determine the resonant frequency and frequency response of a series RLC circuit.
II. BASIC INFORMATION
II.1 RC Circuit with Voltage Step Input
1. An RC circuit with voltage step input is shown in Figure 5-1-1. From KCL, we have
0out in
out
v t v tdC v t
dt R
.
If the input voltage inv t is fixed at a particular value VS from time 1t to 2t , then the
output voltage outv t during this time interval is given by
1
1
t t
out S out Sv t V v t V e
, 1 2t t t , (1)
where 1outv t is the initial output voltage (for this interval which starts at time t1) and
RC is the time constant.
In Part A of this experiment, the input voltage inv t is a square-wave; inv t will be 0
or 4 V.

2
2. For simplicity, assume 1 0t . Then, the output voltage is given by
0
t
out S out Sv t V v V e
.
Now, further assume that 0 0outv . Then
1
t t
out S S Sv t V V e V e
.
Therefore, the voltage across the capacitor increases from 0 to VS and we say that the
capacitor is charging. Note that in one time constant (t = ), the capacitor is charged to
approximately 11 0.63S SV e V , i.e. the voltage across the capacitor becomes
approximately 63 percent of VS.
Voltage
time
Charging
periodDischarging
period
pulse input voltage
voltage across capacitor
R
vin(t)C
+
-
vout(t) vout(t)
vin(t)VS
Figure 5-1-1: Pulse input voltage and the voltage across a capacitor.
3. When the input voltage inv t is fixed at 0 from time 1t to 2t , the solution (1) above
gives
1 1
1 10 0
t t t t
out out outv t v t e v t e
, 1 2t t t ,
For simplicity, assume that 1 0t and that the initial output voltage 1 0outv t V . Then,
0
t
outv t V e
.

3
Therefore, the voltage across the capacitor decreases from V0 to 0 and we say that the
capacitor is discharging. In one time constant (t = ), the capacitor is discharged to
approximately 00 00.37
VV e V
e
, or 37 % of the initial voltage V0.
4. Half Life. The half life halft is the time t that is needed for the output voltage of a
discharging capacitor to decrease from V0 to V0/2. At such time,
00
2
tV
V e
.
Solving for t in the above equation gives
ln 2halft .
5. In part A of this experiment, the value of are found using three different methods (see
Figure 5-1-2):
1) Measure 0.37t . Then,
0.37t .
2) Measure halft . Then, calculate
half ln 2t .
3) Measure R and C. Then, calculate RC .
Figure 5-1-2: measurement.
04 V
02 2V
01.47 V e
halft 0.37t
4
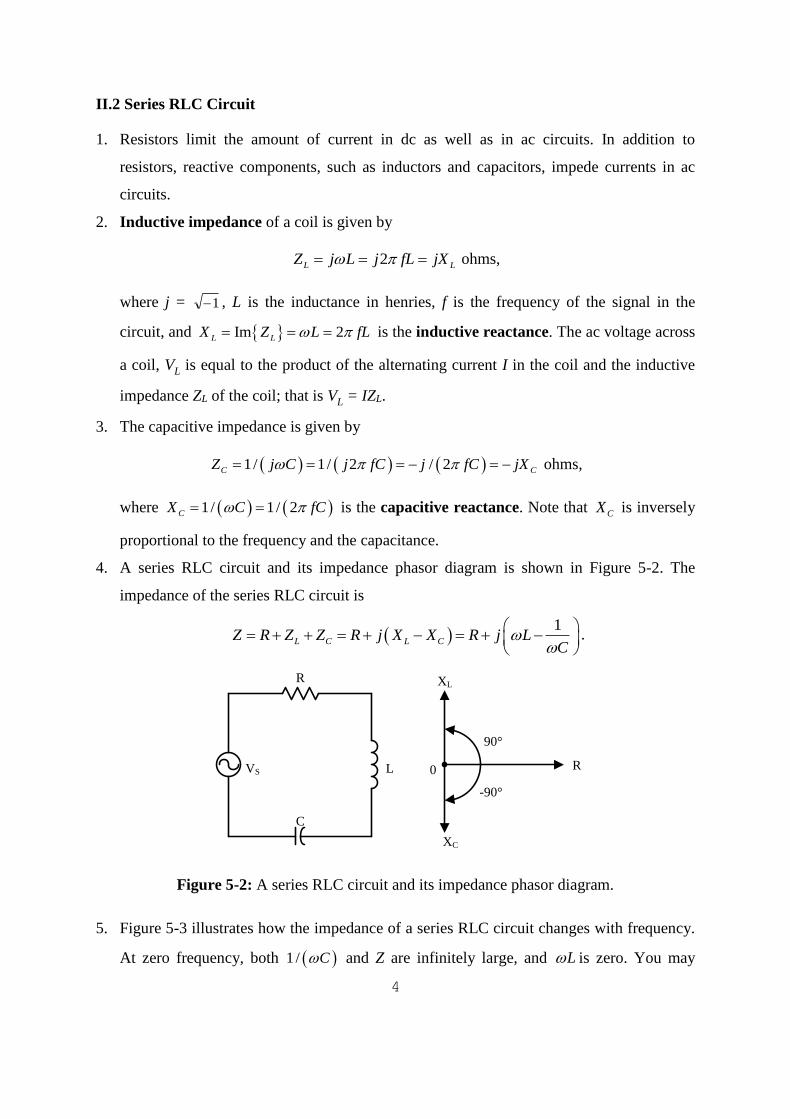
II.2 Series RLC Circuit
1. Resistors limit the amount of current in dc as well as in ac circuits. In addition to
resistors, reactive components, such as inductors and capacitors, impede currents in ac
circuits.
2. Inductive impedance of a coil is given by
2L LZ j L j fL jX ohms,
where j = 1 , L is the inductance in henries, f is the frequency of the signal in the
circuit, and Im 2L LX Z L fL is the inductive reactance. The ac voltage across
a coil, VL is equal to the product of the alternating current I in the coil and the inductive
impedance ZL of the coil; that is VL = IZL.
3. The capacitive impedance is given by
1/ 1/ 2 / 2C CZ j C j fC j fC jX ohms,
where 1/ 1/ 2CX C fC is the capacitive reactance. Note that CX is inversely
proportional to the frequency and the capacitance.
4. A series RLC circuit and its impedance phasor diagram is shown in Figure 5-2. The
impedance of the series RLC circuit is
1
L C L CZ R Z Z R j X X R j LC
.
R
VS L
C
XL
R
XC
0
-90°
90°
Figure 5-2: A series RLC circuit and its impedance phasor diagram.
5. Figure 5-3 illustrates how the impedance of a series RLC circuit changes with frequency.
At zero frequency, both 1/ C and Z are infinitely large, and L is zero. You may

5
recall that at 0 Hz, the capacitor acts like an open circuit, while the inductor acts like a
short circuit.
As the frequency increases, 1/ C decreases, and L increases. At the frequencies
below the resonant frequency fo, 1/L C , the circuit, whose reactance ImX Z
is negative, is said to be capacitive. At the resonant frequency f0, 1/L C , so the
circuit is purely resistive and Z = R. At the frequencies above f0, 1/L C , and the
circuit, whose reactance ImX Z is now positive, is said to be inductive. The
minimum magnitude of the impedance occurs at a resonant frequency f0 where XL = XC,
but increases in value when the frequency is above or below the resonant point.
XC
XL
ffo
Z = R0
Z()
Z
Figure 5-3: Impedance magnitude of a series RLC circuit as a function of frequency.
6. For the series RLC circuit shown in Figure 5-2, the phasor current through all the circuit
elements is given by
1S SV V
IZ
R j LC
.
The phasor voltages across the resistor, capacitor, and inductor can then be found via
RV IR , C CV IZ , and L LV IZ ,
respectively. Their magnitudes are shown in Figure 5-4-1.

6
7. Figure 5-4-2 shows the plot of RV . Three significant points have been marked on the
curve. These are f0, the resonant frequency, and f1 and f2. For series RLC circuits, the
RV is maximum at 0f . Note that
2
2 1
S
R
V RV I R
R LC
,
where 2 f .
Figure 5-4-1: Voltage values across the resistor RV , the capacitor CV , and the inductor
LV in a series RLC circuit.
f f0 f2f1
0V
0 2V
RV
Figure 5-4-2: Frequency response of a series RLC circuit.
The frequency f (or equivalently, the angular frequency ) that maximizes RV must
be the one that minimizes 2
1/L C . Because 2
1/L C is nonnegative, if
f0 f
𝑉𝑅
𝑉𝐶 𝑉𝐿

7
we can make the squared term zero then we will get the minimum of its value which in
turn will maximize RV . Therefore, the maximum value of RV occurs at such that
1L
C
,
which gives
0
1
LC and 0
1 1
2f
LC .
Points 1f and
2f are located at 1/ 2 , which is approximately 70.7%, of the
maximum (at f0) on the curve. They are called the half power points, and the (angular)
frequency separation between them is called the bandwidth (BW) of the circuit. For the
series RLC circuit under consideration,
2 1 2 12R
BW f fL
.
Remarks:
(1) In general, the maximum values for LV and CV will NOT occur at resonant
frequency. (See Figure 5-4-1.)
(2) At the resonant frequency, the voltages |VL| and |VC| across L and C, respectively, are
equal.
8. For a circuit intended to be frequency selective, the sharpness of the selectivity is a
measure of the circuit quality. The quality of the frequency response is described
quantitatively in terms of the ratio of the resonance frequency to the bandwidth. This ratio
is called the quality factor (Q) of the circuit. Therefore,
0 1 LQ
BW R C
.
III. MATERIALS REQUIRED
- Function generator, multi-meter, and oscilloscope.
- Resistor: 100 , 1 k.
- Inductor: 5 mH.
- Capacitors: 0.01 F, 0.47 F, and 0.1 F.

8
IV. EXPERIMENTS
Part A: RC Circuit with Square-Wave Input
4Vp-p
square
wave
+
1k
0.1 F
Oscilloscope
Ch-1 Ch-2
Figure 5-5: RC Circuit with Voltage Square-Wave Input
1. Connect the circuit of Figure 5-5, where the oscilloscope is in DC mode. Note that
Channel 1 is connected to the input voltage while Channel 2 is connected to the output
voltage.
2. Set the output of the function generator to be a square wave with amplitude of 4 Vp-p (2
VAC on DMM with true-rms) and frequency of 500 Hz. Then (use the DMM to) set the
DC offset level to 2 V. (On the oscilloscope display, the square-wave will now has its
lower peak at 0 V and its higher peak at 4 V.)
3. Adjust volts/div and time/div until a couple periods of the two waveforms can be seen on
the oscilloscope. Then, draw the voltage waveforms across the function generator (shown
by dash line in Figure 5-1), and across the capacitor (shown by solid line) in Table 5-1.
4. Consider the time interval where the capacitor is discharging. Find the time constant by
measuring the time t0.37 which is the amount of time that is needed for the voltage across
the capacitor to drop from its maximum value to 1/ 0.37e times the maximum value
as shown in Figure 5-1-2. Put the value of t0.37 in Table 5-2.
5. Measure the half life thalf during which the voltage across the capacitor drops to half of
the maximum value.
6. Calculate by ln 2
halft and record the value in Table 5-2.
7. Calculate the product of R and C, and record the value in Table 5-2.
9
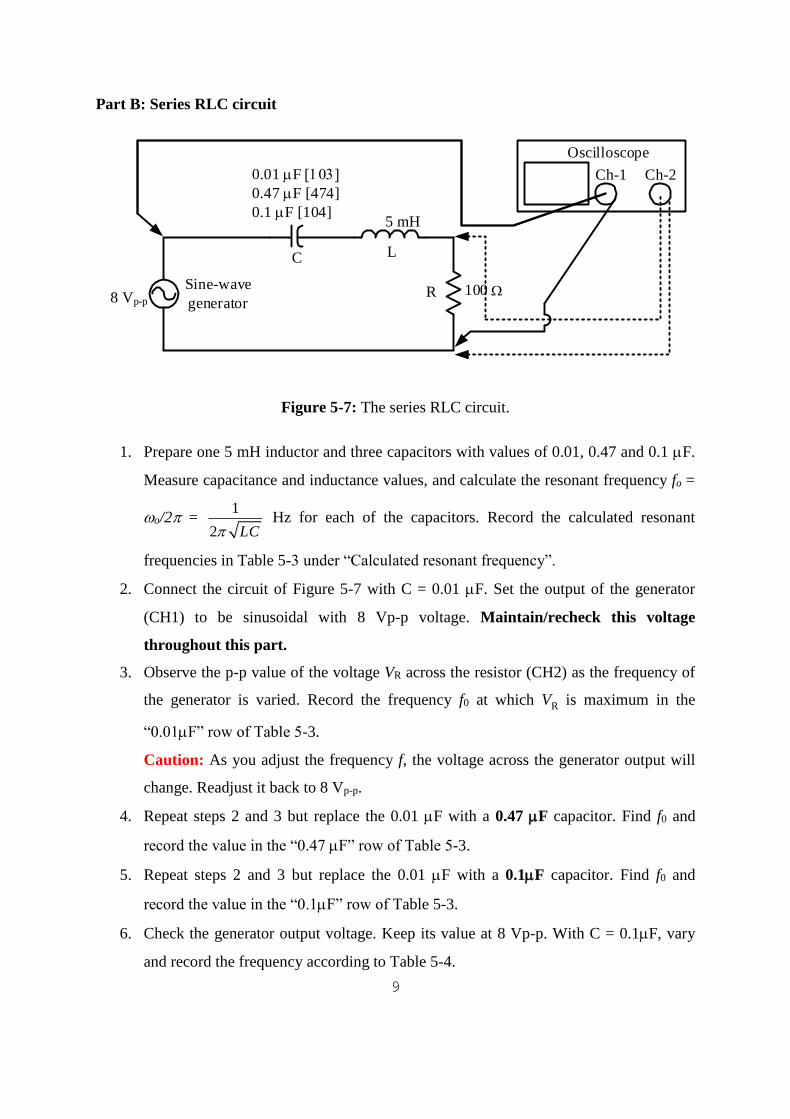
Part B: Series RLC circuit
RSine-wave
generator
LC
8 Vp-p
5 mH
0.01 F [103]
0.47 F [474]
0.1 F [104]
Oscilloscope
Ch-1 Ch-2
100
Figure 5-7: The series RLC circuit.
1. Prepare one 5 mH inductor and three capacitors with values of 0.01, 0.47 and 0.1 F.
Measure capacitance and inductance values, and calculate the resonant frequency fo =
o/2 = 1
2 LC Hz for each of the capacitors. Record the calculated resonant
frequencies in Table 5-3 under “Calculated resonant frequency”.
2. Connect the circuit of Figure 5-7 with C = 0.01 F. Set the output of the generator
(CH1) to be sinusoidal with 8 Vp-p voltage. Maintain/recheck this voltage
throughout this part.
3. Observe the p-p value of the voltage VR across the resistor (CH2) as the frequency of
the generator is varied. Record the frequency f0 at which VR is maximum in the
“0.01F” row of Table 5-3.
Caution: As you adjust the frequency f, the voltage across the generator output will
change. Readjust it back to 8 Vp-p.
4. Repeat steps 2 and 3 but replace the 0.01 F with a 0.47 F capacitor. Find f0 and
record the value in the “0.47 F” row of Table 5-3.
5. Repeat steps 2 and 3 but replace the 0.01 F with a 0.1F capacitor. Find f0 and
record the value in the “0.1F” row of Table 5-3.
6. Check the generator output voltage. Keep its value at 8 Vp-p. With C = 0.1F, vary
and record the frequency according to Table 5-4.
10
(The value of f0 should be the same as what you got from the previous step.)
Record the corresponding p-p values of the voltage VG across the generator, voltage
VR across the resistor, the voltage VL across the inductor, and the voltage VC across
the capacitor in Table 5-4.
Hint: Some values will require application of the differential measurement technique
on the scope.
11
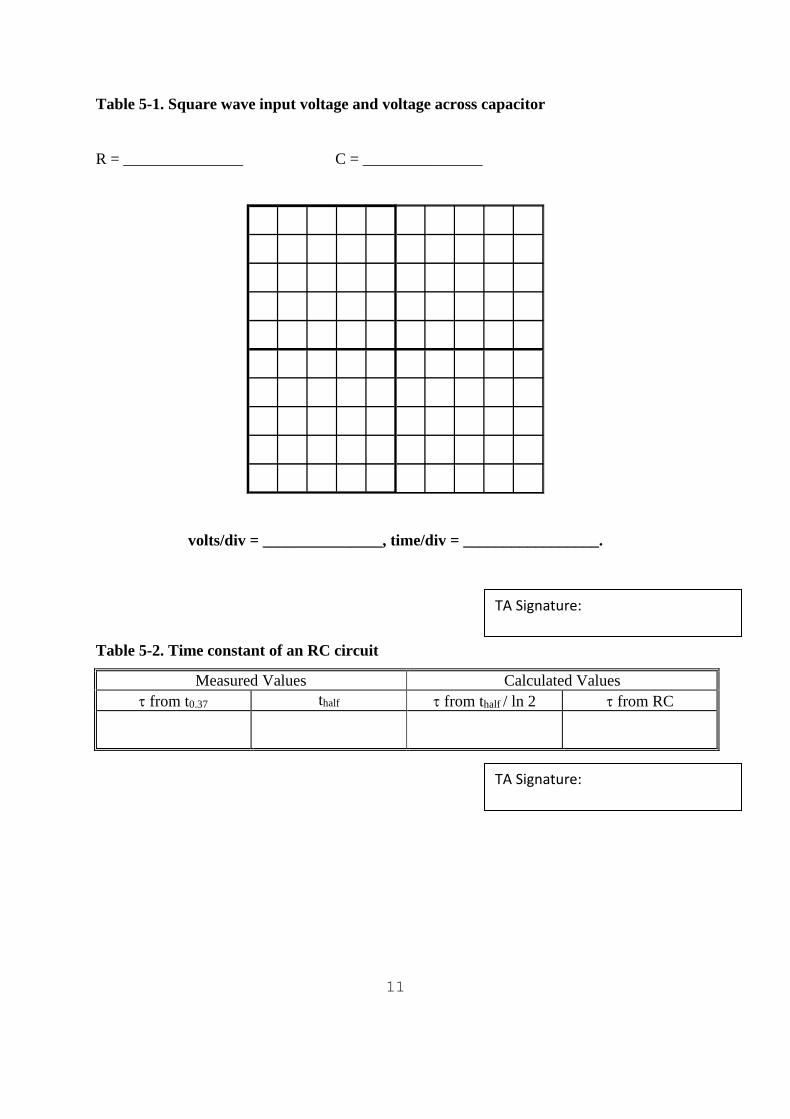
Table 5-1. Square wave input voltage and voltage across capacitor
R = _______________ C = _______________
volts/div = _______________, time/div = _________________.
Table 5-2. Time constant of an RC circuit
Measured Values Calculated Values
from t0.37 thalf from thalf / ln 2 from RC
TA Signature:
________________________
TA Signature:
________________________

12
Table 5-3. Resonant frequency of a series RLC circuit
Measured
Inductance L [mH]
Measured
Capacitance C [F]
Resonant Frequency f0, Hz
Calculated Measured
5 0.01
5 Same as above 0.47
5 Same as above 0.1
Table 5-4. Frequency response of a series RLC circuit
Frequency
deviation f [Hz] VG [Vp-p] VR [Vp-p] VL [Vp-p] VC [Vp-p]
f0 – 1000
f0 – 500
f0 – 200
f0 – 100
f0
f0 + 100
f0 + 200
f0 + 500
f0 + 1000
TA Signature:
________________________
TA Signature:
________________________

13
QUESTIONS
True or False
1. _______ In a circuit containing impedance, the current and voltage are 90 degrees out of
phase.
2. _______ The value of reactance in a series RLC circuit can exceed the magnitude of
impedance.
3. _______ The value of resistance in a series RLC circuit can exceed the magnitude of
impedance.
4. _______ In a series RLC circuit, the capacitor rms voltage can be greater than the source
rms voltage.
5. _______ A series RLC circuit operating above its resonant frequency is inductive.
6. _______ There is only one combination of L and C for each resonant frequency.
Fill in the blanks.
7. The series RLC circuit in Figure 5-2 has an inductance of 100 H, a capacitance of 200
pF, and a resistance of 10 . Determine its resonant frequency and bandwidth. Also
determine XC, X
L, I
L, and V
L at 1.0 MHz if the source voltage VS = 1.0 Vp.
Resonant frequency = _______________
Bandwidth = _________________
At 1.0 MHz
XC = ______________
XL = ______________
IL = ______________
VL = ______________
8. The series RLC circuit in Figure 5-2 has a capacitance of 25 F, and a resistance of 10 .
We then adjust the inductance until VR is maximum. Determine VR, VL, and V
C at =
2000 rad/sec if the source voltage VS = 50 Vp.
VR = ______________
VL = ______________
VC = ______________
14
Short Answers
9. Suppose you set the voltage across the output of the signal generator at 2Vrms. You then
connect the generator output across a 100Ω resistor. Now, you measure the voltage across
the generator again but you get a value which is significantly less than 2Vrms. Why?
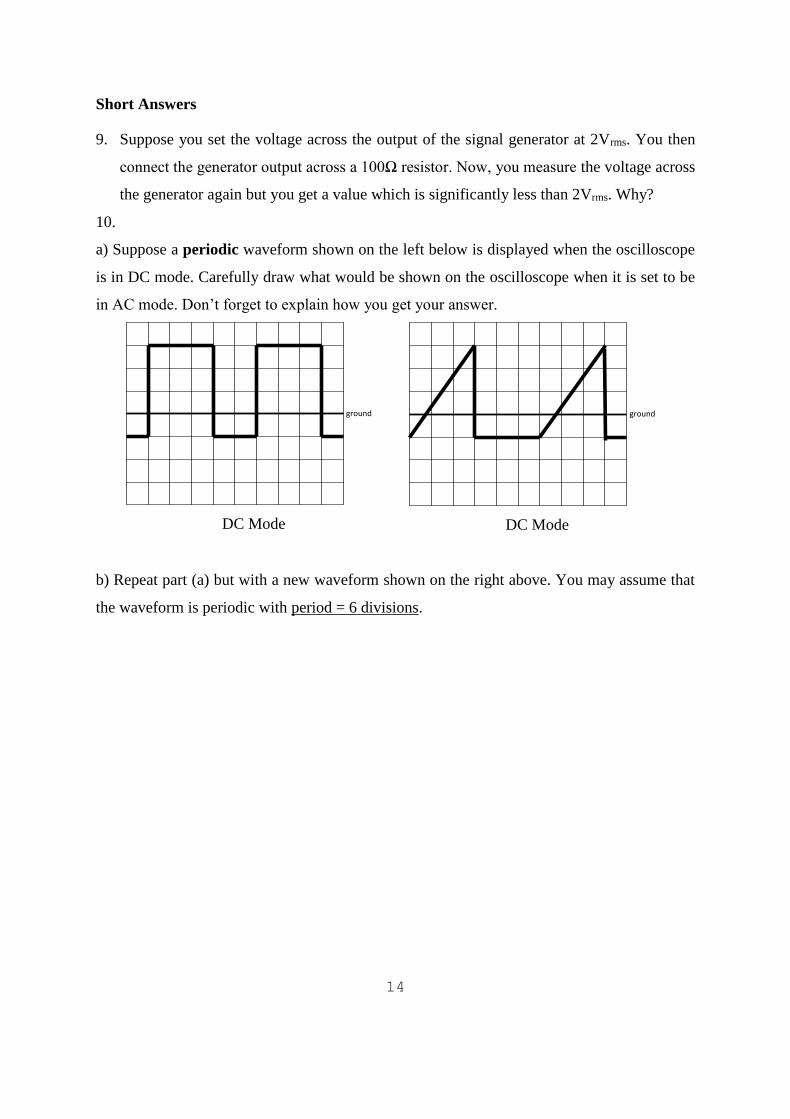
10.
a) Suppose a periodic waveform shown on the left below is displayed when the oscilloscope
is in DC mode. Carefully draw what would be shown on the oscilloscope when it is set to be
in AC mode. Don’t forget to explain how you get your answer.
DC Mode
DC Mode
b) Repeat part (a) but with a new waveform shown on the right above. You may assume that
the waveform is periodic with period = 6 divisions.
ground
ground