coversheet information for submission - florianópolis · coversheet information for submission ......
TRANSCRIPT

1
Coversheet Information for Submission (send your full paper and coversheet to [email protected])
Full Paper for the XXVIII IASP World Conference on Science and
Technology Parks, 2011
Title of the Paper: Measuring the success of science parks: performance monitoring and evaluation
Session for which the Steering Committee has provisionally allocated the abstract
People and competences: 1b – Managing people and performance
Length of the paper 4,719 words
Author * Justyna Dabrowska
Given Name: Justyna
SURNAME: DABROWSKA
Position: Innovation Project Manager
Author‘s E-mail Address: [email protected]
Organisation: Manchester Science Parks
Mailing Address [email protected]
Phone (with Area Code): 0044 161 232 4600
Fax (optional):
Co-author(s) **
Given Name:
SURNAME:
Position:
E-mail Address:
Organisation:
Mailing Address:
Phone (with Area Code):
Fax (optional):
I confirm my ability to present my paper in English
By submitting my Full Paper I authorise the Conference Organisers to publish it in the Conference Proceedings (if the Paper is approved by the Steering Committee).
Date 18.02.2011
Signature Justyna Dabrowska
2
Measuring the success of science parks: performance monitoring and evaluation By Justyna Dabrowska 2/18/2011
3
Contents
Executive Summary .................................................................... 3
1. Literature survey .................................................................. 4
1.1. Measuring success .............................................................. 4
1.2. Evaluation studies .............................................................. 7
2. Workshop on measuring the success of science parks ....................... 8
2.1. Background information ....................................................... 8
2.2. Outcomes ........................................................................ 9
3. Matrix of key performance indicators ....................................... 14
Conclusions ........................................................................... 18
Executive Summary Measuring the success of science parks is not a straightforward task. The hypothesis that science parks have been successful and effective cannot be proved or disapproved. Policy and decision makers need strong arguments to continue allocating resources to science parks, the media are increasingly interested in the science park phenomenon, science parks‘ stakeholders need to know how science parks perform and what added value they create within the regional knowledge economy. Evaluating the performance of science parks is becoming a more and more important issue for the science park industry.
This paper aims to give a general overview of the literature associated with the evaluation of science and technology parks (section 1), summarise outcomes of the workshop on science parks‘ success held in Manchester in 2010 (section 2). Based on the literature, outcomes of the workshop as well as post workshop analysis and comments it proposes a matrix of key performance indicators or so called science parks‘ performance measurement system (section3).

4
1. Literature survey
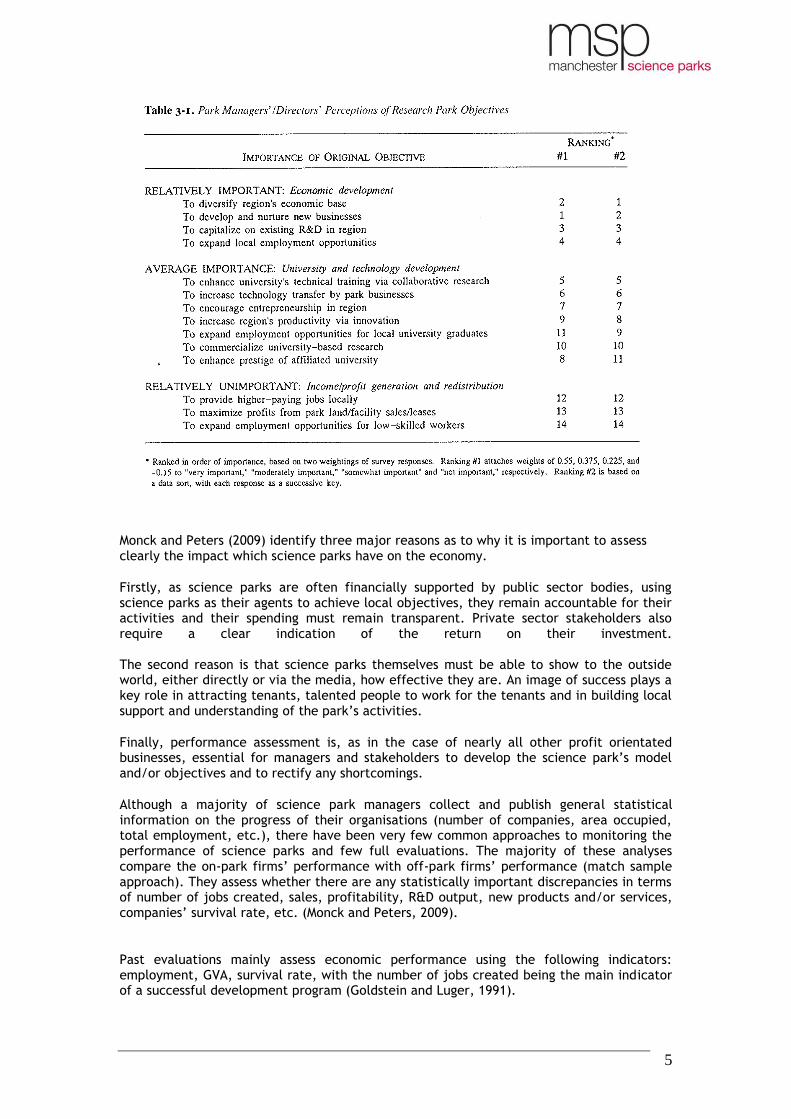
1.1. Measuring success There is no consensus about the definition of successful science parks. In order to define science parks‘ success it is necessary to establish a reference framework i.e. a set of goals against which to measure it (Luger and Goldstein 1991). A problem that arises straight away is that science parks may have different goals and objectives. To evaluate the success of science parks it is essential to understand and agree on the goals that are most important to each science park and then assess their performance against the agreed goals using a set of performance indicators. Before defining the common goals/objectives it is necessary to identify stages of science parks‘ development that will be considered as success thresholds and those characteristics that determine what a science park should exhibit to be successful. Luger and Goldstein (1991) identify three stages of the science park development process i.e. incubation, consolidation and maturation. Similarly, Professor John Allen (2007) describes a science park development or maturation process in three generally applicable phases: initial planning and development (first generation), steady growth (second generation) and the ‗mature‘ phase (third generation). The last stage is when the management and stakeholders recognise that the science park plays a wider role in regional economic development. Each phase has different expected outcomes and therefore criteria for measuring success would also have to be different. This paper focuses on measuring the success of mature science parks termed ‗Third Generation Science Parks‘. The main characteristics and objectives of a mature science park are thoroughly described in ‗Third Generation Science Parks‘ by John Allen (2007). An exemplary park managers‘/directors‘ perception of parks‘ objectives is also proposed by Luger and Goldstein (1991) as follows:
5
Monck and Peters (2009) identify three major reasons as to why it is important to assess clearly the impact which science parks have on the economy.
Firstly, as science parks are often financially supported by public sector bodies, using science parks as their agents to achieve local objectives, they remain accountable for their activities and their spending must remain transparent. Private sector stakeholders also require a clear indication of the return on their investment. The second reason is that science parks themselves must be able to show to the outside world, either directly or via the media, how effective they are. An image of success plays a key role in attracting tenants, talented people to work for the tenants and in building local support and understanding of the park‘s activities.
Finally, performance assessment is, as in the case of nearly all other profit orientated businesses, essential for managers and stakeholders to develop the science park‘s model and/or objectives and to rectify any shortcomings.
Although a majority of science park managers collect and publish general statistical information on the progress of their organisations (number of companies, area occupied, total employment, etc.), there have been very few common approaches to monitoring the performance of science parks and few full evaluations. The majority of these analyses compare the on-park firms‘ performance with off-park firms‘ performance (match sample approach). They assess whether there are any statistically important discrepancies in terms of number of jobs created, sales, profitability, R&D output, new products and/or services, companies‘ survival rate, etc. (Monck and Peters, 2009).
Past evaluations mainly assess economic performance using the following indicators: employment, GVA, survival rate, with the number of jobs created being the main indicator of a successful development program (Goldstein and Luger, 1991).
6
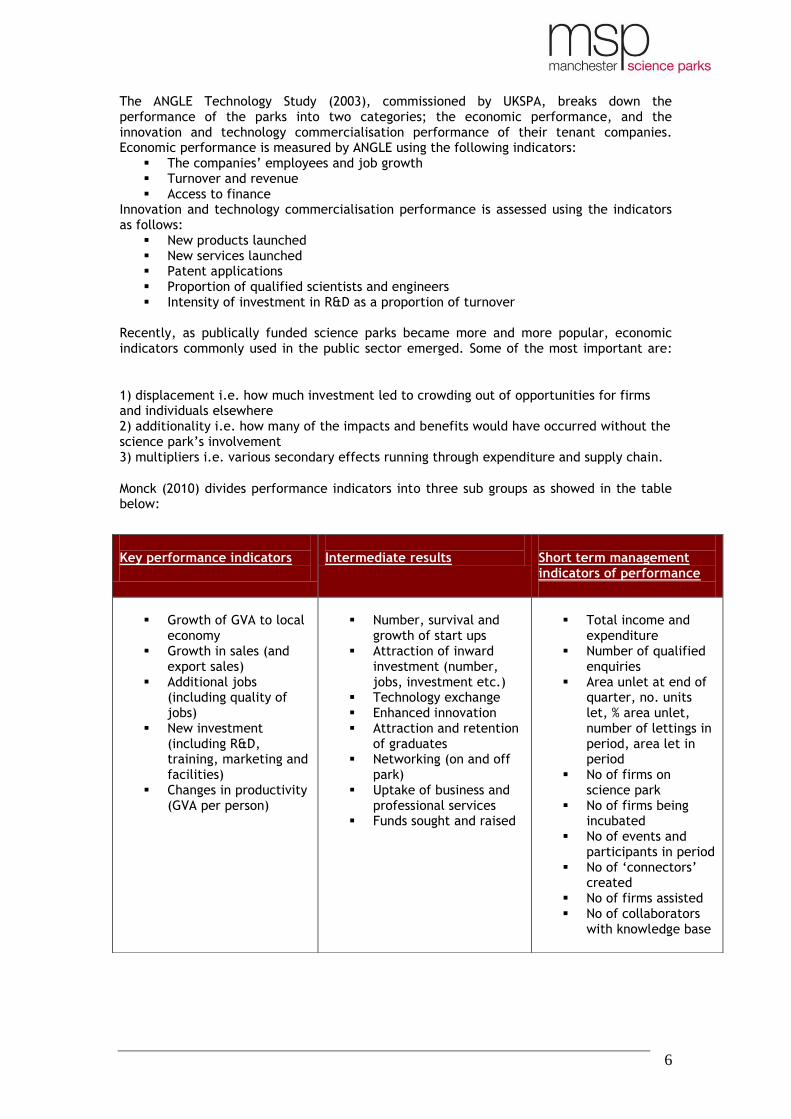
The ANGLE Technology Study (2003), commissioned by UKSPA, breaks down the performance of the parks into two categories; the economic performance, and the innovation and technology commercialisation performance of their tenant companies. Economic performance is measured by ANGLE using the following indicators:
The companies‘ employees and job growth Turnover and revenue Access to finance
Innovation and technology commercialisation performance is assessed using the indicators as follows:
New products launched New services launched Patent applications Proportion of qualified scientists and engineers Intensity of investment in R&D as a proportion of turnover
Recently, as publically funded science parks became more and more popular, economic indicators commonly used in the public sector emerged. Some of the most important are:
1) displacement i.e. how much investment led to crowding out of opportunities for firms and individuals elsewhere 2) additionality i.e. how many of the impacts and benefits would have occurred without the science park‘s involvement 3) multipliers i.e. various secondary effects running through expenditure and supply chain.
Monck (2010) divides performance indicators into three sub groups as showed in the table below:
Key performance indicators
Intermediate results
Short term management indicators of performance
Growth of GVA to local
economy Growth in sales (and
export sales) Additional jobs
(including quality of jobs)
New investment (including R&D, training, marketing and facilities)
Changes in productivity (GVA per person)
Number, survival and
growth of start ups Attraction of inward
investment (number, jobs, investment etc.)
Technology exchange Enhanced innovation Attraction and retention
of graduates Networking (on and off
park) Uptake of business and
professional services Funds sought and raised
Total income and
expenditure Number of qualified
enquiries Area unlet at end of
quarter, no. units let, % area unlet, number of lettings in period, area let in period
No of firms on science park
No of firms being incubated
No of events and participants in period
No of ‗connectors‘ created
No of firms assisted No of collaborators
with knowledge base
7
1.2. Evaluation studies The proliferation of science park models is mirrored by myriad types of analysis that aim to evaluate the added value of science parks. Hodgson (1996) defines these analyses as ‗relative performance‘ and ‗impact evaluation‘ assessments. The analysed aspects include mainly the added value of science parks to new technology-based firms (NTBFs), the establishment of university-industry links, science parks‘ growth and their regional dimension.
Science parks‘ assessment history started first in the UK with the analysis carried out by Monck et al. (1988). They examine the impact of science parks on their tenant companies. They use a match sample approach to assess the performance of on-park companies versus off-park firms. In this research various measures are used to assess the performance of the UK parks: links with Universities and Higher Education Institutions (HEI), R&D intensity, patent activity, launch of new products and services, companies‘ survival/closure rates, multiplier effect, etc. Their study concluded that the evidence that companies on science parks perform better than off-park firms is weak.
Similarly, Massey et al. (1992) in their re-interpretation of the study by Monck et al. (1988) find out that jobs on science parks are not created but simply relocated. Moreover, they are involved in small innovations rather than in major innovative break-throughs (not innovators per se). More recent studies give a different, slightly more positive, picture of science parks. For instance, Lindelöf and Löfsten (2003) show that, although differences between on-park and off-park firms are insignificant in terms of patents, R&D output, new products and services the on-park firms have stronger innovation ability, employment growth, sales and profitability than off-park firms. This view is supported by the ANGLE analysis (2003). The paper shows that on-park firms have higher growth rates than similar off-park firms. Moreover, on-park companies employ 10% more full time staff and have a higher turnover than off-park companies. On the contrary, Ferguson and Olofsson (2004) observe insignificant difference in sales and employment growth between science parks‘ tenants and off-park companies. However, they support the view that on-park firms demonstrate a higher survival rate than the off-park firms. A few recent studies highlight the importance of science parks in terms of links with HEIs. For instance, Lindelöf and Löfsten (2002, 2004) show that NTBFs have stronger links with HEIs than their off-park counterparts. Similarly, Colombo and Delmastro (2002) show that NTBFs on parks perform better in terms of collaboration with universities than off-park NTBFs. This view is also supported by Fukugawa, who assess the ability of on and off-park companies to establish links with HEIs. A positive assessment of science parks is offered by Luger and Goldstein (1991). They prove that science parks have a positive impact on regional economic development. They measured success in science parks across the US (at both consolidation and maturation stages) in terms of: ‗The number of jobs represented by the R&D organisations that have located in the park and in terms of the following induced changes in the region: employment growth, business start-ups, regional income and income equality, employment opportunities for women and minorities, occupational mix and the local wage structure, research capacity of the local universities, the business climate and the political culture.‘ Their research concludes that science parks foster jobs at regional level and strengthen economic diversity. Squicciarini brings a different element into the discussion. She compared patenting activity over 1970-2002 of on and off-park firms to see whether science parks enhance the

8
innovative output of their tenants. The research outcomes suggest that science parks‘ companies show a better performance in terms of patents during their life cycle. Interesting analysis is suggested by Link and Scott (2003). The unit of analysis does not focus on firms but on universities and their relation with University Research Parks (URPs). URPs are property-based ventures which have contractual and/or formal ownership or an operational relationship with one or more universities or other institutions of higher education, and science research1. The research indicates that research parks have a positive impact on universities‘ growth and profile. They enable universities to increase the number of publications, patents, facilitate transfer of technologies and easily place graduates. The table in Annex 1 gives a general overview of performance and impact evaluation studies with their key outcomes. As shown above, authors looked at various indicators to assess the performance of science parks.
Even if the studies recognise the supporting environment and quality added value services provided by the park, the evidence that on-park companies perform better than off-park companies is relatively weak so far.
A majority of analyses use a match sample approach to evaluate performance of firms located on science parks with that of off-park companies. Although there is a need to compare the results with another similar sample, (an important part of all evaluations), there may be a number of weaknesses in the use of the match sample. For example, the ANGLE Technology Report (2003) recognises the importance of science park development and other exterior factors (local innovation system, policy incentives, relationship with university, etc.) that have to be analysed when assessing science parks‘ performance and impact. Interestingly, their research results show that the most important single factor affecting the performance of individual science parks is the state of the Sub Regional Knowledge Economy within which they are operating.
Moreover, the above analysis shows that all studies have been undertaken at regional or national level. No comparison has been made so far between the performance of individual science parks. This is mainly due to the lack of common metrics for evaluation and lack of data collected on regular basis.
A need to agree a consistent approach to performance and impact assessment has been recognised in a various publications (Link and Siegel 2007, Link and Scott 2007, Squicciarini 2007, Monck and Peters 2009).
2. Workshop on measuring the success of science parks
2.1. Background information In October 2010, Manchester Science Parks hosted a one day International Association of Science Parks (IASP) division workshop on ‗Measuring the success of science parks‘. The aim of the workshop was to generate guidance on how science park managers can identify their own success factors via participative workshops and case study presentations
1 AURP definition of University Research Parks
9
from leading IASP members. This was then used to create performance measurement tool that supported those characteristics. At the workshop, four groups were formed and asked the question ‗what a successful science park means to different stakeholders?‘ Each group considered a successful science park from the different perspectives of: universities, city or regional economic development agency, tenant company and commercial investors in the park.
2.2. Outcomes The university group identified seven aspects of what of a successful science park mean to Vice Chancellors and rectors.
1) Science park is a catalyst for culture change of universities. They become more entrepreneurial organisations.
2) Science park is an effective connector in innovation. It acts as a bridge between
market and business
3) Science park makes university a key player in knowledge economy. Science parks give are a tangible example of university‘s success
4) Science park enhances local graduate employment
5) Science park success feeds back to quality of staff, relevance of research and
curriculum
6) Science park is cash-generator for university to reinvest in research. 7) Science park demonstrates regional role of universities
The City or regional economic development agency group identified five major aspects of what a successful science park means to them:
1) Science park is a generator of high quality jobs 2) Science park transforms students into entrepreneurs and consequently retain talent
locally 3) Science park is a net contributor to the economy, it enhances economic
sustainability
4) Science park is an attractive engine for the city/region. It attracts inno-visitors to the region
5) Science park is a catalyst for culture change of the city/region. It has a positive
impact on the city‘s/region‘s image. The tenant company group identified five major aspects of what a successful science park means to them:
1) Science park is a ‗non growing pain‘ place for companies. By providing managed and flexible office space and a large choice of added value support, companies do not have to bother about details. They can concentrate on doing business.
10
2) Science park is a professional home for successful companies. Being on the park gives credibility to new companies with little track record and/or brand value for companies in next stage of development. It has positive impact on their brand/image.
3) Science park is a smart place to do business where knowledge and intelligence is
easily accessible
4) Science park is a place where tenant can meet their potential customers and/or collaborators and have access to larger networks, big companies and multinational firms.
5) Science park is a place with a well established business community to which tenants
want to belong. They can share ideas, issues and even human resources. The commercial investor in the park group identified three major aspects of what a successful science park means to them:
1) Science park is a safe investment for investors
2) Science park gives strong long-term returns
3) Science park with its laboratories attracts more investment, such as European or regional funds, fostering physical growth
11
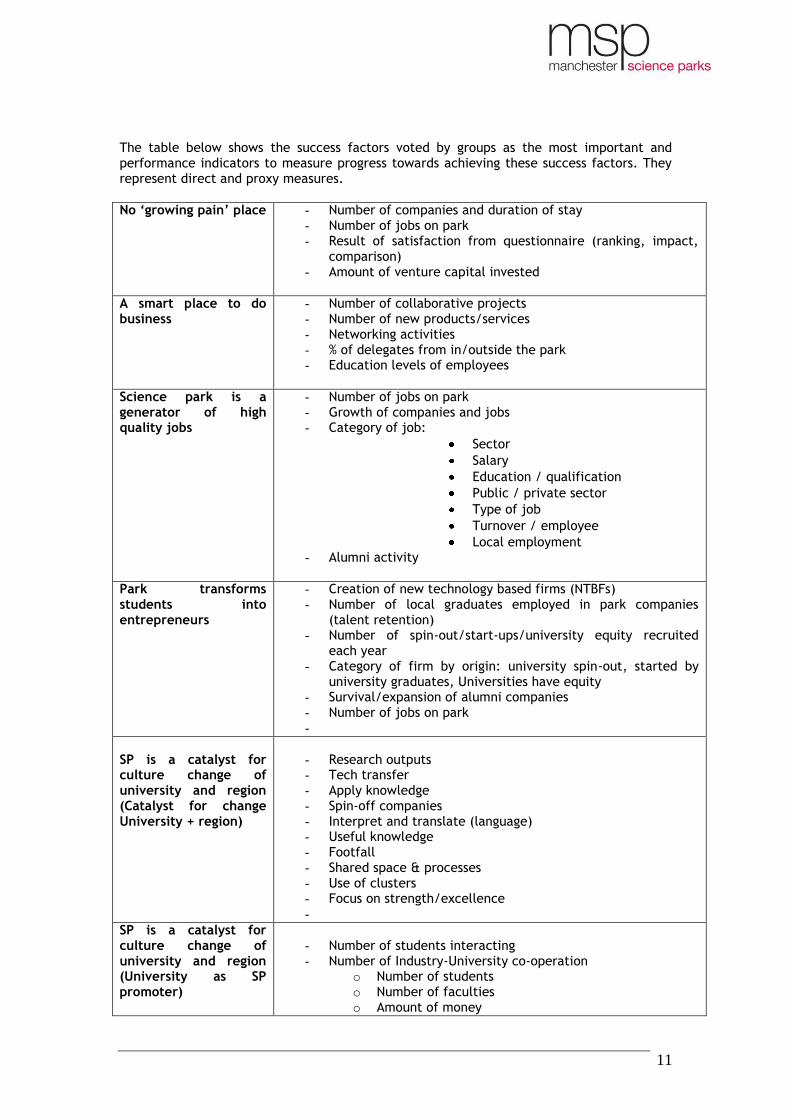
The table below shows the success factors voted by groups as the most important and performance indicators to measure progress towards achieving these success factors. They represent direct and proxy measures.
No ‘growing pain’ place
- Number of companies and duration of stay - Number of jobs on park - Result of satisfaction from questionnaire (ranking, impact,
comparison) - Amount of venture capital invested
A smart place to do business
- Number of collaborative projects - Number of new products/services - Networking activities - % of delegates from in/outside the park - Education levels of employees
Science park is a generator of high quality jobs
- Number of jobs on park - Growth of companies and jobs - Category of job:
Sector
Salary
Education / qualification
Public / private sector
Type of job
Turnover / employee
Local employment - Alumni activity
Park transforms students into entrepreneurs
- Creation of new technology based firms (NTBFs) - Number of local graduates employed in park companies
(talent retention) - Number of spin-out/start-ups/university equity recruited
each year - Category of firm by origin: university spin-out, started by
university graduates, Universities have equity - Survival/expansion of alumni companies - Number of jobs on park -
SP is a catalyst for culture change of university and region (Catalyst for change University + region)
- Research outputs - Tech transfer - Apply knowledge - Spin-off companies - Interpret and translate (language) - Useful knowledge - Footfall - Shared space & processes - Use of clusters - Focus on strength/excellence -
SP is a catalyst for culture change of university and region (University as SP promoter)
- Number of students interacting - Number of Industry-University co-operation
o Number of students o Number of faculties o Amount of money
12
o Number of projects
- Number of researches met o Number of ideas passing to ―Project‖ level o Number of ideas going onto ―Start up‖ /QUALITY o Number of exits
- Number of events, workshops
SP is a cash-generator for university to reinvest in research (Generation of cash for Uni to do research)
- Direct income from science park activity - Value of spin-out equity - Licence revenue - Attracting investment from public programmes (including 7th
Framework) - Private sector investment in university related R&D - IP ownership by the university
Science park gives strong long-term returns
- Same direct measures as for conventional estates
o Internal Rate of Return (IRR) o Annual data (5-10 years) o Soft infrastructure
- Indirect o Occupancy o Company growth o Science park‘s image o Added value services
Brand - Investors are willing to invest in companies on science parks (credibility)
- If science park is rigorous in tenancy criteria, acceptance of companies enhances brand in itself
- Companies have SP location on web sites, publicity, address - Science parks own publicity and image (number of citations
in press) - Ranking of science park by potential employee, e.g. students - Tenants‘ own views
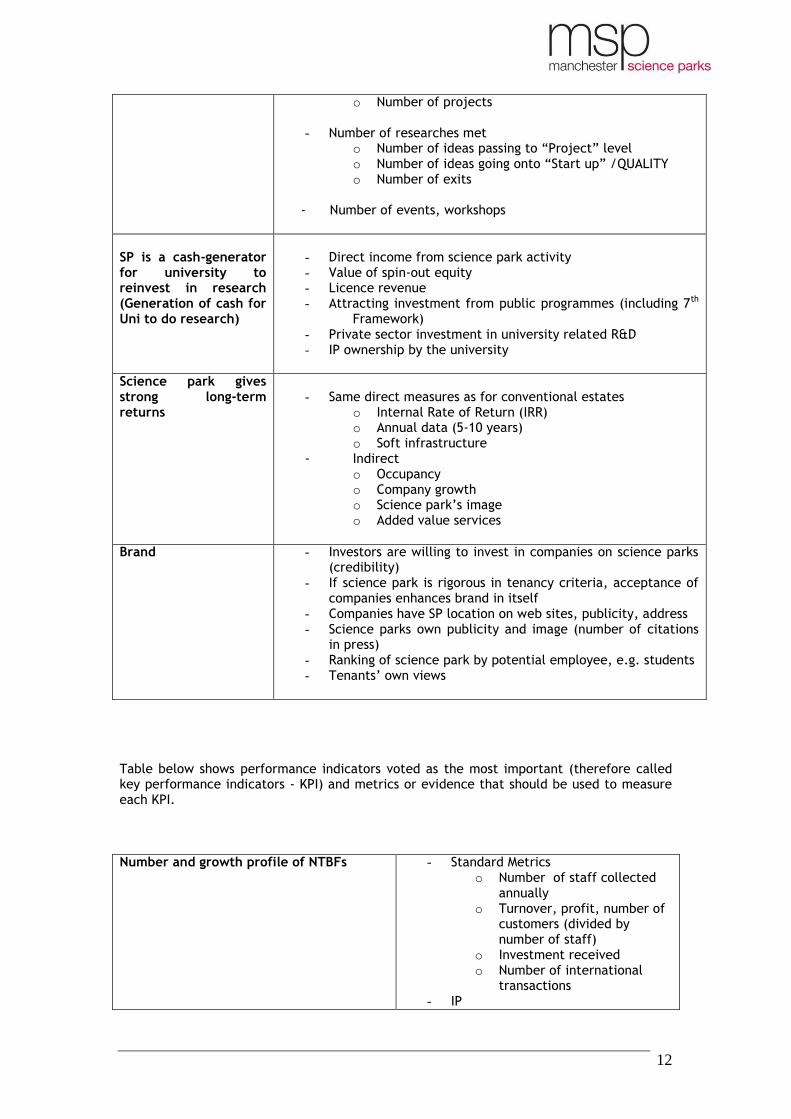
Table below shows performance indicators voted as the most important (therefore called key performance indicators - KPI) and metrics or evidence that should be used to measure each KPI.
Number and growth profile of NTBFs
- Standard Metrics o Number of staff collected
annually o Turnover, profit, number of
customers (divided by number of staff)
o Investment received o Number of international
transactions - IP
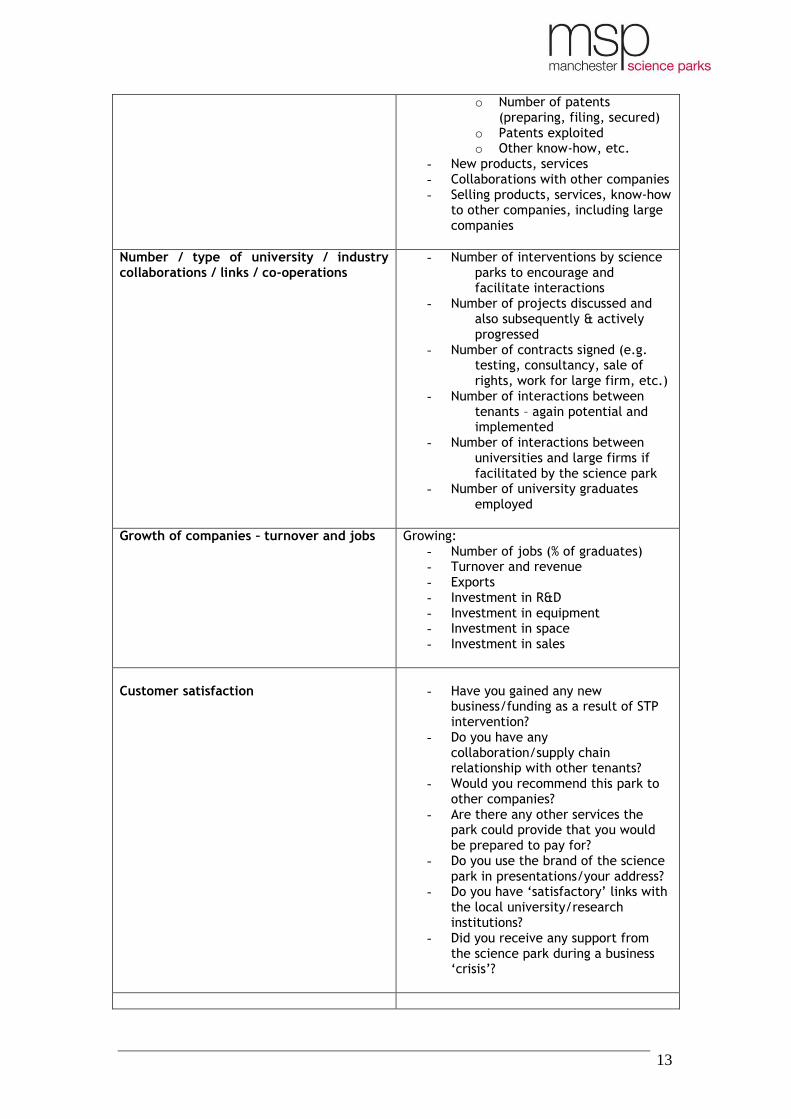
13
o Number of patents (preparing, filing, secured)
o Patents exploited o Other know-how, etc.
- New products, services - Collaborations with other companies - Selling products, services, know-how
to other companies, including large companies
Number / type of university / industry collaborations / links / co-operations
- Number of interventions by science parks to encourage and facilitate interactions
- Number of projects discussed and also subsequently & actively progressed
- Number of contracts signed (e.g. testing, consultancy, sale of rights, work for large firm, etc.)
- Number of interactions between tenants – again potential and implemented
- Number of interactions between universities and large firms if facilitated by the science park
- Number of university graduates employed
Growth of companies – turnover and jobs
Growing: - Number of jobs (% of graduates) - Turnover and revenue - Exports - Investment in R&D - Investment in equipment - Investment in space - Investment in sales
Customer satisfaction
- Have you gained any new
business/funding as a result of STP intervention?
- Do you have any collaboration/supply chain relationship with other tenants?
- Would you recommend this park to other companies?
- Are there any other services the park could provide that you would be prepared to pay for?
- Do you use the brand of the science park in presentations/your address?
- Do you have ‗satisfactory‘ links with the local university/research institutions?
- Did you receive any support from the science park during a business ‗crisis‘?
14
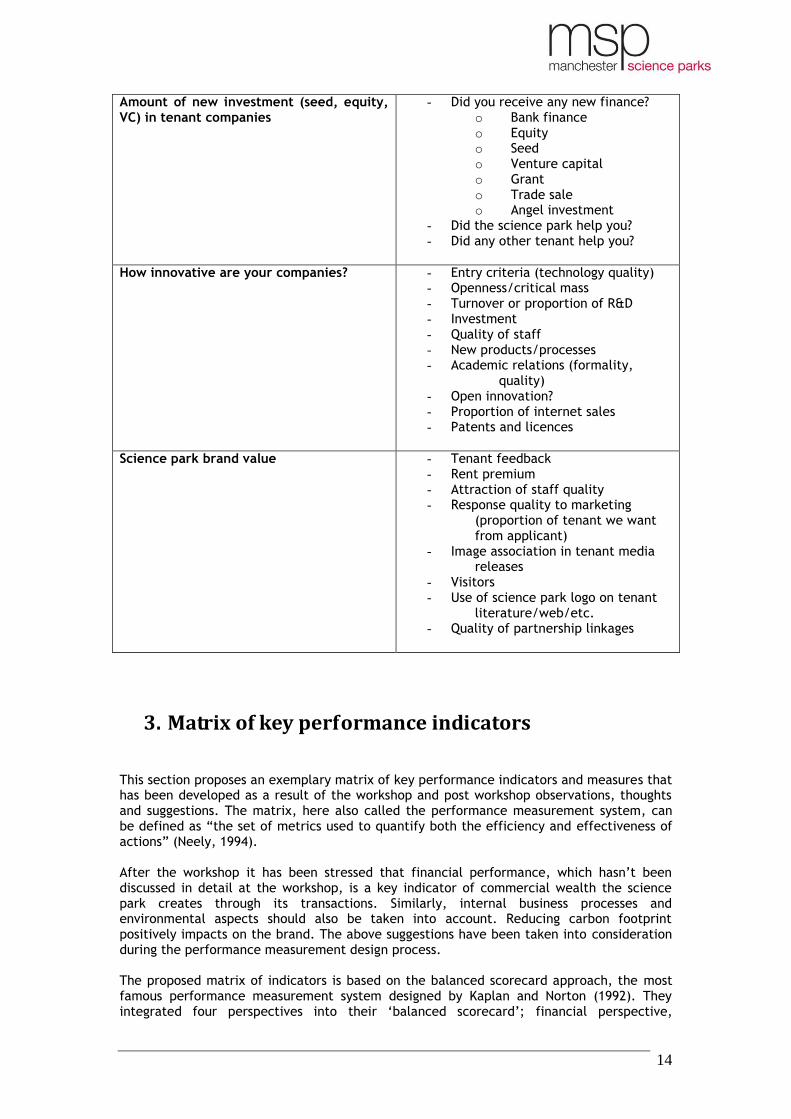
Amount of new investment (seed, equity, VC) in tenant companies
- Did you receive any new finance? o Bank finance o Equity o Seed o Venture capital o Grant o Trade sale o Angel investment
- Did the science park help you? - Did any other tenant help you?
How innovative are your companies?
- Entry criteria (technology quality) - Openness/critical mass - Turnover or proportion of R&D - Investment - Quality of staff - New products/processes - Academic relations (formality,
quality) - Open innovation? - Proportion of internet sales - Patents and licences
Science park brand value
- Tenant feedback - Rent premium - Attraction of staff quality - Response quality to marketing
(proportion of tenant we want from applicant)
- Image association in tenant media releases
- Visitors - Use of science park logo on tenant
literature/web/etc. - Quality of partnership linkages
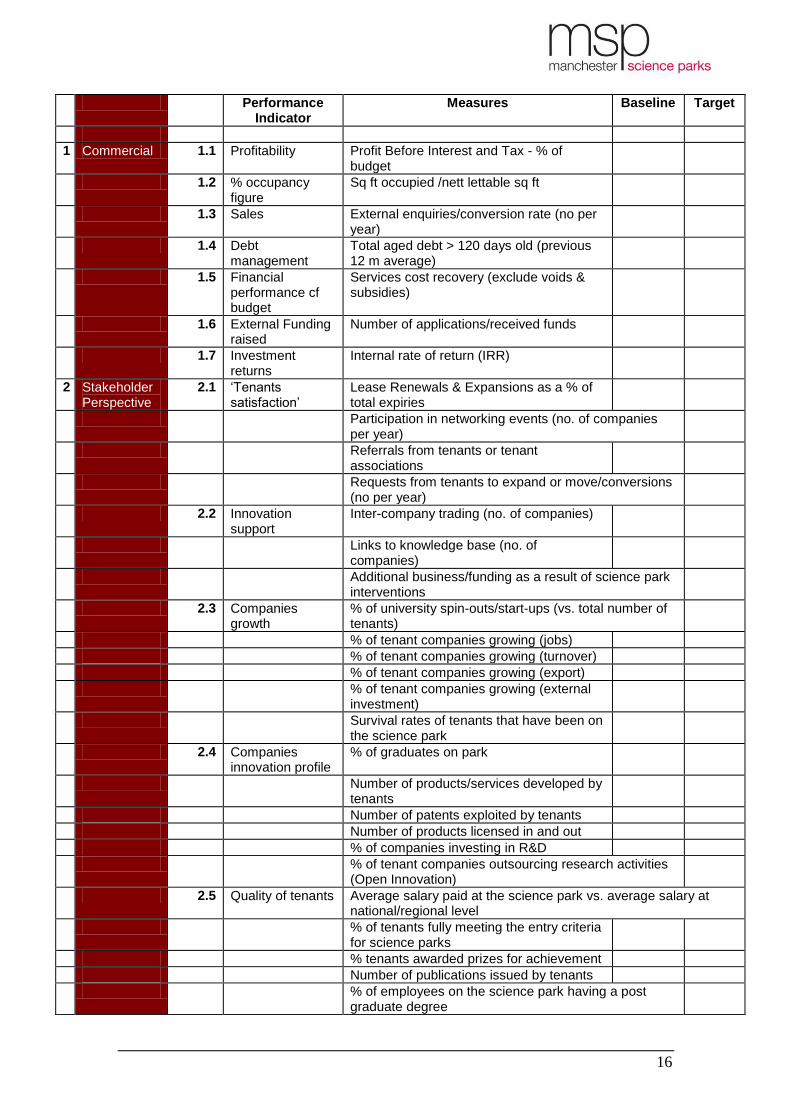
3. Matrix of key performance indicators This section proposes an exemplary matrix of key performance indicators and measures that has been developed as a result of the workshop and post workshop observations, thoughts and suggestions. The matrix, here also called the performance measurement system, can be defined as ―the set of metrics used to quantify both the efficiency and effectiveness of actions‖ (Neely, 1994). After the workshop it has been stressed that financial performance, which hasn‘t been discussed in detail at the workshop, is a key indicator of commercial wealth the science park creates through its transactions. Similarly, internal business processes and environmental aspects should also be taken into account. Reducing carbon footprint positively impacts on the brand. The above suggestions have been taken into consideration during the performance measurement design process. The proposed matrix of indicators is based on the balanced scorecard approach, the most famous performance measurement system designed by Kaplan and Norton (1992). They integrated four perspectives into their ‗balanced scorecard‘; financial perspective,
15
customer perspective, internal business perspective and innovation and learning perspective. The balanced scorecard has developed over the years and evolved ―from a measurement tool into a strategic performance management of which measurement is but a small part‖ (Centre for Business Performance, 2002). As identified by the Centre for Business Performance (2002), performance measurement systems have three main roles: First, strategic role: ―comprise the roles of managing strategy implementation and challenging assumptions‖.
Second, communication role: ―comprises the role of checking position, complying with the non-negotiable parameters, communicating direction, providing feedback and benchmarking‖.
Third, motivational: ―comprises the role of evaluating and rewarding behaviour, and encouraging improvement and learning‖.
As suggested by Neely et al. (2002) the following key characteristics were taken into consideration when designing performance measurement system/the matrix of performance indicators:
- It provides a balanced and multi-dimensional overview of the business, the matrix
assesses all aspects of the company‘s performance. - It is comprehensive. In order to effectively assess performance of the company the
maximum number of data must be gathered and compared with other companies/different time.
- The matrix is clear and provides anyone who may be using it with a concise picture
of the company’s performance
- The proposed performance measurement system is integrated within the company’s processes at vertical (hierarchy) and horizontal (departments) levels to encourage consistency of objectives and actions.
- It also provides information for monitoring past performance as well as planning
future performance. The main objective of the matrix is to introduce measures such as financial and non-financial, internal and external, leading and lagging, and short and long-term measures to measure the performance of science parks. The matrix of key performance indicators has been divided into four main categories: commercial, stakeholder perspective, brand and reputation and internal business processes (see Table 1 below).
16
Performance Indicator
Measures Baseline Target
1 Commercial 1.1 Profitability Profit Before Interest and Tax - % of budget
1.2 % occupancy figure
Sq ft occupied /nett lettable sq ft
1.3 Sales External enquiries/conversion rate (no per year)
1.4 Debt management
Total aged debt > 120 days old (previous 12 m average)
1.5 Financial performance cf budget
Services cost recovery (exclude voids & subsidies)
1.6 External Funding raised
Number of applications/received funds
1.7 Investment returns
Internal rate of return (IRR)
2 Stakeholder Perspective
2.1 ‘Tenants satisfaction’
Lease Renewals & Expansions as a % of total expiries
Participation in networking events (no. of companies per year)
Referrals from tenants or tenant associations
Requests from tenants to expand or move/conversions (no per year)
2.2 Innovation support
Inter-company trading (no. of companies)
Links to knowledge base (no. of companies)
Additional business/funding as a result of science park interventions
2.3 Companies growth
% of university spin-outs/start-ups (vs. total number of tenants)
% of tenant companies growing (jobs)
% of tenant companies growing (turnover)
% of tenant companies growing (export)
% of tenant companies growing (external investment)
Survival rates of tenants that have been on the science park
2.4 Companies innovation profile
% of graduates on park
Number of products/services developed by tenants
Number of patents exploited by tenants
Number of products licensed in and out
% of companies investing in R&D
% of tenant companies outsourcing research activities (Open Innovation)
2.5 Quality of tenants Average salary paid at the science park vs. average salary at national/regional level
% of tenants fully meeting the entry criteria for science parks
% tenants awarded prizes for achievement
Number of publications issued by tenants
% of employees on the science park having a post graduate degree
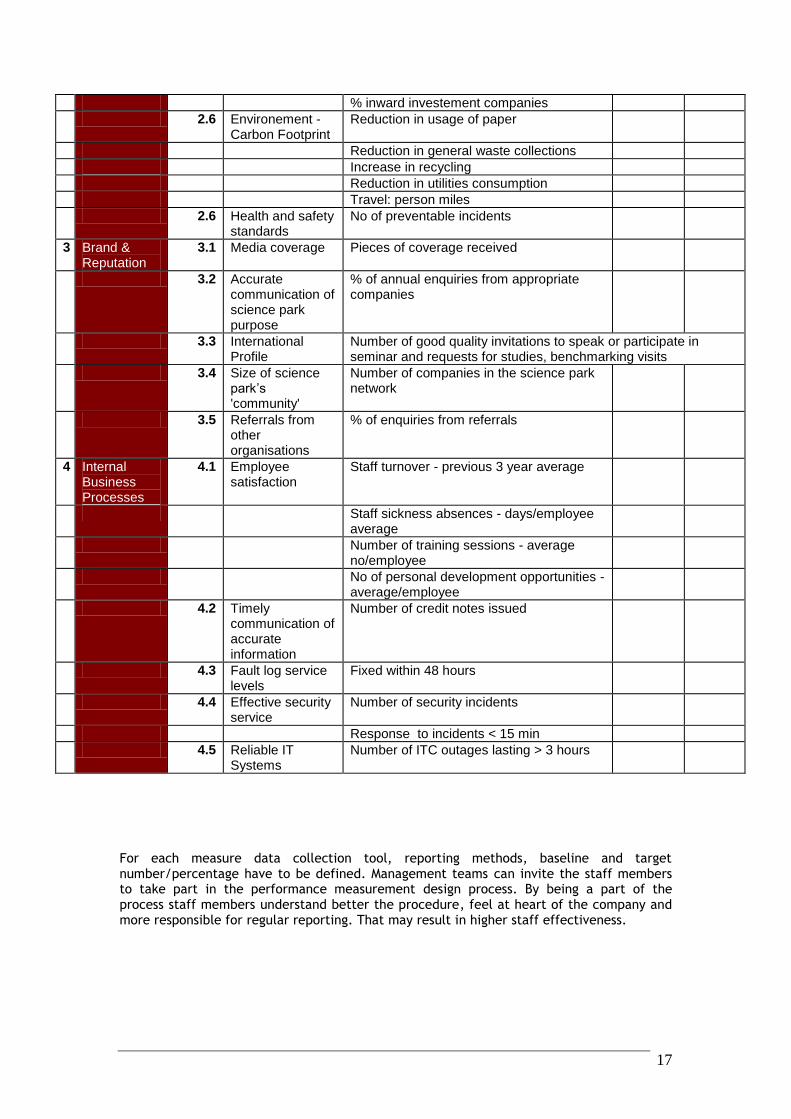
17
% inward investement companies
2.6 Environement - Carbon Footprint
Reduction in usage of paper
Reduction in general waste collections
Increase in recycling
Reduction in utilities consumption
Travel: person miles
2.6 Health and safety standards
No of preventable incidents
3 Brand & Reputation
3.1 Media coverage Pieces of coverage received
3.2 Accurate communication of science park purpose
% of annual enquiries from appropriate companies
3.3 International Profile
Number of good quality invitations to speak or participate in seminar and requests for studies, benchmarking visits
3.4 Size of science park’s 'community'
Number of companies in the science park network
3.5 Referrals from other organisations
% of enquiries from referrals
4 Internal Business Processes
4.1 Employee satisfaction
Staff turnover - previous 3 year average
Staff sickness absences - days/employee average
Number of training sessions - average no/employee
No of personal development opportunities - average/employee
4.2 Timely communication of accurate information
Number of credit notes issued
4.3 Fault log service levels
Fixed within 48 hours
4.4 Effective security service
Number of security incidents
Response to incidents < 15 min
4.5 Reliable IT Systems
Number of ITC outages lasting > 3 hours
For each measure data collection tool, reporting methods, baseline and target number/percentage have to be defined. Management teams can invite the staff members to take part in the performance measurement design process. By being a part of the process staff members understand better the procedure, feel at heart of the company and more responsible for regular reporting. That may result in higher staff effectiveness.
18
Conclusions Evaluation studies of individual science parks have been occasionally carried out in different countries across the world and with different levels of detail and depth. However, it appears vital to achieve a minimum degree of homogeneity in these evaluations, which has not yet been reached. Evaluating the performance of science parks has become very important to the science park community. The success of science parks can be carefully measured using performance indicators. They give an understanding of how the park is performing as a business and how it is making progress towards its long-term organisational goals. It also provides a picture of the impact of a science park on regional economic growth using financial and non-financial indicators. The proposed matrix of indicators is an exemplary tool of how performance could be measured within science parks. By introducing the same measures to evaluate science parks a degree of consistency within science parks could be achieved.

19
References: Allen, J. (2007) Third Generation Science Parks, Manchester Science Parks
Angle Technology (2003) Evaluation of the past and future economic contributions of the UK Science Park Movement, UK Science Park Association
Colombo, M., & Delmastro, M. (2002) How effective are technology incubators? Evidence from Italy, Research Policy, 31, 1103-1122
Ferguson, R., & Olofsson C. (2004), Science parks and the development of NTBFs - location, survival and growth, Journal of Technology Transfer, 29, 5–17
Fukagawa, N. (2006), Science parks in Japan and their value-added contributions to new technology-based Firms, International Journal of Industrial Organization, 24, 381-400
Hodgson, B. (1996) A methodological framework to analyse the impact of Science and Technology Parks, in M. Guedes & P. Formica (Eds.), The Economic of Science Parks, IASP and AURRP
Kaplan, R.S. and Norton, D.P. (1992), ‗The balanced scorecard and measures that drive performance‘, Harvard Business Review, January-February, pp. 71-9 Leyden, D.P., Link, A.N., Siegel, D.S. (2007) A Theoretical and Empirical Analysis of the Decision to Locate on a University Research Park, Engineering Management Journal, IEEE Transactions; 55(1), 23-28 Lindelöf, P., & Löfsten, H. (2002) Science parks and the growth of new technology-based firms – academic-industry links, innovation and markets, Research Policy, 31, 859-876 Lindelöf, P., & Löfsten, H. (2003) Science parks location and new technology-based firms in Sweden— implications for strategy and performance, Small Business Economics, 20, 245–258
Lindelöf, P., &, Löfsten, H. (2004) Proximity as a resource base for competitive advantage: University industry links for technology transfer, Journal of Technology Transfer 29, 311–326
Lindelöf, P., &, Löfsten, H. (2005) R&D networks and product innovation patterns – academic and non-academic new technology-based firms on science parks, Technovation, 25, 1025-1037
Link, A., Scott, J. (2007) The economics of university research parks, Oxford Review of Economic Policy, Volume 23, Number 4, 2007, pp.661 – 674 Link, A., Scott, J.T. (2003) US science parks: The diffusion of an innovation and its effects on the academic missions of universities, International Journal of Industrial Organization, 21, 1323-1356
Link, A. Siegel, D. (2007) Innovation, Entrepreneurship and Technological Change, Oxford University Press, Oxford
Luger, M. I., & Goldstein, H. A. (1991) Technology in the garden, Chapel Hill, UNC Press

20
Massey, D., Quintas, P., & Wield, D. (1992) High-tech fantasies. Science parks in society, science and space, London: Routledge
Monck, C., Peters, K. (2009) Science Parks as an Instrument of Regional Competitiveness: Measuring Success and Impact, IASP 2009 annual conference proceedings
Monck, C. (2010) Performance monitoring and evaluation, UKSPA conference proceedings
Monck, C., Porter, R., Quintas, P., Storey, D.J., Wynarczyk, P. (1988) Science Parks and the Growth of High Technology Firms, Croom Helm and Peat Marwick McLintock, London Neely, A; Adams, C, and Kennerley, M., (2002), ‗The Performance Prism - The Scorecard for Measuring and ManagingBusiness Success", FinancialTimes Neely, A., (2002), Business Performance Measurement: Theory and Practice. Cambridge: Cambridge University Press Siegel, D. S., Westhead, P., & Wright, M. (2003) Assessing the impact of University Science parks on research productivity: Exploratory firm-level evidence from the United Kingdom, International Journal of Industrial Organization, 21, 1357–1369
Squicciarini, M. (2008) Science Parks‘ tenants versus out-of-Park firms: who innovates more? A duration model, The Journal of Technology Transfer, 33, 45-7

21
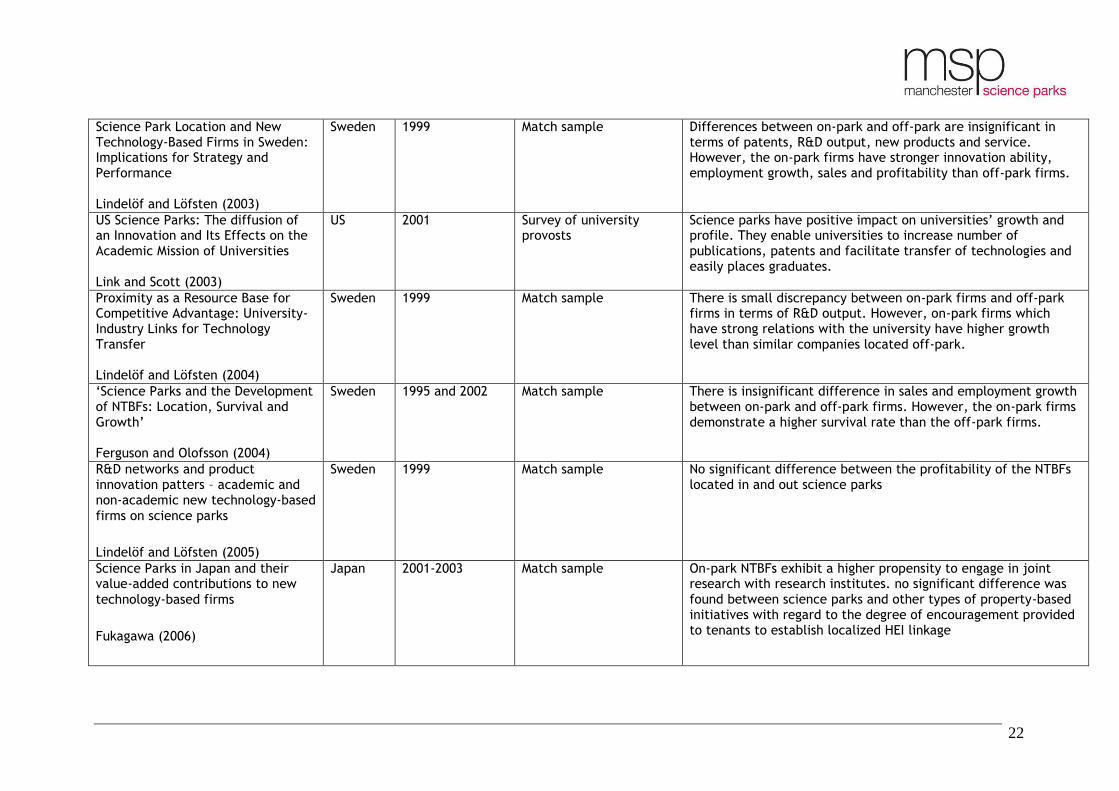
ANNEX 1 Key literature Country Year of analysis Methodology Key outcomes
Science Parks and The Growth of High Technology Firms Monck,Porter,Quintas, Storey and Wynarczyk (1988)
UK 1986 Survey of on-park firms (183) and off-park firms (101) - match sample
NTBFs located on the science park have similar closure rate to non-science park firms.
High-tech Fantasies – Science Parks in Society, Science and Space Massey, Quintas and Wield (1992)
UK 1986 Empirical evaluation (re-interpretation of the study by Monck et al. 1986)
Jobs on science parks are not created but simply relocated. Science parks are involved in small innovations rather than in major innovative break-throughs (not innovators per se)
Technology in the Garden Goldstein and Luger (1991)
USA 1989 Case study and survey of 72 US parks
Science park have a positive impact on regional economic development, they help to generate jobs (especially within minorities) and strengthen economic diversity.
Science parks and the growth of new technology-based firms – academic-industry links, innovation and markets Lindelöf and Löfsten (2002)
Sweden 1999 Match sample NTBFs have more to have links with HEIs than off-park firms
How effective are technology incubators? Evidence from Italy Colombo, Delmastro (2002)
Italy 2000 Match sample On-incubator companies (45) versus off-incubator companies
NTBFs show higher growth than off-NTBFs, incubators attract highly skilled entrepreneurs and have a positive impact on links with HEIs
Assessing the Impact of Science Parks on the Research Productivity of Firms: Exploratory Evidence from the United Kingdom Siegel, Westhead, Wright (2003)
UK 1992 Match sample Firms located on university research parks are more efficient than companies located off-park in terms of creating new products and/or services and patents
UKSPA/Angle Technology (2003) UK 2003 Surveys of technology-based firms located on-park (617) and off-park (259) (match sample)
On-park firms have higher growth rates than similar off-park firms. On-park companies employ 10% more full time staff and have higher turnover than off-park companies.
22
Science Park Location and New Technology-Based Firms in Sweden: Implications for Strategy and Performance Lindelöf and Löfsten (2003)
Sweden 1999 Match sample Differences between on-park and off-park are insignificant in terms of patents, R&D output, new products and service. However, the on-park firms have stronger innovation ability, employment growth, sales and profitability than off-park firms.
US Science Parks: The diffusion of an Innovation and Its Effects on the Academic Mission of Universities Link and Scott (2003)
US 2001 Survey of university provosts
Science parks have positive impact on universities‘ growth and profile. They enable universities to increase number of publications, patents and facilitate transfer of technologies and easily places graduates.
Proximity as a Resource Base for Competitive Advantage: University-Industry Links for Technology Transfer Lindelöf and Löfsten (2004)
Sweden 1999 Match sample There is small discrepancy between on-park firms and off-park firms in terms of R&D output. However, on-park firms which have strong relations with the university have higher growth level than similar companies located off-park.
‗Science Parks and the Development of NTBFs: Location, Survival and Growth‘ Ferguson and Olofsson (2004)
Sweden 1995 and 2002 Match sample
There is insignificant difference in sales and employment growth between on-park and off-park firms. However, the on-park firms demonstrate a higher survival rate than the off-park firms.
R&D networks and product innovation patters – academic and non-academic new technology-based
firms on science parks
Lindelöf and Löfsten (2005)
Sweden 1999 Match sample No significant difference between the profitability of the NTBFs located in and out science parks
Science Parks in Japan and their value-added contributions to new
technology-based firms
Fukagawa (2006)
Japan 2001-2003 Match sample On-park NTBFs exhibit a higher propensity to engage in joint research with research institutes. no significant difference was found between science parks and other types of property-based initiatives with regard to the degree of encouragement provided to tenants to establish localized HEI linkage

23
A Theoretical and Empirical Analysis of the Decision to Locate on a University Research Park
Leyden, Link and Siegel (2007)
US 2006 Match sample On-park firms demonstrate higher economic diversity, growth and R&D outputs than off-park firms.
Science Parks‘ tenants versus out-of-Park firms: who innovates more? A duration model
Squicciarini (2008)
Finland 1970-2002 Match sample Survey of a sample of 252 on-park firms versus and off-park firms, before versus after hazard rate of patenting activity
Park tenants exhibit a comparatively better performance in patenting activity