d. air quality 1. a
TRANSCRIPT

L S A A S S O C I A T E S , I N C . Y O L O C O U N T Y 2 0 3 0 C O U N T Y W I D E G E N E R A L P L A N E I R A P R I L 2 0 0 9 I V . S E T T I N G , I M P A C T S , A N D M I T I G A T I O N M E A S U R E S D . A I R Q U A L I T Y
P:\CYK0701 Yolo GP EIR\PRODUCTS\DEIR\Public\4d-AirQuality.doc (4/27/09) PUBLIC REVIEW DRAFT 273
D. AIR QUALITY This section has been prepared using methods and assumptions recommended in the Handbook for Assessing and Mitigating Air Quality Impacts of the Yolo-Solano Air Quality Management District (YSAQMD).1 In keeping with these guidelines, this analysis describes existing air quality and the potential impacts of emissions generated by the Draft General Plan on local carbon monoxide levels, toxic air contaminants, odors, and regional air pollution. Mitigation measures to reduce or eliminate significant air quality impacts are identified, where appropriate.
1. Setting This section describes the existing air quality conditions in Yolo County, beginning with a discussion of the ambient air quality standards and regulatory framework, typical air pollutant types and sources, and climatology relating to air quality. a. Background. State and federal air quality standards and the regulatory framework for air quality are described in this section.
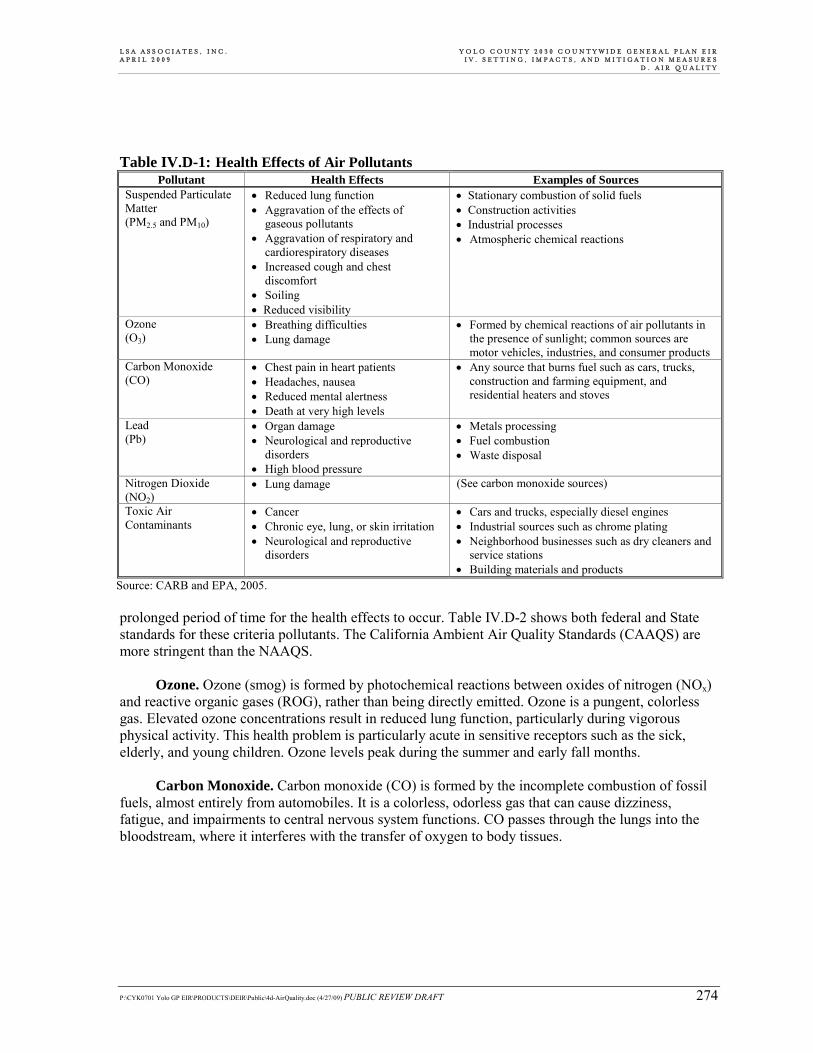
(1) Ambient Air Quality Standards. Pursuant to the federal Clean Air Act (CAA) of 1970, the U.S. Environmental Protection Agency (EPA) established national ambient air quality standards (NAAQS). The NAAQS were established for major pollutants, termed “criteria” pollutants. Criteria pollutants are defined as those pollutants for which the federal and State governments have established ambient air quality standards, or criteria, for outdoor concentrations in order to protect public health. Both the EPA and the California Air Resources Board (CARB) have established ambient air quality standards for common pollutants: carbon monoxide (CO), ozone (O3), nitrogen dioxide (NO2), sulfur dioxide (SO2), lead (Pb), and suspended particulate matter (PM). In addition, the State has set stand-ards for sulfates, hydrogen sulfide, vinyl chloride, and visibility reducing particles. These standards are designed to protect the health and welfare of the populace with a reasonable margin of safety. These ambient air quality standards are levels of contaminants which represent safe levels that avoid specific adverse health effects associated with each pollutant. The ambient air quality standards cover what are called “criteria” pollutants. Federal standards include both primary and secondary standards. Primary standards set limits to protect public health, including the health of sensitive populations such as asthmatics, children, and the elderly. Secondary standards set limits to protect public welfare, including protection against decreased visibility, damage to animals, crops, vegetation, and buildings.2 Despite great progress in improving air quality, approximately 105.6 million people nationwide lived in counties with pollution levels above the National Ambient Air Quality Standards (NAAQS) in 2006. In these nonattainment areas, however, the severity of air pollution episodes has decreased. Health effects of criteria pollutants and their potential sources are described below and are summarized in Table IV.D-1. The standards would have to be exceeded by a large margin or for a
1 Yolo-Solano Air Quality Management District, 2007. Handbook for Assessing and Mitigating Air Quality Impacts.
July 11. 2 U.S. Environmental Protection Agency, 2007. Website: www.epa.gov/air/criteria.html. January.
L S A A S S O C I A T E S , I N C . Y O L O C O U N T Y 2 0 3 0 C O U N T Y W I D E G E N E R A L P L A N E I R A P R I L 2 0 0 9 I V . S E T T I N G , I M P A C T S , A N D M I T I G A T I O N M E A S U R E S D . A I R Q U A L I T Y
P:\CYK0701 Yolo GP EIR\PRODUCTS\DEIR\Public\4d-AirQuality.doc (4/27/09) PUBLIC REVIEW DRAFT 274
Table IV.D-1: Health Effects of Air Pollutants Pollutant Health Effects Examples of Sources
Suspended Particulate Matter (PM2.5 and PM10)
• Reduced lung function • Aggravation of the effects of
gaseous pollutants • Aggravation of respiratory and
cardiorespiratory diseases • Increased cough and chest
discomfort • Soiling • Reduced visibility
• Stationary combustion of solid fuels • Construction activities • Industrial processes • Atmospheric chemical reactions
Ozone (O3)
• Breathing difficulties • Lung damage
• Formed by chemical reactions of air pollutants in the presence of sunlight; common sources are motor vehicles, industries, and consumer products
Carbon Monoxide (CO)
• Chest pain in heart patients • Headaches, nausea • Reduced mental alertness • Death at very high levels
• Any source that burns fuel such as cars, trucks, construction and farming equipment, and residential heaters and stoves
Lead (Pb)
• Organ damage • Neurological and reproductive
disorders • High blood pressure
• Metals processing • Fuel combustion • Waste disposal
Nitrogen Dioxide (NO2)
• Lung damage (See carbon monoxide sources)
Toxic Air Contaminants
• Cancer • Chronic eye, lung, or skin irritation • Neurological and reproductive
disorders
• Cars and trucks, especially diesel engines • Industrial sources such as chrome plating • Neighborhood businesses such as dry cleaners and
service stations • Building materials and products
Source: CARB and EPA, 2005. prolonged period of time for the health effects to occur. Table IV.D-2 shows both federal and State standards for these criteria pollutants. The California Ambient Air Quality Standards (CAAQS) are more stringent than the NAAQS.
Ozone. Ozone (smog) is formed by photochemical reactions between oxides of nitrogen (NOx) and reactive organic gases (ROG), rather than being directly emitted. Ozone is a pungent, colorless gas. Elevated ozone concentrations result in reduced lung function, particularly during vigorous physical activity. This health problem is particularly acute in sensitive receptors such as the sick, elderly, and young children. Ozone levels peak during the summer and early fall months.
Carbon Monoxide. Carbon monoxide (CO) is formed by the incomplete combustion of fossil
fuels, almost entirely from automobiles. It is a colorless, odorless gas that can cause dizziness, fatigue, and impairments to central nervous system functions. CO passes through the lungs into the bloodstream, where it interferes with the transfer of oxygen to body tissues.

L S A A S S O C I A T E S , I N C . Y O L O C O U N T Y 2 0 3 0 C O U N T Y W I D E G E N E R A L P L A N E I R A P R I L 2 0 0 9 I V . S E T T I N G , I M P A C T S , A N D M I T I G A T I O N M E A S U R E S D . A I R Q U A L I T Y
P:\CYK0701 Yolo GP EIR\PRODUCTS\DEIR\Public\4d-AirQuality.doc (4/27/09) PUBLIC REVIEW DRAFT 275
Table IV.D-2: Federal and State Ambient Air Quality Standards California Standardsa Federal Standardsb
Pollutant Averaging
Time Concentrationc Methodd Primaryc,e Secondaryc,f Methodg
1-Hour 0.09 ppm (180 μg/m3)
No federal standard Ozone
(O3) 8-Hour 0.07 ppm (137 μg/m3)
Ultraviolet Photometry 0.075 ppm
(147 μg/m3)
Same as Primary Standard
Ultraviolet Photometry
24-Hour 50 μg/m3 150 μg/m3 Respirable Particulate
Matter (PM10)
Annual Arithmetic
Mean 20 μg/m3
Gravimetric or Beta Attenuation –
Same as Primary Standard
Inertial Separation and
Gravimetric Analysis
24-Hour No Separate State Standard 35 μg/m3 Fine Particulate
Matter (PM2.5)
Annual Arithmetic
Mean 12 μg/m3 Gravimetric or Beta
Attenuation 15 μg/m3
Same as Primary Standard
Inertial Separation and
Gravimetric Analysis
8-Hour 9.0 ppm (10 mg/m3)
9 ppm (10 mg/m3)
1-Hour 20 ppm (23 mg/m3)
35 ppm (40 mg/m3)
Carbon Monoxide
(CO) 8-Hour (Lake Tahoe)
6 ppm (7 mg/m3)
Non-Dispersive Infrared
Photometry (NDIR) –
None
Non-DispersiveInfrared
Photometry (NDIR)
Annual Arithmetic
Mean
0.03 ppm (57 μg/m3)
0.053 ppm (100 μg/m3) Nitrogen
Dioxide (NO2) 1-Hour 0.18 ppm
(339 μg/m3)
Gas Phase Chemiluminescence
–
Same as Primary Standard
Gas Phase Chemiluminesc
ence
30-day average 1.5 μg/m3 – – –
Calendar Quarter –
Atomic Absorption1.5 μg/m3 Lead
(Pb) h Rolling 3-month
averagei –
0.15 μg/m3
Same as Primary Standard
High-Volume Sampler and
Atomic Absorption
Annual Arithmetic
Mean – 0.030 ppm
(80 μg/m3) –
24-Hour 0.04 ppm (105 μg/m3)
0.14 ppm (365 μg/m3) –
3-Hour – – 0.5 ppm (1300 μg/m3)
Sulfur Dioxide (SO2)
1-Hour 0.25 ppm (655 μg/m3)
Ultraviolet Fluorescence
– –
Spectrophoto-metry
(Pararosaniline Method)
Visibility-Reducing Particles
8-Hour
Extinction coefficient of 0.23 per kilometer - visibility of 10 miles or more (0.07–30 miles or more for Lake Tahoe) due to particles when relative humidity is less than 70 percent. Method: Beta
Attenuation and Transmittance through Filter Tape.
Sulfates 24-Hour 25 μg/m3 Ion Chromatography
Hydrogen Sulfide 1-Hour 0.03 ppm
(42 μg/m3) Ultraviolet
Fluorescence Vinyl
Chlorideh 24-Hour 0.01 ppm (26 μg/m3)
Gas Chromatography
No
Federal
Standards
Table notes on next page.
L S A A S S O C I A T E S , I N C . Y O L O C O U N T Y 2 0 3 0 C O U N T Y W I D E G E N E R A L P L A N E I R A P R I L 2 0 0 9 I V . S E T T I N G , I M P A C T S , A N D M I T I G A T I O N M E A S U R E S D . A I R Q U A L I T Y
P:\CYK0701 Yolo GP EIR\PRODUCTS\DEIR\Public\4d-AirQuality.doc (4/27/09) PUBLIC REVIEW DRAFT 276
a California standards for ozone, carbon monoxide (except Lake Tahoe), sulfur dioxide (1 and 24 hour), nitrogen dioxide, suspended particulate matter—PM10, PM2.5, and visibility reducing particles, are values that are not to be exceeded. All others are not to be equaled or exceeded. California ambient air quality standards are listed in the Table of Standards in Section 70200 of Title 17 of the California Code of Regulations.
b National standards (other than ozone, particulate matter, and those based on annual averages or annual arithmetic mean) are not to be exceeded more than once a year. The ozone standard is attained when the fourth highest eight hour concentration in a year, averaged over three years, is equal to or less than the standard. For PM10, the 24 hour standard is attained when the expected number of days per calendar year with a 24-hour average concentration above 150 μg/m3 is equal to or less than one. For PM2.5, the 24 hour standard is attained when 98 percent of the daily concentrations, averaged over three years, are equal to or less than the standard. Contact U.S. EPA for further clarification and current federal policies.
c Concentration expressed first in units in which it was promulgated. Equivalent units given in parentheses are based upon a reference temperature of 25°C and a reference pressure of 760 torr. Most measurements of air quality are to be corrected to a reference temperature of 25°C and a reference pressure of 760 torr; ppm in this table refers to ppm by volume, or micromoles of pollutant per mole of gas.
d Any equivalent procedure which can be shown to the satisfaction of the CARB to give equivalent results at or near the level of the air quality standard may be used.
e National Primary Standards: The levels of air quality necessary, with an adequate margin of safety to protect the public health.
f National Secondary Standards: The levels of air quality necessary to protect the public welfare from any known or anticipated adverse effects of a pollutant.
g Reference method as described by the EPA. An “equivalent method” of measurement may be used but must have a “consistent relationship to the reference method” and must be approved by the EPA.
h The CARB has identified lead and vinyl chloride as 'toxic air contaminants' with no threshold level of exposure for adverse health effects determined. These actions allow for the implementation of control measures at levels below the ambient concentrations specified for these pollutants.
i National lead standard, rolling 3-month average: final rule signed October 15, 2008. Source: California Air Resources Board, November 2008.
Nitrogen Oxides. Nitrogen dioxide (NO2), a reddish-brown gas, and nitric oxide (NO), a colorless, odorless gas, are formed from fuel combustion under high temperature or pressure. These compounds are referred to as nitrogen oxides, or NOx. NOx is a primary component of the photochemical smog reaction. Nitrogen oxides also contribute to other pollution problems, including a high concentration of fine particulate matter, poor visibility, and acid deposition. NO2 decreases lung function and may reduce resistance to infection.
Sulfur Dioxide. Sulfur dioxide (SO2) is a colorless, irritating gas formed primarily from
incomplete combustion of fuels containing sulfur. Industrial facilities also contribute to gaseous SO2 levels in the region. SO2 irritates the respiratory tract, can injure lung tissue when combined with fine particulate matter, and reduces visibility and the level of sunlight.
Particulate Matter. Particulate matter is the term used for a mixture of solid particles and
liquid droplets found in the air. Coarse particles are those that are larger than 2.5 microns but smaller than 10 microns, or PM10. PM2.5 refers to fine suspended particulate matter with an aerodynamic diameter of 2.5 microns or less that is not readily filtered out by the lungs. Nitrates, sulfates, dust, and combustion particulates are major components of PM10 and PM2.5. These small particles can be directly emitted into the atmosphere as by-products of fuel combustion, through abrasion, such as tire or brake lining wear, or through fugitive dust (wind or mechanical erosion of soil). They can also be formed in the atmosphere through chemical reactions. Particulates may transport carcinogens and other toxic compounds that adhere to the particle surfaces, and can enter the human body through the lungs.
L S A A S S O C I A T E S , I N C . Y O L O C O U N T Y 2 0 3 0 C O U N T Y W I D E G E N E R A L P L A N E I R A P R I L 2 0 0 9 I V . S E T T I N G , I M P A C T S , A N D M I T I G A T I O N M E A S U R E S D . A I R Q U A L I T Y
P:\CYK0701 Yolo GP EIR\PRODUCTS\DEIR\Public\4d-AirQuality.doc (4/27/09) PUBLIC REVIEW DRAFT 277
Lead. Lead is a metal found in the natural environment, as well as in manufactured products. The major sources of lead emissions have historically been mobile and industrial sources. In the past, mobile sources were the main contributor to ambient lead concentrations in the air. With the phase-out of lead in gasoline, other stationary sources, such as metal processing, are currently the primary source of lead emissions. Other stationary sources are waste incinerators, utilities, and lead-acid battery manufacturers.
(2) Regulatory Framework. The U.S. Environmental Protection Agency and CARB regulate direct emissions from motor vehicles. YSAQMD is the regional agency responsible for ensuring healthful air quality in Yolo County and the northeast portion of Solano County. Federal Clean Air Act. The 1970 Federal Clean Air Act authorized the establishment of national health-based air quality standards and also set deadlines for their attainment. The Federal Clean Air Act Amendments of 1990 changed deadlines for attaining national standards as well as the remedial actions required of areas of the nation that exceed the standards. Under the Clean Air Act, State and local agencies in areas that exceed the national standards are required to develop State Implementation Plans to demonstrate how they will achieve the national standards by specified dates. The Clean Air Act requires that all projects receiving federal funds demonstrate conformity to the approved State Implementation Plan and local air quality attainment plan for the region. California Clean Air Act. In 1988, the California Clean Air Act required that all air districts in the State endeavor to achieve and maintain California Ambient Air Quality Standards for carbon monoxide (CO), ozone (O3), sulfur dioxide (SO2) and nitrogen dioxide (NO2) by the earliest practical date. The California Clean Air Act provides districts with authority to regulate indirect sources and mandates that air quality districts focus particular attention on reducing emissions from transportation and area-wide emission sources. Each nonattainment district is required to adopt a plan to achieve a 5 percent annual reduction, averaged over consecutive 3-year periods, in district-wide emissions of each nonattainment pollutant or its precursors. A Clean Air Plan (CAP) shows how a district would reduce emissions to achieve air quality standards. Generally, the State standards for these pollutants are more stringent than the national standards.
Regional Air Quality Management Plans. YSAQMD, in coordination with other air districts in the Sacramento Region (e.g., El Dorado APCD, Feather River AQMD, Placer County APCD, and Sacramento Metropolitan AQMD), prepared and submitted the 1991 Air Quality Attainment Plan (AQAP) in compliance with the requirements set forth in the CCAA. The CCAA also requires a triennial assessment of the extent of air quality improvements and emissions reductions achieved through the use of control measures. As part of the assessment the AQAP must be reviewed and, if necessary, revised to correct for deficiencies in progress and to incorporate new data or projections. The requirement of the CCAA for a first triennial progress report and revision of the 1991 AQAP was fulfilled with the preparation and adoption of the 1994 Ozone Attainment Plan (OAP). The 1994 Sacramento Regional Clean Air Plan was developed cooperatively with all the districts in the Sacramento Region. The Clean Air Plan was adopted in 1994 in compliance with the 1990 Amendments to the Federal Clean Air Act. As a nonattainment area, the region is also required to submit rate-of-progress milestone evaluations in accordance with the CAAA. These milestone reports include compliance demonstrations that the
L S A A S S O C I A T E S , I N C . Y O L O C O U N T Y 2 0 3 0 C O U N T Y W I D E G E N E R A L P L A N E I R A P R I L 2 0 0 9 I V . S E T T I N G , I M P A C T S , A N D M I T I G A T I O N M E A S U R E S D . A I R Q U A L I T Y
P:\CYK0701 Yolo GP EIR\PRODUCTS\DEIR\Public\4d-AirQuality.doc (4/27/09) PUBLIC REVIEW DRAFT 278
requirements have been met for the Sacramento nonattainment area. The AQAPs and reports present comprehensive strategies to reduce ROG, NOX, and PM10 emissions from stationary, area, mobile, and indirect sources. An update to the CAP is currently in progress to address the new 8-hour ozone standard and the associated control strategies that would be required to meet the new standards. In 2004, the Sacramento region was classified as a “serious” 8-hour ozone nonattainment area with an attainment deadline of June 15, 2013. However, the Sacramento region needs to rely on the long-term emission reduction strategies from State and federal mobile source control programs that have not fully realized their emission benefits, and as a result the 2013 attainment date cannot be met. On February 14, 2008, CARB, on behalf of the air districts in the Sacramento region, submitted a letter to EPA requesting a voluntary reclassification (“bump-up”) of the Sacramento Federal Nonattainment Area from a “serious” to a “severe” 8-hour ozone nonattainment area with an extended attainment deadline of June 15, 2019. The air districts in the Sacramento Valley Air Basin (SVAB) will hold public hearings in early 2009 to consider adoption of the Sacramento Regional 8-Hour Ozone Attainment and Reasonable Further Progress Plan. The Plan shows that the region is meeting minimum emission reduction progress and would reach the air quality standard no later than 2018. In addition, the plan makes commitments to adopt and implement new reasonably-available control measures.
Transportation Conformity. Transportation conformity is the federal regulatory process for linking and coordinating transportation and air quality planning. Conformity provisions require that federal funding and approvals be given only to those transportation plans and projects that are consistent with air quality goals specified in the State Implementation Plan (SIP). Regional transportation plans must show that implementation will not harm the region’s goal of attaining the air quality standards. Conformity is demonstrated by estimating motor vehicle emissions and comparing the results to motor vehicle emission budgets established in the SIP. Transportation conformity emission budgets were included in the Sacramento region’s 8-hour ozone rate-of-progress plan for 2008. These motor vehicle emissions budgets were based on transportation modeling conducted by the Sacramento Area Council of Governments that uses land use and socioeconomic data to estimate vehicle miles traveled (VMT), which were then used to estimate emissions using CARB’s improved emission factors. In the March 14, 2006, Federal Register, EPA found that the motor vehicle emissions budgets for 2008 were determined to be adequate for transportation conformity purposes by EPA. Since the requested reclassification, the SVAB has proposed new transportation conformity budgets for the 2011, 2014, and 2017 milestone years, and the 2018 attainment analysis year. The proposed budgets incorporate the recent on-road motor vehicle emission inventory factors of EMFAC 2007, updated travel activity data provided by local and regional agencies, and latest regional and State control strategies. If EPA determines these budgets to be adequate for transportation conformity purposes, future transportation plans will need to conform to these new motor vehicle emissions budgets.
L S A A S S O C I A T E S , I N C . Y O L O C O U N T Y 2 0 3 0 C O U N T Y W I D E G E N E R A L P L A N E I R A P R I L 2 0 0 9 I V . S E T T I N G , I M P A C T S , A N D M I T I G A T I O N M E A S U R E S D . A I R Q U A L I T Y
P:\CYK0701 Yolo GP EIR\PRODUCTS\DEIR\Public\4d-AirQuality.doc (4/27/09) PUBLIC REVIEW DRAFT 279
YSAQMD Rules and Regulations. Relevant YSAQMD rules include but are not limited to the following: • Rule 2-5: Nuisance
o To restrict discharge from any source quantities of air contaminants or other material which cause injury, detriment, nuisance, or annoyance to any considerable number of persons or to the public or which endanger the comfort, repose, health, or safety of any such persons or the public or which cause to have a natural tendency to cause injury or damage to business or property.
• Rule 2-8: Open Burning
o To limit emissions to the atmosphere from open burning.
• Rule 2-11: Particulate Matter
o To limit release or discharge into the atmosphere, from any source, particulate matter in excess of 0.3 grains per cubic foot of exhaust volume as calculated standard conditions.
• Rule 2-14: Architectural Coatings
o To limit the quantity of volatile organic compounds (VOC) in architectural coatings supplied, sold, offered for sale, applied, solicited for application, or manufactured for use within the Yolo-Solano Air Quality Management District (District).
• Rule 2-40: Wood Burning Appliances
o To manage the emissions of particulate matter, carbon monoxide, and other air contaminants from wood burning appliances.
• Rule 3-1: General Permit Requirements
o To provide an orderly procedure for the review of new sources of air pollution and of the modification and operation of existing sources through the issuance of permits.
• Rule 9-9: Asbestos
o To limit the emission of asbestos to the atmosphere and require an appropriate work practice standards and waste disposal procedure.
b. Air Pollution. Air pollution climatology, existing conditions, and local air quality are described below.
(1) Air Pollution Climatology. Air quality is a function of both local climate and local sources of air pollution. Air pollution in Yolo County results from a combination of natural and man-made sources. Natural and man-made sources of air pollution consist of windblown dust, agricultural operations, fires from prescribed burning and agricultural burning, hydrocarbons emitted from natural vegetation, and other pollutants from mobile and stationary sources. The amount of a given pollutant in the atmosphere is determined by the amount of a pollutant released and the atmosphere's ability to transport and dilute the pollutant. The major determinants of transport and dilution are wind, atmospheric stability, terrain, and for photochemical pollutants, sunshine. A region's topographic features have a direct correlation with air pollution flow and therefore are used to determine the boundary of air basins. A local air district is then assigned to each air basin and is responsible for providing air quality strategies to bring the air basin into compliance with the NAAQS. The proposed project is located in the Sacramento Valley Air Basin (SVAB), which encompasses eleven counties including all of Shasta, Tehama, Glenn, Colusa, Butte, Sutter, Yuba, Sacramento, and Yolo Counties, the westernmost portion of Placer County, and the northeastern
L S A A S S O C I A T E S , I N C . Y O L O C O U N T Y 2 0 3 0 C O U N T Y W I D E G E N E R A L P L A N E I R A P R I L 2 0 0 9 I V . S E T T I N G , I M P A C T S , A N D M I T I G A T I O N M E A S U R E S D . A I R Q U A L I T Y
P:\CYK0701 Yolo GP EIR\PRODUCTS\DEIR\Public\4d-AirQuality.doc (4/27/09) PUBLIC REVIEW DRAFT 280
portion of Solano County. The SVAB is bounded by the North Coast Ranges to the west and Northern Sierra Nevada Mountains to the east. The intervening terrain is relatively flat. Hot dry summers and mild rainy winters characterize the Mediterranean climate of the SVAB. During the year the temperature may range from 20 to 115 degrees Fahrenheit, with summer highs usually in the 90s and winter lows occasionally below freezing. Average annual rainfall is approximately 20 inches, with about 75 percent of the rain occurring during the rainy season generally from November through March. The prevailing winds are moderate in strength and vary from moist clean breezes from the south to dry land flows from the north. In general, the prevailing wind in the Sacramento Valley is from the southwest due to marine breezes flowing through the Carquinez Strait. The Carquinez Strait is the major corridor for air moving into the Sacramento Valley from the west. Incoming airflow strength varies daily with a pronounced diurnal cycle. Influx strength is weakest in the morning and increases in the afternoon and evening hours (Delta breeze). The ozone season (May through October) in the Sacramento Valley is characterized by stagnant morning air or light winds with the delta breeze arriving in the afternoon out of the southwest. Usually, the evening breeze transports the airborne pollutants to the north out of the Sacramento Valley. During about half of the days from July to September, however, a phenomenon called the “Schultz Eddy” prevents this from occurring.3 Instead of allowing for the prevailing wind patterns to move north carrying the pollutants out of the valley, the Schultz Eddy causes the wind pattern to circle back south. This phenomenon causes the air pollutants to be blown south toward the Sacramento nonattainment area. The SVAB’s climate and topography contribute to the formation and transport of photochemical pollutants throughout the region. The region experiences temperature inversions that limit atmospheric mixing and trap pollutants, resulting in high pollutant concentrations near the ground surface. Generally, the lower the inversion base height from the ground and the greater the temperature increase from base to top, the more pronounced the inhibiting effect of the inversion will be on pollutant dispersion. Consequently, the highest concentrations of photochemical pollutants occur from late spring to early fall when photochemical reactions are greatest because of more intense sunlight and the lower altitude of daytime inversion layers. Surface inversions (those at altitudes of 0–500 feet above sea level) are most frequent during winter, and subsidence inversions (those at 1,000–2,000 feet above sea level) are most common in summer. Surface or radiation inversions are formed when the ground surface becomes cooler than the air above it during the night. The earth's surface goes through a radiative process on clear nights, where heat energy is transferred from the ground to a cooler night sky. As the earth's surface cools during the evening hours, the air directly above it also cools, while air higher up remains relatively warm. The inversion is destroyed when heat from the sun warms the ground, which in turn heats the lower layers of air; this heating stimulates the ground level air to float up through the inversion layer. Inversions create high surface-level concentrations of pollutants during the autumn and early winter when large high-pressure cells lie over the Sacramento Valley. The combination of stagnant wind conditions and low inversions produces the greatest pollutant concentrations. On days of no inversion or high wind speeds, ambient air pollutant concentrations are
3 Jones & Stokes, 2005. Yolo County General Plan Update Background Report. January.

L S A A S S O C I A T E S , I N C . Y O L O C O U N T Y 2 0 3 0 C O U N T Y W I D E G E N E R A L P L A N E I R A P R I L 2 0 0 9 I V . S E T T I N G , I M P A C T S , A N D M I T I G A T I O N M E A S U R E S D . A I R Q U A L I T Y
P:\CYK0701 Yolo GP EIR\PRODUCTS\DEIR\Public\4d-AirQuality.doc (4/27/09) PUBLIC REVIEW DRAFT 281
lowest. Periods of low inversions and low wind speeds are conditions favorable to high concentrations of CO and PM10. In the winter, the greatest pollution problems are carbon monoxide and PM10 because of extremely low inversions and air stagnation during the night and early morning hours. In the summer, the longer daylight hours and the brighter sunshine combine to cause a reaction between hydrocarbons and oxides of nitrogen to form photochemical smog.
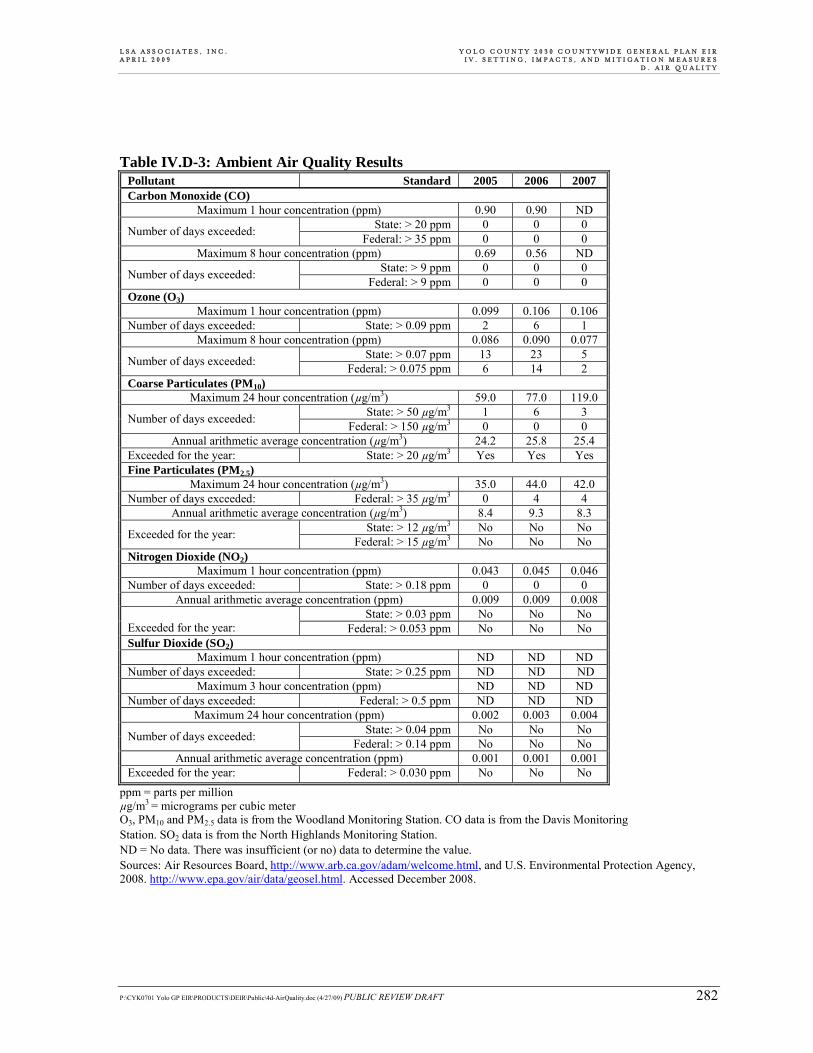
(2) Existing Air Quality Conditions. Air quality monitoring stations are located throughout the nation and maintained by the local air pollution control district and State air quality regulating agencies. Ambient air data collected at permanent monitoring stations are used by the EPA to identify regions as "attainment" or "nonattainment" depending on whether the regions met the requirements stated in the primary NAAQS. Attainment areas are required to maintain their status through moderate, yet effective air quality maintenance plans. Nonattainment areas are imposed with additional restrictions as required by the EPA. In addition, different classifications of attainment such as marginal, moderate, serious, severe, and extreme are used to classify each air basin in the State on a pollutant-by-pollutant basis. Different classifications have different mandated attainment dates and are used as guidelines to create air quality management strategies to improve air quality and comply with the NAAQS by the attainment date. A region is determined to be unclassified when the data collected from the air quality monitoring stations do not support a designation of attainment or nonattainment, due to lack of information, or a conclusion cannot be made with the available data. CARB and YSAQMD monitor air quality at several locations within their jurisdiction in Yolo County and in the SVAB. The closest multi-pollutant monitoring sites are located in Woodland (Gibson Road) and Davis (UC Davis Campus). Monitored pollutants include ozone, CO, PM10, PM2.5, and NO2. SO2 is not monitored within Yolo County; the nearest SO2 monitoring station within the SVAB is located in North Highlands (Blackfoot Way). Air quality trends at these monitoring stations are representative of the ambient air quality in the entire Yolo County region. Thus, the data shown in Table IV.D-3 provide a good characterization of levels of these pollutants within the Draft General Plan area. Table IV.D-3 summarizes pollutant concentrations and exceedances of State and federal standards at these monitoring sites during the period 2005 through 2007. The ambient air quality data show that CO, NO2, and SO2 levels are below relevant State and federal standards. Eight-hour ozone and PM2.5 levels have exceeded State and federal standards during the last three years. PM10 levels have exceeded State standards.
(3) Attainment Status. CARB is required to designate areas of the State as attainment, nonattainment or unclassified for all State standards. An “attainment” designation for an area signifies that pollutant concentrations did not violate the standard for a pollutant in that area. A “nonattain-ment” designation indicates that a pollutant concentration violated the standard, excluding those occasions when a violation was caused by an exceptional event, as defined in the criteria. An “unclassified” designation signifies that data do not support either an attainment or nonattainment status. The California Clean Air Act divides districts into moderate, serious, and severe air pollution categories, with increasingly stringent control requirements mandated for each category.
L S A A S S O C I A T E S , I N C . Y O L O C O U N T Y 2 0 3 0 C O U N T Y W I D E G E N E R A L P L A N E I R A P R I L 2 0 0 9 I V . S E T T I N G , I M P A C T S , A N D M I T I G A T I O N M E A S U R E S D . A I R Q U A L I T Y
P:\CYK0701 Yolo GP EIR\PRODUCTS\DEIR\Public\4d-AirQuality.doc (4/27/09) PUBLIC REVIEW DRAFT 282
Table IV.D-3: Ambient Air Quality Results Pollutant Standard 2005 2006 2007 Carbon Monoxide (CO)
Maximum 1 hour concentration (ppm) 0.90 0.90 ND State: > 20 ppm 0 0 0 Number of days exceeded: Federal: > 35 ppm 0 0 0
Maximum 8 hour concentration (ppm) 0.69 0.56 ND State: > 9 ppm 0 0 0 Number of days exceeded: Federal: > 9 ppm 0 0 0
Ozone (O3) Maximum 1 hour concentration (ppm) 0.099 0.106 0.106
Number of days exceeded: State: > 0.09 ppm 2 6 1 Maximum 8 hour concentration (ppm) 0.086 0.090 0.077
State: > 0.07 ppm 13 23 5 Number of days exceeded: Federal: > 0.075 ppm 6 14 2 Coarse Particulates (PM10)
Maximum 24 hour concentration (µg/m3) 59.0 77.0 119.0 State: > 50 µg/m3 1 6 3 Number of days exceeded: Federal: > 150 µg/m3 0 0 0
Annual arithmetic average concentration (µg/m3) 24.2 25.8 25.4 Exceeded for the year: State: > 20 µg/m3 Yes Yes Yes Fine Particulates (PM2.5)
Maximum 24 hour concentration (µg/m3) 35.0 44.0 42.0 Number of days exceeded: Federal: > 35 µg/m3 0 4 4
Annual arithmetic average concentration (µg/m3) 8.4 9.3 8.3 State: > 12 µg/m3 No No No Exceeded for the year: Federal: > 15 µg/m3 No No No
Nitrogen Dioxide (NO2) Maximum 1 hour concentration (ppm) 0.043 0.045 0.046
Number of days exceeded: State: > 0.18 ppm 0 0 0 Annual arithmetic average concentration (ppm) 0.009 0.009 0.008
State: > 0.03 ppm No No No Exceeded for the year: Federal: > 0.053 ppm No No No Sulfur Dioxide (SO2)
Maximum 1 hour concentration (ppm) ND ND ND Number of days exceeded: State: > 0.25 ppm ND ND ND
Maximum 3 hour concentration (ppm) ND ND ND Number of days exceeded: Federal: > 0.5 ppm ND ND ND
Maximum 24 hour concentration (ppm) 0.002 0.003 0.004 State: > 0.04 ppm No No No Number of days exceeded: Federal: > 0.14 ppm No No No
Annual arithmetic average concentration (ppm) 0.001 0.001 0.001 Exceeded for the year: Federal: > 0.030 ppm No No No
ppm = parts per million µg/m3 = micrograms per cubic meter O3, PM10 and PM2.5 data is from the Woodland Monitoring Station. CO data is from the Davis Monitoring Station. SO2 data is from the North Highlands Monitoring Station. ND = No data. There was insufficient (or no) data to determine the value. Sources: Air Resources Board, http://www.arb.ca.gov/adam/welcome.html, and U.S. Environmental Protection Agency, 2008. http://www.epa.gov/air/data/geosel.html. Accessed December 2008.
L S A A S S O C I A T E S , I N C . Y O L O C O U N T Y 2 0 3 0 C O U N T Y W I D E G E N E R A L P L A N E I R A P R I L 2 0 0 9 I V . S E T T I N G , I M P A C T S , A N D M I T I G A T I O N M E A S U R E S D . A I R Q U A L I T Y
P:\CYK0701 Yolo GP EIR\PRODUCTS\DEIR\Public\4d-AirQuality.doc (4/27/09) PUBLIC REVIEW DRAFT 283
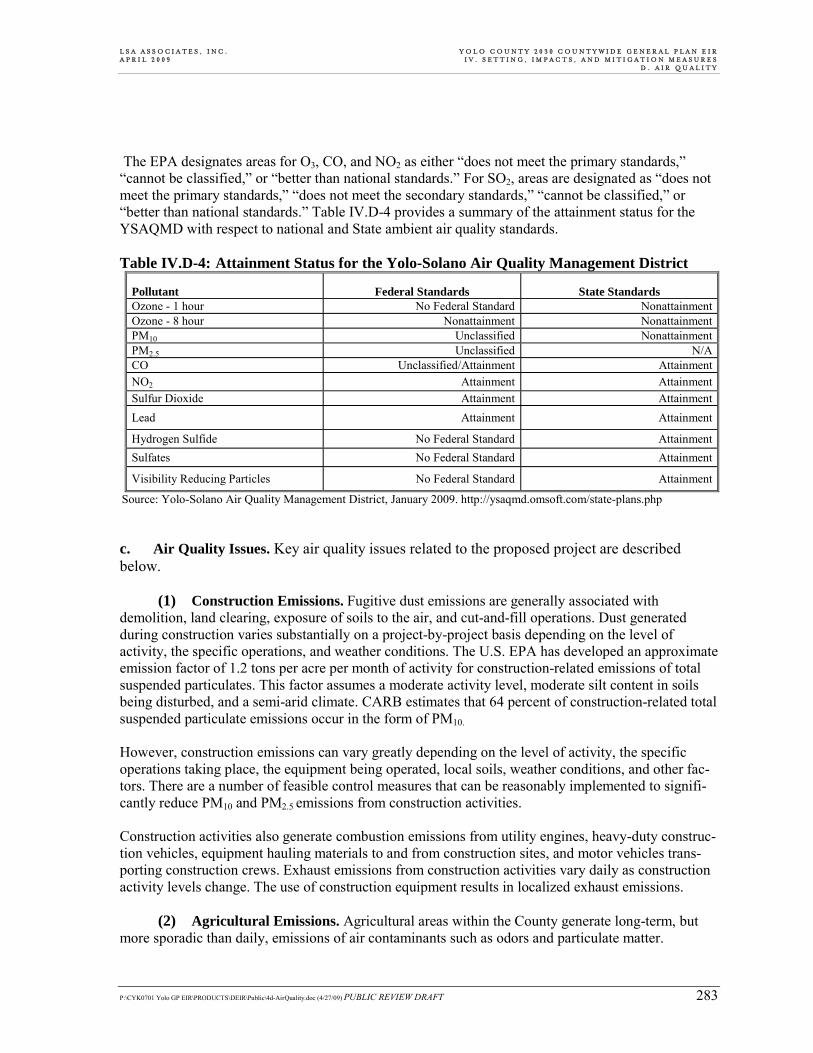
The EPA designates areas for O3, CO, and NO2 as either “does not meet the primary standards,” “cannot be classified,” or “better than national standards.” For SO2, areas are designated as “does not meet the primary standards,” “does not meet the secondary standards,” “cannot be classified,” or “better than national standards.” Table IV.D-4 provides a summary of the attainment status for the YSAQMD with respect to national and State ambient air quality standards. Table IV.D-4: Attainment Status for the Yolo-Solano Air Quality Management District
Pollutant Federal Standards State Standards Ozone - 1 hour No Federal Standard NonattainmentOzone - 8 hour Nonattainment NonattainmentPM10 Unclassified Nonattainment PM2.5 Unclassified N/ACO Unclassified/Attainment AttainmentNO2 Attainment AttainmentSulfur Dioxide Attainment AttainmentLead Attainment Attainment
Hydrogen Sulfide No Federal Standard AttainmentSulfates No Federal Standard Attainment
Visibility Reducing Particles No Federal Standard Attainment Source: Yolo-Solano Air Quality Management District, January 2009. http://ysaqmd.omsoft.com/state-plans.php c. Air Quality Issues. Key air quality issues related to the proposed project are described below.
(1) Construction Emissions. Fugitive dust emissions are generally associated with
demolition, land clearing, exposure of soils to the air, and cut-and-fill operations. Dust generated during construction varies substantially on a project-by-project basis depending on the level of activity, the specific operations, and weather conditions. The U.S. EPA has developed an approximate emission factor of 1.2 tons per acre per month of activity for construction-related emissions of total suspended particulates. This factor assumes a moderate activity level, moderate silt content in soils being disturbed, and a semi-arid climate. CARB estimates that 64 percent of construction-related total suspended particulate emissions occur in the form of PM10. However, construction emissions can vary greatly depending on the level of activity, the specific operations taking place, the equipment being operated, local soils, weather conditions, and other fac-tors. There are a number of feasible control measures that can be reasonably implemented to signifi-cantly reduce PM10 and PM2.5 emissions from construction activities. Construction activities also generate combustion emissions from utility engines, heavy-duty construc-tion vehicles, equipment hauling materials to and from construction sites, and motor vehicles trans-porting construction crews. Exhaust emissions from construction activities vary daily as construction activity levels change. The use of construction equipment results in localized exhaust emissions.
(2) Agricultural Emissions. Agricultural areas within the County generate long-term, but more sporadic than daily, emissions of air contaminants such as odors and particulate matter.
L S A A S S O C I A T E S , I N C . Y O L O C O U N T Y 2 0 3 0 C O U N T Y W I D E G E N E R A L P L A N E I R A P R I L 2 0 0 9 I V . S E T T I N G , I M P A C T S , A N D M I T I G A T I O N M E A S U R E S D . A I R Q U A L I T Y
P:\CYK0701 Yolo GP EIR\PRODUCTS\DEIR\Public\4d-AirQuality.doc (4/27/09) PUBLIC REVIEW DRAFT 284
Agricultural activities that disturb the soil such as land leveling, disking of fields, crop planning, tiling and harvesting all contribute to particulate matter pollution in the region. Additionally, vehicle travel on unpaved farm roads generates particulate and exhaust emissions. Open burning on agricultural lands is also an air quality concern in Yolo County. The YSAQMD has implemented procedures on open burning including enforcement of the Smoke Management Plan (SMP), prohibition of open burning on “Don’t Light Tonight” and “Spare the Air” days, and prohibition of open burning due to fire danger, meteorological conditions such as high winds, temperature inversions, and wet conditions, and during episodic events that have a local impact such as smoke from wildfires. The YSAQMD also limits the ignition of burns from 8:00 a.m. to 5:00 p.m. or one hour prior to sunset whichever is earlier. Due to a combination of legislation, new practices by growers and YSAQMD efforts, there has been a significant decrease in the number of acres burned per year within the YSAQMD jurisdiction since 1992.4
(3) Mining Emissions. Daily and long-term surface mining operations in Yolo County are an additional source of air pollutants. Surface mining activities and mining equipment generate particulate mater. Other sources of pollutants from mining operations include the use of generators operated on natural gas, oil, propane or diesel fuel that release ozone precursor emissions, CO and sulfur dioxide.
(4) Local Carbon Monoxide Hotspots. Local air quality can be affected by CO emissions from motor vehicles. CO is typically a pollutant of concern because it is created in abundance by motor vehicles and it does not readily disperse into the air. Since CO does not readily disperse, areas of vehicle congestion can create pockets of high CO concentration, called “hot spots.” These hot spots have the potential to exceed the State 1-hour standard of 20 ppm and/or the 8-hour standard of 9.0 ppm. While CO transport is limited, it does disperse over time and with distance from the source under normal meteorological conditions. However, under certain meteorological conditions, such as stagnant air or temperature inversions, CO concentrations near congested roadways or intersections may reach unhealthful levels affecting local sensitive receptors (e.g., residents, schoolchildren, the elderly, and hospital patients). Typically, high CO concentrations are associated with roadways or intersections operating at unacceptable levels of service or with extremely high traffic volumes. In areas with high ambient background CO concentration, air quality modeling is needed to determine a project’s effect on local CO levels.
(5) Vehicle Emissions. Long-term air emission impacts are associated with an increases in automobile travel within and around the County over time. Mobile source emissions would result from vehicle trips associated with increased vehicular travel. As is true throughout much of the U.S., motor vehicle use is projected to increase substantially in the region. The YSAQMD, local jurisdictions, and other parties responsible for protecting public health and welfare are continually seeking ways of minimizing the air quality impacts of growth and development in order to avoid further exceedances of the standards.
4 Yolo-Solano AQMD, 2009. http://www.ysaqmd.org. March 30.

L S A A S S O C I A T E S , I N C . Y O L O C O U N T Y 2 0 3 0 C O U N T Y W I D E G E N E R A L P L A N E I R A P R I L 2 0 0 9 I V . S E T T I N G , I M P A C T S , A N D M I T I G A T I O N M E A S U R E S D . A I R Q U A L I T Y
P:\CYK0701 Yolo GP EIR\PRODUCTS\DEIR\Public\4d-AirQuality.doc (4/27/09) PUBLIC REVIEW DRAFT 285
(6) Toxic Air Contaminants. In addition to the criteria pollutants, Toxic Air Contaminants (TACs) are another group of pollutants of concern. TACs are injurious in small quantities and are regulated by the U.S. EPA and CARB. Some examples of TACs include: benzene, butadiene, formaldehyde, and hydrogen sulfide. The identification, regulation, and monitoring of TACs is relatively recent compared to that for criteria pollutants. In 1998, CARB identified particulate matter from diesel-fueled engines as a toxic air contaminant. CARB completed a risk management process that identified potential cancer risks for a range of activities using diesel-fueled engines.5 High volume freeways, stationary diesel engines, and facilities attracting heavy and constant diesel vehicle traffic (e.g., distribution centers and truck stops) were identified as posing the highest risk to adjacent receptors. Other facilities associated with increased risk include warehouse distribution centers, large retail or industrial facilities, high volume transit centers, and schools with a high volume of bus traffic. Health risks from TACs are a function of both concentration and duration of exposure.
(7) Odors. Odors are also an important element of local air quality conditions. While odors rarely cause any physical harm, they still can be unpleasant, leading to distress among the public and generating citizen complaints to local governments and the YSAQMD. Specific land uses (e.g., landfills, manufacturing plants, and some agricultural processing and other operations) can raise concerns on the part of nearby neighbors. The occurrence and severity of odor impacts depends on numerous factors, including the nature, frequency, and intensity of the source; wind speed and direction; and the sensitivity of the receptor(s). Sources that generate objectionable odors must comply with applicable air quality regulations.
(8) Greenhouse Gas Emissions. See discussion in Section IV.F. Climate Change. 2. Draft 2030 Countywide General Plan for Yolo County
The Draft General Plan provides a guide for future development and land uses in Yolo County through 2030 and identifies community priorities and values to guide public decision-making for the County. The following are Draft General Plan policies and actions related to air quality:
Circulation Element
• Policy CI-1.2 : Preserve and continue to develop a fully-connected grid-based circulation system that distributes traffic evenly and avoids excessive concentrations of traffic in any given area.
• Policy CI-1.3: Reduce the total vehicle miles of travel (VMT) per household by making efficient use of existing transportation facilities and by providing for more direct routes for pedestrians and bicyclists through the implementation of “smart growth” and sustainable planning principles.
• Policy CI-2.2 : Encourage employers (including the County) to provide transit subsidies, bicycle facilities, alternative work schedules, ridesharing, telecommuting and work-at-home programs, employee education and preferential parking for carpools/vanpools.
• Policy CI-2.3: Ensure that, wherever feasible, public transit and alternative mode choices are a viable and attractive alternative to the use of single-occupant motor vehicles.
5 California Air Resources Board, 2000. Risk Reduction Plan to Reduce Particulate Matter Emissions from
Diesel-Fueled Engines and Vehicles. October.
L S A A S S O C I A T E S , I N C . Y O L O C O U N T Y 2 0 3 0 C O U N T Y W I D E G E N E R A L P L A N E I R A P R I L 2 0 0 9 I V . S E T T I N G , I M P A C T S , A N D M I T I G A T I O N M E A S U R E S D . A I R Q U A L I T Y
P:\CYK0701 Yolo GP EIR\PRODUCTS\DEIR\Public\4d-AirQuality.doc (4/27/09) PUBLIC REVIEW DRAFT 286
• Policy CI-2.4: The comfort, convenience, and safety of bicyclists and pedestrians are as important as, and should be balanced to the greatest feasible extent with, those same values for drivers.
• Policy CI-3.1: Maintain Level of Service (LOS) C or better for roadways and intersections in the unincorporated county. In no case shall land use be approved that would either result in worse than LOS C conditions, or require additional improvements to maintain the required level of service, except as specified below. The intent of this policy is to consider level of service as a limit on the capacity of the County’s roadways.
• Policy CI-3.5: Establish and implement additional programs to maintain established levels of service at intersections and along roadway segments as circumstances warrant, including the following:
o Collect and analyze traffic volume data and monitor current intersection and roadway segment levels of service on a regular basis. Use this information to update and refine the Yolo County General Plan travel-forecasting model so that estimates of future conditions are based upon local travel behavior and trends.
o Consider, on a case-by-case basis, how to shift travel demand away from the peak period, especially in those situations where peak traffic problems result from a few major generators (e.g. outlying employment locations).
o Perform routine, ongoing evaluation of the efficiency of the urban street traffic control system; with emphasis on traffic signal timing, phasing and coordination to optimize traffic flow along arterial corridors. Use traffic control systems to increase traffic efficiency (e.g. timing and phasing for turn movements, peak period and off-peak signal timing plans).
• Policy CI-3.6: Incorporate the concept of “complete” streets, which requires more complete consideration of all users of the street. Develop roadway cross-sections for community and rural areas, addressing the following factors as applicable: number of travel lanes, lane width, medians, drainage control, shoulder width, parking lanes, bike lanes, fire and emergency response standards, curb and gutter design, landscaped strip and sidewalk width. In general it is intended that roadway cross-sections in the county be as narrow as possible (particularly in community areas) while still meeting recommended safety standards, the requirements of the General Plan, and the needs of users.
• Policy CI-3.8: Encourage development that is compact, so as to promote the efficient use of existing transportation facilities consistent with Policy CI-3.1.
• Policy CI-4.1: Avoid or mitigate environmental impacts from the construction and/or operation of the transportation system.
• Policy CI-4.2: Support regional air quality and greenhouse gas objectives through effective management of the county’s transportation system.
• Policy CI-4.3: Reduce dependence upon fossil fuels through:
o Reduction of vehicle trips and vehicle miles traveled by requiring compact, infill and mixed use development.
o Use of alternatives to the drive-alone automobile, including walking, bicycling and public transit.
o Use of vehicles powered by renewable/alternative fuel sources.
o Local street designs that encourage pedestrian and bicycle use and discourage high speed traffic.
o Street designs that support/enhance access between neighborhoods and to neighborhood-based commercial developments.
o Promotion of ride sharing and car sharing programs.
o Use of LED traffic lights.

L S A A S S O C I A T E S , I N C . Y O L O C O U N T Y 2 0 3 0 C O U N T Y W I D E G E N E R A L P L A N E I R A P R I L 2 0 0 9 I V . S E T T I N G , I M P A C T S , A N D M I T I G A T I O N M E A S U R E S D . A I R Q U A L I T Y
P:\CYK0701 Yolo GP EIR\PRODUCTS\DEIR\Public\4d-AirQuality.doc (4/27/09) PUBLIC REVIEW DRAFT 287
o Encourage development of the infrastructure necessary to support clean alternative fuel vehicles and electric vehicles.
o Emerging technologies related to goods movement activities at truck stops, loading terminals, airports and rail facilities.
• Policy CI-4.4 : Support and encourage low emission or non-polluting forms of transportation. �Policy CO-6.1: Improve air quality through land use planning decisions.
• Policy CI-5.1: Work with local and regional agencies to implement a regional bikeway and/or alternative energy vehicle system that connects the cities, larger unincorporated communities and scenic areas. Implement a dedicated multi-purpose bikeway between Woodland and Davis as a part of this effort.
• Policy CI-5.2 : Create a complete bikeway and sidewalk system within each community, including the completion of existing systems. Create walkways and bikeways that connect existing paths where feasible, and that connect to grocery stores, parks, and other community features.
• Policy CI-5.4 : Establish a looped off-street trail system in each community.
• Policy CI-5.5: Integrate bicycle, pedestrian and transit facilities into new developments.
• Policy CI-5.6 : Establish a network of off-street multi-purpose trails countywide and encourage their use for commute, recreational and other trips.
• Policy CI-5.8 : Include sidewalks and bikeways on newly constructed or modified bridges and overpasses, where feasible.
• Policy CI-5.9 : Strive to incorporate bikeways and sidewalks with modifications or upgrades to existing roadways consistent with the Bicycle Transportation Plan.
• Policy CI-5.10: Institute requirements for the establishment and maintenance of extensive tree canopy over community roadways to create shade.
• Policy CI-5.11: Protect abandoned rail corridors for re-use as trails and other forms of alternative transportation.
• Policy CI-5.12: Support development of facilities that link bicyclists and pedestrians with other modes of transportation.
• Policy CI-5.13: Establish pedestrian areas in conjunction with the development, redevelopment and design of mixed-use neighborhoods, schools, parks and community downtowns. Incorporate the following minimum design elements into pedestrian areas:
o Intersection bulb-outs to reduce walking distances across streets.
o Pedestrian facilities at all signalized intersection approaches, including mid-street refuges, where appropriate.
o Vertical curbs, detached sidewalks and tree-lined streets.
o Adequate lighting for bicycle and pedestrian access.
o Wide sidewalks in downtown areas that allow for multiple uses, including outdoor dining.
o Grid-based street pattern.
o Community entry points (gateways).
o Bicycle and pedestrian connections from cul-de-sacs to adjacent streets.
• Policy CI-5.14: Strive to ensure that bikeway and sidewalk networks within communities are at least as efficient (e.g. miles traveled, connectivity, etc.) as the network for motorists.

L S A A S S O C I A T E S , I N C . Y O L O C O U N T Y 2 0 3 0 C O U N T Y W I D E G E N E R A L P L A N E I R A P R I L 2 0 0 9 I V . S E T T I N G , I M P A C T S , A N D M I T I G A T I O N M E A S U R E S D . A I R Q U A L I T Y
P:\CYK0701 Yolo GP EIR\PRODUCTS\DEIR\Public\4d-AirQuality.doc (4/27/09) PUBLIC REVIEW DRAFT 288
• Policy CI-5.15: Develop and design a system of bikeways and sidewalks that promote safe bicycle riding and walking for transportation and recreation, with particular emphasis on establishing a network of safe routes from residential areas to schools.
• Policy CI-5.16: Construct and maintain bikeways and sidewalks in a manner that minimizes conflicts between bicyclists, pedestrians and motorists.
• Policy CI-6.1: Ensure that residents of unincorporated communities have convenient transit service to employment centers, county service centers, other government centers including the courts and other regional destinations, as funding allows. Work with YCTD to provide fixed route and/or commuter bus service as appropriate.
• Policy CI-6.2 : Require new development to situate transit stops and hubs at locations that are convenient and accessible to transit users based on coordination with YCTD.
• Policy CI-6.3 : Require the design of transit stops and hubs to include upgraded amenities such as sheltered stops, benches and lighting based on coordination with YCTD.
• Policy CI-6.4 : Support convenient and efficient public transportation to workplaces, government services, shopping and other destinations.
• Policy CI-6.5 : Integrate transit stops into new residential and employment center developments.
• Policy CI-6.6: Support YCTD in establishing, expanding and improving a balanced public transportation system, integrated with Sacramento Regional Transit.
• Policy CI-6.7 : Support multi-modal stations at appropriate locations to integrate transit with other transportation modes.
• Policy CI-6.8 : Work with regional leadership to ensure the continued development of a regional transit system, including coordination with SACOG, YCTD, and the cities of Yolo County, in updating regional transit plans.
• Policy CI-6.9 : Encourage the development of facilities for convenient transfers between transportation systems (e.g. rail-to-bus, bus-to-bus).
• Policy CI-6.10: Coordinate and encourage Caltrans and YCTD to identify and implement park-and-ride sites with convenient access to public transit.
• Policy CI-6.11: Require new development to include design elements that promote transit use, such as:
o Locating sheltered bus stops near neighborhood focal points.
o Locating transit routes on streets serving medium-high density development whenever feasible.
o Linking neighborhoods to bus stops through continuous bikeways and sidewalks.
o Providing direct bicycle and pedestrian access to transit stops, park-and-ride lots, alternative fuel stations, bicycle racks, train access (e.g. Dunnigan, Yolo and Zamora), public docks for water taxis (Clarksburg, Elkhorn and Knights Landing) and airport shuttles (Elkhorn).
• Policy CI-6.12: Encourage YCTD to implement future express bus, light rail, rapid transit, commuter rail, or other transit services if development densities occur to support such service.
Conservation and Open Space Element
• Policy CO-6.1: Improve air quality through land use planning decisions.
• Policy CO-6.2: Support local and regional air quality improvement efforts.
• Policy CO-6.3: Encourage employers to increase telecommuting, telepresence, provide bicycle facilities, and enhance access to public transit for employees.
L S A A S S O C I A T E S , I N C . Y O L O C O U N T Y 2 0 3 0 C O U N T Y W I D E G E N E R A L P L A N E I R A P R I L 2 0 0 9 I V . S E T T I N G , I M P A C T S , A N D M I T I G A T I O N M E A S U R E S D . A I R Q U A L I T Y
P:\CYK0701 Yolo GP EIR\PRODUCTS\DEIR\Public\4d-AirQuality.doc (4/27/09) PUBLIC REVIEW DRAFT 289
• Policy CO-6.4: Engage the public in efforts to increase awareness of the health risks associated with air pollution and to take voluntary actions that reduce emissions.
• Policy CO-6.5: Encourage community participation in air quality planning.
• Policy CO-6.6: Encourage implementation of Best Management Practices to reduce emissions and control dust during construction activities.
• Policy CO-6.7: Pursue legislation to assist farming operations with permitting bio-energy operations.
• Action CO-A101: Implement the guidelines of the Transportation and Land Use Toolkit, developed by the Yolo-Solano Air Quality Management District (YSAQMD). (Policy CO-6.1, Policy CO-6.2)
• Action CO-A102: Require development proposals that introduce sources of toxic air pollutants to prepare a health risk assessment and, based on the results of the assessment, establish appropriate land use buffer zones around those uses posing substantial health risks. (Policy CO-6.1)
• Action CO-A103: For discretionary permits, require agricultural Best Management Practices regarding odor control, stormwater drainage, and fugitive dust control where appropriate. (Policy CO 6.1)
• Action CO-A104: Implement the regulations and programs established by the YSAQMD to bring local air quality into attainment with State and federal standards. (Policy CO-6.1, Policy CO-6.2)
• Action CO-A105: Coordinate air quality planning efforts with other local, regional and State agencies. (Policy CO-6.1, Policy CO-6.2)
• Action CO-A106: Regulate the location and operation of land uses to avoid or mitigate harmful or nuisance levels of air emissions to the following sensitive receptors: residentially designated land uses, hospitals and nursing/convalescent homes, hotels and lodging, schools and day care centers and neighborhood parks. (Policy CO-6.1, Policy CO-6.2)
• Action CO-A107: Establish additional air quality monitoring stations in consultation with the YSAQMD, where appropriate. (Policy CO-6.1, Policy CO-6.4)
• Action CO-A108: Prohibit wood-burning fireplaces in new residential developments. (Policy CO-6.1)
3. Impacts and Mitigation Measures
This section provides an assessment of the potential air quality impacts related to growth allowed under build-out of the Draft General Plan. It establishes the thresholds of significance for impacts and then evaluates the effects related to build-out of the Draft General Plan. Where potentially significant impacts of the proposed project are identified, mitigation measures are recommended. a. Significance Criteria. The Draft General Plan would have a significant air quality impact if it would: • Violate applicable air quality standards or contribute substantially to an existing or projected air
quality violation;
• Exceed the following thresholds established by the Yolo-Solano Air Quality Management District that apply to both the construction and operational phases:
o Contributing to CO concentrations exceeding the State ambient air quality standards of 9 ppm averaged over 8 hours and 20 ppm for 1 hour; or
o Generating criteria air pollutant emissions of ROG or NOx in excess of 10 tons per year, or PM10 in excess of 80 pounds per day;
L S A A S S O C I A T E S , I N C . Y O L O C O U N T Y 2 0 3 0 C O U N T Y W I D E G E N E R A L P L A N E I R A P R I L 2 0 0 9 I V . S E T T I N G , I M P A C T S , A N D M I T I G A T I O N M E A S U R E S D . A I R Q U A L I T Y
P:\CYK0701 Yolo GP EIR\PRODUCTS\DEIR\Public\4d-AirQuality.doc (4/27/09) PUBLIC REVIEW DRAFT 290
• Result in human exposure to toxic air contaminants (TAC) in excess of applicable thresholds;
• Create objectionable odors affecting a substantial number of people;
• Conflict with or obstruct implementation of the applicable air quality plans including, but not limited to, the 1992 Air Quality Attainment Plan, 2003 Triennial Assessment and Plan Update, and the 2006 Sacramento Regional Nonattainment Area 8-Hour Ozone Rate-of-Progress Plan;
• Substantially conflict with applicable plans, policies, and regulations of other agencies where such conflict would result in an adverse physical change in the environment;
• Result in a cumulative air quality impact;
• Result in new policies that would result in significant adverse physical impacts as compared to the 1983 General Plan policies.
b. Impacts Analysis. The following section provides an evaluation and analysis for the potential impacts of the Draft General Plan for each of the criteria of significance listed above.
(1) Violate Applicable Air Quality Standards. Air quality impacts would occur during the construction of individual development projects allowed by the Draft General Plan. Air pollutant emissions would be generated over the short-term from construction activities such as fugitive dust from demolition, site preparation, and grading as well as emissions from equipment exhaust and architectural coatings.
Impact AIR-1: Build-out of the Draft General Plan could result in construction-related emissions that exceed the YSAQMD thresholds of significance for criteria pollutants. (S)
Demolition and renovation of buildings can generate PM10 emissions and is of particular concern if the building(s) contain any asbestos-bearing materials. The demolition, renovation, or removal of asbestos-containing materials is subject to the limitations of YSAQMD Rule 9.9 – Asbestos and the National Emissions Standards for Hazardous Air Pollutants (NESHAP) regulations as listed in the Code of Federal Regulations requiring notification and inspection. Most demolitions and many renovations are subject to an asbestos inspection prior to the start of activity. Strict compliance with existing asbestos regulations will normally prevent asbestos from being considered a significant adverse impact (see discussion in Section IV.M, Hazards and Hazardous Materials). In addition to the dust created during demolition and site preparation for construction, substantial dust emissions could be created as debris and soil are loaded into trucks for disposal. Construction activities from vehicles and equipment would generate exhaust, fugitive particulate matter, and organic gas emissions that would also affect local air quality. Solvents in adhesives, non-water-based paints, thinners, and some insulating and caulking materials would evaporate into the atmosphere and would participate in the photochemical reaction that creates urban ozone. Asphalt used in paving is also a source of organic gases for a short time after its application. Effects of project-related construction activities would include increased dustfall and locally-elevated levels of PM10 downwind of construction activity. Construction dust could be generated at levels that would create an annoyance to nearby properties. In addition to particulate emissions from earthmoving, air pollutants also would be emitted in the exhaust of construction equipment. To minimize this impact, prolonged idling of construction

L S A A S S O C I A T E S , I N C . Y O L O C O U N T Y 2 0 3 0 C O U N T Y W I D E G E N E R A L P L A N E I R A P R I L 2 0 0 9 I V . S E T T I N G , I M P A C T S , A N D M I T I G A T I O N M E A S U R E S D . A I R Q U A L I T Y
P:\CYK0701 Yolo GP EIR\PRODUCTS\DEIR\Public\4d-AirQuality.doc (4/27/09) PUBLIC REVIEW DRAFT 291
vehicles should be restricted and all construction equipment should be properly tuned and fitted with manufacturer’s standard exhaust controls. The YSAQMD has established quantitative thresholds of significance for construction-related emissions for ROG and NOx of 10 tons per year and PM10 of 80 pounds per day. Build-out of the Draft General Plan, including residential, commercial and industrial uses, will result in project-related construction emissions. A precise construction schedule is not possible to determine at the level of detail available in the Draft General Plan. Individual project development schedules are subject to a variety of conditions, including project funding, market conditions, and permit and project approvals. These schedules and estimates may change as activity levels are updated in the future. The information provided in Table IV.D-5 is based on a scenario that assumes General Plan development will occur equally over 22 years (i.e., 1/22th of the total development occurs in each year with equal construction phasing in each year). This assumption was made for purposes of this analysis; however total build-out may not occur by 2030 due to market conditions and based on past trends. PM10 emitted during construction can vary greatly depending on the level of activity, the specific operations taking place, the equipment being operated, and other factors, which creates uncertainties in the quantification of these emissions. While these are only initial estimates of the construction schedule, the estimates indicate that construction-related activities can result in emissions that exceed the thresholds established by the YSAQMD. Draft General Plan Policy CO-6.6 is designed to reduce construction-related emissions by encouraging implementation of Best Management Practices during construction activities. However, this policy does not require implementation of all practices that would reduce construction-related fugitive dust and equipment exhaust emissions. Construction-related emissions associated with new development under the Draft General Plan would thus be considered a significant impact. YSAQMD recommends that the Lead Agency determine feasibility and incorporate the following construction dust control measures and additional strategies where appropriate:
• Water all active construction areas at least twice daily.
• Haul trucks shall maintain at least two feet of freeboard.
• Cover all trucks hauling soil, sand, and other loose materials.
• Apply non-toxic binders (e.g., latex acrylic copolymer) to exposed areas after cut-and-fill operations and hydroseed area.
• Apply chemical soil stabilizers on inactive construction areas (disturbed lands within construction projects that are unused for at least four consecutive days).
Table IV.D-5: Summary of Estimated Construction-Related Emissions
ROG
(tons/year) NOx
(tons/year) PM10
(pounds/day) Annual Construction Emissions
31.8 21.8 1,221.2
YSAQMD Significance Threshold
10.0 tons/year
10.0 tons/year
80.0 pounds/day
Note: Emissions estimated using the URBEMIS 2007 (v9.2.4) computer model. Source: LSA Associates, 2009

L S A A S S O C I A T E S , I N C . Y O L O C O U N T Y 2 0 3 0 C O U N T Y W I D E G E N E R A L P L A N E I R A P R I L 2 0 0 9 I V . S E T T I N G , I M P A C T S , A N D M I T I G A T I O N M E A S U R E S D . A I R Q U A L I T Y
P:\CYK0701 Yolo GP EIR\PRODUCTS\DEIR\Public\4d-AirQuality.doc (4/27/09) PUBLIC REVIEW DRAFT 292
• Plant tree windbreaks on the windward perimeter of construction projects if adjacent to open land.
• Plant vegetative ground cover in disturbed areas as soon as possible.
• Cover inactive storage piles.
• Sweep streets if visible soil material is carried out from the construction site.
• Treat accesses to a distance of 100 feet from the paved road with a 6 to 12 inch layer of wood chips or mulch.
• Treat accesses to a distance of 100 feet from the paved road with a 6-inch layer of gravel. Additional strategies to mitigate construction equipment exhaust include restricting unnecessary vehicle idling to 5 minutes, using reformulated and emulsified fuels, incorporating catalyst and filtration technologies, and modernizing the equipment fleet with cleaner repower and newer engines, among others. Implementation of the following mitigation measure would reduce Draft General Plan impacts related to construction-related emissions to the extent feasible.
Mitigation Measure AIR-1: Amend the Draft General Plan Policy CO-6.6 as follows: Policy CO-6.6: Encourage implementation of YSAQMD Best Management Practices
including those listed below to reduce emissions and control dust during construction activities.
• Water all active construction areas at least twice daily.
• Haul trucks shall maintain at least two feet of freeboard.
• Cover all trucks hauling soil, sand, and other loose materials.
• Apply non-toxic binders (e.g., latex acrylic copolymer) to exposed areas after cut-and-fill operations and hydroseed area.
• Apply chemical soil stabilizers on inactive construction areas (disturbed lands within construction projects that are unused for at least four consecutive days).
• Plant tree windbreaks on the windward perimeter of construction projects if adjacent to open land.
• Plant vegetative ground cover in disturbed areas as soon as possible.
• Cover inactive storage piles.
• Sweep streets if visible soil material is carried out from the construction site.
• Treat accesses to a distance of 100 feet from the paved road with a 6 to 12 inch layer of wood chips or mulch.
• Treat accesses to a distance of 100 feet from the paved road with a 6-inch layer of gravel.
L S A A S S O C I A T E S , I N C . Y O L O C O U N T Y 2 0 3 0 C O U N T Y W I D E G E N E R A L P L A N E I R A P R I L 2 0 0 9 I V . S E T T I N G , I M P A C T S , A N D M I T I G A T I O N M E A S U R E S D . A I R Q U A L I T Y
P:\CYK0701 Yolo GP EIR\PRODUCTS\DEIR\Public\4d-AirQuality.doc (4/27/09) PUBLIC REVIEW DRAFT 293
According to the YSAQMD, the effectiveness of the construction dust mitigation measures range from 50 to 90 percent. Equipment exhaust mitigation is also not 100 percent effective, therefore even with implementation of Mitigation Measure AIR-1, implementation of the Draft General Plan may still result in construction emissions that exceed the significance criteria established by the YSAQMD, and therefore this impact is considered to be significant and unavoidable. (SU)
(2) Exceed Carbon Monoxide, Reactive Organic Gases, or Nitrogen Oxide Thresholds.
Two thresholds were established by YSAQMD to evaluate air quality for construction and operation of new development:
• Contributing to CO concentrations exceeding the State ambient air quality standards of 9 ppm averaged over 8 hours and 20 ppm for 1 hour; or
• Generating criteria air pollutant emissions of ROG or NOx in excess of 10 tons per year, or PM10 in excess of 80 pounds per day.
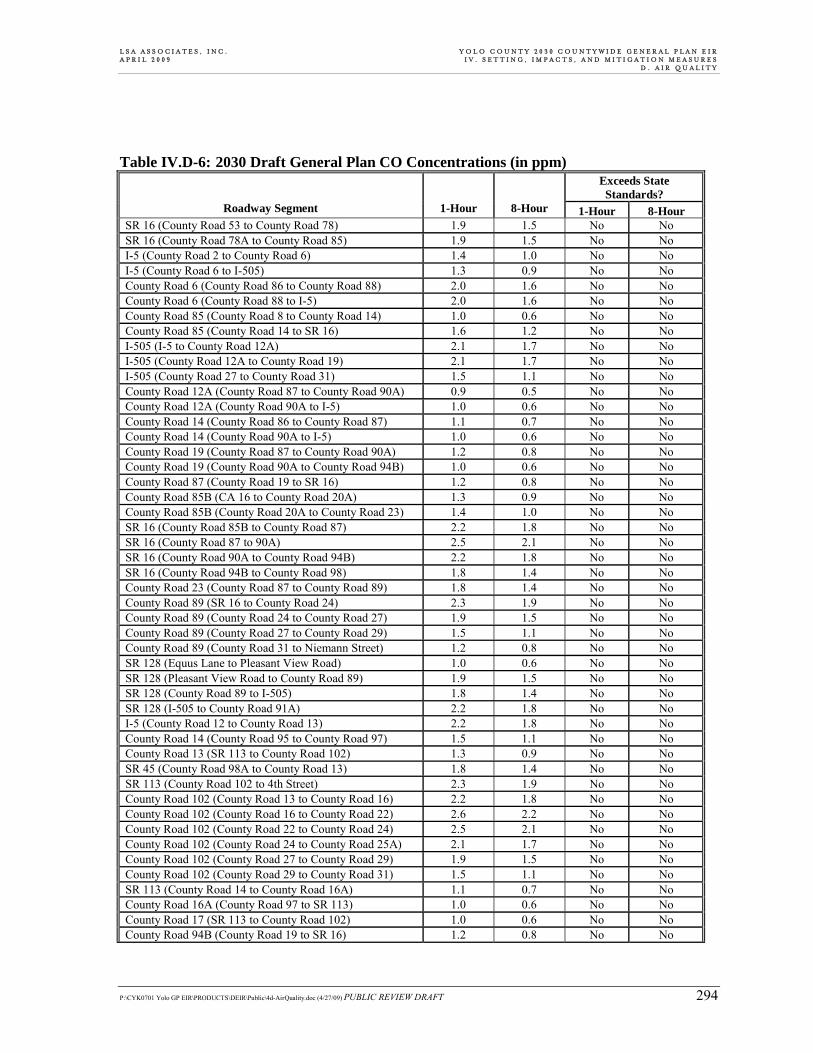
Potential impacts are discussed separately below for each of these thresholds. Contribute to CO Concentrations Exceeding 1- and 8-hour Standards. Vehicular traffic associated with the build-out of the Draft General Plan would emit carbon monoxide (CO) into the air along roadway segments and near intersections. As previously described, areas of vehicle congestion can create pockets of high CO concentrations, called “hot spots,” affecting local sensitive receptors (e.g., residents, school children, the elderly, and hospital patients). High CO concentrations are typically associated with roadways or intersections operating with extremely high traffic volumes. According to YSAQMD, streets and intersections operating at LOS E and F have the “potential” to create a violation of the CO standard. Policies CI-3.1 and CI-3.2 establish LOS E and F as acceptable standards on a number of specific roadway segments. Other policies such as CI-1.2, CI-3.1, CA-3.5, CI-4.2, CO-6.1, and CO-6.2 are designed to affect roadway levels of service by distributing traffic evenly, avoiding excessive concentrations of traffic establishing and implementing additional programs to maintain appropriate levels of service at intersections and along roadway segments, supporting regional air quality and greenhouse gas objectives, and improving air quality through land use planning decisions. Action CO-A104 seeks to implement YSAQMD’s regulations and programs to bring local air quality into State and federal attainment. Even with these Draft General Plan policies and actions, however, vehicular traffic on roadways would contribute to air emissions that could exceed standards. Yolo County is currently an attainment area for State and federal carbon monoxide air quality standards. Monitoring data at the Woodland station indicate that CO concentrations, even in the incorporated areas of Yolo County, are currently less than 10 percent of the State standard and projected to decline over time. A screening analysis of the 2030 CO concentrations was performed to determine CO levels for primary Yolo County roadways. The results of the analysis are shown in Table IV.D-6. Results indicate that growth allowed under the Draft General Plan and associated vehicular emissions are not expected to result in any CO concentrations exceeding the 1-hour or 8-hour State CO standards. Roadway-related CO concentrations would in fact be well below State standards and would not exceed standards even with increased traffic in 2030. As a result, any impacts to air quality as measured by the 1- and 8-hour standards for CO concentrations would be less-than-significant.
L S A A S S O C I A T E S , I N C . Y O L O C O U N T Y 2 0 3 0 C O U N T Y W I D E G E N E R A L P L A N E I R A P R I L 2 0 0 9 I V . S E T T I N G , I M P A C T S , A N D M I T I G A T I O N M E A S U R E S D . A I R Q U A L I T Y
P:\CYK0701 Yolo GP EIR\PRODUCTS\DEIR\Public\4d-AirQuality.doc (4/27/09) PUBLIC REVIEW DRAFT 294
Table IV.D-6: 2030 Draft General Plan CO Concentrations (in ppm)Exceeds State Standards?
Roadway Segment 1-Hour 8-Hour 1-Hour 8-Hour SR 16 (County Road 53 to County Road 78) 1.9 1.5 No No SR 16 (County Road 78A to County Road 85) 1.9 1.5 No No I-5 (County Road 2 to County Road 6) 1.4 1.0 No No I-5 (County Road 6 to I-505) 1.3 0.9 No No County Road 6 (County Road 86 to County Road 88) 2.0 1.6 No No County Road 6 (County Road 88 to I-5) 2.0 1.6 No No County Road 85 (County Road 8 to County Road 14) 1.0 0.6 No No County Road 85 (County Road 14 to SR 16) 1.6 1.2 No No I-505 (I-5 to County Road 12A) 2.1 1.7 No No I-505 (County Road 12A to County Road 19) 2.1 1.7 No No I-505 (County Road 27 to County Road 31) 1.5 1.1 No No County Road 12A (County Road 87 to County Road 90A) 0.9 0.5 No No County Road 12A (County Road 90A to I-5) 1.0 0.6 No No County Road 14 (County Road 86 to County Road 87) 1.1 0.7 No No County Road 14 (County Road 90A to I-5) 1.0 0.6 No No County Road 19 (County Road 87 to County Road 90A) 1.2 0.8 No No County Road 19 (County Road 90A to County Road 94B) 1.0 0.6 No No County Road 87 (County Road 19 to SR 16) 1.2 0.8 No No County Road 85B (CA 16 to County Road 20A) 1.3 0.9 No No County Road 85B (County Road 20A to County Road 23) 1.4 1.0 No No SR 16 (County Road 85B to County Road 87) 2.2 1.8 No No SR 16 (County Road 87 to 90A) 2.5 2.1 No No SR 16 (County Road 90A to County Road 94B) 2.2 1.8 No No SR 16 (County Road 94B to County Road 98) 1.8 1.4 No No County Road 23 (County Road 87 to County Road 89) 1.8 1.4 No No County Road 89 (SR 16 to County Road 24) 2.3 1.9 No No County Road 89 (County Road 24 to County Road 27) 1.9 1.5 No No County Road 89 (County Road 27 to County Road 29) 1.5 1.1 No No County Road 89 (County Road 31 to Niemann Street) 1.2 0.8 No No SR 128 (Equus Lane to Pleasant View Road) 1.0 0.6 No No SR 128 (Pleasant View Road to County Road 89) 1.9 1.5 No No SR 128 (County Road 89 to I-505) 1.8 1.4 No No SR 128 (I-505 to County Road 91A) 2.2 1.8 No No I-5 (County Road 12 to County Road 13) 2.2 1.8 No No County Road 14 (County Road 95 to County Road 97) 1.5 1.1 No No County Road 13 (SR 113 to County Road 102) 1.3 0.9 No No SR 45 (County Road 98A to County Road 13) 1.8 1.4 No No SR 113 (County Road 102 to 4th Street) 2.3 1.9 No No County Road 102 (County Road 13 to County Road 16) 2.2 1.8 No No County Road 102 (County Road 16 to County Road 22) 2.6 2.2 No No County Road 102 (County Road 22 to County Road 24) 2.5 2.1 No No County Road 102 (County Road 24 to County Road 25A) 2.1 1.7 No No County Road 102 (County Road 27 to County Road 29) 1.9 1.5 No No County Road 102 (County Road 29 to County Road 31) 1.5 1.1 No No SR 113 (County Road 14 to County Road 16A) 1.1 0.7 No No County Road 16A (County Road 97 to SR 113) 1.0 0.6 No No County Road 17 (SR 113 to County Road 102) 1.0 0.6 No No County Road 94B (County Road 19 to SR 16) 1.2 0.8 No No

L S A A S S O C I A T E S , I N C . Y O L O C O U N T Y 2 0 3 0 C O U N T Y W I D E G E N E R A L P L A N E I R A P R I L 2 0 0 9 I V . S E T T I N G , I M P A C T S , A N D M I T I G A T I O N M E A S U R E S D . A I R Q U A L I T Y
Table IV.D-6 Continued
P:\CYK0701 Yolo GP EIR\PRODUCTS\DEIR\Public\4d-AirQuality.doc (4/27/09) PUBLIC REVIEW DRAFT 295
Exceeds State Standards?
Roadway Segment 1-Hour 8-Hour 1-Hour 8-Hour County Road 24 (I-505 to County Road 95) 1.5 1.1 No No County Road 24 (County Road 95 to County Road 97) 2.3 1.9 No No County Road 24 (SR 16 to East Street) 2.2 1.8 No No County Road 27 (I-505 to County Road 95) 1.2 0.8 No No County Road 27 (County Road 95 to SR 16) 1.3 0.9 No No County Road 27 (SR 16 to SR 113) 1.2 0.8 No No County Road 29A (I-505 to County Road 95) 1.1 0.7 No No County Road 29 (County Road 95 to County Road 96) 1.2 0.8 No No County Road 29 (County Road 99 to SR 113) 1.3 0.9 No No County Road 29 (SR 113 to County Road 102) 1.3 0.9 No No County Road 28H (County Road 102 to County Road 105) 2.1 1.7 No No Russell Boulevard (County Road 98 to SR 113) 1.9 1.5 No No County Road 31 (Russell Boulevard to County Road 95) 1.5 1.1 No No County Road 31 (County Road 96 to County Road 98) 2.2 1.8 No No County Road 31 (County Road 98 to SR 113) 2.9 2.5 No No County Road 31 (SR 113 to County Road 101A) 2.8 2.4 No No County Road 31 (County Road 102 to Mace Boulevard) 2.1 1.7 No No SR 16 (I-5 to County Road 24) 1.6 1.2 No No SR 16 (County Road 24 to County Road 27) 1.5 1.1 No No SR 16 (County Road 27 to County Road 29) 1.5 1.1 No No SR 16 (County Road 29 to County Road 31) 1.4 1.0 No No SR 16 (Hutchinson Drive to Tremont Road) 1.2 0.8 No No County Road 99 (County Road 25A to County Road 27) 1.1 0.7 No No County Road 99 (County Road 20 to County Road 31) 2.2 1.8 No No SR 113 (County Road 31 to Hutchinson Drive) 2.4 2.0 No No County Road 101A (County Road 29 to County Road 31 1.9 1.5 No No County Road 101 (I-5 to County Road 24) 1.6 1.2 No No I-5 (County Road 102 to Old River Road) 3.1 2.7 No No Old River Road (I-5 to I-80) 2.2 1.8 No No I-80 (Sacramento Avenue to Industrial Boulevard) 4.0 3.6 No No I-80 (Industrial Boulevard to Levee Road) 4.1 3.7 No No Mace Boulevard (I-80 to Rd 33) 1.8 1.4 No No Mace Boulevard (Rd 33 to Rd 35) 1.2 0.8 No No Clarksburg Road (SR 84 to S. River Road) 1.2 0.8 No No Willow Point Road (SR 84 to S. River Road) 1.3 0.9 No No S. River Road (Willow Point Road to Freeport Bridge) 1.6 1.2 No No S. River Road (Freeport Bridge to Babel Slough Road) 1.5 1.1 No No SR 84 (Babel Slough Road to Willow Point Road) 2.7 2.3 No No SR 84 (Babel Slough Road to I-80) 4.5 4.1 No No I-80 (County Road 104 to SR 113) 3.2 2.8 No No County Road 105 (County Road 28H to I-80) 1.8 1.4 No No East Street (County Road 17 to I-5) 1.6 1.2 No No
Note: ppm = parts per million The State 1-hour standard is 20 ppm and the 8-hour standard is 9 ppm Source: LSA Associates, Inc., 2009.

L S A A S S O C I A T E S , I N C . Y O L O C O U N T Y 2 0 3 0 C O U N T Y W I D E G E N E R A L P L A N E I R A P R I L 2 0 0 9 I V . S E T T I N G , I M P A C T S , A N D M I T I G A T I O N M E A S U R E S D . A I R Q U A L I T Y
P:\CYK0701 Yolo GP EIR\PRODUCTS\DEIR\Public\4d-AirQuality.doc (4/27/09) PUBLIC REVIEW DRAFT 296
Generate Criteria Air Pollutants in Excess of Daily or Yearly Limits. Long-term air emission impacts are those associated with mobile and area sources resulting from growth allowed under the Draft General Plan. Mobile source emissions result from vehicle trips generated by the project and therefore result in air pollutant emissions that affect the entire air basin. Area source emissions result from the consumption of natural gas and propane for energy, as well as the use of landscaping equipment and some consumer products. Impact AIR-2: Build-out of the Draft General Plan could result in long-term operational emissions that would exceed YSAQMD thresholds of significance and substantially contribute to air quality violations. (S) The YSAQMD has established a significance threshold of 10 tons per year for ROG and NOx and 80 pounds per day for PM10. The criteria for operational impacts are the same for construction emissions. Regional emissions associated with the project’s mobile sources were calculated using the EMFAC 2007 model and the URBEMIS 2007 model. The results are presented in Table IV.D-7 and represent the emissions associated with development and vehicle trips resulting from build-out of the Draft General Plan. EMFAC 2007 uses vehicle population, trips, and VMT to estimate regional motor vehicle emissions. VMT data for the unincorporated portions of the County were used as an input to the EMFAC 2007 model. Area source emissions from additional residential development associated with the Draft General Plan were calculated using the URBEMIS 2007 model. URBEMIS accounts for the use of natural gas, wood stoves, fireplaces, landscape equipment, and consumer product emissions related to residential development as well as the commercial and industrial sources of pollutants. Appendix D contains the EMFAC and URBEMIS model output sheets. The daily emissions associated with the project are identified in Table IV.D-7 for reactive organic gases (ROG) and nitrogen oxides (NOx) (two precursors of ozone) and coarse particulate matter (PM10). YSAQMD has established thresholds of significance for ROG and NOx of 10 tons per year and PM10 of 80 pounds per day. The proposed project emissions shown in Table IV.D-7 exceed these thresholds of significance for ROG, NOx, and PM10. Operational emissions exceed the YSAQMD thresholds primarily due to the contribution of vehicle emissions in the County. Draft General Plan policies CI-1.3, CI-2.2, CI-2.3, and CI-2.4 seek to reduce vehicle emissions by reducing total VMT per household through efficient transportation facilities, ridesharing, public transit and other alternative transportation options including walking and bicycling. Policies CI-3.1, CI-3.6, and CI-3.8 promote more efficient roadways, roadway design, and compact development that considers all users of streets and promotes efficient use of existing
Table IV.D-7: Regional Emissions from Build-out of the Draft General Plan
Reactive Organic Gases
(Tons/Year)
Nitrogen Oxides
(Tons/Year) PM10
(Pounds/Day)Area Source Emissions 451.9 222.4 2,974.2 Operational Emissions 98.6 164.3 140.0 Total Emissions 550.5 386.7 3,114.2 YSAQMD Significance Threshold 10.0 10.0 80.0 Exceed? Yes Yes Yes Area Source Emissions calculated using URBEMIS 2007. Operational emissions calculated using EMFAC 2007. Source: LSA Associates, Inc., 2009.

L S A A S S O C I A T E S , I N C . Y O L O C O U N T Y 2 0 3 0 C O U N T Y W I D E G E N E R A L P L A N E I R A P R I L 2 0 0 9 I V . S E T T I N G , I M P A C T S , A N D M I T I G A T I O N M E A S U R E S D . A I R Q U A L I T Y
P:\CYK0701 Yolo GP EIR\PRODUCTS\DEIR\Public\4d-AirQuality.doc (4/27/09) PUBLIC REVIEW DRAFT 297
transportation facilities. Policies CI-4.1 through CI-4.4 seek to reduce environmental impacts from construction and operation of the County’s transportation system, emphasize effective transportation management to support regional air quality and greenhouse gas objectives, promote the reduction of the County’s dependence on fossil fuels, and support low emission or non-polluting forms of transportation. Policies CI-5.1, CI-5.2, CI-5.4 through CI-5.6, CI-5.8, CI-5.9, and CI-5.11 through CI-5.16 promote improvement of the County’s bicycle and pedestrian networks and promote the development and design of bikeways, sidewalks, and local and regional trails to promote safe bicycle riding and walking for transportation and recreation. Additionally, Draft General Plan Goal CI-6 and Policies CI-6.1 through CI-6.12 promote accessible transit to ensure that residents of unincorporated communities have convenient transit service, transit stops are conveniently located and include upgraded amenities, support efficient public transportation to residential areas and workplaces as well as other destinations, establish a balanced public transit system integrated with Sacramento Regional Transit, and support multi-modal transportation options. Policies CO-6.2, CO-6.3, CO-6.4, and CO-6.5 encourage alternative efforts to reduce air quality impacts by encouraging telecommuting and public transit access, encourage public and community participation in air quality planning, and support local and regional air quality improvement efforts. Actions CO-A101, CO-A104, and CO-A108 seek to implement YSAQMD guidelines and regulations to bring local air quality into attainment. As discussed in Section IV.A, Land Use and Housing, the County has taken a fine-grained, prescriptive smart growth approach to future allowed growth by: allowing urban growth only within the identified community area growth boundaries; attempting to balance land uses and the number of resulting jobs and homes within community areas to reduce vehicle miles traveled (VMT) and resulting environmental effects including the emissions of greenhouse gases resulting in global climate change; identifying upper limits or caps to the total amount of development that can occur in Specific Plan areas and some other communities; and providing policies that protect agricultural and open space lands. The Draft General Plan policies are intended to create sustainable towns and communities with a balance of jobs and housing that are similar to mature communities in the County (e.g., the cities of Davis and Woodland). By creating full-service communities designed around sustainable principles, implementation of the Draft General Plan will help reduce trip generation and the associated VMT and therefore subsequent regional emissions for new growth and existing development which would be a beneficial effect. Section IV.C, Transportation and Circulation of this EIR contains a discussion of the growth in travel (as measured by VMT) within unincorporated Yolo County generated by new growth, and indirectly includes VMT related to employment and other non-residential growth. Regional transportation performance measures are identified in this Section, and the change in VMT was determined due to the built environment variables of density (development per acre), diversity (mix of land uses), design (connectivity of uses), and destination accessibility. The result of this analysis was to identify new and revised policies (see Mitigation Measure CI-1a and CI-1b) to require new growth in Dunnigan, and strive to achieve growth in the other Specific Plan areas, that is planned, designed and balanced with a mix of uses to achieve a maximum of 44 VMT generated per household per weekday under the Draft General Plan in order to reduce regional greenhouse gas emissions that contribute to air pollution and global climate change. This VMT threshold would be a significant reduction from the existing average VMT of 83 miles generated per household per weekday under 2005 conditions for the unincorporated area. As described above, the Draft General Plan includes policies that focus on
L S A A S S O C I A T E S , I N C . Y O L O C O U N T Y 2 0 3 0 C O U N T Y W I D E G E N E R A L P L A N E I R A P R I L 2 0 0 9 I V . S E T T I N G , I M P A C T S , A N D M I T I G A T I O N M E A S U R E S D . A I R Q U A L I T Y
P:\CYK0701 Yolo GP EIR\PRODUCTS\DEIR\Public\4d-AirQuality.doc (4/27/09) PUBLIC REVIEW DRAFT 298
reducing VMT for the entire unincorporated area of the County. Because the VMT threshold would be difficult to apply on a parcel-by-parcel basis, it is proposed to be applied to the Specific Plan areas where the majority of planned development would occur and where the proposed land uses can be refined and balanced through the Specific Plan process. In these communities, residents have multiple choices for travel, such as transit, bicycling, and walking, which is important to note since the VMT threshold is not intended to reduce personal mobility, but instead increase travel choices through both land use and transportation actions. Implementation of the Draft General Plan policies and this new VMT policy would help to reduce regional air quality impacts associated with vehicle emissions.
Mitigation Measure AIR-2: Implement Mitigation Measure CI-1a, CI-1b, CI-1c, and CI-1d. While implementation of the policies and actions included in the Draft General Plan and identified mitigation measures would reduce VMT generated by new development and long-term operational emissions, the YSAQMD thresholds of significance would continue to be exceeded at build-out of the Draft General Plan. No additional feasible mitigation measure was identified to reduce this impact to a less-than-significant level. This impact would remain significant and unavoidable. (SU)
(3) Expose Humans to Toxic Air Contaminants. When evaluating potential impacts
relating to Toxic Air Contaminants, Lead Agencies should consider situations in which (1) a new or modified source of TACs is proposed for a location near an existing residential area or other sensitive receptor, and (2) a residential development or other sensitive receptor is proposed for a site near an existing source of TACs. According to data from CARB, over 400 emission sources of Toxic Air Contaminants are located within Yolo County, including the incorporated areas.6 The most serious pollutants on a Statewide basis include diesel exhaust particulate matter, benzene, and 1,3-butadien, all of which are emitted by motor vehicles. Additional sources include distribution centers, rail yards, ports, refineries, chrome platers, dry cleaners and gasoline dispensing facilities. Impact AIR-3: Build-out of the Draft General Plan could expose sensitive receptors to toxic air contaminants. (S) The YSAQMD reviews the potential for TAC emissions from new and modified stationary sources through the permitting process. TAC emissions from existing stationary sources are limited by:
• District adoption and enforcement of rules aimed at specific types of sources known to emit high levels of TACs;
• Implementation of the Air Toxics “Hot Spots” (AB 2588) Program; and
• Implementation of the federal Title III Toxics program. Many facilities, such as solvent-based dry cleaners, produce toxic emissions and existing controls often reduce impacts from these sources to less-than-significant levels. Detailed analyses should be
6 Estimates include gas stations and dry cleaners. If these sources are excluded, Yolo County has approximately 300
TAC emission sources.
L S A A S S O C I A T E S , I N C . Y O L O C O U N T Y 2 0 3 0 C O U N T Y W I D E G E N E R A L P L A N E I R A P R I L 2 0 0 9 I V . S E T T I N G , I M P A C T S , A N D M I T I G A T I O N M E A S U R E S D . A I R Q U A L I T Y
P:\CYK0701 Yolo GP EIR\PRODUCTS\DEIR\Public\4d-AirQuality.doc (4/27/09) PUBLIC REVIEW DRAFT 299
used to determine the potential risk and feasible control measures if consideration is given to siting such a source near sensitive receptors. CARB has also developed an Air Quality and Land Use Handbook7 which is intended to serve as a general reference guide for evaluating and reducing air pollution impacts associated with new development. The CARB Handbook indicates that mobile sources continue to be the largest overall contributors to the State’s air pollution problems, representing the greatest air pollution health risk to most Californians. The most serious pollutants on a Statewide basis include diesel exhaust particulate matter (diesel PM), benzene, and 1,3-butadiene, all of which are emitted by motor vehicles. The CARB handbook recommends that planning agencies strongly consider proximity to these sources when finding new locations for "sensitive" land uses such as those described in Action CO-A106 (residentially designated land uses, hospitals and nursing/convalescent homes, hotels and lodging, schools and day care centers, and neighborhood parks). Key recommendations in the Handbook are listed in Table IV.D-8. The Handbook specifically states that these recommendations are advisory and acknowledges land use agencies have to balance other considerations, including housing and transportation needs, economic development priorities, and other quality of life issues. During construction as well as mining and agricultural operations, various diesel-powered vehicles and equipment would be in use. In 1998, CARB identified particulate matter from diesel-fueled engines as a toxic air contaminant. CARB has completed a risk management process that identified potential cancer risks for a range of activities using diesel-fueled engines.8 Health risks from TACs are a function of both concentration and duration of exposure. Unlike the above types of sources, construction diesel emissions are temporary, affecting an area for a period of days or perhaps weeks. Additionally, construction-related sources are mobile and transient in nature, and the bulk of the emission occurs at a substantial distance from nearby receptors. Because of its short duration, health risks from construction emissions of diesel particulate would be a less-than-significant impact. Health risks from agriculture and mining emissions are regulated under YSAQMD rules and regulations. Specifically, agricultural is regulated under Regulation 11, Agriculture Sources. Both agricultural activities and mining activities are regulated under Regulation 3, Toxics New Source Review and Regulation 9, State Designated Toxic Sources. New agricultural or mining operations in Yolo County would be subject to these rules and regulations which insure health risks to sensitive receptors from these industries are minimized to a less than significant level. While stationary TAC sources are regulated under YSAQMD permitting programs, mobile sources of TAC are largely unregulated and can contribute to elevated health risks when located near receptors, particularly concentrations of dense residential uses such as a residential subdivision. Primary mobile TAC sources include truck traffic on freeways and sources that attract diesel truck traffic, such as warehousing facilities or truck stops. Agricultural harvesting generates truck traffic in Yolo County, but does not pose a serious health risk due to the seasonal nature of harvesting and the open rural
7 California Air Resources Board, 2005. Air Quality and Land Use Handbook: A community Health Perspective. April.
8 California Air Resources Board, 2000. Risk Reduction Plan to Reduce Particulate Matter Emissions from Diesel-Fueled Engines and Vehicles, October.

L S A A S S O C I A T E S , I N C . Y O L O C O U N T Y 2 0 3 0 C O U N T Y W I D E G E N E R A L P L A N E I R A P R I L 2 0 0 9 I V . S E T T I N G , I M P A C T S , A N D M I T I G A T I O N M E A S U R E S D . A I R Q U A L I T Y
P:\CYK0701 Yolo GP EIR\PRODUCTS\DEIR\Public\4d-AirQuality.doc (4/27/09) PUBLIC REVIEW DRAFT 300
Table IV.D-8: CARB’s Recommendations on Siting New Sensitive Land Uses Source Category Advisory Recommendations Freeways and High-Traffic Roads
Avoid concentrating sensitive land uses within 500 feet of a freeway, urban roads with 100,000 vehicles/day, or rural roads with 50,000 vehicles/day.
Distribution Centers
Avoid avoid concentrating sensitive land uses within 1,000 feet of a distribution center (that accommodates more than 100 trucks per day, more than 40 trucks with operating transport refrigeration units (TRUs) per day, or where TRU unit operations exceed 300 hours per week). Take into account the configuration of existing distribution centers and avoid concentrating residences and other new sensitive land uses near entry and exit points.
Rail Yards Avoid concentrating sensitive land uses within 1,000 feet of a major service and maintenance rail yard. Within one mile of a rail yard, consider possible siting limitations and mitigation approaches.
Ports Avoid concentrating sensitive land uses immediately downwind of ports in the most heavily impacted zones. Consult local air districts or the CARB on the status of pending analyses of health risks.
Refineries Avoid concentrating sensitive land uses immediately downwind of petroleum refineries. Consult with local air districts and other local agencies to determine an appropriate separation.
Chrome Platers Avoid concentrating sensitive land uses within 1,000 feet of a chrome plater. Dry Cleaners Using Perchloroethylene
Avoid concentrating sensitive land uses within 300 feet of any dry cleaning operation. For operations with two or more machines, provide 500 feet. For operations with 3 or more machines, consult with the local air district. Do not concentrate sensitive land uses in the same building with perc dry cleaning operations.
Gasoline Dispensing Facilities
Avoid concentrating sensitive land uses within 300 feet of a large gas station (defined as a facility with a throughput of 3.6 million gallons per year or greater). A 50 foot separation is recommended for typical gas dispensing facilities.
Notes: 1. These recommendations are advisory. Land use agencies have to balance other considerations, including housing and
transportation needs, economic development priorities, and other quality of life issues. 2. Recommendations are based primarily on data showing that the air pollution exposures addressed here (i.e., localized) can
be reduced as much as 80% with the recommended separation. 3. The relative risk for these categories varies greatly. To determine the actual risk near a particular facility, a site-specific
analysis would be required. Risk from diesel PM will decrease over time as cleaner technology phases in. 4. These recommendations are designed to fill a gap where information about existing facilities may not be readily available
and are not designed to substitute for more specific information if it exists. The recommended distances take into account other factors in addition to available health risk data (see individual category descriptions).
5. Site-specific project design improvements may help reduce air pollution exposures and should also be considered when siting new sensitive land uses.
6. This table does not imply that mixed residential and commercial development in general are incompatible. Rather it focuses on known problems like dry cleaners using perchloroethylene that can be addressed with reasonable preventative actions.
7. A summary of the basis for the distance recommendations can be found in Table 1-2 (see ARB’s Land Use Handbook). Source: California Air Resources Board, 2005. Air Quality and Land Use Handbook: A Community Health Perspective. April and Tschudin Consulting Group, April 2009. character of the area that allows for dispersal of emissions. Similarly individual or small clusters of farm dwellings do not typically face elevated health risk, even when in proximity to staging areas for agricultural harvesting, because the concentration of exposure is sporadic and highly diluted. Elevated health risks would only occur with continuous and/or concentrated exposure over many years. New development projects that would place sensitive receptors near a TAC source at a distance that is within the ranges indicated in Table IV.D-8 would be considered to have an elevated risk. As stated

L S A A S S O C I A T E S , I N C . Y O L O C O U N T Y 2 0 3 0 C O U N T Y W I D E G E N E R A L P L A N E I R A P R I L 2 0 0 9 I V . S E T T I N G , I M P A C T S , A N D M I T I G A T I O N M E A S U R E S D . A I R Q U A L I T Y
P:\CYK0701 Yolo GP EIR\PRODUCTS\DEIR\Public\4d-AirQuality.doc (4/27/09) PUBLIC REVIEW DRAFT 301
previously, policies of the Draft General Plan aim to provide a balance of jobs and housing within growth areas. This strategy could allow for uses that are potential stationary TAC sources (e.g., distribution centers) in proximity to residential uses. Development in Yolo County near high volume freeways could be a source for an elevated health risk for residents. As an example, new development in the Dunnigan Specific Plan area located near Interstate 5 could be exposed to elevated TAC levels. In these cases, it is advisable to conduct a health risk assessment using a dispersion model to calculate this increased risk. TAC risk is based on several factors including the vehicle fleet mix and other traffic data and site specific meteorological data. Draft General Plan Policy CO-6.1 promotes improving air quality through land use planning decisions, and Action CO-A102 requires development proposals for new sources of toxic air pollutants to prepare a health risk assessment and establish appropriate land use buffers. Action CO-A106 requires regulating the location and operation of land uses to avoid or mitigate harmful or nuisance levels of air emissions to residential uses, hospitals and nursing/convalescent homes, hotels and lodging, schools and day care centers and neighborhood parks. Implementation of Mitigation Measure AIR-2 would insure that any future development adjacent to potential sources of TAC’s would not expose sensitive receptors to an increased health risk.
Mitigation Measure AIR-3: Amend Action CO-A106 of the Draft General Plan as follows: Action CO-106: Regulate the location and operation of land uses to avoid or mitigate
harmful or nuisance levels of air emissions to the following sensitive receptors: residential uses, hospitals and nursing/convalescent homes, hotels and lodging, schools and day care centers and neighborhood parks. New development shall follow the recommendations for siting new sensitive land uses consistent with the CARB’s recommendation as shown in Table IV.D-8. (Policy CO-6.1, Policy CO-6.2)
Implementation of Mitigation Measure AIR-3, and Draft General Plan policies and actions, in conjunction with compliance with existing regulatory programs would ensure that impacts related to an increase in exposure of sensitive receptors to TACs at build-out of the Draft General Plan’s TAC impacts would be less than significant.
(4) Create Objectionable Odors. Potential odor impacts should be evaluated for both (1) sources of odor locating near existing receptors, and (2) receptors locating near existing odor sources. It is unknown at this point what types and locations of specific establishments could be developed under implementation of the Draft General Plan, and it is possible that some uses (e.g., wastewater treatment plants) could have the potential to produce odors. For example, Table PF-1,of the Draft General Plan indicates that the required expansion or construction of wastewater treatment facilities to serve the Specific Plan areas could result in local odor impacts. Some objectionable odors may also be generated from the operation of diesel-powered construction equipment and/or asphalt paving during the construction period of individual projects. However, these odors would be short term in nature and would not result in permanent impacts to surrounding land uses, including sensitive receptors within and adjacent to the project site.

L S A A S S O C I A T E S , I N C . Y O L O C O U N T Y 2 0 3 0 C O U N T Y W I D E G E N E R A L P L A N E I R A P R I L 2 0 0 9 I V . S E T T I N G , I M P A C T S , A N D M I T I G A T I O N M E A S U R E S D . A I R Q U A L I T Y
P:\CYK0701 Yolo GP EIR\PRODUCTS\DEIR\Public\4d-AirQuality.doc (4/27/09) PUBLIC REVIEW DRAFT 302
The YSAQMD is responsible for enforcing the provisions of California Health and Safety Code Section 41700 which prohibits the discharge of anything that could endanger the comfort or health of the public. Nuisance odors are regulated by this section, although certain odors are exempted, such as odors from agricultural activates and composting facilities. The YSAQMD enforces Section 41700 through its nuisance rule. Any actions related to odors are based on citizen complaints to local governments and the YSAQMD. In all, there have been 44 odor complaints countywide over the last 3 years.9 Most of these emanated from operations in the cities. A summary of these complaints compiled by the YSAQMD is included in Appendix D. The majority of complaints have come from unidentified sources in Woodland. Based on the information provided by the YSAQMD, there is not enough evidence to suggest the odors are coming from any one source or that any mitigating action should be taken based on these previous complaints. The most effective measure available to reduce odor impacts is to establish a buffer between the odor source and the nearest sensitive receptor. A safety margin also should be considered in establishing a buffer zone to allow for future expansion of operations at the source of the odors. Draft General Plan Policy CO-6.1 would reduce the impact of odors by emphasizing the improvement of air quality through land use planning. Action CO-A103 implements this policy by requiring Best Management Practices regarding odor control, storm water drainage, and fugitive dust control (which can both directly and indirectly affect odors.) Draft General Plan policies LU-2.1 and AG-1.8 establish buffers for agricultural uses (and agricultural commercial/industrial uses which are allowed in the agricultural land use designation) which would mitigate the effect of agricultural odors. Mining also has buffer requirements through the CCAP and mining ordinances and therefore, mining odor impacts would be less than significant. With implementation of the Draft General Plan policies, the potential for creation of objectionable odors associated with build-out of the Draft General Plan would be less than significant.
(5) Result in Cumulative Impacts. CEQA defines cumulative impacts as two or more individual effects which, when considered together, are either significant or “cumulatively considerable,” meaning they add considerably to a significant environmental impact. Cumulative impacts can result from individually minor but collectively significant projects (CEQA Guidelines §15355). Project emissions that are not consistent with the AQAP, SIP, or that exceed YSAQMD thresholds will have a significant cumulative impact unless offset. Impact AIR-4: Build-out of the Draft General Plan could result in a cumulatively considerable impact on criteria air pollutants. (S) Yolo County is in a designated non-attainment area for ozone. The YSAQMD has prepared the AQAP to address attainment of the State and federal ozone air quality standards. This plan accommodates growth by projecting growth in ozone precursor emissions and through the planning process, ozone precursor emission growth is offset by regional controls on stationary, area, and transportation sources of air pollution. Growth allowed under the Draft General Plan would exceed the ozone emissions above the individual thresholds. The growth anticipated under the Draft General Plan has not been accommodated for in the AQAP, and therefore it is not consistent with the AQAP
9 Yolo-Solano AQMD, 2009. Yolo County odor complaints compiled by David Smith. March.

L S A A S S O C I A T E S , I N C . Y O L O C O U N T Y 2 0 3 0 C O U N T Y W I D E G E N E R A L P L A N E I R A P R I L 2 0 0 9 I V . S E T T I N G , I M P A C T S , A N D M I T I G A T I O N M E A S U R E S D . A I R Q U A L I T Y
P:\CYK0701 Yolo GP EIR\PRODUCTS\DEIR\Public\4d-AirQuality.doc (4/27/09) PUBLIC REVIEW DRAFT 303
and would have a significant cumulative impact on regional air quality unless ozone precursor emissions above the thresholds are offset.
Mitigation Measure AIR-4: None available. While implementation of the policies and actions and mitigation measures included in the Draft General Plan to reduce VMT would reduce the severity of cumulative impacts on criteria air pollutants, no feasible mitigation measure was identified to reduce this impact to a less-than-significant level. This impact would remain significant and unavoidable. (SU)
(6) Conflict with Plans or Policies of Other Agencies. Regional air quality plans are
developed to meet requirements of both the federal and California Clean Air Acts. The federal Clean Air Act requires that areas not attaining the air quality standards develop an attainment plan demonstrating how control strategies help the area meet reasonable further progress goals and attain the air quality standard. As mentioned earlier in this section, the CCAA also requires a triennial assessment of the extent of air quality improvements and emissions reductions achieved through the use of control measures. Impact AIR-5: Build-out of the Draft General Plan could result in conflicts with air quality planning efforts by other agencies. (S) Air quality plan projections, including the 2003 Triennial Assessment and Plan Update developed by YSAQMD, the 2006 Sacramento Regional Nonattainment Area 8-Hour Ozone Rate-of-Progress (ROP) Plan, and the Sacramento Regional 8-Hour Ozone Attainment Draft Report and Reasonable Further Progress (RFP) Plan dated September 2008, are based on analysis and forecasts of air pollutant emissions throughout the entire region. These forecasts rely on projections of vehicle miles traveled, population, and employment made by the Sacramento Area Council of Government (SACOG), which are based on land use projections made by local jurisdictions (e.g., through the General Plan development process). The SACOG Metropolitan Transportation Plan (MTP) provides vehicle data that are used to estimate mobile source emissions and demonstrate transportation conformity. The Draft General Plan was therefore evaluated to determine consistency with the MTP and relevant air quality plans. The 2003 Triennial Assessment and Plan Update developed by YSAQMD was prepared pursuant to CARB guidance, complies with plan revision requirements, and compares and incorporates updated population, industry, and vehicle-related projections, as necessary. The 2003 Assessment Plan provided emissions projections for the years 2010, 2015, and 2020 for stationary, area, and on- and off-road mobile sources. The 2006 Sacramento Regional Nonattainment Area 8-Hour Ozone ROP Plan fulfilled the federal 8-hour ozone requirements for the Sacramento regional nonattainment area and also set new motor vehicle emission budgets for transportation conformity. The updated on-road motor vehicle emissions budgets were based on vehicle miles traveled and trips developed as part of the Sacramento region’s 2002 MTP. YSAQMD and Sacramento Metropolitan AQMD work with SACOG and local agencies to ensure that each air quality plan is developed with the most recent available data. Therefore, the most recent

L S A A S S O C I A T E S , I N C . Y O L O C O U N T Y 2 0 3 0 C O U N T Y W I D E G E N E R A L P L A N E I R A P R I L 2 0 0 9 I V . S E T T I N G , I M P A C T S , A N D M I T I G A T I O N M E A S U R E S D . A I R Q U A L I T Y
P:\CYK0701 Yolo GP EIR\PRODUCTS\DEIR\Public\4d-AirQuality.doc (4/27/09) PUBLIC REVIEW DRAFT 304
air quality plans, including the 2006 Sacramento 8-Hour Ozone ROP Plan and the Sacramento Regional 8-Hour Ozone Attainment and RFP Plan Draft Report10, would be the most appropriate plans for comparison to the Draft General Plan, as they contain the most updated vehicle and motor vehicle emissions budgets. To show that the 2035 MTP conforms to these new emission budgets, SACOG would need to ensure that the transportation emissions in the region stay below these levels, regardless of project changes or growth increases. The 2006 Sacramento 8-Hour Ozone ROP Plan and the Sacramento Regional 8-Hour Ozone Attainment and RFP Plan Draft Report were prepared using population and employment data assumptions based on the 1983 General Plan. The Draft General Plan would increase the total number of homes by 10,786 units with a corresponding increase in population of approximately 30,195 people over the 1983 General Plan. Employment would increase by 19,209 jobs over the 1983 General Plan. This increase in residential units, population, and employment exceeds the estimates included in the most recently adopted 2035 MTP11 and, therefore, conflicts with the 2006 Sacramento 8-Hour Ozone ROP Plan and the Sacramento Regional 8-Hour Ozone Attainment and RFP Plan Draft Report. Therefore, the project would not be consistent with the MTP and Clean Air Plans. Draft General Plan Policies CO-6.1, CO-6.2, and Action CO-A105 are designed to improve air quality through land use planning decisions, supporting local and regional air quality improvement efforts, and coordinating the County’s air quality planning efforts with other local, regional, and State agencies. The Draft General Plan includes prescriptive requirements for smart growth, jobs/housing balance, jobs/housing match, jobs/housing phasing, and green building. Therefore, growth under the Draft General Plan is likely to have less impact on the region than other planned and approved development that could proceed by right without this stringent policy framework. Therefore, to the extent that new planned growth under this Draft General Plan supplants growth that would otherwise occur elsewhere, the net effect would be better for the region. Additionally, as discussed in Chapter IV.C Transportation and Circulation, the Draft General Plan includes policies that are intended to create sustainable towns and communities with housing, jobs, and services that result in levels of VMT that are similar to other mature communities in the County. By creating full-service communities designed around sustainable principles, the Draft General Plan will help reduce VMT and associated vehicle emissions, not just for new growth but for existing development as well. Instead of the estimated VMT of 77 miles generated per household per day for the unincorporated County under a business as usual scenario by year 2030, the Draft General Plan is expected to result in communities that can achieve much lower levels of VMT, similar to that of mature communities in the County such as the cities of Davis and Woodland. The new and revised policies per Mitigation Measure C1-1 would require new growth in the Specific Plan to achieve a VMT threshold of 44 miles generated per household per weekday to the extent feasible, using VMT reduction methods outlined in Section IV.C, Transportation and Circulation. These VMT reduction measures would help to reduce ozone precursor emissions through a reduction of automobile emissions. It should be noted that upon adoption updated General Plan build-out estimates will be available for SACOG to incorporate into future updates of applicable transportation and air quality
10 Scheduled for Air District and CARB adoption in 2009. 11 SACOG, 2008. Sacramento Region 2035 Metropolitan Transportation Plan. March.

L S A A S S O C I A T E S , I N C . Y O L O C O U N T Y 2 0 3 0 C O U N T Y W I D E G E N E R A L P L A N E I R A P R I L 2 0 0 9 I V . S E T T I N G , I M P A C T S , A N D M I T I G A T I O N M E A S U R E S D . A I R Q U A L I T Y
P:\CYK0701 Yolo GP EIR\PRODUCTS\DEIR\Public\4d-AirQuality.doc (4/27/09) PUBLIC REVIEW DRAFT 305
plans. However, in the mean time, projected growth in the Draft General Plan would not be consistent with the air quality plans of other agencies.
Mitigation Measure AIR-5: Implement Mitigation Measure CI-1a and CI-1b. While implementation of the mitigation measure, policies and actions included in the Draft General Plan would reduce the severity of this impact, no additional feasible mitigation measures are available to reduce this impact to a less-than-significant level. This impact would remain significant and unavoidable. (SU)
(7) Result in Adverse Impacts from Draft General Plan Policies Compared to 1983
General Plan Policies. Based on a review of the 1983 General Plan policies related to air quality in the Agriculture and Economic Development, Conservation and Open Space, and Housing Elements, the previous policies were determined to be either equivalent to or less rigorous than those proposed under the Draft General Plan. The Draft General Plan contains goals, policies and actions providing greater protections related to air quality than the policies of the 1983 General Plan. In general, the Draft General Plan would provide more stringent environmental protection and greater accountability in the regulation of development activities that would affect or be affected by air quality. Therefore, implementation of the Draft General Plan would not result in a significant adverse physical impact related to air quality as compared to the 1983 General Plan.

L S A A S S O C I A T E S , I N C . Y O L O C O U N T Y 2 0 3 0 C O U N T Y W I D E G E N E R A L P L A N E I R A P R I L 2 0 0 9 I V . S E T T I N G , I M P A C T S , A N D M I T I G A T I O N M E A S U R E S D . A I R Q U A L I T Y
P:\CYK0701 Yolo GP EIR\PRODUCTS\DEIR\Public\4d-AirQuality.doc (4/27/09) PUBLIC REVIEW DRAFT 306