deaths and injury patterns among powered two wheeler · pdf filethis study sought to ... j.l....
TRANSCRIPT

Abstract Despite increases in helmet use, powered two wheelers (PTWs – mopeds, motorcycles, scooters)
remain the most dangerous form of travel on today’s roads. This study sought to identify helmet use rates, mortality rates, and injury patterns among PTW users in Spain using a cross‐sectional, ecological study design. Overall helmet use rates for 2005‐2008 were obtained from sample‐based observational studies performed by the Spanish Dirección General de Tráfico (DGT). Injury distributions among non‐fatally‐injured PTW users (age 14+) were obtained from a census of injury‐related hospital discharge records. Fatality data were obtained from a census of police‐reported roadway fatalities. Helmet use ranged from 85% to 100%. The most common injuries among non‐fatally injured patients were fractures of the lower extremity (23% of injuries) and upper extremity (18%), and traumatic brain injury (12%). Fatality rates ranged from 0.8 to 3.0 per 100,000 population, per year. Neither the fatality rates nor the percent of non‐fatal hospital cases exhibiting an AIS 3+ head injury correlated significantly with fluctuations in overall helmet use (within the range observed). These observations highlight challenges in PTW user safety remaining in populations that exhibit high helmet use rates. Future work includes re‐examining risk factors in these populations to identify continuing opportunities for intervention. Keywords Ecological, helmet, hospital, motorcycle, powered‐two‐wheeler
I. INTRODUCTION Despite improvements in helmet use, powered two wheelers (PTWs – mopeds, motorcycles, scooters) remain
the most dangerous form of travel on today’s roads. In European Union countries from 2001‐2002, PTW collisions resulted in 17.6 times the number of deaths per passenger‐travel hours compared to both cars and non‐powered cycles [1]. In 1995‐2006, motorcycle users in Canada were 3.5 times more likely to be severely injured or killed compared to other motorists (based on the number of vehicle registrations) [2]. PTW collisions accounted for 15% of European roadway deaths in 2005 [3]. Motorcycle collisions resulted in 30,505 hospital admittances in the United States in 2001, producing hospital charges estimated at $841 million [4]. The prevalence of PTW injuries may increase in the near future, resulting from efforts to increase PTW sales to address fuel economy and environmental concerns. In 2004‐2005 alone, such efforts resulted in a 172% increase in new PTW registrations in Spain, estimated to have caused an additional 100 PTW user deaths in Spain in 2005 [5]. Due to regulation and other efforts, many countries have achieved PTW user helmet use rates between 90
and 100% [6]. Despite this improvement, many deaths and serious injuries still occur [7] for several possible reasons. Helmets have a finite effectiveness, reducing the risk of death in motorcycle collisions by approximately 42% and reducing the risk of head injury by 69% [8]. The effectiveness of helmets in preventing lower severity or rotationally‐induced brain injury remains unknown [7]. Even in high‐helmet use regions the remaining un‐helmeted riders may account for a disproportionate number of PTW user head injuries and deaths [13]. Severe injuries to the thorax, spine, and abdomen (although rare relative to head injuries [7], [4], [9], [10], [11], [12]) also likely account for a portion of the fatalities in both the helmeted and non‐helmeted populations. As with
J.L. Forman is a Whitaker International Scholar, a Profesor Asociado at the Universidad de Navarra, and is the Deputy Director for Science of the European Center for Injury Prevention (phone: +34 948 425 600 x6469; fax: +34 948 425 649; email: [email protected]). R. Heredero‐Ordoyo is a research assistant for the European Centre for Injury Prevention. F. J. Lopez‐Valdes is a Ph.D. student at the University of Virginia Center for Applied Biomechanics. M. Segui‐Gomez is a Profesora Titular at the Universidad de Navarra, and is the Director of the European Center for Injury Prevention.
Deaths and injury patterns among powered‐two wheeler users in Spain: population‐level data in regions with high helmet‐use rates.
Jason L. Forman, Rafael Heredero‐Ordoyo, Francisco J. Lopez‐Valdes, Maria Segui‐Gomez
IRC-11-42 Ircobi Conference 2011
- 113 -

cars and other passenger vehicles, there are also a portion of PTW collisions that are of high‐enough severity to be considered “unsurvivable” [13], in which it is unlikely that any clothing‐based safety device will be effective. Severe injuries to the upper and lower extremity are also common in PTW collisions [7], [4] and are an important source of long‐term disability in non‐fatally injured users [7]. Progressing PTW user safety in regions with high helmet use requires a re‐examination of injury and fatality
trends to identify continuing opportunities for intervention [8]. This study sought to examine characteristics and trends in PTW user injury on a population level, in a set of geographic areas with high helmet use rates. This type of study – where the input variables are defined at the population level instead of the individual level – is a type of epidemiological investigation commonly termed an “ecological” study [38]. This study examined PTW user helmet use, injury distributions and fatality trends within Spain over time periods from 2005‐2008, using a cross‐sectional, ecological study design. This study also combined overall helmet use observations with fatality and injury data to test the hypotheses that fluctuations in overall helmet use rate within the 85 to 100% range affect changes in population‐based PTW user fatality rates and the rate of AIS 3+ head injuries among non‐fatally injured hospitalized PTW users.
II. METHODS
The entire country of Spain was divided into seven zones (Figure 1) and was examined for the time period 2005‐2008. Population data, overall PTW‐user helmet use rates, injury data for non‐fatal collisions and fatal collision information were acquired for each zone and for each year. An analysis was then performed to test for effects of overall observed helmet use on injury distributions and population‐based fatality characteristics. The data source and analysis procedures are described in detail below.
Figure 1: Map showing the division of Spain into the seven zones studied.
Data Sources Overall Helmet Use Rates Overall helmet use data, across zones and years, were obtained from the Observatorio Nacional de Seguridad
Vial [National Road Safety Observatory] of the Spanish Dirección General de Tráfico (DGT). Those data were collected through a series of sample‐based observational studies intending to observe helmet use rates representative of regional PTW user populations. The observational studies were conducted during daylight hours at randomly‐selected urban and extra‐urban intersections within each region. The site and time‐period selection process was designed to provide a representative sample of day‐time PTW users. [14]
IRC-11-42 Ircobi Conference 2011
- 114 -

Injury Characteristics, Hospitalized Survivors Injury characteristics among hospitalized survivors of PTW collisions were observed using the “Conjunto
Mínimo Básico” (i.e., hospital discharge database) maintained by the Spanish Ministry of Health and Social Policy. This is a near‐census of minimum basic hospital discharge data from throughout Spain currently available up to 2008. Each year, the European Center for Injury Prevention (ECIP) obtains from that database the sub‐set of all records containing at least one injury code in at least one of the diagnoses fields. Those data are then checked for quality, augmented, and maintained as a part of the APOLLO injury surveillance database operated by ECIP. Although identifying data regarding the patients or the hospitals is not available, the location of the hospitals is, thus allowing for reorganization of the data into the 7 zones described in paragraph above. Among other variables, available data include the age and gender of the patients, the year of discharge and
the destination of discharge (home, hospital transfer, death, etc.). Case information included diagnoses (primary diagnosis and up to 13 secondary diagnoses) coded using the International Classification of Disease, version 9, Clinical Modification (ICD‐9‐CM [15]). The etiology of injury (traffic collision, etc.) was coded using the external cause of injury code (E code) in the ICD‐9‐CM. Hospital discharge records were included in this study if they had at least one injury code (ICD‐9‐CM 800.0‐
995.85). PTW users were defined as having E‐Codes E810‐E825, but only if the fourth digit was .2 or .3 in the ICD‐9‐CM classification. The analysis was restricted to subjects 14 years old or older at the time of admission. Years 2005‐2008 were analyzed. The hospital record examination was confined to those patients that were discharged alive. This analysis examined the top three diagnoses for each case. Data on injury diagnoses were categorized into the Barell Matrix to present the overall relative distribution of
injured body regions and injury types [16]. To further examine injury types and severities, the ICD‐9‐CM injury codes were mapped to the Abbreviated Injury Scale (AIS, 1998 update of the 1990 version [17]). This mapping was accomplished using an algorithm developed by the Center for Injury Research and Policy of the Johns Hopkins University School of Public Health and Trianalytics, Inc. [18]. This algorithm has been used previously to study PTW user injury trends from hospital discharge records of other European countries, and is described in detail therein [7]. Diagnoses related to head injury were further classified by associated injury mechanisms based on an
algorithm that was developed by Martin and Eppinger [19] and automated by the European Center for Injury Prevention [20]. This algorithm classifies head injuries into those associated with translational acceleration/impact mechanisms, rotational acceleration mechanisms or those associated with either translational or rotational acceleration. This algorithm has been previously used to study head injury characteristics among pediatric motor vehicle victims [21], pedestrian collisions [22] and PTW users in other European countries [7], and is described in detail therein. Previous studies have indicated a relatively high frequency of AIS 2 cerebral concussion (AIS98 code 161000.2) among PTW users hospitalized with head injuries [7]. Although Martin and Eppinger classified that as a rotational injury, those authors noted that this mechanism is less than certain. To avoid the possibility of cerebral concussions skewing the perceived relative distribution of head injury mechanisms, those were treated as a separate category (distinct from rotational, translational, etc.) when examining the entire set of head injury cases. Fatality Counts Counts of fatally‐injured PTW users were obtained from the Spanish DGT. Those data are maintained as a
census of police‐reported fatalities. Although official statistics are commonly extrapolated to represent deaths up to 30‐days after the event, the raw‐form data only includes deaths occurring within 24 hours of a collision. Portions of those data are summarized and published annually by the DGT [23]. This study used raw data (deaths up to 24 hours following the event) obtained directly from the DGT for years 2005‐2008. Fatality Rate Denominator Population data for each zone and for each year was obtained from the Spanish National Statistics Institute
IRC-11-42 Ircobi Conference 2011
- 115 -

[24]. Population‐based rates of PTW user fatalities were then calculated using the police‐reported fatality data of the DGT. Analysis In addition to the descriptive analysis described above, regression analyses were performed to test for
correlations between fluctuations in helmet use and different outcomes of interest. These analyses were performed across zones and across years, with the outcome variable value for each zone‐year combination considered as a single observation. Cochrane‐Orcutt regression [25] was then used to test for a correlation with overall helmet use. This analysis method is designed for sets non‐independent observations consisting of a number of cases (in this study, zones) tracked over a period of time, where the number of cases is similar to the number of time periods observed. Analyzed output variables included the population‐based PTW user fatality rates and the percentage of non‐fatal PTW user hospitalizations that exhibited an AIS 3+ head injury. The analyses were performed using Stata v9.0 (Stata Corporation, College Station, TX). The results were deemed to be statistically significant if the p‐values were less than 0.05.
III. RESULTS Observational PTW user helmet use data are shown in Table 1. Observed helmet use rates ranged from 85.1%
to 100.0%.
Table 1: Overall PTW user helmet use rates for Spain, daylight hours, 2005‐2008, by zone (percent of users). Source: Dirección General de Tráfico [14].
Zone # Regions Included 2005 2006 2007 2008 1 Andalucía, Ceuta and Melilla and the Canary
Islands 85.1 88.2 90.0 95.3
2 Aragon, Navarra, La Rioja and the Basque Country
98.3 99.1 99.4 100.0
3 Principality of Asturias, Cantabria and Galicia 100.0 98.4 99.2 99.4
4 Castilla y León, Castilla la Mancha and Extremadura
98.6 96.0 99.2 98.6
5 Catalonia 99.9 99.4 100.0 99.8
6 Valencia, Murcia and the Balearic Islands 95.3 95.3 98.0 98.8
7 Madrid 97.2 96.5 99.7 99.6
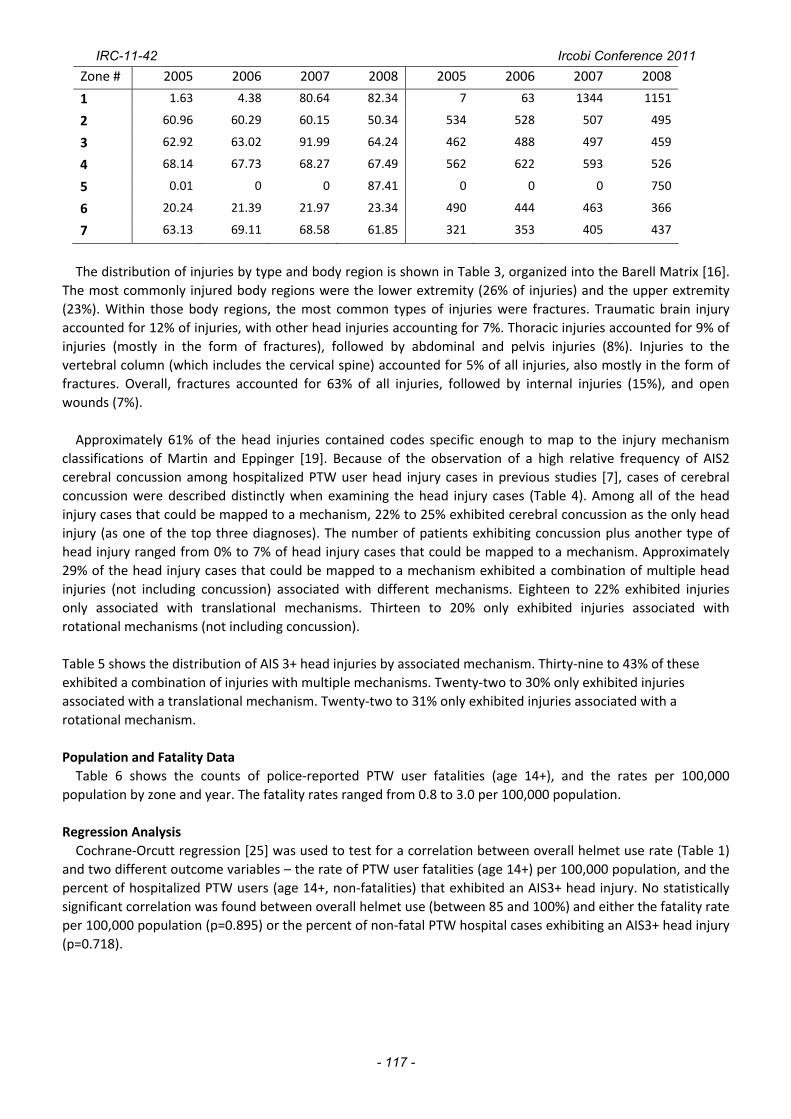
Hospital discharge data Table 2 shows the percent of hospital discharge records of injury patients that included external cause of
injury information (E‐code), and the numbers of non‐fatal hospital injury patients (age 14+) identified as PTW user casualties. The percent of hospital records including E‐codes varied widely by zone and year, ranging from 0% to 87%. In some cases (e.g., Zones 1 and 5), the percent E‐code reporting changed dramatically in time due systematic changes in reporting practices. Such changes included the legislative addition of reporting variable fields dedicated specifically to E‐codes (as opposed to having E‐codes float among general diagnosis fields). A total of 541,777 non‐fatal injury cases (age 14+) were identified that had E‐code information. Of those,
12,867 were identified as PTW user casualties. Those 12,867 cases exhibited a total of 21,077 injuries, for an average of 1.6 injuries per case (counts limited to the top three diagnoses). For comparison, a total of 64,149 non‐fatal injury cases (age 14+) were identified as automobile collision casualties (including PTW users). Table 2: Percent of hospital records of non‐fatal injury patients containing external cause of injury information (E‐code), and the number of hospital injury patients identified as PTW collision casualties (age 14+, non‐fatalities) for Spain, 2005‐2008, by zone.
% of Records with E‐code # of Patients Identified as PTW users
IRC-11-42 Ircobi Conference 2011
- 116 -
Zone # 2005 2006 2007 2008 2005 2006 2007 2008
1 1.63 4.38 80.64 82.34 7 63 1344 1151
2 60.96 60.29 60.15 50.34 534 528 507 495
3 62.92 63.02 91.99 64.24 462 488 497 459
4 68.14 67.73 68.27 67.49 562 622 593 526
5 0.01 0 0 87.41 0 0 0 750
6 20.24 21.39 21.97 23.34 490 444 463 366
7 63.13 69.11 68.58 61.85 321 353 405 437
The distribution of injuries by type and body region is shown in Table 3, organized into the Barell Matrix [16].
The most commonly injured body regions were the lower extremity (26% of injuries) and the upper extremity (23%). Within those body regions, the most common types of injuries were fractures. Traumatic brain injury accounted for 12% of injuries, with other head injuries accounting for 7%. Thoracic injuries accounted for 9% of injuries (mostly in the form of fractures), followed by abdominal and pelvis injuries (8%). Injuries to the vertebral column (which includes the cervical spine) accounted for 5% of all injuries, also mostly in the form of fractures. Overall, fractures accounted for 63% of all injuries, followed by internal injuries (15%), and open wounds (7%). Approximately 61% of the head injuries contained codes specific enough to map to the injury mechanism
classifications of Martin and Eppinger [19]. Because of the observation of a high relative frequency of AIS2 cerebral concussion among hospitalized PTW user head injury cases in previous studies [7], cases of cerebral concussion were described distinctly when examining the head injury cases (Table 4). Among all of the head injury cases that could be mapped to a mechanism, 22% to 25% exhibited cerebral concussion as the only head injury (as one of the top three diagnoses). The number of patients exhibiting concussion plus another type of head injury ranged from 0% to 7% of head injury cases that could be mapped to a mechanism. Approximately 29% of the head injury cases that could be mapped to a mechanism exhibited a combination of multiple head injuries (not including concussion) associated with different mechanisms. Eighteen to 22% exhibited injuries only associated with translational mechanisms. Thirteen to 20% only exhibited injuries associated with rotational mechanisms (not including concussion). Table 5 shows the distribution of AIS 3+ head injuries by associated mechanism. Thirty‐nine to 43% of these exhibited a combination of injuries with multiple mechanisms. Twenty‐two to 30% only exhibited injuries associated with a translational mechanism. Twenty‐two to 31% only exhibited injuries associated with a rotational mechanism. Population and Fatality Data Table 6 shows the counts of police‐reported PTW user fatalities (age 14+), and the rates per 100,000
population by zone and year. The fatality rates ranged from 0.8 to 3.0 per 100,000 population.
Regression Analysis Cochrane‐Orcutt regression [25] was used to test for a correlation between overall helmet use rate (Table 1)
and two different outcome variables – the rate of PTW user fatalities (age 14+) per 100,000 population, and the percent of hospitalized PTW users (age 14+, non‐fatalities) that exhibited an AIS3+ head injury. No statistically significant correlation was found between overall helmet use (between 85 and 100%) and either the fatality rate per 100,000 population (p=0.895) or the percent of non‐fatal PTW hospital cases exhibiting an AIS3+ head injury (p=0.718).
IRC-11-42 Ircobi Conference 2011
- 117 -

Table 3: Percent distribution of non
‐fatal in
juries categorized
by the Ba
rell Matrix [16] (PTW user ho
spita
lizations, n
on‐fatalities, zon
es aggregated, years 200
5‐20
08
aggregated
, age 14+, N
=21,07
7 injuries from
12,86
7 cases, 95%
C.I. sho
wn in paren
theses)
Fracture
s Dislocatio
ns
Internal
Ope
n Wou
nd
Ampu
tatio
n Ve
ssels
Contusion‐
Supe
rficial
Crush
Burns
Others
Not
Specified
Total
Traumatic brain injury
3.9†
(3.6‐4.2)
* 7.9
(7.6‐8.3)
0.0
0.0
11.9
(11.4‐12.3)
Other Head
4.5
(4.2‐4.8)
0.0
2.2
(2.0‐2.4)
0.1
0.0
<0.1
0.2
7.1
(6.8‐7.4)
Neck
<0.1
<0.1
0.0
0.0
0.0
0.1
Neck and Head Other
<0.1
0.6
(0.5‐0.7)
0.0
<0.1
0.0
0.1
0.7
(0.6‐0.8)
Spinal Cord
1.2
(1.0‐1.3)
0.3
(0.2‐0.4)
1.5
(1.3‐1.7)
Verteb
ral Colum
n 4.1
(3.7‐4.2)
0.1
0.4
(0.3‐0.5)
4.5
(4.2‐4.8)
Thorax
5.4
(5.1‐5.7)
<0.1
2.8
(2.5‐3.0)
<0.1
0.1
0.3
(0.2‐0.4)
0.0
0.0
0.0
8.6
(8.2‐9.0)
Abd
omen
, Pelvis,
Trun
k, and
Low
er
Back
2.2
(1.9‐2.4)
0.1
3.7
(3.5‐3.9)
0.3
(0.2‐0.4)
<0.1
0.6
(0.5‐0.7)
<0.1
<0.1
<0.1
0.4
(0.3‐0.5)
7.5
(7.1‐7.8)
Upp
er Extremity
17.7
(17.2‐18.3)
2.1
(1.9‐2.3)
1.4
(1.2‐1.5)
0.1
<0.1
0.9
(0.7‐1.0)
<0.1
0.1
0.7
(0.6‐0.8)
0.1
23.1
(22.5‐23.6)
Hip
1.4
(1.2‐1.6)
0.4
(0.3‐0.5)
<0.1
0.0
0.1
1.9
(1.7‐2.0)
Lower Extremity
22.8
(22.2‐23.4)
0.8
(0.7‐0.9)
0.4
(0.3‐0.5)
0.1
0.6
(0.5‐0.7)
<0.1
0.1
1.3
(1.2‐1.5)
26.2
(25.6‐26.7)
Multip
le bod
y region
s, system wide,
or unspe
cifie
d <0.1
0.0
<0.1
2.9
(2.6‐3.0)
<0.1
0.1
3.0
(2.8‐3.3)
0.0
<0.1
0.4
(0.3‐0.5)
0.7
(0.6‐0.9)
7.2
(6.9‐7.6)
TOTA
L 63.1
(62.4‐63.7)
3.5
(3.2‐3.7)
14.9
(14.3‐
15.3)
7.2
(6.8‐7.5)
0.3
(0.2‐0.4)
0.3
(0.2‐0.4)
6.2
(5.8‐6.5)
0.1
0.2
(0.1‐0.3)
3.0
(2.8‐3.2)
1.5
(1.3‐1.7)
100
* Gray cells indicate bod
y region
/injury type
com
binatio
ns th
at do no
t exist in
the ICD‐9‐CM.
† This cell include
s traumatic brain injuries associated with
a skull fracture. The
se are com
bine
d into single code
s in IC
D‐9‐CM (e
.g., Co
de 800
.1: “Fracture of vault of skull, closed with
cerebral laceratio
n and contusion”).
IRC-11-42 Ircobi Conference 2011
- 118 -

Table 4: Distribution of head injury cases by injury type or associated injury mechanism (PTW user hospitalizations, non‐fatalities, zones aggregated, age 14+, N=2176) 2005 2006 2007 2008
Concussion Only 21.9 24.2 25.4 24.2 + Other Rotational Inj. 0.0 0.0 0.0 0.0 + Translational Inj. 0.2 1.0 0.5 0.2 + Either‐type Inj. 6.9 0.8 0.6 1.0
With
Co
ncussion
+ Combination 0.2 0.0 0.0 0.0
Other Rotational Injury 12.5 17.5 16.7 19.9
Translational Injury 22.1 18.3 18.5 16.7
Either‐Type Injury 6.9 9.6 9.0 9.4
With
out
Concussion
Combination 29.2 28.5 29.4 28.6
Table 5: Distribution of AIS3+ head injury cases by associated injury mechanism (PTW user hospitalizations, non‐fatalities, zones aggregated, age 14+, N=1566). 2005 2006 2007 2008 Rotational Injury 21.7 30.6 28.7 30.9 Translational Injury 30.3 23.1 23.2 21.5 Either‐type injury 4.6 6.9 7.8 7.2 Combination 43.3 39.3 40.3 40.4 Table 6: Police‐reported PTW user fatality counts and rates per 100,000 population for Spain, years 2005‐2008, by zone (fatality counts and population base both age 14+).
Number of PTW User Fatalities Rate per 100,000 population
Zone # 2005 2006 2007 2008 2005 2006 2007 2008
1 199 201 218 142 2.4 2.3 2.5 1.6
2 51 46 49 45 1.3 1.2 1.3 1.2
3 79 77 100 62 2.0 1.9 2.5 1.6
4 93 107 112 89 1.9 2.2 2.3 1.8
5 160 148 168 128 2.6 2.4 2.7 2.0
6 160 148 189 131 2.7 2.4 3.0 2.0
7 40 52 58 43 0.8 1.0 1.1 0.8
I. DISCUSSION Based on the patients records with the external cause of injury information available, approximately two
percent of the patients age 14+ discharged alive from a hospital following an injurious event (of any type, including unintentional injuries, intentional injuries, and violence) were identified as PTW collision casualties. For comparison, automobile collision casualties (including PTW users) accounted for a total of approximately 12% of non‐fatal injury patients (age 14+). Among the non‐fatal PTW patients, the most commonly injured body regions in this study were the upper and lower extremities, mostly in the form of fractures. This is consistent with recent studies of PTW user injuries in the U.S. and Europe. In a sample‐based study of hospital‐discharge records of motorcycle injury patients in the U.S., Coben et al. [4] found that the most common principal diagnoses were fractures of the lower extremity (29.4 %) and upper extremity (13.1%). In a census‐based study of hospital discharge records in eight European countries (including the Spanish data used in the current study), Forman et al. [7] found that the most commonly occurring injuries among PTW patients were fractures of the lower extremity (20% of injuries) and the upper extremity (15%). In a study of PTW user hospital data from two large Italian cities, Latorre et al. [12] found that at least 35% of the injuries occurred in the lower extremity, and 17% occurred in the upper extremity. While these types of injuries are not necessarily life‐threatening, they can represent a major source of long‐term functional disability [7].
IRC-11-42 Ircobi Conference 2011
- 119 -

This study did not observe any correlation between fluctuations in overall helmet use rate (between 85 and 100%) and the prevalence of AIS 3+ head injuries among non‐fatal PTW user hospital cases. This is consistent with the observation of similar head injury rates in previous studies of populations with much lower helmet use. The percentage of intracranial injuries observed in the U.S.‐based study of Coben et al. [4] (12.3% of all principal diagnoses) was consistent with the percentage of traumatic brain injuries in the current study (11.9%), despite a generally lower helmet use rate in the U.S. in the time period studied (58% in 2007 [6]). Similarly, Latorre et al. [12] observed a similar rate of all head injuries (17.5% of all injuries, compared to 19% in the current study), despite a very low helmet use rate (12%) among the injured in the Italian data. These observations may be attributable to the confounding effects of on‐scene deaths. Unlike non‐fatal cases, head injuries are commonly shown to be the most‐frequently injured body region among fatally‐injured PTW riders [27], [28]. When helmet use is known on an individual level, the use of helmets has been regularly shown to reduce both the incidence and severity of head injuries [29], [30], [31], [32]. When non‐fatal hospital discharge data are examined on an ecological level (knowing only overall helmet use), it is possible that an overall decrease in head injury severity (with greater overall helmet use rates) could be balanced by an increase in hospitalizations from surviving patients that would have otherwise been killed. Or, given that non‐helmeted riders are much more likely to die in a collision than helmeted riders [8], it is possible that non‐helmeted riders are under‐represented in non‐fatal hospital discharge records independent of fluctuations in overall helmet use rates (within the range studied here). Unfortunately the structure of the data collected in most countries, including Spain, does not allow a comprehensive census‐level evaluation of the nature of injuries among the combined population of fatal and non‐fatal cases, due to a lack of on‐scene fatalities in hospital record datasets and a lack of detailed injury information in police‐reported fatality datasets. Among the AIS3+ head injuries in non‐fatally injured patients that could be mapped to a mechanism, 22‐31%
were only associated with rotational mechanisms, and approximately 40% exhibited a combination of multiple injuries associated with a variety of mechanisms. Approximately 22‐30% were associated with a translational mechanism only. Although individual helmet use was not known in these cases, it is also unknown the degree to which helmets protect against rotational head injuries. Current European Union helmet performance regulations are based predominantly on impact attenuation during a translational (linear) head‐drop performance test [33]. Neither that test, nor the test assessment measures (linear acceleration and the Head Injury Criterion, HIC) are designed to assess the risk of rotational traumatic brain injury. Future work should include an examination of the causes of rotational head injury among PTW users to identify opportunities for further intervention. In addition, this study and previous studies [7], [34] have reported high rates of cerebral concussions or other AIS 2 head injuries among PTW users. Although not necessarily life threatening, their high relative frequency and potential long‐term effects suggests further study may be warranted to determine if cerebral concussions among PTW users should be targeted for further intervention. Fatality Rates Despite near 100% overall helmet use rates, this study still observed substantial numbers of PTW user
fatalities. This study also did not observe any statistically significant correlation between overall helmet use rates (between 85 and 100%) and the rate of PTW user fatalities per 100,000 population. Among other factors, this is likely affected by fluctuations in exposure not addressed in this study (e.g., the number of PTW users and vehicle‐miles traveled in Spain). PTW use throughout Europe may be increasing due to fuel economy and environmental concerns. Between 2004 and 2005 alone, Segui‐Gomez and Lopez‐Valdes [5] reported a 172% increase in new PTW registrations in Spain. As a result, gains in individual safety from helmet use may be overshadowed by an overall increase in the number of users exposed, especially when the fluctuation in overall helmet use is small (such as observed here). In a previous study of PTW user mortality in Spain, Ferrando et al. [35] did observe a reduction in fatality rates normalized by the total number of PTW users, comparing a time period of 36% overall helmet use (pre‐helmet law) to a time period of 91% helmet use (post‐helmet law). Similar results were observed by McSwain et al. [13], who compared PTW user fatality rates (normalized by PTW user registrations) between periods in which helmet use changed from 50% to near 100% (also as a result of changes in helmet use laws). Even with normalization by number of PTW users, however, the ecological effects of helmet use rates can be confounded by factors such as population density, roadway design, number of miles traveled,
IRC-11-42 Ircobi Conference 2011
- 120 -

travel speed, and many other factors [26]. Other Limitations As discussed above, the hospital data used here are inherently limited in the study of fatalities (due to the lack
of on‐scene fatality information). Hospital discharge data are also limited in the study of very minor injuries that do not require hospital admittance [26]. Thus, hospital‐discharge data are best suited to the study of potentially‐survivable injuries (or in the current study, non fatal injuries) that are severe enough to require hospital admittance. It is possible, however, that differences in hospital admittance or diagnosis practices may introduce biases in hospital record data, especially for injuries of lower severity. For example, Forman et al. [7] observed a higher frequency of cerebral concussion as the only head injury in hospitalized PTW users in eight European countries (44% of head injury cases that could be mapped to a mechanism) compared to the lower frequency observed in the current study (22‐25% of head injury cases that could be mapped to a mechanism). This could be due to differences in diagnosis or admittance practices relating to cerebral concussions across countries, locales, hospitals, or even individual physicians. Future work could include studying differences in hospital admittance practices across countries, and how this affects perceptions in injury prevention priorities. In addition, the fatality data presented here included deaths occurring within 24 hours following a collision. It
is likely that some deaths occurred after 24 hours, and thus were not counted in the police data. The number of deaths missed in this manner, however, was likely small. Examining the hospital discharge data indicates that 75‐100% of deaths of hospitalized persons were within the first 24 hours after admittance (varying by year). If on‐scene deaths were added to that figure, then the percentage of deaths occurring within the first 24 hours following the collision (and thus, captured by the police data) would be even greater. The proportion of hospital records of injury cases that included external cause of injury information varied
widely across zones and years. It is important to note that Table 2 describes the number of non‐fatal hospital injury admissions (age 14+) that were identified as PTW users. Those identification counts were inherently affected by the percentage of cases for which E‐codes were reported. Because the E‐code reporting varied across regions and across years, the absolute counts in Table 2 cannot be used to infer trends in PTW user hospital admission either in time or across zones. Instead, the counts in Table 2 are included simply to describe magnitude of the sample base available for study. Unfortunately, this type of limited E‐code reporting is common within Europe [7] and throughout the world. As a result, it was not possible to ascertain the total number of hospitalizations (or the population rate of hospitalizations) attributable to PTW collisions. Although some older studies (time period 1979‐1988) have indicated that limitations in E‐coding may result in some reporting bias [36], there is currently no evidence to suggest that coding bias may exist in more modern datasets, or in the specific dataset studied here. Regardless, future efforts should include improving the rate of E‐code reporting for injury cases both within Spain, and in all other hospital‐based injury surveillance systems. In addition, the AIS 1998 codes and head injury mechanism classifications are descriptive measures that were
determined from the ICD codes based on translational algorithms. These are subject to assumptions and case losses inherent to shifting between different coding criteria. Although most of the PTW user ICD codes could be mapped to the AIS, only 61% of the head injury cases contained information specific enough to be mapped to a head injury mechanism. As a result, the head injury mechanism classifications discussed here don’t necessarily represent the characteristics of the entire population of hospitalized PTW users, but instead represent a sample with a potential for some sampling error. As with the E‐code losses discussed above, there is currently no information to suggest that losses in the head injury mechanism information would be systematically biased. Future work could include investigating whether or not any systematic bias exists, or developing methods to identify head injury mechanisms directly. The helmet use data presented here were based on observations collected during daylight hours. The hospital
and fatality information included both daytime and nighttime collisions. It is possible that helmet use rates may differ during nighttime hours, and that those may have affected the fatality or injury‐distribution information examined here. Even if this were the case, then it would suggest that helmet use promotion should continue
IRC-11-42 Ircobi Conference 2011
- 121 -

even if rates appear to be at or near 100%, on the possibility that there are groups of non‐helmeted users that may not feature in standard observational studies. Finally, it was not desired to investigate the normalized risk of PTW users to injury or fatality (e.g., risk per
user, or per number of miles driven). Instead it was desired to observe the total numbers of fatalities that occur in Spanish populations. While this may be seen as a limitation, it was in fact an intentionally chosen outcome measure designed to convey the overall burden of PTW user deaths among populations with relatively high helmet use rates. The results indicate that a substantial number of fatalities do still occur, and suggest that efforts continue to advance PTW user safety even after helmet use gains widespread adoption. Implications and Future Work It is important to remember that this study was not intended to be an evaluation of the effectiveness of
helmets, and none of the results shown should be used to draw conclusions on the effectiveness of helmets. Instead, the goal was to observe ‐ from a clinical and public health perspective ‐ remaining challenges in PTW user safety in regions of high population‐based helmet use rates. Helmets have been proven to reduce the risk of death and serious head injury for PTW users [8]. Helmets should always be worn by PTW users, and every effort should be made to reach 100% helmet use in all PTW user populations. However, the results of this study show that even when 100% helmet use is achieved PTW use remains a field with significant safety challenges. Even with near universal helmet use, 3,095 PTW user deaths were observed over a four year period in a single European country. Under universal safety philosophies such as Vision Zero [37] (or its revised formulation as Safe Systems) the continuing occurrence of this number of fatalities is simply unacceptable. In addition, many more cases of non‐fatal PTW user hospitalizations were observed (at least 12,867; the exact number is unknown due to limited E‐code reporting). Most of those involved fractures of the extremities, representing a potential source of long‐term disability that has thus far received little attention from the PTW safety research community. These data also indicated a high relative frequency of rotational and combinational head injury mechanisms among cases of moderate‐to‐severe head injury, for which the effectiveness of helmets is currently unknown. These trends are likely to remain in Spain and in other countries even as helmet use rates approach 100%, unless other complimentary steps are taken to improve PTW user safety. The next phase of this effort should include a comprehensive re‐examination of risk factors for PTW user injury in populations with high‐helmet use rates, including both case‐studies and macroscopic analyses. Such information could be used to develop new intervention targets, which may include roadway design, regulation, passive safety, or additional protective gear.
II. CONCLUSIONS
This study described overall helmet use rates, injury distributions among non‐fatal PTW user hospitalizations, and numbers of police‐reported PTW user fatalities throughout Spain, over a period of four years. Overall helmet use rates ranged from 85% to 100%. The most common injuries among non‐fatally injured PTW user hospitalizations (age 14+) were fractures of the lower extremity (23% of injuries) and fractures of the upper extremity (18% of injuries). Head injuries of various types accounted for 19% of the injuries observed. Fatality rates ranged from 0.8 to 3.0 per 100,000 population, per year. Neither those fatality rates nor the percentage of non‐fatal hospital cases exhibiting an AIS 3+ head injury correlated significantly with fluctuations in overall helmet use rate (within the range studied here). These observations highlight challenges in PTW user safety remaining in populations that exhibit high helmet use rates. Future work includes re‐examining risk factors in these populations to identify continuing opportunities for intervention.
III. ACKNOWLEDGEMENT
This work was partly funded by the Spanish Dirección General de Tráfico (DGT) (2011/0100DGT18710). This work was also partially supported by a Whitaker International Scholars Grant. The authors would also like to thank Anuncia Ocampo of the Observatorio Nacional de Seguridad Vial of the DGT for her assistance in procuring portions of the data used in this study. The opinions expressed in this manuscript are solely those of the authors, and do not necessarily represent the consensus views of the funding organizations.
IRC-11-42 Ircobi Conference 2011
- 122 -

IV. REFERENCES [1] World report on road traffic injury prevention, ed. Peden M, Scurfield R, Sleet D, Mohan D, Hyder A,
Jarawan E, Mathers C, The World Health Organization, Geneva, 2004. [2] Monk JP, Buckley R, Dyer D, Motorcycle‐related trauma in Alberta: a sad and expensive story, Can J
Surg, 52, 6, pages E235‐E240, 2009. [3] SafetyNet ‐ powered two wheelers., European Commission, Road Safety, Available at
http://ec.europa.eu/transport/road_safety/ (retrieved 07/12/2010), 2009. [4] Coben JH, Steiner CA, Owens P, Motorcycle‐related hospitalizations in the United States, 2001,
Am.J.Prev.Med., 27, 5, pages 355‐362, 2004. [5] Segui‐Gomez M, Lopez‐Valdes F, Recognizing the importance of injury in other policy forums: the case
of motorcycle licensing policy in Spain, Injury Prevention, 6, pages 429‐430, 2007. [6] WHO, Global status report on road safety: time for action, The World Health Organization, Geneva,
2009. [7] Forman JL, Lopez‐Valdes FJ, Pollack K, Heredero‐Ordoyo R, Molinero A, Mansilla A, Fildes B, Segui‐
Gomez M, Injuries among powered two‐wheeler users in eight European countries: a descriptive analysis of hospital discharge data, Accident Analysis and Prevention, in press, 2011.
[8] Liu BC, Ivers R, Norton R, Boufous S, Blows S, Lo SK, Helmets for preventing injury in motorcycle riders, Cochrane Database Syst Rev, 1, pages CD004333‐2008.
[9] Hinds JD, Allen G, Morris CG, Trauma and motorcyclists: born to be wild, bound to be injured?, Injury, 38, 10, pages 1131‐1138, 2007.
[10] Zettas JP, Zettas P, Thanasophon B, Injury patterns in motorcycle accidents, J.Trauma, 19, 11, pages 833‐836, 1979.
[11] Robertson A, Branfoot T, Barlow IF, Giannoudis PV, Spinal injury patterns resulting from car and motorcycle accidents, Spine (Phila Pa 1976.), 27, 24, pages 2825‐2830, 12‐15‐2002.
[12] LaTorre G, Bertazzoni G, Zotta D, van BE, Ricciardi G, Epidemiology of accidents among users of two‐wheeled motor vehicles. A surveillance study in two Italian cities, Eur J Public Health, 12, 2, pages 99‐103, 2002.
[13] McSwain NE, Jr., Belles A, Motorcycle helmets‐‐medical costs and the law, J Trauma, 30, 10, pages 1189‐1197, 1990.
[14] Dirección General de Tráfico, Studies and Reports on Road Safety, Observatorio Nacional de Seguridad Vial, Gobierno de España, http://www.dgt.es/portal/es/seguridad_vial/estudios_informes.do, 2010.
[15] National Center for Health Statistics (NCHS). 2011. International Classification of Diseases v.9, 2011 Clinical Modificaition (ICD‐9‐CM),
[16] Barell V, haronson‐Daniel L, Fingerhut LA, MacKenzie EJ, Ziv A, Boyko V, Abargel A, Avitzour M, Heruti R, An introduction to the Barell body region by nature of injury diagnosis matrix, Inj Prev, 8, 2, pages 91‐96, 2002.
[17] AAAM, The Abbreviate Injury Severity Scale, AIS, 1990 update 1998., Association for the Advancement of Automotive Medicine, Des Plaine, IL, 1998.
[18] Center for Injury Research and Policy of the Johns Hopkins University School of Public Health and Trianalytics Inc., ICDMAP‐90: A Program to Map ICD‐9‐CM Diagnoses into AIS and ISS Severity Scores, 1998.
[19] Martin P, Eppinger R, Incidence of head injuries attributable to rotation, Proc.31st International Workshop on Injury Biomechanics Research, National Highway Traffic Safety Administration, 2003.
[20] European Center for Injury Prevention at the Universidad de Navarra, Algorithm to Estimate the Type of Forces Related to Brain Injury using AIS98. 1.0 Stata, 2008.
[21] Arbogast KB, Jermakian JS, Ghati Y, Smith R, Maltese MR, Menon RA, Predictors and patterns of pediatric head injury in motorvehicle crashes, Proceedings of the International Research Council on the Biomechanics of Impact, Prague, Czech Republic, 2005.
[22] Arregui‐Dalmases C, Lopez‐Valdes FJ, Segui‐Gomez M, Pedestrian injuries in eight European countries: an analysis of hospital discharge data, Accid.Anal Prev, 42, 4, pages 1164‐1171, 2010.
[23] Anuario Estadistico de Accidentes, Ministerio del Interio, Direccion General de Trafico, Observacion Nacional de Seguridad Vial, Spain, 2007.
[24] Instituto Nacional de Estadistica, www.ine.es, 2011.
IRC-11-42 Ircobi Conference 2011
- 123 -

[25] Diggle PJ, Heagerty P, Liang K‐Y, Seger SL, Analysis of Longitudinal Data, Second Edition, Oxford University Press, Oxford, 2002.
[26] Lin MR, Kraus JF, Methodological issues in motorcycle injury epidemiology, Accid.Anal Prev, 40, 5, pages 1653‐1660, 2008.
[27] Ankarath S, Giannoudis PV, Barlow I, Bellamy MC, Matthews SJ, Smith RM, Injury patterns associated with mortality following motorcycle crashes, Injury, 33, 6, pages 473‐477, 2002.
[28] Kraus JF, Epidemiology of head injury, in Head Injury, ed. Cooper PR, 2nd ed., Williams & Wilkins, Baltimore, MD, 1989.
[29] Offner PJ, Rivara FP, Maier RV, The impact of motorcycle helmet use, J Trauma, 32, 5, pages 636‐641, 1992.
[30] Rowland J, Rivara F, Salzberg P, Soderberg R, Maier R, Koepsell T, Motorcycle helmet use and injury outcome and hospitalization costs from crashes in Washington State, Am J Public Health, 86, 1, pages 41‐45, 1996.
[31] Wagle VG, Perkins C, Vallera A, Is helmet use beneficial to motorcyclists?, J Trauma, 34, 1, pages 120‐122, 1993.
[32] Lin MR, Kraus JF, A review of risk factors and patterns of motorcycle injuries, Accid.Anal Prev, 41, 4, pages 710‐722, 2009.
[33] ECE/ONU Regulation 22 rev. 5., 2002. Uniform Provisions Concerning the Approval of Protective Helmets and of their Visors for Drivers and Passengers of Motorcycles and Mopeds.,
[34] Hell W, Lob G, Typical injury patterns of motorcyclists in different crash types ‐ effectiveness and improvements of countermeasures, 37th Proc.Annual Proceedings of the Association for the Advancement of Automotive Medicine, pages 77‐86, 1993.
[35] Ferrando J, Plasencia A, Oros M, Borrell C, Kraus JF, Impact of a helmet law on two wheel motor vehicle crash mortality in a southern European urban area, Inj Prev, 6, 3, pages 184‐188, 2000.
[36] Marganitt B, MacKenzie EJ, Smith GS, Damiano AM, Coding external causes of injury (E‐codes) in Maryland hospital discharges 1979‐88: a statewide study to explore the uncoded population, Am J Public Health, 80, 12, pages 1463‐1466, 1990.
[37] Fahlquist JN, Responsibility ascriptions and Vision Zero, Accid.Anal Prev, 38, 6, pages 1113‐1118, 2006. [38] Coggon D, Rose G, Barker DJP, Epidemiology for the uninitiated, 4th edition, BMJ Publishing Group, 1997.
IRC-11-42 Ircobi Conference 2011
- 124 -