december 31, 2020 t. rowe price rpmgx
TRANSCRIPT

T. ROWE PRICE
December 31, 2020ANNUAL REPORT
RPMGX Mid-Cap Growth Fund
PAMCX Mid-Cap Growth Fund– Advisor Class
RRMGX Mid-Cap Growth Fund– R Class
RPTIX Mid-Cap Growth Fund– I Class
TRQZX Mid-Cap Growth Fund– Z Class
For more insights from T. Rowe Price investment professionals, go to troweprice.com.
armcg_1220_P4Proof #
armcg_1220_P4Proof #
Log in to your account at troweprice.com for more information.
* Certain mutual fund accounts that are assessed an annual account service fee can also save money by switching to e-delivery.
It’s fast—receive your statements and confirmations faster than U.S. mail.
It’s convenient—access your important account documents whenever you need them.
It’s secure—we protect your online accounts using “True Identity” to confirm new accounts and make verification faster and more secure.
It can save you money—where applicable, T. Rowe Price passes on the cost savings to fund holders.*
TO ENROLL:If you invest directly with T. Rowe Price, go to troweprice.com/paperless.
If you invest through an investment advisor, a bank, or a brokerage firm, please contact that organization and ask if it can provide electronic documentation.
Go PaperlessSign up for e-delivery of your statements, confirmations, and prospectuses or shareholder reports.
T. ROWE PRICE MId-CAP GROWTh Fund
HIGHLIGHTS
nn The Mid-Cap Growth Fund delivered strong absolute returns for the year but underperformed the Russell Midcap Growth Index, which was led by “growth at any price” stocks that do not meet our investment criteria.
nn Our information technology holdings surged nearly 44% on an overall basis, but our cautious positioning in this richly valued sector weighed on relative results.
nn We continue to evaluate investments in light of their ability to outperform as the economy stabilizes, seeking opportunities in durable-growth companies that appear undervalued by the market.
nn We have witnessed several previous cycles of market exuberance come to abrupt ends, and we are confident that our valuation-sensitive and risk-aware investment approach will help us continue to deliver solid long-term performance for our shareholders.
armcg_1220_P4Proof #
1
T. ROWE PRICE MId-CAP GROWTh Fund
CIO Market Commentary
Nearly all major stock and bond indexes produced positive results during 2020 as markets recovered from the steep sell-off that resulted from the spread of the coronavirus. Extraordinary fiscal and monetary support from global governments and central banks helped spur the rebound, although the pandemic continued to pose significant public health and economic challenges as the year came to an end.
In the U.S., the large-cap Dow Jones Industrial Average and S&P 500 Index reached record highs, as did the technology-heavy Nasdaq Composite Index—a result that few would have predicted in late March after the benchmarks tumbled more than 30% as governments instituted lockdowns to try to halt the spread of the virus. Large-cap information technology and internet-related firms helped lead the rebound as they benefited from the work-from-home environment and an acceleration in demand for online services.
Within the S&P 500, the technology and consumer discretionary sectors were the top performers, and communication services and materials stocks also outperformed. Despite a late rally, the energy sector trailed with significant losses due to a plunge in oil prices.
Most equity markets outside the U.S. also performed well. Emerging markets outpaced developed markets, and Asian shares delivered strong results as China and other countries in the region proved relatively successful in containing the coronavirus.
Growth stocks significantly outpaced their value counterparts for the full year; however, value shares rallied late in the period. Positive vaccine news in November raised hopes for a return to normalcy in 2021 and boosted sectors that had been beaten down in the initial phases of the pandemic.
Within the fixed income universe, corporate bonds delivered strong results as the market easily absorbed a torrent of new issuance. After falling to record lows in March, intermediate- and longer-term Treasury yields ticked higher later in the year but remained very low by historical standards, a factor that encouraged investors to seek out riskier securities with higher return potential.
armcg_1220_P4Proof #
2
T. ROWE PRICE MId-CAP GROWTh Fund
CIO Market Commentary
While investors had reason to cheer the market’s recovery, the global economic outlook remained unclear as the year came to an end. Most notable on the positive side was the start of vaccine distributions, which provided hope that the pandemic was in its final phase. In addition, Congress passed a $900 billion coronavirus relief package, supplementing the $2.4 trillion allocated to address the crisis earlier in the year, and the Fed continued to pledge very accommodative monetary policies for the foreseeable future. Meanwhile, political uncertainty diminished with Joe Biden’s victory in the U.S. presidential election and the completion of a Brexit trade deal between the UK and the European Union.
On the negative side, concerns about a resurgence in virus hospitalizations led to new lockdowns and business restrictions in many countries, which in turn appeared to threaten economic recoveries. In the U.S., after a strong recovery in the summer and fall, the pace of hiring slowed late in the year, and household spending declined in November for the first time since April.
It was a remarkable 12-month period in many ways, but as far as markets are concerned, I can recall no calendar year that so starkly displayed evidence of both fear and greed. Fear emerged during the March sell-off and again in April as oil futures briefly traded in negative territory. Greed surfaced later as some assets seemed to continue to rally without fundamental support. Bitcoin rocketed to a record high of $29,000 by year-end, and the amount of money raised by initial public offerings also climbed to historic levels. While valuations are still attractive in some areas of the market, other sectors appear to have already priced in a strong rebound in earnings and are trading at elevated levels.
There are both risks and potential rewards in this environment, and we believe strong fundamental analysis and skilled active security selection will remain critical components of investment success.
Thank you for your continued confidence in T. Rowe Price.
Sincerely,
Robert SharpsGroup Chief Investment Officer
armcg_1220_P4Proof #
3
T. ROWE PRICE MId-CAP GROWTh Fund
Management’s discussion of Fund Performance
INVESTMENT OBJECTIVE
The fund seeks to provide long-term capital appreciation by investing in mid-cap stocks with potential for above-average earnings growth.
FUND COMMENTARY
How did the fund perform in the past 12 months?
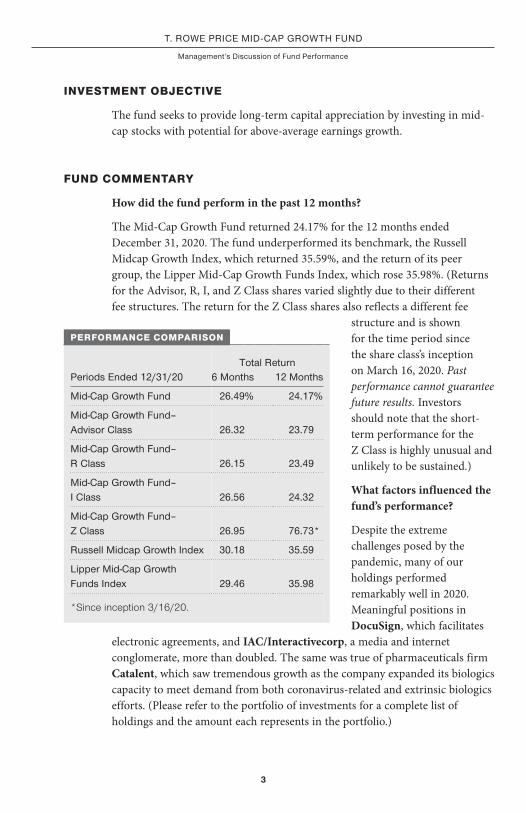
The Mid-Cap Growth Fund returned 24.17% for the 12 months ended December 31, 2020. The fund underperformed its benchmark, the Russell Midcap Growth Index, which returned 35.59%, and the return of its peer group, the Lipper Mid-Cap Growth Funds Index, which rose 35.98%. (Returns for the Advisor, R, I, and Z Class shares varied slightly due to their different fee structures. The return for the Z Class shares also reflects a different fee
structure and is shown for the time period since the share class’s inception on March 16, 2020. Past performance cannot guarantee future results. Investors should note that the short-term performance for the Z Class is highly unusual and unlikely to be sustained.)
What factors influenced the fund’s performance?
Despite the extreme challenges posed by the pandemic, many of our holdings performed remarkably well in 2020. Meaningful positions in DocuSign, which facilitates
electronic agreements, and IAC/Interactivecorp, a media and internet conglomerate, more than doubled. The same was true of pharmaceuticals firm Catalent, which saw tremendous growth as the company expanded its biologics capacity to meet demand from both coronavirus-related and extrinsic biologics efforts. (Please refer to the portfolio of investments for a complete list of holdings and the amount each represents in the portfolio.)
Total ReturnPeriods Ended 12/31/20 6 Months 12 Months
Mid-Cap Growth Fund 26.49% 24.17%
Mid-Cap Growth Fund– Advisor Class 26.32 23.79
Mid-Cap Growth Fund– R Class 26.15 23.49
Mid-Cap Growth Fund– I Class 26.56 24.32
Mid-Cap Growth Fund– Z Class 26.95 76.73*
Russell Midcap Growth Index 30.18 35.59
Lipper Mid-Cap Growth Funds Index 29.46 35.98
*Since inception 3/16/20.
PERFORMANCE COMPARISON
armcg_1220_P4Proof #
4
T. ROWE PRICE MId-CAP GROWTh Fund
Nevertheless, the sharp outperformance of “growth at any price” companies in the mid-cap space—names that we do not favor as risk-aware, valuation-sensitive growth investors—caused us to lag our benchmark in 2020. While market upheaval often leads to a change in market leadership, this was not the case during the period. Many high-flying names that led coming into the year outperformed in the sell-off and then continued their strong run in the recovery.
Although we enjoyed strong absolute returns in both sectors, information technology (IT) and health care were the largest detractors from relative results. Many fast-growing but expensive IT companies do not fit our investment framework, particularly in software and pockets of IT services and health care. As their valuations became even more extreme, a lack of exposure to such names hindered our relative performance. Stock selection in health care, particularly holdings in health care equipment and supplies, also weighed on relative returns. Delays in non-urgent medical care pressured shares of two of our key holdings, Teleflex and Cooper Companies. While both companies must continue to navigate near-term headwinds, partially influenced by the pandemic, we believe them to be high-quality, durable-growth names that will add value over the longer term.
We enjoyed good results from positions in several consumer discretionary holdings, including auto parts company Aptiv, which benefited from growing demand for electric and hybrid vehicles and a sustained recovery in China's car market, and Dunkin Brands, which surged upon the announcement that the company agreed to be acquired by Inspire Brands at a premium valuation. Stock selection in this sector at the epicenter of the virus generally weighed on returns, however. Norwegian Cruise Line Holdings found itself in the crosshairs of the coronavirus pandemic and the persistent overhang of a “no sail” order. The company has made tremendous improvements in recent years and secured a dominant position within the cruising industry, but our evaluation of the extraordinary amount of stock dilution led us to eliminate the investment.
Conversely, an underweight allocation to the consumer staples sector contributed to relative performance. The sector underperformed the broader Russell Midcap Growth Index, and we have minimal exposure to the space, where few firms meet our growth criteria.

armcg_1220_P4Proof #
5
T. ROWE PRICE MId-CAP GROWTh Fund
How is the fund positioned?
We continue to evaluate investments in light of their ability to return to normalized earnings and outperform as the economy stabilizes, seeking opportunities to add to durable-growth companies that we believe are reasonably valued. Some of our larger trades during the period occurred within health care, IT, and consumer discretionary.
Health care was the fund’s largest sector allocation in absolute terms, and our exposure rose to slightly more than one-quarter of the fund’s assets at year-end. We capitalized on opportunities to add to positions within biotechnology and life sciences tools and services over the period. We started a position in Ionis Pharmaceuticals and added to Incyte, both biotechnology companies trading at compelling valuations with promising drug pipelines that we believe can generate significant shareholder value over time. We initiated a position in Quidel, a diagnostic health care company that received federal emergency authorization for its rapid-response COVID-19 antigen test in May. Despite competition and vaccine-driven volatility, we think Quidel has solid growth prospects as it develops new rapid tests that should endure when COVID-19 testing begins to subside.
IT is the second-largest area of investment, but it remained our largest underweight versus the benchmark, as we have found the valuations of many of these names to be disconnected from their fundamentals. Nevertheless, we have found a few opportunities in companies trading at reasonable valuations, and we took new positions in Citrix and KLA. We think KLA will see rising demand for its process control capabilities as semiconductor makers produce higher volumes of smaller and more powerful processing chips. We eliminated financial technology companies Fiserv and Fidelity National Information Services from the portfolio and reduced our position in Global Payments after merger activity by all three pushed them into the large-cap space. Among software names, we eliminated Workday and reduced our position in DocuSign on strength.
Investing in the consumer discretionary space during a turbulent year for the sector required discipline and careful analysis. We started a position in e-commerce platform Etsy, which offers unique, artisan merchandise to consumers. While face mask demand was part of the reason for Etsy’s accelerated growth in 2020, recent investments in business operations and data technology have enhanced the user experience and improved customer
armcg_1220_P4Proof #
6
T. ROWE PRICE MId-CAP GROWTh Fund
retention, both of which we expect to be critical long-term drivers for the company. We reinstated a position in Chipotle after its shares sold off with the restaurant industry in the first quarter. Chipotle’s leadership in mobile ordering and established takeout and delivery capabilities have given it a clear advantage over peers reliant on in-person dining during COVID, and the company is well positioned to emerge stronger and take share on the other side of the pandemic. Conversely, discount retailer Ross Stores came under pressure following mandated store closures due to COVID restrictions. We took the opportunity to start a position in this well-run off-price retailer, which we believe will continue to take share from department stores as the economy recovers.
What is portfolio management’s outlook?
Mid-cap stocks staged a huge comeback in 2020 after the first quarter’s historic sell-off, aided in no small part by the Federal Reserve’s extraordinary stimulus measures to shore up the coronavirus-stricken U.S. economy. Although the Fed’s emergency actions were intended to stabilize financial markets as the health crisis escalated in March, the backstop the Fed provided for Wall Street prolonged the disregard for risk that has driven the market’s gains in recent years. Moreover, thanks to remote working and new consumer behaviors introduced by the pandemic, the virus pulled forward
the growth of many companies, particularly in software. Valuations for many high-priced, aggressive-growth technology stocks have climbed to even more rarefied levels as a result, pushing the disconnect with their fundamentals to extreme levels.
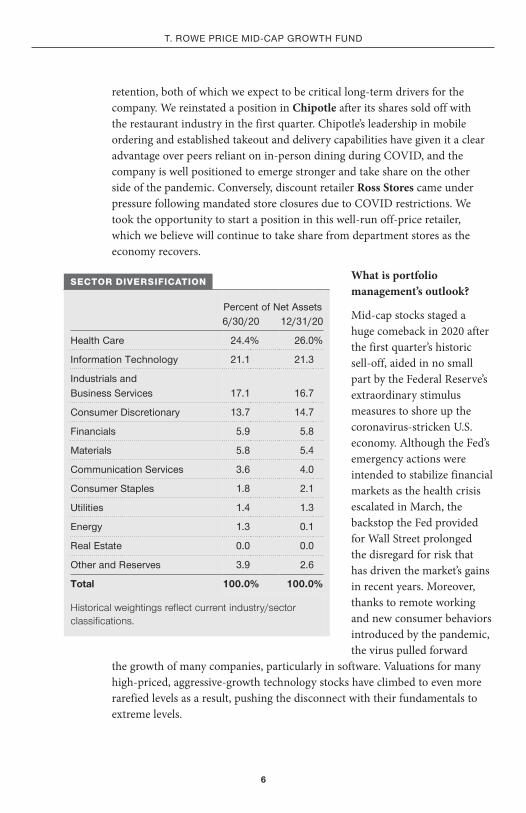
Percent of net Assets6/30/20 12/31/20
health Care 24.4% 26.0%
Information Technology 21.1 21.3
Industrials and Business Services 17.1 16.7
Consumer discretionary 13.7 14.7
Financials 5.9 5.8
Materials 5.8 5.4
Communication Services 3.6 4.0
Consumer Staples 1.8 2.1
utilities 1.4 1.3
Energy 1.3 0.1
Real Estate 0.0 0.0
Other and Reserves 3.9 2.6
Total 100.0% 100.0%
Historical weightings reflect current industry/sector classifications.
SECTOR DIVERSIFICATION

armcg_1220_P4Proof #
7
T. ROWE PRICE MId-CAP GROWTh Fund
Aggressive stimulus, interest rates near zero, and low inflation will not last forever, however. In our view, the inevitable disappearance of these tailwinds is not reflected in the rich growth expectations baked into many high-flying stocks. In our nearly three decades managing the fund, we have seen similar periods of complacency on Wall Street, and we believe there will again be a reckoning when these lofty expectations are met with harsh realities.
In the meantime, we continue to leverage our fundamental research platform to select high-quality, reasonably valued companies with durable growth prospects, experienced management, competitive advantages, and solid balance sheets. We are confident that our fundamental research and valuation-sensitive, risk-aware investment approach will help us continue delivering solid long-term performance for our shareholders.
The views expressed reflect the opinions of T. Rowe Price as of the date of this report and are subject to change based on changes in market, economic, or other conditions. These views are not intended to be a forecast of future events and are no guarantee of future results.
armcg_1220_P4Proof #
8
T. ROWE PRICE MId-CAP GROWTh Fund
RISKS OF INVESTING IN THE FUND
Principal Risks As with any fund, there is no guarantee that the fund will achieve its objective(s). The fund’s share price fluctuates, which means you could lose money by investing in the fund. The principal risks of investing in this fund, which may be even greater during periods of market disruption or volatility, are summarized as follows:
Market conditions. The value of the fund’s investments may decrease, sometimes rapidly or unexpectedly, due to factors affecting an issuer held by the fund, particular industries, or the overall securities markets. A variety of factors can increase the volatility of the fund’s holdings and markets generally, including political or regulatory developments, recessions, inflation, rapid interest rate changes, war or acts of terrorism, natural disasters, and outbreaks of infectious illnesses or other widespread public health issues. Certain events may cause instability across global markets, including reduced liquidity and disruptions in trading markets, while some events may affect certain geographic regions, countries, sectors, and industries more significantly than others. These adverse developments may cause broad declines in market value due to short-term market movements or for significantly longer periods during more prolonged market downturns.
Mid-cap stocks. Investments in securities issued by mid-cap companies are likely to be more volatile than investments in securities issued by larger companies. Medium-sized companies may have less experienced management, narrower product lines, and less capital reserves and liquidity than larger companies and are therefore more sensitive to economic, market, and industry changes.
Growth investing. The fund’s growth approach to investing could cause it to underperform other stock funds that employ a different investment style. Growth stocks tend to be more volatile than certain other types of stocks and their prices may fluctuate more dramatically than the overall stock market. A stock with growth characteristics can have sharp price declines due to decreases in current or expected earnings and may lack dividends that can help cushion its share price in a declining market.

armcg_1220_P4Proof #
9
T. ROWE PRICE MId-CAP GROWTh Fund
BENCHMARK INFORMATION
Note: Lipper, a Thomson Reuters Company, is the source for all Lipper content reflected in these materials. Copyright 2021 © Refinitiv. All rights reserved. Any copying, republication or redistribution of Lipper content is expressly prohibited without the prior written consent of Lipper. Lipper shall not be liable for any errors or delays in the content, or for any actions taken in reliance thereon.
Note: Frank Russell Company (Russell) is the source and owner of the Russell index data contained or reflected in these materials and all trademarks and copyrights related thereto. Russell® is a registered trademark of Russell. Russell is not responsible for the formatting or configuration of these materials or for any inaccuracy in T. Rowe Price Associates’ presentation thereof.
armcg_1220_P4Proof #
10
T. ROWE PRICE MId-CAP GROWTh Fund
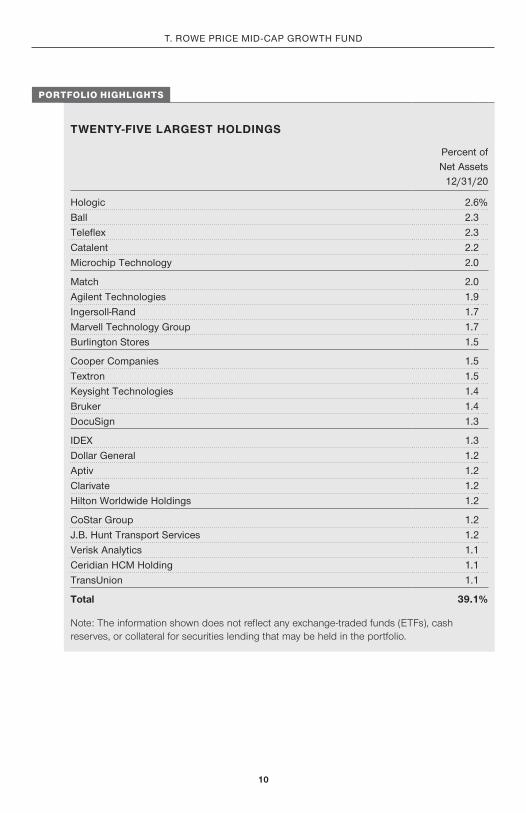
TWENTY-FIVE LARGEST HOLDINGS
Percent of net Assets
12/31/20
hologic 2.6%Ball 2.3Teleflex 2.3Catalent 2.2Microchip Technology 2.0
Match 2.0Agilent Technologies 1.9Ingersoll-Rand 1.7Marvell Technology Group 1.7Burlington Stores 1.5
Cooper Companies 1.5Textron 1.5Keysight Technologies 1.4Bruker 1.4docuSign 1.3
IdEX 1.3dollar General 1.2Aptiv 1.2Clarivate 1.2hilton Worldwide holdings 1.2
CoStar Group 1.2J.B. hunt Transport Services 1.2Verisk Analytics 1.1Ceridian hCM holding 1.1Transunion 1.1
Total 39.1%
Note: The information shown does not reflect any exchange-traded funds (ETFs), cash reserves, or collateral for securities lending that may be held in the portfolio.
PORTFOLIO HIGHLIGHTS
armcg_1220_P4Proof #
11
T. ROWE PRICE MId-CAP GROWTh Fund
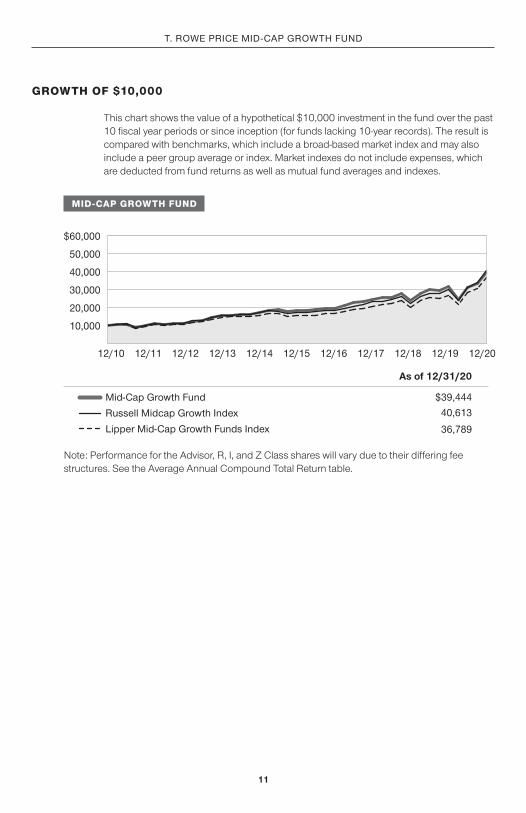
This chart shows the value of a hypothetical $10,000 investment in the fund over the past 10 fiscal year periods or since inception (for funds lacking 10-year records). The result is compared with benchmarks, which include a broad-based market index and may also include a peer group average or index. Market indexes do not include expenses, which are deducted from fund returns as well as mutual fund averages and indexes.
GROWTH OF $10,000
As of 12/31/20
$39,44440,61336,789
Mid-Cap Growth FundRussell Midcap Growth IndexLipper Mid-Cap Growth Funds Index
12/2012/1912/1812/1712/1612/1512/1412/1312/1212/1112/10
10,000
20,000
30,000
40,000
50,000
$60,000
MID-CAP GROWTH FUND
Note: Performance for the Advisor, R, I, and Z Class shares will vary due to their differing fee structures. See the Average Annual Compound Total Return table.
armcg_1220_P4Proof #
12
T. ROWE PRICE MId-CAP GROWTh Fund
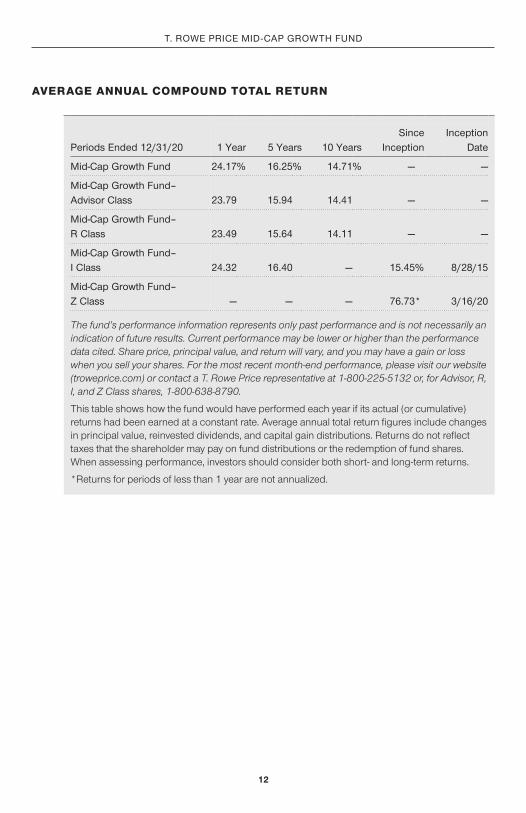
AVERAGE ANNUAL COMPOUND TOTAL RETURN
Periods Ended 12/31/20 1 Year 5 Years 10 YearsSince
InceptionInception
date
Mid-Cap Growth Fund 24.17% 16.25% 14.71% — —
Mid-Cap Growth Fund– Advisor Class 23.79 15.94 14.41 — —
Mid-Cap Growth Fund– R Class 23.49 15.64 14.11 — —
Mid-Cap Growth Fund– I Class 24.32 16.40 — 15.45% 8/28/15
Mid-Cap Growth Fund– Z Class — — — 76.73* 3/16/20
The fund’s performance information represents only past performance and is not necessarily an indication of future results. Current performance may be lower or higher than the performance data cited. Share price, principal value, and return will vary, and you may have a gain or loss when you sell your shares. For the most recent month-end performance, please visit our website (troweprice.com) or contact a T. Rowe Price representative at 1-800-225-5132 or, for Advisor, R, I, and Z Class shares, 1-800-638-8790.
This table shows how the fund would have performed each year if its actual (or cumulative) returns had been earned at a constant rate. Average annual total return figures include changes in principal value, reinvested dividends, and capital gain distributions. Returns do not reflect taxes that the shareholder may pay on fund distributions or the redemption of fund shares. When assessing performance, investors should consider both short- and long-term returns.
*Returns for periods of less than 1 year are not annualized.
armcg_1220_P4Proof #
13
T. ROWE PRICE MId-CAP GROWTh Fund
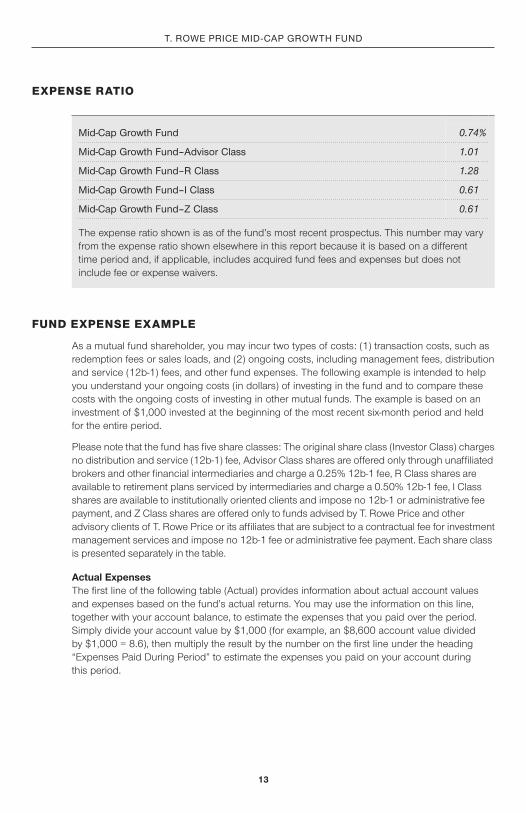
EXPENSE RATIO
Mid-Cap Growth Fund 0.74%
Mid-Cap Growth Fund–Advisor Class 1.01
Mid-Cap Growth Fund–R Class 1.28
Mid-Cap Growth Fund–I Class 0.61
Mid-Cap Growth Fund–Z Class 0.61
The expense ratio shown is as of the fund’s most recent prospectus. This number may vary from the expense ratio shown elsewhere in this report because it is based on a different time period and, if applicable, includes acquired fund fees and expenses but does not include fee or expense waivers.
FUND EXPENSE EXAMPLE
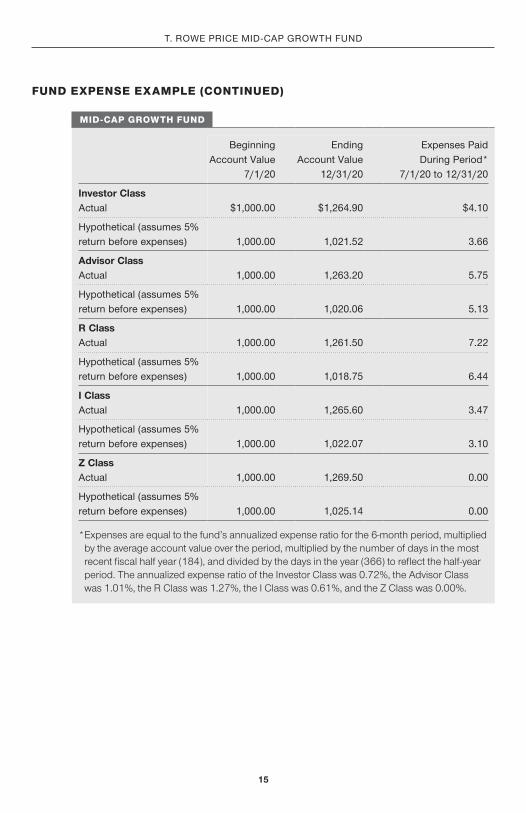
As a mutual fund shareholder, you may incur two types of costs: (1) transaction costs, such as redemption fees or sales loads, and (2) ongoing costs, including management fees, distribution and service (12b-1) fees, and other fund expenses. The following example is intended to help you understand your ongoing costs (in dollars) of investing in the fund and to compare these costs with the ongoing costs of investing in other mutual funds. The example is based on an investment of $1,000 invested at the beginning of the most recent six-month period and held for the entire period.
Please note that the fund has five share classes: The original share class (Investor Class) charges no distribution and service (12b-1) fee, Advisor Class shares are offered only through unaffiliated brokers and other financial intermediaries and charge a 0.25% 12b-1 fee, R Class shares are available to retirement plans serviced by intermediaries and charge a 0.50% 12b-1 fee, I Class shares are available to institutionally oriented clients and impose no 12b-1 or administrative fee payment, and Z Class shares are offered only to funds advised by T. Rowe Price and other advisory clients of T. Rowe Price or its affiliates that are subject to a contractual fee for investment management services and impose no 12b-1 fee or administrative fee payment. Each share class is presented separately in the table.
Actual ExpensesThe first line of the following table (Actual) provides information about actual account values and expenses based on the fund’s actual returns. You may use the information on this line, together with your account balance, to estimate the expenses that you paid over the period. Simply divide your account value by $1,000 (for example, an $8,600 account value divided by $1,000 = 8.6), then multiply the result by the number on the first line under the heading “Expenses Paid During Period” to estimate the expenses you paid on your account during this period.
armcg_1220_P4Proof #
14
T. ROWE PRICE MId-CAP GROWTh Fund
FUND EXPENSE EXAMPLE (CONTINUED)
Hypothetical Example for Comparison PurposesThe information on the second line of the table (Hypothetical) is based on hypothetical account values and expenses derived from the fund’s actual expense ratio and an assumed 5% per year rate of return before expenses (not the fund’s actual return). You may compare the ongoing costs of investing in the fund with other funds by contrasting this 5% hypothetical example and the 5% hypothetical examples that appear in the shareholder reports of the other funds. The hypothetical account values and expenses may not be used to estimate the actual ending account balance or expenses you paid for the period.
Note: T. Rowe Price charges an annual account service fee of $20, generally for accounts with less than $10,000. The fee is waived for any investor whose T. Rowe Price mutual fund accounts total $50,000 or more; accounts electing to receive electronic delivery of account statements, transaction confirmations, prospectuses, and shareholder reports; or accounts of an investor who is a T. Rowe Price Personal Services or Enhanced Personal Services client (enrollment in these programs generally requires T. Rowe Price assets of at least $250,000). This fee is not included in the accompanying table. If you are subject to the fee, keep it in mind when you are estimating the ongoing expenses of investing in the fund and when comparing the expenses of this fund with other funds.
You should also be aware that the expenses shown in the table highlight only your ongoing costs and do not reflect any transaction costs, such as redemption fees or sales loads. Therefore, the second line of the table is useful in comparing ongoing costs only and will not help you determine the relative total costs of owning different funds. To the extent a fund charges transaction costs, however, the total cost of owning that fund is higher.
armcg_1220_P4Proof #
15
T. ROWE PRICE MId-CAP GROWTh Fund
FUND EXPENSE EXAMPLE (CONTINUED)
Beginning Account Value
7/1/20
Ending Account Value
12/31/20
Expenses Paid during Period*
7/1/20 to 12/31/20
Investor ClassActual $1,000.00 $1,264.90 $4.10
hypothetical (assumes 5% return before expenses) 1,000.00 1,021.52 3.66
Advisor ClassActual 1,000.00 1,263.20 5.75
hypothetical (assumes 5% return before expenses) 1,000.00 1,020.06 5.13
R ClassActual 1,000.00 1,261.50 7.22
hypothetical (assumes 5% return before expenses) 1,000.00 1,018.75 6.44
I ClassActual 1,000.00 1,265.60 3.47
hypothetical (assumes 5% return before expenses) 1,000.00 1,022.07 3.10
Z ClassActual 1,000.00 1,269.50 0.00
hypothetical (assumes 5% return before expenses) 1,000.00 1,025.14 0.00
* Expenses are equal to the fund’s annualized expense ratio for the 6-month period, multiplied by the average account value over the period, multiplied by the number of days in the most recent fiscal half year (184), and divided by the days in the year (366) to reflect the half-year period. The annualized expense ratio of the Investor Class was 0.72%, the Advisor Class was 1.01%, the R Class was 1.27%, the I Class was 0.61%, and the Z Class was 0.00%.
MID-CAP GROWTH FUND
armcg_1220_P4Proof #
16
T. ROWE PRICE MId-CAP GROWTh Fund
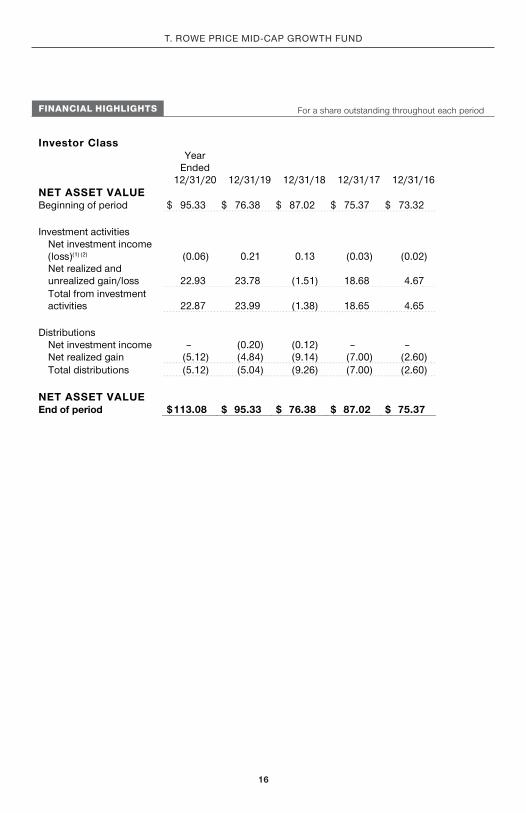
FINANCIAL HIGHLIGHTS For a share outstanding throughout each period
Investor Class
Year Ended
12/31/20 12/31/19 12/31/18 12/31/17 12/31/16
NET ASSET VALUE Beginning of period $ 95.33 $ 76.38 $ 87.02 $ 75.37 $ 73.32
Investment activities
Net investment income (loss)(1) (2) (0.06) 0.21 0.13 (0.03) (0.02)
Net realized and unrealized gain/loss 22.93 23.78 (1.51) 18.68 4.67
Total from investment activities 22.87 23.99 (1.38) 18.65 4.65
Distributions
Net investment income – (0.20) (0.12) – –
Net realized gain (5.12) (4.84) (9.14) (7.00) (2.60)
Total distributions (5.12) (5.04) (9.26) (7.00) (2.60)
NET ASSET VALUE End of period $113.08 $ 95.33 $ 76.38 $ 87.02 $ 75.37
armcg_1220_P4Proof #
17
The accompanying notes are an integral part of these financial statements.
T. ROWE PRICE MId-CAP GROWTh Fund
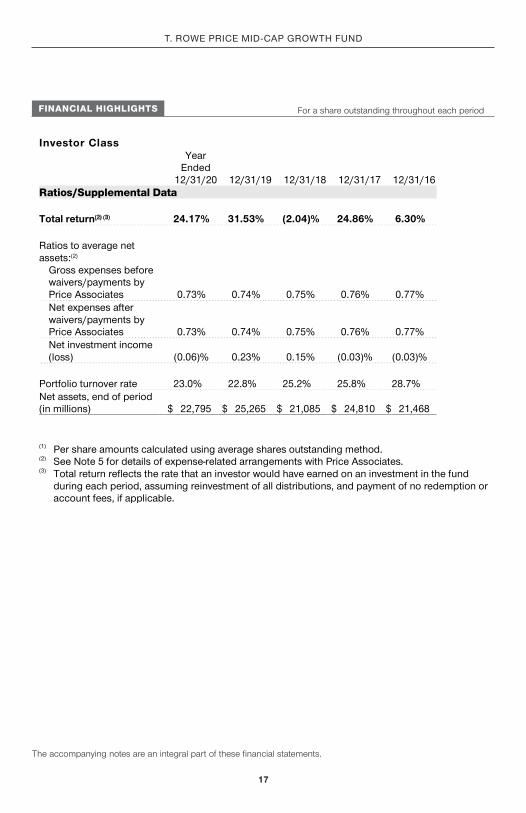
FINANCIAL HIGHLIGHTS For a share outstanding throughout each period
Investor Class
Year Ended
12/31/20 12/31/19 12/31/18 12/31/17 12/31/16
Ratios/Supplemental Data
Total return(2) (3) 24.17% 31.53% (2.04)% 24.86% 6.30%
Ratios to average net assets:(2)
Gross expenses before waivers/payments by Price Associates 0.73% 0.74% 0.75% 0.76% 0.77%
Net expenses after waivers/payments by Price Associates 0.73% 0.74% 0.75% 0.76% 0.77%
Net investment income (loss) (0.06)% 0.23% 0.15% (0.03)% (0.03)%
Portfolio turnover rate 23.0% 22.8% 25.2% 25.8% 28.7%
Net assets, end of period (in millions) $ 22,795 $ 25,265 $ 21,085 $ 24,810 $ 21,468
(1) Per share amounts calculated using average shares outstanding method. (2) See Note 5 for details of expense-related arrangements with Price Associates. (3) Total return reflects the rate that an investor would have earned on an investment in the fund
during each period, assuming reinvestment of all distributions, and payment of no redemption or account fees, if applicable.
armcg_1220_P4Proof #
18
The accompanying notes are an integral part of these financial statements.
T. ROWE PRICE MId-CAP GROWTh Fund
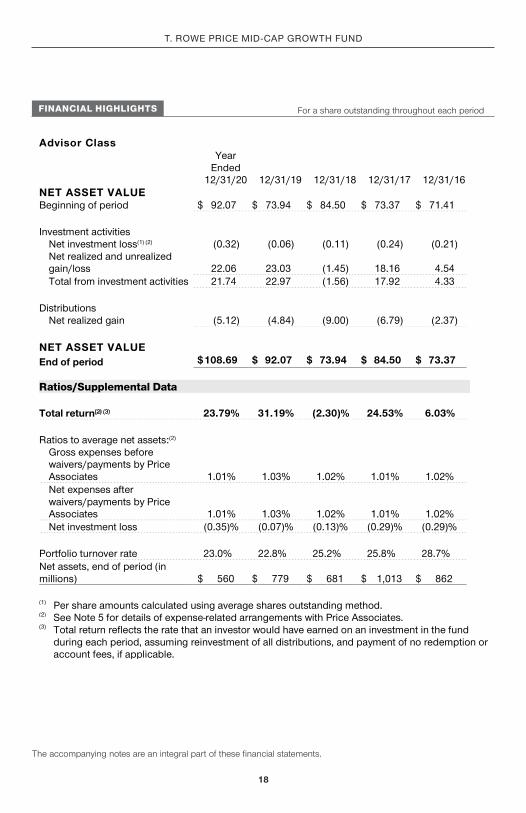
FINANCIAL HIGHLIGHTS For a share outstanding throughout each period
Advisor Class
Year Ended
12/31/20 12/31/19 12/31/18 12/31/17 12/31/16
NET ASSET VALUE Beginning of period $ 92.07 $ 73.94 $ 84.50 $ 73.37 $ 71.41
Investment activities
Net investment loss(1) (2) (0.32) (0.06) (0.11) (0.24) (0.21)
Net realized and unrealized gain/loss 22.06 23.03 (1.45) 18.16 4.54
Total from investment activities 21.74 22.97 (1.56) 17.92 4.33
Distributions
Net realized gain (5.12) (4.84) (9.00) (6.79) (2.37)
NET ASSET VALUE End of period $108.69 $ 92.07 $ 73.94 $ 84.50 $ 73.37
Ratios/Supplemental Data
Total return(2) (3) 23.79% 31.19% (2.30)% 24.53% 6.03%
Ratios to average net assets:(2)
Gross expenses before waivers/payments by Price Associates 1.01% 1.03% 1.02% 1.01% 1.02%
Net expenses after waivers/payments by Price Associates 1.01% 1.03% 1.02% 1.01% 1.02%
Net investment loss (0.35)% (0.07)% (0.13)% (0.29)% (0.29)%
Portfolio turnover rate 23.0% 22.8% 25.2% 25.8% 28.7%
Net assets, end of period (in millions) $ 560 $ 779 $ 681 $ 1,013 $ 862
(1) Per share amounts calculated using average shares outstanding method. (2) See Note 5 for details of expense-related arrangements with Price Associates. (3) Total return reflects the rate that an investor would have earned on an investment in the fund
during each period, assuming reinvestment of all distributions, and payment of no redemption or account fees, if applicable.
armcg_1220_P4Proof #
19
The accompanying notes are an integral part of these financial statements.
T. ROWE PRICE MId-CAP GROWTh Fund
FINANCIAL HIGHLIGHTS For a share outstanding throughout each period
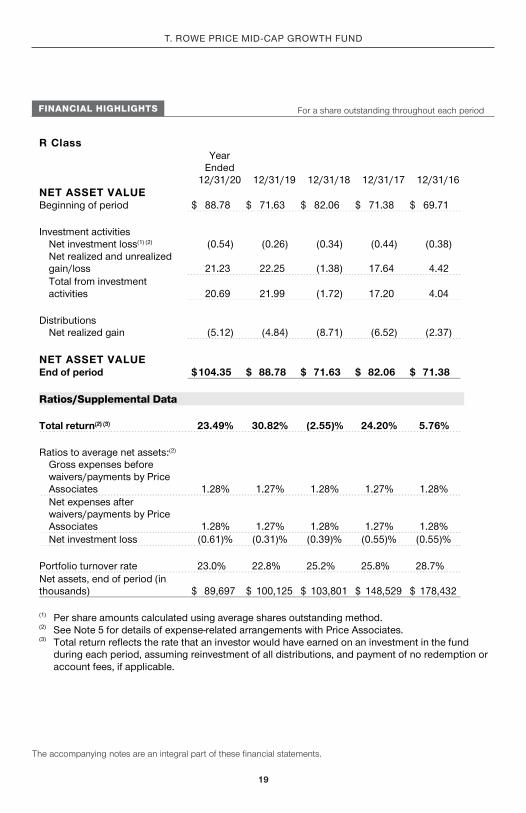
R Class
Year Ended
12/31/20 12/31/19 12/31/18 12/31/17 12/31/16
NET ASSET VALUE Beginning of period $ 88.78 $ 71.63 $ 82.06 $ 71.38 $ 69.71
Investment activities
Net investment loss(1) (2) (0.54) (0.26) (0.34) (0.44) (0.38)
Net realized and unrealized gain/loss 21.23 22.25 (1.38) 17.64 4.42
Total from investment activities 20.69 21.99 (1.72) 17.20 4.04
Distributions
Net realized gain (5.12) (4.84) (8.71) (6.52) (2.37)
NET ASSET VALUE End of period $104.35 $ 88.78 $ 71.63 $ 82.06 $ 71.38
Ratios/Supplemental Data
Total return(2) (3) 23.49% 30.82% (2.55)% 24.20% 5.76%
Ratios to average net assets:(2)
Gross expenses before waivers/payments by Price Associates 1.28% 1.27% 1.28% 1.27% 1.28%
Net expenses after waivers/payments by Price Associates 1.28% 1.27% 1.28% 1.27% 1.28%
Net investment loss (0.61)% (0.31)% (0.39)% (0.55)% (0.55)%
Portfolio turnover rate 23.0% 22.8% 25.2% 25.8% 28.7%
Net assets, end of period (in thousands) $ 89,697 $ 100,125 $ 103,801 $ 148,529 $ 178,432
(1) Per share amounts calculated using average shares outstanding method. (2) See Note 5 for details of expense-related arrangements with Price Associates. (3) Total return reflects the rate that an investor would have earned on an investment in the fund
during each period, assuming reinvestment of all distributions, and payment of no redemption or account fees, if applicable.
armcg_1220_P4Proof #
20
T. ROWE PRICE MId-CAP GROWTh Fund
FINANCIAL HIGHLIGHTS For a share outstanding throughout each period
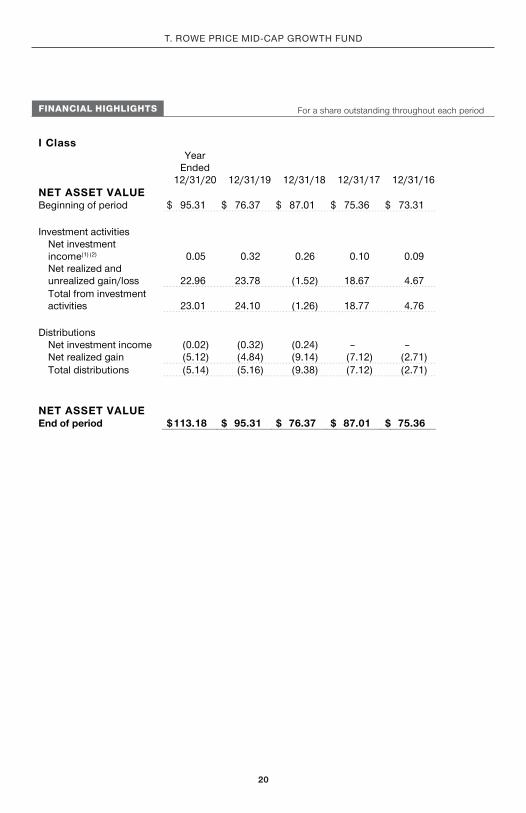
I Class
Year Ended
12/31/20 12/31/19 12/31/18 12/31/17 12/31/16
NET ASSET VALUE Beginning of period $ 95.31 $ 76.37 $ 87.01 $ 75.36 $ 73.31
Investment activities
Net investment income(1) (2) 0.05 0.32 0.26 0.10 0.09
Net realized and unrealized gain/loss 22.96 23.78 (1.52) 18.67 4.67
Total from investment activities 23.01 24.10 (1.26) 18.77 4.76
Distributions
Net investment income (0.02) (0.32) (0.24) – –
Net realized gain (5.12) (4.84) (9.14) (7.12) (2.71)
Total distributions (5.14) (5.16) (9.38) (7.12) (2.71)
NET ASSET VALUE End of period $113.18 $ 95.31 $ 76.37 $ 87.01 $ 75.36
armcg_1220_P4Proof #
21
The accompanying notes are an integral part of these financial statements.
T. ROWE PRICE MId-CAP GROWTh Fund
FINANCIAL HIGHLIGHTS For a share outstanding throughout each period
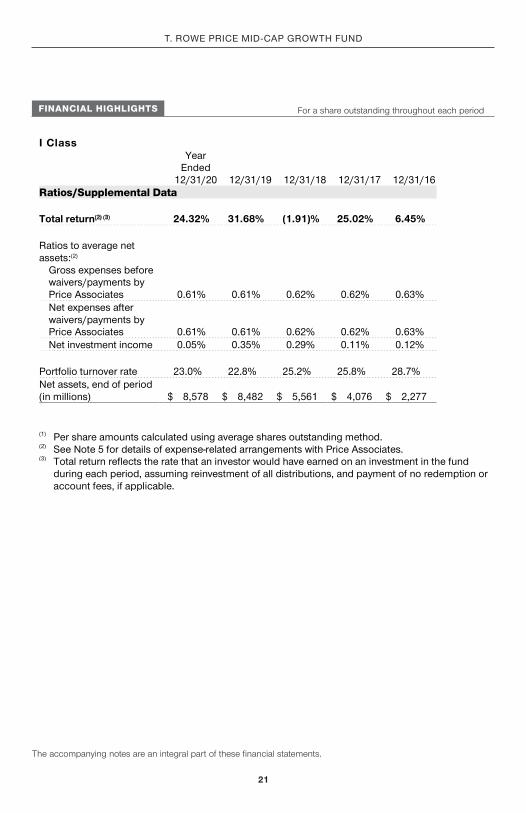
I Class
Year Ended
12/31/20 12/31/19 12/31/18 12/31/17 12/31/16
Ratios/Supplemental Data
Total return(2) (3) 24.32% 31.68% (1.91)% 25.02% 6.45%
Ratios to average net assets:(2)
Gross expenses before waivers/payments by Price Associates 0.61% 0.61% 0.62% 0.62% 0.63%
Net expenses after waivers/payments by Price Associates 0.61% 0.61% 0.62% 0.62% 0.63%
Net investment income 0.05% 0.35% 0.29% 0.11% 0.12%
Portfolio turnover rate 23.0% 22.8% 25.2% 25.8% 28.7%
Net assets, end of period (in millions) $ 8,578 $ 8,482 $ 5,561 $ 4,076 $ 2,277
(1) Per share amounts calculated using average shares outstanding method. (2) See Note 5 for details of expense-related arrangements with Price Associates. (3) Total return reflects the rate that an investor would have earned on an investment in the fund
during each period, assuming reinvestment of all distributions, and payment of no redemption or account fees, if applicable.
armcg_1220_P4Proof #
22
The accompanying notes are an integral part of these financial statements.
T. ROWE PRICE MId-CAP GROWTh Fund
FINANCIAL HIGHLIGHTS For a share outstanding throughout the period
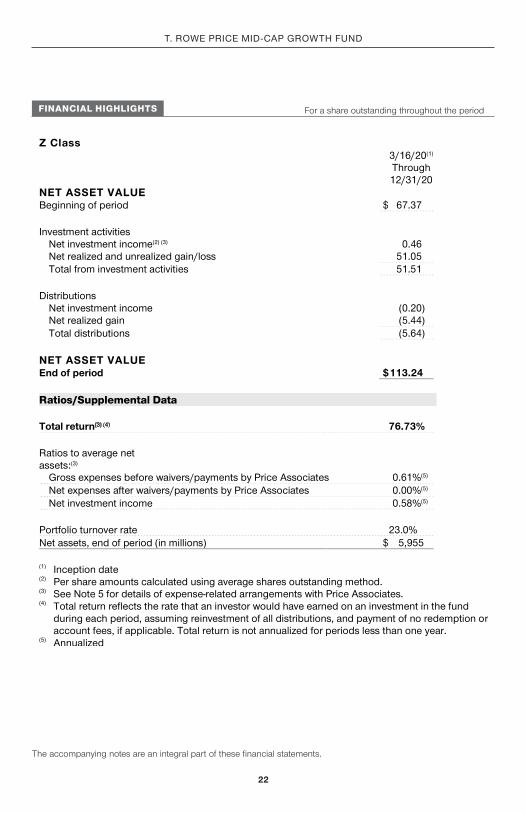
Z Class
3/16/20(1) Through 12/31/20
NET ASSET VALUE Beginning of period $ 67.37
Investment activities
Net investment income(2) (3) 0.46
Net realized and unrealized gain/loss 51.05
Total from investment activities 51.51
Distributions
Net investment income (0.20)
Net realized gain (5.44)
Total distributions (5.64)
NET ASSET VALUE End of period $113.24
Ratios/Supplemental Data
Total return(3) (4) 76.73%
Ratios to average net assets:(3)
Gross expenses before waivers/payments by Price Associates 0.61%(5)
Net expenses after waivers/payments by Price Associates 0.00%(5)
Net investment income 0.58%(5)
Portfolio turnover rate 23.0%
Net assets, end of period (in millions) $ 5,955
(1) Inception date (2) Per share amounts calculated using average shares outstanding method. (3) See Note 5 for details of expense-related arrangements with Price Associates. (4) Total return reflects the rate that an investor would have earned on an investment in the fund
during each period, assuming reinvestment of all distributions, and payment of no redemption or account fees, if applicable. Total return is not annualized for periods less than one year.
(5) Annualized
armcg_1220_P4Proof #
23
T. ROWE PRICE MId-CAP GROWTh Fund
december 31, 2020
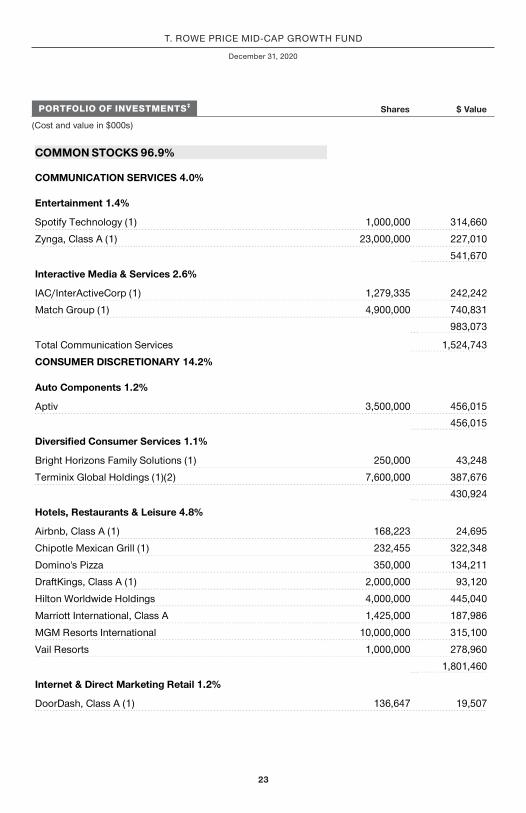
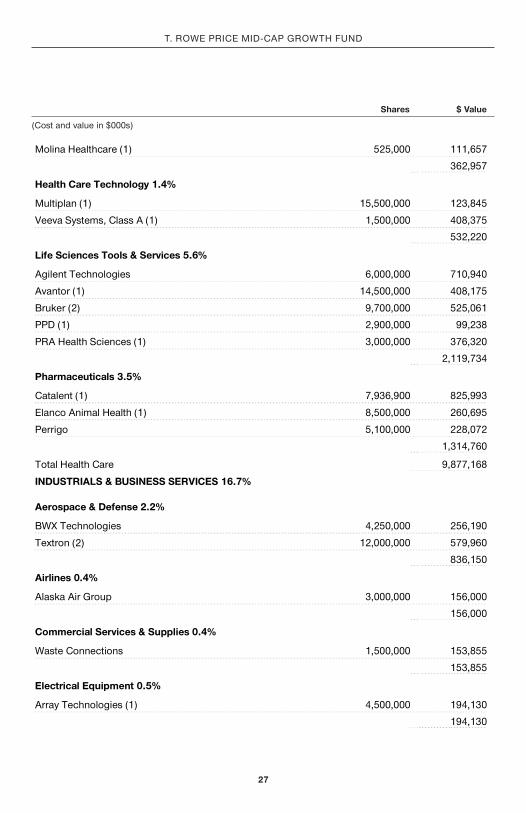
PORTFOLIO OF INVESTMENTS‡
(Cost and value in $000s)
Shares $ Value
COMMON STOCKS 96.9%
COMMUNICATION SERVICES 4.0%
Entertainment 1.4%
Spotify Technology (1) 1,000,000 314,660
Zynga, Class A (1) 23,000,000 227,010
541,670
Interactive Media & Services 2.6%
IAC/InterActiveCorp (1) 1,279,335 242,242
Match Group (1) 4,900,000 740,831
983,073
Total Communication Services 1,524,743
CONSUMER DISCRETIONARY 14.2%
Auto Components 1.2%
Aptiv 3,500,000 456,015 456,015
Diversified Consumer Services 1.1%
Bright Horizons Family Solutions (1) 250,000 43,248
Terminix Global Holdings (1)(2) 7,600,000 387,676 430,924
Hotels, Restaurants & Leisure 4.8%
Airbnb, Class A (1) 168,223 24,695
Chipotle Mexican Grill (1) 232,455 322,348
Domino's Pizza 350,000 134,211
DraftKings, Class A (1) 2,000,000 93,120
Hilton Worldwide Holdings 4,000,000 445,040
Marriott International, Class A 1,425,000 187,986
MGM Resorts International 10,000,000 315,100
Vail Resorts 1,000,000 278,960
1,801,460
Internet & Direct Marketing Retail 1.2%
DoorDash, Class A (1) 136,647 19,507
armcg_1220_P4Proof #
24
Shares $ Value
T. ROWE PRICE MId-CAP GROWTh Fund
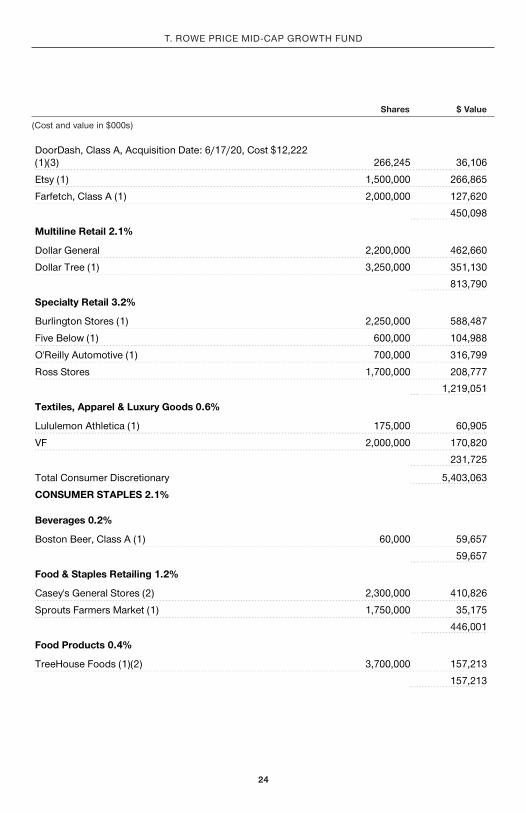
(Cost and value in $000s)
DoorDash, Class A, Acquisition Date: 6/17/20, Cost $12,222 (1)(3) 266,245 36,106
Etsy (1) 1,500,000 266,865
Farfetch, Class A (1) 2,000,000 127,620
450,098
Multiline Retail 2.1%
Dollar General 2,200,000 462,660
Dollar Tree (1) 3,250,000 351,130
813,790
Specialty Retail 3.2%
Burlington Stores (1) 2,250,000 588,487
Five Below (1) 600,000 104,988
O'Reilly Automotive (1) 700,000 316,799
Ross Stores 1,700,000 208,777 1,219,051
Textiles, Apparel & Luxury Goods 0.6%
Lululemon Athletica (1) 175,000 60,905
VF 2,000,000 170,820
231,725
Total Consumer Discretionary 5,403,063
CONSUMER STAPLES 2.1%
Beverages 0.2%
Boston Beer, Class A (1) 60,000 59,657
59,657
Food & Staples Retailing 1.2%
Casey's General Stores (2) 2,300,000 410,826
Sprouts Farmers Market (1) 1,750,000 35,175
446,001
Food Products 0.4%
TreeHouse Foods (1)(2) 3,700,000 157,213
157,213
armcg_1220_P4Proof #
25
Shares $ Value
T. ROWE PRICE MId-CAP GROWTh Fund
(Cost and value in $000s)
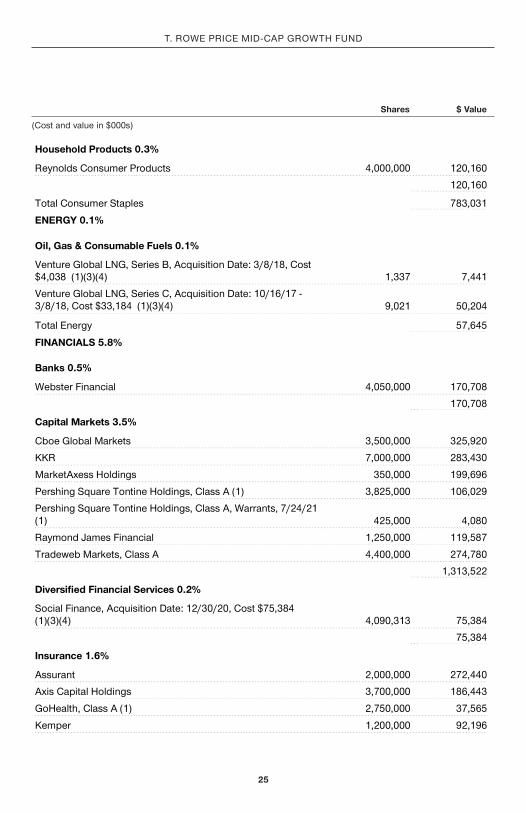
Household Products 0.3%
Reynolds Consumer Products 4,000,000 120,160
120,160
Total Consumer Staples 783,031
ENERGY 0.1%
Oil, Gas & Consumable Fuels 0.1%
Venture Global LNG, Series B, Acquisition Date: 3/8/18, Cost $4,038 (1)(3)(4) 1,337 7,441
Venture Global LNG, Series C, Acquisition Date: 10/16/17 - 3/8/18, Cost $33,184 (1)(3)(4) 9,021 50,204
Total Energy 57,645
FINANCIALS 5.8%
Banks 0.5%
Webster Financial 4,050,000 170,708
170,708
Capital Markets 3.5%
Cboe Global Markets 3,500,000 325,920
KKR 7,000,000 283,430
MarketAxess Holdings 350,000 199,696
Pershing Square Tontine Holdings, Class A (1) 3,825,000 106,029
Pershing Square Tontine Holdings, Class A, Warrants, 7/24/21 (1) 425,000 4,080
Raymond James Financial 1,250,000 119,587
Tradeweb Markets, Class A 4,400,000 274,780
1,313,522
Diversified Financial Services 0.2%
Social Finance, Acquisition Date: 12/30/20, Cost $75,384 (1)(3)(4) 4,090,313 75,384
75,384
Insurance 1.6%
Assurant 2,000,000 272,440
Axis Capital Holdings 3,700,000 186,443
GoHealth, Class A (1) 2,750,000 37,565
Kemper 1,200,000 92,196
armcg_1220_P4Proof #
26
Shares $ Value
T. ROWE PRICE MId-CAP GROWTh Fund
(Cost and value in $000s)
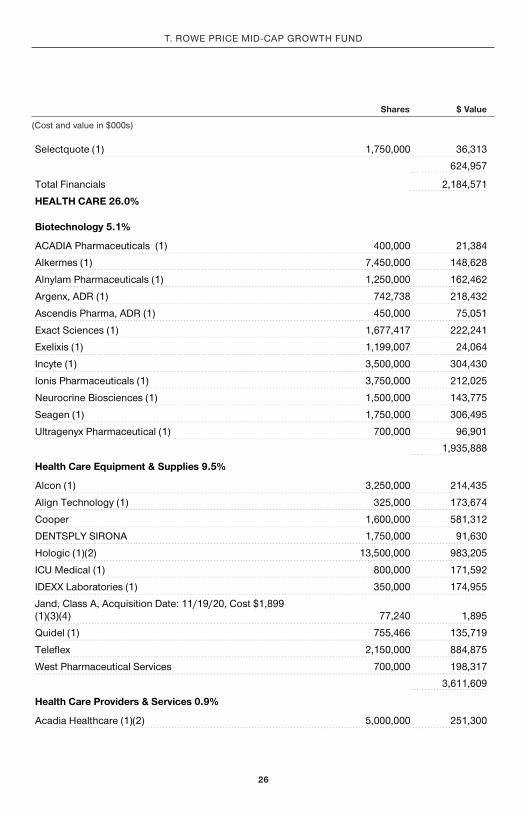
Selectquote (1) 1,750,000 36,313
624,957
Total Financials 2,184,571
HEALTH CARE 26.0%
Biotechnology 5.1%
ACADIA Pharmaceuticals (1) 400,000 21,384
Alkermes (1) 7,450,000 148,628
Alnylam Pharmaceuticals (1) 1,250,000 162,462
Argenx, ADR (1) 742,738 218,432
Ascendis Pharma, ADR (1) 450,000 75,051
Exact Sciences (1) 1,677,417 222,241
Exelixis (1) 1,199,007 24,064
Incyte (1) 3,500,000 304,430
Ionis Pharmaceuticals (1) 3,750,000 212,025
Neurocrine Biosciences (1) 1,500,000 143,775
Seagen (1) 1,750,000 306,495
Ultragenyx Pharmaceutical (1) 700,000 96,901 1,935,888
Health Care Equipment & Supplies 9.5%
Alcon (1) 3,250,000 214,435
Align Technology (1) 325,000 173,674
Cooper 1,600,000 581,312
DENTSPLY SIRONA 1,750,000 91,630
Hologic (1)(2) 13,500,000 983,205
ICU Medical (1) 800,000 171,592
IDEXX Laboratories (1) 350,000 174,955
Jand, Class A, Acquisition Date: 11/19/20, Cost $1,899 (1)(3)(4) 77,240 1,895
Quidel (1) 755,466 135,719
Teleflex 2,150,000 884,875
West Pharmaceutical Services 700,000 198,317
3,611,609
Health Care Providers & Services 0.9%
Acadia Healthcare (1)(2) 5,000,000 251,300
armcg_1220_P4Proof #
27
Shares $ Value
T. ROWE PRICE MId-CAP GROWTh Fund
(Cost and value in $000s)
Molina Healthcare (1) 525,000 111,657
362,957
Health Care Technology 1.4%
Multiplan (1) 15,500,000 123,845
Veeva Systems, Class A (1) 1,500,000 408,375 532,220
Life Sciences Tools & Services 5.6%
Agilent Technologies 6,000,000 710,940
Avantor (1) 14,500,000 408,175
Bruker (2) 9,700,000 525,061
PPD (1) 2,900,000 99,238
PRA Health Sciences (1) 3,000,000 376,320
2,119,734
Pharmaceuticals 3.5%
Catalent (1) 7,936,900 825,993
Elanco Animal Health (1) 8,500,000 260,695
Perrigo 5,100,000 228,072
1,314,760
Total Health Care 9,877,168
INDUSTRIALS & BUSINESS SERVICES 16.7%
Aerospace & Defense 2.2%
BWX Technologies 4,250,000 256,190
Textron (2) 12,000,000 579,960
836,150
Airlines 0.4%
Alaska Air Group 3,000,000 156,000
156,000
Commercial Services & Supplies 0.4%
Waste Connections 1,500,000 153,855
153,855
Electrical Equipment 0.5%
Array Technologies (1) 4,500,000 194,130
194,130
armcg_1220_P4Proof #
28
Shares $ Value
T. ROWE PRICE MId-CAP GROWTh Fund
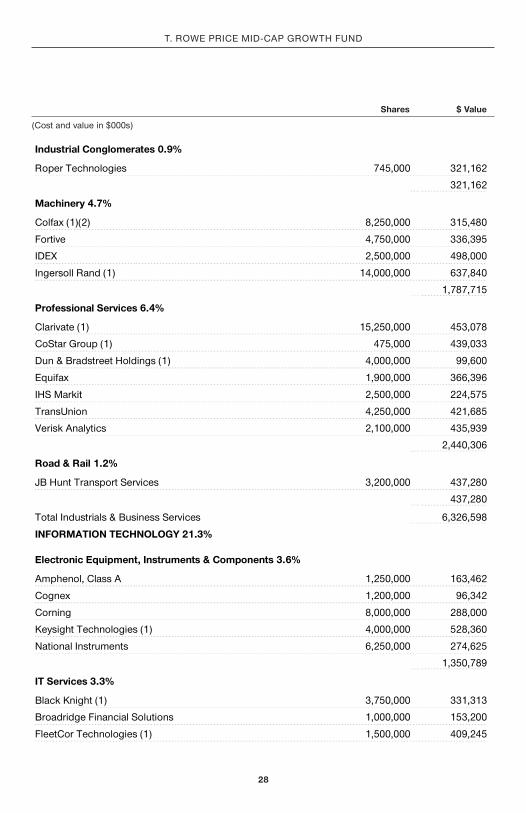
(Cost and value in $000s)
Industrial Conglomerates 0.9%
Roper Technologies 745,000 321,162
321,162
Machinery 4.7%
Colfax (1)(2) 8,250,000 315,480
Fortive 4,750,000 336,395
IDEX 2,500,000 498,000
Ingersoll Rand (1) 14,000,000 637,840
1,787,715
Professional Services 6.4%
Clarivate (1) 15,250,000 453,078
CoStar Group (1) 475,000 439,033
Dun & Bradstreet Holdings (1) 4,000,000 99,600
Equifax 1,900,000 366,396
IHS Markit 2,500,000 224,575
TransUnion 4,250,000 421,685
Verisk Analytics 2,100,000 435,939
2,440,306
Road & Rail 1.2%
JB Hunt Transport Services 3,200,000 437,280
437,280
Total Industrials & Business Services 6,326,598
INFORMATION TECHNOLOGY 21.3%
Electronic Equipment, Instruments & Components 3.6%
Amphenol, Class A 1,250,000 163,462
Cognex 1,200,000 96,342
Corning 8,000,000 288,000
Keysight Technologies (1) 4,000,000 528,360
National Instruments 6,250,000 274,625
1,350,789
IT Services 3.3%
Black Knight (1) 3,750,000 331,313
Broadridge Financial Solutions 1,000,000 153,200
FleetCor Technologies (1) 1,500,000 409,245
armcg_1220_P4Proof #
29
Shares $ Value
T. ROWE PRICE MId-CAP GROWTh Fund
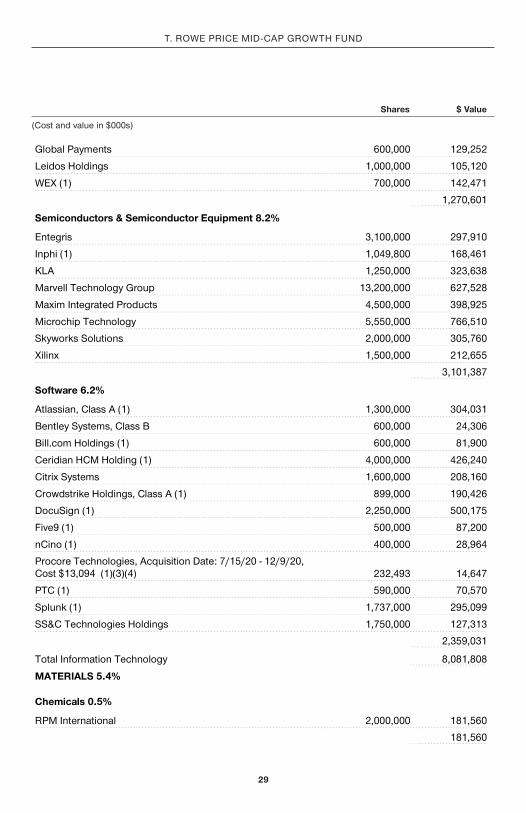
(Cost and value in $000s)
Global Payments 600,000 129,252
Leidos Holdings 1,000,000 105,120
WEX (1) 700,000 142,471
1,270,601
Semiconductors & Semiconductor Equipment 8.2%
Entegris 3,100,000 297,910
Inphi (1) 1,049,800 168,461
KLA 1,250,000 323,638
Marvell Technology Group 13,200,000 627,528
Maxim Integrated Products 4,500,000 398,925
Microchip Technology 5,550,000 766,510
Skyworks Solutions 2,000,000 305,760
Xilinx 1,500,000 212,655
3,101,387
Software 6.2%
Atlassian, Class A (1) 1,300,000 304,031
Bentley Systems, Class B 600,000 24,306
Bill.com Holdings (1) 600,000 81,900
Ceridian HCM Holding (1) 4,000,000 426,240
Citrix Systems 1,600,000 208,160
Crowdstrike Holdings, Class A (1) 899,000 190,426
DocuSign (1) 2,250,000 500,175
Five9 (1) 500,000 87,200
nCino (1) 400,000 28,964
Procore Technologies, Acquisition Date: 7/15/20 - 12/9/20, Cost $13,094 (1)(3)(4) 232,493 14,647
PTC (1) 590,000 70,570
Splunk (1) 1,737,000 295,099
SS&C Technologies Holdings 1,750,000 127,313
2,359,031
Total Information Technology 8,081,808
MATERIALS 5.4%
Chemicals 0.5%
RPM International 2,000,000 181,560
181,560
armcg_1220_P4Proof #
30
Shares $ Value
T. ROWE PRICE MId-CAP GROWTh Fund
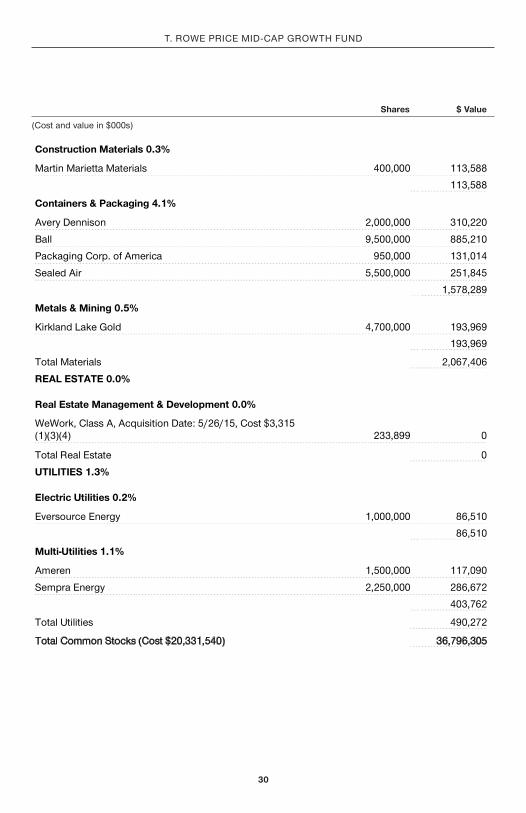
(Cost and value in $000s)
Construction Materials 0.3%
Martin Marietta Materials 400,000 113,588
113,588
Containers & Packaging 4.1%
Avery Dennison 2,000,000 310,220
Ball 9,500,000 885,210
Packaging Corp. of America 950,000 131,014
Sealed Air 5,500,000 251,845
1,578,289
Metals & Mining 0.5%
Kirkland Lake Gold 4,700,000 193,969 193,969
Total Materials 2,067,406
REAL ESTATE 0.0%
Real Estate Management & Development 0.0%
WeWork, Class A, Acquisition Date: 5/26/15, Cost $3,315 (1)(3)(4) 233,899 0
Total Real Estate 0
UTILITIES 1.3%
Electric Utilities 0.2%
Eversource Energy 1,000,000 86,510
86,510
Multi-Utilities 1.1%
Ameren 1,500,000 117,090
Sempra Energy 2,250,000 286,672
403,762
Total Utilities 490,272
Total Common Stocks (Cost $20,331,540) 36,796,305
armcg_1220_P4Proof #
31
Shares $ Value
T. ROWE PRICE MId-CAP GROWTh Fund
(Cost and value in $000s)
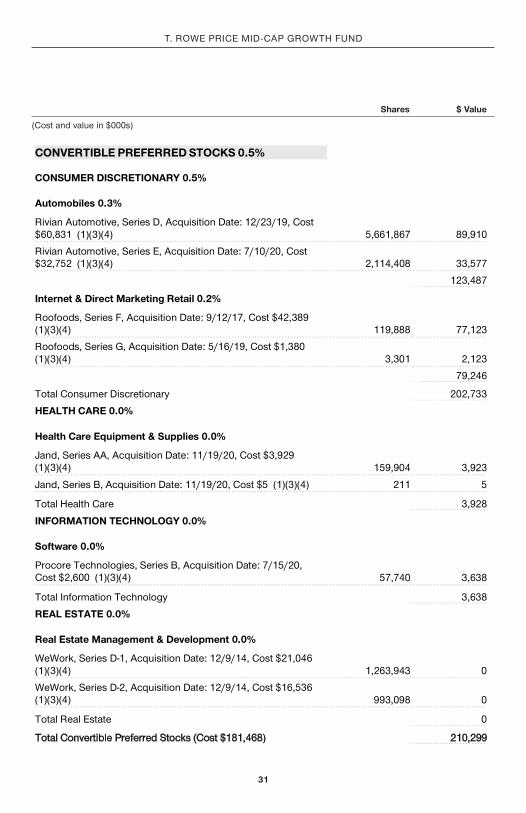
CONVERTIBLE PREFERRED STOCKS 0.5%
CONSUMER DISCRETIONARY 0.5%
Automobiles 0.3%
Rivian Automotive, Series D, Acquisition Date: 12/23/19, Cost $60,831 (1)(3)(4) 5,661,867 89,910
Rivian Automotive, Series E, Acquisition Date: 7/10/20, Cost $32,752 (1)(3)(4) 2,114,408 33,577
123,487
Internet & Direct Marketing Retail 0.2%
Roofoods, Series F, Acquisition Date: 9/12/17, Cost $42,389 (1)(3)(4) 119,888 77,123
Roofoods, Series G, Acquisition Date: 5/16/19, Cost $1,380 (1)(3)(4) 3,301 2,123
79,246
Total Consumer Discretionary 202,733
HEALTH CARE 0.0%
Health Care Equipment & Supplies 0.0%
Jand, Series AA, Acquisition Date: 11/19/20, Cost $3,929 (1)(3)(4) 159,904 3,923
Jand, Series B, Acquisition Date: 11/19/20, Cost $5 (1)(3)(4) 211 5
Total Health Care 3,928
INFORMATION TECHNOLOGY 0.0%
Software 0.0%
Procore Technologies, Series B, Acquisition Date: 7/15/20, Cost $2,600 (1)(3)(4) 57,740 3,638
Total Information Technology 3,638
REAL ESTATE 0.0%
Real Estate Management & Development 0.0%
WeWork, Series D-1, Acquisition Date: 12/9/14, Cost $21,046 (1)(3)(4) 1,263,943 0
WeWork, Series D-2, Acquisition Date: 12/9/14, Cost $16,536 (1)(3)(4) 993,098 0
Total Real Estate 0
Total Convertible Preferred Stocks (Cost $181,468) 210,299
armcg_1220_P4Proof #
32
Shares $ Value
T. ROWE PRICE MId-CAP GROWTh Fund
(Cost and value in $000s)
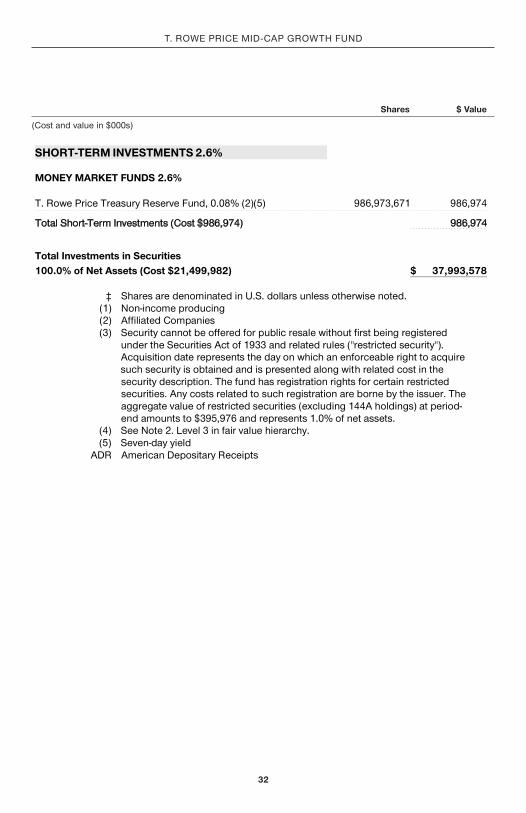
SHORT-TERM INVESTMENTS 2.6%
MONEY MARKET FUNDS 2.6%
T. Rowe Price Treasury Reserve Fund, 0.08% (2)(5) 986,973,671 986,974
Total Short-Term Investments (Cost $986,974) 986,974
Total Investments in Securities 100.0% of Net Assets (Cost $21,499,982) $ 37,993,578
‡ Shares are denominated in U.S. dollars unless otherwise noted. (1) Non-income producing (2) Affiliated Companies (3)
Security cannot be offered for public resale without first being registered under the Securities Act of 1933 and related rules ("restricted security"). Acquisition date represents the day on which an enforceable right to acquire such security is obtained and is presented along with related cost in the security description. The fund has registration rights for certain restricted securities. Any costs related to such registration are borne by the issuer. The aggregate value of restricted securities (excluding 144A holdings) at period-end amounts to $395,976 and represents 1.0% of net assets.
(4) See Note 2. Level 3 in fair value hierarchy. (5) Seven-day yield
ADR American Depositary Receipts
armcg_1220_P4Proof #
33
T. ROWE PRICE MId-CAP GROWTh Fund
($000s)
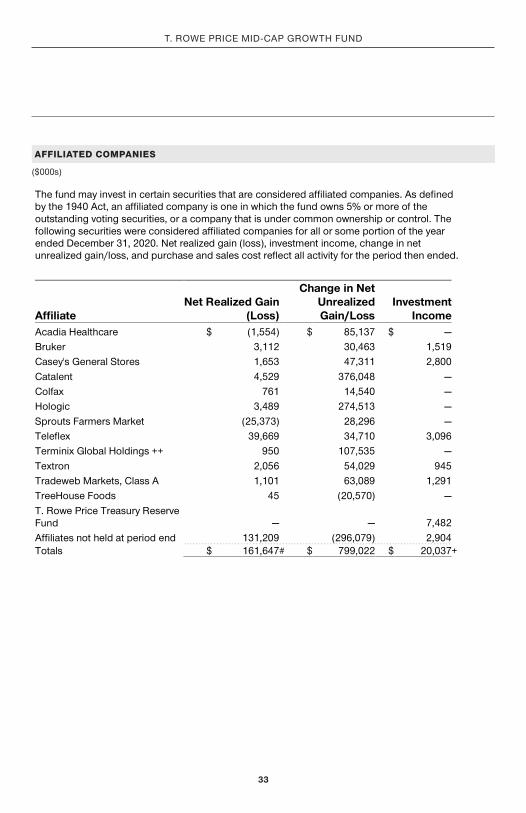
AFFILIATED COMPANIES
The fund may invest in certain securities that are considered affiliated companies. As defined by the 1940 Act, an affiliated company is one in which the fund owns 5% or more of the outstanding voting securities, or a company that is under common ownership or control. The following securities were considered affiliated companies for all or some portion of the year ended December 31, 2020. Net realized gain (loss), investment income, change in net unrealized gain/loss, and purchase and sales cost reflect all activity for the period then ended.
Affiliate Net Realized Gain
(Loss)
Change in NetUnrealizedGain/Loss
InvestmentIncome
Acadia Healthcare $ (1,554) $ 85,137 $ — Bruker 3,112 30,463 1,519 Casey's General Stores 1,653 47,311 2,800 Catalent 4,529 376,048 — Colfax 761 14,540 — Hologic 3,489 274,513 — Sprouts Farmers Market (25,373) 28,296 — Teleflex 39,669 34,710 3,096 Terminix Global Holdings ++ 950 107,535 — Textron 2,056 54,029 945 Tradeweb Markets, Class A 1,101 63,089 1,291 TreeHouse Foods 45 (20,570) — T. Rowe Price Treasury Reserve Fund — — 7,482 Affiliates not held at period end 131,209 (296,079) 2,904 Totals $ 161,647# $ 799,022 $ 20,037+
armcg_1220_P4Proof #
34
T. ROWE PRICE MId-CAP GROWTh Fund
The accompanying notes are an integral part of these financial statements.
($000s)
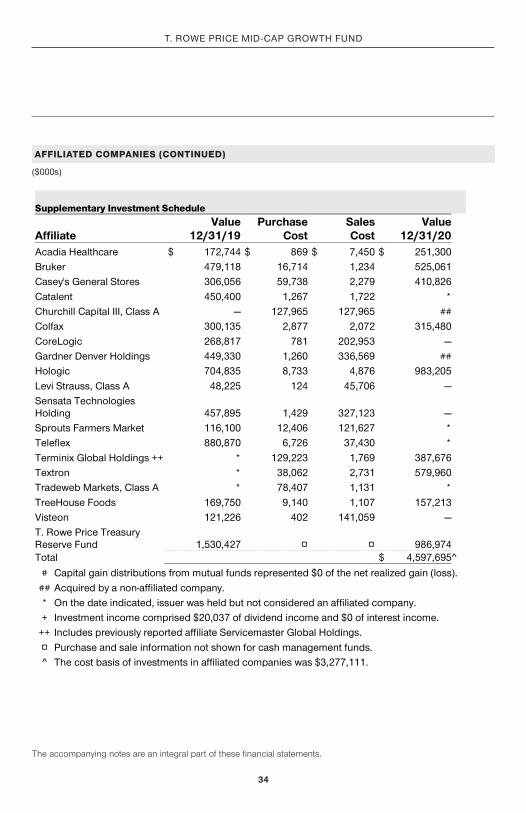
AFFILIATED COMPANIES (CONTINUED)
Supplementary Investment Schedule
Affiliate Value
12/31/19Purchase
CostSalesCost
Value12/31/20
Acadia Healthcare $ 172,744 $ 869 $ 7,450 $ 251,300 Bruker 479,118 16,714 1,234 525,061 Casey's General Stores 306,056 59,738 2,279 410,826 Catalent 450,400 1,267 1,722 * Churchill Capital III, Class A — 127,965 127,965 ## Colfax 300,135 2,877 2,072 315,480 CoreLogic 268,817 781 202,953 — Gardner Denver Holdings 449,330 1,260 336,569 ## Hologic 704,835 8,733 4,876 983,205 Levi Strauss, Class A 48,225 124 45,706 — Sensata Technologies Holding 457,895 1,429 327,123 — Sprouts Farmers Market 116,100 12,406 121,627 * Teleflex 880,870 6,726 37,430 * Terminix Global Holdings ++ * 129,223 1,769 387,676 Textron * 38,062 2,731 579,960 Tradeweb Markets, Class A * 78,407 1,131 * TreeHouse Foods 169,750 9,140 1,107 157,213 Visteon 121,226 402 141,059 — T. Rowe Price Treasury Reserve Fund 1,530,427 ¤ ¤ 986,974 Total $ 4,597,695^
# Capital gain distributions from mutual funds represented $0 of the net realized gain (loss). ## Acquired by a non-affiliated company. * On the date indicated, issuer was held but not considered an affiliated company. + Investment income comprised $20,037 of dividend income and $0 of interest income.
++ Includes previously reported affiliate Servicemaster Global Holdings. ¤ Purchase and sale information not shown for cash management funds. ^ The cost basis of investments in affiliated companies was $3,277,111.
armcg_1220_P4Proof #
35
T. ROWE PRICE MId-CAP GROWTh Fund
december 31, 2020
($000s, except shares and per share amounts)
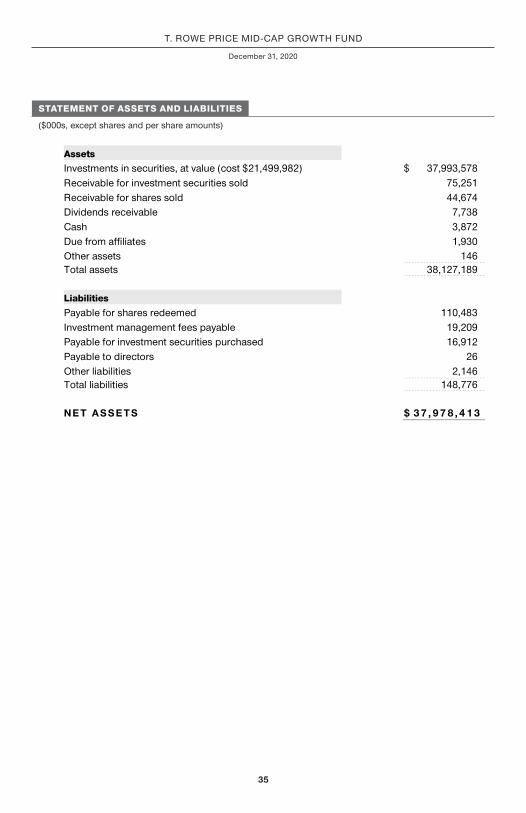
STATEMENT OF ASSETS AND LIABILITIES
Assets Investments in securities, at value (cost $21,499,982) $ 37,993,578 Receivable for investment securities sold 75,251 Receivable for shares sold 44,674 Dividends receivable 7,738 Cash 3,872 Due from affiliates 1,930 Other assets 146 Total assets 38,127,189
Liabilities Payable for shares redeemed 110,483 Investment management fees payable 19,209 Payable for investment securities purchased 16,912 Payable to directors 26 Other liabilities 2,146 Total liabilities 148,776
NET ASSETS $ 37, 97 8, 4 13
armcg_1220_P4Proof #
36
T. ROWE PRICE MId-CAP GROWTh Fund
december 31, 2020
($000s, except shares and per share amounts)
The accompanying notes are an integral part of these financial statements.
STATEMENT OF ASSETS AND LIABILITIES
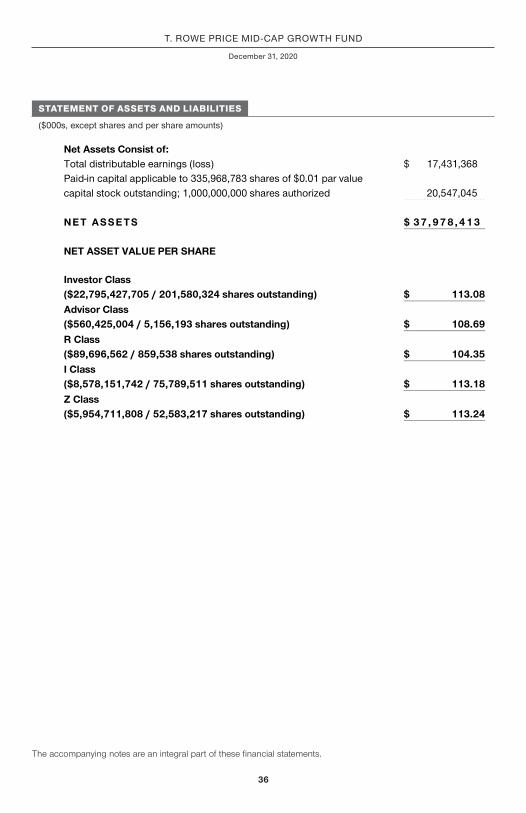
Net Assets Consist of: Total distributable earnings (loss) $ 17,431,368 Paid-in capital applicable to 335,968,783 shares of $0.01 par value capital stock outstanding; 1,000,000,000 shares authorized 20,547,045
NET ASSETS $ 37, 97 8, 4 13
NET ASSET VALUE PER SHARE
Investor Class ($22,795,427,705 / 201,580,324 shares outstanding) $ 113.08 Advisor Class ($560,425,004 / 5,156,193 shares outstanding) $ 108.69 R Class ($89,696,562 / 859,538 shares outstanding) $ 104.35 I Class ($8,578,151,742 / 75,789,511 shares outstanding) $ 113.18 Z Class ($5,954,711,808 / 52,583,217 shares outstanding) $ 113.24
armcg_1220_P4Proof #
37
T. ROWE PRICE MId-CAP GROWTh Fund
($000s)
The accompanying notes are an integral part of these financial statements.
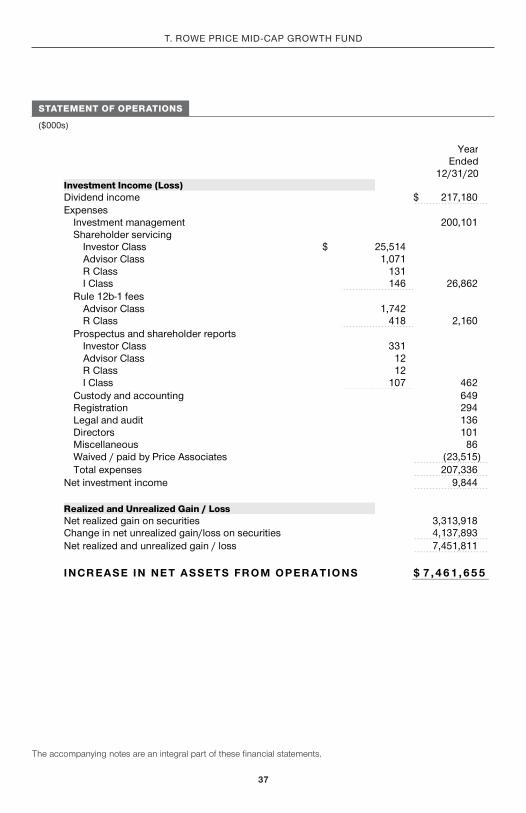
STATEMENT OF OPERATIONS
Year Ended
12/31/20Investment Income (Loss) Dividend income $ 217,180 Expenses Investment management 200,101
Shareholder servicing Investor Class $ 25,514 Advisor Class 1,071 R Class 131 I Class 146 26,862
Rule 12b-1 fees Advisor Class 1,742 R Class 418 2,160
Prospectus and shareholder reports Investor Class 331 Advisor Class 12 R Class 12 I Class 107 462
Custody and accounting 649 Registration 294 Legal and audit 136 Directors 101 Miscellaneous 86 Waived / paid by Price Associates (23,515)
Total expenses 207,336 Net investment income 9,844
Realized and Unrealized Gain / Loss Net realized gain on securities 3,313,918 Change in net unrealized gain/loss on securities 4,137,893 Net realized and unrealized gain / loss 7,451,811
INCR EASE IN NET ASSETS FROM OPERATIO NS $ 7 ,461,655
armcg_1220_P4Proof #
38
T. ROWE PRICE MId-CAP GROWTh Fund
($000s)
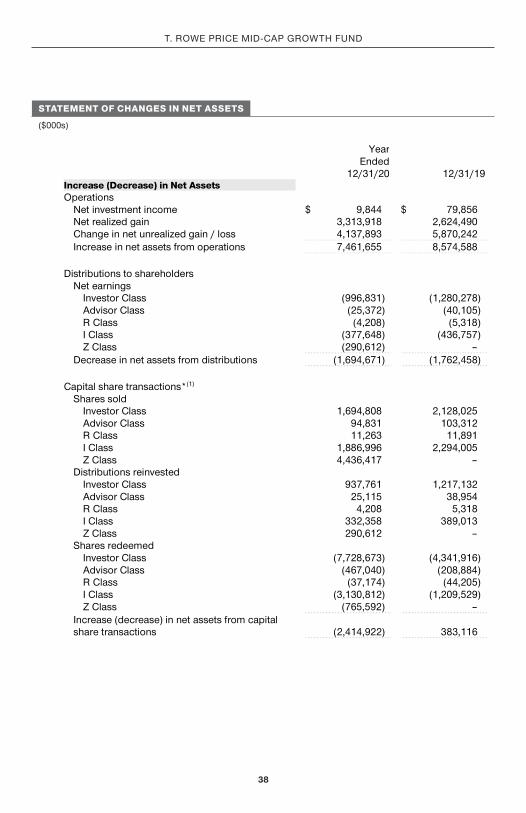
STATEMENT OF CHANGES IN NET ASSETS
YearEnded
12/31/20 12/31/19Increase (Decrease) in Net Assets Operations
Net investment income $ 9,844 $ 79,856 Net realized gain 3,313,918 2,624,490 Change in net unrealized gain / loss 4,137,893 5,870,242
Increase in net assets from operations 7,461,655 8,574,588
Distributions to shareholders Net earnings Investor Class (996,831) (1,280,278) Advisor Class (25,372) (40,105) R Class (4,208) (5,318) I Class (377,648) (436,757) Z Class (290,612) –
Decrease in net assets from distributions (1,694,671) (1,762,458)
Capital share transactions*(1) Shares sold Investor Class 1,694,808 2,128,025 Advisor Class 94,831 103,312 R Class 11,263 11,891 I Class 1,886,996 2,294,005 Z Class 4,436,417 – Distributions reinvested Investor Class 937,761 1,217,132 Advisor Class 25,115 38,954 R Class 4,208 5,318 I Class 332,358 389,013 Z Class 290,612 – Shares redeemed Investor Class (7,728,673) (4,341,916) Advisor Class (467,040) (208,884) R Class (37,174) (44,205) I Class (3,130,812) (1,209,529) Z Class (765,592) –
Increase (decrease) in net assets from capital share transactions (2,414,922) 383,116
armcg_1220_P4Proof #
39
T. ROWE PRICE MId-CAP GROWTh Fund
($000s)
The accompanying notes are an integral part of these financial statements.
STATEMENT OF CHANGES IN NET ASSETS
YearEnded
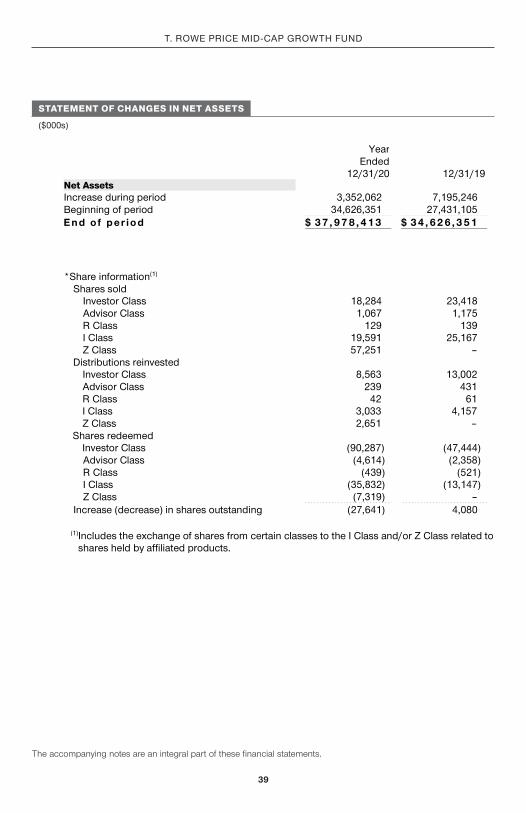
12/31/20 12/31/19Net Assets Increase during period 3,352,062 7,195,246 Beginning of period 34,626,351 27,431,105 End o f per io d $ 37, 97 8, 4 13 $ 34, 62 6, 3 51
*Share information(1) Shares sold Investor Class 18,284 23,418 Advisor Class 1,067 1,175 R Class 129 139 I Class 19,591 25,167 Z Class 57,251 – Distributions reinvested Investor Class 8,563 13,002 Advisor Class 239 431 R Class 42 61 I Class 3,033 4,157 Z Class 2,651 – Shares redeemed Investor Class (90,287) (47,444) Advisor Class (4,614) (2,358) R Class (439) (521) I Class (35,832) (13,147) Z Class (7,319) –
Increase (decrease) in shares outstanding (27,641) 4,080
(1)Includes the exchange of shares from certain classes to the I Class and/or Z Class related to shares held by affiliated products.
armcg_1220_P4Proof #
40
T. ROWE PRICE MId-CAP GROWTh Fund
NOTES TO FINANCIAL STATEMENTS
T. Rowe Price Mid-Cap Growth Fund, Inc. (the fund) is registered under the Investment Company Act of 1940 (the 1940 Act) as a diversified, open-end management investment company. The fund seeks to provide long-term capital appreciation by investing in mid-cap stocks with potential for above-average earnings growth. The fund has five classes of shares: the Mid-Cap Growth Fund (Investor Class), the Mid-Cap Growth Fund–Advisor Class (Advisor Class), the Mid-Cap Growth Fund–R Class (R Class), the Mid-Cap Growth Fund–I Class (I Class), and the Mid-Cap Growth Fund–Z Class (Z Class). Advisor Class shares are sold only through various brokers and other financial intermediaries, and R Class shares are available through financial intermediaries for employer-sponsored defined contribution retirement plans and certain other retirement accounts. I Class shares require a $1 million initial investment minimum, although the minimum generally is waived for retirement plans, financial intermediaries, and certain other accounts. The Z Class is only available to funds advised by T. Rowe Price Associates, Inc. and its affiliates and other clients that are subject to a contractual fee for investment management services. The Advisor Class and R Class each operate under separate Board-approved Rule 12b-1 plans, pursuant to which each class compensates financial intermediaries for distribution, shareholder servicing, and/or certain administrative services; the Investor, I and Z Classes do not pay Rule 12b-1 fees. Each class has exclusive voting rights on matters related solely to that class; separate voting rights on matters that relate to all classes; and, in all other respects, the same rights and obligations as the other classes.
NOTE 1 - SIGNIFICANT ACCOUNTING POLICIES
Basis of Preparation The fund is an investment company and follows accounting and reporting guidance in the Financial Accounting Standards Board (FASB) Accounting Standards Codification Topic 946 (ASC 946). The accompanying financial statements were prepared in accordance with accounting principles generally accepted in the United States of America (GAAP), including, but not limited to, ASC 946. GAAP requires the use of estimates made by management. Management believes that estimates and valuations are appropriate; however, actual results may differ from those estimates, and the valuations reflected in the accompanying financial statements may differ from the value ultimately realized upon sale or maturity.
Investment Transactions, Investment Income, and Distributions Investment transactions are accounted for on the trade date basis. Income and expenses are recorded on the accrual basis. Realized gains and losses are reported on the identified cost basis.
armcg_1220_P4Proof #
41
T. ROWE PRICE MId-CAP GROWTh Fund
Income tax-related interest and penalties, if incurred, are recorded as income tax expense. Dividends received from mutual fund investments are reflected as dividend income; capital gain distributions are reflected as realized gain/loss. Dividend income and capital gain distributions are recorded on the ex-dividend date. Non-cash dividends, if any, are recorded at the fair market value of the asset received. Distributions to shareholders are recorded on the ex-dividend date. Income distributions, if any, are declared and paid by each class annually. A capital gain distribution may also be declared and paid by the fund annually.
Class Accounting Shareholder servicing, prospectus, and shareholder report expenses incurred by each class are charged directly to the class to which they relate. Expenses common to all classes, investment income, and realized and unrealized gains and losses are allocated to the classes based upon the relative daily net assets of each class. The Advisor Class and R Class each pay Rule 12b-1 fees, in an amount not exceeding 0.25% and 0.50%, respectively, of the class’s average daily net assets.
Capital Transactions Each investor’s interest in the net assets of the fund is represented by fund shares. The fund’s net asset value (NAV) per share is computed at the close of the New York Stock Exchange (NYSE), normally 4 p.m. ET, each day the NYSE is open for business. However, the NAV per share may be calculated at a time other than the normal close of the NYSE if trading on the NYSE is restricted, if the NYSE closes earlier, or as may be permitted by the SEC. Purchases and redemptions of fund shares are transacted at the next-computed NAV per share, after receipt of the transaction order by T. Rowe Price Associates, Inc., or its agents.
Indemnification In the normal course of business, the fund may provide indemnification in connection with its officers and directors, service providers, and/or private company investments. The fund’s maximum exposure under these arrangements is unknown; however, the risk of material loss is currently considered to be remote.
NOTE 2 - VALUATION
Fair Value The fund’s financial instruments are valued at the close of the NYSE and are reported at fair value, which GAAP defines as the price that would be received to sell an asset or paid to transfer a liability in an orderly transaction between market participants at the measurement date. The T. Rowe Price Valuation Committee (the Valuation Committee) is an internal committee that has been delegated certain responsibilities by the fund’s Board of Directors (the Board) to ensure that financial instruments
armcg_1220_P4Proof #
42
T. ROWE PRICE MId-CAP GROWTh Fund
are appropriately priced at fair value in accordance with GAAP and the 1940 Act. Subject to oversight by the Board, the Valuation Committee develops and oversees pricing-related policies and procedures and approves all fair value determinations. Specifically, the Valuation Committee establishes policies and procedures used in valuing financial instruments, including those which cannot be valued in accordance with normal procedures or using pricing vendors; determines pricing techniques, sources, and persons eligible to effect fair value pricing actions; evaluates the services and performance of the pricing vendors; oversees the pricing process to ensure policies and procedures are being followed; and provides guidance on internal controls and valuation-related matters. The Valuation Committee provides periodic reporting to the Board on valuation matters.
Various valuation techniques and inputs are used to determine the fair value of financial instruments. GAAP establishes the following fair value hierarchy that categorizes the inputs used to measure fair value:
Level 1 – quoted prices (unadjusted) in active markets for identical financial instruments that the fund can access at the reporting date
Level 2 – inputs other than Level 1 quoted prices that are observable, either directly or indirectly (including, but not limited to, quoted prices for similar financial instruments in active markets, quoted prices for identical or similar financial instruments in inactive markets, interest rates and yield curves, implied volatilities, and credit spreads)
Level 3 – unobservable inputs (including the fund’s own assumptions in determining fair value)
Observable inputs are developed using market data, such as publicly available information about actual events or transactions, and reflect the assumptions that market participants would use to price the financial instrument. Unobservable inputs are those for which market data are not available and are developed using the best information available about the assumptions that market participants would use to price the financial instrument. GAAP requires valuation techniques to maximize the use of relevant observable inputs and minimize the use of unobservable inputs. When multiple inputs are used to derive fair value, the financial instrument is assigned to the level within the fair value hierarchy based on the lowest-level input that is significant to the fair value of the financial instrument. Input levels are not necessarily an indication of the risk or liquidity associated with financial instruments at that level but rather the degree of judgment used in determining those values.
armcg_1220_P4Proof #
43
T. ROWE PRICE MId-CAP GROWTh Fund
Valuation Techniques Equity securities, including exchange-traded funds, listed or regularly traded on a securities exchange or in the over-the-counter (OTC) market are valued at the last quoted sale price or, for certain markets, the official closing price at the time the valuations are made. OTC Bulletin Board securities are valued at the mean of the closing bid and asked prices. A security that is listed or traded on more than one exchange is valued at the quotation on the exchange determined to be the primary market for such security. Listed securities not traded on a particular day are valued at the mean of the closing bid and asked prices for domestic securities.
Investments in mutual funds are valued at the mutual fund’s closing NAV per share on the day of valuation. Assets and liabilities other than financial instruments, including short-term receivables and payables, are carried at cost, or estimated realizable value, if less, which approximates fair value.
Investments for which market quotations or market-based valuations are not readily available or deemed unreliable are valued at fair value as determined in good faith by the Valuation Committee, in accordance with fair valuation policies and procedures. The objective of any fair value pricing determination is to arrive at a price that could reasonably be expected from a current sale. Financial instruments fair valued by the Valuation Committee are primarily private placements, restricted securities, warrants, rights, and other securities that are not publicly traded. Factors used in determining fair value vary by type of investment and may include market or investment specific considerations. The Valuation Committee typically will afford greatest weight to actual prices in arm’s length transactions, to the extent they represent orderly transactions between market participants, transaction information can be reliably obtained, and prices are deemed representative of fair value. However, the Valuation Committee may also consider other valuation methods such as market-based valuation multiples; a discount or premium from market value of a similar, freely traded security of the same issuer; discounted cash flows; yield to maturity; or some combination. Fair value determinations are reviewed on a regular basis and updated as information becomes available, including actual purchase and sale transactions of the investment. Because any fair value determination involves a significant amount of judgment, there is a degree of subjectivity inherent in such pricing decisions, and fair value prices determined by the Valuation Committee could differ from those of other market participants.
armcg_1220_P4Proof #
44
T. ROWE PRICE MId-CAP GROWTh Fund
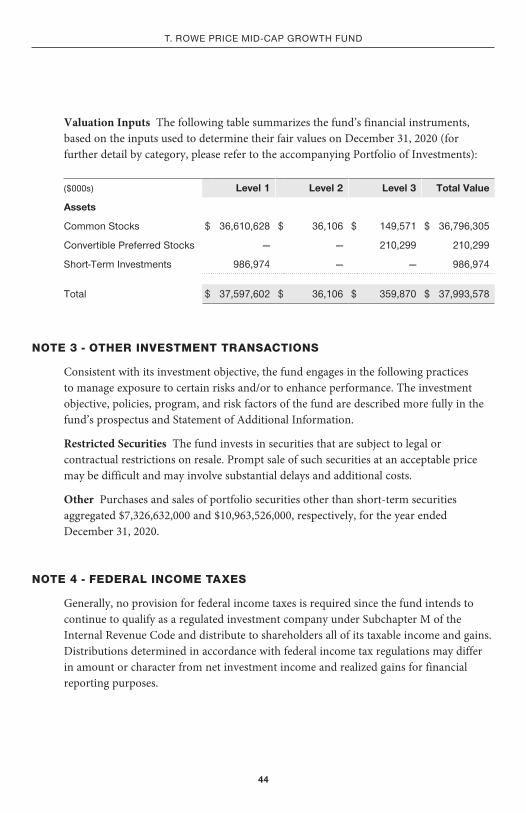
Valuation Inputs The following table summarizes the fund’s financial instruments, based on the inputs used to determine their fair values on December 31, 2020 (for further detail by category, please refer to the accompanying Portfolio of Investments):
($000s) Level 1 Level 2 Level 3 Total Value
Assets
Common Stocks $ 36,610,628 $ 36,106 $ 149,571 $ 36,796,305
Convertible Preferred Stocks — — 210,299 210,299
Short-Term Investments 986,974 — — 986,974
Total $ 37,597,602 $ 36,106 $ 359,870 $ 37,993,578
NOTE 3 - OTHER INVESTMENT TRANSACTIONS
Consistent with its investment objective, the fund engages in the following practices to manage exposure to certain risks and/or to enhance performance. The investment objective, policies, program, and risk factors of the fund are described more fully in the fund’s prospectus and Statement of Additional Information.
Restricted Securities The fund invests in securities that are subject to legal or contractual restrictions on resale. Prompt sale of such securities at an acceptable price may be difficult and may involve substantial delays and additional costs.
Other Purchases and sales of portfolio securities other than short-term securities aggregated $7,326,632,000 and $10,963,526,000, respectively, for the year ended December 31, 2020.
NOTE 4 - FEDERAL INCOME TAXES
Generally, no provision for federal income taxes is required since the fund intends to continue to qualify as a regulated investment company under Subchapter M of the Internal Revenue Code and distribute to shareholders all of its taxable income and gains. Distributions determined in accordance with federal income tax regulations may differ in amount or character from net investment income and realized gains for financial reporting purposes.
armcg_1220_P4Proof #
45
T. ROWE PRICE MId-CAP GROWTh Fund
The fund files U.S. federal, state, and local tax returns as required. The fund’s tax returns are subject to examination by the relevant tax authorities until expiration of the applicable statute of limitations, which is generally three years after the filing of the tax return but which can be extended to six years in certain circumstances. Tax returns for open years have incorporated no uncertain tax positions that require a provision for income taxes.
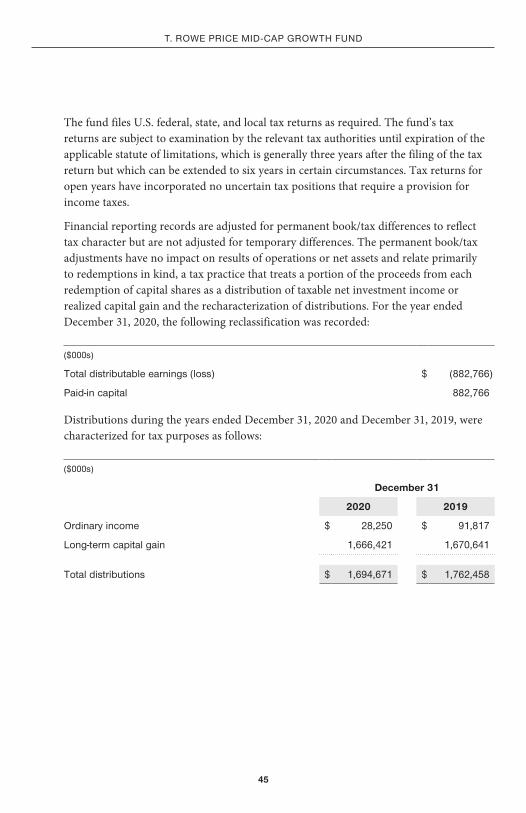
Financial reporting records are adjusted for permanent book/tax differences to reflect tax character but are not adjusted for temporary differences. The permanent book/tax adjustments have no impact on results of operations or net assets and relate primarily to redemptions in kind, a tax practice that treats a portion of the proceeds from each redemption of capital shares as a distribution of taxable net investment income or realized capital gain and the recharacterization of distributions. For the year ended December 31, 2020, the following reclassification was recorded:
($000s)
Total distributable earnings (loss) $ (882,766)
Paid-in capital 882,766
Distributions during the years ended December 31, 2020 and December 31, 2019, were characterized for tax purposes as follows:
($000s)
December 31
2020 2019
Ordinary income $ 28,250 $ 91,817
Long-term capital gain 1,666,421 1,670,641
Total distributions $ 1,694,671 $ 1,762,458
armcg_1220_P4Proof #
46
T. ROWE PRICE MId-CAP GROWTh Fund
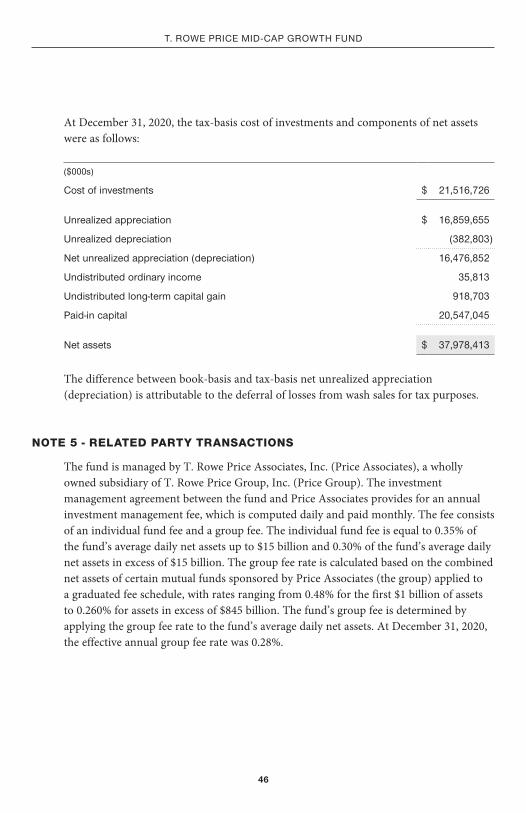
At December 31, 2020, the tax-basis cost of investments and components of net assets were as follows:
($000s)
Cost of investments $ 21,516,726
unrealized appreciation $ 16,859,655
unrealized depreciation (382,803)
net unrealized appreciation (depreciation) 16,476,852
undistributed ordinary income 35,813
undistributed long-term capital gain 918,703
Paid-in capital 20,547,045
net assets $ 37,978,413
The difference between book-basis and tax-basis net unrealized appreciation (depreciation) is attributable to the deferral of losses from wash sales for tax purposes.
NOTE 5 - RELATED PARTY TRANSACTIONS
The fund is managed by T. Rowe Price Associates, Inc. (Price Associates), a wholly owned subsidiary of T. Rowe Price Group, Inc. (Price Group). The investment management agreement between the fund and Price Associates provides for an annual investment management fee, which is computed daily and paid monthly. The fee consists of an individual fund fee and a group fee. The individual fund fee is equal to 0.35% of the fund’s average daily net assets up to $15 billion and 0.30% of the fund’s average daily net assets in excess of $15 billion. The group fee rate is calculated based on the combined net assets of certain mutual funds sponsored by Price Associates (the group) applied to a graduated fee schedule, with rates ranging from 0.48% for the first $1 billion of assets to 0.260% for assets in excess of $845 billion. The fund’s group fee is determined by applying the group fee rate to the fund’s average daily net assets. At December 31, 2020, the effective annual group fee rate was 0.28%.
armcg_1220_P4Proof #
47
T. ROWE PRICE MId-CAP GROWTh Fund
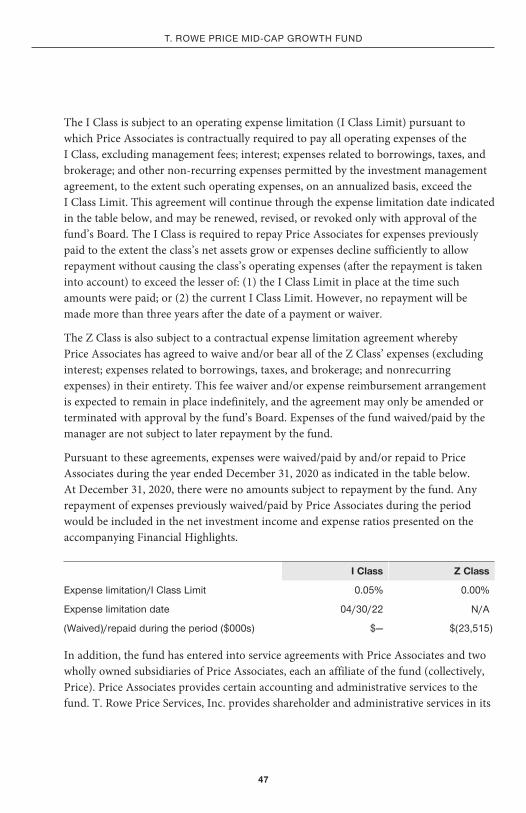
The I Class is subject to an operating expense limitation (I Class Limit) pursuant to which Price Associates is contractually required to pay all operating expenses of the I Class, excluding management fees; interest; expenses related to borrowings, taxes, and brokerage; and other non-recurring expenses permitted by the investment management agreement, to the extent such operating expenses, on an annualized basis, exceed the I Class Limit. This agreement will continue through the expense limitation date indicated in the table below, and may be renewed, revised, or revoked only with approval of the fund’s Board. The I Class is required to repay Price Associates for expenses previously paid to the extent the class’s net assets grow or expenses decline sufficiently to allow repayment without causing the class’s operating expenses (after the repayment is taken into account) to exceed the lesser of: (1) the I Class Limit in place at the time such amounts were paid; or (2) the current I Class Limit. However, no repayment will be made more than three years after the date of a payment or waiver.
The Z Class is also subject to a contractual expense limitation agreement whereby Price Associates has agreed to waive and/or bear all of the Z Class’ expenses (excluding interest; expenses related to borrowings, taxes, and brokerage; and nonrecurring expenses) in their entirety. This fee waiver and/or expense reimbursement arrangement is expected to remain in place indefinitely, and the agreement may only be amended or terminated with approval by the fund’s Board. Expenses of the fund waived/paid by the manager are not subject to later repayment by the fund.
Pursuant to these agreements, expenses were waived/paid by and/or repaid to Price Associates during the year ended December 31, 2020 as indicated in the table below. At December 31, 2020, there were no amounts subject to repayment by the fund. Any repayment of expenses previously waived/paid by Price Associates during the period would be included in the net investment income and expense ratios presented on the accompanying Financial Highlights.
I Class Z Class
Expense limitation/I Class Limit 0.05% 0.00%
Expense limitation date 04/30/22 n/A
(Waived)/repaid during the period ($000s) $— $(23,515)
In addition, the fund has entered into service agreements with Price Associates and two wholly owned subsidiaries of Price Associates, each an affiliate of the fund (collectively, Price). Price Associates provides certain accounting and administrative services to the fund. T. Rowe Price Services, Inc. provides shareholder and administrative services in its
armcg_1220_P4Proof #
48
T. ROWE PRICE MId-CAP GROWTh Fund
capacity as the fund’s transfer and dividend-disbursing agent. T. Rowe Price Retirement Plan Services, Inc. provides subaccounting and recordkeeping services for certain retirement accounts invested in the Investor Class. For the year ended December 31, 2020, expenses incurred pursuant to these service agreements were $68,000 for Price Associates; $3,365,000 for T. Rowe Price Services, Inc.; and $5,907,000 for T. Rowe Price Retirement Plan Services, Inc. All amounts due to and due from Price, exclusive of investment management fees payable, are presented net on the accompanying Statement of Assets and Liabilities.
Additionally, the fund is one of several mutual funds in which certain college savings plans managed by Price Associates may invest. As approved by the fund’s Board of Directors, shareholder servicing costs associated with each college savings plan are borne by the fund in proportion to the average daily value of its shares owned by the college savings plan. For the year ended December 31, 2020, the fund was charged $439,000 for shareholder servicing costs related to the college savings plans, of which $340,000 was for services provided by Price. All amounts due to and due from Price, exclusive of investment management fees payable, are presented net on the accompanying Statement of Assets and Liabilities. At December 31, 2020, less than 1% and approximately 2% of the outstanding shares of the Investor Class and I Class, respectively, were held by college savings plans.
The fund is also one of several mutual funds sponsored by Price Associates (underlying Price Funds) in which the T. Rowe Price Spectrum Funds (Spectrum Funds) and T. Rowe Price Retirement Funds (Retirement Funds) may invest. None of the Spectrum Funds or Retirement Funds invest in the underlying Price Funds for the purpose of exercising management or control. Pursuant to special servicing agreements, expenses associated with the operation of the Spectrum Funds and Retirement Funds are borne by each underlying Price Fund to the extent of estimated savings to it and in proportion to the average daily value of its shares owned by the Spectrum Funds and Retirement Funds. This special servicing agreement between the fund and the Retirement Funds terminated on April 7, 2020. Expenses allocated under these special servicing agreements are reflected as shareholder servicing expense in the accompanying financial statements. For the year ended December 31, 2020, the fund was allocated $109,000 of Spectrum Funds’ expenses and $1,479,000 of Retirement Funds’ expenses. Of these amounts, $582,000 related to services provided by Price. All amounts due to and due from Price, exclusive of investment management fees payable, are presented net on the accompanying Statement of Assets and Liabilities. At December 31, 2020, approximately 1% of the outstanding shares of the Investor Class were held by the Spectrum Funds.

armcg_1220_P4Proof #
49
T. ROWE PRICE MId-CAP GROWTh Fund
In addition, other mutual funds, trusts, and other accounts managed by Price Associates or its affiliates (collectively, Price Funds and accounts) may invest in the fund and are not subject to the special servicing agreements disclosed above. No Price fund or account may invest for the purpose of exercising management or control over the fund. At December 31, 2020, approximately 100% of the Z Class’s outstanding shares were held by Price Funds and accounts.
The fund may invest its cash reserves in certain open-end management investment companies managed by Price Associates and considered affiliates of the fund: the T. Rowe Price Government Reserve Fund or the T. Rowe Price Treasury Reserve Fund, organized as money market funds, or the T. Rowe Price Short-Term Fund, a short-term bond fund (collectively, the Price Reserve Funds). The Price Reserve Funds are offered as short-term investment options to mutual funds, trusts, and other accounts managed by Price Associates or its affiliates and are not available for direct purchase by members of the public. Cash collateral from securities lending is invested in the T. Rowe Price Short-Term Fund. The Price Reserve Funds pay no investment management fees.
As of December 31, 2020, T. Rowe Price Group, Inc., or its wholly owned subsidiaries owned 135,462 shares of the I Class, representing less than 1% of the I Class’s net assets.
The fund may participate in securities purchase and sale transactions with other funds or accounts advised by Price Associates (cross trades), in accordance with procedures adopted by the fund’s Board and Securities and Exchange Commission rules, which require, among other things, that such purchase and sale cross trades be effected at the independent current market price of the security. During the year ended December 31, 2020, the fund had no purchases or sales cross trades with other funds or accounts advised by Price Associates.
Effective January 1, 2020, Price Associates has voluntarily agreed to reimburse the fund from its own resources on a monthly basis for the cost of investment research embedded in the cost of the fund’s securities trades. This agreement may be rescinded at any time. For the year ended December 31, 2020, this reimbursement amounted to $691,000, which is included in Net realized gain (loss) on Securities in the Statement of Operations.
armcg_1220_P4Proof #
50
T. ROWE PRICE MId-CAP GROWTh Fund
NOTE 6 - OTHER MATTERS
Unpredictable events such as environmental or natural disasters, war, terrorism, pandemics, outbreaks of infectious diseases, and similar public health threats may significantly affect the economy and the markets and issuers in which a fund invests. Certain events may cause instability across global markets, including reduced liquidity and disruptions in trading markets, while some events may affect certain geographic regions, countries, sectors, and industries more significantly than others, and exacerbate other pre-existing political, social, and economic risks. During 2020, a novel strain of coronavirus (COVID-19) resulted in disruptions to global business activity and caused significant volatility and declines in global financial markets.
These types of events, such as the global pandemic caused by COVID-19, may also cause widespread fear and uncertainty, and result in, among other things: enhanced health screenings, quarantines, cancellations, and travel restrictions, including border closings; disruptions to business operations, supply chains and customer activity; exchange trading suspensions and closures, and overall reduced liquidity of securities, derivatives, and commodities trading markets; reductions in consumer demand and economic output; and significant challenges in healthcare service preparation and delivery. The fund could be negatively impacted if the value of a portfolio holding were harmed by such political or economic conditions or events. In addition, the operations of the fund, its investment advisers, and the fund’s service providers may be significantly impacted, or even temporarily halted, as a result of any impairment to their information technology and other operational systems, extensive employee illnesses or unavailability, government quarantine measures, and restrictions on travel or meetings and other factors related to public emergencies.
Governmental and quasi-governmental authorities and regulators have in the past responded to major economic disruptions with a variety of significant fiscal and monetary policy changes, including but not limited to, direct capital infusions into companies, new monetary programs, and dramatically lower interest rates. An unexpected or quick reversal of these policies, or the ineffectiveness of these policies, could negatively impact overall investor sentiment and further increase volatility in securities markets. The impact of this outbreak has adversely affected the economies of many nations and the entire global economy and may impact individual issuers and capital markets in ways that cannot be foreseen. Other infectious illness outbreaks that may arise in the future could have similar or other unforeseen effects. The duration of this outbreak or others and their effects cannot be determined with certainty.
armcg_1220_P4Proof #
51
T. ROWE PRICE MId-CAP GROWTh Fund
REPORT OF INDEPENDENT REGISTERED PUBLIC ACCOUNTING FIRM
To the Board of Directors and Shareholders of T. Rowe Price Mid-Cap Growth Fund, Inc.
Opinion on the Financial StatementsWe have audited the accompanying statement of assets and liabilities, including the portfolio of investments, of T. Rowe Price Mid-Cap Growth Fund, Inc. (the “Fund”) as of December 31, 2020, the related statement of operations for the year ended December 31, 2020, the statement of changes in net assets for each of the two years in the period ended December 31, 2020, including the related notes, and the financial highlights for each of the periods indicated therein (collectively referred to as the “financial statements”). In our opinion, the financial statements present fairly, in all material respects, the financial position of the Fund as of December 31, 2020, the results of its operations for the year then ended, the changes in its net assets for each of the two years in the period ended December 31, 2020 and the financial highlights for each of the periods indicated therein, in conformity with accounting principles generally accepted in the United States of America.
Basis for OpinionThese financial statements are the responsibility of the Fund’s management. Our responsibility is to express an opinion on the Fund’s financial statements based on our audits. We are a public accounting firm registered with the Public Company Accounting Oversight Board (United States) (PCAOB) and are required to be independent with respect to the Fund in accordance with the U.S. federal securities laws and the applicable rules and regulations of the Securities and Exchange Commission and the PCAOB.
We conducted our audits of these financial statements in accordance with the standards of the PCAOB. Those standards require that we plan and perform the audit to obtain reasonable assurance about whether the financial statements are free of material misstatement, whether due to error or fraud.

armcg_1220_P4Proof #
52
T. ROWE PRICE MId-CAP GROWTh Fund
REPORT OF INDEPENDENT REGISTERED PUBLIC ACCOUNTING FIRM (CONTINUED)
Our audits included performing procedures to assess the risks of material misstatement of the financial statements, whether due to error or fraud, and performing procedures that respond to those risks. Such procedures included examining, on a test basis, evidence regarding the amounts and disclosures in the financial statements. Our audits also included evaluating the accounting principles used and significant estimates made by management, as well as evaluating the overall presentation of the financial statements. Our procedures included confirmation of securities owned as of December 31, 2020 by correspondence with the custodian, transfer agent and brokers; when replies were not received from brokers, we performed other auditing procedures. We believe that our audits provide a reasonable basis for our opinion.
PricewaterhouseCoopers LLPBaltimore, MarylandFebruary 17, 2021
We have served as the auditor of one or more investment companies in the T. Rowe Price group of investment companies since 1973.
armcg_1220_P4Proof #
53
T. ROWE PRICE MId-CAP GROWTh Fund
TAX INFORMATION (UNAUDITED) FOR THE TAX YEAR ENDED 12/31/20
We are providing this information as required by the Internal Revenue Code. The amounts shown may differ from those elsewhere in this report because of differences between tax and financial reporting requirements.
The fund’s distributions to shareholders included:
§ $23,976,000 from short-term capital gains.
§ $2,379,048,000 from long-term capital gains, subject to a long-term capital gains tax rate of not greater than 20%.
For taxable non-corporate shareholders, $69,633,000 of the fund’s income represents qualified dividend income subject to a long-term capital gains tax rate of not greater than 20%.
For corporate shareholders, $69,633,000 of the fund’s income qualifies for the dividends-received deduction.
INFORMATION ON PROXY VOTING POLICIES, PROCEDURES, AND RECORDS
A description of the policies and procedures used by T. Rowe Price funds and portfolios to determine how to vote proxies relating to portfolio securities is available in each fund’s Statement of Additional Information. You may request this document by calling 1-800-225-5132 or by accessing the SEC’s website, sec.gov.
The description of our proxy voting policies and procedures is also available on our corporate website. To access it, please visit the following Web page:
https://www.troweprice.com/corporate/en/utility/policies.html
Scroll down to the section near the bottom of the page that says, “Proxy Voting Policies.” Click on the Proxy Voting Policies link in the shaded box.
Each fund’s most recent annual proxy voting record is available on our website and through the SEC’s website. To access it through T. Rowe Price, visit the website location shown above, and scroll down to the section near the bottom of the page that says, “Proxy Voting Records.” Click on the Proxy Voting Records link in the shaded box.
HOW TO OBTAIN QUARTERLY PORTFOLIO HOLDINGS
Effective for reporting periods on or after March 1, 2019, a fund, except a money market fund, files a complete schedule of portfolio holdings with the Securities and Exchange Commission (SEC) for the first and third quarters of each fiscal year as an exhibit to its reports on Form N-PORT. Prior to March 1, 2019, a fund, including a money market fund, filed a complete schedule of portfolio holdings with the SEC for the first and third quarters of each fiscal year on Form N-Q. A money market fund files detailed month-end portfolio holdings information on Form N-MFP with the SEC each month and posts a complete schedule of portfolio holdings on its website (troweprice.com) as of each month-end for the previous six months. A fund’s Forms N-PORT, N-MFP, and N-Q are available electronically on the SEC’s website (sec.gov).
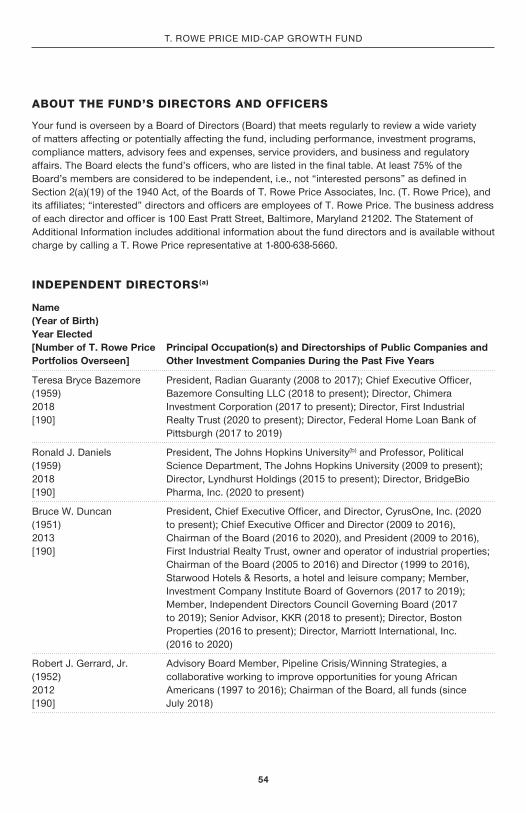
armcg_1220_P4Proof #
54
T. ROWE PRICE MId-CAP GROWTh Fund
ABOUT THE FUND’S DIRECTORS AND OFFICERS
Your fund is overseen by a Board of directors (Board) that meets regularly to review a wide variety of matters affecting or potentially affecting the fund, including performance, investment programs, compliance matters, advisory fees and expenses, service providers, and business and regulatory affairs. The Board elects the fund’s officers, who are listed in the final table. At least 75% of the Board’s members are considered to be independent, i.e., not “interested persons” as defined in Section 2(a)(19) of the 1940 Act, of the Boards of T. Rowe Price Associates, Inc. (T. Rowe Price), and its affiliates; “interested” directors and officers are employees of T. Rowe Price. The business address of each director and officer is 100 East Pratt Street, Baltimore, Maryland 21202. The Statement of Additional Information includes additional information about the fund directors and is available without charge by calling a T. Rowe Price representative at 1-800-638-5660.
INDEPENDENT DIRECTORS(a)
Name(Year of Birth)Year Elected[Number of T. Rowe PricePortfolios Overseen]
Principal Occupation(s) and Directorships of Public Companies and Other Investment Companies During the Past Five Years
Teresa Bryce Bazemore(1959)2018[190]
President, Radian Guaranty (2008 to 2017); Chief Executive Officer, Bazemore Consulting LLC (2018 to present); director, Chimera Investment Corporation (2017 to present); director, First Industrial Realty Trust (2020 to present); director, Federal home Loan Bank of Pittsburgh (2017 to 2019)
Ronald J. daniels(1959)2018[190]
President, The Johns hopkins university(b) and Professor, Political Science department, The Johns hopkins university (2009 to present); director, Lyndhurst holdings (2015 to present); director, BridgeBio Pharma, Inc. (2020 to present)
Bruce W. duncan(1951)2013[190]
President, Chief Executive Officer, and director, CyrusOne, Inc. (2020 to present); Chief Executive Officer and director (2009 to 2016), Chairman of the Board (2016 to 2020), and President (2009 to 2016), First Industrial Realty Trust, owner and operator of industrial properties; Chairman of the Board (2005 to 2016) and director (1999 to 2016), Starwood hotels & Resorts, a hotel and leisure company; Member, Investment Company Institute Board of Governors (2017 to 2019); Member, Independent directors Council Governing Board (2017 to 2019); Senior Advisor, KKR (2018 to present); director, Boston Properties (2016 to present); director, Marriott International, Inc. (2016 to 2020)
Robert J. Gerrard, Jr.(1952)2012[190]
Advisory Board Member, Pipeline Crisis/Winning Strategies, a collaborative working to improve opportunities for young African Americans (1997 to 2016); Chairman of the Board, all funds (since July 2018)
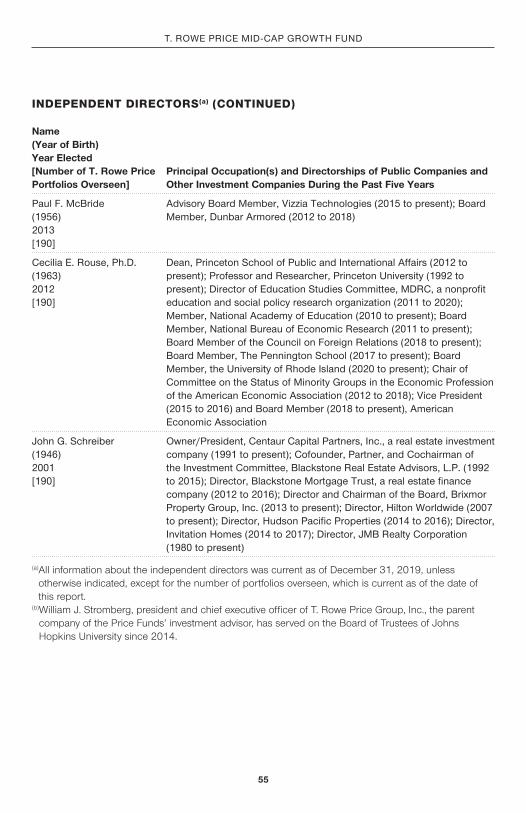
armcg_1220_P4Proof #
55
T. ROWE PRICE MId-CAP GROWTh Fund
Name(Year of Birth)Year Elected[Number of T. Rowe PricePortfolios Overseen]
Principal Occupation(s) and Directorships of Public Companies and Other Investment Companies During the Past Five Years
Paul F. McBride(1956)2013[190]
Advisory Board Member, Vizzia Technologies (2015 to present); Board Member, dunbar Armored (2012 to 2018)
Cecilia E. Rouse, Ph.d.(1963)2012[190]
dean, Princeton School of Public and International Affairs (2012 to present); Professor and Researcher, Princeton university (1992 to present); director of Education Studies Committee, MdRC, a nonprofit education and social policy research organization (2011 to 2020); Member, national Academy of Education (2010 to present); Board Member, national Bureau of Economic Research (2011 to present); Board Member of the Council on Foreign Relations (2018 to present); Board Member, The Pennington School (2017 to present); Board Member, the university of Rhode Island (2020 to present); Chair of Committee on the Status of Minority Groups in the Economic Profession of the American Economic Association (2012 to 2018); Vice President (2015 to 2016) and Board Member (2018 to present), American Economic Association
John G. Schreiber(1946)2001[190]
Owner/President, Centaur Capital Partners, Inc., a real estate investment company (1991 to present); Cofounder, Partner, and Cochairman of the Investment Committee, Blackstone Real Estate Advisors, L.P. (1992 to 2015); director, Blackstone Mortgage Trust, a real estate finance company (2012 to 2016); director and Chairman of the Board, Brixmor Property Group, Inc. (2013 to present); director, hilton Worldwide (2007 to present); director, hudson Pacific Properties (2014 to 2016); director, Invitation homes (2014 to 2017); director, JMB Realty Corporation (1980 to present)
(a) All information about the independent directors was current as of December 31, 2019, unless otherwise indicated, except for the number of portfolios overseen, which is current as of the date of this report.
(b) William J. Stromberg, president and chief executive officer of T. Rowe Price Group, Inc., the parent company of the Price Funds’ investment advisor, has served on the Board of Trustees of Johns Hopkins University since 2014.
INDEPENDENT DIRECTORS(a) (CONTINUED)
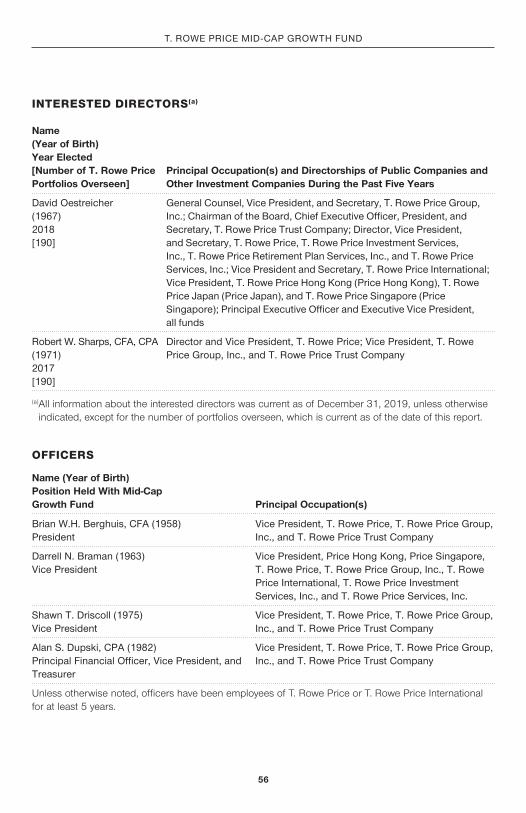
armcg_1220_P4Proof #
56
T. ROWE PRICE MId-CAP GROWTh Fund
INTERESTED DIRECTORS(a)
Name(Year of Birth)Year Elected[Number of T. Rowe Price Portfolios Overseen]
Principal Occupation(s) and Directorships of Public Companies and Other Investment Companies During the Past Five Years
david Oestreicher(1967)2018[190]
General Counsel, Vice President, and Secretary, T. Rowe Price Group, Inc.; Chairman of the Board, Chief Executive Officer, President, and Secretary, T. Rowe Price Trust Company; director, Vice President, and Secretary, T. Rowe Price, T. Rowe Price Investment Services, Inc., T. Rowe Price Retirement Plan Services, Inc., and T. Rowe Price Services, Inc.; Vice President and Secretary, T. Rowe Price International; Vice President, T. Rowe Price hong Kong (Price hong Kong), T. Rowe Price Japan (Price Japan), and T. Rowe Price Singapore (Price Singapore); Principal Executive Officer and Executive Vice President, all funds
Robert W. Sharps, CFA, CPA(1971)2017[190]
director and Vice President, T. Rowe Price; Vice President, T. Rowe Price Group, Inc., and T. Rowe Price Trust Company
(a) All information about the interested directors was current as of December 31, 2019, unless otherwise indicated, except for the number of portfolios overseen, which is current as of the date of this report.
OFFICERS
Name (Year of Birth)Position Held With Mid-Cap Growth Fund Principal Occupation(s)
Brian W.h. Berghuis, CFA (1958)President
Vice President, T. Rowe Price, T. Rowe Price Group, Inc., and T. Rowe Price Trust Company
darrell n. Braman (1963)Vice President
Vice President, Price hong Kong, Price Singapore, T. Rowe Price, T. Rowe Price Group, Inc., T. Rowe Price International, T. Rowe Price Investment Services, Inc., and T. Rowe Price Services, Inc.
Shawn T. driscoll (1975)Vice President
Vice President, T. Rowe Price, T. Rowe Price Group, Inc., and T. Rowe Price Trust Company
Alan S. dupski, CPA (1982)Principal Financial Officer, Vice President, and Treasurer
Vice President, T. Rowe Price, T. Rowe Price Group, Inc., and T. Rowe Price Trust Company
Unless otherwise noted, officers have been employees of T. Rowe Price or T. Rowe Price International for at least 5 years.
armcg_1220_P4Proof #
57
T. ROWE PRICE MId-CAP GROWTh Fund
Name (Year of Birth)Position Held With Mid-Cap Growth Fund Principal Occupation(s)
donald J. Easley, CFA (1971)Vice President
Vice President, T. Rowe Price and T. Rowe Price Group, Inc.
Joseph B. Fath, CPA (1971)Vice President
Vice President, T. Rowe Price, T. Rowe Price Group, Inc., and T. Rowe Price Trust Company
John R. Gilner (1961)Chief Compliance Officer
Chief Compliance Officer and Vice President, T. Rowe Price; Vice President, T. Rowe Price Group, Inc., and T. Rowe Price Investment Services, Inc.
Gary J. Greb (1961)Vice President
Vice President, T. Rowe Price, T. Rowe Price International, and T. Rowe Price Trust Company
Paul J. Krug, CPA (1964)Vice President
Vice President, T. Rowe Price, T. Rowe Price Group, Inc., and T. Rowe Price Trust Company
Matt Mahon (1985)Vice President
Vice President, T. Rowe Price and T. Rowe Price Group, Inc.; formerly, student, The Wharton School, university of Pennsylvania (to 2016)
Robert J. Marcotte (1962)Vice President
Vice President, T. Rowe Price and T. Rowe Price Group, Inc.
Jason nogueira, CFA (1974)Vice President
Vice President, T. Rowe Price and T. Rowe Price Group, Inc.
Fran M. Pollack-Matz (1961)Vice President and Secretary
Vice President, T. Rowe Price and T. Rowe Price Group, Inc.
Shannon h. Rauser (1987)Assistant Secretary
Assistant Vice President, T. Rowe Price
Joshua K. Spencer, CFA (1973)Vice President
Vice President, T. Rowe Price, T. Rowe Price Group, Inc., and T. Rowe Price Trust Company
John F. Wakeman (1962)Executive Vice President
Vice President, T. Rowe Price and T. Rowe Price Group, Inc.
Megan Warren (1968)Vice President
Vice President, T. Rowe Price, T. Rowe Price Group, Inc., T. Rowe Price Retirement Plan Services, Inc., T. Rowe Price Services, Inc., and T. Rowe Price Trust Company; formerly, Executive director, JPMorgan Chase (to 2017)
Unless otherwise noted, officers have been employees of T. Rowe Price or T. Rowe Price International for at least 5 years.
OFFICERS (CONTINUED)

armcg_1220_P4Proof #
58
T. ROWE PRICE MId-CAP GROWTh Fund
Name (Year of Birth)Position Held With Mid-Cap Growth Fund Principal Occupation(s)
Justin P. White (1981)Vice President
Vice President, T. Rowe Price and T. Rowe Price Group, Inc.
Ashley R. Woodruff, CFA (1979)Vice President
Vice President, T. Rowe Price and T. Rowe Price Group, Inc.
Unless otherwise noted, officers have been employees of T. Rowe Price or T. Rowe Price International for at least 5 years.
OFFICERS (CONTINUED)

armcg_1220_P4Proof #
This page intentionally left blank.

armcg_1220_P4Proof #
This page intentionally left blank.

armcg_1220_P4Proof #
This page intentionally left blank.
armcg_1220_P4Proof #
202102-1446272F64-050 2/21
You have manyinvestment goals.
Explore products and services that can help you achieve them.Whether you want to put away more money for retirement, for a child’s education, or for other priorities, we have solutions for you. See how we can help you accomplish the investment goals that are important to you.
RETIREMENTn IRAs: Traditional, Roth,
Rollover/Transfer, or Brokerage
n Small Business Plans help minimize taxes, maximize savings
n T. Rowe Price® ActivePlus Portfolios1 for online investing powered by experts
GENERAL INVESTINGn Individual or Joint
Tenantn Brokerage2 offers
access to stocks, ETFs, bonds, and more
n Gifts and transfers to a child (UGMA/UTMAs)
n Trustn Transfer on Death
COLLEGE SAVINGSn T. Rowe Price-managed
529 plans offer tax-advantaged solutions for families saving money for college tuition and education-related expenses
Visit troweprice.com/broadrange
Call 1-800-225-5132 to request a prospectus or summary prospectus; each includes investment objectives, risks, fees, expenses, and other information that you should read and consider carefully before investing.
All mutual funds are subject to market risk, including possible loss of principal. Investing internationally involves special risks including economic and political uncertainty and currency fluctuation.
1 The T. Rowe Price® ActivePlus Portfolios is a discretionary investment management program provided by T. Rowe Price Advisory Services, Inc., a registered investment adviser under the Investment Advisers Act of 1940. Brokerage services are provided by T. Rowe Price Investment Services, Inc., member FINRA/SIPC. Brokerage accounts are carried by Pershing LLC, a BNY Mellon Company, member NYSE/FINRA/SIPC. T. Rowe Price Advisory Services, Inc., and T. Rowe Price Investment Services, Inc., are affiliated companies.
2 Brokerage services are provided by T. Rowe Price Investment Services, Inc., member FINRA/SIPC. Brokerage accounts are carried by Pershing LLC, a BNY Mellon Company, member NYSE/FINRA/SIPC.
T. Rowe Price Investment Services, Inc. | 100 East Pratt Street | Baltimore, MD 21202-1009