deliverable d2.3 design and analysis of the chosen...
TRANSCRIPT

STRAUSS Scalable and efficient orchestration of Ethernet services
using software-defined and flexible optical networks
Deliverable D2.3
Page 1 of 80
Deliverable D2.3
Design and analysis of the chosen technology options for the flexi-grid optical path-packet infrastructure for Ethernet transport
Status and Version: Version 0.6
Date of issue: 30/11/2015
Distribution: Public
Author(s): Name Partner
Shuangyi Yan
Yan Yan
Georgios Zervas
Dimitra Simeonidou
UNIVBRIS
Michela Svaluto Moreolo
Laia Nadal
Josep M. Fabrega
CTTC
Kai Habel
Luz Fernandez del Rosal
Michael Schlosser
HHI
Yuki Yoshida
Pablo J. Argibay-Losada
Ken-ichi Kitayama
OsakaU
Ref. Ares(2015)5579335 - 04/12/2015

STRAUSS Scalable and efficient orchestration of Ethernet services
using software-defined and flexible optical networks
Deliverable D2.3
Page 2 of 80
Yutaka Kai
Masato Nishihara
Ryo Okabe
Toshiki Tanaka
Tomoo Takahara
Jens C. Rasmussen
Fujitsu
Felipe Jimenez Arribas TID

STRAUSS Scalable and efficient orchestration of Ethernet services
using software-defined and flexible optical networks
Deliverable D2.3
Page 3 of 80
Executive Summary
This deliverable focuses on the development of the optimum design of the chosen technology options for the flexi-grid optical path-packet infrastructure for Ethernet transport, in line with the requirements identified in D2.1. The outcomes are optical transceiver solutions supporting OPS and flexi-grid OCS, variable capacity OPS, flexible optical nodes and interface between OPS and OCS, in view of their integration within WP4. The performance of these technology enablers have been reported, including the evaluation of alternative solutions and improvement methods.
DMT has been the chosen technology option for transceivers supporting OPS beyond 100GbE. The FPGA-based DMT transceiver allows sub-wavelength granularity and format adaptation, enabling up to 400G (4x100G) transmission over link distance of up to 40 km, in line with the requirements targeted in D2.1. In this deliverable, the analysis to extend the achievable distance to more than 100km, thanks to the use of VSB and NLC, has been provided. In addition, DMT modulation and demodulation processing performed by the FPGA board has been improved with optimized HLS.
For the metro/regional segment of the OCS network, the transceiver design that has been chosen is based on the OFDM technology combined with DD, for cost-effective rate/distance adaptive transmission with sub-wavelength granularity. To target the requirements of flexibility, scalability and adaptive spectrum allocation, envisioned in D2.1, a sliceable BVT architecture has been provided and its building block scheme and performance optimized. In addition to this, a real-time implementation of an OFDM-transmitter has been evaluated. The design of a high baud-rate multi-format transceiver has been given for covering the core segment in OCS network. The available link capacities have been analyzed to provide the huge capacity request with flexible superchannel assembling up to 320Gb/s/channel.
The OPS technology using the FL-VC design has been investigated and the adaptive modulation algorithm optimized to be cross-talk tolerant in fully-flexible 3D networks. A throughput improvement greater than 75% have been obtained compared to fixed-format transmissions. The network performance has been analyzed in terms of throughput and latency, demonstrating that OPS outperforms EPS in highly-loaded systems with very stringent QoS requisites.
In this deliverable also the key design and subsystems of the flexible/adaptable optical node based on the AoD have been reported to enable network function programmability and support multi-domain network operations. In addition, to improve the robustness of optical network and decrease the network operation fee, a power monitoring system has been included, demonstrating global power equalization and auto-restoration feature.
Finally, the architecture of the FPGA-based real-time OPS/OCS integrated interface has been provided to bridge OPS and OCS domains with ultra-high performance optoelectronics platforms, according to the requirements of the system and the FPGA-based platforms constraints. Furthermore,

STRAUSS Scalable and efficient orchestration of Ethernet services
using software-defined and flexible optical networks
Deliverable D2.3
Page 4 of 80
the maximum bit rate of variable OPS packet length, as well as the OPS and the OCS latency have been analyzed.

STRAUSS Scalable and efficient orchestration of Ethernet services
using software-defined and flexible optical networks
Deliverable D2.3
Page 5 of 80
Table of Contents
Executive Summary 3
1 Introduction 7
2 Optical transceiver for OPS 10
2.1 Required specifications of DMT transceiver 10
2.2 Experimental evaluation of DMT transceiver 11 2.2.1 Result of experimental validation 11 2.2.2 Reach extension for DMT transceiver 12
2.3 FPGA configuration for the DMT transmission 18
2.4 Difference of the processing of FPGA and Matlab 20
2.5 Comparative study of the DMT transmission results between Matlab and FPGA 21
3 Optical transceiver solutions for flexible OCS 25
3.1 OFDM-based transceiver 25 3.1.1 Sliceable OFDM transceiver 25 3.1.2 Real time OFDM transmitter 33
3.2 High-baud rate multi-format transceiver 45
4 Variable capacity OPS based on sliceable transceivers 49
4.1 Fixed-length variable-capacity OPS for photonic layer-2 49
4.2 Cross-talk tolerant FL-VC packet for mode-unbundled transmissions 51
4.3 Update on the performance analysis of distance-adaptive FL-VC OPS 56
5 Flexible optical node with OPS/OCS interface 61
5.1 AoD-based flexible/adaptable optical node 61 5.1.1 Experimental testbed of AoD-based optical node 63 5.1.2 Developed key subsystems 65 5.1.3 Demonstration of global power equalization 67 5.1.4 Demonstration of auto-restoration of network failure 68

STRAUSS Scalable and efficient orchestration of Ethernet services
using software-defined and flexible optical networks
Deliverable D2.3
Page 6 of 80
5.2 FPGA-based real-time OPS/OCS integrated interface 70
6 Conclusions 74
7 List of acronyms 75
8 References 78

STRAUSS Scalable and efficient orchestration of Ethernet services
using software-defined and flexible optical networks
Deliverable D2.3
Page 7 of 80
1 Introduction
STRAUSS project aims to control and manage a network scenario covering multiple technology domains and provision end-to-end services. Figure 1 shows the four layers of the software defined optical Ethernet transport network architecture proposed in STRAUSS.
Figure 1: The four layers of STRAUSS architecture
The transport infrastructure includes different/heterogeneous technologies based on: i) optical packet switching technology to provide scalable and cost/energy-efficient traffic grooming at sub-wavelength granularity, ii) optical spectrum switching technology to provide flexible spectrum management capabilities, and iii) software-defined and sliceable (multi-flow) bandwidth-variable transponders (BVT) supporting multiple data flows with different modulation formats and bit rates.
Figure 2 details the use case for end-to-end transparent optical networks, proposed within the STRAUSS project. Specifically, the different network segments covered by the transport infrastructure for optical packet switching (OPS) and optical circuit switching (OCS) domains are indicated.
Virtual Transport Infrastructure 1 Virtual Transport Infrastructure n
...
...
SDN-based Service and Network Orchestrator
Network Control & ManagementNetwork Control & Management
Flexi-grid OCS Domain 2
Flexi-grid OCS Domain 1
OPSOPS OPS/OCS
(BVT)OPS/OCS
(BVT)
Virtual Resources Pool
GMPLS OpenFlow
Tra
nspo
rtIn
fras
truc
ture
Tra
nspo
rt V
irtua
lizat
ion
Virt
ual I
nfr.
Ctr
l & M
gtE
nd-t
o-en
dO
rche
stra
tion
Virtualization Visor (Abstraction, Partitioning, Composition)

STRAUSS Scalable and efficient orchestration of Ethernet services
using software-defined and flexible optical networks
Deliverable D2.3
Page 8 of 80
Figure 2 Use case for end-to-end transparent optical networks: multi-domain communication in the ICT STRAUSS project
For each specific domain of the flexi-grid optical path-packet infrastructure, the chosen technology options are designed and analyzed for Ethernet transport, according to the identified requirements provided in deliverable D2.1 [D2.1].
An overview of these requirements and the technology enablers considered in STRAUSS is here below provided.
Optical transmission technologies are evolving to enable a higher network efficiency, flexibility and scalability to cope with the needs of the future Internet. OPS and flexible OCS technologies have been analyzed in STRAUSS project to fulfil the requirements for this evolution, and suitably combined towards a future optical infrastructure for optical transport beyond 100 Gb/s.
Huge quantities of data are exchanged between data center (DC) on inter-DC and within the data center on intra-DC networks. The amount of data that can be processed in a reasonable time frame is often limited by the processing capability, the bandwidth and the latency of data transfer over the networks. Therefore, a large bandwidth as well as low latency will be required for the network.
One technology to create flexible sub-wavelength paths with arbitrary bandwidths is the packet optical transport system, where electric packet switches are integrated with WDM optical cross-connects. Packets provide sub-wavelength “logical” paths, while a wavelength serves as a physical path.

STRAUSS Scalable and efficient orchestration of Ethernet services
using software-defined and flexible optical networks
Deliverable D2.3
Page 9 of 80
The limitations of today’s electronic packet switching technologies, commonly identified in terms of energy consumption and capacity, will constrain the ability of the network to meet the rising demand for more data. Thus, a novel network architecture is needed to overcome the limitations of the current router-based networks. Beyond 100 Gb/s, layer-2 switches, such as Ethernet switches, in widespread use in metro-access networks, cannot be as efficient as their optical counterparts, due to large forwarding delay and poor power efficiency. An attractive solution in order to save energy, CAPEX and OPEX will be photonic layer-2 (P-L2) networking based on the optical packet switching technology.
Actually, by exploiting the high speed and bandwidth of photonics as well as the all-optical processing capability, Ethernet bridging or switching functions can be simplified, creating a new photonic transport protocol, while maintaining the interface with existing protocols (e.g. Ethernet protocol) at the edges.
For the lack of readily available optical RAM buffer, fiber delay line buffer can be adopted as a practical solution for OPS. Thus, a fixed-length (fixed time slotted) optical packet would be preferable; however, the incoming Ethernet frames have variable-length. In STRAUSS project, we cope with this issue by exploiting the bandwidth flexibility of the sliceable transponders. Specifically, we investigate an efficient design of fixed-length variable-capacity (FL-VC) optical payload packet towards real-life P-L2 based on the OPS technology.
The chosen technology option for transceivers supporting OPS beyond 100GbE is the discrete multitone (DMT). In fact, multicarrier modulation allows sub-wavelength granularity and format adaptation, enabling up to 400G (4x100G) transmission over link distance of up to 40 km, in line with the demand within 400GbE standardization activities and according to the requirements targeted in D2.1.
In order to handle the nature of Ethernet traffic in the OCS domain and cope with the need of future Internet, the major requirement identified in D2.1 is the evolution of data plane technologies to address optical networks flexibility, efficiency and scalability. Thus, adaptive optical spectrum allocation, modulation format adaption as well as channel spacing adjustment represent key flexible features in flexi-grid OCS networks. The flexibility provides differentiated services related to the transmission distance, while flexibility strategies allow more efficient utilization of the optical spectrum and the network resources. Another important requirement for the networks evolution is to have a node architecture which enables to dynamically configure the data-rate by software on demand and able to accommodate the demands using a DWDM flexi-grid.
In the STRAUSS project the technology enablers targeting the above mentioned requirements have been identified and investigated. They include software-defined sliceable BVT, and flexible/adaptable optical nodes for flexi-grid DWDM networks.

STRAUSS Scalable and efficient orchestration of Ethernet services
using software-defined and flexible optical networks
Deliverable D2.3
Page 10 of 80
Software-defined programmable BVT allows flexibly forming superchannel structures, which are routed and switched in optical networks as a single signal comprised of several subcarriers; multiple signal slices with variable granularity (including the sub-wavelength level) can be either handled by introducing advanced features in the BVT. One key requirement for the software-defined transponder is that it must be programmable and thus adaptively reconfigurable to multiple modulation formats and/or variable bandwidth occupancy. Another important requirement for the BVT solution is the cost effectiveness, particularly relevant for the metro/regional network segment. In the STRAUSS project optical orthogonal frequency division multiplexing (OFDM), with simple direct detection is selected for this segment due to its high spectral efficiency, unique flexibility, adaptive bit-rate/bandwidth, and sub-wavelength granularity. In contrast, for the core segment, high baud rate multi-format transceiver based on coherent technology is proposed, targeting high capacity superchannel generation.
To enable network function programmability as well as handling the heterogeneous and dynamic Ethernet traffic in flexi-grid DWDM networks, STRAUSS flexible/adaptable node design is based on the architecture on demand.
To take full advantage of both OPS and OCS networks, OPS/OCS-integrated interface is required to interconnect the two technological domains of OPS and OCS. Within STRAUSS, an FPGA-based real-time OPS/OCS integrated interface is designed and implemented to bridge OPS and OCS domains with ultra-high performance optoelectronics platforms.
Details on the adopted design and the latest performance assessment of DMT transceiver for OPS are provided in Sec. 2, while the chosen technology options for the transceivers to be adopted in the different segments of the OCS domain are presented in Sec. 3.
The investigation on the OPS technology using the FL-VC design is reported in Sec. 4, providing the analysis of network performance and latency in comparison with electrical packet switching.
The flexible optical node design and performance as well as the architecture of the interface between OPS and OCS and its analysis, are presented and discussed in Sec. 5.
Finally, in Sec. 6, the concluding remarks are listed.
2 Optical transceiver for OPS
2.1 Required specifications of DMT transceiver
The specifications of DMT transceiver for beyond 100 Gb/s OPS is summarized in Table 1.

STRAUSS Scalable and efficient orchestration of Ethernet services
using software-defined and flexible optical networks
Deliverable D2.3
Page 11 of 80
Table 1 Specifications of the DMT transceiver for OPS
Items Parameter Target specification
Transmission characteristics
Data rate per wavelength ≤ 100 Gb/s
Transmission distance ≤ 40 km
Number of wavelength 4
Target BER 4.5 x 10⁻³
Note that target specification for “Target BER” was revised. Previous specification was based on BCH FEC. New specification is based on CI-BCH (Continuously Interleaved BCH).
2.2 Experimental evaluation of DMT transceiver
2.2.1 Result of experimental validation
Figure 3 depicts the experimental setup for DMT transceiver evaluation. The DMT signal was
generated by a four channel DAC (digital to analog converter) operating at 64 GSamples/s with 8-bit resolution and was amplified by the linear electrical amplifier. We used four directly modulated lasers (DMLs). The center wavelengths of DML1, DML2, DML3 and DML4 were 1295.0, 1299.5, 1304.1 and 1309.0 nm, respectively, which is corresponding to four wavelengths in LAN-WDM system. Each wavelength of the DMLs was allocated in the wavelength range for each port. The optical signal was launched into the SMF without optical amplification and dispersion compensation. The transmitted signal was received by the receiver with the linear transimpedance amplifier (TIA). The received signal was captured by a four channel ADC (analog to digital converter) operating at 64 GSamples/s with 8-bit resolution. The modulation and the demodulation processes of the DMT signal were done
Figure 3: Setup for DMT transceiver evaluation
STRAUSS Scalable and efficient orchestration of Ethernet services
using software-defined and flexible optical networks
Deliverable D2.3
Page 12 of 80
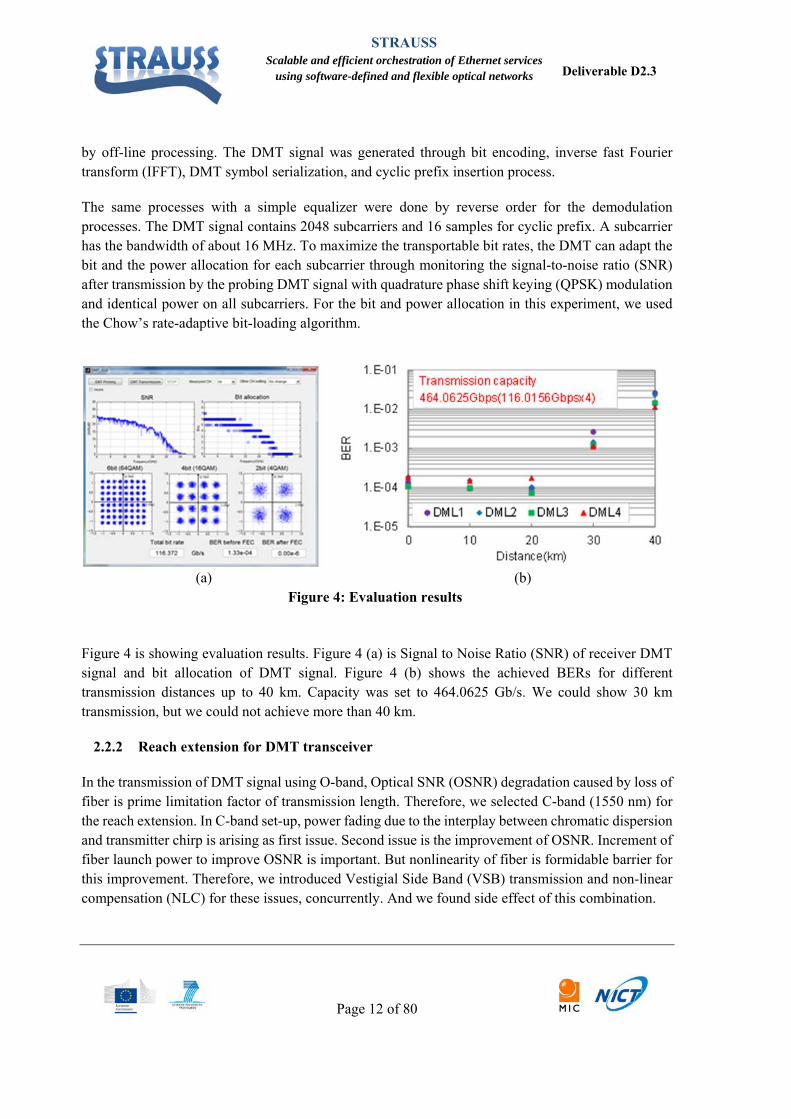
by off-line processing. The DMT signal was generated through bit encoding, inverse fast Fourier transform (IFFT), DMT symbol serialization, and cyclic prefix insertion process.
The same processes with a simple equalizer were done by reverse order for the demodulation processes. The DMT signal contains 2048 subcarriers and 16 samples for cyclic prefix. A subcarrier has the bandwidth of about 16 MHz. To maximize the transportable bit rates, the DMT can adapt the bit and the power allocation for each subcarrier through monitoring the signal-to-noise ratio (SNR) after transmission by the probing DMT signal with quadrature phase shift keying (QPSK) modulation and identical power on all subcarriers. For the bit and power allocation in this experiment, we used the Chow’s rate-adaptive bit-loading algorithm.
Figure 4 is showing evaluation results. Figure 4 (a) is Signal to Noise Ratio (SNR) of receiver DMT signal and bit allocation of DMT signal. Figure 4 (b) shows the achieved BERs for different transmission distances up to 40 km. Capacity was set to 464.0625 Gb/s. We could show 30 km transmission, but we could not achieve more than 40 km.
2.2.2 Reach extension for DMT transceiver
In the transmission of DMT signal using O-band, Optical SNR (OSNR) degradation caused by loss of fiber is prime limitation factor of transmission length. Therefore, we selected C-band (1550 nm) for the reach extension. In C-band set-up, power fading due to the interplay between chromatic dispersion and transmitter chirp is arising as first issue. Second issue is the improvement of OSNR. Increment of fiber launch power to improve OSNR is important. But nonlinearity of fiber is formidable barrier for this improvement. Therefore, we introduced Vestigial Side Band (VSB) transmission and non-linear compensation (NLC) for these issues, concurrently. And we found side effect of this combination.
(a) (b) Figure 4: Evaluation results

STRAUSS Scalable and efficient orchestration of Ethernet services
using software-defined and flexible optical networks
Deliverable D2.3
Page 13 of 80
Figure 5 depicts the set up for reach extension experiment.
DMT signal is converted to analogue signal by 64 GS/s DAC and drove Mach-Zehnder modulator (MZM). Wavelength of the optical source (CW) is 1549.8 nm. After being amplified by 1st Erbium doped Fiber Amplifier (EDFA), the side band of the DMT signal is eliminated by 1st OBPF in the VSB case and transmitted over SSMF up to 110 km. Fiber input power is adjusted by VOA.
Transmitted signal is amplified by 2nd EDFA and inserted to the 2nd OBPF. 2nd OBPF is playing a role of eliminating filter for optical noise occurred in 2nd EDFA. Bandwidths of OBPFs are 64 GHz and centre frequency is offset by 6 GHz to switch VSB and double side band (DSB) signal. Then it is received by the photodetector (PD) whose input power is fixed at 0 dBm and converted to digital signal by the 80 GS/s digital storage oscilloscope (DSO). 2nd order Volterra NLC with 31 taps is applied to the captured data before DMT demodulation. In this experiment all digital signal processing are done by offline manner.
Power fading appears as periodical dips in the frequency response occurred at the photodetector with existence of chromatic dispersion and transmitter chirp. It is interplay of Upper Side Band (USB) and Lower Side Band (LSB) of received signal. Although an adaptive bit loading is used for DMT transmission, the performance degrades by the frequency dips. VSB transmission suppresses the power fading by eliminating one side band by an optical band pass filter (OBPF). However, additional non-linear distortion caused by the OBPF for VSB filtering must be taken into account. Therefore, transmission capacity using VSB was degraded in previous research and no one can achieve enough 100 Gbps including taking into account of FEC overhead.
On the other hand, for the mitigation of fiber nonlinearity, NLC based on Volterra theory was proposed and showed good performance to compensate the non-linear distortion of DMT transmission. We adopt the NLC to compensate the non-linear distortion of transmission.
Figure 5: Setup for reach extension experiment for DMT transceiver
64 GS/s
DAC
DSO
MZMCW
OBPF2
PD
Driver
EDFA1VOA1
EDFA2SMF
OBPF1
VOA2
1549.8 nm
DMTmod.
DMTdemod. NLC
80 GS/s

STRAUSS Scalable and efficient orchestration of Ethernet services
using software-defined and flexible optical networks
Deliverable D2.3
Page 14 of 80
Figure 6 shows optical spectra of VSB and DSB DMT signal. The centre frequency of OBPFs is changed to switch VSB and DSB signal. OBPFs suppress the LSB with the offset of 6 GHz from the centre frequency of optical carrier. And this optimized offset value of 6 GHz was confirmed before experiments.
Figure 7 shows the SNR characteristics of DMT transmission obtained from transmission characteristics of probe signal. In this case, 80 km SSMF was used for this measurement. These results include not only optical transmission characteristics but also electrical characteristics of transceiver. Transmitted characteristic of DSB case is shown in Figure 7 (a) as dashed line. Power fading caused by the interplay of transmitter chirp and fiber chromatic dispersion is clearly observed. The transmission capacity is maximized for these measured SNR and bit and power loading on each subcarrier. The Chow’s algorithm is used with the target BER of 4.5 x 10⁻³. Bit loading results of back to back and 80 km transmission for DSB case without NLC are shown in Figure 8. As a result of power fading influence, transmission capacity is reduced from 140.5 Gbps to 83.2 Gbps.
Figure 6: Optical spectra of VSB/DSB signal
1549.35 1549.85 1550.35
Nor
mal
ized
leve
l 10
dB/
div.
Wavelength (nm)
DSBVSB
Res.; 0.8 pm
Figure 7: SNR characteristics of VSB/DSB DMT signal
(a) DSB (b) VSBw/o. NLCw. NLC
w/o. NLCw. NLC
Frequency (GHz)Frequency (GHz)0 10 20 300 10 20 30
SNR
(dB)
0
10
30
20
SNR
(dB)
0
10
30
20
6 dB

STRAUSS Scalable and efficient orchestration of Ethernet services
using software-defined and flexible optical networks
Deliverable D2.3
Page 15 of 80
We adapt VSB filtering at transmitter side. Measured SNR characteristics same as DSB manner is shown in Figure 7 (b) as dashed line. Bit loading results of back to back and 80 km transmission for VSB case without NLC are shown in Figure 9. By the benefit of VSB filtering, power fading disappears. But improvement of transmission capacity is from 83.2 Gbps to 83.5 Gbps, and this is negligible. They are clearly showing the degradation caused by VSB filtering. VSB can mitigate the impact of dispersion oriented power fading, but this filtering cause nonlinear effect to DMT signalling. For the measurement of Figure 7 (b) and Figure 9, 6 GHz offset filter is used for making VSB signal. Therefore, SNR degradation appeared beyond 6 GHz frequency region compare with DSB and VSB measured SNR. It is clearly observed in dashed line of Figure 7 (a) and (b). In the back to back case, transmission capacity is reduced approximately 25 %, from 140 Gbps to 105 Gbps, by the VSB filtering.
Figure 8: Bit loading results of DSB signal without NLC
Figure 9: Bit loading results of VSB signal without NLC
Next we adapt NLC based on the Volterra algorithm for the compensation of nonlinearity. We expect the mitigation of the nonlinearity caused by the fiber. And as a side effect of NLC, we expect the
0
2
4
6
8
10
0 500 1000
Bit a
lloca
tion
Subcarrier number
0
2
4
6
8
10
0 500 1000
Bit a
lloca
tion
Subcarrier number
(a) DSB w/o NLC, L = 0 kmcapacity = 140.5 Gbps
(b)DSB w/o NLC, L = 80 kmcapacity = 83.2 Gbps
0
2
4
6
8
10
0 500 1000
Bit a
lloca
tion
Subcarrier number
0
2
4
6
8
10
0 500 1000
Bit a
lloca
tion
Subcarrier number
(a) VSB w/o NLC, L = 0 kmcapacity = 105.4 Gbps
(b)VSB w/o NLC, L = 80 kmcapacity = 83.5 Gbps

STRAUSS Scalable and efficient orchestration of Ethernet services
using software-defined and flexible optical networks
Deliverable D2.3
Page 16 of 80
mitigation of nonlinearity caused by the VSB filtering previously mentioned. Bit loading results of back to back and 80 km transmission for DSB and VSB with NLC are shown in Figure 10. Figure 11
shows BER characteristics comparison. For the DSB case, optimum fiber launch power is several dB improved and back to back transmission capacity is improved 5 %, from 140.5 Gbps to 147.3 Gbps by the benefit of NLC. As expected, NLC is efficient not only for fiber nonlinearity, but also nonlinearity caused by the VSB filtering. It is shown that 6 dB improvement of SNR by NLC in Figure 7(b). As a result, transmission capacity of VSB in back to back case is improved approximately 30 %, namely from 105.4 Gb/s to 135.3 Gb/s. Figure 11 shows the BER characteristics at data rate of 110.3 Gb/s corresponding to the payload of 103.125 Gb/s with HD-FEC overhead of 7% over 80 km SSMF. The BER for optimized input power of VSB transmission largely improved from 3.5 x 10⁻² to 1.1 x 10⁻³ by using NLC. On the other hand, improvement of DSB transmission is 1.1 dB that is from 4.5 x 10⁻² to 2.0 x 10⁻².
Figure 10: Bit loading results of DSB/VSB signal with NLC
0
2
4
6
8
10
0 500 1000
Bit a
lloca
tion
Subcarrier number
0
2
4
6
8
10
0 500 1000
Bit a
lloca
tion
Subcarrier number
0
2
4
6
8
10
0 500 1000
Bit a
lloca
tion
Subcarrier number
0
2
4
6
8
10
0 500 1000
Bit a
lloca
tion
Subcarrier number
(a) DSB w. NLC, L = 0 kmcapacity = 147.3 Gbps
(b) DSB w. NLC, L = 80 kmcapacity = 88.7 Gbps
(c) VSB w. NLC, L = 0 kmcapacity = 135.3 Gbps
(d) VSB w. NLC, L = 80 kmcapacity = 111.6 Gbps

STRAUSS Scalable and efficient orchestration of Ethernet services
using software-defined and flexible optical networks
Deliverable D2.3
Page 17 of 80
Finally, we experimentally evaluated practical transmission length by DMT transceiver without chromatic dispersion compensation. In this case bit rate of transceiver is set to 110.3 Gb/s for 100GbE capacity. We confirm for DSB/VSB and with/without NLC.
Figure 12 shows these results. For the conventional transceiver 10 km transmission is not possible. Using NLC, 40 km transmission is possible. And finally, more than 100 km transmission is confirmed by DMT transceiver using VSB and NLC. Dispersion of 10 km, 40 km, 80 km and 100 km SSMF are 163, 652, 1306 and 1630 ps/nm respectively. These results are showing DMT transmission reach is extended up to 80 km successfully.
Figure 11: BER vs. fiber launch power for 80 km transmission
Figure 12: BER vs. transmission distance for 110.3 Gb/s
Fibre launch power (dBm)0 5 10 15
Bit e
rror r
atio
10-1
10-2
10-3
10-4
FEC threshold
VSBDSB
w.
NLCw/o.
Distance (km)0 50 100
Bit e
rror r
atio
10-1
10-2
10-3
10-4
10-5
10-6
FEC threshold
VSBDSB
w.
NLCw/o.

STRAUSS Scalable and efficient orchestration of Ethernet services
using software-defined and flexible optical networks
Deliverable D2.3
Page 18 of 80
2.3 FPGA configuration for the DMT transmission
The FPGA-based DMT transceiver demonstrator is revised to support 400G (4x100G) transmission (see Figure 3). Modulation and demodulation is performed by the FPGA board. Synopsys HAPS-62 with Virtex6 was used for the FPGA board. DMT transmission of each wavelength was done sequentially. Figure 13 shows the configuration of the FPGA. FPGA controls the 4-channel (4-ch) digital-to-analog converter (DAC) and the 4-ch analog-to-digital converter (ADC) through the Serial Peripheral Interface (SPI). Table 2 and Table 3 show the functions of the internal blocks of the FPGA and RAM, respectively. The pseudorandom data is generated by the PRBS GEN, and the Tx data is generated by the NSYM GEN. For the DMT processing, the Tx data are demultiplexed to the subcarrier signals. The data of each subcarrier are converted to the modulated signals by IFFTDATA GEN. The modulated signals are then converted to time-domain signals by an inverted fast Fourier transformation (IFFT). After the cyclic prefix (CP) is added, the subcarrier signals are multiplexed and output as a DMT signal through the SPI-IF. Then, the modulated signal is converted to an analog signal by a 4-ch DAC. The received DMT signals from the 4-ch ADC are stored in the RX RAM and demultiplexed to the subcarrier signals, with the cyclic prefix data being removed afterwards. The time-domain signals are converted to frequency-domain signals by FFT and demodulated to the data of each subcarrier. The subcarrier data are multiplexed as Rx data and are compared to the Tx data by the SNR_BER CALCULATION block. Thus, the modulation and demodulation of DMT transmission of each wavelength is done sequentially by using FPGA. Transmission characteristics of demonstrator were already verified by back-to-back and 40 km transmission configuration. We have already achieved the DMT transmission using FPGA of data rate >112 Gb/s with BER <3e-3 for back-to-back and data rate >100 Gb/s with BER <3e-3 for 40km transmission for all four channels shown in Table 2 of deliverable D2.2 [D2.2]. However, transmission results using FPGA are different from those of Matlab due to the difference of logarithmic arithmetic. Based on the previous work, we improve the processing of the FPGA and adopt the optimization of High-Level Synthesis (HLS), which read a C or C++ behavioral description and generates a register-transfer level description for FPGA.

STRAUSS Scalable and efficient orchestration of Ethernet services
using software-defined and flexible optical networks
Deliverable D2.3
Page 19 of 80
Figure 13 FPGA configuration
Table 2 Functions of the FPGA for the DMT transceiver
No. Function Control block Outline of functions1 USBIF RW CTRL (FT2232H)USB interface2 TRX CTRL The processing sequence of the entire FPGA is controlled3 REGISTER Write/ read control of register4 TXTOP PRBS GEN The pseudorandom data is generated5 NSYM GEN The number of DMT symbols is calculated, and the send data is generated6 IFFTDATA GEN Modulation index, the modulation, and Mirroring processing decided by the Waterfilling processing7 IFFT Data conversion from frequency domain to time domain8 ADD CP The attached processing of Cyclic Prefix9 MAKE INFO DATA The Padding , the averaging, and the clipping processing10 RXTOP XCORR The signal detection by correlation processing using transmission signal11 REMOVE CP The removal processing of Cyclic Prefix12 FFT Data conversion from time domain to frequency domain13 REMOVE MIRROR The release processing of Mirrorling14 SNR_BER CALCULATION The channel estimation, the correction, the SNR presumption, and BER are calculated.15 WATER FILLING Modulation index and the power allocation is calculated from the SNR estimated value16 SPIIF DAC SPI SPI interface to/ from the LEIA-DK17 ADC1 SPI SPI interface to/ from the LUKE-DK/ ADC118 ADC2 SPI SPI interface to/ from the LUKE-DK/ ADC2

STRAUSS Scalable and efficient orchestration of Ethernet services
using software-defined and flexible optical networks
Deliverable D2.3
Page 20 of 80
Table 3 Functions of the RAM in the FPGA
2.4 Difference of the processing of FPGA and Matlab
We tried to implement the DMT processing on the FPGA based on the programming code of Matlab. We achieved the FPGA implementation of data rate >112 Gb/s with BER <3e-3 for back-to-back as reported in deliverable D2.2. However, there was a difference in the Water Filling processing between FPGA and Matlab.
The sum total of modulation index of FPGA is lower than that of Matlab, and rises power assignment in the high frequency area that the power distribution becomes low SNR as shown in the Figure 15. The difference of processing is due to the use of logarithmic arithmetic. The use of logarithmic arithmetic is quite difficult in FPGA. Therefore, we adopted the processing of the comparison of anti-logarithm instead of the logarithmic arithmetic. However, the processing by the comparison of anti-logarithm of the FPGA implementation did not become equal to the logarithmic arithmetic in Matlab. Moreover, High-Level Synthesis (HLS), which read C or C++ behavioral description and generates a register-transfer level description for FPGA, was not optimized. Therefore, we tried to optimize the HLS and changed the processing by the comparison of anti-logarithm to the processing having the table of LOG2 in the FPGA.
No. Function RAM Outline of functions1 TXTOP INFOBIT RAM The data of the transmitted number of DMT symbols is stored.2 IFFT IN REAL RAM For data store input to IFFT(Real)3 IFFT IN IMAG RAM For data store input to IFFT(Image)4 IFFT OUT REAL RAM For data store output to IFFT(Real)5 BUFFER RAM RAM fot the High-Level Synthesis (HLS)6 TX RAM 128KByte RAM for transmission data7 RXTOP RX RAM 16KByte RAM for received data8 SYMBOL DUMP RAM RAM fot the High-Level Synthesis (HLS)9 INFOBIT STPT RAM RAM fot the High-Level Synthesis (HLS)10 FFT IN REAL RAM For storage of input data to FFT(Real)11 FFT OUT REAL RAM For storage of output data of FFT(Real)12 FFT OUT IMAG RAM For storage of output data of FFT(Image)13 TEMP REAL RAM Frequency domain data received when training (for real part)14 TEMP IMAG RAM Frequency domain data received when training (for imaginary part)15 TOTAL BIT RAM RAM fot the High-Level Synthesis (HLS)16 TOTAL ERR RAM RAM fot the High-Level Synthesis (HLS)17 BER RAM The BER of each subcarrier is stored18 MOD TYPE RAM Modulation index n of each subcarrier is stored19 SC POWER RAM The power of each subcarrier is stored20 SNR RAN The estimated SNR of each subcarrier is stored21 CH COEF RAM The compensation coefficient of each subcarrier is stored

STRAUSS Scalable and efficient orchestration of Ethernet services
using software-defined and flexible optical networks
Deliverable D2.3
Page 21 of 80
2.5 Comparative study of the DMT transmission results between Matlab and FPGA
We revised the FPGA-based 400Gbps DMT transceiver demonstrator by updating the internal Water Filling processing on the DMT transmission. We evaluated the transmission characteristics in the optical back-to-back scenario. We compare the transmission capacity and bit assignment for both Matlab and FPGA. The results of Matlab using a PC for the back-to-back transmission is shown in Table 4. We achieved a capacity of more than 127 Gb/s, and a bit assignment of more than 4100 bits for all 4 lanes. Table 5 shows the results of FPGA which is not optimized HLS. The capacity differences to Matlab are more than 4.6 Gb/s. Table 6 shows the results of FPGA with optimized HLS and has the calculation table of LOG2. The transmission results are improved and the capacity differences to Matlab are smaller compared to the FPGA with not optimized HLS.
Table 4 Back-to-back transmission of Matlab (logarithmic arithmetic @PC)
Table 5 Back-to-back transmission of FPGA (not optimized High-Level Synthesis)
Table 6 Back-to-back transmission of FPGA (optimized High-Level Synthesis)
Lane Capacity ( Gb/s) Bit assign
1 127.721 41192 130.419 42063 128.248 41364 127.69 4118
Lane Capacity ( Gb/s) Bit assignDifferenceto Matlab
( Gb/s)1 123. 07 3969 -4. 6512 124. 16 4004 -6. 2593 122. 54 3952 -5. 7084 122. 98 3966 -4. 71
Lane Capacity ( Gb/s) Bit assignDifferenceto Matlab
( Gb/s)1 124. 59 4018 -3. 1312 126. 76 4088 -3. 6593 125. 95 4062 -2. 2984 126. 11 4067 -1. 58

STRAUSS Scalable and efficient orchestration of Ethernet services
using software-defined and flexible optical networks
Deliverable D2.3
Page 22 of 80
Figure 14 Capacity of each lane
Figure 14 shows the comparison of the total capacity of Matlab, FPGA (not optimized HLS), and FPGA (optimized HLS). The results clearly show the effect of the optimized HLS. Moreover, we confirmed that the power distribution in the high frequency bandwidth is improved by the optimized HLS, as shown in the Figure 15. Therefore, we adopt the optimized High-Level Synthesis (HLS) for our FPGA. However, pure logarithmic arithmetic cannot be treated in general purpose FPGA. The logarithmic arithmetic in the Matlab is superior to any FPGA processing. We confirmed that the power assignment of subcarrier at high frequency bandwidth is improved after the resistor-transistor logic (RTL) correction in the FPGA implementation.
Figure 15 Power assignment of each subcarrier

STRAUSS Scalable and efficient orchestration of Ethernet services
using software-defined and flexible optical networks
Deliverable D2.3
Page 23 of 80
Figure 16 SNRs and bit allocations of Lane 1 and Lane 2.

STRAUSS Scalable and efficient orchestration of Ethernet services
using software-defined and flexible optical networks
Deliverable D2.3
Page 24 of 80
Figure 17 SNRs and bit allocations of Lane 3 and Lane 4.

STRAUSS Scalable and efficient orchestration of Ethernet services
using software-defined and flexible optical networks
Deliverable D2.3
Page 25 of 80
Figure 16 and Figure 17 show the SNRs and bit allocations of all 4-lanes. Although FPGA with optimized HLS has a better bit allocations than the FPGA with not optimized HLS, it is not superior to the bit allocations of Matlab due to the difference of logarithmic arithmetic.
3 Optical transceiver solutions for flexible OCS
3.1 OFDM-based transceiver
3.1.1 Sliceable OFDM transceiver
Within the STRAUSS project, a sliceable bandwidth variable transceiver (S-BVT) based on orthogonal frequency division multiplexing (OFDM) technology has been designed, analyzed and implemented targeting efficiency, flexibility and scalability, for coping with the needs of the future Internet. Here, we report the design of the S-BVT architecture and the optimized building block scheme, including numerical and experimental analysis of the performance.
The proposed S-BVT schematic is depicted in Figure 18. The multiple flows are generated using an array of sub-transceivers based on OFDM technology, which allows data rate / bandwidth adaptability and super-/sub-wavelength granularity. Hence, system flexibility can be achieved by loading the subcarriers with different powers and number of bits according to the optical channel (see inset of Figure 19). Additionally, the transceiver can be reconfigured, programmed and adapted for efficient utilization of the optical spectrum by a software-defined network (SDN) controller. Thus, unique granularity, flexibility and grid adaptation are enabled even in conventional fixed-grid networks [Svaluto15a], fulfilling the general operator requirements, defined in deliverable D2.1.
Cost-effective and simple transmission schemes are preferably adopted in the metro/regional segment to enable connectivity between different network nodes. For this purpose, a simplified optoelectronic front-end is considered. At the sub-transmitter, real data are generated by (digitally) upconverting the baseband OFDM signal to a radio frequency (RF). A single digital-to-analog converter (DAC) is required, with a driver and an external Mach-Zehnder modulator (MZM) per slice, driven by a tunable laser source (TLS) working in the C-band, for flexible optical carrier selection. The array of N TLS in Figure 18 can be also implemented as a single laser generating an optical frequency comb of N lines [Sambo15]. To enhance the S-BVT programmability, the optimal bias point of the MZM can be digitally programmed [Li13].

STRAUSS Scalable and efficient orchestration of Ethernet services
using software-defined and flexible optical networks
Deliverable D2.3
Page 26 of 80
Figure 18: Sliceable BVT schematic, building blocks and experimental set-up.
At the receiver side, direct detection (DD) is adopted, including a simple PIN photodetector and an analog-to-digital converter (ADC) for each S-BVT sub-transceiver.
The BVT (sub-transceiver) scheme is described in Figure 18 (bottom side). It enables the generation of one flow or slice and represents the building block of the S-BVT. Specifically, the adaptive OFDM transmitter (Tx) and receiver (Rx) digital signal processing (DSP) blocks are depicted in Figure 19.

STRAUSS Scalable and efficient orchestration of Ethernet services
using software-defined and flexible optical networks
Deliverable D2.3
Page 27 of 80
Figure 19: Adaptive Tx/Rx-DSP blocks of OFDM BVTx/Rx. In the insets, SNR channel profile with the corresponding BL per subcarrier and transmitted/received 8-QAM constellations.
At the transmitter side, a randomly generated data stream is parallelized and mapped into BPSK and M-QAM formats (being M a power of 2, ranging from 2 to 256). The Levin-Campello algorithm is used to implement the adaptive loading, which can work in either margin adaptive (MA) or rate adaptive (RA) mode, setting the targeted rate or performance, respectively [Nadal14]. After the mapping, training symbols (TS) are added in order to equalize data at the receiver side, assuming a 4% overhead. Although the fast Hartley (FHT) and the real-valued inverse fast Fourier transform (IFFT) were proposed in deliverable D2.1 as possible options to create the OFDM symbols, complex IFFT is adopted for the S-BVT design. In fact, thanks to this processing, the system flexibility and performance are enhanced by allowing finer modulation format selection in the loading algorithm implementation [Svaluto15b]. Then, a cyclic prefix (CP) is added to the signal, which is serialized and symmetrically clipped in order to mitigate the peak-to-average power ratio (PAPR). The overhead due to the CP is 1.9%. The resulting data is upconverted to a RF in order to transmit a real OFDM signal. A 2nd order digital pre-emphasis Gaussian filter is included to compensate the losses due to the limited bandwidth of the DACs. At the receiver side, downconversion, parallelization, CP removal, FFT processing, equalization and TS removal are performed. Finally, the resulting data are demapped and serialized. Flexible equalization selection is implemented according to the network requirements. In particular, zero-forcing (ZF) is commonly used in OFDM systems to retrieve the original transmitted data. However, when the inverse of the channel function does not exist, data cannot be equalized by using the well-known ZF equalizer. To overcome this problem, the minimum mean-square error linear equalization (MMSE-LE) can be adopted without increasing the system complexity [Cioffi13].

STRAUSS Scalable and efficient orchestration of Ethernet services
using software-defined and flexible optical networks
Deliverable D2.3
Page 28 of 80
Figure 20: (a) Numerical and (b) experimental B2B BER curves at 24 Gb/s.
With the increase of the optical path length between nodes, chromatic dispersion (CD) limits the OFDM transmission. Thus, single side band (SSB) modulation is implemented by using an optical filter. As shown in Figure 18, the S-BVT optical aggregator can also acts as (SSB) filter per each flow, since it is implemented with a 1:N spectrum selective switch (SSS) based on liquid crystal on silicon (LCoS) technology. In standard SSB modulation schemes, a guard interval (GI) is left between the optical carrier and the OFDM signal.
In order to further increase the tolerance against fiber impairments, low-order modulation formats (<16-QAM) are widely assigned to different subcarriers according to the implemented loading algorithm [Nadal14]. Among the candidates, 8-QAM is the one that presents many possible signal constellations with different performance, when distinct symbol distances and amplitudes are
Figure 21: ADRENALINE photonic mesh network.

STRAUSS Scalable and efficient orchestration of Ethernet services
using software-defined and flexible optical networks
Deliverable D2.3
Page 29 of 80
considered [Proakis00, Nölle14]. Hence, the selection of a suitable 8-QAM format becomes crucial in order to maximize either the system performance or the data rate [Nadal15]. Circular, star, rectangular and square 8-QAM constellations have been investigated, which are shown in the inset of Figure 19. A first system optimization is performed considering a standard SSB scheme with GI equal to the OFDM signal bandwidth of 8 GHz which was used to evaluate the performance of uniform loading with the different 8-QAM constellations. The parameters and numerical models of the used optoelectronic components were defined in deliverable D2.2. Comparing Figure 20 (a) and (b), it can be observed that the experimental back-to-back (B2B) curves are in good agreement with the obtained numerical results. In particular, the maximum optical signal-to-noise ratio (OSNR) difference for a target bit error rate (BER) of 3·10-3 is about 0.1 dB and it occurs using the rectangular 8-QAM constellation.
Figure 22: (a) Performance of circular 8-QAM for different paths. In the inset, photodetected spectrum after 85 km at 15.3 dB OSNR. (b) System performance for 85 km optical path with
different percentages of 8-QAM format at 18 dB OSNR.
Since circular 8-QAM constellation maximizes the system performance in the B2B case, we have experimentally assessed its performance over different paths of the 4-nodes ADRENALINE network, which is considered to represent a metro network (see Figure 21) [Muñoz14]. Single and 2 hop paths of 50 km, 85 km and 185 km have been analyzed, as indicated in Figure 22. After single hop 50 km path, 24 Gb/s are transmitted with the same OSNR than in the optical B2B case, according to Figure 22 (a). A higher OSNR value of 13.5 dB is needed to ensure the target BER after the 85 km path with 2 hops passing through ROADM-2 (see Figure 21). In this case, particularly high-frequency subcarriers are attenuated due to the transmission over the network. This can be seen in the inset of Figure 22 (a), where the photodetected spectrum is depicted. Finally, the performance is assessed over the 2 hop path of 185 km (OXC-2/OXC-1/ROADM-1) achieving 3·10-3 BER with 17.7 dB OSNR.
(a) (b)

STRAUSS Scalable and efficient orchestration of Ethernet services
using software-defined and flexible optical networks
Deliverable D2.3
Page 30 of 80
Then, we have investigated which is the optimal format selection that maximizes the system performance using the bit/power loading for an intermediate path of 85 km with 2 hops. Different percentages of 8-QAM format are assigned to the subcarriers, according to the bit/power loading algorithm. This allows achieving different data rates and performances over the 85 km path with 2 hops. Specifically, the constellation selection becomes crucial for maximizing the system performance, when more than 10% of the subcarriers are mapped into 8-QAM format, as seen in Figure 22 (b). Circular 8-QAM outperforms rectangular and square constellations from 10% of the mapped subcarriers and star 8-QAM from 45%. The proposed programmable S-BVT can select any modulation format per subcarrier and the suitable 8-ary constellation according to the target data rate/performance and complexity requirements [Nadal15].
Figure 23: (a) Transmitted B2B spectrum captured with a high resolution OSA and (b) received B2B spectra with and without pre-emphasis captured with a DPO.
The proposed S-BVT building block is further optimized for enhancing the performance in terms of data rate and spectral efficiency. A high-speed DAC working at 64 GS/s is used; it has 13 GHz bandwidth and its profile is compensated at the S-BVTx DSP by the pre-emphasis block. Additionally, a no-guard interval (No-GI) signal is created at the OFDM BVTx, as it presents enhanced system performance compared to standard SSB schemes [Svaluto15b]. According to the selected SSB transmission scheme, the MZM bias point is preselected in order to maximize the performance. Specifically, the optimal MZM bias for the No-GI scheme is the quadrature point (intensity modulation), whereas for the GI SSB scheme is close by the null point (linear field modulation). At the receiver side, a 20 GHz PIN photodiode and a real-time oscilloscope (DPO) working at 100 GS/s is used.
A No-GI SSB OFDM signal of 20GHz optical bandwidth occupancy is considered, whose B2B spectrum, measured with a high resolution optical spectrum analyzer (OSA), is depicted in Figure 23 (a). The received B2B spectra with and without pre-emphasis filtering captured with a DPO can be
193.37 193.38 193.39 193.4 193.41 193.42-100
-80
-60
-40
-20
0
20
Frequency (THz)
Pow
er (
dBm
)
Tx Spectrum (b) (a)

STRAUSS Scalable and efficient orchestration of Ethernet services
using software-defined and flexible optical networks
Deliverable D2.3
Page 31 of 80
seen in Figure 23 (b). The system performance of GI and No-GI SSB OFDM schemes has been analyzed in a B2B configuration and after 150km of SSMF in [Svaluto15b]. A maximum data rate of 64 Gb/s is achieved considering a No-GI scheme with 20GHz optical bandwidth occupancy in the B2B configuration, as seen in Figure 24 (a). In contrast, the data rate decreases to 46 Gb/s when the GI scheme is used with the same spectral occupancy. Over the 150 km path, similar data rates are obtained using both implementations; however, No-GI requires lower OSNR.
Figure 24: (a) Achieved data rate for GI and No-GI SSB OFDM schemes. (b) Simulation results summarizing table. (c) Achieved data rate for different SSB filter bandwidths.
As a next step, the suitable SSB filter bandwidth is analyzed in order to maximize the system performance. A numerical analysis of the achieved data rate at the varying of the filter bandwidth has been performed for a fixed OSNR and a filter center frequency of 10 GHz. Circular constellation and MMSE-LE equalization are selected to implement the 8-QAM format, according to our previous results. Whereas, rectangular constellations are considered for the rest of implemented M-QAM formats [Proakis00]. A BER of 3·10-3 has been set as a target and different fiber lengths up to 300 km have been evaluated, emulating different paths of the network. According to Figure 24 (c), data rates of 75.5 Gb/s and 76.4 Gb/s can be successfully transmitted in the B2B configuration using 30 GHz and 35 GHz optical filters, respectively. In this case, the optimal signal filtering results in a vestigial sideband (VSB). In fact, in B2B the power fading effect due to path impairments is not critical and a greater bandwidth allows transmitting higher bit rate. In presence of CD, as shown in (c) for paths ranging between 85 km and 300 km, the data rate is maximized when the SSB filter bandwidth ranges between 25 GHz and 30 GHz and the filter central frequency is selected to implement SSB.
The proposed optimized (S)-BVT sub-transceiver has been experimentally validated for a target BER of 3·10-3. SSB filter bandwidths of 25 GHz and 30 GHz are used, according to the obtained numerical results, trading spectral efficiency and system performance. The filter center frequency is varied for each configuration in order to transmit a SSB OFDM signal. In the B2B scenario, a maximum data rate of 60 Gb/s is achieved considering the two filter bandwidths, with less than 1 dB penalty of OSNR in case of using the 25 GHz filter. Then, a 2-hop optical path of 185 km is experimentally assessed in the ADRENALINE testbed, for the targeted application in metro scenario.
0
10
20
30
40
50
60
70
GI 20GHz No‐GI 20GHz
Data Rate (Gb/s)
SSB scheme
B2B
150km
SSB Scheme
PathBER OSNR
[∙10‐3] [dB]
GI 20GHz B2B 2.7 33.4
GI 20GHz 150km 2 30.7
No‐GI 20GHz
B2B 2 30.6
No‐GI 20GHz
150km 2.5 21.4
(c) (b) (a)

STRAUSS Scalable and efficient orchestration of Ethernet services
using software-defined and flexible optical networks
Deliverable D2.3
Page 32 of 80
Figure 25: Achieved data rate vs OSNR considering 25 GHz and 30 GHz SSB filters (a) in the B2B and (b) after 185 km optical path.
Higher data rate is achieved when the broader filter is used at the expense of the spectral efficiency. Specifically, 34 Gb/s is transmitted over the 185 km optical path with the 30 GHz filter, whereas with the 25 GHz SSB filter the data rate decreases to 32.3 Gb/s, as shown in Figure 25. Thus, a trade-off is evidenced: when using the narrower filter, a 12.5% spectral efficiency increase is obtained against a 5% data rate loss, compared to the case of using the 30 GHz bandwidth filter.
Furthermore, the programmable S-BVT intrinsically provides self-performance monitoring in the electrical domain at the edge-node of the network. In fact, as its building block is based on OFDM, a set of system parameters required for channel estimation/equalization are acquired thanks to the overhead of information transmitted for a correct detection [Shieh10]. Additionally, in-band OSNR monitoring of individual subcarriers can be performed in the optical domain by using a high-resolution OSA, which can be placed anywhere along the network, as shown in Figure 26. Therefore, non-intrusive signal quality monitoring per subcarrier is enabled at the nodes of the network. It has been demonstrated that the measurements in the optical domain are correlated with the electrical SNR and the BER estimated at the OFDM-based receiver of the edge-node [Fabrega15]. According to the acquired live monitoring information, the control layer can dynamically reconfigure the S-BVT parameters to compensate the signal degradation at specific subcarriers, activating the resiliency mechanism without the need for optical-to-electrical conversion and data demodulation.
(b) (a)

STRAUSS Scalable and efficient orchestration of Ethernet services
using software-defined and flexible optical networks
Deliverable D2.3
Page 33 of 80
Figure 26: Network scenario with S-BVTx/Rx and high resolution OSA for optical performance monitoring. In the inset, the transmitted spectrum with uniform and bit/power
loading measured with the high resolution OSA.
Particularly, in the example reported in Figure 26, the high resolution OSA is employed for optical performance monitoring of the individual subcarriers, i.e. it estimates the SNR per subcarrier. This information is then fed to the S-BVTx/Rx in order to appropriately adapt the modulation format per subcarrier according to the measured OSNR profile. Precisely, the inset of Figure 26 shows the subcarrier loading with uniform and adaptive bit assignment after a 150km path of the ADRENALINE testbed. In case of adaptive BL, it can be observed from Figure 26 that some subcarriers, in the neighborhood of the optical carrier, have been set to zero for achieving a successful transmission.
3.1.2 Real time OFDM transmitter
First we describe briefly the OFDM transmitter and receiver model which have been used to evaluate the DSP algorithms of the real-time OFDM transmitter.
The OFDM transmitter simulation model is using straight-forward implementation of the required DSP blocks (Figure 27). A random data source generates the binary data for each subcarrier. Depending on the bit loading the mapper modulates each subcarrier with the respective N-QAM format. Here N can be in the range 2…8. After applying the IFFT, and transforming the time domain, the cyclic prefix is added. In order to synchronize the data frames a modified CAZAC sequence is inserted afterwards. If required, an up- or re-sampling can be applied.

STRAUSS Scalable and efficient orchestration of Ethernet services
using software-defined and flexible optical networks
Deliverable D2.3
Page 34 of 80
Figure 27: OFDM transmitter simulation model
The channel and receiver simulation models consist of the blocks shown in Figure 28. The channel module can resample the incoming signal if required. Afterwards I/Q imbalance and noise of different strengths can be inserted into the signal.
Figure 28: Simulation model of channel and OFDM receiver
The actual OFDM receiver begins with a frame synchronization block, which finds the frame start very reliably. Afterwards a combined I/Q imbalance and channel estimation block find the respective parameter. Now the overhead symbols for training and synchronization can be removed. After transforming back to frequency domain a signal for each subcarrier is generated. I/Q and channel correction use the previously estimated parameters in order to correct each subcarrier individually. After decision the signals are evaluated and the performance parameters like EVM or BER are estimated.
The received symbol of an OFDM signal with N subcarrier distorted by I/Q imbalance can be described in general by means the following formula:
(3.1)
Datasource
MapperN‐QAM
IFFTInsertTS
CPInsertSync
Up‐sampling*
*if required1024 1024
OFDM Rx
channel
Re‐sampling*
*if required
I/QDistortion(Tx&Rx)
insertNoise(SNR)
FrameSYNC
I/Q & channel
Estimation
RemoveTS,SYNC
RemoveCP
IFFTI/Q
correctiondecision
EvaluationEVM, BER

STRAUSS Scalable and efficient orchestration of Ethernet services
using software-defined and flexible optical networks
Deliverable D2.3
Page 35 of 80
The transmitted symbols ck and received symbols rk are linked via the complex valued parameters
and . The subscript –k denotes the so called mirror subcarrier of k, which is calculated using the relation -k= 1+(1-k) mod N.
Figure 29: Effect of I/Q imbalance for OFDM system
The effect of I/Q imbalance is illustrated in Figure 29. Subcarrier 2 is being modulated using 8-QAM while its mirror carrier 1024 is using a QPSK modulation format. It can be seen, that for the graphic on left (subcarrier #2) all eight constellation points of the 8-QAM modulation are not single points anymore but each is split into four points because of the crosstalk from the mirror channel. On the right side one can see the crosstalk of subcarrier 2 which distorts the constellations of subcarrier 1024.
A derivation for and can be found in [Tubbax03], where describes the amplitude imbalance and
the phase imbalance:
(3.2)
A more detailed formula for and including additionally the phase rotation and the amplitude
scaling of the received symbol has been used in the offline OFDM receiver and is given by:

STRAUSS Scalable and efficient orchestration of Ethernet services
using software-defined and flexible optical networks
Deliverable D2.3
Page 36 of 80
(3.3)
In order to estimate and correct the I/Q imbalance the received signal r is expressed by the following equation
r = Xc
(3.4)
When using special training symbols ck and the respective received trainings symbols and can be calculated for each subcarrier. In order to improve the accuracy of the estimation multiple training symbols can be used together with averaging. The actual number can be set by the worst channel conditions the system must support. An alternative approach is to change the number of training symbols adaptively.
If a good estimation for and exist the transmitted information (symbols ck) can be recovered by inverting the matrix X and multiplying with the received information.
(3.5)
An OFDM link with the parameters shown in Table 7 has been simulated in order to evaluate especially the DSP blocks for I/Q imbalance estimation and correction.

STRAUSS Scalable and efficient orchestration of Ethernet services
using software-defined and flexible optical networks
Deliverable D2.3
Page 37 of 80
Table 7: Simulation parameters
Parameter Value Unit
#subcarrier (FFT size) 1024
I/Q phase imbalance [Tx, Rx] /7,-/6
I/Q amplitude imbalance [Tx, Rx] 0.1, 0.1
SNR 24 dB
Number of training symbols /frame (I/Q and channel estimation)
20
Number of symbols for synchronisation 4
Cyclic prefix 16
Number of data symbols / frame 840
Overhead (w/o FEC) ~3.0 %
In Figure 30 the estimated I/Q parameters are plotted. The reference for each parameter is shown as bold line in the background. One can see that due to noise channel (SNR = 24 dB) the estimation

STRAUSS Scalable and efficient orchestration of Ethernet services
using software-defined and flexible optical networks
Deliverable D2.3
Page 38 of 80
fluctuates around the reference for each subcarrier. For the DC carrier (center) the estimation is not correct. This can be attributed to the overall bad performance of that subcarrier.
Figure 30: Estimated I/Q imbalance parameters
For each subcarrier the performance is evaluated. In Figure 31 the constellation is shown for a selected number of subcarriers. One can see the I/Q imbalance is completely corrected, all constellation diagrams are in the correct shape, only the impact of the noise is visible.

STRAUSS Scalable and efficient orchestration of Ethernet services
using software-defined and flexible optical networks
Deliverable D2.3
Page 39 of 80
Figure 31: OFDM constellation plot for selected subcarriers
In Figure 32 the performance parameters (EVM, BER, Errors) for each subcarrier are plotted. Since an SNR of 24 dB has been used only the subcarriers show a few errors. It can be seen all interference due to I/Q imbalance was corrected.

STRAUSS Scalable and efficient orchestration of Ethernet services
using software-defined and flexible optical networks
Deliverable D2.3
Page 40 of 80
Figure 32: OFDM results (EVM, BER, Errors and bit loading per subcarrier)
In a next step the performance of the real-time OFDM transmitter was evaluated. As a reference the performance in back-to-back mode was evaluated.
Figure 33: Configuration for back-to-back evaluation
After an initial measurement (not shown here) the maximum bit loading (Figure 34) for this configuration was set in the FPGA. The subcarrier left and right from DC could be set to a 16-QAM modulation format, only for subcarriers with the highest frequencies the modulation format was set to QPSK. With this bit loading the (gross) data rate is 41.4 Gbit/s.
OFDMReal‐time Tx
LP
LP
6 GHz12 GSa/s
DSOOFDMOfflineRx
40GSa/s

STRAUSS Scalable and efficient orchestration of Ethernet services
using software-defined and flexible optical networks
Deliverable D2.3
Page 41 of 80
Figure 34: Bit loading per subcarrier
The Offline OFDM-Rx has been used to process the data captured by an oscilloscope using 2 channels and running at 40GSa/s. The constellation plot for different subcarrier groups is shown in Figure 35. One can see the subcarriers with 16-QAM overlap already, so that a transmission with errors is expected.
Figure 35: Constellation plot for different subcarrier groups
This is shown in Figure 36 in the lowest subplot. In this configuration a mean BER of 9.9e-4 has been reached. Considering a standard FEC these errors can be corrected. In the top subplot the low pass characteristic of the channel can be seen, mainly caused by the DAC.

STRAUSS Scalable and efficient orchestration of Ethernet services
using software-defined and flexible optical networks
Deliverable D2.3
Page 42 of 80
Figure 36: Performance for each subcarrier in back-to-back configuration
The subplot in the middle shows the estimated SNR values calculated from the EVM values of each subcarrier.
In order to characterize the performance of the OFDM-Tx further the setup as depicted in Figure 37 has been used. The output signal of the real-time OFDM transmitter is LP filtered to avoid an alias frequency in the data. After up-mixing the I and Q component by means of an I/Q modulator the resulting signal is amplified and used to imprint the information on an optical carrier using an MZM. The optical signal is generated by means of a DFB laser at 1550 nm. To compensate for losses of the modulator an EDFA is used amplify the optical signal. To avoid any distortions caused by dispersion an optical bandpass is used to generate an optical SSB signal. A 10 dB monitor tap is used to control the optical output power of the optical transmitter.
rel.
Po
wer
[d
B]
SN
R [
dB
]B
ER

STRAUSS Scalable and efficient orchestration of Ethernet services
using software-defined and flexible optical networks
Deliverable D2.3
Page 43 of 80
Figure 37: Experimental Setup for optical transmission
A 40km fiber link in a loopback configuration has been used to characterize the performance of an optical transmission. At the receiver a 30 GHz PIN receiver with integrated TIA has been used. The received electrical signal was captured by an oscilloscope using 1 channel and a sample rate of 80 GSa/s. The received OFDM spectrum with a spectral width of 12 GHz around the LO frequency of 23 GHz is depicted in Figure 38.
Figure 38: Received OFDM spectrum (fLO=23GHz, fS=12GSa/s)
After an initial test the bit loading has been set for the 40km transmission. The resulting modulation format for each subcarrier is shown in Figure 39. With this setup a gross data rate of 12.3 Gbit/s was reached.
fLO
I/QMixer
OFDMReal‐time Tx
LP
LP
6 GHz12 GSa/s
23 GHz18 dBm
MZMDFB
1550 nm
OBPEDFA
10 dBMonitor
OPM
Link40km
PIN+TIA
OFDMOfflineRx
Rel
. po
wer
(d
B)

STRAUSS Scalable and efficient orchestration of Ethernet services
using software-defined and flexible optical networks
Deliverable D2.3
Page 44 of 80
Figure 39: Bit loading for 40km transmission
In Figure 40 the results of the transmission are shown. In the 1st subfigure the channel response as acquired from the channel estimation is depicted. The 2nd subfigure shows the estimated SNR. Here values in the range of 10 dB are shown.
Figure 40: Performance for each subcarrier of 40km transmission setup
The resulting BER is in the order of 5∙10-3, which would require a sophisticated FEC to become error free.
rel.
Po
wer
[d
B]
SN
R [
dB
]B
ER

STRAUSS Scalable and efficient orchestration of Ethernet services
using software-defined and flexible optical networks
Deliverable D2.3
Page 45 of 80
3.2 High-baud rate multi-format transceiver
In STRAUSS project, the OCS-based core network serves as the intermediate network to connect OPS domain, Metro or other domains for end-to-end connection. As raised in D2.1, transceivers in OCS should be capable of providing huge link capacity for future Ethernet services. Currently, 100G Ethernet standardization work has completed and research efforts are moving to the 400G Ethernet [McDonough07]. The new Ethernet standards provide improved link capacity for the emerging bandwidth-hungry applications. On the other side, the higher capacity requests in Metro and other domains will lead to huge bandwidth requests in OCS with further aggregation. The second requirement for the transceiver in OCS is the modulation-format adaptability, which provides a method to optimize network transmission performance [Bosco11]. For a given optical link, the transceivers can decide its modulation format, which is related to the link capacity, to trade off the link capacity and transmission reach. The forth requirement for transceiver in OCS is the superchannel assembling. Due to the future huge capacity request, such as Tbit class Ethernet, it’s impossible to provide enough bandwidth with one single channel. Therefore, multiple channels should be assembled to a superchannel signal. The high baud-rate transceiver provides high capacity per channel and a few number of channels can provide enough bandwidth.
By investing several transceiver solutions in D2.2, we chose high baud-rate multi-format transceiver as the potential solution for covering the core segment in OCS network. The proposed high baud-rate transmitter needs a low number of channels to provide high optical capacity in core networks, contributing to cost reduction. In addition, the DAC free transmitter also helps to reduce the link cost. Figure 41 show our proposed superchannel signal generation to satisfy the requirements raised in D2.1.

STRAUSS Scalable and efficient orchestration of Ethernet services
using software-defined and flexible optical networks
Deliverable D2.3
Page 46 of 80
Figure 41 Proposed superchannel signal generation with multi-format transmitters
The multi-format transmitter, which are connected to the OPS domain with developed OPS/OCS interface, provides further aggregation to achieve a total bit rate of 320Gbit/s/channel with 40Gbaud PM-16QAM signals. To enable fine capacity granularity, several low baudrate PM-QPSK transmitters and OOK transmitters are also connected to the FPGA-based OPS/OCS (detailed in Sec. 5.2). In our design, the interface uses 10 Gbaud QPSK signal (40 Gbit/s in 20 GHz), 40 Gbaud QPSK signal (160 Gbit/s in 100 GHz) and 40 Gbaud 16QAM signal (320 Gbit/s in 100 GHz) for bandwidth provision. The internal switch-over functions are developed inside of FPGA to configure the used transmitters and change the provided bandwidth. All the transmitters from the OPS/OCS interface are connected to a multiple input and multiple output SSS. In addition, transmitters from other OPS/OCS interface are also connected to the SSS. Here the SSS have two functions: (a) choose the modulation format in multi-format transmitters; (b) assemble several optical carriers together to a superchannel signals. Figure 42 shows the experimental setup of QPSK/16QAM multi-format transmitter. The SSS in the setup configures the modulation format by choosing the corresponding optical ports. The transmitter only uses several port of the SSS. Thus, the SSS are reused for superchannel signal assembling. In our setup, a 20×4 SSS is used to achieve both modulation format configuration and superchannel signal aggregation. In addition, the multiple output ports can send different signals to different ports. Such feature can be used to routing signal to different destinations. With the OpenFlow controller in SSS and OPS/OCS interface, the superchannel signal generator can be controlled by the SDN control layer.

STRAUSS Scalable and efficient orchestration of Ethernet services
using software-defined and flexible optical networks
Deliverable D2.3
Page 47 of 80
Figure 42 Experimental setup of QPSK/16QAM multi-format transmitter
With the combination of carrier number and modulation formats, the software defined sliceable SC transponder can provide a wide range of bandwidths. Table 8 comparing the Ethernet solutions provided with elastic optical spectrum allocation or with fixed-grid DWDM spectrum allocation. We assume only 25 Gbaud PM-QPSK signals are used in fixed-grid DWDM with 50 GHz channel spacing. As the Ethernet traffic capacity increases, the software defined sliceable SC transponder with elastic optical spectrum allocation can provide more options, to provide either bandwidth efficiency configuration or high connectivity configuration.
Table 8 BANDWIDTH PROVISIONS FOR VARIABLE ETHERNET TRAFFIC CAPACITIES
Ethernet Traffic Capacity
Elastic Optical Spectrum Allocation a
10Gbaud QPSK(20GHz), 40Gbaud QPSK/16QAM(100GHz)
Fixed-Grid DWDM 25Gbaud QPSK (50GHz)
Bandwidth Efficiency Improvement b
10Gbit/s 1 ch 10Gbaud QPSK (20GHz) 1 ch 25Gbaud QPSK (50GHz)
150%
40Gbit/s 1 ch. 10Gbaud QPSK (20GHz) 1 ch. 25Gbaud QPSK (50GHz)
150%
400Gbit/s
2 ch. 40Gbaud QPSK 2 ch. 10Gbaud QPSK (240GHz)
4 ch. 25Gbaud QPSK (200GHz)
- 16.7%
1 ch. 40Gbaud 16QAM 2 ch. 10Gbaud QPSK (140GHz)
42.9%
1 ch. 40Gbaud QPSK 6 ch. 10Gbaud QPSK (220GHz)
-9%
1Tbit/s
3 ch. 40Gbaud 16QAM 1 ch. 10Gbaud QPSK (320GHz)
10 ch. 25Gbaud QPSK (500GHz)
56.3%
2 ch. 40Gbaud 16QAM 2 ch. 40Gbaud QPSK 1 ch. 10Gbaud (420GHz)
19%
6 ch. 40Gbaud QPSK 1 ch. 10Gbaud (620GHz)
-19.4%
1.6Tbit/s
5 ch. 40Gbaud 16QAM (500GHz)
16 ch. 25Gbaud QPSK (800GHz)
60%
4 ch. 40Gbaud 16QAM 2 ch. 40Gbaud QPSK (600GHz)
33.3%
4 ch. 40Gbaud 16QAM 1 ch. 40Gbaud QPSK 4 ch. 10Gbaud QPSK (580GHz)
37.9%

STRAUSS Scalable and efficient orchestration of Ethernet services
using software-defined and flexible optical networks
Deliverable D2.3
Page 48 of 80
a The solution based on elastic optical network provides more options than that list here. b The bandwidth efficiency improvement is defined as the improvement between bandwidth efficiency with elastic optical spectrum allocation and that with fixed-grid DWDM. The minus symbol means the bandwidth efficiency decrease.
Figure 43 show all the possible link capacities which our experimental configuration can provide. The software defined sliceable SC transponder can provide link capacity from 40 Gbit/s to 2.88 Tbit/s with a granularity about 40Gbit/s.
Figure 43 Available capacities provide by the Ethernet to software defined sliceable SC transponder.
Figure 44 shows the spectrum of the generated 8-subcarrier SC signals with 16QAM modulation in ch3, 5, 7, and QPSK modulation in other subcarriers (labelled as SC1). For all the subcarrier, almost error-free back-to-back transmission is achieved. The recovered constellation diagrams are shown as insets in Figure 44. By adopting different modulation formats and different quantity of subcarriers, we obtained SC signals with capacities from 160 Gbit/s up to 2.56 Tbit/s. The experimental demonstration confirms that the proposed superchannel transponder can provide a huge optical bandwidth with a fine bandwidth tunable granularity. The feature of modulation format adaptability makes the superchannel transmitter can optimize the transmission performance for different transmission reach.

STRAUSS Scalable and efficient orchestration of Ethernet services
using software-defined and flexible optical networks
Deliverable D2.3
Page 49 of 80
Figure 44 Optical spectrum of the two SC signals: SC1: reconfigurable SC signals (ch3, 5, 7: 16QAM; other: QPSK) in 100GHz Grid; SC2: SC signals with QPSK in 20GHz grid.
4 Variable capacity OPS based on sliceable transceivers
4.1 Fixed-length variable-capacity OPS for photonic layer-2
In order to save energy, CAPEX and OPEX, a novel network architecture is needed to overcome the limitations of the current router-based networks. There has been a transition or departure from legacy IP over DWDM to simplified layer-2 switching. Layer-2 switches such as Ethernet switches are in widespread use in metro-access networks. Beyond 100 Gb/s, however, the electrical switch cannot be as efficient as the optical counterpart due to large forwarding delay and poor power efficiency. An attractive solution will be photonic layer-2 (P-L2) networking based on the optical packet switching technology.
The key concept of the P-L2 is to simplify the Ethernet bridging or switching functions as much as possible, by exploiting the inherent nature of photonics and optics such as its high speed, abundant bandwidth, and all-optical processing capability. The intention is to create a new photonic-native data transport protocol, not necessarily emulating the conventional Ethernet protocol, while retaining the interface with the existing protocols at the edges.
One major obstruct to realize P-L2 based on the OPS technology is the lack of readily available optical RAM buffer. At present, fiber delay line (FDL) buffer seems to be a practical solution despite its inflexible buffering capacity. A fixed-length (fixed time slotted) optical packet would be preferable in FDL because of simple scheduling algorithm. Meanwhile the incoming Ethernet frames have variable-length, e.g., 64 to 1518 bytes (or 9600 bytes). In STRAUSS project, by exploiting the bandwidth flexibility of the sliceable transponders developed in WP2, we investigate an efficient

STRAUSS Scalable and efficient orchestration of Ethernet services
using software-defined and flexible optical networks
Deliverable D2.3
Page 50 of 80
design of fixed-length variable-capacity (FL-VC) optical payload packet towards real-life P-L2 based on the OPS technology. Figure 45 shows the basic concept of the FL-VC OPS, where the incoming variable-length data sequences are packed into a fixed-length optical payload by adaptive modulation techniques.
Figure 45 a) Principle of FL-VC OFDM payload packet generation and b) its impact in OPS network with FDL buffers [Yoshida13]
Our investigation on the FL-VC OPS can be divided into two parts; 1) optimization of the adaptive modulation algorithm for FL-VC OPS, and 2) analysis of the network performance using the FL-VC concept. As for 1), two different approaches have been proposed and demonstrated so far, i.e., the cross-talk (XT) tolerant approach [D2.2, Noguchi15a] and the distance adaptive approach [Yoshida14]. In the XT tolerant approach, each optical packet is modulated individually so as to minimize the ill-effect of the inband-XT between the packets caused by the limited extinction ration of high-speed optical switches. In the preliminary demonstration by using a 2x2 PLZT switch, the XT tolerant 10Gbaud OFDM packets achieved a 33% capacity improvement in the presence of 13dB XT compared with the conventional optical packet with a fixed modulation format. Meanwhile, the distance-adaptive approach is, particularly, attractive for the direct-detection OFDM (or DMT) payload packet, whose capacity is generally limited by fiber’s chromatic dispersion. By properly allocating the information bits to the subcarriers in the frequency domain to avoid the channel fading resulting from the dispersion, the payload capacity of each OFDM/DMT packet is maximized depending on the distance between its source and destination nodes. In [D2.2, Yoshida14], we have evaluated the achievable capacity versus link distance of the optical DMT packet by using a 2x2 PLZT
optical switch and the Fujitsu’s 100G DMT transponder prototype and confirmed > 100 Gbits/s/ for
< 2 km links and ~40 Gbit/s/ even after 40 km transmission. On the other hand, the impact of the adaptation on the entire network performance is not so obvious. Since, the payload capacities vary from transmission-distance to distance, the performance of the OPS network based on the distance-adaptive FL-VC concept may largely depend on the geographic distribution of traffic. Moreover, the choice for the packet length may also impact on the performance. In [Losada15a, b], 2) the application throughput and the latency of the distance-adaptive approach were analyzed based on the experimental results in [Yoshida14] and some practical DC workloads.

STRAUSS Scalable and efficient orchestration of Ethernet services
using software-defined and flexible optical networks
Deliverable D2.3
Page 51 of 80
In this document, we report our progress in the both investigations. As for 1) the adaptive modulation algorithm, the XT-tolerant approach is adapted to the mode-division multiplexed (MDM) transmissions over few-mode fibers as a key enabler for so-called 3D optical networking. Meanwhile, as for 2) performance analysis of FL-VC OPS, we updated our analysis in [Losada15a, b] by taking the recent development of the Fujitsu’s DMT transponder into account. In addition, we further analyze the latency performance of the OPS NW in comparison with electronic packet switching (EPS) NWs.
4.2 Cross-talk tolerant FL-VC packet for mode-unbundled transmissions
Optical networking technology in the temporal, spectral, and spatial domains, so-called 3D networking [Proietti15], provides a pathway towards petabit-class elastic optical networks. As a spatial resource in the 3D networks, the use of multiple spatial modes in few-mode fibers (FMF) have been intensely studied, where the modes are generally utilized in bundle, i.e., mode-division multiplexing. In fact, the modes need to be bundled to resolve the inter-mode XT via MIMO-DSP. However, from the 3D networking point of view, it is also attractive to unbundle the spatial resources to support multiple flows. A multi-mode transmission system that supports both mode-bundled and unbundled scenarios enables the fully-flexible 3D OPS NW.
So far, some modal-XT suppression techniques applicable to mode-unbundled transmission have been reported, e.g., deployment of high modal differential group delay (DGD) FMFs, input power allocation, and bidirectional transmission. Meanwhile, few works have been done on the XT suppression in the digital domain. The mode unbundled transmission can be viewed as a multi-user (MU) MIMO transmission over a XT channel. In this context, it is reasonable to apply the transmitter-side XT cancellation or suppression techniques developed for the wireless MU-MIMO systems, such as the interference alignment (IA) technique [Cadambe08], to digitally resolve the modal-XT issue. A notable advantage of such DSP-aided approach is its programmability and adaptability. Particularly it may be beneficial to mitigate some residual XT, which is difficult to completely remove in the analog-domain in a cost-efficient manner. Note that, each analog/digital anti-XT technique has its own pros and cons. The use of the high DGD FMFs may be susceptible to inherent XT such as due to fiber splicing, while the bi-directional transmission needs a smart path computation algorithm. The DSP-aided pre-XT suppression often requires the channel state information at the transmitter (CSIT). Therefore, the use of these anti-XT techniques with the appropriate combination is a key for the FMF-based 3D OPS NW.
In this report the XT-tolerant approach in FL-VC OPS proposed in [D2.2, Noguchi15a] is further adopted to the mode unbundled transmission as a digital-domain pre-XT scheme. Note that, the direct application of the sophisticated IA technique in the wireless field to the optical transmissions systems is not always practical; the IA techniques are phase sensitive in principle while the optical communication systems often suffer from the severe phase noise or frequency drift, particularly if there are multiple transponders likewise in the mode unbundled transmission scenario.

STRAUSS Scalable and efficient orchestration of Ethernet services
using software-defined and flexible optical networks
Deliverable D2.3
Page 52 of 80
Figure 46: OFDM-based mode-unbundled transmission [Noguchi15b]; there are I modes and the input stream on each mode consists of M subcarriers (or sub-bands) whose bandwidth is W. hij and Rij denote the channel response and XT level between the ith mode input and jth
mode output, respectively.
The pre-XT suppression for the mode-unbundling may be formulated as a capacity maximization problem in a MU-MIMO interference channel. In addition, to cope with the chromatic dispersion and the differential modal group delay (DGD), it is beneficial to handle the XT in the frequency domain by employing multi-carrier modulation techniques, such as OFDM. Figure 46 depicts the concept of the proposed OFDM-based mode-unbundled transmission scheme. Exploiting CSIT, the subcarriers on each mode are optimally bit- and power-loaded to minimize the impact of the XT on the entire MIMO channel capacity. Suppose that there are modes and the input stream on each mode consists of subcarriers (or sub-bands) whose bandwidth is . Here we omit the polarization channels for simplicity. The averaged power of each subcarrier is controlled between 0 and with discrete levels, i.e., the input power of the th subcarrier transmitted over the mode ∈ is represented as
⁄ ∙ , where ∈ 0, 1, 2, , . The discrete level is employed to simplify the implementation of numerical algorithms. In practice, it is useful to estimate the system capacity based on a signal-to-noise-pulse-interference ratio (SINR) model. The capacity of the th sub-band in the mode can be described as,
log 1 , (4.1)
where,
/
∑ /∈. (4.2)
In Eq. 4.2, is the noise power spectrum density, is the channel gain of the th band of the -
th mode, and is the XT level between the mode to the mode normalized by ∑ . Note
that, even though the XT is modeled as frequency-flat for simplicity, the resulting XT power per
subcarrier becomes frequency-selective due to . This implies that there is the optimal set of
which maximizes }. For this goal, one may simply maximize the sum of , i.e.,

STRAUSS Scalable and efficient orchestration of Ethernet services
using software-defined and flexible optical networks
Deliverable D2.3
Page 53 of 80
∑ ∑ , under an energy constraint. However, the maximization may be useless in practice, because the maximum is often achieved by blocking the modes with poor XT performance. Therefore, we consider to maximize the minimum capacity among the modes to resolve the capacity bottleneck due to XT;
max ∈
∑
s. t.
∈ 0,1,⋯ ,
1,2, ⋯
(4.3)
where is the upper-bound of the transmitted optical power per mode. Eq. 4.3 is a mixed integer non-linear program (MINLP) and is NP-hard in general. However, it is still possible to solve it numerically by the linearization and the branch-and-bound method such as in [Shi11]. Once the
optimal are found, the number of bits per subcarrier is decided based on Eq. 4.3 to achieve the target bit error rate (BER) performance. Note that, once the bit-/power-loading map is fixed, no MIMO-DSP at the transceiver is needed.
Figure 47 and Figure 48 show numerical results in a mode-unbundled transmission over a TMF (2). Any channel impairments other than the modal XT are neglected for simplicity. The XT levels are { , 14, 23 dB, thus the first mode (port 1) suffer from the serious XT and can be a
system bottleneck. Figure 47 a) depicts an example of the convergence of the numerical algorithm and Figure 47 b) is versus SNR. Without the pre-XT suppression, the capacity of the port 1 is restricted particularly in the high SNR region. With the suppression, the capacity bottleneck is removed and an up-to 22 % improvement is achieved. It should be mentioned that here we focus on the maximum capacity can be achieved by the proposed method, thus > 2.0 10 LPs have to be solved before the convergence. However, the lower bound (or equivalently, the achievable capacity) in Figure 47 a) quickly converges to the sub-optimal, which is very close to the global optimum, thus the required computational complexity may not be significant in practical situations. Figure 48 shows
the BER performance and the achievable throughput when the optimal power allocation is implemented based on the optical multi-carrier modulation techniques, such as OFDM. We set the number of the subcarriers 3 and employ BPSK, QPSK, 8QAM and 16QAM for the subcarrier modulation formats. As shown in Figure 48 a), without the optimization, the BER performance of the port 1 is seriously restricted due to the XT, while the both ports achieved the target BER of 10

STRAUSS Scalable and efficient orchestration of Ethernet services
using software-defined and flexible optical networks
Deliverable D2.3
Page 54 of 80
with the adaptation for any SNRs. In Figure 48 b), one can find the minimum capacity monotonically increases as SNR increases as we expected.
Figure 47: a) An example of the convergence of and the resulting versus SNR( )
Figure 48: BER performance and the achievable throughput in case with M=3
Then we demonstrate the feasibility of the proposed XT-suppression technique experimentally. Figure 49 is the experimental setup for a mode-unbundled transmission over LP01 and LP11 modes of a 30-km TMF. Two streams of 10 Gbaud electrical OFDM signals were generated via arbitrary waveform generators (AWGs) at 10 GS/s, and then electro-optic converted by optical In-phase and Quadrature (IQ) modulators with a 100-kHz-linewidth external-cavity laser at 1550.0 nm. Each OFDM signal consisted of 246 (10 null carriers around the DC carrier) subcarriers with 11.72% cyclic prefix overhead. We employed a multicore fiber-based Mode-Mux/DeMux pair which has combined path loss ~13.6 dB for LP01 and ~18.3 dB for LP11. A 30 km differential modal group delay (DGD) compensated TMF link [Maruyama14] which is designed for the mode-bundled transmission. The

STRAUSS Scalable and efficient orchestration of Ethernet services
using software-defined and flexible optical networks
Deliverable D2.3
Page 55 of 80
link was composed of a 26 km long negative DGD TMF span and a 4 km positive DGD TMF span. The loss and chromatic dispersion for both spans were about 0.2 dB/km and ~20 ps/nm/km, while the total DGD was < 0.4 ns at 1550.0 nm. The estimated XTs were ,
15.5, 10.4 dB. The TMF output was mode-demultiplexed and then combined again by a polarization beam combiner (PBC) so that the signals could be detected by a dual-polarization optical coherent receiver. Before the detection, ASE noise was loaded. The receiver was implemented based on a 40 GSa/s sampling oscilloscope and a 1-kHz-linewidth local source. Note that, although the outputs from the modes were detected simultaneously, they were demodulated individually by offline-DSP.
Figure 49: Experimental setup for mode-unbundled transmission over 30-km TMF
First, we investigated the impact of the modal XT in the OFDM transmission with a fixed modulation format. Figure 50 shows BER per mode versus OSNR where BPSK, QPSK, and 16QAM formats were employed. From the figure, one can see notable performance degradation due to the XT, particularly on the LP11 mode. For a target BER of 1.0 10 , the achievable throughput with a fixed modulation format was restricted to 10 Gb/s per mode (not including the overheads such as for CP) regardless of OSNR. This is because the LP11 mode needed to employ BPSK for any OSNR due to the XT.
Then we demonstrated the advantage of the proposed technique by sub-banding the 246 data-subcarriers into four sub-groups for simplicity. The loaded-bit and power per sub-band were optimized at ONSR = 25dB by the proposed algorithm. The CSI was estimated a priori by sending pilot sequences. Figure 50 b) depicts the results of the optimization. The sub-bands on LP01and LP11 were modulated unequally in order to maximize the throughput under the XT. From Figure 50 a), the achievable throughput for BER=1.0 10 was 19.95 Gb/s for LP01 and 17.52 Gb/s for LP11 for OSNR > 25 dB. In this proof-of-concept demonstration, the pre-XT suppression technique resolved the capacity bottleneck due to the modal XT and improved the achievable throughput >75% compared with the fixed-formatted transmissions.

STRAUSS Scalable and efficient orchestration of Ethernet services
using software-defined and flexible optical networks
Deliverable D2.3
Page 56 of 80
(a)
(b)
Figure 50: a) BER performance versus OSNR and (b) bit- and power-loading tables at OSNR=25 dB and the received constellations
4.3 Update on the performance analysis of distance-adaptive FL-VC OPS
The adaptability of bit rates with respect to path distance can be achieved in several ways. We have studied four options that offer practical implementation advantages: double side band (DSB) modulation with and without non-linear compensation (NLC), and VSB modulation with and without NLC. Each of these modulations leads to a different dependence of the packet bit rate with respect to the maximum distance achievable with that bit rate. We accordingly show in Figure 51 (a) the `bit rate`-vs-distance curves for each modulation. As the studied optical modulations allow achieving distances up to several tens of kilometers, we are interested in network configurations featuring those distances. For example, let us focus on the topology shown in Figure 51 (b): a ring network connecting 12 OPS switches and with a diameter of 80km. Rings are popular physical topologies in metropolitan area networks due to their good trade-off between costs of deployment and network performance. This ring connects 4 groups of clusters; each cluster contains three OPS switches and three gateways where data flows originate and terminate. For each flow, its source gateway is chosen at random; then, its destination gateway is also chosen at random among the gateways belonging to the farthest cluster, in other words, we focus here on the flows following the longest paths since they are subjected to the worst impairments. Each flow transports a file whose size follows a lognormal-like distribution that has been empirically measured in production networks dealing with file servers, and which are a reasonable representative of the kind of heavy-tailed distributions often found in most computer networks. This file size distribution has a mean of 180kB and two modes around 10MB and 1GB derived from the files that are most frequently

STRAUSS Scalable and efficient orchestration of Ethernet services
using software-defined and flexible optical networks
Deliverable D2.3
Page 57 of 80
transmitted across the network. Although most of its flows are small (the median is only 5kB), most bytes belong to much larger flows [Losada15a]. The maximum transmission unit (MTU) for packets is 9kB, as usual in the Jumbo Ethernet frames commonly used in high-speed network applications. Throughput per flow with reliable transmission of data is likely the most useful metric for most applications, since virtually all application logic involves getting a group of bytes from a source, or group of sources, to a destination in the least amount of time possible. Distributed applications as the ones frequently found in cloud computing scenarios define network throughput in a way adapted to their inner workings: as these involve the transmission of multiple flows around the network, network throughput for distributed applications takes into account the time elapsed since the beginning of the first transmission up to the finish of the last active transmission. Accordingly, we show in Figure 52 the network throughput, defined as the sum of the sizes of all the transmitted files divided by the time elapsed between the start of the first flow and the finish of the last one, as a function of the number of flows entering the network at the same time. In general, we can see how the increased bit rate intended by VSB-NLC effectively translates in a noticeable throughput gain for applications, and thus it is a preferred option to implement in the variable bit-rate transponders. We can appreciate in the figure the progressive increase in network throughput with the number of flows created by the application, up to a given point where it starts decreasing: this point signals the increasing saturation of network resources due to high offered loads, and progressively worse performance as the offered network load grows. VSB-NLC, as we can see, allows addressing the saturation point more effectively than its counterparts, allowing to obtain not only higher throughputs but also a more graceful degradation of performance with respect to the other modulations.
(a) (b)
Figure 51: Dependence of packet bit rate with distance for the four studied modulations, and the topology where we study them.

STRAUSS Scalable and efficient orchestration of Ethernet services
using software-defined and flexible optical networks
Deliverable D2.3
Page 58 of 80
Figure 52: Network throughput as a function of the number of flows.
Once seen that FL-VC is a promising candidate to obtain good performance from an OPS network, an interesting issue is how well OPS can compare with traditional EPS networks. This question addresses the interest in providing cost effective alternatives to current high-bit-rate EPS systems. In order to perform this comparison in a fundamental way that is not overly dependent on any specific OPS technology, we will not use FL-VC packets in OPS, instead using conventional variable-length, fixed-bit-rate technology. In this way, we will be able to provide a common footing unaffected by the presence of additional degrees of freedom in FL-VC (e.g., the choice in packet duration).
We will address this comparison by selecting as our metric of interest the per-packet end-to-end delay at zero losses. Regarding delay, it is important to notice that networks can lose packets: in OPS mainly due to lack of buffers, and in EPS due to buffer overflows or excessive delays that cause retransmissions, effectively treating packets as lost by TCP or any equivalent protocol in charge of offering a reliable service on top of the best-effort one offered by the network. Thus, we will send reliably each packet by means of TCP, take into account the number of retransmissions of each packet, and all its sources of delay (serialization delays, queuing delays, propagation delays) in order to describe how fast are OPS and EPS compared to each other.
In general, the comparison of delay must take into account the characteristics of the expected probability density functions. As there are multiple useful measures that can be computed from those

STRAUSS Scalable and efficient orchestration of Ethernet services
using software-defined and flexible optical networks
Deliverable D2.3
Page 59 of 80
functions, we will concentrate here on two of the most relevant ones: the average packet delay and the probability of exceeding a given delay (i.e., a deadline).
Many applications interested in per-packet delays have an internal logic that needs to gather information about something in order to process that information and return the results in a timely manner to some other entity. Each part of this process is usually assigned a time budget, and targets for average delays, and possibly deadlines, result in a natural way. To model these situations, we will consider a distributed application involving many nodes transmitting information to a central location in charge of processing this information. For example, this can correspond to a distributed driving system inside a city where many cars sense their environment and transmit relevant data to a centralized controller in a metropolitan area, which can then intelligently process the information to offer advice to the cars about desirable paths to reach their destinations, or to minimize expected pollution, etc. We depict this scenario in Figure 53 , where 10 switches are interconnected in a ring, and one of them is the sink of all the information generated by the other nine. Routing is shortest path and the bandwidth in all links and routes is 100Gb/s. Each switch is connected to a gateway where data enter and abandon the network. Multiple flows arrive randomly at all nodes with a random amount of data to transmit to the sink. Empirical loads are highly variable, but they usually present a heavy-tailed shape where long files are less likely to appear but are large enough to contribute a sizeable proportion of packets to the network. To take into account this characteristic, we will use two file sizes separated by one order of magnitude, 1MB and 10MB, and where the likelihood of appearance of the large one is one tenth of the small one, so each kind of file contributes the same amount of bytes to the network in average. Empirical workloads also tend to concentrate arrivals in very short time intervals as a consequence of shared events like those emanating from rush hours. Thus, we will also initiate all connections at the same time in order to simulate the presence of intense forms of congestion jointly with other phases that are more lightly loaded.
Figure 53 Topology to compare OPS with EPS.

STRAUSS Scalable and efficient orchestration of Ethernet services
using software-defined and flexible optical networks
Deliverable D2.3
Page 60 of 80
We accordingly plot in Figure 54 the average end-to-end per-packet delay at zero losses for OPS and for EPS in several scenarios: ring circumferences of 10 km and 100 km, and maximum transmission units (MTU) of 1.5kB and 9kB (standard and Jumbo Ethernet values).We can clearly see in the figures the relative performance of OPS against EPS. When the loads are small, EPS tends to achieve lower end-to-end delays than OPS due to its usage of RAM buffers in the switches that avoid losses and thus additional delays due to retransmissions: OPS suffers some losses due to its lack of buffers, so it needs to detect them and retransmit the involved packets later, leading to the worse delay that we can appreciate in the left part of the figure. However, as loads increase and more flows are offered to the network, the difference between EPS and OPS starts decreasing and it final reaches a point where OPS offers lower average delays than EPS, and the difference grows with load from that point on. This is due to the congestion control algorithms in OPS (i.e., inside TCP) being more efficient at estimating the state of network paths since, although losses are higher, end-to-end delays for the packets that are not lost are deterministic and very low, allowing congestion control logic to work very fast at overcoming losses. Congestion control in EPS, in contrast, needs to deal with extremely variable queueing delays in order to achieve a trade-off between number of sent packets and response times, and this is a difficult task in highly-loaded systems.
Figure 54 Average end-to-end per-packet delay at zero-loss in OPS and EPS.
We also plot in Figure 55 the complementary cumulative distribution function of the end-to-end per-packet delay at zero loss ---i.e., the probability of missing a hard deadline. We can observe a qualitative difference among EPS and OPS stemming from the different delay patterns found in each one: low losses with queueing delays in EPS, and high losses without queueing delays in OPS. This difference shows in generally higher values for EPS than for OPS if the deadlines are small, and in generally higher values in OPS than in EPS if deadlines are large. In other words, if deadlines for applications are very low (i.e., stringent QoS), OPS is expected to carry more packets without missing them than

STRAUSS Scalable and efficient orchestration of Ethernet services
using software-defined and flexible optical networks
Deliverable D2.3
Page 61 of 80
EPS; if the deadline becomes larger (i.e., more relaxed QoS requirements), EPS will carry a larger percentage of packets without missing it than OPS.
Figure 55 Probability of missing a deadline for the end-to-end per-packet delay at zero loss for OPS and EPS.
Thus, OPS outperforms EPS in terms of delay in highly-loaded systems or in systems with very stringent QoS requisites, while EPS outperforms OPS in low-load systems or in systems with laxer QoS requisites. As many cloud-computing scenarios prevalent in current 5G use cases tend to be geared towards the exchange of large quantities of information subject to strict deadlines, it seems that OPS is better suited than EPS to be used there.
5 Flexible optical node with OPS/OCS interface
5.1 AoD-based flexible/adaptable optical node
Architecture-on-Demand (AoD) based flexible/adaptable optical node has been proposed to handle the heterogeneous and dynamic Ethernet traffic in flexi-grid DWDM networks. The AoD-based optical node enables network function programmability in optical networks. The core device, a large-port-count fiber switch, reconfigures the cross connections between all the network functions in optical nodes, to configure or program the network functions. The network programmability in optical nodes will handle the unpredictable Ethernet traffic better, and lead to a programmable and hardware-efficient network, where the deployment of network functions happens only when it is needed.
Figure 56 presents the key design of the AoD-based optical nodes.

STRAUSS Scalable and efficient orchestration of Ethernet services
using software-defined and flexible optical networks
Deliverable D2.3
Page 62 of 80
Figure 56: Design of AoD-based flexible modular and scalable optical node
The proposed optical node comprises of four main parts. A Large-Port-count Fiber Switch (LPFS), used as an optical backplane, connected both the input and output ports of all the components and device in optical nodes. All the input and output fibers of the optical node is also connected to the LPFS. With such configuration, the LPFS can manage the interconnection between the fibers, components, device and subsystems. Thus, network functions can be deployed between the incoming fibers and output fibers by adopting the related switch matrix. The configurability of the LPFS enabled the programmability of network functions in the optical node. Several technologies, such as 3D MEMS (Micro-Electro-Mechanical System) and beam steering technology, provide optical fiber switch matrix up to 320×320. The available LPFS enable the synthesis of large scale AoD optical node with the subsystem & component inventory. The inventory as another key parts of the node design shown in Figure 56, is composed of several stand-alone subsystems to provide network functions. The subsystem inventory comprises of superchannel add/drop, fast time switching for Time Division Multiplexing (TDM), OPS/OCS interface, et al. A lot of optical common components, such as optical amplifiers (EDFAs), optical couplers, optical splitters, and SSSs, are available in the inventory to provide essential function for optical node function synthesis.
Another part of the designed optical node is the node composing algorithms. The node composing module talks to the control layer and response the network requests, including node functions, wavelength allocation, and bandwidth requirements, then synthesis optical node architecture by configure the large port count fiber switch based optical backplane. Some node composing algorithms will be deployed here to balance the payload of the optical node to use the network hardware efficiently. The optical node synthesis would reduce the total energy consumption, as the unused device can be turn down when Ethernet traffic is low. The AoD-based optical node provides an efficient way to allocate optical hardware resources.

STRAUSS Scalable and efficient orchestration of Ethernet services
using software-defined and flexible optical networks
Deliverable D2.3
Page 63 of 80
Optical monitoring block is the third part of the AoD-based optical node. As the LPFS accesses both the input and output ports of all the devices, components, and subsystems, the integrated inline power monitor at each port of the LPFS enable ubiquitous power monitoring in optical nodes. Compared with other power monitoring technologies, the LPFS-based ubiquitous inline power monitors enable the power monitoring of all the components and subsystem at same time. Such new monitoring technology provides an effective tool to characterize the connected optical components and subsystem by insertion loss and gain. In addition, optical power reflects important information about optical signals, e.g., optical power indicates spectral usage in optical links. The power monitor block provides a lot of information about the optical node. The new AoD-enabled ubiquitous power monitoring, combing with other available monitoring technologies, provide a network analytics tool both for network synthetization and network maintenance. The monitoring information will be fed back to the node composing module for network performance optimization. The monitor information can also be sent to the control layer for network optimization.
5.1.1 Experimental testbed of AoD-based optical node
To demonstrate the AoD-based flexible/adaptable optical node, a 192×192 beam steering fiber switch is used as the optical backplane switch. A set of network function subsystems have been developed including software-defined programmable superchannel transceivers, programmable ROADM, and optical amplification/equalization. All this modular subsystems and key devices are connected to the fiber switch. All this support switch operations and network functions constitutes the subsystem inventory. Thus the AoD-based optical nodes support flexible wavelength operation with SSS, time switch operation with FPGA-controlled PLZT-based fast time switches, and large-port-count fiber switch supported space-switching operation. According to the traffic requests, the AoD-based optical node can synthesize its architecture and provide the related functions by managing the interconnections. Table 9 lists all the connected optical components managed by the LPFS in our testbeds. Thus we can synthesis optical network with different network topology.
Table 9 The inventory of optical components for the experimental setup Tx Rx EDFA Fiber Link Optical Coupler/splitter SSS
Quantity 4 2 7 50km×5, 75km×1 10 4
In our experimental setup, we divided a 192×192 ports LPFS (Polatis, 6000S) to several parts to emulate several optical nodes for simplicity. Thus an optical testbed with four AoD-based optical nodes are setup to verified the node and related applications. The elastic optical network testbed is shown in Figure 57.

STRAUSS Scalable and efficient orchestration of Ethernet services
using software-defined and flexible optical networks
Deliverable D2.3
Page 64 of 80
Figure 57: Elastic optical network testbed
Due to the programmability of the AoD-based optical node, the testbed can generate different topologies for different test scenarios. Figure 58 shows the typologies of the two synthesized optical networks. At the transmitter side, the OPS/OCS interface will send the traffic from OPS domain to the OCS domain with the aforementioned superchannel generator. Then, the generated signals are sent to the network testbed and received at the destination node. For the setup optical link, the AoD-based optical node will deploy different functions at different node to serve the network traffic requests.

STRAUSS Scalable and efficient orchestration of Ethernet services
using software-defined and flexible optical networks
Deliverable D2.3
Page 65 of 80
Figure 58: Typologies of the synthesized optical networks.
5.1.2 Developed key subsystems
To support the multi-domain network operations, several key subsystems for the proposed AoD-based flexible/adaptable optical nodes are designed and implemented. These subsystems enable the optical node support flexible wavelength switching operation and fiber-to-fiber space-switching operation. In addition, optical signal-to-noise (OSNR) monitor are developed to monitoring the synthesized optical node with other optical monitoring technologies.
a) Software-defined programmable superchannel transceivers
Superchannel signals group several carriers to provide a large capacity transmission. The superchannel transmitter would satisfy the huge bandwidth requirement of the aggregated data from other network domains, e.g., the OPS network. With the FPGA-based real-time OPS/OCS integrated interface developed in Task 2.3.2, the superchannel transceivers can aggregate the Ethernet traffic from OPS network to a superchannel signal for spectral-efficient transmission. The superchannel transceiver also provides the modulation programmable feature to provide a large range bandwidth tunability. The detailed design of the superchannel transceiver is presented at section 3.2. Driving by the OPS/OCS interface (shown in sec. 5.2), the superchannel transmitter aggregates multiple Ethernet traffic from either Ethernet-based metro domain, or OPS domain, and packed into an superchannel signal with capacity support up to Tbit/s for spectrally efficient transmission in core network. The superchannel transmitter can also configure each carrier’s modulation format to optimize the transmission performance.
b) Programmable ROADM

STRAUSS Scalable and efficient orchestration of Ethernet services
using software-defined and flexible optical networks
Deliverable D2.3
Page 66 of 80
Flexible reconfigurable optical add/drop multiplexer (ROADM) is implemented based on AoD concept in our node. As shown in Figure 59, our ROADM design use the LPFS to manage the input and output ports of the ROADM configurations, which enable fiber-to-fiber direct switching possible. In addition, the WSSes in the egress port can be replaced to optical splitters, thus the ROADM architecture of ROADM can be change from “Route and Select” to “Broad and Select”. Such architecture flexibility improves the hardware utilization efficiency for different traffic characteristics.
Figure 59 Design of flexible ROADM
c) Error-vector-magnitude (EVM) based in-band OSNR monitoring
In elastic optical networks, all signals have compact spectra for spectrally efficient transmission. Thus the widely-used out-of-band OSNR monitoring technologies face a lot of challenges. In addition, the power-based in-band OSNR estimation becomes less precise with the deployment of polarization multiplexed signals. On the other side, some optical signal monitoring technologies are developed to use the computing resource in coherent receiver. Without deploy new hardware, the coherent receiver can provide a lot of information about signal [Dong2015].
In our optical node, we have implemented the receiver-side error-vector-magnitude (EVM) based OSNR monitor. The developed monitor provides in-band OSNR monitoring without deploying new hardware. Figure 60 shows the performance of the OSNR monitor for both QPSK and 16QAM transmitters. For QPSK signals, the estimated OSNR values are very close to the measured OSNR

STRAUSS Scalable and efficient orchestration of Ethernet services
using software-defined and flexible optical networks
Deliverable D2.3
Page 67 of 80
values after calibration. For 16QAM signals, the asymmetrical constellation distribution leads to extra error for the estimated OSNR values.
Figure 60 EVM-based in-band OSNR monitor performance for 28Gbaud PMQPSK and PM-16QAM
5.1.3 Demonstration of global power equalization
As in the synthesized optical nodes, signal powers are more dynamical than that in the static optical node. The optical power deviation occurs at any optical combining components, such as coupler, multiplexer, and WSS. The accumulated power deviation will increase after the signal passes through a saturated EDFA. The signal with low power will experience amplification with a large noise figure and lead to a degraded OSNR. In addition, the large power deviation should be equalized before the signal is launched to a link. The gain/power equalizer at the final stage will clip the high power and lead to waste of energy. Thus the power deviation should be avoided or minimized.

STRAUSS Scalable and efficient orchestration of Ethernet services
using software-defined and flexible optical networks
Deliverable D2.3
Page 68 of 80
Figure 61: Power equalization enabled by optical power
In the AoD-based optical node, power monitoring and the integrated optical attenuator enable global power equalization. The power monitoring system can obtain all powers of the combing operation. The node composing algorithm will take account for the occupied optical bandwidth and the power information, to provide power equalization through optical attenuators. We demonstrated the power equalization feature experimentally. Figure 61 shows three optical signals with different power combined together by a 4×1 optical coupler. The optical spectrum of the combined signal with/without power equalization are shown as inset (a) of Figure 61. The dynamic power equalization can be provided for all the combing components, and make the node synthesis more intelligent.
5.1.4 Demonstration of auto-restoration of network failure
The ubiquitous power monitoring system provides a lot of information about the healthiness of the optical node. This information can be used for predictive maintenance, and also for active maintenance, such as optical network restoration. By incorporating with the AoD configuration, the proposed AoD-based optical node enables auto-restoration when network failure occurs.
Figure 62 Work-flow for network auto-restoration
The ODA algorithm for auto-restoration is developed to diagnose optical nodes and locate the failed subsystem or component. Figure 62 shows the work-flow for network auto-restoration. The monitors monitor all the signal output. When a signal loss is detected, the ODA will first report the signal loss

STRAUSS Scalable and efficient orchestration of Ethernet services
using software-defined and flexible optical networks
Deliverable D2.3
Page 69 of 80
to the control system. Then the ODA will check the insertion loss of all the connected components in the failed traffic flow. By comparing the insert loss with the reference value, the ODA can locate the failed components in the connection. Then, the ODA will check the availability of the inventory to find optical components with similar function to replace the failed components. After the replacement, the network service can be restored. The network restoration can be achieved without human intervention, due to the programmability of the AoD-based optical node.
We demonstrated the auto-restoration feature in a four-node optical networks. The network topology is shown in Figure 58 (a). The synthesized optical networks are shown in Figure 63. The LPFS is omitted for simplicity in. A fully programmable multi-flow optical generator is connected at node A. The spectrum of the generated multichannel signal is shown in the inset (b) of Figure 63. The generated signal is launched to the fiber link. After 100km transmission, the signal passes through a WSS and send to Node C. The fiber link is 175 km between Node B and Node C. At Node C, a channel 28GBaud PM-QPSK signal is demultiplexed by an WSS. Then the signal is detected after amplification. The ODA monitor the connection from Node A to Node C. All the connection points, indicated with star symbols, are monitored and managed by the LPFS.
Figure 63 Experimental setup of network auto-restoration
Network failure occurs when the last EDFA is broken. The ODA started to work after detecting the signal loss at the receiver. Then the components characteristic algorithm rechecks the insertion loss of all the connected components. By comparing to the reference value, the ODA located the broken components. As indicated in Figure 63, the last EDFA is down. The ODA checks the optical component inventory to find another available EDFA and replaced the broken EDFA by changing the connection. After the replacement, the network failure is restored. The constellations for the 28GBaud PM-QPSK signal after transmitted over 275 km is shown in the inset (b) of Figure 63. The auto-restoration feature will improve the robustness of optical network and also decrease the network operation fee.

STRAUSS Scalable and efficient orchestration of Ethernet services
using software-defined and flexible optical networks
Deliverable D2.3
Page 70 of 80
5.2 FPGA-based real-time OPS/OCS integrated interface
The FPGA-based real-time OPS/OCS integrated interface is designed and implemented to bridge OPS and OCS domains with ultra-high performance optoelectronics platforms. According to the requirements of the system and the FPGA-based platforms constraints, the implementation architecture of the FPGA-based OPS/OCS interface is shown in Figure 64. There are 4 input ports which can receive hybrid OPS/OCS traffic, and there are 4 output ports with 2 hybrid OPS/OCS ones and 2 OCS-only ones. The traffic direction follows the direction of arrows, and the receiving functional blocks can identify whether the receiving traffic are OPS or OCS, which are then processed correspondingly with its input type. The first two OPS/OCS hybrid ports can be set as OPS or OCS output on demand, and the other two OCS ports are predefined as OCS output only.
Figure 64: FPGA-based OPS/OCS interface design architecture
For the interface with the control plane, the controller sends commands encapsulated in Ethernet frames via a 10Gbps interface. With the same interface and method, the FPGA-based OPS/OCS interface sends feedback with its status back to the controller.
Figure 65: FPGA-based interface LUT
When receiving the Ethernet frame from the controller, the FPGA-based OPS/OCS interface updates its Look Up Table (LUT) with the commands, and the FPGA-based functional blocks follow the

STRAUSS Scalable and efficient orchestration of Ethernet services
using software-defined and flexible optical networks
Deliverable D2.3
Page 71 of 80
commands in the LUT to achieve certain functions. The content of the LUT is displayed in Figure 65, which mainly has three major parts information parts. Firstly, there is OCS/OPS configuration information; the output ports transmit out OPS or OCS traffic based on the commands stored here. Secondly, there is OPS information that includes the optical packet size, the Quality of Transmission (QoT) overhead size, and the OPS label, which can get updated hitless on-the-fly. Lastly is traffic flow header matching information. The matching mechanism is shown in Figure 66. The SIC can match based on the destination MAC address, source MAC address, and VLAN ID of the Ethernet frame. The traffic flow header matching LUT stores both the header and the mask. As shown in Figure 66, the mask can be ‘1’ (which means select) or ‘0’ (which means do not care), then in the example LUT of Buffer 1:
Matching=Header AND Mask
With the 16 bits header, we can match 65536 flows in total.
Figure 66: FPGA-based OPS/OCS interface traffic flow header matching LUT
To measure the performance of FPGA-based OPS/OCS interface, we setup a FPGA-based OPS/OCS interface testbed with back-to-back connection for one FPGA only. As shown in Figure 67, the server deploys virtual machines, in which higher layer control is placed to dynamically update the programmable parameters in the FPGA over 10 Gigabit Ethernet. The traffic is generated by Anritsu MD1230B, a 10Gbps Ethernet/IP network data analyser, which is also used to analyse the bitrate and latency.

STRAUSS Scalable and efficient orchestration of Ethernet services
using software-defined and flexible optical networks
Deliverable D2.3
Page 72 of 80
Figure 67: FPGA-based OCS/OPS interface back-to-back testbed setup
With this setup, we measured the maximum bit rate of variable OPS packet length (shown in Figure 68), OPS latency based on different packet length and bit rate (shown in Figure 69), in the meantime, we also measured the OCS latency based on different Ethernet frame length and bit rate (shown in Figure 70).
Figure 68: OCS to OPS maximum bit rate when OPS packet length changes
Figure 68 measured the maximum bit rate when OPS packet length changes. In the experiment, the minimum OPS packet length for 64B Ethernet frame is 80B, for 1500B Ethernet frame is 1.5KB, and the maximum OPS packet length for both is 31.25KB. Figure 68 gives information of the maximum bit rate with increased time-slice size. The maximum bit rate we can achieve for 1500B Ethernet frame is 9.18Gbps, and 7.356Gbps for 64B Ethernet frame
0
5
10
0 100 200 300
Bit‐Rate (Gbps)
Optical Packet length (Kb)
Maximum Bit‐Rate vs Optical Packet Length
Theoretically
1500B
64B

STRAUSS Scalable and efficient orchestration of Ethernet services
using software-defined and flexible optical networks
Deliverable D2.3
Page 73 of 80
Figure 69: FPGA-based OPS/OCS interface OPS latency result
In Figure 69, the packet lengths are set as 12Kb, 128Kb and 256Kb, the keep alive message is kept at 8.7Kb. The keep alive message is used for the receiver side to recover the clock. The length of keep alive message depends on the condition of the network and QoS. Because of the use of the keep alive message, the maximum bit rate is relevant to the ratio of packet length and keep alive message. When the packet length is low, the maximum bit rate it can achieve is low, and when the packet length increases, so increases the maximum bit rate. The latency result is relevant to the packet length and the bit rate. When the packet length increases, the latency gets worse, but when bit rate increases, the latency gets better.
Figure 70: FPGA-based OPS/OCS interface OCS latency result

STRAUSS Scalable and efficient orchestration of Ethernet services
using software-defined and flexible optical networks
Deliverable D2.3
Page 74 of 80
In Figure 70, the OCS latency results are measured based on two Ethernet frame length: 64B and 1500B. The maximum bit rate with 64B Ethernet frame is 5Gbps, and for 1500B Ethernet frames is 9.47Gbps. The latency remains constant for the same size Ethernet frame length. And Ethernet frame length 1500B has higher latency result than 64B.
6 Conclusions
In this document we have reported the optimum design of the chosen technology options according to the requirements specified in D2.1. This includes optical transceiver supporting OPS, optical transceivers supporting flexi-grid OCS, FL-VC OPS, flexible optical nodes and interface between OPS and OCS. The performance of these technology enablers have been reported in view of their integration within WP4.
The transceiver design adopted for supporting OPS has been based on DMT. The FPGA-based DMT transceiver demonstrator has been revised to support 400G (4x100G) transmission. We have already achieved the DMT transmission using FPGA of data rate >112 Gb/s with BER <3e-3 for back-to-back and data rate >100 Gb/s with BER <3e-3 for 40km transmission for all four channels in deliverable D2.2. In this deliverable, the reach has been extended to more than 100km with VSB and NLC based on Volterra theory. Moreover, the DMT modulation and demodulation processing performed by the FPGA board has been improved with optimized HLS, presenting a comparative study of the DMT transmission results obtained using Matlab.
For the metro/regional segment of the OCS network, the transceiver design that has been chosen is based on OFDM technology combined with DD, enabling a cost-effective rate/distance adaptive solution with sub-wavelength granularity. To target the requirements of flexibility, scalability and adaptive spectrum allocation, a sliceable BVT architecture has been provided, and the building block scheme have been optimized to improve the transceiver performance. The evaluation of a real-time OFDM transmitter has also been provided.
A high baud-rate multi-format transceiver has been proposed as the potential solution for covering the core segment in OCS network. Its design allows providing the huge capacity request with flexible superchannel assembling up to 320Gb/s/channel. The available link capacities have been analyzed.
Regarding the investigation on the OPS technology using the FL-VC design, on one side the adaptive modulation algorithm has been optimized in order to be cross-talk tolerant in fully-flexible 3D networks. An improvement of the achievable throughput >75% compared to fixed-format transmissions has been obtained. On the other side, the network performance has been analyzed in terms of throughput and latency, demonstrating that OPS outperforms EPS in terms of delay in highly-loaded systems or in systems with very stringent QoS requisites.

STRAUSS Scalable and efficient orchestration of Ethernet services
using software-defined and flexible optical networks
Deliverable D2.3
Page 75 of 80
The key design and subsystems of the flexible/adaptable optical node based on the AoD have been provided to enable network function programmability and support multi-domain network operations. In addition, global power equalization and auto-restoration feature have been demonstrated, enabled by the power monitoring system, to improve the robustness of optical network and decrease the network operation fee.
Finally, the implementation architecture of the FPGA-based real-time OPS/OCS integrated interface has been reported. It has been designed and implemented to bridge OPS and OCS domains with ultra-high performance optoelectronics platforms, according to the requirements of the system and the FPGA-based platforms constraints. Furthermore, we have measured the maximum bit rate of variable OPS packet length, the OPS latency based on different packet length and bit rate, and the OCS latency based on different Ethernet frame length and bit rate.
7 List of acronyms
ADC Analog-to-Digital Converter
AoD Architecture-on-Demand
BGP-LS Border Gateway Protocol- Link State
BRAS Broadband Remote Access Server
BVT Bandwidth-Variable Transponders
BV-OXC Bandwidth Variable – Optical Cross-Connect
BV-ROADM
Bandwidth Variable – Reconfigurable Optical Add-Drop Multiplexer
CAPEX Capital Expenditures
CD/C Colorless Directionless Contentionless
CFO Carrier Frequency Offset
COP Control Orchestration Protocol
CRDL Common Resource Description Language
DAC Digital-to-Analog Converter

STRAUSS Scalable and efficient orchestration of Ethernet services
using software-defined and flexible optical networks
Deliverable D2.3
Page 76 of 80
DCN Data Center Network
DDoS Distributed Denial-of-Service
DMT Discrete Multi-Tone
ECL External Cavity Laser
E2E End-to-End
FDL Fiber Delay-Line
FEC Forward Error Correction
FPGA Field Programmable Gate Array
GMPLS Generalized Multiprotocol Label Switching
LPFS Large Port Count Fiber Switch
LUT Look-Up-Table
MEMS Micro-Electro-Mechanical System
IX Internet eXchange
NE Network Element
NVC
OCS
Network Virtualization Controller
Optical Circuit Switching
OF OpenFlow
OFDM Orthogonal Frequency Division Multiplexing
OFS OpenFlow switch
ONF Open Networking Foundation
ONH Optical Network Hypervisor
OOK On-Off Keying

STRAUSS Scalable and efficient orchestration of Ethernet services
using software-defined and flexible optical networks
Deliverable D2.3
Page 77 of 80
OPEX Operational Expenditures
OPS Optical Packet Switching
PAPR Peak-to-Average Power Ratio
PCE Path Computation Element
PM Polarization Multiplex
QoS Quality of Service
SC Superchannel
SC-FDM Single Carrier Frequency Division Multiplexing
SDN Software Defined Networking
SNR Signal-to-Noise Ratio
SSMF Standard Single Mode Fiber
SSS Spectrum Selective Switch
TED Traffic Engineering Database
TDM Time Division Multiplexing
VC Virtualization Composer
VOA Variable Optical Attenuator
VON Virtual Overlay Network
VP Virtualization Partitioner
WDM Wavelength Division Multiplexing
XML Extensible Markup Language

STRAUSS Scalable and efficient orchestration of Ethernet services
using software-defined and flexible optical networks
Deliverable D2.3
Page 78 of 80
8 References
All the reference material and the list of acronyms have to be listed in alphabetic order. [Bosco11] G. Bosco, P. Poggiolini, A. Carena, V. Curri, and F. Forghieri, “Analytical results
on channel capacity in uncompensated optical links with coherent detection,” Opt. Express, vol. 19, no. 26, pp. B440–B451, Dec. 2011.
[Cadambe08] V. R. Cadambe and S. A. Jafar, "Interference alignment and degrees of freedom of the K-user interference channel", IEEE Trans. Inf. Theory, 54(8), 3425–3441 (2008)
[Cioffi13] J.M. Cioffi, “Data Transmission Theory,” in Course Text for EE379A-B and EE479, Stanford, CA, USA: Stanford Univ., ch. 4, (2013) [Online]. Available: www.stanford.edu/group/cioffi/book/.
[D2.1] Requirements analysis of technology enablers for the flexi-grid optical path-packet infrastructure for Ethernet transport.
[D2.2] Investigation and assessment of the potential technologies for the flexi-grid optical path-packet Infrastructure for Ethernet Transport.
[Dong2015] Z. Dong, F. Khan, Q. Sui, K. Zhong, C. Lu, and A. Lau, “Optical Performance Monitoring: A Review of Current and Future Technologies,” Journal of Lightwave Technology, pp. 1–1, 2015.
[Fabrega15] J. M. Fabrega, P. Sevillano, M. Svaluto Moreolo, A. Villafranca, F. J. Vílchez, and J. M. Subías, “OFDM subcarrier monitoring using high resolution optical spectrum analysis,” Optics Commun., Vol. 342, pp. 144-151, May 2015.
[Li13] Y. Li, Y. Zhang, and Y. Huang, “Any bias control technique for Mach-Zehnder modulator,” IEEE Photon. Technol. Lett., vol. 25, no. 24, pp. 2412-2415, Dec. 2013.
[Losada15a] P.J. Argibay-Losada, Y. Yoshida, A. Maruta, M. Schlosser, K Kitayama, "Performance of fixed-length, variable-capacity packets in optical packet-switching networks," IEEE/OSA Journal of Optical Communications and Networking, vol. 7, no.7, pp. 609--617, 2015.
[Losada15b] P.J. Argibay-Losada, Y. Yoshida, A. Maruta, M. Schlosser, K. Kitayama, "Throughput analysis of distant-adaptive, xed-length, variable-capacity packets in OPS networks," IEEE ICC 2015, June 2015, London (UK).
[Maruyama14] R. Maruyama, et al., “Two mode optical fibers with low and flattened differential modal delay suitable for WDM-MIMO combined system,” Opt. Express, vol. 22, no. 12, pp. 14311–14321, 2014.
[McDonough07] J. McDonough, “Moving standards to 100 Gbe and beyond,” Communications Magazine, IEEE, vol. 45, no. 11, pp. 6 –9, Nov. 2007.
[Muñoz14] R. Muñoz, R. Vilalta, M. Svaluto Moreolo, J.M. Fàbrega, R. Casellas, F.J. Vílchez, R. Martínez, S. Frigerio, A. Lometti “Dynamic differential delay aware RMSA for elastic multi-path provisioning in GMPLS flexi-grid DWDM networks,” Proc. OFC, paper W3A.2, (2014).
[Nadal14] L. Nadal, M. Svaluto Moreolo, J. M. Fabrega, A. Dochhan, H. Griesser, M. Eiselt, and J. P. Elbers, “DMT modulation with adaptive loading for high bit rate transmission over directly detected optical channels,” IEEE/OSA J. Lightwave Technol., vol. 32, no. 21, pp. 3541-3551, Nov. 2014.

STRAUSS Scalable and efficient orchestration of Ethernet services
using software-defined and flexible optical networks
Deliverable D2.3
Page 79 of 80
[Nadal15] L. Nadal, J. M. Fabrega, F. J. Vilchez, M. Svaluto Moreolo,” Experimental Analysis of 8-QAM Constellations for Adaptive Optical OFDM Systems”, accepted in Photonics Technology Letters, November (2015).
[Noguchi15a] S. Noguchi, Y. Yoshida and K. Kitayama, “Cross-talk Tolerant Multicarrier Optical Packet: Concept and Demonstration,” to appear in proc. PS2015, Sept. 2015.
[Noguchi15b] S. Noguchi, N.P. Diamantopoulos, Y. Yoshida, A. Maruta, K. Kitayama, R. Maruyama, M. Shoichiro and N. Kuwaki “Mode-unbundled Transmission over a 30-km Two-mode Fiber via OFDM-based Pre-crosstalk Suppression Technique,” to appear in proc. PS2015, Sept. 2015.
[Nölle14] M. Nolle et al., “Performance Comparison of Different 8QAM Constellations for the Use in Flexible Optical Networks,” Proc. OFC, paper W3B.2, San Francisco, (2014).
[Proakis00] J.G.Proakis,”Digital Communications”, McGraw Hill,(2000)
[Proietti15] R. Proietti, L. Liu, R.P. Scott, B. Guan, C. Qin, T. Su, F. Giannone, and S.J.B. Yoo, "3D elastic optical networking in temporal, spectral, and spatial domains," IEEE Communications Magazine, Special Issue on Spatially and Spectrally Flexible Elastic Optical Networking, vol. 53, no. 2, pp. 79-87, Feb. 2015.
[Sambo15] N. Sambo, P.Castoldi, A. D'Errico; E. Riccardi, A. Pagano, M.S. Moreolo, J.M. Fabrega,.D. Rafique, A. Napoli, S. Frigerio, E.H. Salas, G. Zervas, M. Nolle, J.K. Fischer, A. Lord, J.P.F.-P.Gimenez, “Next Generation Sliceable Bandwidth VariableTransponders,” IEEE Comm. Mag., vol. 53, no. 2, pp. 163-171, Feb. 2015.
[Shi11] Y. Shi et al., "Maximizing capacity in multihop cognitive radio networks under the SINR model," IEEE Trans. Mobile Comput., 10(7), 954–967 (2011).
[Shieh10] W.Shieh, I.Djordjevic, “Orthogonal Frequency Division Multiplexing for Optical Communications,” Elsevier, San Diego, CA, USA, 2010.
[Svaluto15a] M. Svaluto Moreolo, J. M. Fabrega, L. Nadal, F. J. Vilchez, A. Mayoral, R. Vilalta, R. Muñoz, R. Casellas, R. Martínez, M. Nishihara, T. Tanaka, T. Takahara, J. C. Rasmussen, C. Kottke, M. Schlosser, R. Freund, F. Meng, S. Yan, G. Zervas, D. Simeonidou, Y. Yoshida, K. Kitayama, “SDN-enabled Sliceable BVT Based on Multicarrier Technology for Multi-Flow Rate/Distance and Grid “, paper Th.2.1.1, in Proc. ECOC, 2015.
[Svaluto15b] M. Svaluto Moreolo, et al., “DSP-enabled optical OFDM for multiple-format and multi-rate/distance transmission,” Proc. ICTON, We.A1.5, Budapest (2015).
[Tubbax03] J. Tubbax, B. Come, L. Van der Perre, L. Deneire, S. Donnay, M. Engels, “Compensation of IQ imbalance in OFDM systems”, IEEE International Conference on Communications, 2003. ICC '03.
[Yoshida13] Y. Yoshida, T. Kodama, S. Shinada, N. Wada, and K. Kitayama, “Fixed-length Elastic-capacity OFDM Payload Packet: Concept and Demonstration” in Proc. IEEE/OSA OFC2013, Paper Out2A.7., 2013
[Yoshida14] Y. Yoshida, A. Maruta, K. Kitayama, M. Nishihara, T. Takahara, T. Tanaka, J. Rasmussen, N. Yoshikane, T. Tsuritani, I. Morita, S. Yan, Y. Shu, Y. Yan, R. Nejabati, G. Zervas, D. Simeonidou, R. Vilalta, R. Munoz, R. Casellas, R. Martinez, V. Lopez, A. Aguado, and J. Beltran, “SDN-based Network Orchestration of Variable-capacity Optical Packet Switching Network over Programmable Flexi-grid Elastic Optical Path Network,” J. Light. Technol., vol. 33, no. 3, pp. 609–617, Aug. 2014.

STRAUSS Scalable and efficient orchestration of Ethernet services
using software-defined and flexible optical networks
Deliverable D2.3
Page 80 of 80