delivering today for a brighter tomorrow - pplweb.com · with an eye toward the future, ... 18.9...
TRANSCRIPT

Delivering today for a brighter tomorrowPPL CORPORATIONANNUAL REPORT 2017

Cover: Western Power Distribution Project Engineer Jack Lawthom.

MESSAGE TO SHAREOWNERS
PPL Corporation 2017 Annual Report I
Thank you for investing in PPL and supporting the work we do topower people's lives throughout the communities we serve.
At PPL, we are a company of more than 12,000 employees, each of us different in so many ways. Yet, we are united by a commonpurpose: to deliver value for our shareowners and customers, tosecure a brighter energy future for generations to come, and to make a positive impact in our communities.
This sense of purpose guides us each and every day and focuses our strategy for long-term growth and success. That strategy is clear. We will deliver best-in-sector operational performance,invest responsibly in a sustainable energy future, maintain a strong financial foundation, and engage and develop our people.
This letter highlights our achievements during 2017 in pursuit of this strategy. Those achievements included delivering powersafely, reliably and affordably to more than 10 million customers in the U.S. and U.K.; providing award-winning customer service; strengthening reliability; and investing in the future. We alsodelivered full-year earnings at the high end of our guidancerange, increased our dividend, maintained our strong balance sheet and positioned PPL for competitive earnings growth and dividends.
While PPL executed well in 2017, we were disappointed by our stock price performance. Political and regulatory uncertainty in the U.K. weighed on the price of PPL shares in the latter half of 2017 and has continued to affect the stock early this year.
We think the market has overreacted to regulatory and political developments in the U.K. We believe that the U.K. remains apremium regulatory jurisdiction in which to operate and that
Western Power Distribution (WPD), consistently the top-performing distribution network operator group in the U.K., willcontinue to deliver strong returns. We will continue to actively engage with U.K. regulator Ofgem and key stakeholders toensure positive outcomes for our customers and shareownersmoving forward.
As this uncertainty passes, we are confident that the fundamen-tal strength of our regulated businesses, our track record of outstanding execution, our strong organic growth and our forward-looking strategy will carry the day.
Drive best-in-sector operational performance
PPL's success begins by delivering electricity safely, reliably and affordably while providing outstanding customer service.Operational excellence in these areas drives high customer satisfaction, keeps PPL's reputation strong and should yield better long-term results for our shareowners.
In both the U.S. and the U.K., we excelled at customer service in2017 as we worked to expand the options available to customers and better anticipate their needs.
WPD led all U.K. distribution network operator groups in overallcustomer satisfaction and ranked best at engaging stakeholders and addressing vulnerable customers. In the U.S., both PPLElectric Utilities Corporation (PPL Electric) and Kentucky UtilitiesCompany (KU) received J.D. Power awards for residential customer satisfaction, achieving the highest overall marks byclass and region based on customer surveys. Louisville Gas andElectric Company (LG&E) finished a close second to KU.
DEAR SHAREOWNERS,
We will deliver best-in-sector operational performance, invest responsibly in a sustainable energy future, maintain a strong financial foundation, and engage and develop our people.

II PPL Corporation 2017 Annual Report
At the same time, we continued to strengthen reliability for ourcustomers by making the grid smarter and more resilient. PPL Electric recorded its best year ever for reliability in 2017. LG&E and KU posted their best year in more than a decade. And WPD remained on track to achieve its 2017/2018 performance incentive targets for both reliability and customer satisfaction.
Our U.S. utilities also finished the year with their lowest OSHA-recordable injury rates in history, reflecting continued safetyimprovements and our company-wide commitment to safety.
Invest responsibly in a sustainable energy future
As the nation grapples with how to address aging infrastructure,PPL is moving forward, taking bold steps to modernize the grid,incorporate new technology and advance a cleaner energy futurein ways that benefit customers, grow shareowner value andsupport jobs.
In 2017, we invested about $3.5 billion in infrastructureimprovements. From 2018 through 2022, we plan to invest anadditional $15 billion.
In Pennsylvania, we installed nearly 600,000 advanced meters aspart of a multi-year project to replace 1.4 million. We expanded and reinforced our transmission system, completing foursubstations and adding or rebuilding 110 miles of transmission lines. And we continued to add smart grid devices to enhance adistribution automation system that is already among the most robust and advanced in the U.S.
In Kentucky, we completed a multi-year, 540-mile gas mainreplacement project in Louisville, replacing cast iron, wrought iron and bare steel natural gas pipelines with more durable plastic natural gas pipelines. We did this ahead of many of our peers and well before federal regulations required it. In addition,we made progress on about $1 billion in environmental upgrades as part of a five-year project to cap and close ash ponds at ourcoal-fired power plants.
Across the Atlantic, we continued to expand and reinforce our distribution networks in the U.K. With an eye toward the future,we connected nearly 2 gigawatts of distributed generation, including private solar power, to our networks. In addition, weadvanced nearly two dozen research and development projects to support the increased adoption of distributed energyresources. These projects help to support the U.K.'s move towarda low-carbon future.
Finally, we performed a scenario-based climate assessment in 2017, and in early 2018 PPL established a goal to reduce carbon dioxide emissions 70 percent from 2010 levels by 2050.
Maintain a strong financial foundation
Delivering for our customers while investing in the futurerequires a strong financial foundation. At PPL, we understand that, and we're committed to protecting the value of our company so that we can deliver for you.
In 2017, we maintained a solid balance sheet and investment-grade credit ratings, generated strong cash flow and updated our business plans to address U.S. tax reform. In addition, we effectively managed foreign currency exposure through ourdisciplined risk management program.
Throughout the year, we also allocated capital as planned and recovered capital investments in a timely manner, realizing near-real-time recovery of about 80 percent of our infrastructureinvestment. We received approval from the Kentucky Public Service Commission for a combined $116 million increase in annual base electricity and gas rates for LG&E and KU. Inaddition, we continued to perform well in the U.K. against our performance incentive targets.
As a result of this disciplined investment and strong execution, we delivered at the high end of our earnings guidance in 2017, increased our dividend by 4 percent in early 2017 and thenincreased it 4 percent again early this year. Looking ahead, we expect at least 5 to 6 percent annual earnings per share growth from 2018 through 2020 off of our 2018 forecast midpoint of $2.30 per share.
Engage and develop our people
Across our company in 2017, we also continued to invest in the people whose dedication, experience and professionalism fuel our success.
This included recruiting and training field workers in our apprenticeship and lineman trainee programs, investing in leadership development programs, fostering greater diversity and inclusion, promoting employee wellness and providingexcellent compensation and benefits. As we continued this focus in 2017, PPL was recognized by Forbes magazine as one of America's best employers.
In closing, I am proud of our many achievements, and I feel very fortunate to work for this great company.
As we look to the future, we will continue to meet the challenges of a changing world and explore new opportunities to grow your company in a sustainable way. We will remain steadfast in thepursuit of our long-term strategy for growth and success, and wewill always be mindful of the role we play in providing an essential service to families, businesses and communities.
On behalf of our entire team at PPL, I thank you for your continued trust and confidence.
Sincerely,
enceWilliam H. SpeChairman, President and Chief Executive Officer

FINANCIAL & OPERATING HIGHLIGHTS
PPL Corporation 2017 Annual Report III
FINANCIAL HIGHLIGHTSFor the years ended December 31
FINANCIAL 2017 2016Operating revenues (millions) $7,447 $7,517Net income (millions) $1,128 $1,902Earnings from ongoing operations (millions) (a) $1,553 $1,674Total assets (millions) (b) $41,479 $38,315Earnings per share - Diluted $1.64 $2.79Earnings from ongoing operations per share – Diluted (a) $2.25 $2.45Dividends declared per share $1.58 $1.52Book value per share (b,c) $15.52 $14.56Market price per share (b) $30.95 $34.05Market price/book value ratio (b) 199% 234%Dividend yield 5.1% 4.5%Dividend payout ratio (d) 96% 55%Dividend payout ratio - earnings from ongoing operations (d,e) 70% 62%Price/earnings ratio (d) 18.9 12.2Price/earnings ratio - earnings from ongoing operations (d,e) 13.8 13.9Return on common equity 10.9% 19.2%Return on common equity - earnings from ongoing operations (e) 15.0% 16.9%
OPERATING - DOMESTIC ELECTRICITY SALES (GWh)
Retail delivered 65,751 67,474Wholesale supplied 2,084 2,177
OPERATING - INTERNATIONAL ELECTRICITY SALES (GWh)United Kingdom 74,317 74,728
(a) Management utilizes “Earnings from Ongoing Operations” as a non-GAAP financial measure that should not be considered as an alternative to reportedearnings, or net income, an indicator of operating performance determined in accordance with GAAP. PPL believes that Earnings from Ongoing Operationsis useful and meaningful to investors because it provides management's view of PPL's earnings performance as another criterion in making investment decisions. In addition, PPL's management uses Earnings from Ongoing Operations in measuring achievement of certain corporate performance goals, including targets for certain executive incentive compensation. Other companies may use different measures to present financial performance.
Earnings from Ongoing Operations is adjusted for the impact of special items. Special items are presented in the financial tables on an after-tax basis withthe related income taxes on special items separately disclosed. Income taxes on special items, when applicable, are calculated based on the effective tax rate of the entity where the activity is recorded. See “Reconciliation of Net Income to Earnings from Ongoing Operations” on page 36 (millions of dollars) andpage V (per share) of this report.
(b) End of period.
(c) Based on 693,398 and 679,731 shares of common stock outstanding (in thousands) at December 31, 2017 and December 31, 2016.
(d) Based on diluted earnings per share.
(e) Calculated using earnings from ongoing operations, which is a non-GAAP financial measure that includes adjustments described above in footnote (a).
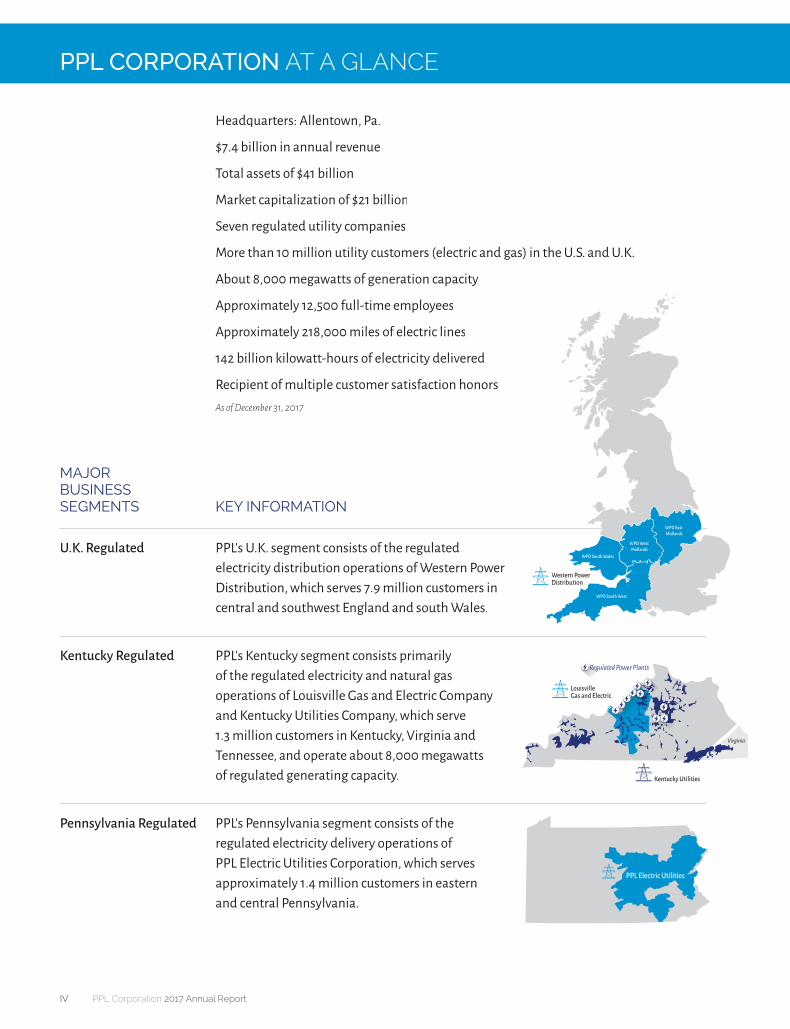
PPL CORPORATION AT A GLANCE
IV PPL Corporation 2017 Annual Report
Headquarters: Allentown, Pa.
$7.4 billion in annual revenue
Total assets of $41 billion
Market capitalization of $21 billion
Seven regulated utility companies
More than 10 million utility customers (electric and gas) in the U.S. and U.K.
About 8,000 megawatts of generation capacity
Approximately 12,500 full-time employees
Approximately 218,000 miles of electric lines
142 billion kilowatt-hours of electricity delivered
Recipient of multiple customer satisfaction honorsAs of December 31, 2017
MAJOR BUSINESS SEGMENTS
KEY INFORMATION
U.K. Regulated PPL's U.K. segment consists of the regulatedelectricity distribution operations of Western Power Distribution, which serves 7.9 million customers incentral and southwest England and south Wales.
Kentucky Regulated PPL's Kentucky segment consists primarily of the regulated electricity and natural gasoperations of Louisville Gas and Electric Company and Kentucky Utilities Company, which serve1.3 million customers in Kentucky, Virginia and Tennessee, and operate about 8,000 megawattsof regulated generating capacity.
Pennsylvania Regulated PPL's Pennsylvania segment consists of theregulated electricity delivery operations of PPL Electric Utilities Corporation, which servesapproximately 1.4 million customers in easternand central Pennsylvania.
WPD South Wales
WPD South West
WPD East Midlands
WPD West Midlands
Western PowerDistribution
Louisville Gas and Electric
Kentucky Utilities
Virginia
Regulated Power Plants
PPL Electric Utilities

FINANCIAL TABLE OF CONTENTS
Business ........................................................................................................................................................... 1
Selected Financial and Operating Data ........................................................................................................ 19
Combined Management's Discussion and Analysis of Financial Condition and
Results of Operations ................................................................................................................................... 20
Reports of Independent Registered Public Accounting Firms ...................................................................... 67
Consolidated Statements of Income .............................................................................................................70
Consolidated Statements of Comprehensive Income .................................................................................. 71
Consolidated Statements of Cash Flows ....................................................................................................... 72
Consolidated Balance Sheets ........................................................................................................................ 73
Consolidated Statements of Equity ............................................................................................................... 75
Combined Notes to Financial Statements
Note 1 Summary of Significant Accounting Policies ........................................................................ 76
Note 2 Segment and Related Information ........................................................................................88
Note 3 Preferred Securities ................................................................................................................ 91
Note 4 Earnings Per Share .................................................................................................................. 91
Note 5 Income and Other Taxes ........................................................................................................92
Note 6 Utility Rate Regulation ......................................................................................................... 105
Note 7 Financing Activities ............................................................................................................... 115
Note 8 Acquisitions, Development and Divestitures .......................................................................121
Note 9 Leases ................................................................................................................................... 124
Note 10 Stock-Based Compensation ..................................................................................................125
Note 11 Retirement and Postemployment Benefits ......................................................................... 130
Note 12 Jointly Owned Facilities ........................................................................................................ 147
Note 13 Commitments and Contingencies ....................................................................................... 148
Note 14 Related Party Transactions ....................................................................................................157
Note 15 Other Income (Expense) - net .............................................................................................. 159
Note 16 Fair Value Measurements..................................................................................................... 159
Note 17 Derivative Instruments and Hedging Activities ...................................................................161
Note 18 Goodwill and Other Intangible Assets ................................................................................. 168
Note 19 Asset Retirement Obligations ...............................................................................................172
Note 20 Accumulated Other Comprehensive Income (Loss) .............................................................172
Note 21 New Accounting Guidance Pending Adoption ................................................................... 174
Quarterly Financial, Common Stock Price and Dividend Data (Unaudited) ...............................................177
Comparison of 5-Year Cumulative Total Return .......................................................................................... 178
Management's Report on Internal Control over Financial Reporting ........................................................ 178
Glossary of Terms and Abbreviations .......................................................................................................... 179

Form 10-K for the year ended December 31, 2017, was filed by PPL Corporation with the U.S. Securities and Exchange Commission on February 22, 2018. Please visit PPL Corporation's website, www.pplweb.com/investors, for the full text.

1
BUSINESS
General
(All Registrants)
PPL Corporation, headquartered in Allentown, Pennsylvania, is a utility holding company, incorporated in 1994, in connectionwith the deregulation of electricity generation in Pennsylvania, to serve as the parent company to the regulated utility, PPL Electric, and to generation and other unregulated business activities. PPL Electric was founded in 1920 as Pennsylvania Power & Light Company. PPL, through its regulated utility subsidiaries, delivers electricity tod customers in the U.K., Pennsylvania,Kentucky, Virginia and Tennessee; delivers natural gas to customers in Kentucky; and generates electricity from power plantsin Kentucky. In June 2015, PPL completed the spinoff of PPL Energy Supply, which combined its competitive power dgeneration businesses with those of Riverstone to form a new, stand-alone, publicly traded company named Talen Energy. See"Spinoff of PPL Energy Supply" below for more information.
PPL's principal subsidiaries at December 31, 2017 are shown below (* denotes a Registrant).
PPL Corporation*
PPL Capital Funding
Provides financing for theoperations of PPL andcertain subsidiaries
PPL GlobalEngages in the regulated
distribution of electricity inthe U.K.
LKE*
PPL Electric* Engages in the regulated
transmission and distribution of electricity in Pennsylvania
LG&E* Engages in the regulated
generation, transmission,distribution and sale of electricity and the regulated distribution and sale of natural gas in Kentucky
KU* Engages in the regulated
generation, transmission, distribution and sale of electricity, primarily inKentucky
U.K.Regulated Segment Kentucky
Regulated Segment PennsylvaniaRegulated Segment
PPL Global is not a registrant. Unaudited annual consolidated financial statements for the U.K. Regulated Segment arefurnished on a Form 8-K with the SEC.
In addition to PPL, the other Registrants included in this report are as follows.
PPL Electric Utilities Corporation, headquartered in Allentown, Pennsylvania, is a wholly owned subsidiary of PPL organized ain Pennsylvania in 1920 and a regulated public utility that is an electricity transmission and distribution service provider ineastern and central Pennsylvania. PPL Electric is subject to regulation as a public utility by the PUC, and certain of its transmission activities are subject to the jurisdiction of the FERC under the Federal Power Act. PPL Electric delivers electricity in its Pennsylvania service area and provides electricity supply to retail customers in that area as a PLR under the Customer Choice Act.
LG&E and KU Energy LLC, headquartered in Louisville, Kentucky, is a wholly owned subsidiary of PPL and a holding company that owns regulated utility operations through its subsidiaries, LG&E and KU, whichu constitute substantially all of LKE's assets. LG&E and KU are engaged in the generation, transmission, distribution and sale of electricity. LG&E alsoengages in the distribution and sale of natural gas. LG&E and KU maintain separate corporate identities and serve customers in

2
Kentucky under their respective names. KU also serves customers in Virginia under the Old Dominion Power name and in Tennessee under the KU name. LKE, formed in 2003, is the successor to a Kentucky entity incorporated in 1989.
Louisville Gas and Electric Company, headquartered in Louisville, Kentucky, is a wholly owned subsidiary of LKE and a regulated utility engaged in the generation, transmission, distribution and sale of electricity and distribution and sale of naturalaagas in Kentucky. LG&E is subject to regulation as a public utility by the KPSC, and certain of its transmission activities aresubject to the jurisdiction of the FERC under the Federal Power Act. LG&E was incorporated in 1913.
Kentucky Utilities Company, headquartered in Lexington, Kentucky, is a wholly owned subsidiary of LKE and a regulated wutility engaged in the generation, transmission, distribution and sale of electricity in Kentucky, Virginia and Tennessee. KU issubject to regulation as a public utility by the KPSC and the VSCC, and certain of its transmission and wholesale power activities are subject to the jurisdiction of the FERC under the Federal Power Act. KU serves its Virginia customers under theOld Dominion Power name and its Kentucky and Tennessee customers under the KU name. KU was incorporated in Kentuckyin 1912 and in Virginia in 1991.
Segment Informationg
(PPL)
PPL is organized into three reportable segments as depicted in the chart above: U.K. Regud lated, Kentucky Regulated, and Pennsylvania Regulated. The U.K. Regulated segment has no related subsidiary Registrants. PPL's other reportable segments'results primarily represent the results of its related subsidiary Registrants, except that the reportable segments are also allf ocated certain corporate level financing and other costs that are not included in the results of the applicable subsidiary Registrants. PPL also has corporate and other costs which primarily include financing costs incurred at the corporate level that have not been allocated or assigned to the segments, as well as certain other unallocated costs. As a result of the June 1, 2015 spinoff of fPPL Energy Supply, PPL no longer has a Supply segment. The operations of the Supply segment are included in "Loss from Discontinued Operations (net of income taxes)" on the Statements of Income.
A comparison of PPL's three regulated segments is shown below.
Kentucky PennsylvaniaU.K. Regulated Regulated Regulated
For the year ended December 31, 2017: Operating Revenues (in billions) $ 2.1 $ 3.2 $ 2.2Net Income (in millions) $ 652 $ 286 $ 359Electricity delivered (GWh) 74,317 31,839 35,996
At December 31, 2017: Regulatory Asset Base (in billions) (a) $ 9.8 $ 9.2 $ 6.9Service area (in square miles) 21,600 9,400 10,000End-users (in millions) 7.9 1.3 1.4
(a) Represents RAV for U.K. Regulated, capitalization for Kentucky Regulated and rate base for Pennsylvania Regulated.
See Note 2 to the Financial Statements for additional financial information about the segments.
(PPL Electric, LKE, LG&E and KU)
PPL Electric has two operating segments that are aggregated into a single reportable segment. LKE, LG&E and KU areindividually single operating and reportable segments.
• U.K. Regulated Segment (PPL)g g
Consists of PPL Global, which primarily includes WPD's regulated electricity distributioe n operations, the results of hedging the translation of WPD's earnings from British pound sterling into U.S. dollars, and certain costs, such asU.S. income taxes, administrative costs and acquisition-related financing costs. d
WPD operates four of the 14 Ofgem regulated DNOs providing electricity service in the U.K. through indirect wholly owned subsidiaries: WPD (South West), WPD (South Wales), WPD (East Midlands) and WPD (West Midlands). The number of

3
network customers (end-users) served by WPD totals 7.9 million across 21,600 square miles in south Wales and southwest and central England.
Revenues, in millions, for the years ended December 31 are shown below.
2017 2016 2015 Operating Revenues (a) $ 2,091 $ 2,207 $ 2,410
(a) WPD’s Operating Revenues are translated from GBP to U.S. dollars using the average GBP to U.S. dollar exchange rates in effect each month. Theannual weighted average of the monthly GBP to U.S. dollar exchange rates used for the years ended December 31, 2017, 2016 and 2015 were $1.28 per GBP, $1.37 per GBP and $1.53 per GBP.
Franchise and Licenses
WPD’s operations are regulated by Ofgem under the direction of the Gas and Electricity Markets Authority. Ofgem is a non-fministerial government department and an independent National Regulatory Authority that is responsible for protecting theinterests of existing and future electricity and natural gas consumers. The Electricity Act 1989 provides the fundamental framework for electricity companies and established licenses that require each of the DNOs to develop, maintain and operate efficient distribution networks. WPD’s operations are regulated under these licenses which set the outputs WPD needs todeliver for their customers and associated revenues WPD is allowed to earn. WPD operates under a regulatory year that beginsApril 1 and ends March 31 of each year.
Ofgem has the formal power to propose modifications to each distribution license; however licensees can appeal such changes to the U.K.’s Competition and Markets Authority in the event of a disagreement with the regulator. Generally, any potentialchanges to these licenses are reviewed with stakeholders in a formal regulatory consultation process prior to a formal change proposal.
Competition p
Although WPD operates in non-exclusive concession areas in the U.K., it currently faces little competition with respect to end-users connected to its network. WPD's four distribution businesses are, therefore, regulated monopolies, which operate under regulatory price controls.
Customers
WPD provides regulated electricity distribution services to licensed third party energy suppliers who use WPD's networks toytransfer electricity to their customers, the end-users. WPD bills energy suppliers for this service and the supplier is responsible for billing its end-users. Ofgem requires that all licensed electricity distributors and suppliers become parties to the DistributionConnection and Use of System Agreement. This agreement specifies how creditworthiness will be determined and, as a result, whether the supplier needs to collateralize its payment obligations.
WPD’s costs make up approximately 16% of a U.K. end-user customer’s electricity bill.
U.K. Regulation and Ratesg
Overview
Ofgem has adopted a price control regulatory framework with a balanced objective of enhancing and developing electricity networks for the future, controlling costs to customers and allowing DNOs, such as WPD's DNOs, to earn a fair return on their investments. This regulatory structure is focused on outputs and performance in contrast to traditional U.S. utility ratemakingttthat operates under a cost recovery model. Price controls are established based on long-term business plans developed by eachDNO with substantial input from its stakeholders. To measure the outputs and performance, each DNO business plan includes incentive targets that allow for increases and/or reductions in revenues based on operational performance, which are intended toalign returns with quality of service, innovation and f customer satisfaction.
For comparative purposes, amounts listed below are in British pounds sterling, nominal prices and in calendar years unlessotherwise noted.

4
Key Ratemaking Mechanisms
PPL believes the U.K. electricity utility model is a premium jurisdiction in which to do business due to its significant stakeholder engagement, incentive-based structure and high-quality ratemaking mechanisms.
Current Price Control: RIIO-ED1
WPD is currently operating under an eight-year price control period called RIIO-ED1, which commenced for electricitydistribution companies on April 1, 2015. The regulatory framework is based on an updated approach for sustainable network kregulation known as the "RIIO" model where Revenue = Incentives + Innovation + Outputs.
The RIIO framework allows for a MPR, which is a review halfway through the price control period to assess potential changesin outputs during the price control period. The scope of the potential MPR was originally limited to material changes to outputs that can be justified by clear changes in government policy and the introduction of new outputs that are needed to meet the needs of consumers and other network users. Ofgem is currently consulting t on the scope of the potential MPR. See " Combined Management's Discussion and Analysis of Financial Condition and Results of Operations - Overview - Financial and Operational Developments - Regulatory Requirements" for additional information.
In coordination with numerous stakeholders, WPD developed its business plans for RIIO-ED1 building off its historical track record and long-term strategy of delivering industry-leading levels of performance at an efficient level of cost. As a result, all four of WPD’s DNOs' business plans were accepted by Ofgem as "well justified" and were "fast-tracked" ahead of all of the other DNOs. WPD's DNOs were rewarded for being fast-tracked with preferential financial incentives, a higher return onequity and higher cost savings retention under their business plans as discussed further below.
WPD's combined RIIO-ED1 business plans include funding for total expenditures of approximately £12.8 billion (nominal) over the eight-year period, broken down as follows:
• Totex - £8.5 billion (£6.8 billion recovered as additions to RAV over time ("Slow pot"); £1.7 billionrecovered in the year spent in the plan ("Fast pot"));
• Pension deficit funding - £1.2 billion;• Cost of debt recovery - £1.0 billion;• Pass Through Charges - £1.6 billion (Property taxes, Ofgem fees and National Grid transmissions charges);
and • Corporate income taxes recovery - £0.5 billion.
The chart below illustrates the building blocks of allowed revenue and GAAP net income for the U.K. Regulated Segment. Therevenue components are shown in either 2012/13 prices or nominal prices, consistent with the formulas Ofgem established for RIIO-ED1. The reference numbers included in each block correspond with the descriptions that follow.
(a) Primarily pension deficit funding, pass through costs, profiling adjustments and legacy price control adjustments.(b) Primarily pass through true-ups and £5 per residential customer reduction.

5
(c) Reference Form 8-K filed February 22, 2018 for U.K. Regulated Segment GAAP Statement of Income component values. (d) Includes GAAP pension costs/income (see “Defined Benefits, Net periodic defined benefit costs (credits)” in Note 11 to the Financial Statements).(e) Primarily property taxes. (f) Primarily gains and losses on foreign currency hedges. (g) Includes WPD interest and $32 million of allocated interest expense to finance the acquisition of WPD Midlands. (h) GAAP income taxes represent an effective tax rate of 19% for 2017, 16% for 2016 and approximately 17% going forward.
(1) Base Revenue
The base revenue that a DNO can collect in each year of the current price control period is the sum of the following which aretdiscussed further below:
• a return on capital from RAV; • a return of capital from RAV (i.e., depreciation);• the Fast pot recovery, see discussion “(4) Expenditure efficiency mechanisms” below;• an allowance for cash taxes paid less a potential reduction for tax benefits from excess leverage if a DNO is
levered more than 65% Debt/RAV;• pension deficit funding;• certain pass-through costs over which the DNO has no control; • profiling adjustments, see discussion “(6) Other revenue included in base revenue” below;• certain legacy price control adjustments from preceding price control periods, including the information
quality incentive (also known as the rolling RAV incentive); and,• fast-track incentive - because WPD's four DNOs were fast-tracked through the price control review process
for RIIO-ED1, their base demand revenue also includes the fast-track incentive.
(2) Real Return on capital from RAV
Real-time returns on cost of regulated equity (real) - Ofgem establishes an allowed return on regulated equity that DNOs earn g q y ( )in their base business plan revenues as a consideration of the financial parameters for each RIIO-ED1 business plan. For WPD,the base cost of equity collected in revenues was set at 6.4% (real). Base equity returns exclude inflation adjustments, allowances for incentive rewards/penalties and over/under collections driven by cost efficiencies. WPD’s base equity returnsffare calculated using an equity ratio of 35% of RAV at the DNO. The equity ratio was reviewed and set during the RIIO-ED1 business plan process taking various stakeholder impacts into consideration such as costs to consumers, credit ratings and investor needs. The amounts of base real equity return, for 2017 and 2016 were £151 million and £144 million.
Indexed cost of debt recovery (real) - As part of WPD’s fast-track agreement with Ofgem for RIIO-ED1, WPD collects iny ( )revenues an assumed real cost of debt that is derived from a historical 10-year bond index (iBoxx) and adjusted annually for inflation. This calculated real cost of debt is then applied to 65% of RAV at the DNOs to determine the cost of debt revenue recovery. The cost of debt was set at 2.55% in the original "well justified" business plans. The recovery amounts are trued up annually as a component of the MOD true-up mechanism described within "(9) MOD and Inflation True-Up (TRU)" below.
Actual interest expense is reflective of prior financing activities and any financing required to fund capital expenditures. Therefore, the amount collected in revenues may differ from the actual interest expense recorded in the Statements of Income.Currently, WPD is under-recovering its DNO-related interest expense and is expected to continue to under-recover through the remainder of RIIO-ED1.
Interest costs relating to debt issued at WPD’s holding companies are not recovered in revenues and for 2017 and 2016 wereapproximately £49 million and £54 million.
(3) Recovery of depreciation in revenues - Recovery of depreciation in regulatory revenues is one of the key mechanismsrrOfgem uses to support financeable business plans that provide incentives to attract the continued substantial investment required in the U.K. Differences between GAAP and regulatory depreciation exist primarily due to differing assumptions on asset lives and because RAV is adjusted for inflation using RPI.
Compared to asset lives established for GAAP, asset lives established for ratemaking are set by Ofgem based on economic lives which results in improved near-term revenues and cash flows for DNOs during investment cycles. Under U.K. regulation prior to RIIO-ED1, electric distribution assets were depreciated on a 20-year asset life for the purpose of setting revenues. After review and consultation, Ofgem decided to use 45-year asset lives for RAV additions after April 1, 2015, with transitional arrangements available for DNOs that fully demonstrated a need to ensure a financeable plan. WPD adopted a transition that

6
has a linear increase in asset lives from 20 to 45 years for additions to RAV in each year of RIIO-ED1 (with additions averaging a life of approximately 35 years over this period), which adds support to its credit metrics. RAV additions prior to March 31,uu2015 continue to be recovered in revenues over 20 years.
The asset lives used to determine depreciation expense for GAAP purposes are not the same as those used for the depreciationof the RAV in setting revenues and, as such, vary by asset type and are based on the expected useful lives of the assets.yyEffective January 1, 2015 after completing a review of the useful lives of its distribution network assets, WPD set the weighted average useful lives to 69 years for GAAP depreciation expense.
Because Ofgem uses a real cost of capital, the RAV and recovery of depreciation are adjusted for inflation using RPI. Theinflation revenues collected in this line item help recover the cost of equity and debt returns on a "nominal" basis, compared to the "real" rates used to set the return component of base revenues.
This regulatory construct, in combination with the different assets lives used for ratemaking and GAAP, results in amountscollected by WPD as recovery of depreciation in revenues being significantly higher than the amounts WPD recorded for depreciation expense under GAAP. For 2017 and 2016, this difference was £424 million and £415 million (pre-tax) and positively impacted net income. We expect this difference to continue in the £400 million to £450 million (pre-tax) range at least through 2022 (the last full calendar year of RIIO-ED1) assuming RPI of approximately 3.0% per year from 2018 through2022 and based on expected RAV additions of approximately £800 million per year tof prepare the distribution system for future U.K. energy objectives while maintaining premier levels of reliability and customer service.
(4) Expenditure efficiency mechanisms - Ofgem introduced the concept of Totex in RIIO to ensure all DNOs face equal incentives in choosing between operating and capital solutions. Totex is split between immediate recovery (called "Fast pot")and deferred recovery as an addition to the RAV (called "Slow pot"). The ratio of Slow pot to Fast pot was determined by each DNO in their business plan development. WPD established a Totex split of 80% Slow pot and 20% Fast pot for RIIO-ED1 tobalance maximizing RAV growth with immediate cost recovery to support investment grade credit ratings. Comparatively,other DNOs on average used a ratio of approximately 70% Slow pot and 30% Fast pot for RIIO-ED1.
Ofgem also allows a Totex Incentive Mechanism that is intended to reward DNOs for cost efficiency. WPD's DNOs are able toretain 70% of any amounts not spent against its RIIO-ED1 plan and bear 70% of any over-spends. Any amounts to be returned to customers are trued up in the AIP discussed below. n
Because Fast pot cost recovery represents 20% of Totex expenditures and certain other costs are recovered in other aspects of revenue, Fast pot will not equal operation and maintenance expenses recorded for GAAP purposes.
(5) Income Tax Allowance - For price control purposes, WPD collects income tax based on Ofgem’s notional tax charge, which will not equal the amount of income tax expense recorded for GAAP purposes. The following table shows the amount of taxescollected in revenues and recorded under GAAP.
2017 2016 Taxes collected in revenues £ 57 £ 53Taxes recorded under GAAP 139 119
(6) Other revenue included in base revenue - Other revenue included in base revenue primarily consists of pension deficit funding, pass through costs, profiling adjustments and legacy price control adjustments.tt
Recovery of annual (normal) pension cost and pension deficit funding - Ofgem allows DNOs to recover annual (normal) y ( ) p p gpension costs through the Totex allocation, split between the previously described Fast pot (immediate recovery) and Slow pot recovery (as an addition to RAV). The amount of normal pension cost is computed by the pension trustees, using assumptions ythat differ from those used in calculating pension costs/income under GAAP. In addition, the timing of the revenue collectionmay not match the actual pension payment schedule, resulting in a timing difference of cash flows.
In addition, WPD recovers approximately 80% of pension deficit funding for certain of WPD's defined benefit pension plans in conjunction with actual costs similar to the Fast pot mechanism. r The pension deficit is determined by the pension trustees on atriennial basis in accordance with their funding requirements. Pension deficit fundinguu recovered in revenues was £142 million and £139 million in 2017 and 2016.
See Note 11 to the Financial Statements for additional information on pension costs/income recognized under GAAP.

7
Recovery of pass through costs - WPD recovers certain pass-through costs over which the DNO has no control such as property y p gtaxes, National Grid transmission charges and Ofgem fees. Although these items are intended to be pass-through charges therecould be timing differences, primarily related to property taxes, as to when amounts are collected in revenues and whenamounts are expensed in the Statements of Income. WPD over-collected property taxes by £19 million and £8 million in 2017and 2016. WPD expects to continue to over-recover property taxes until the end of RIIO-ED1. Amounts under-or over-recovered in revenues in a regulatory year are trued up through revenues two regulatory years later.
Profiling adjustments - Ofgem permitted DNOs the flexibility to make profiling adjustments to their base revenues within their g jbusiness plans. These adjustments do not affect the total base revenue in real terms over the eight-year price control period, but change the year in which the revenue is collected. In the first year of RIIO-ED1, WPD’s base revenue decreased by 11.8%compared to the final year of the prior price control period (DPCR5), primarily due to a change in profiling methodology and a lower weighted-average cost of capital. Base revenue then increases by approximately 2.5% per annum before inflation for regulatory years up to March 31, 2018 and by approximately 1% per annum before inflation for each regulatory year thereafter for the remainder of RIIO-ED1.
(7) Incentives for developing high-quality business plans (known as fast-tracking) - For RIIO-ED1, Ofgem incentivized DNOs with certain financial rewards to develop "well justified" business plans that drive value to customers. WPD wasawarded the following incentives for being fast-tracked by Ofgem:
• an annual fast-track revenue incentive worth 2.5% of Totex (approximately £25 million annually for WPD); • a real cost of equity rate of 6.4% compared to 6.0% for slow-tracked DNOs; and,• cost savings retention was established at 70% for WPD compared to approximately 55% for slow-tracked
DNOs.
(8) Allowed Revenue - Allowed revenue is the amount that a DNO can collect from its customers in order to fund itsinvestment requirements.
Base revenues are adjusted annually during RIIO-ED1 to arrive at allowed revenues. These adjustments are discussed in sections (9) through (13) below.
(9) MOD and Inflation True-Up (TRU)
MOD - RIIO-ED1 includes an AIP that allows future base revenues, agreed with the regulator as part of the price control review, to be updated during the price control period for financial adjustments includitt ng taxes, pensions, cost of debt, legacyprice control adjustments from preceding price control periods and adjustments relating to actual and allowed total expendituretogether with the Totex Incentive Mechanism (TIM). The AIP calculates an incremental change to base revenue, known as the "MOD" adjustment.
• The MOD provided by Ofgem in November 2016 included the TIM for the 2015/16 regulatory year, as wellas the cost of debt calculation based on the 10-year trailing average to October 2016. This MOD of £12 million reduced base revenue in calendar years 2017 and 2018 by £8 million and £4 million.
• The MOD provided by Ofgem in November 2017 for the 2016/17 regulatory year is a £39 million reductionto revenue and will reduce base revenue in calendar years 2018 and 2019 by £26 million and £13 million.
• The projected MOD for the 2017/18 regulatory year is a £45 million reduction to revenue and is expected toreduce base revenue in calendar years 2019 and 2020 by £30 million and £15 million.
TRU - As discussed below in "(10) Inflation adjusted, multi-year rate cycle," the base revenue for the RIIO-ED1 period was set based on 2012/13 prices. Therefore an inflation factor as determined by forecasted RPI, provided by HM Treasury, is applied to base revenue. Forecasted RPI is trued up to actuals and affects future base revenue two regulatory years later. This revenue change is called the "TRU" adjustment.
• The TRU for the 2015/16 regulatory year was a £31 million reduction to revenue and reduced base revenue in calendar years 2017 and 2018 by £21 million and £10 million.
• The TRU for the 2016/17 regulatory year was a £6 million reduction to revenue and will reduce base revenue in calendar years 2018 and 2019 by £4 million and £2 million.
• The projected TRU for the 2017/18 regulatory year is a £5 million increase to revenue and is expected toincrease base revenue in calendar years 2019 and 2020 by £3 million and £2 million.

8
As both MOD and TRU are changes to future base revenues as determined by Ofgem, these adjustments are recognized as acomponent of revenues in future years in which service is provided and revenues are collected or returned to customers. PPL'sprojected earnings per share growth rate through 2020 includes both the TRU and MOD for regulatory years 2015/16 and 2016/17 and the estimated TRU and MOD for 2017/18.
(10) Inflation adjusted, multi-year rate cycle - Ofgem built its price control framework e to better coincide with the long-term nature of electricity distribution investments. The current price control for electricity distribution is for the eight-year period from April 1, 2015 through March 31, 2023. This both required and enabled WPD to design a base business plan withpredictable revenues and expenses over the long-term to drive value for its customers through predetermined outputs and for itsinvestors through preset base returns. A key aspect to the multi-year cycle is an annual inflation adjustment for revenue and cost components, which are inflated using RPI from the base 2012/13 prices used to establish the business plans. Consistent withOfgem’s formulas, the inflation adjustment is applied to base revenue, MOD and TRU when determining allowed revenue. This inflation adjustment also has the effect of inflating RAV, and real returns are earned on the inflated RAV.
(11) Incentive revenues for strong operational performance and innovation - Ofgem has established incentives to provide opportunities for DNOs to enhance overall returns by improving network efficiency, reliability and customer service. Theseincentives can result in an increase or reduction in revenues based on incentives or penalties for actual performance against pre-established targets based on past performance. Some of the more significant incentives that may affect allowed revenue include the Interruptions Incentive Scheme (IIS), the broad measure of customer service (BMCS) and the time to connect (TTC)incentive:
• The IIS has two major components: (1) Customer interruptions (CIs) and (2) Customer minutes lost (CMLs),rrand both are designed to incentivize the DNOs to invest in and operate their networks to manage and reduceboth the frequency and duration of power outages.
• The BMCS encompasses customer satisfaction in supply interruptions, connections and general inquiries,complaints, stakeholder engagement and delivery of social obligations.
• The TTC incentive rewards DNOs for reducing connection times for minor connections against an Ofgem set target.
The annual incentives and penalties are reflected in customer rates on a two-year lag from the time they are earned and/or aaassessed. Based on applicable GAAP, incentive revenues and penalties are recorded in revenues when they are billed to customers. The following table shows the amount of incentive revenues (in total), primarily from IIS, BMCS and TTC that WPD has received and is projected to receive on a calendar year basis:
Incentive Received Calendar Year Ended IncentiveCalendar Year Ended Incentive Earned (in millions) Included in Revenue
2014 £ 83 2016 2015 79 2017 2016 76 2018
2017 (a) 65-80 2019 2018 (a) 70-85 2020
(a) Reflects projected incentive revenues.
(12) Correction Factor (K-factor) - During the price control period, WPD sets its tariffs to recover allowed revenue. However, in any fiscal period, WPD's revenue could be negatively affected if its tariffs and the volumed delivered do not fully recover the allowed revenue for a particular period. Conversely, WPD could over-recover revenue. Over- and under-recoveries aresubtracted from or added to allowed revenue in future years, known as the "Correction Factor" or "K-factor." Over and under-recovered amounts during RIIO-ED1 will be refunded/recovered two regulatory years later. The K-factors created in the2016/17 and 2015/16 regulatory years were not significant.
Historically, tariffs have been set a minimum of three months prior to the beginning of the regulatory year (April 1). InFebruary 2015, Ofgem determined that, beginning with the 2017/18 regulatory year, tariffs would be established a minimum of fifteen months in advance. Therefore, in December 2015, WPD was required to establish tariffs for the 2016/17 and 2017/18regulatory years. This change will potentially increase volatility in future revenue forecasts due to the need to forecast components of allowed revenue including MOD, TRU, K-factor and incentive revenues.

9
(13) Other Allowed Revenue - Other Allowed Revenue primarily consists of pass through true-ups and £5 per residential customer reduction. For a discussion on property tax true-ups, see recovery of pass through costs in "rr (6) Other revenueincluded in base revenue" above.
In the 2016/17 regulatory year, WPD recovered a £5 per residential network customer reduction given through reduced tariffsrin 2014/15. As a result, revenues were positively affected in calendar years 2017 and 2016 by £13 million and £25 million.
(14) GAAP Operating Revenue - Operating revenue under GAAP primarily consise ts of allowed revenue that has been collected in the calendar year converted to U.S. dollars. It also includes miscellaneous revenue primarily from engineering recharge workand ancillary activity revenue. Engineering recharge is work performed for a third party by WPD which is not for generalnetwork maintenance or to increase reliability. Examples are diversions and running new lines and equipment for a newhousing complex. Ancillary activity revenue includes revenue primarily from WPD’s Telecoms and Property companies. For additional information on ancillary activity revenue, see footnote c in "Combined Management’s Discussion and Analysis of Financial Conditions and Results of Operation - Reconciliation of Margins." The amounts of miscellaneous revenue for 2017and 2016 were £90 million and £84 million, however, the margin or profit on these activities was not significant.
(15) Currency Hedging - Earnings generated by PPL's U.K. subsidiaries areg subject to foreign currency translation risk. Due to the significant earnings contributed from WPD, PPL enters into foreign currency contracts to economically hedge the value of the GBP versus the U.S. dollar. These hedges do not receive hedge accounting treatment under GAAP. See "Overview-Financial and Operational Developments - U.K. Membership in European Union" in " Combined Management's Discussionand Analysis of Financial Condition and Results of Operations" for a discussion of U.K. earnings hedging activity.
GAAP Accounting implications:
As the regulatory model in the U.K. is incentive based rather than a cost recovery model, WPD is not subject to accounting for the effects of certain types of regulation as prescribed by GAAP. Therefore, the accounting treatment for the accelerated recovery of depreciation, pension deficit funding, cost of debt recovery, income taff x recovery and the adjustments to base revenue and/or allowed revenue is evaluated primarily based on revenue recognition guidance.
See "Revenue Recognition" in Note 1 to the Financial Statements for additional information.
• Kentucky Regulated Segment (PPL)y g g
Consists of the operations of LKE, which owns and operates regulated public utilities engaged in the generation,transmission, distribution and sale of electricity and distribution and sale of natural gas, representing primarily therractivities of LG&E and KU. In addition, certain acquisition-related financing costs are allocated to the KentuckyRegulated segment.
(PPL, LKE, LG&E and KU)
LG&E and KU, direct subsidiaries of LKE, are engaged in the regulated generation, transmission, distribution and sale of electricity in Kentucky and, in KU's case, Virginia and Tennessee. LG&E also engages in the distribution and sale of naturalngas in Kentucky. LG&E provides electric service to approximately 411,000 customers in Louisville and adjacent areas inKentucky, covering approximately 700 square miles in nine counties and provides natural gas service to approximately 326,000customers in its electric service area and eight additional counties in Kentucky. KU provides electric service to approximately525,000 customers in 77 counties in central, southeastern and western Kentucky,tt approximately 28,000 customers in fivecounties in southwestern Virginia, and three customers in Tennessee, covering approximately 4,800 non-contiguous square miles. KU also sells wholesale electricity to 10 municipalities in Kentucky under load following contracts.

10
Details of operating revenues, in millions, by customer class for the years ended December 31 are shown below.
2017 2016 2015
Revenue % of
Revenue Revenue% of
Revenue Revenue % of
Revenue LKE Commercial $ 854 27 $ 834 27 $ 816 26Industrial 603 19 601 19 628 20Residential 1,259 40 1,261 40 1,245 40Other (a) 280 9 288 9 267 9Wholesale - municipal 112 4 116 4 114 4Wholesale - other (b) 48 1 41 1 45 1Total $ 3,156 100 $ 3,141 100 $ 3,115 100
(a) Primarily includes revenues from street lighting and other public authorities. (b) Includes wholesale power and transmission revenues.
2017 2016 2015
Revenue % of
Revenue Revenue% of
Revenue Revenue % of
Revenue LG&E Commercial $ 453 31 $ 442 31 $ 436 30Industrial 187 13 185 13 199 14Residential 637 44 627 44 633 44Other (a) 123 8 135 9 117 8Wholesale - other (b) 53 4 41 3 59 4Total $ 1,453 100 $ 1,430 100 $ 1,444 100
(a) Primarily includes revenues from street lighting and other public authorities. (b) Includes wholesale power and transmission revenues. Also includes intercompany power sales and transmission revenues, which are eliminated upon
consolidation at LKE.
2017 2016 2015
Revenue % of
Revenue Revenue % of
Revenue Revenue % of
Revenue KU Commercial $ 401 23 $ 392 22 $ 380 22Industrial 416 24 416 24 429 25Residential 622 36 634 36 612 35Other (a) 157 9 153 9 150 9Wholesale - municipal 112 6 116 7 114 7Wholesale - other (b) 36 2 38 2 43 2Total $ 1,744 100 $ 1,749 100 $ 1,728 100
(a) Primarily includes revenues from street lighting and other public authorities. (b) Includes wholesale power and transmission revenues. Also includes intercompany power sales and transmission revenues, which are eliminated upon
consolidation at LKE.
Franchises and Licenses
LG&E and KU provide electricity delivery service, and LG&E provides natural gas distribution service, in their respectiveservice territories pursuant to certain franchises, licenses, statutory service areas, easements and other rights or permissionsgranted by state legislatures, cities or municipalities or other entities.
Competition p
There are currently no other electric public utilities operating within the electric service areas of LKE. From time to time, bills are introduced into the Kentucky General Assembly which seek to authorize, promote or mandate increased distributed generation, customer choice or other developments. Neither the Kentucky General Assembly nor the KPSC has adopted or approved a plan or timetable for retail electric industry competition in Kentucky. The nature or timing of legislative or regulatory actions, if any, regarding industry restructuring and their impact on LKE, which may be significant, cannot currentlrr y

11
be predicted. Virginia, formerly a deregulated jurisdiction, has enacted legislation that implemented a hybrid model of cost-based regulation. KU's operations in Virginia have been and remain regulated.
Alternative energy sources such as electricity, oil, propane and other fuels indirectly impact LG&E's natural gas revenues.Marketers may also compete to sell natural gas to certain large end-users. LG&E's natural gas tariffs include gas price pass-through mechanisms relating to its sale of natural gas as a commodity; therefore, customer natural gas purchases from alternative suppliers do not generally impact LG&E's profitability. Some large industrial and commercial customers, however,may physically bypass LG&E's facilities and seek delivery service directly from interstate pipelines or other natural gasdistribution systems.
Power Supplypp y
At December 31, 2017, LKE owned, controlled or had a minority ownership interest in generating capacity of 8,017 MW, of which 2,920 MW related to LG&E and 5,097 MW related to KU, in Kentucky, Indiana, and Ohio.
The system capacity of LKE's owned or controlled generation is based upon a number of factors, including the operatingnexperience and physical condition of the units, and may be revised periodically to reflect changes in circumstances.
During 2017, LKE's power plants generated the following amounts of electricity.
GWh Fuel Source LKE LG&E KUCoal (a) 28,519 12,161 16,358Gas 4,625 1,105 3,520Hydro 337 278 59Solar 18 7 11Total (b) 33,499 13,551 19,948
(a) Includes 794 GWh of power generated by and purchased from OVEC for LKE, 549 GWh for LG&E and 245 GWh for KU.(b) This generation represents a 3.7% decrease for LKE, a 0.3% increase for LG&E and a 6.3% decrease for KU from 2016 output.
The majority of LG&E's and KU's generated electricity was used to supply their retail and KU's municipal customer base. d
LG&E and KU jointly dispatch their generation units with the lowest cost generation used to serve their retail and municipal customers. When LG&E has excess generation capacity after serving its own retail customers and its generation cost is lower than that of KU, KU purchases electricity from LG&E and vice versa.
As a result of environmental requirements and energy efficiency measures, KU anticipates retiring two older coal-fired units atthe E.W. Brown plant in 2019 with a combined summer rating capacity of 272 MW.
In 2016, LG&E and KU completed construction activities and placed into commercial operation a 10 MW solar generatingfacility at the E.W. Brown generating site. Additionally, LG&E and KU received approval from the KPSC to develop a 4 MW solar share facility to service a solar share program. The solar share program is an optional, voluntary program that allowscustomers to subscribe capacity in the solar share facility. Construction is expected to begin, in 500-kilowatt phases, when subscription is complete. As of December 31, 2017, LG&E and KU have not yet constructed the first solar share facility and are actively marketing the program and continue to receive interest from customers.
In 2015, KU retired two coal-fired units, with a combined capacity of 161 MW, at the Green River plant. Additionally, LG&Eretired three coal-fired units with a combined capacity of 563 MW, at the Cane Run plant.
Fuel Supply pp y
Coal and natural gas will continue to be the predominant fuel used by LG&E and KU for generation for the foreseeable future. Natural gas used for generation is primarily purchased using contractual arrangements separate from LG&E's natural gasdistribution operations. Natural gas and oil will continue to be used for intermediate and peaking capacity and flame stabilization in coal-fired boilers.
Fuel inventory is maintained at levels estimated to be necessary to avoid operational disruptions at coal-fired generating unitaa s. Reliability of coal deliveries can be affected from time to time by a number of factorsd including fluctuations in demand, coalmine production issues and other supplier or transporter r operating difficulties.

12
LG&E and KU have entered into coal supply agreements with various suppliers for coal deliveries through 2023 and augment their coal supply agreements with spot market purchases, as needed.
For their existing units, LG&E and KU expect for the foreseeable future to purchase most of their coal from western Kentucky,southern Indiana and southern Illinois. LG&E and KU continue to purchase certain quantities of ultra-low sulfur content coalfrom Wyoming for blending at Trimble County Unit 2. Coal is delivered to the generating plants primarily by barge and rail.
To enhance the reliability of natural gas supply, LG&E and KU have secured firm long-term pipeline transport capacity withcontracts of various durations from 2019 to 2024 on the interstate pipeline serving Cane Run Unit 7. This pipeline also servesthe six simple cycle combustion turbine units located at the Trimble County site as well as four other simple cycle units at the Cane Run and Paddy's Run sites. LG&E has also secured long-term firm pipeline transport capacity on an interstate pipeline for the summer months through October 2018 to serve an additional simple cycle gas turbine operated under a tolling agreement that ends April 30, 2019. For the seven simple cycle combustion turbines at the E.W. Brown facility, no firm long-term pipelinetransport capacity has been purchased due to the facility being interconnected to two pipelines and some of the units having dual fuel capability.
LG&E and KU have firm contracts for a portion of the natural gas fuel for Cane Run Unit 7 for delivery in future months. The bulk of the natural gas fuel remains purchased on the spot market.
(PPL, LKE and LG&E)
Natural Gas Distribution Supplypp y
Five underground natural gas storage fields, with a current working natural gas capacity of approximately 15 billion cubic feet(Bcf), are used in providing natural gas service to LG&E's firm sales customers. By using natural gas storage facilities, LG&E avoids the costs typically associated with more expensive pipeline transportation capacity to serve peak winter heating loads. Natural gas is stored during the summer season for withdrawal during the following winter heating season. Without this storagecapacity, LG&E would be required to purchase additional natural gas and pipeline transportation services during winter monthswhen customer demand increases and the prices for natural gas supply and transportation services can be expected to be at theirhighest. At December 31, 2017, LG&E had 12 Bcf of natural gas stored underground with a carrying value of $43 million.
LG&E has a portfolio of supply arrangements of varying durations and terms that provide competitively priced natural gas designed to meet its firm sales obligations. These natural gas supply arrangements include pricing provisions that are market-responsive. In tandem with pipeline transportation services, these natural gas supplies provide the reliability and flexibilitynecessary to serve LG&E's natural gas customers.
LG&E purchases natural gas supply transportation services from two pipelines. LG&E has contracts with one pipeline that aresubject to termination by LG&E between 2020 and 2023. Total winter season capacity under these contracts is 184,900 MMBtu/day and summer season capacity is 60,000 MMBtu/day. With this same pipeline, LG&E also has another contract for hpipeline capacity through 2026 in the amount of 60,000 MMBtu/day during both the winter and summer seasons. LG&E has asingle contract with a second pipeline with a total capacity of 20,000 MMBtu/day during both the winter and summer seasons that expires in 2023.
LG&E expects to purchase natural gas supplies for its gas distribution operations from onshortt e producing regions in South Texas, East Texas, North Louisiana and Arkansas, as well as gas originating in the Marcellus and Utica production areas.
(PPL, LKE, LG&E and KU)
Transmission
LG&E and KU contract with the Tennessee Valley Authority to act as their transmission reliability coordinator and contract with TranServ International, Inc. to act as their independent transmission organization.
Rates
LG&E is subject to the jurisdiction of the KPSC and the FERC, and KU is subject to the jurisdiction of the KPSC, the FERC and the VSCC. LG&E and KU operate under a FERC-approved open access transmission tariff.

13
LG&E's and KU's Kentucky base rates are calculated based on a return on capitalization (common equity, long-term debt and short-term debt) including adjustments for certain net investments and costs recovered separately through other means. As such, LG&E and KU generally earn a return on regulatory assets in Kentucky.
KU's Virginia base rates are calculated based on a return on rate base (net utility plant plus working capital less deferred taxes aaand miscellaneous deductions). As all regulatory assets and liabilities, except the leva elized fuel factor, are excluded from the return on rate base utilized in the calculation of Virginia base rates, no return is earned on the related assets.
KU's rates to 10 municipal customers for wholesale power requirements are calculated based on annual updates to a formula rate that utilizes a return on rate base (net utility plant plus working capital less deferred taxes and miscellaneous deductions).As all regulatory assets and liabilities, except regulatory assets recorded for AROs related to CCR impoundments, are excluded from the return on rate base utilized in the development of municipal rates, no return is earned on the related assets. In April2014, nine municipalities submitted notices of termination, under the notice period provisions, to cease taking power under thewholesale requirements contracts. Such terminations are to be effective in 2019, except in the case of one municipality that terminated service in 2017.
Rate Case Proceedings g
(PPL, LKE, LG&E and KU)
In November 2016, LG&E and KU filed requests with the KPSC for increases in annual base electricity and gas rates. LG&E'sand KU's applications included requests for CPCNs for implementing an Advanced Metering System program and a Distribution Automation program.
In April and May 2017, LG&E and KU, along with all intervening parties to the proceeding, filed with the KPSC, stipulation and recommendation agreements (stipulations) resolving all issues with the parties. Among other things, the proposed stipulations provided for increases in annual revenue requirements associated with LG&E base electricity rates of $59 million, LG&E base gas rates of $8 million and KU base electricity rates of $55 million, reflecting a return on equity of 9.75%, thewithdrawal of LG&E's and KU's request for a CPCN for the Advanced Metering System and other changes to the revenue requirements, which dealt primarily with the timing of cost recovery, including depreciation rates.
In June 2017, the KPSC issued orders approving, with certain modifications, the proposed stipulations filed in April and May 2017. The orders modified the stipulations to provide for increases in annual revenue requirements associated with LG&E baseelectricity rates of $57 million, LG&E base gas rates of $7 million, KU base electricity rates of $52 million and incorporated an authorized return on equity of 9.7%. Consistent with the stipulations, the orders approved LG&E's and KU's request for implementing a Distribution Automation program and their withdrawal of a request for a CPCN for the Advanced MeteringSystem program. The orders also approved new depreciation rates for LG&E and KU that resulted in higher depreciation of approximately $15 million ($4 million for LG&E and $11 million for KU) in 2017, exclusive of net additions to PP&E. Theorders resulted in base electricity and gas rate increases of 5.2% and 2.1% at LG&E and a base electricity rate increase of 3.2% at KU. The new base rates and all elements of the orders became effective July 1, 2017. On June 23, 2017, the KPSC issued orders establishing an authorized return on equity of 9.7% for all of LG&E's and KU's existing approved ECR plans and projects, replacing the prior authorized return on equity levels of 9.8% for CCR projects and 10% for all other ECR approved projects, effective with bills issued in August 2017. The annual impact of the new authorized return for ECR projects is not expected to be significant.
(LKE and KU)
On September 29, 2017, KU filed a request seeking approval from the VSCC to increase annual Virginia base electricityrevenue by $7 million, representing an increase of 10.4%. KU's request is based on an authorized 10.42% return on equity.Subject to regulatory review and approval, new rates would become effective July 1, 2018.

14
(PPL, LKE and KU)
In October 2016, KU filed a request with the FERC to modify its formula rates to provide for the recovery of CCR impoundment closure costs from its departing municipal customers. In December 2016, the FERC accepted the revised rateschedules providing recovery of the costs effective December 31, 2016, subject to refund, and established limited hearing and settlement judge procedures relating to determining the applicable amortization period. In March 2017, the parties reached asettlement in principle regarding a suitable amortization period. In June 2017, a FERC judge issued an order implementing thesettlement's rates on an interim basis, effective July 1, 2017. In August 2017, the FERC issued a final order approving the settlement.
TCJA Impact on LG&E and KU Rates p
(PPL, LKE, LG&E and KU)
On December 21, 2017, Kentucky Industrial Utility Customers, Inc. submitted a complaint with the KPSC against LG&E and KU, as well as other utility companies in Kentucky, alleging that their respective rates would no longer be fair, just and reasonable following the enactment of the TCJA reducing the federal corporate tax rate from 35% to 21%. The complaint requested the KPSC to issue an order requiring LG&E and KU to begin deferring, as of January 1, 2018, the revenuerequirement effect of all income tax expense savings resulting from the federal corporate income tax reduction, including theamortization of excess deferred income taxes by recording those savings in a regulatory liability account and establishing a process by which the federal corporate income tax savings will be passed back to customers.
On December 27, 2017, as a result of the complaint, the KPSC ordered LG&E and KU to satisfy or address the complaint and commence recording regulatory liabilities to reflect the reduction in the federal corporate tax rate to 21% and the associated savings in excess deferred taxes on an interim basis until utility rates are adjusted to reflecttt the federal tax savings. t
On January 8, 2018, LG&E and KU responded to the complaint, denying certain claims in the complaint but concurring that theTCJA will result in savings for their customers. LG&E and KU have stated in their responses that the companies have recorded regulatory liabilities as of December 31, 2017 to reflect the reduction in the federal corporate tax rate and the associated savings in excess deferred taxes and will make changes to their ECR, DSM and LG&E's GLT rate mechanisms to beginproviding the applicable savings to customers. LG&E and KU also offered to establish a new bill credit mechanism effective with the April 2018 billing cycle to begin distributing the tax savings associated with base rates to customers. d
On January 29, 2018, LG&E and KU reached a settlement agreement to commence returning savings related to the TCJA to their customers. The savings will be distributed through their ECR, DSM and LG&E's GLT rate mechanisms beginning inMarch 2018 and through a new bill credit mechanism from April 1, 2018 through April 30, 2019. The estimated impact of therate reduction represents approximately $91 million in KU electricity revenues, $69 million in LG&E electricity revenues and $17 million in LG&E gas revenues for the period January 2018 through April 2019. Ongoing tax savings are expected to alsobe addressed in LG&E's and KU's next Kentucky base rate case. LG&E and KU have indicated their intent to file anapplication for base rate changes during 2018 to be effective during spring 2019. The settlement agreement is subject to reviewtand approval by the KPSC. An order in the proceeding may occur during the first quarter of 2018.
Additionally, on January 8, 2018, the VSCC ordered KU, as well as other utilities in Virginia, to accrue regulatory liabilitiesreflecting the Virginia jurisdictional revenue requirement impacts of the reduced federal corporate tax rate.
The FERC has not issued any guidance on the effect on rates of the TCJA.
LG&E and KU cannot predict the outcome of these proceedings.
See Note 6 to the Financial Statements for additional information on cost recovery mechanisms.

15
• Pennsylvania Regulated Segment (PPL)y g g
Consists of PPL Electric, a regulated public utility engaged in the distribution and transmission of electricity.
(PPL and PPL Electric)
PPL Electric delivers electricity to approximately 1.4 million customers in a 10,000-square mile territory in 29 counties of eastern and central Pennsylvania. PPL Electric also provides electricity supply to retail customers in this area as a PLR underthe Customer Choice Act.
Details of revenues, in millions, by customer class for the years ended December 31 are shown below.
2017 2016 2015
Revenue % of
Revenue Revenue % of
Revenue Revenue% of
Revenue Distribution
Residential $ 1,351 62 $ 1,327 61 $ 1,338 63 Industrial 44 2 42 2 58 3Commercial 349 16 338 16 377 18 Other (a) (36) (2 ) (4) — (44) (2 )
Transmission 487 22 453 21 395 18 Total $ 2,195 100 $ 2,156 100 $ 2,124 100
(a) Includes regulatory over- or under-recovery reconciliation mechanisms, pole attachment revenues and street lighting, offset by contra revenue associated with the network integration transmission service expense.
Franchise, Licenses and Other Regulations , g
PPL Electric is authorized to provide electric public utility service throughout its service area as a result of grants by theCommonwealth of Pennsylvania in corporate charters to PPL Electric and companies, which it has succeeded and as a result of certification by the PUC. PPL Electric is granted the right to enter the streets and highways by the Commonwealthy subject tocertain conditions. In general, such conditions have been met by ordinance, resolution, permit, acquiescence or other action byyan appropriate local political subdivision or agency of the Commonwealth.
Competition p
Pursuant to authorizations from the Commonwealth of Pennsylvania and the PUC, PPL Electric operates a regulated distribution monopoly in its service area. Accordingly, PPL Electric does not face competition in its electricity distributionbusiness. Pursuant to the Customer Choice Act, generation of electricity is a competitive business in Pennsylvania, and PPL Electric does not own or operate any generation facilities.
The PPL Electric transmission business, operating under a FERC-approved PJM Open Access Transmission Tariff, is subject to competition pursuant to FERC Order 1000 from entities that are not incumbent PJM transmission owt ners with respect to theconstruction and ownership of transmission facilities within PJM.
Rates and Regulation g
Transmission
PPL Electric's transmission facilities are within PJM, which operates the electricity transmission network and electric energymarket in the Mid-Atlantic and Midwest regions of the U.S.
PJM serves as a FERC-approved Regional Transmission Operator (RTO) to promote greater participation and competition in the region it serves. In addition to operating the electricity transmission network, PJM also administers regional markets for energy, capacity and ancillary services. A primary objective of any RTO is to separate the operation of, and access to, the transmission grid from market participants that buy or sell electricity in the same markets. Electric utilities continue to own thentransmission assets and to receive their share of transmission revenues, but the RTO directs the control and operation of thetransmission facilities. Certain types of transmission investment are subject to competitive processes outlined in the PJM tariff.

16
As a transmission owner, PPL Electric's transmission revenues are recovered through PJM and billed in accordance with aFERC-approved Open Access Transmission Tariff that allows recovery of incurred transmission costs, a return on transmission-related plant and an automatic annual update based on a formula-based rate recovery mechanism. Under this formula, rates areput into effect in June of each year based upon prior year actual expenditures and current year forecasted capital additions.Rates are then adjusted the following year to reflect actual annual expenses and capital additions, as reported in PPL Electric’sannual FERC Form 1, filed under the FERC’s Uniform System of Accounts. Any difference between the revenue requirement in effect for the prior year and actual expenditures incurred for that year is recorded as a regulatory asset or regulatory liability. aAny change in the prior year PPL zonal peak load billing factor applied on January 1st of each year, will result in an increase or decrease in revenue until the next annual rate update goes into effect on June 1st of that same year.
As a PLR, PPL Electric also purchases transmission services from PJM. See "PLR" below.
See Note 6 to the Financial Statements for additional information on rate mechanisms.
Distribution
PPL Electric's distribution base rates are calculated based on a return on rate base (net utility plant plus a cash working capitalallowance less plant-related deferred taxes and other miscellaneous additions and deductions). All regulatory assets and liabilities are excluded from the return on rate base; therefore, no return is earned on the related assets unless specificallyprovided for by the PUC. Currently, PPL Electric's Smart Meter rider and the DSIC are the only riders authorized to earn a return. Certain operating expenses are also included in PPL Electric's distribution base rates including wages and benefits, other ttoperation and maintenance expenses, depreciation and taxes.
Pennsylvania's Alternative Energy Portfolio Standard (AEPS) requires electricity distribution companies and electricitygeneration suppliers to obtain from alternative energy resources a portion of the electricity sold to retail customers inPennsylvania. Under the default service procurement plans approved by the PUC, PPL Electric purchases all of the alternativeenergy generation supply it needs to comply with the AEPS.
Act 129 created an energy efficiency and conservation program, a demand side management program, smart metering technology requirements, new PLR generation supply procurement rules, remedies for market misconduct and changes to the existing AEPS.
Act 11 authorizes the PUC to approve two specific ratemaking mechanisms: the use of a fully projected future test year in baserate proceedings and, subject to certain conditions, the use of a DSIC. Such alternative ratemaking procedures and mechanismsprovide opportunity for accelerated cost-recovery and, therefore, are important to PPL Electric as it is in a period of significant capital investment to maintain and enhance the reliability of its delivery system, including the replacement of aging assets. PPL Electric has utilized the fully projected future test year mechanism in its 2015 base rate proceeding. PPL has had the ability to utilize the DSIC recovery mechanism since July 2013.
See "Regulatory Matters - Pennsylvania Activities" in Note 6 to the Financial Statements for additional information regarding Act 129 and other legislative and regulatory impacts.
PLR
The Customer Choice Act requires Electric Distribution Companies (EDCs), including PPL Electric, or an alternative supplier approved by the PUC to act as a PLR of electricity supply for customers who do not choose to shop for supply with a competitive supplier and provides that electricity supply costs will be recovered by the PLR pursuant to PUC regulations. In2017, the following average percentages of PPL Electric's customer load were provided by competitive suppliers: 46% of residential, 85% of small commercial and industrial and 98% of large commercial and industrial customers. The PUC continues ttto favor expanding the competitive market for electricity. See "Regulatory Matters - Pennsylvania Activities - Act 129" inNote 6 to the Financial Statements for additional information.
PPL Electric's cost of electricity generation is based on a competitive solicitation process. The PUC approved PPL Electric's default service plan for the period June 2015 through May 2017, which included 4 solicitations for electricity supply held semiannually in April and October. The PUC approved PPL Electric's default service plan for the period June 2017 throughMay 2021, which includes a total of 8 solicitations for electricity supply held semiannually in April and October. Pursuant toboth the current and future plans, PPL Electric contracts for all of the electricity supply for residential customers and commercial and industrial customers who elect to take that service from PPL Electric. These solicitations include a mix of 6-and 12-month fixed-price load-following contracts for residential and small commercial and industrial customers, and 12-

17
month real-time pricing contracts for large commercial and industrial customers to fulfill PPL Electric's obligation to provideLcustomer electricity supply as a PLR.
Numerous alternative suppliers have offered to provide generation supply in PPL Electric's service territory. Since the cost ofgeneration supply is a pass-through cost for PPL Electric, its financial results are not impacted if its customers purchaseelectricity supply from these alternative suppliers.
TCJA Impact on PPL Electric Ratesp
The PUC issued a Secretarial Letter on February 12, 2018 regarding the TCJA. The Commission is requesting comments from interested parties addressing whether the Commission should adjust current customer rates to reflect the reduced federal income tax expense and, if so, the appropriate negative surcharge or other methodology that would permit immediate adjustment to consumer rates, and whether the surcharge or other said methodology should provide that any refunds to customers due to reduced taxes be effective as of January 1, 2018. In addition, the Secretarial Letter requests certain Pennsylvania regulated utilities, including PPL Electric, to provide certain data related to the effect of the TCJA on PPL Electric’s income tax expense and rate base including whether any of the potential tax savings from the reduced federalcorporate tax rate can be used for purposes other than to reduce customer rates. PPL Electric’s responses are due to the PUC not later than March 9, 2018.
The FERC has not issued any guidance on the effect on rates of the TCJA.
(PPL)
• Corporate and Other p
PPL Services provides PPL subsidiaries with administrative, management and support services. The costs of these services are charged directly to the respective recipients for the services provided or indirectly charged to applicable recipients based on an naverage of the recipients' relative invested capital, operation and maintenance expenses and number of employees or a ratio of overall direct and indirect costs.
PPL Capital Funding, PPL's financing subsidiary, provides financing for the operations of PPL and certain subsidiaries. PPL'sgrowth in rate-regulated businesses provides the organization with an enhanced corporate level financing alternative, through PPL Capital Funding, that enables PPL to cost effectively support targeted credit profiles across all of PPL's rated companies.As a result, PPL plans to utilize PPL Capital Funding as a source of capital in future financings, in addition to continued direct financing by the operating companies.
Unlike PPL Services, PPL Capital Funding's costs are not generally charged to PPL subsidiaries. Costs are charged directly toPPL. However, PPL Capital Funding participated significantly in the finad ncing for the acquisitionsaa of LKE and WPD Midlands and certain associated financing costs were allocated to the Kentucky Regulated and U.K. Regulated segments. The associated financing costs, as well as the financing costs associated with prior issuances of certain other PPL Capital Funding securities,have been assigned to the appropriate segments for purposes of PPL management's assessment of segment performance. Thefinancing costs associated primarily with PPL Capital Funding's securities issuances beginning in 2013, with certainexceptions, have not been directly assigned or allocated to any segment.
Spinoff of PPL Energy Supplyp gy pp y
In June 2014, PPL and PPL Energy Supply executed definitive agreements with affiliates of Riverstone to spin off PPL Energy Supply and immediately combine it with Riverstone's competitive power generation businesses to form a new, stand-alone,publicly traded company named Talen Energy. On April 29, 2015, PPL's Board of Directors declared the June 1, 2015distribution to PPL's shareowners of record on May 20, 2015 of a newly formed entity, Holdco, which at closing owned all of yythe membership interests of PPL Energy Supply and all of the common stock of Talen Energy.
Immediately following the spinoff on June 1, 2015, Holdco merged with a special purpose subsidiary of Talen Energy, withHoldco continuing as the surviving company to the merger and as a wholly owned subsidiary of Talen Energy and the sole owner of PPL Energy Supply. Substantially contemporaneous with the spinoff and mey rger, RJS Power was contributed by itsowners to become a subsidiary of Talen Energy. PPL's shareowners received approximately 0.1249 shares of Talen Energycommon stock for each share of PPL common stock they owned on May 20, 2015. Following completion of these transactions,PPL shareowners owned 65% of Talen Energy and affiliates of Riverstone owned 35%. The spf inoff had no effect on the

18
number of PPL common shares owned by PPL shareowners or the number of shares of PPL common stock outstanding. Thetransaction is intended to be tax-free to PPL and its shareowners for U.S. federal income tax purposes.
PPL has no continuing ownership interest in or control of Talen Energy and Talen Energy Supply (formerly PPL Energy fSupply).
See Note 8 to the Financial Statements for additional information.
(All Registrants)
CYBERSECURITY MANAGEMENT
The Registrants and their subsidiaries are subject to risks from cyber-attacks that have the potential to cause significant interruptions to the operation of their businesses. The frequency of these attempted intrusions has increased in recent years and aathe sources, motivations and techniques of attack continue to evolve and change rapidly. PPL has undertaken a variety of actions to monitor and address cyber-related risks. Cybersecurity and the effectiveness of PPL’s cybersecurity strategy are regular topics of discussion at Board and Audit Committee meetings. PPL's strategy for managing cyber-related risks is risk-based and, where appropriate, integrated within the company's enterprise risk management processes. PPL’s Chief InformationSecurity Officer (CISO), who reports directly to the Chief Executive Officer, leads a dedicated cybersecurity team and is responsible for the design, implementation, and execution of cyber-risk management strategy. Among other things, the CISOyand the cybersecurity team actively monitor the Registrants' systems, regularly review policies, compliance, regulations and best practices, perform penetration testing, lead response exercises and internal campaigns, and provide training and communication across the organization to strengthen secure behavior. The cybersecurity team also routinely participates inindustry-wide programs to further information sharing, intelligence gathering, and unityn of effort in responding to potential oy r actual attacks. In addition to these enterprise-wide initiatives, PPL’s Kentucky and Pennsylvania operations are subject toextensive and rigorous mandatory cybersecurity requirements that are developed and enforced by NERC and approved by FERC to protect grid security and reliability. Finally, PPL purchases insurance to protect against a wide range of costs that could be incurred in connection with cyber-related incidents. There can be no assurance, however, that these efforts will beeffective to prevent interruption of services or other damage to the Registrants' businesses or operations or that PPL's insurance aacoverage will cover all costs incurred in connection with any cyber-related incident.

19
SELECTED FINANCIAL AND OPERATING DATA
PPL Corporation (a) (b) 2017 2016 2015 2014 2013
Income Items (in millions)
Operating revenues $ 7,447 $ 7,517 $ 7,669 $ 7,852 $ 7,263
Operating income 3,068 3,048 2,831 2,867 2,561Income from continuing operations after income taxes attributable to PPL shareowners 1,128 1,902 1,603 1,437 1,368Income (loss) from discontinued operations (net of income taxes) (f) — — (921) 300 (238) NNet income attributable to PPL shareowners (f) 1,128 1,902 682 1,737 1,130
Balance Sheet Items (in millions) Total assets (d) 41,479 38,315 39,301 48,606 45,889Short-term debt (d) 1,080 923 916 836 701Long-term debt (d) 20,195 18,326 19,048 18,054 18,269Common equity (d) 10,761 9,899 9,919 13,628 12,466Total capitalization (d) 32,036 29,148 29,883 32,518 31,436
Financial RatiosReturn on common equity - % (d)(f) 10.9 19.2 5.8 13.0 9.8Ratio of earnings to fixed charges (c) 3.1 3.8 2.8 2.8 2.4
Common Stock DataNumber of shares outstanding - Basic (in thousands)
Year-end 693,398 679,731 673,857 665,849 630,321Weighted-average 685,240 677,592 669,814 653,504 608,983
Income from continuing operations after income taxes available to PPL common shareowners - Basic EPS $ 1.64 $ 2.80 $ 2.38 $ 2.19 $ 2.24Income from continuing operations after income taxes available to PPL common shareowners - Diluted EPS $ 1.64 $ 2.79 $ 2.37 $ 2.16 $ 2.12NNet income available to PPL common shareowners - Basic EPS $ 1.64 $ 2.80 $ 1.01 $ 2.64 $ 1.85Net income available to PPL common shareowners - Diluted EPS $ 1.64 $ 2.79 $ 1.01 $ 2.61 $ 1.76Dividends declared per share of common stock $ 1.58 $ 1.52 $ 1.50 $ 1.49 $ 1.47Book value per share (d) $ 15.52 $ 14.56 $ 14.72 $ 20.47 $ 19.78Market price per share $ 30.95 $ 34.05 $ 34.13 $ 36.33 $ 30.09Dividend payout ratio - % (e)(f) 96 55 149 57 84Dividend yield - % (g) 5.1 4.5 4.4 4.1 4.9Price earnings ratio (e)(f)(g) 18.9 12.2 33.8 13.9 17.1
Sales Data - GWh Domestic - Electric energy supplied - wholesale 2,084 2,177 2,241 2,365 2,383Domestic - Electric energy delivered - retail 65,751 67,474 67,798 68,569 67,848U.K. - Electric energy delivered 74,317 74,728 75,907 75,813 78,219
(a) The earnings each year were affected by several items that management considers special. See "Results of Operations - Segment Earnings" in "Combined Management's Discussion and Analysis of Financial Condition and Results of Operations" for a description of special items in 2017, 2016 and 2015. The earnings for 2015, 2014 and 2013 were also affected by the spinoff of PPL Energy Supply and the sale of the Montana hydroelectric generating facilities.See Note 8 to the Financial Statements for a discussion of discontinued operations in 2015.
(b) See Notes 1, 6 and 13 to the Financial Statements for a discussion of uncertainties that could affect PPL's future financial condition. (c) Computed using earnings and fixed charges of PPL and its subsidiaries. Fixed charges consist of interest on short and long-term debt, amortization of debt
discount, expense and premium-net, other interest charges, the estimated interest component of operating rentals and preferred securities distributions of subsidiaries.
(d) 2015 reflects the impact of the spinoff of PPL Energy Supply and a $3.2 billion related dividend. (e) Based on diluted EPS.(f) 2015 includes an $879 million loss on the spinoff of PPL Energy Supply, reflecting the difference between PPL's recorded value for the Supply segment
and the estimated fair value determined in accordance with GAAP. 2015 also includes five months of Supply segment earnings, compared to 12 months in2014 and 2013.
(g) Based on year-end market prices.

20
Combined Management's Discussion and Analysis of Financial Condition and Results of Operationsg y p
(All Registrants)
The following should be read in conjunction with the Registrants' Consolidated Financial Statements and the accompanying Notes. Capitalized terms and abbreviations are defined in the glossary. Dollars are in millions, except per share data, unlessotherwise noted.
"Management's Discussion and Analysis of Financial Condition and Results of Operations" includes the following information:
• "Overview" provides a description of each Registrant's business strategy and a discussion of important financial and operational developments.
• "Results of Operations" for all Registrants includes a "Statement of Income Analysis," which discusses significant changes in principal line items on the Statements of Income, comparing 2017 with 2016 and 2016 with 2015. For PPL, "Results of Operations" also includes "Segment Earnings" and "Margins" which provide a detailed analysis of earnings by reportable segment. These discussions include non-GAAP financial measures, including "Earnings from Ongoing Operations" and "Margins" and provide explanations of the non-GAAP financial measures and areconciliation of the non-GAAP financial measures to the most comparable GAAP measure. The "2018 Outlook"discussion identifies key factors expected to impact 2018 earnings.
• "Financial Condition - Liquidity and Capital Resources" provides an analysis of the Registrants' liquidity positions and credit profiles. This section also includes a discussion of forecasted sources and uses of cash and rating agency actions.
• "Financial Condition - Risk Management" provides an explanation of the Registrants' risk management programsrelating to market and credit risk.
• "Application of Critical Accounting Policies" provides an overview of the accounting policies that are particularlyimportant to the results of operations and financial condition of the Registrants and that require their management to make significant estimates, assumptions and other judgments of inherently uncertain matters.
Overview
For a description of the Registrants and their businesses, see "Business."
Business Strategy
(All Registrants)
Following the June 1, 2015 spinoff of PPL Energy Supply, PPL completed its strategic transformation to a fully regulated business model operating seven diverse, high-performing utilities. These utilities are located in the U.K., Pennsylvania and Kentucky and each jurisdiction has different regulatory structures and customer classes. The Company believes this diverseportfolio provides strong earnings and dividend growth potential that will create significant value for its shareowners and positions PPL well for continued growth and success.
PPL's businesses of WPD, PPL Electric, LG&E and KU plan to achieve growth by providing efficient, reliable and safe operations and strong customer service, maintaining constructive regulatory relationships and achieving timely recovery of costs. These businesses are expected to achieve strong, long-term growth in rate base in the U.S. and aa RAV in the U.K., driven by planned significant capital expenditures to maintain existing assets and improve system reliability and, for LKE, LG&E and KU, to comply with federal and state environmental regulations related to coal-fired electricity generation facilities.Additionally, significant transmission rate base growth is expected through at least 2020 at PPL Electric.
For the U.S. businesses, our strategy is to recover capital project costs efficiently through various rate-making mechanisms,including periodic base rate case proceedings using forward test years, annual FERC formula rate mechanisms and other regulatory agency-approved recovery mechanisms designed to limit regulatory lag. In Kentucky, the KPSC has adopted a series of regulatory mechanisms (ECR, DSM, GLT, fuel adjustment clause, gas supply clause and recovery on construction work-in-progress) that reduce regulatory lag and provide timely recovery of and return on, as appropriate, prudently incurred costs. Inaddition, the KPSC requires a utility to obtain a CPCN prior to constructing a facility, unless the construction is an ordinary

21
extension of existing facilities in the usual course of business or does not involve sufficient capital outlay to materially affect ffthe utility's financial condition. Although such KPSC proceedings do not directly address cost recovery issues, the KPSC, in awarding a CPCN, concludes that the public convenience and necessity require the construction of the facility on the basis thatthe facility is the lowest reasonable cost alternative to address the need. In Pennsylvania, the FERC transmission formula rate,DSIC mechanism, Smart Meter Rider and other recovery mechanisms are in place to reduce regulatory lag and provide for timely recovery of and a return on, as appropriate, prudently incurred costs.
Rate base growth in the domestic utilities is expected to result in earnings growth for the foreseeable future. In 2017, earnings from the U.K. Regulated segment declined mainly due to the unfavorable impact of lower GBP to U.S. dollar exchange rates. RAV growth is expected in the U.K. Regulated segment during the RIIO-ED1 price control period which ends on March 31,2023 and to result in earnings growth in 2018 through at least 2020. See "Business - Segment Information - U.K. Regulated Segment" for additional information on RIIO-ED1.
To manage financing costs and access to credit markets, and to fund capital expenditures, a key objective of the Registrants isto maintain their investment grade credit ratings and adequate liquidity positions. In addition, the Registrants have financialn and operational risk management programs that, among other things, are designed to monitor and manage exposure to earnings and cash flow volatility, as applicable, related to changes in interest rates, foreign currency exchange rates and counterparty credit quality. To manage these risks, PPL generally uses contracts such as forwards, options and swaps. See "Financial Condition -Risk Management" below for further information.
Earnings generated by PPL's U.K. subsidiaries are subject to foreign currency translation risk. Because WPD's earnings represent such a significant portion of PPL's consolidated earnings, PPL enters into foreign currency contracts to economicallyhedge the value of the GBP versus the U.S. dollar. These hedges do not receive hedge accounting treatment under GAAP. See "Financial and Operational Developments - U.K. Membership in European Union" for additional discussion of the U.K. earnings hedging activity.
The U.K. subsidiaries also have currency exposure to the U.S. dollar to the extent of their U.S. dollar denominated debt. To manage these risks, PPL generally uses contracts such as forwards, options and cross-currency swaps that containcharacteristics of both interest rate and foreign currency exchange contracts.
As discussed above, a key component of this strategy is to maintain constructive relationships with regulators in alljurisdictions in which we operate (U.K., U.S. federal and state). This is supported by our strong culture of integrity and delivering on commitments to customers, regulators and shareowners, and a commitment to continue to improve our customer service, reliability and operational efficiency.
Financial and Operational Developments
U.S. Tax Reform (All Registrants)
On December 22, 2017, President Trump signed into law the TCJA. Substantially all of the provisions of the TCJA are effective for taxable years beginning after December 31, 2017. The TCJA includes significant changes to the taxation of corporations,including provisions specifically applicable to regulated public utilities. The more significant changes that impact theRegistrants are:
• The reduction in the U.S. federal corporate income tax rate from a top marginal rate of 35% to a flat rate of 21%, effectiveJanuary 1, 2018;
• The exclusion from U.S. federal taxable income of dividends from foreign subsidiaries and the associated "transition tax;" • Limitations on the tax deductibility of interest expense, with an exception to these limitations for regulated public utilities; • Full current year expensing of capital expenditures with an exception for regulated public utilities that qualify for the
exception to the interest expense limitation; and • The continuation of certain rate normalization requirements for accelerated depreciation benefits. For non-regulated
businesses, the TCJA generally provides for full expensing of property acquired after September 27, 2017.
As a result, PPL expects cash flows at its domestic utilities to decline as the benefit of the lower U.S. federal corporate income tax rate is passed through to its utility customers. In addition, as PPL is not a current federal tax payer because of available net operating loss carry forwards, there is no immediate corporate cash benefit associated with the lower tax rate. The lack of cash benefit resulted in degradation of PPL’s projected financial credit metrics. In an effort to maintain its current credit rating, PPL,

22
among other things, currently plans to issue about $1 billion of equity in 2018. This compares to PPL's actual 2017 equity issuances of $482 million.
The changes enacted by the TCJA were recorded as an adjustment to the Registrants' deferred tax provision, and have been dreflected in "Income Taxes" on the Statement of Income for the year ended December 31, 2017 as follows:
PPL PPL Electric LKE LG&E KUIncome tax expense (benefit) $ 321 $ (13) $ 112 $ — $ —
The components of these adjustments are discussed below:
Reduction of U.S. Federal Corporate Income Tax Ratep
At the date of enactment, the Registrants' deferred taxes were remeasured based upon the new U.S. federal corporate income tax rate of 21%. For PPL’s regulated entities, the changes in deferred taxes were, ind large part, recorded as an offset to either a regulatory asset or regulatory liability and will be reflected in future rates charged to customers. The rate reduction on non-regulated deferred tax assets and liabilities were recorded as an adjustment to the Registrants' deferred tax provision, and haveaabeen reflected in "Income Taxes" on the Statement of Income for the year ended December 31, 2017 as follows:
PPL PPL Electric LKE LG&E KUIncome tax expense (benefit) $ 220 $ (13) $ 112 $ — $ —
For PPL's U.S. regulated operations, reductions in accumulated deferred income tax balances due to the reduction in the U.S.federal corporate income tax rate to 21% under the provisions of the TCJA may result in amounts previously collected from utility customers for these deferred taxes to be refundable to such customers over a period of time. The TCJA includesprovisions that stipulate how these excess deferred taxes are to be passed back to customers for certain accelerated tax depreciation benefits. Potential refunds of other deferred taxes will be determined by the Registrants’ regulators. The BalanceSheets at December 31, 2017 reflect the increase to the Registrants' net regulatory liabilities as a result of the TCJA as follows:
PPL PPL Electric LKE LG&E KUNNet Increase in Regulatory Liabilities $ 2,185 $ 1,019 $ 1,166 $ 532 $ 634
Transition Tax
The TCJA included a conversion from a worldwide tax system to a territorial tax system, effective January 1, 2018. In the transition to the territorial regime, a one-time transition tax was imposed on PPL’s unrepatriated accumulated foreign earningsin 2017. These earnings were treated as a taxable deemed dividend to PPL of approximately $462 million. As the PPL consolidated U.S. group had a taxable loss for 2017, inclusive of the taxable deemed dividend, the foreign tax credits associatf ed with the deemed dividend were recorded as a deferred tax asset. However, it is expected that under the TCJA, the current and prior year foreign tax credit carryforwards will not be fully realizable.
As a result, the net deferred income tax expense impact of the deemed repatriation was $101 million and was recorded in"Income Taxes" on the PPL Statement of Income for the year ended December 31, 2017 and "Deferred tax liabilities" on thePPL Balance Sheet at December 31, 2017.
See Note 5 to the Financial Statements for additional information.
U.K. Membership in European Union (PPL)
On March 29, 2017, the U.K. formally notified the European Council of the European Union (EU) of its intent to withdrawfrom the EU, thereby commencing the two-year negotiation period to establish the terms of that withdrawal under Article 50 of the Lisbon Treaty. Article 50 specifies that if a member state decides to withdraw from the EU, it must notify the EuropeanCouncil of its intention to leave the EU, negotiate the terms of withdrawal and establish the legal grounds for its futurerelationship with the EU. Article 50 provides two years from the date of the Article 50 notification to conclude negotiations. Failure to complete negotiations within two years, unless negotiations are extended, would result in the treaties governing theEU no longer being applicable to the U.K. with there being no agreement in place governing the U.K.'s relationship with the EU. Under the terms of Article 50, negotiations can only be extended beyond two years if all of the 27 remaining EU statesagree to an extension. Any withdrawal agreement will need to be approved by both the European Council and the European

23
Parliament. There remains significant uncertainty as to the ultimate outcome of the withdrawal negotiations and the related impact on the U.K. economy and the GBP to U.S. dollar exchange rate.
PPL has executed hedges to mitigate the foreign exchange risk to the Company's U.K. earnings. As of February 20, 2018, PPL's foreign exchange exposure related to budgeted earnings is 100% hedged for the remainder of 2018 at an average rate of $1.34 per GBP, 100% hedged for 2019 at an average rate of $1.39 per GBP and 35% hedged for 2020 at an average rate of $1.46 per GBP.
PPL cannot predict either the short-term or long-term impact to foreign exchange rates or long-term impact on PPL's financial condition that may be experienced as a result of the actions taken by the U.K.d government to withdraw from the EU, althoughsuch impacts could be significant.
Regulatory Requirements
(All Registrants)((
The Registrants cannot predict the impact that future regulatory requirements may have on their financial condition or results of operations.
(PPL)
RIIO-2 Framework Review
In July 2017, Ofgem published an open letter commencing its RIIO-2 framework review, which covers all U.K. gas and electricity, transmission and distribution price controls. The purpose of this framework review is to build on lessons learned from the current price controls and to develop a framework that will be adaptable to meeting the needs of an evolving U.K. energy sector.
The letter sets out the context for the development of the next price controls, RIIO-2, and seeks views from stakeholders on the RIIO-2 framework. Responses to the open letter were published in September 2017 and will be n used to guide the full RIIO-2framework consultation which is expected to be published in March of 2018. The promulgation of a sector specific price controlswill begin with the gas and electricity transmission networks, with electricity distribution price control work scheduled to begin in 2020, at which time Ofgem plans to publish its RIIO-ED2 strategy consultation document.
The current electricity distribution price control, RIIO-ED1, continues through March 31, 2023 and will not be impacted by thisRIIO-2 consultation process. PPL cannot predict the outcome of this process or the long-term impact it or the final RIIO-ED2regulations will have on its financial condition or results of operations. a
RIIO-ED1 Mid-period Review
In December 2017, Ofgem initiated a consultation on a potential RIIO-ED1 mid-period review (MPR). The RIIO framework allows for a MPR of outputs halfway through the price control. Ofgem is consulting on three potential approaches:
• whether to implement a MPR as currently defined;• whether to implement a MPR with an extension for WPD rail electrification; and • whether to implement a MPR with a significant extension of scope to include financial parameters.
Ofgem’s initial assessment as set forth in its December 2017 consultation publication is that a MPR as currently defined under RIIO-ED1 is not required. In addition, Ofgem recognized that the rail electrification is outside the scope of the MPR and that implementing a MPR to include financial parameters could undermine the stability of the regulatory regime. The consultation, however, requests interested party comments on those conclusions. The period for submission of comments to the consultation uclosed on February 2, 2018. Formal consultation responses have been submitted by PPL and WPD. A decision on whether to aaproceed with a MPR is expected in spring 2018. If Ofgem decides to launch a MPR, it will consult on detailed proposals insummer 2018 and any associated changes to DNO licenses would be in place by April 1, 2019. Although, PPL cannot predict the outcome of the consultation process, a MPR is not expected to have a significant impact on PPL's financial condition or ffresults of operations.

24
(PPL, LKE, LG&E and KU)
The businesses of LKE, LG&E and KU are subject to extensive federal, state and local environmental laws, rules and regulations, including those pertaining to CCRs, GHG, ELGs and the Clean Power Plan. See Note 6, Note 13 and Note 19 tothe Financial Statements for a discussion of these significant environmental matters. These and other stringent environmentalrequirements led PPL, LKE, LG&E and KU to retire approximately 800 MW of coal-fired generating plants in Kentucky, primarily in 2015. Additionally, KU anticipates retiring two older coal-fired units at the E.W. Brown plant in 2019 with acombined summer rating capacity of 272 MW.
Also as a result of the environmental requirements discussed above, LKE projects $828 million ($335 million at LG&E and $493 million at KU) in environmental capital investment over the next five years. See PPL's "Financial Condition - Forecasted Uses of Cash - Capital Expenditures", Note 6 and Note 13 for additional information.
Rate Case Proceedings
(PPL, LKE, LG&E and KU)
In November 2016, LG&E and KU filed requests with the KPSC for increases in annual base electricity and gas rates. LG&E's and KU's applications included requests for CPCNs for implementing an Advanced Metering System program and aDistribution Automation program.
In April and May 2017, LG&E and KU, along with all intervening parties to the proceeding, filed with the KPSC, stipulation and recommendation agreements (stipulations) resolving all issues with the parties. Among other things, the proposed stipulations provided for increases in annual revenue requirements associated with LG&E base electricity rates of $59 million, LG&E base gas rates of $8 million and KU base electricity rates of $55 million, reflecting a return on equity of 9.75%, thewithdrawal of LG&E's and KU's request for a CPCN for the Advanced Metering System and other changes to the revenuerequirements, which dealt primarily with the timing of cost recovery, including depreciation rates.
In June 2017, the KPSC issued orders approving, with certain modifications, the proposed stipulations filed in April and May2017. The orders modified the stipulations to provide for increases in annual revenue requirements associated with LG&E base electricity rates of $57 million, LG&E base gas rates of $7 million, KU base electricity rates of $52 million and incorporated an authorized return on equity of 9.7%. Consistent with the stipulations, the orders approved LG&E's and KU's request for implementing a Distribution Automation program and their withdrawal of a request for a CPCN for the Advanced MeteringSystem program. The orders also approved new depreciation rates for LG&E and KU that resulted in higher depreciation of approximately $15 million ($4 million for LG&E and $11 million for KU) in 2017, exclusive of net additions to PP&E. Theorders resulted in base electricity and gas rate increases of 5.2% and 2.1% at LG&E and a base electricity rate increase of 3.2% at KU. The new base rates and all elements of the orders became effective July 1, 2017. On June 23, 2017, the KPSC issued orders establishing an authorized return on equity of 9.7% for all of LG&E's and KU's existing approved ECR plans and projects, replacing the prior authorized return on equity levels of 9.8% for CCR projects and 10% for all other ECR approved projects, effective with bills issued in August 2017. The annual impact of the new authorized return for ECR projects is not expected to be significant.
(LKE and KU)
On September 29, 2017, KU filed a request seeking approval from the VSCC to increase annual Virginia base electricityrevenue by $7 million, representing an increase of 10.4%. KU's request is based on an authorized 10.42% return on equity.Subject to regulatory review and approval, new rates would become effective July 1, 2018.
(PPL, LKE and KU)
In October 2016, KU filed a request with the FERC to modify its formula rates to provide for the recovery of CCR impoundment closure costs from its departing municipal customers. In December 2016, the FERC accepted the revised rateschedules providing recovery of the costs effective December 31, 2016, subject to refund, and established limited hearing and settlement judge procedures relating to determining the applicable amortization period. In March 2017, the parties reached asettlement in principle regarding a suitable amortization period. In June 2017, a FERC judge issued an order implementing thesettlement's rates on an interim basis, effective July 1, 2017. In August 2017, the FERC issued a final order approving the settlement.

25
TCJA Impact on LG&E and KU Rates (PPL, LKE, LG&E and KU)
On December 21, 2017, Kentucky Industrial Utility Customers, Inc. submitted a complaint with the KPSC against LG&E and KU, as well as other utility companies in Kentucky, alleging that their respective rates would no longer be fair, just and reasonable following the enactment of the TCJA reducing the federal corporate tax rate from 35% to 21%. The complaint requested the KPSC to issue an order requiring LG&E and KU to begin deferring, as of January 1, 2018, the revenuerequirement effect of all income tax expense savings resulting from the federal corporate income tax reduction, including the amortization of excess deferred income taxes by recording those savings in a regulatory liability account and establishing a process by which the federal corporate income tax savings will be passed back to customers.
On December 27, 2017, as a result of the complaint, the KPSC ordered LG&E and KU to satisfy or address the complaint and commence recording regulatory liabilities to reflect the reduction in the federal corporate tax rate to 21% and the associated savings in excess deferred taxes on an interim basis until utility rates are adjusted to reflecttt the federal tax savings. t
On January 8, 2018, LG&E and KU responded to the complaint, denying certain claims in the complaint but concurring that theTCJA will result in savings for their customers. LG&E and KU have stated in their responses that the companies have recorded regulatory liabilities as of December 31, 2017 to reflect the reduction in the federal corporate tax rate and the associated savings in excess deferred taxes and will make changes to their ECR, DSM and LG&E's GLT rate mechanisms to begin providing the applicable savings to customers. LG&E and KU also offered to establish a new bill credit mechanism effective with the April 2018 billing cycle to begin distributing the tax savings associated with base rates to customers. d
On January 29, 2018, LG&E and KU reached a settlement agreement to commence returning savings related to the TCJA to their customers. The savings will be distributed through their ECR, DSM and LG&E's GLT rate mechanisms beginning inMarch 2018 and through a new bill credit mechanism from April 1, 2018 through April 30, 2019. The estimated impact of therate reduction represents approximately $91 million in KU electricity revenues, $69 million in LG&E electricity revenues and $17 million in LG&E gas revenues for the period January 2018 through April 2019. Ongoing tax savings are expected to alsobe addressed in LG&E's and KU's next Kentucky base rate case. LG&E and KU have indicated their intent to file an application for base rate changes during 2018 to be effective during spring 2019. The settlement agreement is subject to reviewtand approval by the KPSC. An order in the proceeding may occur during the first quarter of 2018.
Additionally, on January 8, 2018, the VSCC ordered KU, as well as other utilities in Virginia, to accrue regulatory liabilitiesreflecting the Virginia jurisdictional revenue requirement impacts of the reduced federal corporate tax rate.
The FERC has not issued any guidance on the effect on rates of the TCJA.
LG&E and KU cannot predict the outcome of these proceedings.
TCJA Impact on PPL Electric Rates (PPL and PPL Electric)
The PUC issued a Secretarial Letter on February 12, 2018 regarding the TCJA. The Commission is requesting comments from interested parties addressing whether the Commission should adjust current customer rates to reflect the reduced federal income tax expense and, if so, the appropriate negative surcharge or other methodology that would permit immediate adjustment to consumer rates, and whether the surcharge or other said methodology should provide that any refunds to customers due to reduced taxes be effective as of January 1, 2018. In addition, the Secretarial Letter requests certain Pennsylvania regulated utilities, including PPL Electric, to provide certain data related L to the effect of the TCJA on PPL Electric’s income tax expense and rate base including whether any of the potential tax savings from the reduced federal corporate tax rate can be used for purposes other than to reduce customer rates. PPL Electric’s responses are due to the PUC not later than March 9, 2018.
The FERC has not issued any guidance on the effect on rates of the TCJA.
Discontinued Operations (PPL)
The operations of PPL's Supply segment prior to its June 1, 2015 spinoff are included in "Loss from Discontinued Operations(net of income taxes)" on the 2015 Statement of Income.

26
See Note 8 to the Financial Statements for additional information related to the spinoff of PPL Energy Supply, including thecomponents of Discontinued Operations.
Results of Operations p
(PPL)
The "Statement of Income Analysis" discussion below describes significant changes in principal line items on PPL's Statements of Income, comparing year-to-year changes. The "Segment Earnings" and "Margins" discussions for PPL provide a review of results by reportable segment. These discussions include non-GAAP financial measures, including "Earnings from OngoingOperations" and "Margins," and provide explanations of the non-GAAP financial measures and a reconciliation of thosemeasures to the most comparable GAAP measure. The "2018 Outlook" discussion identifies key factors expected to impact 2018 earnings.
Tables analyzing changes in amounts between periods within "Statement of Income Analysis," "Segment Earnings" and "Margins" are presented on a constant GBP to U.S. dollar exchange rate basis, where applicable, in order to isolate the impact of the change in the exchange rate on the item being explained. Results computed on a constant GBP to U.S. dollar exchange rate basis are calculated by translating current year results at the prior year weighted-average GBP to U.S. dollar exchange rate.
PPL: Statement of Income Analysis, Segment Earnings and Margins
Statement of Income Analysis y
Net income for the years ended December 31 includes the following results.
Change 2017 2016 2015 2017 vs. 2016 2016 vs. 2015
Operating Revenues $ 7,447 $ 7,517 $ 7,669 $ (70) $ (152) Operating Expenses
Operation 791 863 (32) (72)
Energy purchases 685 706 855 (21) (149) Other operation and maintenance 1,635 1,745 1,938 (110) (193)
Depreciation 1,008 926 883 82 43Taxes, other than income 292 301 299 (9) 2Total Operating Expenses 4,379 4,469 4,838 (90) (369)
Other Income (Expense) - net (255) 390 108 (645) 282Interest Expense 901 888 871 13 17Income Taxes 784 648 465 136 183Income from Continuing Operations After Income Taxes 1,128 1,902 1,603 (774) 299Loss from Discontinued Operations (net of income taxes) — — (921 ) — 921NNet Income $ 1,128 $ 1,902 $ 682 $ (774) $ 1,220

27
Operating Revenues
The increase (decrease) in operating revenues was due to:
2017 vs. 2016 2016 vs. 2015
Domestic:
PPL Electric Distribution price (a) $ 53 $ 126
PPL Electric Distribution volume (21) (9 )
PPL Electric PLR Revenue (b) (16) (135)
PPL Electric Transmission Formula Rate 34 59
LKE Base rates 58 68
LKE Volumes (c) (73) 1
LKE Fuel and other energy prices (d) 10 (81)
LKE ECR 10 39
Other (9) (17)
Total Domestic 46 51
U.K.:
Price 60 98
Volume (30) (36)
Foreign currency exchange rates (154) (255 )
Other 8 (10)
Total U.K. (116) (203 )
Total $ (70) $ (152)
(a) Distribution rider prices resulted in an increase of $47 million in 2017 compared with 2016. Distribution rate case effective January 1, 2016, resulted inan increase of $160 million in 2016 compared with 2015.
(b) Decrease in 2016 compared with 2015 was primarily due to lower energy purchase prices.(c) Decrease in 2017 compared with 2016 was primarily due to milder weather in 2017.(d) Decrease in 2016 compared with 2015 was due to lower recoveries of fuel and energy purchases due to lower commodity costs.
Fuel
Fuel decreased $32 million in 2017 compared with 2016 primarily due to a decrease in fuel usage driven by milder weather in 2017.
Fuel decreased $72 million in 2016 compared with 2015 primarily due to a decrease in market prices for coal and natural gas.
Energy Purchases
Energy purchases decreased $21 million in 2017 compared with 2016 primarily due to lower PLR prices of $17 million.
Energy purchases decreased $149 million in 2016 compared with 2015 primarily due to a $124 million decrease in PLR pricesand a $12 million decrease in PLR volumes at PPL Electric and a $9 million decrease in the market price of natural gas and a $5 million decrease in natural gas volumes at LKE.

28
Other Operation and Maintenance
The increase (decrease) in other operation and maintenance was due to:
2017 vs. 2016 2016 vs. 2015 Domestic:
LKE plant operations and maintenance (a) $ (2) $ (19) LKE pension expense 1 (12)PPL Electric payroll-related costs (12) (26) PPL Electric Act 129 9 (15)PPL Electric contractor related expenses (4) 7PPL Electric vegetation management (17) 4PPL Electric universal service programs (3) 3Storm costs 4 6Bad debts (17) (5) Stock compensation expense 5 (6) Third-party costs related to the spinoff of PPL Energy Supply (Note 8) — (13) Separation benefits related to the spinoff of PPL Energy Supply (Note 8) — (8) Corporate costs previously included in discontinued operations — 8Other (1) 18
U.K.: Pension expense (b) (67) (86)Foreign currency exchange rates (15) (33) Third-party engineering 6 (8) Other 3 (8)
Total $ (110) $ (193)
(a) Includes a $29 million reduction of costs in 2016 compared with 2015 due to the retirement of Cane Run and Green River coal units partially offset by $5million of additional costs for Cane Run Unit 7 plant operations.
(b) The decreases were primarily due to increases in expected returns on higher asset balances and lower interest costs.
Depreciation
The increase (decrease) in depreciation was due to:
2017 vs. 2016 2016 vs. 2015 Additions to PP&E, net $ 93 $ 76Foreign currency exchange rates (16) (27)Depreciation rates (a) 15 —Other (10) (6) Total $ 82 $ 43
(a) Higher depreciation rates were effective July 1, 2017 at LG&E and KU.
Taxes, Other Than Income
The increase (decrease) in taxes, other than income was due to:
2017 vs. 2016 2016 vs. 2015 State gross receipts tax (a) $ 3 $ 11Domestic property tax expense 4 4Domestic capital stock tax (6) —Foreign currency exchange rates (8) (15)Other (2) 2Total $ (9) $ 2
(a) 2016 increased compared with 2015 due to the settlement of a 2011 gross receipts tax audit that resulted in the reversal of $17 million of previously recognized reserves in 2015.

29
Other Income (Expense) - net
Other income (expense) - net decreased $645 million in 2017 compared with 2016 and increased $282 million in 2016compared with 2015 primarily due to changes in realized and unrealized gains (losses) on foreign currency contracts toeconomically hedge GBP denominated earnings from WPD.
Interest Expense
The increase (decrease) in interest expense was due to:
2017 vs. 2016 2016 vs. 2015 Long-term debt interest expense (a) $ 34 $ 63Short-term debt interest 7 2Hedging activities and ineffectiveness 1 (4) Foreign currency exchange rates (26) (43)Other (3) (1) Total $ 13 $ 17
(a) Interest expense increased in 2017 compared with 2016, primarily due to accretion on Index linked bonds at WPD and a debt issuance at PPL Electric inMay 2017.
Interest expense increased in 2016 compared with 2015 primarily due to debt issuances at WPD in November 2015, LG&E and KU in September 2015 and PPL Capital Funding in May 2016 as well as higher interest rates on bonds refinanced in September 2015 at LG&E and KU.
Income Taxes
The increase (decrease) in income taxes was due to:
2017 vs. 2016 2016 vs. 2015 Change in pre-tax income at current period tax rates $ (223) $ 184Valuation allowance adjustments (a) 20 (8) Federal and state tax reserve adjustments (b) — 22Foreign income tax return adjustments (10) 2U.S. income tax on foreign earnings net of foreign tax credit (c) 89 (50) Impact of U.K. Finance Acts (d) 33 42Deferred tax impact of U.S. tax reform (e) 220 —Stock-based compensation (f) 7 (10)Other — 1Total $ 136 $ 183
(a) During 2017, PPL recorded an increase in valuation allowances of $23 million primarily related to foreign tax credits recorded in 2016. The future utilization of these credits is expected to be lower as a result of the TCJA.
During 2017 and 2016, PPL recorded deferred income tax expense of $16 million and $13 million for valuation allowances primarily related to increased Pennsylvania net operating loss carryforwards expected to be unutilized.
During 2015, PPL recorded $24 million of deferred income tax expense related to deferred tax valuation allowances. PPL recorded state deferred incomedtax expense of $12 million primarily related to increased Pennsylvania net operating loss carryforwards expected to be unutilized and $12 million of federal deferred income tax expense primarily related to federal tax credit carryforwards that are expected to expire as a result of lower future taxable earnings due to the extension of bonus depreciation.
(b) During 2015, PPL recorded a $9 million income tax benefit related to a planned amendment of a prior period tax return and a $12 million income taxbenefit related to the settlement of an IRS audit for the tax years 1998-2011.
(c) During 2017, PPL recorded a federal income tax benefit of $35 million primarily attributable to UK pension contributions.
During 2017, PPL recorded deferred income tax expense of $83 million primarily related to enactment of the TCJA. The enacted tax law included aconversion from a worldwide tax system to a territorial tax system, effective January 1, 2018. In the transition to the territorial regime, a one-time transition tax was imposed on PPL’s unrepatriated accumulated foreign earnings in 2017. These earnings were treated as a taxable deemed dividend toPPL of approximately $462 million, including $205 million of foreign tax credits. As the PPL consolidated U.S. group had a taxable loss for 2017, ainclusive of the taxable deemed dividend, these credits were recorded as a deferred tax asset. However, it is expected that under the TCJA, only $83million of the $205 million of foreign tax credits will be realized in the carry forward period. Accordingly, a valuation allowance on the current year foreign tax credits in the amount of $122 million has been recorded to reflect the reduction in the future utilization of the credits. The foreign tax credits

30
associated with the deemed repatriation result in a gross carryforward and corresponding deferred tax asset of $205 million offset by a valuation ffallowance of $122 million.
PPL recorded lower income taxes in 2016 compared with 2015 primarily attributable to foreign tax credit carryforwards, arising from a decision to amend prior year tax returns to claim foreign tax credits rather than deduct foreign taxes. This decision was prompted by changes to the Company's most recent business plan.
(d) The U.K. Finance Act 2016, enacted in September 2016, reduced the U.K. statutory income tax rate effective April 1, 2020 from 18% to 17%. As a result,PPL reduced its net deferred tax liabilities and recognized a $42 million deferred income tax benefit during 2016.
The U.K. Finance Act 2015, enacted in November 2015, reduced the U.K. statutory income tax rate from 20% to 19% effective April 1, 2017 and from 19% to 18% effective April 1, 2020. As a result, PPL reduced its net deferred tax liabilities and recognized a $90 million deferred income tax benefit during 2015, related to both rate decreases.
(e) During 2017, PPL recorded deferred income tax expense for the U.S. federal corporate income tax rate reduction from 35% to 21% enacted by the TCJA. (f) During 2016, PPL recorded lower income tax expense related to the application of new stock-based compensation accounting guidance. See Note 1 to the
Financial Statements for additional information.
See Note 5 to the Financial Statements for additional information on income taxes.
Loss from Discontinued Operations (net of income taxes)
Loss from Discontinued Operations (net of income taxes) for 2015 includes the results of operations of PPL Energy Supply,which was spun off from PPL on June 1, 2015 and substantially represents PPL's former Supply segment. See "Discontinued yOperations" in Note 8 to the Financial Statements for additional information.
Segment Earningsg g
PPL's net income by reportable segments were as follows:
Change 2017 2016 2015 2017 vs. 2016 2016 vs. 2015
U.K. Regulated $ 652 $ 1,246 $ 1,121 $ (594) $ 125Kentucky Regulated 286 398 326 (112) 72Pennsylvania Regulated 359 338 252 21 86Corporate and Other (a) (169) (80) (96 ) (89) 16Discontinued Operations (b) — — (921) — 921Net Income $ 1,128 $ 1,902 $ 682 $ (774) $ 1,220
(a) Primarily represents financing and certain other costs incurred at the corporate level that have not been allocated or assigned to the segments, which are presented to reconcile segment information to PPL's consolidated results. 2017 includes $97 million of additional income tax expense related to the enactment of the TCJA. See Note 5 to the Financial Statements for additional information. 2015 includes certain costs related to the spinoff of PPL Energy Supply. See Note 8 to the Financial Statements for additional information.
(b) As a result of the spinoff of PPL Energy Supply, substantially representing PPL's former Supply segment, the earnings of the Supply segment prior to thespinoff are included in Discontinued Operations. 2015 includes an $879 million charge reflecting the difference between PPL's recorded value for the Supply segment and its estimated fair value as of the spinoff date, determined in accordance with the applicable accounting rules under GAAP. See Note8 to the Financial Statements for additional information.
Earnings from Ongoing Operations g g g p
Management utilizes "Earnings from Ongoing Operations" as a non-GAAP financial measure that should not be considered asan alternative to net income, an indicator of operating performance determined in accordance with GAAP. PPL believes that Earnings from Ongoing Operations is useful and meaningful to investors because it provides management's view of PPL's earnings performance as another criterion in making investment decisions. In addition, PPL's management uses Earnings from Ongoing Operations in measuring achievement of certain corporate performance goals, including targets for certain executive incentive compensation. Other companies may use different measures to present financial performance. ff
Earnings from Ongoing Operations is adjusted for the impact of special items. Special items are presented in the financialtables on an after-tax basis with the related income taxes on special items separately disclosed. Income taxes on special itemsy ,when applicable, are calculated based on the effective tax rate of the end tity where the activity is recorded. Special items include:
• Unrealized gains or losses on foreign currency economic hedges (as discussed below).• Spinoff of the Supply segment.• Gains and losses on sales of assets not in the ordinary course of business.

31
• Impairment charges. • Significant workforce reduction and other restructuring effects.• Acquisition and divestiture-related adjustments. • Other charges or credits that are, in management's view, non-recurring or otherwise not reflective of the company's ongoing
operations.
Unrealized gains or losses on foreign currency economic hedges include the changes in fair value of foreign currency contractsused to hedge GBP-denominated anticipated earnings. The changes in fair value of these contracts are recognized immediately within GAAP earnings. Management believes that excluding these amounts from Earnings from Ongoing Operations until settlement of the contracts provides a better matching of the financial impacts of those contracts with the economic value of PPL's underlying hedged earnings. See Note 17 to the Financial Statements and "Risk Management" below for additionalinformation on foreign currency economic activity.
PPL's Earnings from Ongoing Operations by reportable segment were as follows:
Change 2017 2016 2015 2017 vs. 2016 2016 vs. 2015
U.K. Regulated $ 885 $ 1,015 $ 968 $ (130) $ 47Kentucky Regulated 395 398 343 (3) 55Pennsylvania Regulated 349 338 252 11 86Corporate and Other (76) (77) (74 ) 1 (3) Earnings from Ongoing Operations $ 1,553 $ 1,674 $ 1,489 $ (121) $ 185
See "Reconciliation of Earnings from Ongoing Operations" below for a reconciliation of this non-GAAP financial measure to Net Income.
U.K. Regulated Segment g g
The U.K. Regulated segment consists of PPL Global, which primarily includes WPD's regulated electricity distribution operations, the results of hedging the translation of WPD's earnings from GBP into U.S. dollars, and certain costs, such as U.S.income taxes, administrative costs, and certain acquisition-related financing costs. Thrr e U.K. Regulated segment represents 58%of PPL's Net Income for 2017 and 41% of PPL's assets at December 31, 2017.
Net Income and Earnings from Ongoing Operations include the following results.
Change 2017 2016 2015 2017 vs. 2016 2016 vs. 2015
Operating revenues $ 2,091 $ 2,207 $ 2,410 $ (116) $ (203) Other operation and maintenance 272 344 477 (72) (133) Depreciation 230 233 242 (3) (9) Taxes, other than income 127 135 148 (8) (13)
Total operating expenses 629 712 867 (83) (155) Other Income (Expense) - net (261) 386 123 (647) 263Interest Expense 397 402 417 (5) (15) Income Taxes 152 233 128 (81) 105NNet Income 652 1,246 1,121 (594) 125Less: Special Items (233) 231 153 (464) 78Earnings from Ongoing Operations $ 885 $ 1,015 $ 968 $ (130) $ 47
The following after-tax gains (losses), which management considers special items, impacted the U.K. Regulated segment'sresults and are excluded from Earnings from Ongoing Operations.

32
Income StatementLine Item 2017 2016 2015
Foreign currency economic hedges, net of tax of $59, $4, ($30) (a) Other Income (Expense) - net $ (111 ) $ (8) $ 55
U.S. tax reform (b) Income Taxes (122 ) — —
Settlement of foreign currency contracts, net of tax of $0, ($108), $0 (c)Other Income (Expense) - net — 202 —
Change in U.K. tax rate (d) Income Taxes — 37 78
WPD Midlands acquisition-related adjustment, net of tax of $0, $0, ($1)Other operation and maintenance — — 2
Settlement of certain income tax positions (e) Income Taxes — — 18Total $ (233) $ 231 $ 153
(a) Represents unrealized gains (losses) on contracts that economically hedge anticipated GBP-denominated earnings. 2016 includes the reversal of $310million ($202 million after-tax) of unrealized gains related to the settlement of 2017 and 2018 contracts.
(b) During 2017, PPL recorded deferred income tax expense for the enactment of the TCJA. See Note 5 to the Financial Statements for additionalinformation.
(c) In 2016, PPL settled 2017 and 2018 foreign currency contracts, resulting in $310 million of cash received ($202 million after-tax). The settlement did not have a material impact on net income as the contracts were previously marked to fair value and recognized in "Other Income (Expense) - net" on theStatement of Income. See Note 17 to the Financial Statements for additional information.
(d) The U.K. Finance Acts of 2016 and 2015 reduced the U.K.'s statutory income tax rates. As a result, PPL reduced its net deferred tax liability and recognized a deferred tax benefit in 2016 and 2015. See Note 5 to the Financial Statements for additional information.
(e) Relates to the April 2015 settlement of the IRS audit for the tax years 1998-2011. See Note 5 to the Financial Statements for additional information.
The changes in the components of the U.K. Regulated segment's results between these periods were due to the factors set forthbelow, which reflect amounts classified as U.K. Gross Margins, the items that management considers special and the effects of movements in foreign currency exchange, including the effects of foreign currency hedge contracts, on separate lines and not intheir respective Statement of Income line items.
2017 vs. 2016 2016 vs. 2015 U.K.
Gross margins $ 30 $ 62Other operation and maintenance 64 94Depreciation (14) (18) Interest expense (21) (28)Other (6) (3) Income taxes 11 (18)
U.S. Interest expense and other 1 (2) Income taxes (10) 41
Foreign currency exchange, after-tax (185) (81)Earnings from Ongoing Operations (130) 47Special items, after-tax (464) 78NNet Income $ (594) $ 125
U.K.
• See "Margins - Changes in Margins" for an explanation of U.K. Gross Margins.
• Lower other operation and maintenance expense in 2017 compared with 2016 primarily due to $67 million from higher pension income due to an increase in expected returns on higher asset balances and lower interest costs due to a lower discount rate.
• Lower other operation and maintenance expense in 2016 compared with 2015 primarily due to $86 million from higher pension income due to an increase in expected returns on higher asset balances and lower interest costs due to a change in the discount rate methodology.
• Higher depreciation expense in 2017 compared with 2016 and 2016 compared with 2015, primarily due to additions toPP&E, net of retirements.
• Higher interest expense in 2017 compared with 2016 primarily due to higher interest expense on indexed linked bonds.

33
• Higher interest expense in 2016 compared with 2015 primarily due to $16 million higher long-term debt interest expense due to a debt issuance in November 2015 and $12 million higher interest expense on indexed linked bonds.
• Lower income taxes in 2017 compared with 2016 primarily due to decreases of $10 million related to accelerated taxdeductions and $7 million from lower U.K. tax rates, partially offset by an increase of $11 million from higher pre-taxincome.
• Higher income taxes in 2016 compared with 2015 primarily due to an increase of $21 million from higher pre-tax income,partially offset by a decrease of $7 million from lower U.K. tax rates.
U.S.
• Higher income taxes in 2017 compared with 2016 primarily due to a $37 million benefit related to foreign tax credit carryforwards in 2016, partially offset by a $29 million tax benefit on accelerated pension contributions made in the first quarter of 2017.
• Lower income taxes in 2016 compared with 2015 primarily due to a benefit related to foreign tax crd edit carryforwards in 2016.
Kentucky Regulated Segmenty g g
The Kentucky Regulated segment consists primarily of LKE's regulated electricity generation, transmission and distribution operations of LG&E and KU, as well as LG&E's regulated distribution and sale of natural gas. In addition, certain acquisition-related financing costs are allocated to the Kentucky Regulated segment. The Kentucky Regulated segment represents 25% of PPL's Net Income for 2017 and 35% of PPL's assets at December 31, 2017.
Net Income and Earnings from Ongoing Operations include the following results.
Change 2017 2016 2015 2017 vs. 2016 2016 vs. 2015
Operating revenues $ 3,156 $ 3,141 $ 3,115 $ 15 $ 26Fuel 759 791 863 (32) (72)Energy purchases 178 171 184 7 (13) Other operation and maintenance 806 804 837 2 (33)Depreciation 439 404 382 35 22Taxes, other than income 65 62 57 3 5
Total operating expenses 2,247 2,232 2,323 15 (91) Other Income (Expense) - net (3) (9) (13 ) 6 4Interest Expense 261 260 232 1 28Income Taxes 359 242 221 117 21NNet Income 286 398 326 (112) 72Less: Special Items (109) — (17 ) (109) 17Earnings from Ongoing Operations $ 395 $ 398 $ 343 $ (3) $ 55
The following after-tax gains (losses), which management considers special items, impacted the Kentucky Regulated segment'sresults and are excluded from Earnings from Ongoing Operations.
Income Statement Line Item 2017 2016 2015 U.S. tax reform (a) Income Taxes $ (112 ) $ — $ —Adjustment to investment, net of tax of $0, $0, $0 (b) Other Income (Expense) - net (1 ) — —Settlement of indemnification agreement, net of tax of ($2), $0, $0(c) Other Income (Expense) - net 4 — —Certain income tax valuation allowances (d) Income Taxes — — (12)LKE acquisition - related adjustment, net of tax of $0, $0, $0 (e) Other Income (Expense) - net — — (5) Total $ (109 ) $ — $ (17)
(a) During 2017, LKE recorded deferred income tax expense related to the enactment of the TCJA associated with LKE's non-regulated entities. See Note 5 to the Financial Statements for additional information.
34
(b) KU recorded a write-off of an equity method investment. (c) Recorded at LKE and represents the settlement of a WKE indemnification. See Note 13 to the financial statements for additional information.(d) Recorded at LKE and represents a valuation allowance against tax credits expiring through 2020 that are more likely than not to expire before being
utilized.(e) Recorded at PPL and allocated to the Kentucky Regulated segment. The amount represents a settlement between E.ON AG (a German corporation and
the indirect parent of E.ON US Investments Corp., the former parent of LKE) and PPL for a tax matter.
The changes in the components of the Kentucky Regulated segment's results between these periods were due to the factors set nnforth below, which reflect amounts classified as Kentucky Gruu oss Margins and the items that management considers special onseparate lines and not in their respective Statement of Income line item.
2017 vs. 2016 2016 vs. 2015 Kentucky Gross Margins $ 29 $ 83Other operation and maintenance — 42Depreciation (27) (4) Taxes, other than income (2) (4) Other Income (Expense) - net 1 (1) Interest Expense (1) (28)Income Taxes (3) (33) Earnings from Ongoing Operations (3) 55Special Items, after-tax (109) 17Net Income $ (112) $ 72
• See "Margins - Changes in Margins" for an explanation of Kentucky Gross Margins.
• Lower other operation and maintenance expense in 2016 compared with 2015 primarily due to a $29 million reduction of costs as a result of coal units retired in 2015 at the Cane Run and Green River plants, partially offset by $5 million of additional costs for Cane Run Unit 7 plant operations and $12 million of lower pension expense mainly due to higher discount rates and deferred amortization of actuarial losses.
• Higher depreciation expense in 2017 compared with 2016 primarily due to additions to PP&E, net of retirements, and higher depreciation rates effective July 1, 2017.
• Higher income taxes in 2016 compared with 2015 primarily due to higher pre-tax income at current period tax rates.
Pennsylvania Regulated Segment y g g
The Pennsylvania Regulated segment includes the regulated electricity transmission and distribution operations of PPL Electric. In addition, certain costs are allocated to the Pennsylvania Regulated segment. The Pennsylvania Regulated segment represents 32% of PPL's Net Income for 2017 and 24% of PPL's assets at December 31, 2017.
Net Income and Earnings from Ongoing Operations include the following results.
Change 2017 2016 2015 2017 vs. 2016 2016 vs. 2015
Operating revenues $ 2,195 $ 2,156 $ 2,124 $ 39 $ 32Energy purchases
External 507 535 657 (28) (122) Intersegment — — 14 — (14)
Other operation and maintenance 571 601 607 (30) (6) Depreciation 309 253 214 56 39Taxes, other than income 107 105 94 2 11
Total operating expenses 1,494 1,494 1,586 — (92)Other Income (Expense) - net 16 17 8 (1) 9Interest Expense 142 129 130 13 (1) Income Taxes 216 212 164 4 48Net Income 359 338 252 21 86Less: Special Items 10 — — 10 —Earnings from Ongoing Operations $ 349 $ 338 $ 252 $ 11 $ 86

35
The following after-tax gain, which management considers a special item, impacted the Pennsylvania Regulated segment'sresults and is excluded from Earnings from Ongoing Operations.
Income Statement Line Item 2017 2016 2015 U.S. tax reform (a) Income Taxes $ 10 $ — $ —Total $ 10 $ — $ —
(a) During 2017, PPL recorded a deferred income tax benefit for the enactment of the TCJA. See Note 5 to the Financial Statements for additionalffinformation.
The changes in the components of the Pennsylvania Regulated segment's results between these periods were due to the factorsset forth below, which reflect amounts classified as Pennsylvania Gross Margins and the item that management considers special on separate lines and not in their respective Statement of Income line items.
2017 vs. 2016 2016 vs. 2015 Pennsylvania Gross Margins $ 31 $ 177Other operation and maintenance 42 —Depreciation (35) (39) Taxes, other than income 1 (14)Other Income (Expense) - net (1) 9Interest Expense (13) 1Income Taxes (14) (48) Earnings from Ongoing Operations 11 86Special Item, after-tax 10 —Net Income $ 21 $ 86
• See "Margins - Changes in Margins" for an explanation of Pennsylvania Gross Margins.
• Lower other operation and maintenance expense for 2017 compared with 2016 primarily due to $17 million of lower bad debt expense, $17 million of lower vegetation management expense and $12 million of lower payroll related expenses, partially offset by $19 million of higher corporate service costs allocated to PPL Electric. aa
• Other operation and maintenance expense for 2016 was comparable with 2015 primarily due to $26 million of lower payroll related expenses, partially offset by $8 million of higher corporate service costs allocated to PPL Electric, $8 million of higher costs for additional work done by outside vendors and other costs, which were not individually significant in comparison to the prior year.
• Higher depreciation expense for both periods primarily due to transmission and distribution additions placed into servicerelated to the ongoing efforts to replace aging infrastructure and improve reliability, net of retirements.
• Higher taxes, other than income for 2016 compared with 2015 primarily due to the settlement of a 2011 gross receipts taxaudit resulting in the reversal of $17 million of previously recognized reserves in 2015. d
• Higher interest expense for 2017 compared with 2016 primarily due to the issuance of $475 million of 3.950% First Mortgage Bonds in May 2017.
• Higher income taxes for both periods primarily due to higher pre-tax income at current period tax rates.
Reconciliation of Earnings from Ongoing Operationsg g g p
The following tables contain after-tax gains (losses), in total, which manaff gement considers special items, that are excluded from Earnings from Ongoing Operations and a reconciliation to PPL's "Net Income" for the years ended December 31.

36
2017 U.K.
Regulated KY
RegulatedPA
RegulatedCorporateand Other Total
Net Income $ 652 $ 286 $ 359 $ (169) $ 1,128Less: Special Items (expense) benefit:Foreign currency economic hedges, net of tax of $59 (111) — — — (111) Spinoff of the Supply segment, net of tax of ($1) — — — 4 4Other:
(112) 10 (97) (321) Adjustment to investment, net of tax of $0 — (1) — — (1) Settlement of indemnification agreement, net of tax of ($2) — 4 — — 4
Total Special Items (233) (109) 10 (93) (425) Earnings from Ongoing Operations $ 885 $ 395 $ 349 $ (76) $ 1,553
(a) During 2017, PPL recorded deferred income tax (expense) benefit related to the enactment of the TCJA. See Note 5 to the Financial Statements for additional information.
2016 U.K.
Regulated KY
RegulatedPA
Regulated Corporateand Other Total
Net Income $ 1,246 $ 398 $ 338 $ (80) $ 1,902Less: Special Items (expense) benefit: Foreign currency economic hedges, net of tax of $4 (8) — — — (8) Spinoff of the Supply segment, net of tax of $2 — — — (3) (3) Other:
— — — 202Change in U.K. tax rate 37 — — — 37
Total Special Items 231 — — (3) 228
Earnings from Ongoing Operations $ 1,015 $ 398 $ 338 $ (77) $ 1,674
2015 U.K.
Regulated KY
RegulatedPA
RegulatedCorporateand Other
DiscontinuedOperations Total
Net Income $ 1,121 $ 326 $ 252 $ (96) $ (921) $ 682Less: Special Items (expense) benefit: Foreign currency economic hedges, net of tax of ($30) 55 — — — — 55Spinoff of the Supply segment:
Discontinued operations, net of tax of $30 — — — — (921) (921) Transition and transaction costs, net of tax of $6 — — — (12 ) — (12)Employee transitional services, net of tax of $2 — — — (5) — (5) Separation benefits, net of tax of $3 — — — (5 ) — (5)
Other Change in U.K. tax rate 78 — — — — 78Settlement of certain income tax positions 18 — — — — 18WPD Midlands acquisition-related adjustment, net of tax of ($1) 2 — — — — 2Certain income tax valuation allowances — (12) — — — (12) LKE acquisition-related adjustment, net of tax of $0 — (5) — — — (5)
Total Special Items 153 (17) — (22) (921) (807) Earnings from Ongoing Operations $ 968 $ 343 $ 252 $ (74 ) $ — $ 1,489
Marginsg
Management also utilizes the following non-GAAP financial measures as indicators of performance for its businesses.
• "U.K. Gross Margins" is a single financial performance measure of the electricity distribution operations of the U.K.uuRegulated segment. In calculating this measure, direct costs such as connection charges from National Grid, which owns and manages the electricity transmission network in England and Wales, and Ofgem license fees (recorded in "Other operation and maintenance" on the Statements of Income) are deducted from operating revenues, as they are costs passed

37
through to customers. As a result, this measure represents the net revenues from the delivery of electricity across WPD's distribution network in the U.K. and directly related activities.
• "Kentucky Gross Margins" is a single financial performance measure of the electricity generation, transmission and distribution operations of the Kentucky Regulated segment, LKE, LG&E and KU, as well as the Kentucky Regulated segment's, LKE's and LG&E's distribution and sale of natural gas. In calculating this measure, fuel, energy purchases and certain variable costs of production (recorded in "Other operation and maintenance" on the Statements of Income) are deducted from operating revenues. In addition, certain other expenses, recorded in "Other operation and maintenance", "Depreciation" and "Taxes, other than income" on the Statements of Income, associated with approved cost recovery mechanisms are offset against the recovery of those expenses, which are included in revenues. These mechanisms allow for direct recovery of these expenses and, in some cases, returns on capital investments and performance incentives. As a result, this measure represents the net revenues from electricity and gas operations.
• "Pennsylvania Gross Margins" is a single financial performance measure of the electricity transmission and distribution yoperations of the Pennsylvania Regulated segment and PPL Electric. In calculating this measure, utility revenues and expenses associated with approved recovery mechanisms, including energy provided as a PLR, are offset with minimal impact on earnings. Costs associated with these mechanisms are recorded in "Energy purchases," "Other operation and maintenance," (which are primarily Act 129 and Universal Service program costs), "Depreciation" (which is primarily related to the Act 129 Smart Meter program) and "Taxes, other than income," (which is primarily gross receipts tax) on theStatements of Income. This performance measure includes PLR energy purchases by PPL Electric from PPL EnergyPlus,which are reflected in "Energy purchases from affiliate" in the 2015 reconciliation table. As a result of the June 2015spinoff of PPL Energy Supply and the formation of Talen Energy, PPL EnergyPlus (renamed Talen Energy Marketing) isno longer an affiliate of PPL Electric. PPL Electric's purchases from Talen Energy Marketing subsequent to May 31, 2015are reflected in "Energy Purchases" in the reconciliation tables. This measure represents the net revenues from thePennsylvania Regulated segment's and PPL Electric's electricity delivery operations.
These measures are not intended to replace "Operating Income," which is determined in accordance with GAAP, as an indicator of overall operating performance. Other companies may use different measures to analyze and report their results of operations.Management believes these measures provide additional useful criteria to make investment decisions. These performancemeasures are used, in conjunction with other information, by senior management and PPL's Board of Directors to manage operations and analyze actual results compared with budget.
Changes in Marginsg g
The following table shows Margins by PPL's reportable segments and by component, as applicable, for the year ended December 31 as well as the changes between periods. The factors that gave rise to the changes are described following thetable.
Change
2017 2016 2015 2017 vs.
20162016 vs.
2015U.K. Regulated U.K. Gross Margins $ 1,952 $ 2,067 $ 2,243 $ (115) $ (176)
Impact of changes in foreign currency exchange rates (145) (238) U.K. Gross Margins excluding impact of foreign currency exchange rates $ 30 $ 62
Kentucky Regulated
LG&E $ 910 $ 887 $ 867 $ 23 $ 20KU 1,128 1,122 1,059 6 63
Total Kentucky Gross Margins $ 2,038 $ 2,009 $ 1,926 $ 29 $ 83
Pennsylvania Regulated
Distribution $ 958 $ 960 $ 842 $ (2) $ 118Transmission 487 454 395 33 59
Total Pennsylvania Gross Margins $ 1,445 $ 1,414 $ 1,237 $ 31 $ 177

38
U.K. Gross Margins
U.K. Gross Margins, excluding the impact of changes in foreign currency exchange rates, increased in 2017 compared witht2016 primarily due to $81 million from the April 1, 2016 price increase, partially offset by $30 million from lower volumes and$21 million from the April 1, 2017 price decrease, which includes lower true-up mechanisms partially offset by higher base demand revenue.
U.K. Gross Margins, excluding the impact of changes in foreign currency exchange rates, increased in 2016 compared witht2015 primarily due to $166 million from the April 1, 2016 price increase, which included $39 million of the recovery of prior customer rebates, and $21 million of other revenue adjustments in the first quarter of 2016, parn tially offset by $89 million frrr om the April 1, 2015 price decrease resulting from the commencement of RIIO-ED1 and $36 million from lower volumes.
Kentucky Gross Margins
Kentucky Gross Margins increased in 2017 compared with 2016 primarily due to higher base rates of $58 million ($32 million at LG&E and $26 million at KU) and gas cost recoveries added to base rates of $5 million at LG&E, partially offset by $41million of lower sales volumes due to milder weather in 2017 ($15 million at LG&E and $26 million at KU).r
The increases in base rates were the result of new rates approved by the KPSC effective July 1, 2017. The gas cost recoveries added to base rates were the result of the transfer of certain GLT expenses into base rates as a result of the 2016 Kentucky rate case. This transfer results in depreciation and other operation and maintenance expenses associated with the GLT program being excluded from margins in the second half of 2017, while the recovery of such costs remain in Kentucky Gross Marginsthrough base rates.
Kentucky Gross Margins increased in 2016 compared with 2015 primarily due to higher base rates of $68 million ($4 million at LG&E and $64 million at KU) and returns on additional environmental capital investments of $13 million at LG&E. The fincreases in base rates were the result of new rates approved by the KPSC effective July 1, 2015.
Pennsylvania Gross Margins
Distribution
Distribution margins decreased in 2017 compared with 2016 primarily due to $10 million of lower electricity sales volumes due fto milder weather in 2017, partially offset by $7 million of returns on additional Smart Meter capital investments.
Distribution margins increased in 2016 compared withn 2015 primarily due to $121 million of higher base rates, effective January 1, 2016 as a result of the 2015 rate case.
Transmission
Transmission margins increased in 2017 compared with 2016 primarily due to an increase of $51 million from returns onadditional transmission capital investments focused on replacing aging infrastructure and improving reliability, partially offset by a $17 million decrease as a result of a lower PPL zonal peak load billing factor which affected transmission revenue in thefirst five months of 2017.
Transmission margins increased in 2016 compared with 2015 primarily due to returns on additional capital investments focused ton replacing aging infrastructure and improving reliability.
Reconciliation of Margins g
The following tables contain the components from the Statement of Income that are included in the non-GAAP financialmeasures and a reconciliation to PPL's "Operating Income" for the years ended December 31.

39
2017 U.K. Gross
Margins
Kentucky Gross
Margins
PAGross
Margins Other (a)Operating Income (b)
Operating Revenues $ 2,050 (c) $ 3,156 $ 2,195 $ 46 $ 7,447
Operating Expenses Fuel — 759 — — 759Energy purchases — 178 507 — 685Other operation and maintenance 98 111 120 1,306 1,635Depreciation — 64 21 923 1,008Taxes, other than income — 6 102 184 292
Total Operating Expenses 98 1,118 750 2,413 4,379Total $ 1,952 $ 2,038 $ 1,445 $ (2,367) $ 3,068
2016 U.K. Gross
Margins
Kentucky Gross
Margins
PAGross
Margins Other (a)Operating Income (b)
Operating Revenues $ 2,165 (c) $ 3,141 $ 2,156 $ 55 $ 7,517
Operating Expenses Fuel — 791 — — 791Energy purchases — 171 535 — 706Other operation and maintenance 98 109 108 1,430 1,745Depreciation — 56 — 870 926Taxes, other than income — 5 99 197 301
Total Operating Expenses 98 1,132 742 2,497 4,469Total $ 2,067 $ 2,009 $ 1,414 $ (2,442) $ 3,048
2015 U.K. Gross
Margins
Kentucky Gross
Margins
PAGross
Margins Other (a)Operating Income (b)
Operating Revenues $ 2,364 (c) $ 3,115 $ 2,124 $ 66 $ 7,669
Operating Expenses Fuel — 863 — — 863Energy purchases — 184 657 14 855Energy purchases from affiliate — — 14 (14) —Other operation and maintenance 121 100 114 1,603 1,938Depreciation — 38 — 845 883Taxes, other than income — 4 102 193 299
Total Operating Expenses 121 1,189 887 2,641 4,838Total $ 2,243 $ 1,926 $ 1,237 $ (2,575) $ 2,831
(a) Represents amounts excluded from Margins. (b) As reported on the Statements of Income. (c) 2017, 2016 and 2015 exclude $41 million, $42 million and $46 million of ancillary activity revenues.
2018 Outlook
(PPL)
Higher net income is projected in 2018 compared with 2017. The increase in net income reflects the 2017 unfavorable impact of U.S. tax reform and unrealized losses on foreign currency economic hedges. Excluding these 2017 special items, the increase is primarily attributable to increases in the U.K. Regulated and Pennsylvania Regulated segments. The following projections and factors underlying these projections (on an after-tax basis) are provided for PPL's segments and the Corporateand Other category and the related Registrants.
40
(PPL's U.K. Regulated Segment)
Higher net income is projected in 2018 compared with 2017. The increase in net income reflects the 2017 unfavorable impact of U.S. tax reform and unrealized losses on foreign currency economic hedges. Excluding these 2017 special items, the increase is expected to be driven primarily by higher assumed GBP exchange rates and higher pension income, partially offset by higher taxes.
(PPL's Kentucky Regulated Segment and LKE, LG&E and KU)
Higher net income is projected in 2018 compared with 2017, which reflects the 2017 unfavorable impact of U.S. tax reform. Excluding this 2017 special item, earnings in 2018 compared with 2017 are projected to be lower, driven primarily by higher operation and maintenance expense, higher depreciation expense, higher interest expense and a lower tax shield on holding company interest and expenses, partially offset by an assumed return to normal weather and higher base electricity and gas rates effective July 1, 2017.
(PPL's Pennsylvania Regulated Segment and PPL Electric)
Higher net income is projected in 2018 compared with 2017, driven primarily by higher transmission earnings and lower operation and maintenance expense, partially offset by higher depreciation expense and higher interest expense.
(PPL's Corporate and Other Category)
Lower costs are projected in 2018 compared with 2017, which reflects the 2017 unfavorable impact of U.S. tax reform. Excluding this 2017 special item, costs are projected to be flat in 2018 compared to 2017, due to a lower tax shield on holdingcompany interest expense offset by lower financing costs.
(All Registrants)
Earnings in future periods are subject to various risks and uncertainties. See “Business," the rest of this section, and Notes 1, 6and 13 to the Financial Statements (as applicable) for a discussion of the risks, uncertainties and factors that may impact future ttearnings.
Financial Condition
Liquidity and Capital Resources
(All Registrants)
The Registrants' cash flows from operations and access to cost effective bank and capital markets are subject to risks and uncertainties.
The Registrants had the following at:

41
PPL (a) PPL
Electric LKE LG&E KUDecember 31, 2017 Cash and cash equivalents $ 485 $ 49 $ 30 $ 15 $ 15Short-term debt 1,080 — 244 199 45Long-term debt due within one year 348 — 98 98 —Notes payable with affiliates — 225 — —
December 31, 2016 Cash and cash equivalents $ 341 $ 13 $ 13 $ 5 $ 7Short-term debt 923 295 185 169 16Long-term debt due within one year 518 224 194 194 —Notes payable with affiliates — 163 — —
December 31, 2015 Cash and cash equivalents $ 836 $ 47 $ 30 $ 19 $ 11Short-term debt 916 — 265 142 48Long-term debt due within one year 485 — 25 25 —Notes payables with affiliates — 54 — —
(a) At December 31, 2017, $58 million of cash and cash equivalents were denominated in GBP. If these amounts would be remitted as dividends, PPL would not anticipate an incremental U.S. tax cost. See Note 5 to the Financial Statements for additional information on undistributed earnings of WPD. d
(PPL)
The Statements of Cash Flows separately report the cash flows of the discontinued operations. The "Operating Activities,""Investing Activities" and "Financing Activities" sections below include only the cash flows of continuing operations.
(All Registrants)
Net cash provided by (used in) operating, investing and financing activities for the years ended December 31 and the changes between periods were as follows.
PPLPPL
Electric LKE LG&E KU2017 Operating activities $ 2,461 $ 880 $ 1,099 $ 512 $ 634Investing activities (3,156) (1,252) (888 ) (458) (428) Financing activities 824 408 (194) (44) (198)
2016
$ 872 $ 1,027 $ 482 $ 606Investing activities (2,918) (1,130) (790) (439) (349) Financing activities (439) 224 (254 ) (57) (261)
2015 Operating activities $ 2,272 $ 602 $ 1,063 $ 554 $ 608Investing activities (3,439) (1,108) (1,203 ) (689) (512) Financing activities 482 339 149 144 (96)
2017 vs. 2016 Change
$ 8 $ 72 $ 30 $ 28Investing activities (238) (122) (98) (19) (79) Financing activities 1,263 184 60 13 63
2016 vs. 2015 Change Operating activities $ 618 $ 270 $ (36) $ (72) $ (2) Investing activities 521 (22) 413 250 163Financing activities (921) (115) (403) (201) (165)

42
Operating Activitiesp g
The components of the change in cash provided by (used in) operating activities were as follows.
PPLPPL
Electric LKE LG&E KU2017 vs. 2016 Change - Cash Provided (Used):
NNet income $ (774) $ 22 $ (113 ) $ 10 $ (6) Non-cash components 363 100 31 (8) 42Working capital 38 (87) 93 (33) (14) Defined benefit plan funding (138) (24) 50 42 (3) Other operating activities 82 (3) 11 19 9
Total $ (429) $ 8 $ 72 $ 30 $ 28
2016 vs. 2015 Change - Cash Provided (Used):
NNet income $ 299 $ 88 $ 65 $ 18 $ 31Non-cash components 195 40 66 20 (20)Working capital 47 101 (206) (100) (51) Defined benefit plan funding 72 33 (15 ) (20) 1Other operating activities 5 8 54 10 37
Total $ 618 $ 270 $ (36 ) $ (72) $ (2)
(PPL)
PPL had a $429 million decrease in cash provided by operating activities from continuing operations in 2017 compared with 2016.
• Net income declined $774 million between periods and included net non-cash benefits of $363 million. The increasein net non-cash benefits was primarily due to an increase in unrealized losses on hedging activities, an increase indeferred income taxes (primarily due to the impact of the TCJA) and an increase in depreciation expense (primarilydue to additional assets placed into service, net of retirements, and higher depreciation rates at LG&E and KU effective July 1, 2017, partially offset by the impact of foreign currency at WPD), partially offset by an increase in the U.K. net periodic defined benefit credits (primarily due to a decrease in the U.K. pension plan discount rates used to calculate the interest cost component of the net periodic defined benefit costs (credits) and increase in expected returns).
• The $38 million increase in cash from changes in working capital was primarily due a decrease in net regulatory assetsaand liabilities (due to timing of rate recovery mechanisms), a decrease in fuel, materials and supplies (primarily due to a decrease in fuel purchases due to lower generation driven by milder weather in 2017 compared to 2016) and adecrease in unbilled revenue (primarily due to lower growth in volumes in 2017 compared to 2016), partially offset by a decrease in accounts payable (due to timing of payments), a decrease in taxes payable (primarily due to the timing of payments) and an increase in accounts receivable.
• Defined benefit plan funding was $138 million higher in 2017. The increase was primarily due to the acceleration of WPD's contributions to its U.K. pension plans.
PPL had a $618 million increase in cash provided by operating activities from continuing operations in 2016 compared with2015.
• Net income improved by $299 million between the periods. This included an additional $195 million of net non-cashbenefits, including a $132 million increase in deferred income taxes and $96 million of lower unrealized gains onhedging activity (primarily due to the settlement of hedges in the third quarter of 2016) partially offset by a $96million increase in defined benefit plan income (primarily due to an increase in estimy ated returns on higher asset balances and lower interest costs due to a change in the discount rate for the U.K. pension plans).
• The $47 million increase in cash from changes in working capital was primarily due to an increase in taxes payable (due to timing of payments) and an increase in accounts payable (primarily due to timing of payments), partially offset aa

43
by an increase in unbilled revenues (primarily due to favorable weather compared to December 2015), an increase in net regulatory assets/liabilities (due to timing of rate recovery mechanisms) and an increase in accounts receivable (primarily due to increased volumes and favorable weather in 2016).
• Defined benefit plan funding was $72 million lower in 2016.
(PPL Electric)
PPL Electric had an $8 million increase in cash provided by operating activities in 201d 7 compared with 2016. • Net income improved by $22 million between the periods. This included an additional $100 million of net non-cash
benefits primarily due to a $56 million increase in depreciation expense (primarily due to additional assets placed intoservice, related to the ongoing efforts to ensure the reliability of the delivery system and the replacement of aginginfrastructure as well as the roll-out of the Act 129 Smart Meter program, net of retirements) and a $37 millionincrease in deferred income taxes (primarily due to book versus tax plant timing differences).
• The $87 million decrease in cash from changes in working capital was primarily due to an increase in accounts receivable (primarily due to a 2017 federal income tax benefit refund, not yet received), a decrease in accounts payable (primarily due to timing of payments) and an increase in prepayments (primarily due to an increase in the 2017 gross receipts tax prepayment compared to 2016), partially offset by an decrease in net regulatory assets and liabilities (due to timing of rate recovery mechanisms) and a decrease in unbilled revenue (primarily due to lower growth in volumes in 2017 compared to 2016).
• Pension funding was $24 million higher in 2017 due to contributions made in 2017 to the PPL Retirement Plan.
PPL Electric had an $270 million increase in cash provided by operating activities in 2016 compared with 2015.• Net income improved by $88 million between the periods. This included an additional $40 million of net non-cash
benefits primarily due to a $39 million increase in depreciation expense (primarily due to the replacement of aging infrastructure and to ensure system reliability).
• The $101 million increase in cash from changes in working capital was primarily due to an increase in accountspayable (primarily due to timing of payments), an increase in taxes payable (primarily due to timing of payments) and a decrease in prepayments (primarily due to higher tax payments in 2015), partially offset by an increase in net regulatory assets and liabilities (due to timing of rate recovery mechanisms), an increase in unbilled revenues (primarily due to higher volumes and favorable weather compared to December 2015) and an increase in accountsreceivable.
• Pension funding was $33 million lower in 2016.
(LKE)
LKE had a $72 million increase in cash provided by operating activities in 2017 compared with 2016. • Net income declined by $113 million and included an increase of $31 million of net non-cash charges primarily due to
a $35 million increase in depreciation expense and a $3 million increase in deferred income taxes due to the impact of the TCJA, largely offset by book versus tax plant timing differences and reduced benefit from net operating losses.
• The increase in cash from changes in working capital was driven primarily by an increase in other current liabilities due to customer advances and the timing of payments, a decrease in fuel purchases due to lower generation driven by milder weather in 2017 compared to 2016, an increase in taxes payable due to the timing of payments, partially offset by a decrease in accounts payable due to the timing of payments.
• Defined benefit plan funding was $50 million lower in 2017.
LKE had a $36 million decrease in cash provided by operating activities in 2016 compared with 2015.• Net income improved by $65 million and included an increase of $66 million of net non-cash charges primarily due to
a $55 million increase in deferred income taxes and a $22 million increase in depreciation expense.
• The decrease in cash from changes in working capital was driven primarily by lower tax payments received from PPL for the use of prior year excess tax depreciation deductions. Other decreases in cash were related to accounts receivable and unbilled revenues due to more favorable weather in December 2016 compared to December 2015, and

44
a decrease in taxes payable due to the timing of payments, partially offset by an increase in accounts payable due tothe timing of fuel purchases and payments.
• Defined benefit plan funding was $15 million higher in 2016.
• The increase in cash from LKE's other operating activities was driven primarily by lower payments for the settlement of interest rate swaps, partially offset by an increase in ARO expenditures.
(LG&E)
LG&E had a $30 million increase in cash provided by operating activities in 2017 compared with 2016. • Net income improved by $10 million and included a decrease of $8 million of net non-cash charges primarily due to a
$21 million decrease in deferred income taxes largely due to book versus tax plant timing differences, partially offset by a $13 million increase in depreciation expense.
• The decrease in cash from changes in working capital was driven primarily by decreases in accounts payable and taxespayable due to the timing of payments, partially offset by a decrease in accounts receivable from affiliates due tolower intercompany settlements associated with energy sales and inventory and an increase in other current liabilities due to customer advances and the timing of payments.
• Defined benefit plan funding was $42 million lower in 2017.
• The increase in cash from LG&E's other operating activities was driven primarily by lower payments for the settlement of interest rate swaps.
LG&E had a $72 million decrease in cash provided by operating activities in 201y 6 compared with 2015. • Net income improved by $18 million and included an increase of $20 million of net non-cash charges primarily due to
a $21 million increase in deferred income taxes.
• The decrease in cash from changes in working capital was driven primarily by lower tax payments received from LKEfor the use of prior year excess tax depreciation deductions. Other decreases in cash were related to accounts receivable and unbilled revenues due to more favorable weather in December 2016 compared to December 2015, and an increase in accounts receivable from affiliates due to higher intercompany settlements associated with energy sales and inventory, partially offset by an increase in accounts payable due to the timing of fuel purchases and payments.
• Defined benefit plan funding was $20 million higher in 2016.
• The increase in cash from LG&E's other operating activities was driven primarily by lower payments for the settlement of interest rate swaps, partially offset by an increase in ARO expenditures.
(KU)
KU had a $28 million increase in cash provided by operating activities in 2017 compared with 2016. • Net income declined by $6 million and included an increase of $42 million of net non-cash charges primarily due to an
increase of $26 million in deferred income taxes largely due to the utilization of net operating losses and an increase of $21 million in depreciation expense.
• The decrease in cash from changes in working capital was driven primarily by a decrease in taxes payable due to the timing of payments and a decrease in accounts payable to affiliates due to lower intercompany settlements associated with energy purchases and inventory, partially offset by a decrease in fuel purchases due to lower generation driven by milder weather in 2017 compared to 2016 and an increase in accounts payable due to the timing of payments.a
KU had a $2 million decrease in cash provided by operating activities in 2016 compared with 2015.d• Net income improved by $31 million and included a decrease of $20 million of net non-cash charges primarily due to
a $34 million decrease in deferred income taxes, partially offset by a $14 million increase in depreciation expense.
• The decrease in cash from changes in working capital was driven primarily by lower tax payments received from LKE for the use of prior year excess tax depreciation deductions. Other decreases in cash were related to accounts receivable and unbilled revenues due to more favorable weather in December 2016 compared to December 2015,

45
partially offset by an increase in accounts payable to affiliates due to higher intercompany settlements associated withffenergy purchases and inventory, and an increase in taxes payable due to the timing of payments.
• The increase in cash from KU's other operating activities was driven primarily by lower payments for the settlement of interest rate swaps, partially offset by an increase in ARO expenditures.
Investing Activitiesg
(All Registrants)
The components of the change in cash provided by (used in) investing activities were as follows.
PPLPPL
Electric LKE LG&E KU2017 vs. 2016 Change - Cash Provided (Used):
Expenditures for PP&E $ (213) $ (119) $ (101) $ (19) $ (82) Investment activity, net (2) — — — —Other investing activities (23) (3) 3 — 3
Total $ (238) $ (122) $ (98 ) $ (19) $ (79)
2016 vs. 2015 Change - Cash Provided (Used):
$ (28) $ 419 $ 250 $ 169Investment activity, net (134) — — — —Other investing activities 42 6 (6 ) — (6)
Total $ 521 $ (22) $ 413 $ 250 $ 163
For PPL, in 2017 compared with 2016, higher project expenditures at PPL Electric, LKE, LG&E and KU were partially offset by lower project expenditures at WPD. The increase in project expenditures for PPL Electric was primarily due to an increasein capital spending related to the ongoing efforts to improve reliability and replace aging infrastructure, as well as the roll-out of the Act 129 Smart Meter program. The increase in expenditures for LKE, LG&E and KU was primarily due to increased spending for environmental water projects at LG&E’s Mill Creek plant, CCR projects at the Trimble County plant and kincreased spending on various transmission projects at KU, partially offset by lower spending driven by completion of environmental air projects. The decrease in expenditures at WPD was primarily due to a decrease in foreign currency exchangerates partially offset by an increase in expenditures to enhance system reliability.x
For PPL, in 2016 compared with 2015, lower project expenditures at WPD, LKE, LG&E and KU were partially offset by higher project expenditures at PPL Electric. The decrease in expenditures for WPD was primarily due to a decrease in expenditures to enhance system reliability and a decrease in foreign currency exchange rates. The decrease in expenditures for LG&E was primarily driven by the completion of the environmental air projects at LG&E's Mill Creek Plant. The decrease inexpenditures for KU was primarily driven by the completion of the environmental air projects at KU's Ghent plant and the CCR project at KU's E.W. Brown plant. The increase in expenditures for PPL Electric was primarily due to the Northern Lehigh and Greater Scranton transmission reliability projects and other various transmission and distribution projects, partially offset by the completion of the Northeast Pocono reliability project and Susquehanna-Roseland transmission project.
The change in "Investment activity, net" for 2016 compared with 2015 resulted from PPL receiving $136 million during 2015for the sale of short-term investments.
See "Forecasted Uses of Cash" for detail regarding projected capital expenditures for the years 2018 through 2022.

46
Financing Activities g
(All Registrants)
The components of the change in cash provided by (used in) financing activities were as follows.
PPLPPL
Electric LKE LG&E KU2017 vs. 2016 Change - Cash Provided (Used):
Debt issuance/retirement, net $ 935 $ 470 $ 115 $ 115 $ —Stock issuances/redemptions, net 309 — — — —Dividends (42) (48) — (64) 22Capital contributions/distributions, net 355 (147 ) (41) (20)Changes in net short-term debt (a) 86 (590) 92 3 61Other financing activities (25) (3) — — —
Total $ 1,263 $ 184 $ 60 $ 13 $ 63
PPLPPL
Electric LKE LG&E KU2016 vs. 2015 Change - Cash Provided (Used):
Debt issuance/retirement, net $ (824) $ (248) $ (175) $ (325) $ (250) Debt issuance/retirement, affiliate — (400 ) — —Stock issuances/redemptions, net (59) — — — —Dividends (26) (107) — (9) (95)Capital contributions/distributions, net (55) (161) (19) 20Changes in net short-term debt (a) (65) 295 326 149 156Other financing activities 53 — 7 3 4
Total $ (921) $ (115) $ (403 ) $ (201) $ (165)
(a) Includes net increase (decrease) in notes payable with affiliates.
(PPL)
For PPL, in 2017 compared with 2016, cash provided by financing activities increased primarily as a result of an increase incash required to fund capital and general corporate expenditures and a decrease in cash from operations of $429 million. n
For PPL, in 2016 compared with 2015, cash provided by financing activities decreased primarily due to improvements in cash from operations of $618 million.
(PPL Electric)
For PPL Electric, in 2017 compared with 2016, cash provided by financing activities increased primarily as a result of anincrease in cash required to fund capital and general expenditures. d
For PPL Electric, in 2016 compared with 2015, cash provided by financing activities decreased primarily due to improvementsin cash from operations of $270 million.
(LKE, LG&E and KU)
For LKE, LG&E and KU, in 2017 compared with 2016, cash provided by financing activities increased primarily as a result of an increase in cash required to fund capital and general corporate expenditures.
For LKE, LG&E and KU, in 2016 compared with 2015, cash provided by financing activities decreased primarily as a result of a decrease in cash required to fund capital and general corporate expenditures.
(All Registrants)

47
See "Long-term Debt and Equity Securities" below for additional information on current year activity. See "Forecasted Sourcesof Cash" for a discussion of the Registrants' plans to issue debt and equity securities, as well as a discussion of credit facility capacity available to the Registrants. Also see "Forecasted Uses of Cash" for a discussion of PPL's plans to pay dividends oncommon securities in the future, as well as the Registrants' maturities of long-term debt.
Long-term Debt and Equity Securities
Long-term debt and equity securities activity for 2017 included:
Debt Net Stock Issuances (a) Retirements Issuances
Cash Flow Impact: PPL $ 1,515 $ 168 $ 453PPL Electric 470 — LKE 160 70LG&E 160 70 KU — —
(a) Issuances are net of pricing discounts, where applicable, and exclude the impact of debt issuance costs.
See Note 7 to the Financial Statements for additional information about long-term debt.
ATM Program (PPL)g
During 2017, PPL issued 10,373 thousand shares of common stock under the program, receiving net proceeds of $377 million.The compensation paid to the selling agents by PPL may be up to 1% of the gross offering proceeds of the shares sold withrespect to each equity distribution agreement. See Note 7 to the Financial Statements for additional information about the ATM Program.
Forecasted Sources of Cash
(All Registrants)
The Registrants expect to continue to have adequate liquidity available from operating cash flows, cash and cash equivalents,credit facilities and commercial paper issuances. Additionally, subject to market conditions, the Registrants and their subsidiaries may access the capital markets, and PPL Electric, LG&E and KU anticipate receiving equity contributions from their parent or member in 2018.
Credit Facilities
The Registrants maintain credit facilities to enhance liquidity, provide credit support and provide a bau ckstop to commercial paper programs. Amounts borrowed under these credit facilities are reflected in "Short-term debt" on the Balance Sheets except for borrowings under LG&E's term loan agreement which are reflected in "Long-term debt" on the Balance Sheets. At nDecember 31, 2017, the total committed borrowing capacity under credit facilities and the borrowings under these facilitieswere:

48
External
CommittedCapacity Borrowed
Letters of Credit
andCommercial
Paper Issued
UnusedCapacity
PPL Capital Funding Credit Facilities $ 1,400 $ — $ 248 $ 1,152PPL Electric Credit Facility 650 — 1 649
LKE Credit Facility 75 — — 75LG&E Credit Facilities 700 100 199 401KU Credit Facilities 598 — 243 355Total LKE Consolidated 1,373 100 442 831
Total U.S. Credit Facilities (a) (b) $ 3,423 $ 100 $ 691 $ 2,632
Total U.K. Credit Facilities (b) (c) £ 1,055 £ 448 £ — £ 605
(a) The syndicated credit facilities, as well as KU's letter of credit facility, each contain a financial covenant requiring debt tff o total capitalization not to exceed 70% for PPL Capital Funding, PPL Electric, LKE, LG&E and KU, as calculated in accordance with the facility, and other customary covenants.
The commitments under the domestic credit facilities are provided by a diverse bank group, with no one bank and its affiliates providing an aggregate commitment of more than the following percentages of the total committed capacity: PPL - 10%, PPL Electric 7%, LKE - 18%, LG&E - 33% and KU -37%.
(b) Each company pays customary fees under its respective syndicated credit facility, as does LG&E under its term loan agreement and KU under its letter of credit facility. Borrowings generally bear interest at LIBOR-based rates plus an applicable margin.
(c) The facilities contain financial covenants to maintain an interest coverage ratio of not less than 3.0 times consolidated earnings before income taxes, depreciation and amortization and total net debt not in excess of 85% of its RAV, calculated in accordance with the credit facility.
The amounts borrowed at December 31, 2017, include a USD-denominated borrowing of $200 million and GBP-denominated borrowings of £300 million, which equated to $406 million. The unused capacity reflects the USD-denominated amount borrowed in GBP of £150 million as of the date borrowed. At December 31, 2017, the USD equivalent of unused capacity under the U.K. committed credit facilities was $819 million.
The commitments under the U.K.'s credit facilities are provided by a diverse bank group with no one bank providing more than 20% of the totalcommitted capacity.
In addition to the financial covenants noted in the table above, the credit agreements governing the above credit facilities contain various other covenants. Failure to comply with the covenants after applicable grace periods could result in accelerationof repayment of borrowings and/or termination of the agreements. The Registrants monitor compliance with the covenants on a regular basis. At December 31, 2017, the Registrants were in compliance with these covenants. At this time, the Registrants believe that these covenants and other borrowing conditions will not limit access to these funding sources.
See Note 7 to the Financial Statements for further discussion of the Registrants' credit facilities.
Intercompany (LKE, LG&E and KU)y
CommittedCapacity Borrowed
Non-affiliateUsed
CapacityUnused
Capacity LKE Credit Facility $ 275 $ 225 $ — $ 50LG&E Money Pool (a) 500 — 199 301KU Money Pool (a) 500 — 45 455
(a) LG&E and KU participate in an intercompany agreement whereby LKE, LG&E and/or KU make available funds up to $500 million at an interest ratebased on a market index of commercial paper issues. However, the FERC has authorized a maximum aggregate short-term debt limit for each utility at $500 million from all covered sources.
See Note 14 to the Financial Statements for further discussion of intercompany credit facilities.
Commercial Paper (All Registrants)r
PPL, PPL Electric, LG&E and KU maintain commercial paper programs to provide an additional financing source to fund short-term liquidity needs, as necessary. Commercial paper issuances, included in "Short-term debt" on the Balance Sheets, aresupported by the respective Registrant's Syndicated Credit Facility. The following commercial paper programs were in place at:

49
December 31, 2017
Capacity
Commercial Paper
IssuancesUnused
Capacity PPL Capital Funding $ 1,000 $ 230 $ 770PPL Electric 650 — 650
LG&E 350 199 151KU 350 45 305Total LKE 700 244 456
Total PPL $ 2,350 $ 474 $ 1,876
Long-term Debt and Equity Securities
(PPL)
PPL and its subsidiaries are authorized to incur, subject to market conditions, up to $3.2 billion of long-term indebtedness in2018, the proceeds of which would be used to fund capital expenditures and for general corporate purposes.aa
PPL is authorized to issue, subject to market conditions, up to $3.5 billion of equity over three years.
(PPL Electric)
PPL Electric is authorized to incur, subject to market conditions, up to $650 million of long-term indebtedness in 2018, the proceeds of which would be used to fund capital expenditures and for general corporate purposes.
(LKE, LG&E and KU)
LG&E is authorized to incur, subject to market conditions and regulatory approvals, up to $200 million of long-term indebtedness in 2018, of which $100 million was issued in January 2018. The proceeds would be used to fund capitalexpenditures and for general corporate purposes. LG&E currently plans to remarket, subject to market conditions, $98 millionof its Pollution Control Bonds with put dates in 2018.
KU is authorized to incur, subject to market conditions and regulatory approvals, up to $100 million of long-term indebtednessin 2018, the proceeds of which would be used to fund capital expenditures.
Contributions from Parent/Member (PPL Electric, LKE, LG&E and KU)
From time to time, LKE's member or the parents of PPL Electric, LG&E and KU make capital contributions to subsidiaries.The proceeds from these contributions are used to fund capital expenditures and for other general corporate purposes and, in the case of LKE, to make contributions to its subsidiaries.
Forecasted Uses of Cash
(All Registrants)
In addition to expenditures required for normal operating activities, such as purchased power, payroll, fuel and taxes, the Registrants currently expect to incur future cash outflows for capital expenditures, various contractual obligations, payment ott f dividends on its common stock, distributions by LKE to its member, and possibly the purchase or redemption of a portion of debt securities.
Capital Expenditures
The table below shows the Registrants' current capital expenditure projections for the years 2018 through 2022. Expendituresfor the domestic regulated utilities are expected to be recovered through rates, pending regulatory approval.

50
Projected Total 2018 (b) 2019 2020 2021 2022
PPL Construction expenditures (a)
Generating facilities $ 892 $ 238 $ 253 $ 124 $ 204 $ 73Distribution facilities 9,244 1,875 1,819 1,851 1,863 1,836Transmission facilities 3,771 902 854 883 628 504Environmental 828 429 191 91 62 55Other 685 127 201 193 117 47
Total Capital Expenditures $ 15,420 $ 3,571 $ 3,318 $ 3,142 $ 2,874 $ 2,515
PPL Electric (a) Distribution facilities $ 2,077 $ 476 $ 404 $ 403 $ 396 $ 398Transmission facilities 2,901 757 686 692 404 362
Total Capital Expenditures $ 4,978 $ 1,233 $ 1,090 $ 1,095 $ 800 $ 760
LKE
Generating facilities $ 892 $ 238 $ 253 $ 124 $ 204 $ 73Distribution facilities 1,699 347 388 360 338 266Transmission facilities 870 144 169 190 225 142Environmental 828 429 191 91 62 55Other 663 119 196 189 114 45
Total Capital Expenditures $ 4,952 $ 1,277 $ 1,197 $ 954 $ 943 $ 581
LG&E
Generating facilities $ 408 $ 127 $ 108 $ 35 $ 94 $ 44Distribution facilities 1,084 223 265 233 210 153Transmission facilities 161 27 36 36 40 22Environmental 335 176 83 38 22 16Other 331 58 97 94 58 24
Total Capital Expenditures $ 2,319 $ 611 $ 589 $ 436 $ 424 $ 259
KU
Generating facilities $ 484 $ 111 $ 145 $ 89 $ 110 $ 29Distribution facilities 615 124 123 127 128 113Transmission facilities 709 117 133 154 185 120Environmental 493 253 108 53 40 39Other 332 61 99 95 56 21
Total Capital Expenditures $ 2,633 $ 666 $ 608 $ 518 $ 519 $ 322
(a) Construction expenditures include capitalized interest and AFUDC, which are expected to total approximately $84 million for PPL and $62 million for LPPL Electric.
(b) The 2018 total excludes amounts included in accounts payable as of December 31, 2017.
Capital expenditure plans are revised periodically to reflect changes in operational, market and regulatory conditions. For theyears presented, this table includes PPL Electric's asset optimization program to replace aging transmission and distribution assets.
In addition to cash on hand and cash from operations, the Registrants plan to fund capital expenditures in 2018 with proceedsfrom the sources noted below.

51
Source PPLPPL
Electric LKE LG&E KUIssuance of common stock X Issuance of long-term debt securities X X X XEquity contributions from parent/member X X X Short-term debt X X X X X
X = Expected funding source.
Contractual Obligations
The Registrants have assumed various financial obligations and commitments in the ordinary course of conducting business. At December 31, 2017, estimated contractual cash obligations were as follows:
Total 2018 2019 - 2020 2021 - 2022 After 2022PPL Long-term Debt (a) $ 20,282 $ 348 $ 1,708 $ 2,424 $ 15,802Interest on Long-term Debt (b) 15,318 868 1,723 1,529 11,198Operating Leases (c) 96 28 27 16 25Purchase Obligations (d) 3,636 1,121 1,374 563 578Other Long-term Liabilities Reflected on the Balance Sheet (e) 565 293 272 — —Total Contractual Cash Obligations $ 39,897 $ 2,658 $ 5,104 $ 4,532 $ 27,603
PPL Electric Long-term Debt (a) $ 3,339 $ — $ 100 $ 874 $ 2,365Interest on Long-term Debt (b) 2,894 141 282 260 2,211Unconditional Power Purchase Obligations 77 23 45 9 —Total Contractual Cash Obligations $ 6,310 $ 164 $ 427 $ 1,143 $ 4,576
LKE Long-term Debt (a) $ 5,200 $ 98 $ 1,405 $ 250 $ 3,447Interest on Long-term Debt (b) 3,120 199 388 300 2,233Operating Leases (c) 82 26 27 14 15Coal and Natural Gas Purchase Obligations (f) 1,955 582 930 375 68Unconditional Power Purchase Obligations (g) 593 29 53 54 457Construction Obligations (h) 500 305 147 48 —Pension Benefit Plan Obligations (e) 105 105 — — —Other Obligations 417 151 143 70 53Total Contractual Cash Obligations $ 11,972 $ 1,495 $ 3,093 $ 1,111 $ 6,273
LG&E
$ 98 $ 334 $ — $ 1,292Interest on Long-term Debt (b) 1,185 63 117 108 897Operating Leases (c) 39 15 13 5 6Coal and Natural Gas Purchase Obligations (f) 839 252 403 154 30Unconditional Power Purchase Obligations (g) 411 20 37 38 316Construction Obligations (h) 256 185 62 9 —Pension Benefit Plan Obligations (e) 54 54 — — —Other Obligations 149 47 59 26 17Total Contractual Cash Obligations $ 4,657 $ 734 $ 1,025 $ 340 $ 2,558
KU Long-term Debt (a) $ 2,351 $ — $ 596 $ — $ 1,755Interest on Long-term Debt (b) 1,719 93 186 153 1,287Operating Leases (c) 41 10 14 9 8Coal and Natural Gas Purchase Obligations (f) 1,115 330 527 221 37Unconditional Power Purchase Obligations (g) 182 9 16 16 141Construction Obligations (h) 218 101 80 37 —Pension Benefit Plan Obligations (e) 46 46 — — —

52
Total 2018 2019 - 2020 2021 - 2022 After 2022Other Obligations 187 49 64 38 36Total Contractual Cash Obligations $ 5,859 $ 638 $ 1,483 $ 474 $ 3,264
(a) Reflects principal maturities based on stated maturity or earlier put dates. See Note 7 to the Financial Statements for a discussion of variable-rate remarketable bonds issued on behalf of LG&E and KU. The Registrants do not have any significant capital lease obligations.
(b) Assumes interest payments through stated maturity or earlier put dates. For PPL, LKE, LG&E and KU the payments herein are subject to change, aspayments for debt that is or becomes variable-rate debt have been estimated and for PPL, payments denominated in British pounds sterling have beentranslated to U.S. dollars at a current foreign currency exchange rate.
(c) See Note 9 to the Financial Statements for additional information. (d) The amounts include agreements to purchase goods or services that are enforceable and legally binding and specify all significant terms, including: fixed
or minimum quantities to be purchased; fixed, minimum or variable price provisions; and the approximate timing of the transaction. Primarily includes as applicable, the purchase obligations of electricity, coal, natural gas and limestone, as well as certain construction expenditures, which are also included inthe Capital Expenditures table presented above.
(e) The amounts for PPL include WPD's contractual deficit pension funding requirements arising from actuarial valuations performed in March 2016. The U.K. electricity regulator currently allows a recovery of a substantial portion of the contributions relating to the plan deficit. The amounts also include contributions made or committed to be made in 2018 for PPL's and LKE's U.S. pension plans (for PPL Electric, LG&E and KU includes their share of these amounts). Based on the current funded status of these plans, except for WPD's plans, no cash contributions are required. See Note 11 to theFinancial Statements for a discussion of expected contributions.
(f) Represents contracts to purchase coal, natural gas and natural gas transportation. See Note 13 to the Financial Statements for additional information. (g) Represents future minimum payments under OVEC power purchase agreements through June 2040. See Note 13 to the Financial Statements for
additional information. (h) Represents construction commitments, including commitments for LG&E's and KU's Trimble County landfill construction and CCR Rule Closure and
Process Water Program along with LG&E's Mill Creek Gypsum Dewatering and Cane Run plant demolition, which are also reflected in the CapitalExpenditures table presented above.
Dividends/Distributions
(PPL)
PPL views dividends as an integral component of shareowner return and expects to continue to pay dividends in amounts that are within the context of maintaining a capitalization structure that supports investment grade credit ratings. In November 201t 7,PPL declared its quarterly common stock dividend, payable January 2, 2018, at 39.5 cents per share (equivalent to $1.58 per annum). On February 22, 2018, PPL announced that the company is increasing its common stock dividend to 41.0 cents per share on a quarterly basis (equivalent to 1.64 per annum). Future dividends will be declared at the discretion of the Board of Directors and will depend upon future earnings, cash flows, financial and legal requirements and other relevant factors.
See Note 8 to the Financial Statements for information regarding the June 1, 2015 distribution to PPL's shareowners of a newlyformed entity, Holdco, which at closing owned all of the membership interests of PPL Energy Supply and all of the commonstock of Talen Energy.
Subject to certain exceptions, PPL may not declare or pay any cash dividend or distribution on its capital stock during any period in which PPL Capital Funding defers interest payments on its 2007 Series A Junior Subordinated Notes due 2067 or 2013 Series B Junior Subordinated Notes due 2073. At December 31, 2017, no interest payments were deferred.
(PPL Electric, LKE, LG&E and KU)
From time to time, as determined by their respective Board of Directors, the Registrants pay f dividends or distributions, asapplicable, to their respective shareholders or members. Certain of the credit facilities of PPL Electric, LKE, LG&E and KUinclude minimum debt covenant ratios that could effectively restrict the payment of dividends or distributions.
(All Registrants)
See Note 7 to the Financial Statements for these and other restrictions related to distributions on capital interests for theRegistrants and their subsidiaries.
Purchase or Redemption of Debt Securities
The Registrants will continue to evaluate outstanding debt securities and may decide to purchaseuu or redeem these securities inopen market or privately negotiated transactions, in exchange transactions or otherwise, depending upon prevailing market conditions, available cash and other factors, and may be commenced or suspended at any time. The amounts involved may be material.

53
Rating Agency Actions g g y
Moody's and S&P periodically review the credit ratings of the debt of the Registrants and their subsidiaries. Based on their respective independent reviews, the rating agencies may make certain ratings revisions or ratings affirmations.
A credit rating reflects an assessment by the rating agency of the creditworthiness associated with an issuer and particular securities that it issues. The credit ratings of the Registrants and their subsidiaries are based on information provided by the Registrants and other sources. The ratings of Moody's and S&P are not a recommendation to buy, sell or hold any securities of the Registrants or their subsidiaries. Such ratings may be subject to revisions or withdrawal by the agencies at any time and bshould be evaluated independently of each other and any other rating that may be assigned to the securities.
The credit ratings of the Registrants and their subsidiaries affect their liquidity, access to capital markets and cost of borrowing under their credit facilities. A downgrade in the Registrants' or their subsidiaries' credit ratings could result in higher borrowingrrcosts and reduced access to capital markets. The Registrants and their subsidiaries have no credit rating triggers that would result in the reduction of access to capital markets or the acceleration of maturity dates of outstanding debt.
The following table sets forth the Registrants' and their subsidiaries' credit ratings for outstanding debt securities or commercial paper programs as of December 31, 2017.
Senior Unsecured Senior Secured Commercial Paper
Issuer Moody's S&P Moody's S&P Moody's S&P PPL PPL Capital Funding Baa2 BBB+ P-2 A-2WPD plc Baa3 BBB+ WPD (East Midlands) Baa1 A-WPD (West Midlands) Baa1 A-WPD (South Wales) Baa1 A-WPD (South West) Baa1 A-
PPL and PPL Electric PPL Electric A1 A P-2 A-2
PPL and LKE LKE Baa1 BBB+ LG&E A1 A P-2 A-2KU A1 A P-2 A-2
The rating agencies have taken the following actions related to the Registrants and their subsidiaries.
(PPL)
In March 2017, Moody's and S&P assigned ratings of Baa1 and A- to WPD (South Wales)’s £50 million 0.01% Index-linked Senior Notes due 2029.
In September 2017, Moody's and S&P assigned ratings of Baa2 and BBB+ to PPL Capital Funding’s $500 million 4.00% Senior Notes due 2047.
In September 2017, S&P affirmed its ratings with a stable outlook for PPL and PPL Capital Funding.
In November 2017, Moody's and S&P assigned ratings of Baa1 and A- to WPD (South West)'s £250 million 2.375% Senior Notes due 2029.
(PPL Electric)
In January 2017, Moody's and S&P affirmed their commercial paper ratings for PPL Electric's $650 million commercial paper aaprogram.

54
In May 2017, Moody's and S&P assigned ratings of A1 and A to PPL Electric's $475 million 3.95% First Mortgage Bonds due 2047.
In August 2017, Moody's assigned a rating of A1 and S&P confirmed its rating of A for LCIDA's $116 million 1.80% PollutionControl Revenue Refunding Bonds (PPL Electric Utilities Corporation Project) SerL ies 2016A due 2029 and LCIDA's $108 million 1.80% Pollution Control Revenue Refunding Bonds (PPL Electric Utilities Corporation Project) Series 2016B due 2027, each previously issued on behalf of PPL Electric.
In September 2017, S&P affirmed its ratings with a stable outlook for PPL Electric.
(LKE)
In September 2017, S&P affirmed its ratings with a stable outlook for LKE.
(LG&E)
In March 2017, Moody’s assigned a rating of A1 and S&P confirmed its rating of A for the Louisville/Jefferson MetroGovernment of Kentucky's $128 million 1.5% Pollution Control Revenue Bonds, 2003 Series A (Louisville Gas and ElectricCompany Project) due 2033, previously issued on behalf of LG&E.
In May 2017, Moody’s and S&P assigned ratings of A1 and A to the County of Trimble, Kentucky's $60 million 3.75% Environmental Facilities Revenue Bonds, 2017 Series A (Louisville Gas and Electric Company Project) due 2033, issued onbehalf of LG&E.
In May 2017, Moody’s assigned a rating of A1 and in June 2017, S&P confirmed its rating of A for the Louisville/Jefferson Metro Government of Kentucky's $31 million 1.25% Environmental Facilities Revenue Refunding Bonds, 2007 Series A (Louisville Gas and Electric Company Project) due 2033, previously issued on behalf of LG&E.
In May 2017, Moody’s assigned a rating of A1 and in June 2017, S&P confirmed its rating of A for the Louisville/Jefferson Metro Government of Kentucky's $35 million 1.25% Environmental Facilities Revenue Refunding Bonds, 2007 Series B(Louisville Gas and Electric Company Project) due 2033, previously issued on behalf of LG&E.
In September 2017, S&P affirmed its ratings with a stable outlook for LG&E.
(KU)
In July 2017, Moody’s affirmed its rating of Aa2 ff and in August 2017, S&P confirmed its rating of AA for the County of Mercer, Kentucky's $13 million Solid Waste Disposal Facility Revenue Bonds, 2000 Series A (Kentucky Utilities Company Project)due 2023, the County of Carroll, Kentucky's $50 million Environmental Facilities Revenue Bonds, 2004 Series A (Kentucky Utilities Company Project) due 2034, the County of Carroll, Kentucky's $78 million Environmental Facilities Revenue Bonds,2008 Series A (Kentucky Utilities Company Project) due 2032 and the County of Carroll, Kentucky's $54 million Environmental Facilities Revenue Refunding Bonds, 2006 Series B (Kentucky Utilities Company Project) due 2034, each previously issued on behalf of KU.
In September 2017, S&P affirmed its ratings with a stable outlook for KU.
In January 2018, S&P affirmed its rating of AA for the County of Mercer, Kentucky's $13 million Solid Waste Disposal FacilityfRevenue Bonds, 2000 Series A (Kentucky Utilities Company Project) due 2023, the County of Carroll, Kentucky's $50 millionEnvironmental Facilities Revenue Bonds, 2004 Series A (Kentucky Utilities Company Project) due 2034, the County of Carroll, Kentucky's $78 million Environmental Facilities Revenue Bonds, 2008 Series A (Kentucky Utilities Company Project) due 2032 and the County of Carroll, Kentucky's $54 million Environmental Facilities Revenue Refunding Bonds, 2006 Series B (Kentucky Utilities Company Project) due 2034, each previously issued on behalf of KU.
Ratings Triggersg gg
(PPL)
As discussed in Note 7 to the Financial Statements, certain of WPD's senior unsecured notes may be put by the holders to the issuer for redemption if the long-term credit ratings assigned to the notes are withdrawn by any of the rating agencies (Moody's

55
or S&P) or reduced to a non-investment grade rating of Ba1 or BB+ or lower in connection with a restructuring event. A restructuring event includes the loss of, or a material adverse change to, the distribution licenses under which WPD (East Midlands), WPD (South West), WPD (South Wales) and WPD (West Midlands) operate and would be a trigger event for eachcompany. These notes totaled £4.7 billion (approximately $6.4 billion) nominal value at December 31, 2017.
(PPL, LKE, LG&E and KU)
Various derivative and non-derivative contracts, including contracts for the sale and purchase of electricity and fuel, commoditt tytransportation and storage, interest rate and foreign currency instruments (for PPL), contain provisions that require the postingof additional collateral, or permit the counterparty to terminate the contract, if PPL's, LKE's, LG&E's or KU's or their subsidiaries' credit rating, as applicable, were to fall below investment grade. See Note 17 to the Financial Statements for a discussion of "Credit Risk-Related Contingent Features," including a discussion of the potential additional collateralrequirements for PPL, LKE and LG&E for derivative contracts in a net liability position at December 31, 2017.
Guarantees for Subsidiaries (PPL)
PPL guarantees certain consolidated affiliate financing arrangements. Some of the guarantees contain financial and other covenants that, if not met, would limit or restrict the consolidated affiliates' access to funds under these financing arrangements,accelerate maturity of such arrangements or limit the consolidated affiliates' ability to enter into certain transactions. At thistttime, PPL believes that these covenants will not limit access to relevant funding sources. See Note 13 to the Financial Statements for additional information about guarantees.
Off-Balance Sheet Arrangements (All Registrants)
The Registrants have entered into certain agreements that may contingently require payment aa to a guaranteed or indemnified party. See Note 13 to the Financial Statements for a discussion of these agreements.
Risk Management
Market Risk
(All Registrants)
See Notes 1, 16, and 17 to the Financial Statements for information about the Registrants' risk management objectives, valuation techniques and accounting designations.
The forward-looking information presented below provides estimates of what may occur in the future, assuming certain adversemarket conditions and model assumptions. Actual future results may differ materially from those presented. These are not precise indicators of expected future losses, but are rather only indicators of possible losses under normal market conditions at a given confidence level.
Interest Rate Risk
The Registrants and their subsidiaries issue debt to finance their operations, which exposes them to interest rate risk. TheRegistrants and their subsidiaries utilize various financial derivative instruments to adjust the mix of fixed and floating interest rates in their debt portfolios, adjust the duration of their debt portfolios and lock in benchmark interest rates in anticipation of future financing, when appropriate. Risk limits under the risk management program are designed to balance risk exposure tovolatility in interest expense and changes in the fair value of the debt portfolios due to changes in the absolute level of interest rates. In addition, the interest rate risk of certain subsidiaries is potentially mitigf ated as a result of the existing regulatory framework or the timing of rate cases.
The following interest rate hedges were outstanding at December 31.
56
2017 2016
Exposure Hedged
Fair Value,Net - Asset (Liability)
(a)
Effect of a 10%
AdverseMovementin Rates (b)
MaturitiesRangingThrough
ExposureHedged
Fair Value, Net - Asset(Liability)
(a)
Effect of a 10%
AdverseMovement in Rates (b)
PPL Cash flow hedges
Cross-currency swaps (c) $ 702 $ 103 $ (84) 2028 $ 802 $ 191 $ (90) Economic hedges
Interest rate swaps (d) 147 (27) (1) 2033 147 (32) (2) LKE Economic hedges
Interest rate swaps (d) 147 (27) (1) 2033 147 (32) (2) LG&EEconomic hedges
Interest rate swaps (d) 147 (27) (1) 2033 147 (32) (2)
(a) Includes accrued interest, if applicable. (b) Effects of adverse movements decrease assets or increase liabilities, as applicable, which could result in an asset becoming a liability. Sensitivities
represent a 10% adverse movement in interest rates, except for cross-currency swaps which also includes a 10% adverse movement in foreign currency exchange rates.
(c) Changes in the fair value of these instruments are recorded in equity and reclassified into earnings in the same period during which the item being hedged affects earnings.
(d) Realized changes in the fair value of such economic hedges are recoverable through regulated rates and any subsequent changes in the fair value of thesederivatives are included in regulatory assets or regulatory liabilities.
The Registrants are exposed to a potential increase in interest expense and to changes in the fair value of their debt portfolios.The estimated impact of a 10% adverse movement in interest rates on interest expense at December 31, 2017 and 2016 wasinsignificant for PPL, PPL Electric, LKE, LG&E and KU. The estimated impact of a 10% adverse movement in interest rateson the fair value of debt at December 31 is shown below.
10% Adverse Movement in Rates
2017 2016 PPL $ 620 $ 590PPL Electric 162 138LKE 168 182LG&E 62 66KU 92 100
Foreign Currency Risk (PPL)k
PPL is exposed to foreign currency risk primarily through investments in U.K. affiliates. Under its risk management program,ffPPL may enter into financial instruments to hedge certain foreign currency exposures, including translation risk of expected earnings, firm commitments, recognized assets or liabilities, anticipated transactions and net investments.
The following foreign currency hedges were outstanding at December 31.
2017 2016
Exposure Hedged
Fair Value,Net - Asset(Liability)
Effect of a 10%Adverse
Movement in ForeignCurrencyExchangeRates (a)
MaturitiesRangingThrough
ExposureHedged
Fair Value,Net - Asset(Liability)
Effect of a 10%Adverse
Movement in ForeignCurrencyExchangeRates (a)
Economic hedges (b) £ 2,563 $ 15 $ (323) 2020 £ 1,909 $ 184 $ (215)
(a) Effects of adverse movements decrease assets or increase liabilities, as applicable, which could result in an asset becoming a liability. (b) To economically hedge the translation of expected earnings denominated in GBP.

57
(All Registrants)
Commodity Price Risk
PPL is exposed to commodity price risk through its domestic subsidiaries as described below.
• PPL Electric is required to purchase electricity to fulfill its obligation as a PLR. Potential commodity price risk is mitigatedthrough its PUC-approved cost recovery mechanism and full-requirement supply agreements to serve its PLR customerswhich transfer the risk to energy suppliers.
• LG&E's and KU's rates include certain mechanisms for fuel, fuel-related expenses and energy purchases. In addition, LG&E's rates include a mechanism for natural gas supply expenses. These mechanisms generally provide for timely recovery of market price fluctuations associated with these expenses.
Volumetric Risk
PPL is exposed to volumetric risk through its subsidiaries as described below.
• WPD is exposed to volumetric risk which is significantly mitigated as a result of the method of regulation in the U.K. Under the RIIO-ED1 price control regulations, recovery of such exposure occurs on a two year lag. See Note 1 to theFinancial Statements for additional information on revenue recognition under RIIO-ED1.
• PPL Electric, LG&E and KU are exposed to volumetric risk on retail sales, mainly due to weather and other economic conditions for which there is limited mitigation between rate cases. d
Defined Benefit Plans - Equity Securities Price Risk
See "Application of Critical Accounting Policies - Defined Benefits" for additional information regarding the effect of equitysecurities price risk on plan assets.
Credit Risk
(All Registrants)
Credit risk is the risk that the Registrants would incur a loss as a result of nonperformance by counterparties of their contratt ctualobligations. The Registrants maintain credit policies and procedures with respect to counterparty credit (including requirements that counterparties maintain specified credit ratings) and require other assurances in the form of credit support or collateral in certain circumstances in order to limit counterparty credit risk. However, the Registrants, as applicable, have concentrations of suppliers and customers among electric utilities, financial institutions and energy marketing and trading companies. These concentrations may impact the Registrants' overall exposure to credit risk, positively or negatively, as counterparties may be similarly affected by changes in economic, regulatory or other conditions.
(PPL and PPL Electric)
In January 2017, the PUC issued a Final Order approving PPL Electric's PLR procurement plan for the period June 2017through May 2021, which includes a total of eight solicitations for electricity supply semi-annually in April and October. To date, PPL Electric has conducted two of its planned eight competitive solicitations.
Under the standard Supply Master Agreement (the Agreement) for the competitive solicitation process, PPL Electric requires all suppliers to post collateral if their credit exposure exceeds an established credit limit. In the event a supplier defaults on its obligation, PPL Electric would be required to seek replacement power in the market. All incremental costs incurred by PPL Electric would be recoverable from customers in future rates. At December 31, 2017, most of the successful bidders under allof the solicitations had an investment grade credit rating from S&P, and were not required to post collateral under theAgreement. A small portion of bidders were required to post an insignificant amount of collateral under the Agreement. Thereis no instance under the Agreement in which PPL Electric is required to post collateral to its suppliers.
See Note 17 to the Financial Statements for additional information on credit risk.

58
Foreign Currency Translation (PPL)
The value of the British pound sterling fluctuates in relation to the U.S. dollar. In 2017, changes in this exchange rate resulted in a foreign currency translation gain of $537 million, which primarily reflected a $935 million increase to PP&E and $198 million increase to goodwill partially offset by a $549 million increase to long-term debt and an increase of $47 million to other ttnet liabilities. In 2016, changes in this exchange rate resulted in a foreign currency translation loss of $1.1 billion, which primarily reflected a $2.1 billion decrease to PP&E and $490 million decrease to goodwill partially offset by a $1.3 billiondecrease to long-term debt and a decrease of $208 million to other net liabilities. In 2015, changes in this exchange rate resut lted in a foreign currency translation loss of $240 million, which primarily reflected a $472 million decrease to PP&E and $117 million decrease to goodwill partially offset by a $285 million decrease to long-term debt and a decrease of $64 million to otht er net liabilities.
(All Registrants)
Related Party Transactions
The Registrants are not aware of any material ownership interests or operating responsibility by senior management in outsidepartnerships, including leasing transactions with variable interest entities, or other entities doing business with the Registrants.See Note 14 to the Financial Statements for additional information on related party transactions for PPL Electric, LKE, LG&E and KU.
Acquisitions, Development and Divestitures
The Registrants from time to time evaluate opportunities for potential acquisitions, divestitures and development projects.Development projects are reexamined based on market conditions and other factors to determine whether to proceed with,modify or terminate the projects. Any resulting transactions may impact future financial results. See Note 8 to the Financial Statements for information on the more significant activities.
(PPL)
See Note 8 to the Financial Statements for information on the spinoff of PPL Energy Supply.
(All Registrants)
Environmental Matters
Extensive federal, state and local environmental laws and regulations are applicable to PPL's, PPL Electric's, LKE's, LG&E's and KU's air emissions, water discharges and the management of hazardous and solid waste, as well as other aspects of the Registrants' businesses. The cost of compliance or alleged non-compliance cannot be predicted with certainty but could besignificant. In addition, costs may increase significantly if the requirements or scope of environmental laws or regulations, or similar rules, are expanded or changed. Costs may take the form of increased capital expenditures or operating and maintenance expenses, monetary fines, penalties or other restrictions. Many of these environmental law considerations are alsoapplicable to the operations of key suppliers, or customers, such as coal producers and industrial power users, and may impact the cost for their products or their demand for the Registrants' services. Increased capital aaa nd operating costs are subject to rate recovery. PPL, PPL Electric, LKE, LG&E and KU can provide no assurances as to the ultimate outcome of futureenvironmental or rate proceedings before regulatory authorities.
See Note 13 to the Financial Statements for a discussion of the more significant environmental matters including: Legal Matters, NAAQS, Climate Change, CCRs, and ELGs. See "Financial Condition - Liquidity and Capital Resources - Forecasted Uses of Cash - Capital Expenditures" in "Combined Management's Discussion and Analysis of Financial Condition and Results of Operations" for information on projected environmental capital expenditures for 2018 through 2022. See Note 19 to theFinancial Statements for information related to the impacts of CCRs on AROs.
Sustainability
Increasing attention has been focused on a broad range of corporate activities under the heading of “sustainability”, which hasresulted in a significant increase in the number of requests from interested parties for information on sustainability topics. These parties range from investor groups focused on environmental, social, governance and other matters to non-investors

59
concerned with a variety of public policy matters. Often the scope of the information sought is very broad and not necessarily relevant to an issuer’s business or industry. As a result, a number of private groups have proposed to standardize the subject matter constituting sustainability, either generally or by industry. Those efforts remain ongoing. In addition, certain of thesyy e private groups have advocated that the SEC promulgate regulations requiring specific sustainability reporting under the Securities Exchange Act of 1934, as amended (the “’34 Act”), or that issuers voluntarily include certain sustainability disclosure in their ’34 Act reports. To date, no new reporting requirements have been adopted or proposed by the SEC.
As has been PPL’s practice, to the extent sustainability issues have or may have a material impact on the Registrants’ financialcondition or results of operation, PPL discloses such matters in accordance with applicable securities law and SEC regulations.With respect to other sustainability topics that PPL deems relevant to investors but that are not required to be reported underapplicable securities law and SEC regulation, PPL will continue each spring to publish its annual sustainability report and post that report on its corporate website at www.pplweb.com and on www.pplsustainability.com. Neither the information in such annual sustainability report nor the information at such websites is incorporated in this Form 10-K by reference, and it shouldnot be considered a part of this Form 10-K. In preparing its sustainability report, PPL is guided by the framework established by the Global Reporting Initiative, which identifies environmental, social, governance and other subject matter categories, together with recent efforts by the Edison Electric Institute to provide guidance as to the appropriate subset of sustainability ttinformation that can be applied consistently across the electric utility industry.
Cybersecurity
See “Cybersecurity Management” in “Business” for a discussion of cybersecurity risks affecting the Registrants and the related strategies for managing these risks.
Competition
See "Competition" under each of PPL's reportable segments in "Business - General - Segment Information" for a discussion of competitive factors affecting the Registrants.
New Accounting Guidance g
See Note 21 to the Financial Statements for a discussion of new accounting guidance pending adoption.
Application of Critical Accounting Policies pp g
Financial condition and results of operations are impacted by the methods, assumptions and estimates used in the application ofcritical accounting policies. The following accounting policies are particularly important to an understanding of the reported financial condition or results of operations and require management to make estimates or other judgments of matters that areinherently uncertain. Changes in the estimates or other judgments included within these accounting policies could result in a significant change to the information presented in the Financial Statements (these accounting policies are also discussed in Note 1 to the Financial Statements). Senior management has reviewed with PPL's Audit Committee these critical accountingpolicies, the following disclosures regarding their application, and the estimates and assumptions regarding them.
Defined Benefits
(All Registrants)
Certain of the Registrants and/or their subsidiaries sponsor or participate in, as applicable, certain qualified funded and nonaa -qualified unfunded defined benefit pension plans and both funded and unfunded other postretirement benefit plans. These plansare applicable to the majority of the Registrants' employees (based on eligibility for their applicable plans). The Registrants and certain of their subsidiaries record an asset or liability to recognize the funded status of all defined benefit plans with an offsetting entry to AOCI or, in the case of PPL Electric, LG&E and KU, regulatory assets and liabilities for amounts that are expected to be recovered through regulated customer rates. Consequently, the funded status of all defined benefit plans is fully recognized on the Balance Sheets. See Notes 6 and 11 to the Financial Statements for additional information about the plansand the accounting for defined benefits.
A summary of plan sponsors by Registrant and whether a Registrant or its subsidiaries sponsor (S) or participate in and receivesallocations (P) from those plans is shown in the table below.

60
Plan Sponsor PPL PPL Electric LKE LG&E KUPPL Services S P WPD (a) S LKE S P P LG&E S
(a) Does not sponsor or participate in other postretirement benefits plans.
Management makes certain assumptions regarding the valuation of benefit obligations and the performance of plan assets. As such, annual net periodic defined benefit costs are recorded in current earnings or regulatory assets based on estimated results. Any differences between actual and estimated results are recorded in AOCI, or in the case of PPL Electric, LG&E and KU, regulatory assets and liabilities for amounts that are expected to be recovered through regulated customer rates. These amountsin AOCI or regulatory assets and liabilities are amortized to income over future periods. The delayed recognition allows for a smoothed recognition of costs over the working lives of the employees who benefit under the plans. The primary assumptionsare:
• Discount Rate - The discount rate is used in calculating the present value of benefits, which is based on projections of benefit payments to be made in the future. The objective in selecting the discount rate is to measure the single amount that, if invested at the measurement date in a portfolio of high-quality debt instruments, would provide the necessary future cash flows to pay the accumulated benefits when due.
• Expected Return on Plan Assets - Management projects the long-term rates of return on t plan assets that will be earned over the life of the plan. These projected returns reduce the net benefit costs the Registrants record currently.
• Rate of Compensation Increase - Management projects employees' annual pay increases, which are used to project employees' pension benefits at retirement.
• Health Care Cost Trend Rate - Management projects the expected increases in the cost of health care.
In addition to the economic assumptions above that are evaluated annually, Management must also make assumptionsregarding the life expectancy of employees covered under their defined benefit pension and other postretirement benefit plans.
• U.S. - at December 31, 2014, the plan sponsors adopted the mortality tables issued by the Society of Actuaries in October 2014 (RP-2014 base tables) for all U.S. defined benefit pension and other postretirement benefit plans. In addition, at December 31, 2017, the plan sponsors updated the basis for estimating projected mortality improvements and selected theMP-2017 improvement scale for all U.S. defined benefit pension and other postretirement benefit plans. This new mortality assumption reflects the expectation of lower ongoing improvements in life expectancies.
• U.K. - at March 31 2016, the U.K. plan sponsors adopted the new mortality assumptions based on the “SAPS S2 All” tables issued by the Self-Administered Pensions Schemes’ (SAPS) study for all U.K. defined benefit pension plans. In addition, the U.K. plan sponsors updated the basis for estimating projected mortality improvements and selected the CMI 2015 Core Projections model published by the Continuous Mortality Investigation study with a long-term futureimprovement rate of 1% for all U.K. defined benefit pension plans. These new mortality assumptions reflect the impact of the most recently available actual scheme mortality data (which has been higher than previously expected) on both current life expectancies and the expectation of continuing improvements in life expectancies. The use of the new base tables and fimprovement scale resulted in a decrease to U.K. defined benefit pension obligations, a decrease to future expense and an increase to funded status.
(PPL)
In selecting the discount rate for its U.K. pension plans, WPD starts with a cash flow analysis of the expected benefit paymentstream for its plans. These plan-specific cash flows are matched against a spot-rate yield curve to determine the assumed discount rate. The spot-rate yield curve uses an iBoxx British pounds sterling denominated corporate bond index as its base.From this base, those bonds with the lowest and highest yields are eliminated to develop an appropriate subset of bonds.Historically, WPD used the single weighted-average discount rate derived from the spot rates used to discount the benefit obligation. Concurrent with the annual remeasurement of plan assets and obligations at December 31, 2015, WPD began using individual spot rates to measure service cost and interest cost beginning with thet calculation of 2016 net periodic defined benefit cost.

61
An individual bond matching approach, which is used for the U.S. pension plans as discussed below, is not used for the U.K. pension plans because the universe of bonds in the U.K. is not deep enough to adequately support such an approach.
(All Registrants)
In selecting the discount rates for U.S. defined benefit plans, the plan sponsors start with a cash flow analysis of the expected benefit payment stream for their plans. The plan-specific cash flows are matched against the coupons and expected maturityvalues of individually selected bonds. This bond matching process begins with the full universe of Aa-rated non-callable (or callable with make-whole provisions) bonds, serving as the base from which those with the lowest and highest yields are eliminated to develop an appropriate subset of bonds. Individual bonds are then selected based on the timing of each plan's cashflows and parameters are established as to the percentage of each individual bond issue that could be hypothetically purchased and the surplus reinvestment rates to be assumed.
To determine the expected return on plan assets, plan sponsors project the long-term rates of return on plan assets using a besf t-estimate of expected returns, volatilities and correlations for each asset class. Each plan's specific current and expected asset allocations are also considered in developing a reasonable return assumption.
In selecting a rate of compensation increase, plan sponsors consider past experience in light of movements in inflation rates. f
The following table provides the weighted-average assumptions selected for discount rate, expected return on plan assets and rate of compensation increase at December 31 used to measure current year obligations and subsequent year net periodic defined benefit costs under GAAP, as applicable.
Assumption / Registrant 2017 2016 Discount rate
Pension - PPL (U.S.) 3.70% 4.21%Pension - PPL (U.K.) Obligations 2.65% 2.87%Pension - PPL (U.K.) Service Cost (a) 2.73% 2.99%Pension - PPL (U.K.) Interest Cost (a) 2.31% 2.41%Pension - LKE 3.69% 4.19%Pension - LG&E 3.65% 4.13%Other Postretirement - PPL 3.64% 4.11%Other Postretirement - LKE 3.65% 4.12%
Expected return on plan assets Pension - PPL (U.S.) 7.25% 7.00%Pension - PPL (U.K.) 7.23% 7.22%Pension - LKE 7.25% 7.00%Pension - LG&E 7.25% 7.00%Other Postretirement - PPL 6.40% 6.21%Other Postretirement - LKE 7.15% 6.82%
Rate of compensation increase Pension - PPL (U.S.) 3.78% 3.95%Pension - PPL (U.K.) 3.50% 3.50%Pension - LKE 3.50% 3.50%Other Postretirement - PPL 3.75% 3.92%Other Postretirement - LKE 3.50% 3.50%
(a) WPD began using individual spot rates from the yield curve used to discount the benefit obligation to measure service cost and interest cost for thecalculation of net periodic defined benefit cost in 2016. PPL's U.S. plans use a single discount rate derived from an individual bond matching model to measure the benefit obligation, service cost and interest cost. See Note 1 to the Financial Statements for additional details.
In selecting health care cost trend rates, plan sponsors consider past performance and forecasts of health care costs. At December 31, 2017, the health care cost trend rate for all plans was 6.6% for 2018, gradually declining to an ultimate trend rate of 5.0% in 2022.

62
A variance in the assumptions listed above could have a significant impact on accrued defined benefit liabilities or assets,reported annual net periodic defined benefit costs and AOCI or regulatory assets and liabilities. At December 31, 2017, the defined benefit plans were recorded in the Registrants' financial statements as follows.
PPL PPL Electric LKE LG&E KUBalance Sheet:
Regulatory assets (a) $ 880 $ 504 $ 376 $ 234 $ 142Regulatory liabilities 27 27 27Pension assets 284
246 369 45 36Other postretirement and postemploymentbbenefit liabilities 184 62 107 74 32AOCI (pre-tax) 3,144 150
Statement of Income: Defined benefits expense $ (87) $ 12 $ 33 $ 11 $ 5Increase (decrease) from prior year (52) 1 3 — (2)
(a) As a result of the 2014 Kentucky rate case settlement that became effective July 1, 2015, the difference between pension cost calculated in accordancewith LG&E's and KU's pension accounting policy and pension cost calculated using a 15 year amortization period for actuarial gains and losses isrecorded as a regulatory asset. At December 31, 2017, the balances were $33 million for PPL and LKE, $18 million for LG&E and $15 million for KU. See Note 6 to the Financial Statements for additional information.
The following tables reflect changes in certain assumptions based on the Registrants' primary defined benefit plans. The tablesreflect either an increase or decrease in each assumption. The inverse of this change would impact the accrued defined benefit liabilities or assets, reported annual net periodic defined benefit costs and AOCI or regulatory assets and liabilities by a siff milar amount in the opposite direction. The sensitivities below reflect an evaluation of the change based solely on a change in that assumption. Actuarial assumptionDiscount Rate (0.25%) Expected Return on Plan Assets (0.25%) Rate of Compensation Increase 0.25 % Health Care Cost Trend Rate (a) 1 %
(a) Only impacts other postretirement benefits.
Increase (Decrease)
(Increase)Decrease
Increase(Decrease)
Increase(Decrease)
Actuarial assumption Defined Benefit
Liabilities AOCI
(pre-tax) Net Regulatory
AssetsDefined Benefit
CostsPPL
Discount rates $ 520 $ 416 $ 104 $ 43Expected return on plan assets n/a n/a n/a 27Rate of compensation increase 72 60 12 9Health care cost trend rate (a) 4 — 4 —
PPL Electric Discount rates 64 — 64 4Expected return on plan assets n/a — n/a 4Rate of compensation increase 8 — 8 1Health care cost trend rate (a) 1 — 1 —
LKE Discount rates 68 28 40 8Expected return on plan assets n/a n/a n/a 3Rate of compensation increase 10 5 5 2Health care cost trend rate (a) 3 — 3 —
LG&EDiscount rates 21 n/a 21 3Expected return on plan assets n/a n/a n/a 1

63
Increase (Decrease)
(Increase)Decrease
Increase(Decrease)
Increase(Decrease)
Actuarial assumption Defined Benefit
Liabilities AOCI
(pre-tax) Net Regulatory
AssetsDefined Benefit
CostsRate of compensation increase 2 n/a 2 —Health care cost trend rate (a) 1 n/a 1 —
KUDiscount rates 18 n/a 18 2Expected return on plan assets n/a n/a n/a 1Rate of compensation increase 3 n/a 3 —Health care cost trend rate (a) 2 n/a 2 —
(a) Only impacts other postretirement benefits.
Income Taxes (All Registrants)
The Registrants have completed or made reasonable estimates of the effects of the TCJA and reflected these amounts in their December 31, 2017 financial statements. The Registrants continue to evaluate the application of the TCJA and have used significant management judgment to make certain assumptions concerning the application of various components of the law in the calculation of 2017 income tax expense. The current and deferred components of the income tax expense calculations that the Registrants consider provisional due to uncertainty either with respect to the technical application of the law or thequantification of the impact of the law include (but are not limited to): tax depreciation, deductible executive compensation, and the accumulated foreign earnings used to calculate the deemed dividend included in PPL's taxable income in 2017 alongwith the impact of associated foreign tax credits and related valuation allowances. The Registrants believe that classification of nthese items as provisional is appropriate. The Registrants have accounted for these items based on their interpretation of theTCJA.
Further interpretive guidance on the TCJA from the IRS, Treasury, the Joint Committee on Taxation through its "Blue Book" or from Congress in the form of Technical Corrections may differ from the Registrants' interpretation of the TCJA.aa
Significant management judgment is also required in developing the Registrants' provision for income taxes, primarily due tothe uncertainty related to tax positions taken or expected to be taken in tax returns, valuation allowances on deferred tax assetsand whether the undistributed earnings of WPD are considered indefinitely reinvested. d
Significant management judgment is required to determine the amount of benefit recognized related to an uncertain taxposition. Tax positions are evaluated following a two-step process. The first step requires an entity to determine whether, based on the technical merits supporting a particular tax position, it is more likely than not (greater than a 50% chance) that the tax position will be sustained. This determination assumes that the relevant taxing authority will examine the tax position and isaware of all the relevant facts surrounding the tax position. The second step requires an entity to recognize in the financial statements the benefit of a tax position that meets the more-likely-than-not recognition criterion. The benefit recognized is measured at the largest amount of benefit that has a likelihood of realization, upon settlement, that exceeds 50%. Management considers a number of factors in assessing the benefit to be recognized, includiff ng negotiation of a settlement.
On a quarterly basis, uncertain tax positions are reassessed by considering information known as of the reporting date. Based yon management's assessment of new information, a tax benefit may subsequently be recognized for a previously unrecognized tax position, a previously recognized tax position may be derecognized, or the benefit of a previously recognized tax positionmay be remeasured. The amounts ultimately paid upon resolution of issues raised by taxing authorities may differ materiallyfrom the amounts accrued and may materially impact the financial statements in the future. Unrecognized tax benefits are classified as current to the extent management expects to settle an uncertain tax position by payment or receipt of cash withinone year of the reporting date.
At December 31, 2017, no significant changes in unrecognized tax benefits are projected over the next 12 months.
The need for valuation allowances to reduce deferred tax assets also requires significant management judgment. Valuation allowances are initially recorded and reevaluated each reporting period by assessing the likelihood of the ultimate realization of na deferred tax asset. Management considers a number of factors in assessing the realization of a deferred tax asset, including the reversal of temporary differences, future taxable income and ongoing prudent and feasible tax planning strategies. Any tax planning strategy utilized in this assessment must meet the recognition and measurement criteria utilized to account for an

64
uncertain tax position. Management also considers the uncertainty posed by political risk and the effect of this uncertainty onffthe various factors that management takes into account in evaluating the need for valuation allowances. The amount of deferred tax assets ultimately realized may differ materially from the estimates utilized in the computation of valuation allowances andmay materially impact the financial statements in the future.
See Note 5 to the Financial Statements for income tax disclosures, including the impact of the TCJA and management'sconclusion that the undistributed earnings of WPD are considered indefinitely reinvested. Based on this conclusion, PPL Global ndoes not record U.S. federal income taxes on WPD's undistributed earnings.
Regulatory Assets and Liabilities
(All Registrants)
PPL Electric, LG&E and KU, are subject to cost-based rate regulation. As a result, the effects of regulatory actions are required to be reflected in the financial statements. Assets and liabilities are recorded that result from the regulated ratemaking procm essthat may not be recorded under GAAP for non-regulated entities. Regulatory assets generally represent incurred costs that have been deferred because such costs are probable of future recovery in regulated customer rates. Regulatory liabilities arerecognized for amounts expected to be returned through future regulated customer rates. In certain cases, regulatory liabilities are recorded based on an understanding or agreement with the regulator that rates have been set to recover costs that areexpected to be incurred in the future, and the regulated entity is accountable for any amounts charged pursuant to such rates andaanot yet expended for the intended purpose.
Management continually assesses whether the regulatory assets are probable of future recovery by considering factors such as ychanges in the applicable regulatory and political environments, the ability to recover costs through regulated rates, recent rate orders to other regulated entities, and the status of any pending or potential deregulation legislation. Based on this continualassessment, management believes the existing regulatory assets are probable of recovery. This assessment reflects the current political and regulatory climate at the state and federal levels, and is subject to change in the future. If future recovery of costsfceases to be probable, the regulatory asset would be written-off. Additionally, the regulatory agencies can provide flexibility in ythe manner and timing of recovery of regulatory assets.
See Note 6 to the Financial Statements for regulatory assets and regulatory liabilities recorded at December 31, 2017 and 2016,as well as additional information on those regulatory assets and liabilities. All regulatory assets are either currently beingrecovered under specific rate orders, represent amounts that are expected to be recovered in future rates or benefit future periods based upon established regulatory practices.
(PPL)
WPD operates in an incentive-based regulatory structure under distribution licenses granted by Ofgem. As the regulatory model is incentive-based rather than a cost recovery model, WPD is not subject to accounting for the effects of certain types of regulation as prescribed by GAAP for entities subject to cost-based rate regulation. Therefore, the accounting treatment of adjustments to base demand revenue and/or allowed revenue is primarily evaluated based on revenue recognition guidance. SeeNote 1 to the Financial Statements for additional information.
Price Risk Management (PPL)
See "Financial Condition - Risk Management" above, as well as "Price Risk Management" in Note 1 to the FinancialStatements.
Goodwill Impairment (PPL, LKE, LG&E and KU)
Goodwill is tested for impairment at the reporting unit level. PPL has determined its reporting units to be at the same level as its reportable segments. LKE, LG&E and KU are individually single operating and reportable segments. A goodwill impairment test is performed annually or more frequently if events or changes in circumstances indicate that the carrying amount of the reporting unit may be greater than the reporting unit's fair value. Additionally, goodwill is tested for impairment after a portionrrof goodwill has been allocated to a business to be disposed of.
PPL, LKE, LG&E and KU may elect either to initially make a qualitative evaluation about the likelihaa ood of an impairment of goodwill or to bypass the qualitative evaluation and test goodwill for impairment using a two-step quantitative test. If the qualitative evaluation (referred to as "step zero") is elected and the assessment results in a determination that it is not more

65
likely than not that the fair value of a reporting unit is less than the carrying amount, the two-step quantitative impairment test is not necessary.
When the two-step quantitative impairment test is elected or required as a result of the step zero assessment, in step one, PPL,LKE, LG&E and KU determine whether a potential impairment exists by comparing the estimated fair value of a reporting unit with its carrying amount, including goodwill, on the measurement date. If the estimated fair value exceeds its carrying amount,goodwill is not considered impaired. If the carrying amount exceeds the estimated fair value, the second step is performed to measure the amount of impairment loss, if any.
The second step of the quantitative test requires a calculation of the implied fair value of goodwill, which is determined in the same manner as the amount of goodwill in a business combination. That is, the estimated fair value of a reporting unit isallocated to all of the assets and liabilities of that reporting unit as if the reportinf g unit had been acquired in a business combination and the estimated fair value of the reporting unit was the price paid to acquire the reporting unit. The excess of theestimated fair value of a reporting unit over the amounts assigned to its assets and liabilities is the implied fair value of goodwill. The implied fair value of the reporting unit's goodwill is then compared with the carrying amount of that goodwill. If the carrying amount exceeds the implied fair value, an impairment loss is recognized in an amount equal to that excess. Thetloss recognized cannot exceed the carrying amount of the reporting unit's goodwill.
PPL's goodwill was $3.3 billion at December 31, 2017, which consists of $2.6 billion related to the acquisition of WPD and $662 million related to the acquisition of LKE. PPL (for its U.K. Regulated and Kentucky Regulated segments), and individually, LKE, LG&E and KU elected to perform the qualitative step zero evaluation of goodwill, as of October 1, 2017. These evaluations considered the excess of fair value over the carrying value of each reporting unit that was calculated duringstep one of the quantitative impairment tests performed in the fourth quarter of 2015, and the relevant events and circumstances that occurred since those tests were performed including:
• current year financial performance versus the prior year; • changes in planned capital expenditures; • the consistency of forecasted free cash flows; • earnings quality and sustainability; • changes in market participant discount rates; • changes in long-term growth rates; • changes in PPL's market capitalization; and • the overall economic and regulatory environments in which these regulated entities operate.
Based on these evaluations, management concluded it was not more likely than not that the fair value of these reporting unitstwas less than their carrying values. As such, the two-step quantitative impairment test was not performed.
Asset Retirement Obligations (PPL, LKE, LG&E and KU)
ARO liabilities are required to be recognized for legal obligations associatedd with the retirement of long-lived assets. The initial obligation is measured at its estimated fair value. An ARO must be recognized when incurred if the fair value of the ARO canbe reasonably estimated. An equivalent amount is recorded as an increase in the value of the capitalized asset and amortized toexpense over the useful life of the asset. For LKE, LG&E and KU, all ARO accretion and depreciation expenses are reclassified as a regulatory asset. ARO regulatory assets associated with certain CCR projects are amortized to expense in accordance with regulatory approvals. For other AROs, at the time of retirement, the related ARO regulatory asset is offset against the associated cost of removal regulatory liability, PP&E and ARO liability.
See Note 19 to the Financial Statements for additional information on AROs.
In determining AROs, management must make significant judgments and estimates to calculate fair value. Fair value isdeveloped using an expected present value technique based on assumptions of market participants that consider estimated retirement costs in current period dollars that are inflated to the anticipated retirement date and then discounted back to the datethe ARO was incurred. Changes in assumptions and estimates included within the calculations of the fair value of AROs could result in significantly different results than those identified and recorded in the financial statements. Estimated ARO costs and settlement dates, which affect the carrying value of the ARO and the related capitalized asset, are reviewed periodically toensure that any material changes are incorporated into the latest estimate of the ARO. Any change to the capitalized asset,positive or negative, is generally amortized over the remaining life of the associated long-lived asset.
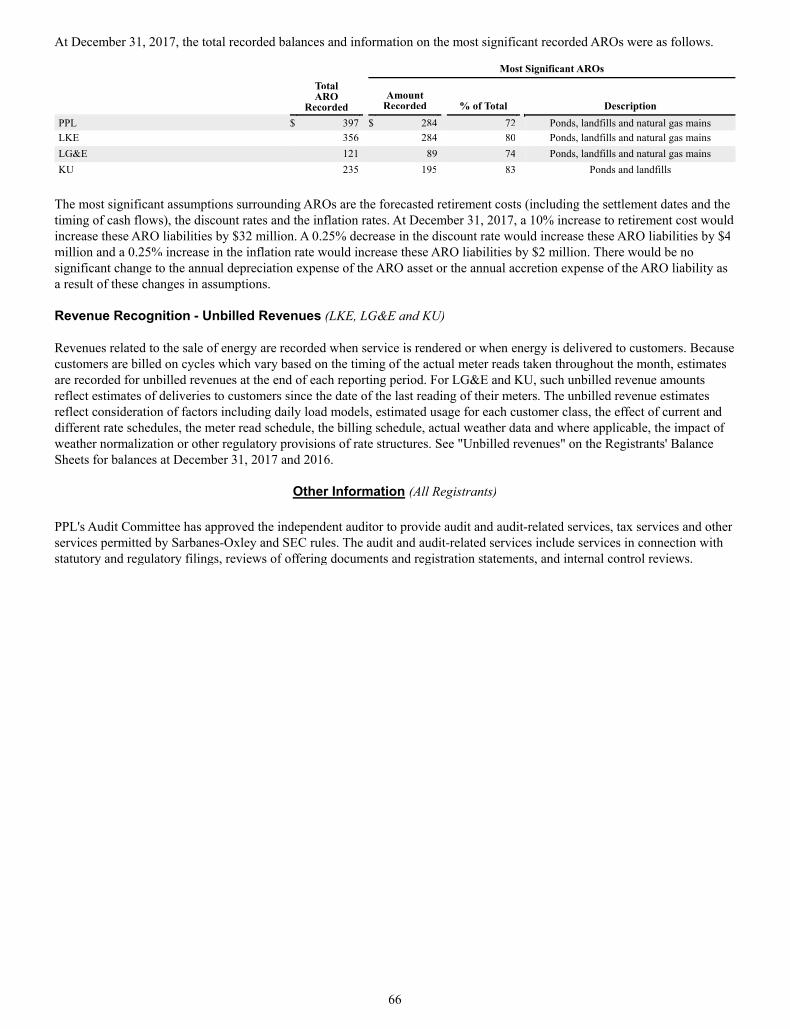
66
At December 31, 2017, the total recorded balances and information on the most significant recorded AROs were as follows.
Most Significant AROs TotalARO
RecordedAmount
Recorded % of Total Description PPL $ 397 $ 284 72 Ponds, landfills and natural gas mainsLKE 356 284 80 Ponds, landfills and natural gas mainsLG&E 121 89 74 Ponds, landfills and natural gas mainsKU 235 195 83 Ponds and landfills
The most significant assumptions surrounding AROs are the forecasted retirement costs (including the settlement dates and the timing of cash flows), the discount rates and the inflation rates. At December 31, 2017, a 10% increase to retirement cost would increase these ARO liabilities by $32 million. A 0.25% decrease in the discount rate would increase these ARO liabilities by $4million and a 0.25% increase in the inflation rate would increase these ARO liabilities by $2 million. There would be nosignificant change to the annual depreciation expense of the ARO asset or the annual accretion expense of the ARO liability asa result of these changes in assumptions.
Revenue Recognition - Unbilled Revenues (LKE, LG&E and KU)
Revenues related to the sale of energy are recorded when service is rendered or when energy is delivered to customers. Becausecustomers are billed on cycles which vary based on the timing of the actual meter reads taken throughout the month, estimates are recorded for unbilled revenues at the end of each reporting period. For LG&E and KU, such unbilled revenue amountsreflect estimates of deliveries to customers since the date of the last reading of their meters. The unbilled revenue estimatesreflect consideration of factors including daily load models, estimated usage for each customer class, the effect of current and different rate schedules, the meter read schedule, the billing schedule, actual weather data and where applicable, the impact of weather normalization or other regulatory provisions of rate structures. See "Unbilled revenues" on the Registrants' BalanceSheets for balances at December 31, 2017 and 2016.
Other Information (All Registrants)
PPL's Audit Committee has approved the independent auditor to provide audit and audit-related services, tax services and other services permitted by Sarbanes-Oxley and SEC rules. The audit and audit-related services include services in connection with statutory and regulatory filings, reviews of offering documents and registration sf tatements, and internal control reviews.

REPORT OF INDEPENDENT REGISTERED PUBLIC ACCOUNTING FIRM
To the Shareowners and the Board of Directors of PPL Corporation
Opinion on the Financial Statements
We have audited the accompanying consolidated balance sheets of PPL Corporation and subsidiaries (the "Company") as of December 31, 2017 and 2016, the related consolidated statements of income, comprehensive income, equity, and cash flows, for the years then ended, and the related notes(collectively referred to as the "financial statements"). In our opinion, the financial statements present fairly, in all material respects, the financial position of the Company as of December 31, 2017 and 2016, and the results of its operations and its cash flows for the years then ended, in conformity with accounting principles generally accepted in the United States of America.
We have also audited, in accordance with the standards of the Public Company Accounting Oversight Board (United States) (PCAOB), the Company's internal control over financial reporting as of December 31, 2017, based on criteria established in Internal Control — Integrated Framework (2013) issued by the Committee of Sponsoring Organizations of the Treadway Commission and our report dated February 22,2018, expressed an unqualified opinion on the Company's internal control over financial reporting.
Basis for Opinion
These financial statements are the responsibility of the Company's management. Our responsibility is to express an opinion on the Company's financial statements based on our audits. We are a public accounting firm registered with the PCAOB and are required to be independent with respect to theCompany in accordance with the U.S. federal securities laws and the applicable rules and regulations of the Securities and Exchange Commission and the PCAOB.
We conducted our audits in accordance with the standards of the PCAOB. Those standards require that we plan and perform the audit to obtain reasonable assurance about whether the financial statements are free of material misstatement, whether due to error or fraud. Our audits included performing procedures to assess the risks of material misstatement of the financial statements, whether due to error or fraud, and performing procedures that respond to those risks. Such procedures included examining, on a test basis, evidence regarding the amounts and disclosures in the financial statements. Our audits also included evaluating the accounting principles used and significant estimates made by management, as well as evaluating the overall presentation of the financial statements. We believe that our audits provide a reasonable basis for our opinion.
Parsippany, New Jersey February 22, 2018
We have served as the Company's auditor since 2015.
67

REPORT OF INDEPENDENT REGISTERED PUBLIC ACCOUNTING FIRM
To the Shareowners and the Board of Directors of PPL Corporation
Opinion on Internal Control over Financial Reporting
We have audited the internal control over financial reporting of PPL Corporation and subsidiaries (the "Company") as of December 31, 2017, based on criteria established in Internal Control — Integrated Framework (2013)— I issued by the Committee of Sponsoring Organizations of the Treadway Commission (COSO). In our opinion, the Company maintained, in all material respects, effective internal control over financial reporting as of December31, 2017, based on criteria established in Internal Control — Integrated Framework (2013) issued by COSO.
We have also audited, in accordance with the standards of the Public Company Accounting Oversight Board (United States) (PCAOB), the consolidated financial statements as of and for the year ended December 31, 2017, of the Company and our report dated February 22, 2018, expressed an unqualified opinion on those financialstatements.
Basis for Opinion
The Company’s management is responsible for maintaining effective internal control over financial reporting and for its assessment of the effectiveness of internal control over financial reporting, included in the accompanying Management’s Report on Internal Control over Financial Reporting. Our responsibility is toexpress an opinion on the Company’s internal control over financial reporting based on our audit. We are appublic accounting firm registered with the PCAOB and are required to be independent with respect to the Company in accordance with the U.S. federal securities laws and the applicable rules and regulations of the Securities and Exchange Commission and the PCAOB.
We conducted our audit in accordance with the standards of the PCAOB. Those standards require that we plan andperform the audit to obtain reasonable assurance about whether effective internal control over financial reportingwas maintained in all material respects. Our audit included obtaining an understanding of internal control over financial reporting, assessing the risk that a material weakness exists, testing and evaluating the design and operating effectiveness of internal control based on the assessed risk, and performing such other procedures as weconsidered necessary in the circumstances. We believe that our audit provides a reasonable basis for our opinion.
Definition and Limitations of Internal Control over Financial Reporting
A company's internal control over financial reporting is a process designed to provide reasonable assurance regarding the reliability of financial reporting and the preparation of financial statements for external purposes in accordance with generally accepted accounting principles. A company's internal control over financial reporting includes those policies and procedures that (1) pertain to the maintenance of records that, in reasonable detail, accurately and fairly reflect the transactions and dispositions of the assets of the company; (2) provide reasonable assurance that transactions are recorded as necessary to permit preparation of financial statements in accordance with generally accepted accounting principles, and that receipts and expenditures of the company are being madeonly in accordance with authorizations of management and directors of the company; and (3) provide reasonable assurance regarding prevention or timely detection of unauthorized acquisition, use, or disposition of thecompany's assets that could have a material effect on the financial statements.
Because of its inherent limitations, internal control over financial reporting may not prevent or detect misstatements. Also, projections of any evaluation of effectiveness to future periods are subject to the risk that controls may become inadequate because of changes in conditions, or that the degree of compliance with the policies or procedures may deteriorate.
Parsippany, New Jersey February 22, 2018
68

Report of Independent Registered Public Accounting Firm
The Board of Directors and Shareowners of PPL Corporation
We have audited the accompanying consolidated statements of income, comprehensive income, equity, and cashflows of PPL Corporation and subsidiaries for the year ended December 31, 2015. These financial statements are theresponsibility of the Company's management. Our responsibility is to express an opinion on these financialstatements based on our audit.
We conducted our audit in accordance with the standards of the Public Company Accounting Oversight Board (United States). Those standards require that we plan and perform the audit to obtain reasonable assurance aboutwhether the financial statements are free of material misstatement. An audit includes examining, on a test basis, evidence supporting the amounts and disclosures in the financial statements. An audit also includes assessing theaccounting principles used and significant estimates made by management, as well as evaluating the overallfinancial statement presentation. We believe that our audit provides a reasonable basis for our opinion.
In our opinion, the financial statements referred to above present fairly, in all material respects, the consolidated results of operations and cash flows of PPL Corporation and subsidiaries for the year ended December 31, 2015, in conformity with U.S. generally accepted accounting principles.
We also have audited, in accordance with the standards of the Public Company Accounting Oversight Board (United States), PPL Corporation and subsidiaries' internal control over financial reporting as of December 31, 2015, based on criteria established in Internal Control-Integrated Framework issued by the Committee of Sponsoring Organizations of the Treadway Commission (2013 framework) and our report dated February 19, 2016, expressed an unqualified opinion thereon.
Philadelphia, Pennsylvania February 19, 2016
69

70
FINANCIAL STATEMENTS AND SUPPLEMENTARY DATA
CONSOLIDATED STATEMENTS OF INCOME FOR THE YEARS ENDED DECEMBER 31, PPL Corporation and Subsidiaries (Millions of Dollars, except share data)
2017 2016 2015 Operating Revenues $ 7,447 $ 7,517 $ 7,669
gOperating Expenses
Operation Fuel 759 791 863Energy purchases 685 706 855Other operation and maintenance 1,635 1,745 1,938
Depreciation 1,008 926 883Taxes, other than income 292 301 299Total Operating Expenses 4,379 4,469 4,838
Operating Income 3,068 3,048 2,831
Other Income (Expense) - net (255) 390 108
Interest Expense 901 888 871
Income from Continuing Operations Before Income Taxes 1,912 2,550 2,068
Income Taxes 784 648 465
Income from Continuing Operations After Income Taxes 1,128 1,902 1,603
Loss from Discontinued Operations (net of income taxes) (Note 8) — — (921)
Net Income $ 1,128 $ 1,902 $ 682
Earnings Per Share of Common Stock: Income from Continuing Operations After Income Taxes Available to PPL Common Shareowners:
Basic $ 1.64 $ 2.80 $ 2.38Diluted $ 1.64 $ 2.79 $ 2.37
Net Income Available to PPL Common Shareowners:Basic $ 1.64 $ 2.80 $ 1.01Diluted $ 1.64 $ 2.79 $ 1.01
Dividends Declared Per Share of Common Stock $ 1.58 $ 1.52 $ 1.50
Weighted-Average Shares of Common Stock Outstanding (in thousands) Basic 685,240 677,592 669,814Diluted 687,334 680,446 672,586
The accompanying Notes to Financial Statements are an integral part of the financial statements.

71
CONSOLIDATED STATEMENTS OF COMPREHENSIVE INCOME FOR THE YEARS ENDED DECEMBER 31,PPL Corporation and Subsidiaries (Millions of Dollars)
2017 2016 2015 Net income $ 1,128 $ 1,902 $ 682
Other comprehensive income (loss): Amounts arising during the period - gains (losses), net of tax (expense) benefit:
Foreign currency translation adjustments, net of tax of ($1), ($4), $1 538 (1,107) (234)Available-for-sale securities, net of tax of $0, $0, ($9) — — 8Qualifying derivatives, net of tax of $19, ($18), $0 (79) 91 26Defined benefit plans:
Prior service costs, net of tax of $0, $2, $6 — (3) (9)Net actuarial gain (loss), net of tax of $72, $40, $67 (308) (61) (366)
Reclassifications to net income - (gains) losses, net of tax expense (benefit):Available-for-sale securities, net of tax of $0, $0, $2 — — (2)Qualifying derivatives, net of tax of ($18), $21, ($15) f 73 (91) 2Equity investees' other comprehensive (income) loss, net of tax of $0, $0, $0 1 (1) (1)Defined benefit plans:
Prior service costs, net of tax of ($1), ($1), $0 1 1 —NNet actuarial (gain) loss, net of tax of ($37), ($35), ($46) 130 121 146
Total other comprehensive income (loss) 356 (1,050) (430)
Comprehensive income $ 1,484 $ 852 $ 252
The accompanying Notes to Financial Statements are an integral part of the financial statements.

72
CONSOLIDATED STATEMENTS OF CASH FLOWS FOR THE YEARS ENDED DECEMBER 31, PPL Corporation and Subsidiaries (Millions of Dollars)
2017 2016 2015 Cash Flows from Operating Activities
NNet income $ 1,128 $ 1,902 $ 682Loss from discontinued operations (net of income taxes) — — 921Income from continuing operations (net of income taxes) 1,128 1,902 1,603Adjustments to reconcile Income from continuing operations (net of taxes) to net cash provided by (used in) operating activities - continuing operations
Depreciation 1,008 926 883Amortization 97 80 59Defined benefit plans - expense (income) (95) (40) 56Deferred income taxes and investment tax credits 707 560 428Unrealized (gains) losses on derivatives, and other hedging activities 178 19 (77) Stock compensation expense 38 28 31Other (9) (12) (14)
Change in current assets and current liabilities Accounts receivable (33) (15) 47Accounts payable (10 ) 57 (116) Unbilled revenues (48) (63) 54Fuel, materials and supplies 40 (3) 24Taxes payable 3 31 (175) Regulatory assets and liabilities, net (12 ) (59) 42Other 14 (32) (7)
Other operating activities Defined benefit plans - funding (565) (427) (499) Settlement of interest rate swaps 2 (9) (101) Other assets 30 42 (19) Other liabilities (12 ) (95) 53NNet cash provided by operating activities - continuing operations 2,461 2,890 2,272
Net cash provided by operating activities - discontinued operations — — 343NNet cash provided by operating activities 2,461 2,890 2,615
Cash Flows from Investing Activities Expenditures for property, plant and equipment (3,133) (2,920) (3,533) Expenditures for intangible assets (38 ) (37) (37)Proceeds from the sale of other investments — 2 136Other investing activities 15 37 (5)
NNet cash used in investing activities - continuing operations (3,156) (2,918) (3,439)Net cash used in investing activities - discontinued operations — — (149)
NNet cash used in investing activities (3,156) (2,918) (3,588)Cash Flows from Financing Activities
Issuance of long-term debt 1,515 1,342 2,236Retirement of long-term debt (168 ) (930) (1,000) Issuance of common stock 453 144 203Payment of common stock dividends (1,072 ) (1,030) (1,004) NNet increase in short-term debt 115 29 94Other financing activities (19 ) 6 (47)
NNet cash provided by (used in) financing activities - continuing operations 824 (439) 482Net cash used in financing activities - discontinued operations — — (546) NNet cash distributions to parent from discontinued operations — — 132
Net cash provided by (used in) financing activities 824 (439) 68Effect of Exchange Rates on Cash and Cash Equivalents 15 (28) (10)Net (Increase) Decrease in Cash and Cash Equivalents included in Discontinued Operations — — 352Net Increase (Decrease) in Cash and Cash Equivalents 144 (495) (563)Cash and Cash Equivalents at Beginning of Period 341 836 1,399Cash and Cash Equivalents at End of Period $ 485 $ 341 $ 836
Supplemental Disclosures of Cash Flow Information Cash paid (received) during the period for:
Interest - net of amount capitalized $ 845 $ 854 $ 822Income taxes - net $ 65 $ 70 $ 179
Significant non-cash transactions: Accrued expenditures for property, plant and equipment at December 31, $ 360 $ 281 $ 310Accrued expenditures for intangible assets at December 31, $ 68 $ 117 $ 55
The accompanying Notes to Financial Statements are an integral part of the financial statements.

73
CONSOLIDATED BALANCE SHEETS AT DECEMBER 31,PPL Corporation and Subsidiaries (Millions of Dollars, shares in thousands)
2017 2016
AssetsCurrent Assets
Cash and cash equivalents $ 485 $ 341Accounts receivable (less reserve: 2017, $51; 2016, $54)
Customer 681 666Other 100 46
Unbilled revenues 543 480Fuel, materials and supplies 320 356Prepayments 66 63Price risk management assets 49 63Other current assets 50 52Total Current Assets 2,294 2,067
Property, Plant and Equipment Regulated utility plant 38,228 34,674Less: accumulated depreciation - regulated utility plant 6,785 6,013
Regulated utility plant, net 31,443 28,661Non-regulated property, plant and equipment 384 413Less: accumulated depreciation - non-regulated property, plant and equipment 110 134
Non-regulated property, plant and equipment, net 274 279Construction work in progress 1,375 1,134Property, Plant and Equipment, net 33,092 30,074
Other Noncurrent Assets Regulatory assets 1,504 1,918Goodwill 3,258 3,060Other intangibles 697 700Pension benefit asset 284 9Price risk management assets 215 336Other noncurrent assets 135 151Total Other Noncurrent Assets 6,093 6,174
Total Assets $ 41,479 $ 38,315
The accompanying Notes to Financial Statements are an integral part of the financial statements.

74
CONSOLIDATED BALANCE SHEETS AT DECEMBER 31,PPL Corporation and Subsidiaries (Millions of Dollars, shares in thousands)
2017 2016
Liabilities and EquityCurrent Liabilities
Short-term debt $ 1,080 $ 923Long-term debt due within one year 348 518Accounts payable 924 820Taxes 105 101Interest 282 270Dividends 273 259Customer deposits 292 276Regulatory liabilities 95 101Other current liabilities 624 569Total Current Liabilities 4,023 3,837
Long-term Debt 19,847 17,808
Deferred Credits and Other Noncurrent Liabilities Deferred income taxes 2,462 3,889Investment tax credits 129 132Accrued pension obligations 800 1,001Asset retirement obligations 312 428Regulatory liabilities 2,704 899Other deferred credits and noncurrent liabilities 441 422Total Deferred Credits and Other Noncurrent Liabilities 6,848 6,771
Commitments and Contingent Liabilities (Notes 6 and 13)
Equity
Common stock - $0.01 par value (a) 7 7Additional paid-in capital 10,305 9,841Earnings reinvested 3,871 3,829Accumulated other comprehensive loss (3,422) (3,778)Total Equity 10,761 9,899
Total Liabilities and Equity $ 41,479 $ 38,315
(a) 1,560,000 shares authorized; 693,398 and 679,731 shares issued and outstanding at December 31, 2017 and December 31, 2016.
The accompanying Notes to Financial Statements are an integral part of the financial statements.

75
CONSOLIDATED STATEMENTS OF EQUITY PPL Corporation and Subsidiaries (Millions of Dollars)
PPL Shareowners Common
stock shares outstanding
(a)Common
stock
Additional paid-in capital
Earningsreinvested
Accumulated other
comprehensiveloss Total
December 31, 2014 665,849 $ 7 $ 9,433 $ 6,462 $ (2,274) $ 13,628Common stock issued 8,008 249 249Stock-based compensation 5 5Net income 682 682Dividends and dividend equivalents (1,010) (1,010)Distribution of PPL Energy Supply (Note 8) (3,181) (24) (3,205) Other comprehensive income (loss) ) (430)December 31, 2015 673,857 $ 7 $ 9,687 $ 2,953 $ (2,728) $ 9,919
Common stock issued 5,874 185 185Stock-based compensation (31) (31)Net income 1,902 1,902Dividends and dividend equivalents (1,033) (1,033)Other comprehensive income (loss) (1,050) (1,050) Adoption of stock-based compensation guidancedcumulative effect adjustment (Note 1) 7 7December 31, 2016 679,731 $ 7 $ 9,841 $ 3,829 $ (3,778) $ 9,899
Common stock issued 13,667 482 482Stock-based compensation (18) (18)Net income 1,128 1,128Dividends and dividend equivalents (1,086) (1,086)Other comprehensive income (loss) 356 356December 31, 2017 693,398 $ 7 $ 10,305 $ 3,871 $ (3,422) $ 10,761
(a) Shares in thousands. Each share entitles the holder to one vote on any question presented at any shareowners' meeting.
The accompanying Notes to Financial Statements are an integral part of the financial statements.

76
COMBINED NOTES TO FINANCIAL STATEMENTS
1. Summary of Significant Accounting Policies
(All Registrants)
General
Capitalized terms and abbreviations appearing in the combined notes to financial statements are defined in the glossary. Dollars are in millions, except per share data, unless otherwise noted. The specific Registrant to which disclosures are applicable is identified in parenthetical headings in italics above the applicable disclosure or within the applicable disclosure for each Registrants' related activities and disclosures. Within combined disclosures, amounts are disclosed for any Registrant when significant.
Business and Consolidation
(PPL)
PPL is a utility holding company that, through its regulated subsidiaries, is primarily engaged in: 1) the distribution of electricity in the U.K.; 2) the generation, transmission, distribution and sale of electricity and the distribution and sale of naturalfgas, primarily in Kentucky; and 3) the transmission, distribution and sale of electricity in Pennsylvania. Headquartered in Allentown, PA, PPL's principal subsidiaries are PPL Global, LKE (including its principal subsidiaries, LG&E and KU) and PPL Electric. PPL's corporate level financing subsidiary is PPL Capital Funding.
WPD, a subsidiary of PPL Global, through indirect, wholly owned subsidiaries, operates distribution networks providingelectricity service in the U.K. WPD serves end-users in South Wales and southwest and central England. Its principalsubsidiaries are WPD (South Wales), WPD (South West), WPD (East Midlands) and WPD (West Midlands).
PPL consolidates WPD on a one-month lag. Material events, such as debt issuances that occur in the lag period, are recognized in the current period financial statements. Events that are significant but not material are disclosed.
(PPL and PPL Electric)
PPL Electric is a cost-based rate-regulated utility subsidiary of PPL. PPL Electric's principal business is the transmission anddistribution of electricity to serve retail customers in its franchised territory in eastern and central Pennsylvania and the regulated supply of electricity to retail customers in that territory as a PLR.
(PPL, LKE, LG&E and KU)
LKE is a utility holding company with cost-based rate-regulated utility operations through its subsidiaries, LG&E and KU.LG&E and KU are engaged in the generation, transmission, distribution and sale of electricity. LG&E also engages in thedistribution and sale of natural gas. LG&E and KU maintain their separate identities and serve customers in Kentucky under their respective names. KU also serves customers in Virginia under the Old Dominion Power name and in Tennessee under the aKU name.
(PPL)
"Loss from Discontinued Operations (net of income taxes)" on the 2015 Statement of Income includes the activities of PPL tEnergy Supply, substantially representing PPL's former Supply segment, which was spun off and distributed to PPL shareowners on June 1, 2015. In addition, the Statement of Cash Flows for the same period separately reports the cash flows of the discontinued operations. See Note 8 for additional information.
(All Registrants)
The financial statements of the Registrants include each company's own accounts as well as the accounts of all entities in which the company has a controlling financial interest. Entities for which a controlling financial interest is not demonstrated throuaa ghvoting interests are evaluated based on accounting guidance for Variable Interest Entities (VIEs). The Registrants consolidate a VIE when they are determined to have a controlling interest in the VIE, and as a result are the primary beneficiary of the entity. The Registrants are not the primary beneficiary in any VIEs. Investments in entities in which a company has the ability to
77
exercise significant influence but does not have a controlling fit nancial interest are accounted for under the equity method. Allother investments are carried at cost or fair value. All significant intercompany transactions have been eliminated.
The financial statements of PPL, LKE, LG&E and KU include their share of any undivided interests in jointly owned facilities, as well as their share of the related operating costs of those facilities. See Note 12 for additional information.
Regulation g
(PPL)
WPD operates in an incentive-based regulatory structure under distribution licenses granted by Ofgem. Electricity distributionffrevenues are set by Ofgem for a given time period through price control reviews that are not directly based on cost recovery.The price control formula that governs WPD's allowed revenue is designed to provide economic incentives to minimizeoperating, capital and financing costs. As a result, WPD is not subject to accounting for the effects of certain types of regulation as prescribed by GAAP and does not record regulatory assets and liabilities.
(PPL Electric, LG&E and KU)
PPL Electric, LG&E and KU are cost-based rate-regulated utilities for which rates are set by regulators to enable PPL Electric,LG&E and KU to recover the costs of providing electric or gas service, as applicable, and to provide a reasonable return toshareholders. Base rates are generally established based on a future test period. As a result, the financial statements are subject bto the accounting for certain types of regulation as prescribed by GAAP and reflect the effects of regulatory actions. Regulatory assets are recognized for the effect of transactions or events where future recovery of underlying costs is probable in regulated customer rates. The effect of such accounting is to defer certain or qualifying costs that would otherwise currently be charged todexpense. Regulatory liabilities are recognized for amounts expected to be returned through future regulated customer rates. Incertain cases, regulatory liabilities are recorded based on an understanding or agreement with the regulator that rates have been set to recover costs that are expected to be incurred in the future, and the regulated entity is accountable for any amounts charged pursuant to such rates and not yet expended for the intended purpose. The accounting for regulatory assets and regulatory liabilities is based on specific ratemaking decisions or precedent for each transaction or event as prescribed by the FERC or the applicable state regulatory commissions. See Note 6 for additional details regarding regulatory matters.
Accounting Records g
The system of accounts for domestic regulated entities is maintained in accordance with the Uniform System of Accountsprescribed by the FERC and adopted by the applicable state regulatory commissions.
(All Registrants)
Use of Estimates
The preparation of financial statements in conformity with GAAP requires management to make estimates and assumptions Pthat affect the reported amounts of assets and liabilities, the disclosure of contingent liabilities at the date of the financialstatements and the reported amounts of revenues and expenses during the reporting period. Actual results could differ from those estimates.
Loss Accruals
Potential losses are accrued when (1) information is available that indicates it is "probable" that a loss has been incurred, giventhe likelihood of the uncertain future events and (2) the amount of the loss can bef reasonably estimated. Accounting guidancedefines "probable" as cases in which "the future event or events are likely to occur." The Registrants continuously assesspotential loss contingencies for environmental remediation, litigation claims, regulatory penalties and other events. Lossaccruals for environmental remediation are discounted when appropriate.
The accrual of contingencies that might result in gains is not recorded, unless realization is assured.
78
EPS is computed using the two-class method, which is an earnings allocation method for computing EPS that treats a participating security as having rights to earnings that would otherwise have been available to common shareowners. Share-based payment awards that provide recipients a non-forfeitable right to dividends or dividend equivalents are considered participating securities.
Price Risk Management
(All Registrants)
Interest rate contracts are used to hedge exposure to changes in the fair value of debt instruments and to hedge exposure tovariability in expected cash flows associated with existing floating-rate debt instruments or forecasted fixed-rate issuances of debt. Foreign currency exchange contracts are used to hedge foreign currency exposures, primarily associated with PPL's investments in U.K. subsidiaries. Similar derivatives may receive different accounting treatment, depending on management's intended use and documentation.
Certain contracts may not meet the definition of a derivative because they lack a notional amount or a net settlement provision.In cases where there is no net settlement provision, markets are periodically assessed to determine whether market mechanismshave evolved that would facilitate net settlement. Certain derivative contracts may be excluded from the requirements of aaderivative accounting treatment because NPNS has been elected. These contracts are accounted for using accrual accounting.Contracts that have been classified as derivative contracts are reflected on the balance sheets at fair value. The portion of derivative positions that deliver within a year are included in "Current Assets" and "Current Liabilities," while the portion of derivative positions that deliver beyond a year are recorded in "Other Noncurrent Assets" and "Deferred Credits and Other tNoncurrent Liabilities."
Cash inflows and outflows related to derivative instruments are included as a component of operating, investing or financingactivities on the Statements of Cash Flows, depending on the classification of the hedged items.
PPL and its subsidiaries have elected not to offset net derivative positions against the right to reclaim cash collateral (areceivable) or the obligation to return cash collateral (a payable) under master netting arrangements.
(PPL)
Processes exist that allow for subsequent review and validation of the contract information as it relates to interest rate and foreign currency derivatives. The accounting department provides the treasury department with guidelines on appropriateaccounting classifications for various contract types and strategies. Examples of accounting guidelines provided to the treasury rrdepartment staff include, but are not limited to:
• Transactions to lock in an interest rate prior to a debt issuance can be designated as cash flow hedges, to the extent theforecasted debt issuances remain probable of occurring.
• Cross-currency transactions to hedge interest and principal repayments can be designated as cash flow hedges.
• Transactions to hedge fluctuations in the fair value of existing debt can be designated as fair value hedges. f
• Transactions to hedge the value of a net investment of foreign operations can be designated as net investment hedges.
• Derivative transactions that do not qualify for cash flow or net investment hedge trff eatment are marked to fair value through earnings. These transactions generally include foreign currency forwards and options to hedge GBP-denominated earningstranslation risk associated with PPL's U.K. subsidiaries that report their financial statements in GBP. As such, these transactions reduce earnings volatility due solely to changes in foreign currency exchange rates.
(All Registrants)
• Derivative transactions may be marked to fair value through regulatory assets/liabilities at PPL Electric, LG&E and KU if approved by the appropriate regulatory body. These transactions generally include the effect of interest rate swaps that areincluded in customer rates.
Earnings Per Share (PPL)

79
(PPL and PPL Electric)
To meet its obligation as a PLR to its customers, PPL Electric has entered into certain contracts that meet the definition of aderivative. However, NPNS has been elected for these contracts.
See Notes 16 and 17 for additional information on derivatives.
Revenue
(PPL)
Operating Revenues p g
For the years ended December 31, the Statements of Income "Operating Revenues" line item contains revenue from thefollowing:
2017 2016 2015 Domestic electric and gas revenues (a) $ 5,351 $ 5,297 $ 5,239U.K. operating revenues (b) 2,091 2,207 2,410Domestic - other 5 13 20Total $ 7,447 $ 7,517 $ 7,669
(a) Represents revenues from cost-based rate-regulated generation, transmission and/or distribution in Pennsylvania, Kentucky, Virginia and Tennessee, including regulated wholesale revenue.
(b) Primarily represents regulated electricity distribution revenues from the operation of WPD's distribution networks.
Revenue Recognition g
(All Registrants)
Operating revenues are primarily recorded based on energy deliveries through the end of the calendar month. Unbilled retailrevenues result because customers' bills are rendered throughout the month, rather than bills being rendered at the end of themonth. For LKE, LG&E and KU, unbilled revenues for a month are calculated by multiplying an estimate of unbilled kWh by the estimated average cents per kWh. Any difference between estimated and actual revenues is adjusted the following month when the previous unbilled estimate is reversed and actual billings occur. For PPL Electric, unbilled revenues for a month are calculated by multiplying the actual unbilled kWh by an average rate per customer class.
(PPL)
WPD is currently operating under the eight-year price control period of RIIO-ED1, which commenced for electric distribution companies on April 1, 2015. Ofgem has adopted a price control mechanism that establishes the amount of base demand revenueWPD can earn, subject to certain true-ups, and provides for an increase or reduction in revenues based on incentives or penalties for performance relative to pre-established targets. WPD's allowed revenue primarily includes base demand revenue(adjusted for inflation using RPI), performance incentive revenues/penalties and adjustments for over or under-recovery from prior periods.
As the regulatory model is incentive based rather than a cost recovery model, WPD is not subject to accounting for the effects of certain types of regulation as prescribed by GAAP. Therefore, the accounting treatment of adjustments to base demand revenue and/or allowed revenue is evaluated primarily based on revenue recognition accounting guidance.
Unlike prior price control reviews, base demand revenue under RIIO-ED1 is adjusted during the price control period. The most significant of those adjustments are:
• Inflation True-Up - The base demand revenue for the RIIO-ED1 period was set based on 2012/13 prices. Therefore aninflation factor as determined by forecasted RPI, provided by HM Treasury, is applied to base demand revenue. Forecasted RPI is trued up to actuals and affects future base demand revenue two regulatory years later. This revenuechange is called the "TRU" adjustment.

80
• Annual Iteration Process (AIP) - The RIIO-ED1 price control period also includes an AIP. This will allow future base demand revenues agreed with the regulator as part of the price control review, to be updated during the price control period for financial adjustments including tax, pensions, cost of debt, legacy price control adjustments from preceding price control periods and adjustments relating to actual and allowed total expenditure together with the Totex IncentivettMechanism (TIM). Under the TIM, WPD's DNOs are able to retain 70% of any amounts not spent against the RIIO-ED1 plan and bear 70% of any over-spends. The AIP calculates an incremental change to base demand revenue, known as the "MOD" adjustment.
As both MOD and TRU are changes to future base demand revenues as determined by Ofgem, these adjustments are recognized as a component of revenues in future years in which service is provided and revenues are collected or returned tocustomers.
In addition to base demand revenue, certain other items are added or subtracted to arrive at allowed revenue. The most significant of these are:
• Incentives - Ofgem has established incentives to provide opportunities for DNO's to enhance overall returns by improving aanetwork efficiency, reliability and customer service. These incentives can result in an increase or reduction in revenues based on incentives or penalties for actual performance against pre-established targets based on past performance. Theannual incentives and penalties are reflected in customers' rates on a two-year lag from the time they are earned and/or assessed. Incentive revenues and penalties are included in revenues when they are billed to customers.
• Correction Factor - During the current price control period, WPD sets its tariffs to recover allowed revenue. However, inany fiscal period, WPD's revenue could be negatively affected if its tariffs and the volume delivered do not fully recover the revenue allowed for a particular period. Conversely, WPD could also over-recover revenue. Over and under-recoveries are subtracted from or added to allowed revenue in future years when they are billed to customers, known as the"Correction Factor" or "K-factor." Over and under-recovered amounts arising for the periods beginning with the 2014/15regulatory year and refunded/recovered under RIIO-ED1 will be refunded/recovered on a two year lag (previously oneyear). Therefore the 2014/15 over/under-recovery adjustment occurred in the 2016/17 regulatory year.
Accounts Receivable
(All Registrants)
Accounts receivable are reported on the Balance Sheets at the gross outstanding amount adjusted for an allowance for doubtful accounts.
Allowance for Doubtful Accounts
Accounts receivable collectability is evaluated using a combination of factors, including past due status based on contractual terms, trends in write-offs and the age of the receivable. Specific events, such as bankruptcies, are also considered whenapplicable. Adjustments to the allowance for doubtful accounts are made when necessary based on the results of analysis, theaging of receivables and historical and industry trends.
Accounts receivable are written off in the period in which the receivable is deemed uncollectible.
The changes in the allowance for doubtful accounts were:
AdditionsBalance at
Beginning of Period
Charged to Income
Charged to Other
Accounts Deductions
(a) Balance at
End of Period PPL 2017 $ 54 $ 28 $ (1) $ 30 $ 512016 41 44 — 31 542015 44 49 (2) 50 41
PPL Electric 2017 $ 28 $ 18 $ — $ 22 $ 242016 16 35 — 23 282015 17 39 — 40 16

81
AdditionsBalance at
Beginning of Period
Charged to Income
Charged to Other
Accounts Deductions
(a) Balance at
End of Period
LKE 2017 $ 24 $ 8 $ (1) $ 6 $ 252016 23 8 — 7 242015 25 9 (2) 9 23
LG&E 2017 $ 2 $ 2 $ (1) $ 2 $ 12016 1 2 1 2 22015 2 2 — 3 1
KU 2017 $ 2 $ 4 $ (1) $ 4 $ 12016 2 4 — 4 22015 2 5 — 5 2
(a) Primarily related to uncollectible accounts written off.
Cash
(All Registrants)
Cash Equivalentsq
All highly liquid investments with original maturities of three months or less are considered to be cash equivalents.
(PPL and PPL Electric)
Restricted Cash and Cash Equivalents q
Bank deposits and other cash equivalents that are restricted by agreement or that have been clearly designated for a specific dpurpose are classified as restricted cash and cash equivalents. The change in restricted cash and cash equivalents is reported asan investing activity on the Statements of Cash Flows. On the Balance Sheets, the current portion of restricted cash and cashequivalents is included in "Other current assets," while the noncurrent portion is included in "Other noncurrent assets."
At December 31, the balances of restricted cash and cash equivalents included the following:
PPL PPL Electric 2017 2016 2017 2016
Low carbon network fund (a) $ 17 $ 17 $ — $ —Other 9 9 2 2
Total $ 26 $ 26 $ 2 $ 2
(a) Funds received by WPD, which are to be spent on approved initiatives to support a low carbon environment.
(All Registrants)
Fair Value Measurements
The Registrants value certain financial and nonfinancial assets and liabilities at fair value. Generally, the most significant fair value measurements relate to price risk management assets and liabilities, investments in securities in defined benefit plans, and cash and cash equivalents. PPL and its subsidiaries use, as appropriate, a market approach (generally, data from market transactions), an income approach (generally, present value techniques and option-pricing models) and/or a cost approach(generally, replacement cost) to measure the fair value of an asset or liability. These valuation approaches incorporate inputssuch as observable, independent market data and/or unobservable data that management believes are predicated on thea

82
assumptions market participants would use to price an asset or liability. These inputs may incorporate, as applicable, certainrisks such as nonperformance risk, which includes credit risk.
The Registrants classify fair value measurements within one of three levels in the fair value hierarchy. The level assigned to a fair value measurement is based on the lowest level input that is significant to the fair value measurement in its entirety. The three levels of the fair value hierarchy are as follows:
• Level 1 - quoted prices (unadjusted) in active markets for identical assets or liabilities that are accessible at the measurement date. Active markets are those in which transactions for the asset or liability occur with sufficient frequency and volume to provide pricing information on an ongoing basis.
• Level 2 - inputs other than quoted prices included within Level 1 that are either directly or indirectly observable for substantially the full term of the asset or liability.
• Level 3 - unobservable inputs that management believes are predicated on the assumptions market participants would useto measure the asset or liability at fair value.
Assessing the significance of a particular input requires judgment that considers factors specific to the asset or liability. As such, the Registrants' assessment of the significance of a particular input may affect how the assets and liabilities are classrr ified within the fair value hierarchy.
Investments
(All Registrants)
Generally, the original maturity date of an investment and management's intent and ability to sell an investment prior to its original maturity determine the classification of investments as either short-term or long-term. Investments that would otherwise be classified as short-term, but are restricted as to withdrawal or use for other than current operations or are clearlyaadesignated for expenditure in the acquisition or construction of noncurrent assets or for the liquidation of long-term debts, are aclassified as long-term.
Short-term Investments
Short-term investments generally include certain deposits as well as securities that are considered highly liquid or provide for periodic reset of interest rates. Investments with original maturities greater than three months and less than a year, as wellr asinvestments with original maturities of greater than a year that management has the ability and intent to sell within a year, areaaincluded in "Other current assets" on the Balance Sheets.
(PPL, LKE, LG&E and KU)
Cost Method Investment
LG&E and KU each have an investment in OVEC, which is accounted for using the cost method. The investment is recorded in "Other noncurrent assets" on the PPL, LKE, LG&E and KU Balance Sheets. LG&E and KU and ten other electric utilities areequity owners of OVEC. OVEC's power is currently supplied to LG&E and KU and 11 other companies affiliated with thevarious owners. LG&E and KU own 5.63% and 2.5% of OVEC's common stock. Pursuant to a power purchase agreement, LG&E and KU are contractually entitled to their ownership percentage of OVEC's output, which is approximately 120 MW for LG&E and approximately 53 MW for KU.
LG&E's and KU's combined investment in OVEC is not significant. The direct exposure to loss as a result of LG&E's and KU'sinvolvement with OVEC is generally limited to the value of their investments; however, LG&E and KU are conditionallyresponsible for a pro-rata share of certain OVEC obligations, pursuant to their power purchase contract with OVEC. As part of PPL's acquisition of LKE, the value of the power purchase contract was recorded as an intangible asset with an offsetting regulatory liability, both of which are being amortized using the units-of-production method until March 2026. See Notes 6, 13 and 18 for additional discussion of the power purchase agreement.

83
Long-Lived and Intangible Assets
Property, Plant and Equipmentp y, q p
(All Registrants)
PP&E is recorded at original cost, unless impaired. PP&E acquired in business combinations is recorded at fair value at thetime of acquisition. If impaired, the asset is written down to fair value at that time, which becomes the new cost basis of theasset. Original cost for constructed assets includes material, labor, contractor costs, certain overheads and financing costs, where applicable. The cost of repairs and minor replacements are charged to expense as incurred. The Registrants record costs associated with planned major maintenance projects in the period in which the costs are incurred. No costs associated withnplanned major maintenance projects are accrued to PP&E in advance of the period in which the work is performed. LG&E and KU accrue costs of removal net of estimated salvage value through depreciation, which is included in the calculation of customer rates over the assets' depreciable lives in accordance with regulatory practices. Cost of removal amounts accrued through depreciation rates are accumulated as a regulatory liability until the removal costs are incurred. For LKE, LG&E and KU, all ARO depreciation expenses are reclassified to a regulatory asset. See "Asset Retirement Obligations" below and Note 6 for additional information. PPL Electric records net costs of removal when incurred as a regulatory asset. The regulatory assetis subsequently amortized through depreciation over a five-year period, which is recoverable in customer rates in accordancewith regulatory practices.
AFUDC is capitalized at PPL Electric as part of the construction costs for cost-based rate-regulated projects for which a returnrron such costs is recovered after the project is placed in service. The debt component of AFUDC is credited to "Interest mmExpense" and the equity component is credited to "Other Income (Expense) - net" on the Statements of Income. LG&E and KUgenerally do not record AFUDC, except for certain instances in KU's FERC approved rates charged to its municipal customers, as a return is provided on construction work in progress.
(PPL)
PPL capitalizes interest costs as part of construction costs. Capitalized interest, including thaa e debt component of AFUDC for PPL, was $11 million in 2017, 2016 and 2015.
Depreciation p
(All Registrants)
Depreciation is recorded over the estimated useful lives of property using various methods including the straight-line,composite and group methods. When a component of PP&E that was depreciated under the composite or group method istretired, the original cost is charged to accumulated depreciation. When all or a significant portion of an operating unit that was depreciated under the composite or group method is retired or sold, the property and the related accumulated depreciationaccount is reduced and any gain or loss is included in income, unless otherwise required by regulators.
Following are the weighted-average annual rates of depreciation, for regulated utility plant, for the years ended December 31:
2017 2016 2015 PPL 2.65% 2.73% 2.57%PPL Electric 2.86% 2.63% 2.46%LKE 3.64% 3.69% 3.69%LG&E 3.63% 3.58% 3.65%KU 3.66% 3.77% 3.71%
(All Registrants)
Goodwill and Other Intangible Assetsg
Goodwill represents the excess of the purchase price paid over the fair value of the identifiable net assets acquired in a businesscombination.
Other acquired intangible assets are initially measured based on their fair value. Intangibles that have finite useful lives areamortized over their useful lives based upon the pattern in which the economic benefits of the intangible assets are consumed

84
or otherwise used. Costs incurred to obtain an initial license and renew or extend terms of licenses are capitalized as intangirr ble iassets.
When determining the useful life of an intangible asset, including intangible assets that are renewed or extended, PPL and itssubsidiaries consider:
• the expected use of the asset; • the expected useful life of other assets to which the useful life of the intangible asset may relate; • legal, regulatory, or contractual provisions that may limit the useful life;• the company's historical experience as evidence of its ability to support renewal or extension; • the effects of obsolescence, demand, competition, and other economic factors; and, • the level of maintenance expenditures required to obtain the expected future cash flows from the asset.
Asset Impairment (Excluding Investments)p ( g )
The Registrants review long-lived assets that are subject to depreciation or amortization, including finite-lived intangibles, for impairment when events or circumstances indicate carrying amounts may not be recoverable.
A long-lived asset classified as held and used is impaired when the carrying amount of the asset exceeds the sum of the dundiscounted cash flows expected to result from the use and eventual disposition of the asset. If impaired, the asset's carrying value is written down to its fair value.
A long-lived asset classified as held for sale is impaired when the carrying amount of the asset (disposal group) exceeds its fair ffvalue less cost to sell. If impaired, the asset's (disposal group's) carrying value is written down to its fair value less cost to sell. t
PPL, LKE, LG&E and KU review goodwill for impairment at the reporting unit level annually or more frequently when events or circumstances indicate that the carrying amount of a reporting unit may be greater than the unit's fair value. Additionally,goodwill must be tested for impairment in circumstances when a portion of goodwill has been allocated to a business to bedisposed. PPL's, LKE's, LG&E's and KU's reporting units are at the operating segment level.
PPL, LKE, LG&E and KU may elect either to initially make a qualitative evaluation about the likelihaa ood of an impairment of goodwill or to bypass the qualitative evaluation and test goodwill for impairment using a two-step quantitative test. If thequalitative evaluation (referred to as "step zero") is elected and the assessment results in a determination that it is not morelikely than not that the fair value of a reporting unit is less than the carrying amount, the two-step quantitative impairment test is not necessary. However, the quantitative impairment test is required if management concludes it is more likely than not thatthe fair value of a reporting unit is less than the carrying amount based on the step zero assessment.
If the carrying amount of the reporting unit, including goodwill, exceeds its fair value, the implied fair value of goodwill must be calculated in the same manner as goodwill in a business combination. The fair value of a reporting unit is allocated to all assets and liabilities of that unit as if the reporting unit had been acquired in a business combination. The excess of the fair value of the reporting unit over the amounts assigned to its assets and liabilities is the implied fair value of goodwill. If thettimplied fair value of goodwill is less than the carrying amount, goodwill is written down to its implied fair value.
PPL (for its U.K. Regulated and Kentucky Regulated segments), and individually, LKE, LG&E and KU elected to perform thequalitative step zero evaluation of goodwill as of October 1, 2017. These evaluations considered the excess of fair value over the carrying value of each reporting unit that was calculated during step one of the quantitative impairment tests performed inthe fourth quarter of 2015, and the relevant events and circumstances that occurred since those tests were performed including:
• current year financial performance versus the prior year; • changes in planned capital expenditures; • the consistency of forecasted free cash flows; • earnings quality and sustainability;• changes in market participant discount rates; • changes in long-term growth rates;• changes in PPL's market capitalization; and, • the overall economic and regulatory environments in which these regulated entities operate.

85
Based on these evaluations, management concluded it was not more likely than not that the fair value of these reporting unitstwas less than their carrying value. As such, the two-step quantitative impairment test was not performed and no impairment was recognized.
(PPL, LKE, LG&E and KU)UU
Asset Retirement Obligationsg
PPL and its subsidiaries record liabilities to reflect various legal obligations associated with the retirement of long-lived assets. Initially, this obligation is measured at fair value and offset with an increase ind the value of the capitalized asset, which in s depreciated over the asset's useful life. Until the obligation is settled, the liability is increased through the recognition of accretion expense classified within "Other operation and maintenance" on the Statements of Income to reflect changes in the obligation due to the passage of time. For LKE, LG&E and KU, all ARO accretion and depreciation expenses are reclassified as a regulatory asset. ARO regulatory assets associated with certain CCR projects are amortized to expense in accordance with regulatory approvals. For other AROs, at the time of retirement, the related ARO regulatory asset is offset against the associated aacost of removal regulatory liability, PP&E and ARO liability.
Estimated ARO costs and settlement dates, which affect the carrying value of the ARO and the related capitalized asset, arereviewed periodically to ensure that any material changes are incorporatedaa into the latest estimate of d the ARO. Any change tothe capitalized asset, positive or negative, is generally amortized over the remaining life of the associated long-lived asset. SeeNote 6 and Note 19 for additional information on AROs.
Compensation and Benefits
Defined Benefits (All Registrants)
Certain PPL subsidiaries sponsor various defined benefit pension and other postretirement plans. An asset or liability is recorded to recognize the funded status of all defined benefit plans with an offsetting entry to AOCI or, for LG&E, KU and PPL Electric, to regulatory assets or liabilities. Consequently, the funded status of all defined benefit plans is fully recognized on the dBalance Sheets.
The expected return on plan assets is determined based on a market-related value of plan assets, which is calculated by rollingforward the prior year market-related value with contributions, disbursements and long-term expected return on investments.One-fifth of the difference between the actual value and the expected value is added (or subtracted if negative) to the expectedvalue to determine the new market-related value.
PPL uses an accelerated amortization method for the recognition of gains and losses for its defined benefit pension plans.Under the accelerated method, actuarial gains and losses in excess of 30% of the plan's projected benefit obligation areamortized on a straight-line basis over one-half of the expected average remaining service of active plan participants. Actuarialgains and losses in excess of 10% of the greater of the plan's projected benefit obligation or the market-related value of planassets and less than 30% of the plan's projected benefit obligation are amortized on a straight-line basis over the expected average remaining service period of active plan participants.
See Note 6 for a discussion of the regulatory treatment of defined benefit costs and Note 11 for a discussion of defined benefits.
Discount Rate Change for U.K. Pension Plans (PPL)g
In selecting the discount rate for its U.K. pension plans, WPD historically used a single weighted-average discount rate in thecalculation of net periodic defined benefit cost. WPD began using individual spot rates to measure service cost and interest cost for the calculation of net periodic defined benefit cost in 2016. In 2016, this change in discount rate resulted in lower net periodic defined benefit costs recognized on PPL's Statement of Income of $43 million ($34 million after-tax or $0.05 per share).
See Note 11 for additional information.

86
Stock-Based Compensation (PPL, PPL Electric and LKE)p
PPL has several stock-based compensation plans for purposes of granting stock options, restricted stock, restricted stock unitsand performance units to certain employees as well as stock units and restricted stock units to directors. PPL grants most stock-based awards in the first quarter of each year. PPL and its subsidiaries recognize compensation expense for stock-based awards based on the fair value method. Forfeitures of awards are recognized when they occur. See Note 10 for a discussion of stock-based compensation. All awards are recorded as equity or a liability on the Balance Sheets. Stock-based compensation is primarily included in "Other operation and maintenance" on the Statements of Income. Stock-based compensation expense for PPL Electric and LKE includes an allocation of PPL Services' expense.
Taxes
Income Taxes
(All Registrants)
PPL and its domestic subsidiaries file a consolidated U.S. federal income tax return.
The Registrants have completed or made reasonable estimates of the effects of the TCJA and reflected these amounts in their December 31, 2017 financial statements. The Registrants continue to evaluate the application of the TCJA and have used significant management judgment to make certain assumptions concerning the application of various components of the law in the calculation of 2017 income tax expense. The current and deferred components of the income tax expense calculations that the Registrants consider provisional due to uncertainty either with respect to the technical application of the law or thequantification of the impact of the law include (but are not limited to): tax depreciation, deductible executive compensation, and the accumulated foreign earnings used to calculate the deemed dividend included in PPL's taxable income in 2017 alongwith the impact of associated foreign tax credits and related valuation allowances. The Registrants believe that classification of nthese items as provisional is appropriate. The Registrants have accounted for these items based on their interpretation of theTCJA.
Further interpretive guidance on the TCJA from the IRS, Treasury, the Joint Committee on Taxation through its "Blue Book" or from Congress in the form of Technical Corrections may differ from the Registrants' interpretation of the TCJA.aa
Significant management judgment is also required in developing the Registrants' provision for income taxes, primarily due tothe uncertainty related to tax positions taken or expected to be taken in tax returns, valuation allowances on deferred tax assetsand whether the undistributed earnings of WPD are considered indefinitely reinvested. d
Significant management judgment is also required to determine the amount of benefit to be recognized in relation to anffuncertain tax position. The Registrants use a two-step process to evaluate tax positions. The first step requires an entity todetermine whether, based on the technical merits supporting a particular tax position, it is moaa re likely than not (greater than a n50% chance) that the tax position will be sustained. This determination assumes that the relevant taxing authority will examinethe tax position and is aware of all the relevant facts surrounding the tax position. The second step requires an entity to recognize in the financial statements the benefit of a tax position that meets the more-likely-than-not recognition criterion. The benefit recognized is measured at the largest amount of benefit that has a likelihood of realization, upon settlement, that exceeds 50%. The amounts ultimately paid upon resolution of issues raised by taxing authorities may differ materially from theamounts accrued and may materially impact the financial statements of the Registrants in future periods.
Deferred income taxes reflect the net future tax effects of temporary differences between the carrying amounts of assets and liabilities for accounting purposes and their basis for income tax purposes, as well as the tax effects of net operating losses andtax credit carryforwards.
The Registrants record valuation allowances to reduce deferred tax assets to the amounts that are more likely than not to berealized. The Registrants consider the reversal of temporary differences, future taxablmm e income and ongoing prudent and feasible tax planning strategies in initially recording and subsequently reevaluating the need for valuation allowances. If theRegistrants determine that they are able to realize deferred tax assets in the future in excess of recorded net deferred tax assets,adjustments to the valuation allowances increase income by reducing tax expense in the period that such determination is made. Likewise, if the Registrants determine that they are not able to realize all or part of net deferred tax assets in the future,adjustments to the valuation allowances would decrease income by increasing tax expense in the period that such determinationyis made.

87
The Registrants defer investment tax credits when the credits are utilized and amortize the deferred amounts over the average lives of the related assets.
The Registrants recognize interest and penalties in "Income Taxes" on their Statements of Income.
See Note 5 for additional discussion regarding income taxes, including the impact of the TCJA and management's conclusion fthat the undistributed earnings of WPD are considered indefinitely reinvested.
The provision for PPL's, PPL Electric's, LKE's, LG&E's and KU's deferred income taxes for regulatory assets and liabilities is based upon the ratemaking principles reflected in rates established by the regulators. The difference in the provision for deferred income taxes for regulatory assets and liabilities and the amount that otherwise would be recorded under GAAP isdeferred and included on the Balance Sheets in noncurrent "Regulatory assets" or "Regulatory liabilities."
(PPL Electric, LKE, LG&E and KU)
The income tax provision for PPL Electric, LG&E and KU is calculated in accordance with an intercompany tax sharingagreement, which provides that taxable income be calculated as if PPL Electric, LG&E, KU and any domestic subsidiaries eachfiled a separate return. Tax benefits are not shared between companies. The entity that generates a tax benefit is the entity that is ttentitled to the tax benefit. The effect of PPL filing a consolidated tax return is taken into account in the settlement of current taxes and the recognition of deferred taxes.
At December 31, the following intercompany tax receivables (payables) were recorded:
2017 2016 PPL Electric $ 61 $ 13LKE (23) 1LG&E — (18) KU — (29)
Taxes, Other Than Income (All Registrants),
The Registrants present sales taxes in "Other current liabilities" and PPL presents value-added taxes in "Taxes" on the BalanceSheets. These taxes are not reflected on the Statements of Income. See Note 5 for details on taxes included in "Taxes, other thanincome" on the Statements of Income.
Other
(All Registrants)
Leases
The Registrants evaluate whether arrangements entered into contain leases for accounting purposes. See Note 9 for additional rrinformation.
Fuel, Materials and Supplies, pp
Fuel, natural gas stored underground and materials and supplies are valued using the average cost method. Fuel costs for electric generation are charged to expense as used. For LG&E, natural gas supply costs are charged to expense as delivered tothe distribution system. See Note 6 for further discussion of the fuel adjustment clause and gas supply clause. n
(PPL, LKE, LG&E and KU)
"Fuel, materials and supplies" on the Balance Sheets consisted of the following at December 31:

88
PPL LKE LG&E KU2017 2016 2017 2016 2017 2016 2017 2016
Fuel $ 107 $ 158 $ 107 $ 158 $ 45 $ 60 $ 62 $ 98Natural gas stored underground 43 42 43 42 43 42 — —Materials and supplies 170 156 104 97 43 41 61 56
Total $ 320 $ 356 $ 254 $ 297 $ 131 $ 143 $ 123 $ 154
Guarantees (All Registrants)
Generally, the initial measurement of a guarantee liability is the fair value of the guarantee at its inception. However, there arecertain guarantees excluded from the scope of accounting guidance and other guarantees that are not subject to the initialrecognition and measurement provisions of accounting guidance that only require disclosure. See Note 13 for further discussion of recorded and unrecorded guarantees.
Treasury Stock (PPL)y
PPL restores all shares of common stock acquired to authorized but unissued shares of common stock upon acquisition.
Foreign Currency Translation and Transactions (PPL)g y
WPD's functional currency is the GBP, which is the local currency in the U.K. As such, assets and liabilities are translated toU.S. dollars at the exchange rates on the date of consolidation and related revenues and expenses are generally translated at average exchange rates prevailing during the period included in PPL's results of operations. Adjustments resulting from foreigncurrency translation are recorded in AOCI.
Gains or losses relating to foreign currency transactions are recognized in "Other Income (Expense) - net" on the Statements ofIncome. See Note 15 for additional information.
2. Segment and Related Information
(PPL)
PPL is organized into three segments: U.K. Regulated, Kentucky Regulated and Pennsylvania Regulated. PPL's segments are segmented by geographic location.
The U.K. Regulated segment consists of PPL Global, which primarily includes WPD's regulated electricity distribution operations, the results of hedging the translation of WPD's earnings from GBP into U.S. dollars, and certain costs, such as U.S.income taxes, administrative costs, and certain acquisition-related financing costs.
The Kentucky Regulated segment consists primarily of LKE's regulated electricity generation, transmission and distributionoperations of LG&E and KU, as well as LG&E's regulated distribution and sale of natural gas. In addition, certain acquisition-related financing costs are allocated to the Kentucky Regulated segment.
The Pennsylvania Regulated segment includes the regulated electricity transmission and distribution operations of PPL Electric. In addition, certain costs are allocated to the Pennsylvand ia Regulated segment.
"Corporate and Other" primarily includes financing costs incurred at the corporate level that have not been allocated or assigned to the segments, as well as certain other unallocated costs, which is presented to reconcile segment information to PPL's consolidated results.
On June 1, 2015, PPL completed the spinoff of PPL Energy Supply, which substantially represented PPL's Supply segment. As a result of this transaction, PPL no longer has a Supply segment and its results are presented in "Discontinued Operations". SeeNote 8 for additional information.
Income Statement data for the segments and reconciliation to PPL's consolidated results for the years ended December 31 are as follows:

89
2017 2016 2015 Operating Revenues from external customers (a)
U.K. Regulated $ 2,091 $ 2,207 $ 2,410Kentucky Regulated 3,156 3,141 3,115Pennsylvania Regulated 2,195 2,156 2,124Corporate and Other 5 13 20
Total $ 7,447 $ 7,517 $ 7,669
Depreciation
U.K. Regulated $ 230 $ 233 $ 242Kentucky Regulated 439 404 382Pennsylvania Regulated 309 253 214Corporate and Other 30 36 45
Total $ 1,008 $ 926 $ 883
Amortization (b) U.K. Regulated $ 34 $ 16 $ 6Kentucky Regulated 24 29 27Pennsylvania Regulated 33 32 26Corporate and Other 6 3 —
Total $ 97 $ 80 $ 59
Unrealized (gains) losses on derivatives and other hedging activities (c)
U.K. Regulated $ 166 $ 13 $ (88)Kentucky Regulated 6 6 11Corporate and Other 6 — —
Total $ 178 $ 19 $ (77)
Interest Expense
U.K. Regulated $ 397 $ 402 $ 417Kentucky Regulated 261 260 232Pennsylvania Regulated 142 129 130Corporate and Other 101 97 92
Total $ 901 $ 888 $ 871
Income from Continuing Operations Before Income Taxes U.K. Regulated $ 804 $ 1,479 $ 1,249Kentucky Regulated 645 640 547Pennsylvania Regulated 575 550 416Corporate and Other (d) (112 ) (119) (144)
Total $ 1,912 $ 2,550 $ 2,068
Income Taxes (e)
U.K. Regulated $ 152 $ 233 $ 128Kentucky Regulated 359 242 221Pennsylvania Regulated 216 212 164Corporate and Other (d) 57 (39) (48)
Total $ 784 $ 648 $ 465
Deferred income taxes and investment tax credits (f) U.K. Regulated $ 66 $ 31 $ 45Kentucky Regulated 294 291 236Pennsylvania Regulated 257 221 220Corporate and Other (d) 90 17 (73)
Total $ 707 $ 560 $ 428
NNet Income

90
2017 2016 2015 U.K. Regulated $ 652 $ 1,246 $ 1,121Kentucky Regulated 286 398 326Pennsylvania Regulated 359 338 252Corporate and Other (d) (169) (80) (96) Discontinued Operations (g) — — (921)
Total $ 1,128 $ 1,902 $ 682
(a) See Note 1 for additional information on Operating Revenues. (b) Represents non-cash expense items that include amortization of regulatory assets, debt discounts and premiums, debt issuance costs, emission allowances
and RECs. (c) Includes unrealized gains and losses from economic activity. See Note 17 for additional information. (d) 2015 includes certain costs related to the spinoff of PPL Energy Supply, including deferred income tax expense, transition costs and separation benefits
for PPL Services employees. See Note 8 for additional information.(e) Represents both current and deferred income taxes, including investment tax credits. See Note 5 for additional information on the impact of the TCJA in
2017. (f) Represents a non-cash expense item that is also included in "Income Taxes." (g) 2015 includes an $879 million loss on the spinoff of PPL Energy Supply and five months of Supply segment earnings. See Note 8 for additionalff
information on these transactions.
Cash Flow data for the segments and reconciliation to PPL's consolidated results for the years ended December 31 are as follows:
2017 2016 2015 Expenditures for long-lived assets
U.K. Regulated $ 1,015 $ 1,031 $ 1,242Kentucky Regulated 892 791 1,210Pennsylvania Regulated 1,254 1,134 1,107Corporate and Other 10 1 11
Total $ 3,171 $ 2,957 $ 3,570
The following provides Balance Sheet data for the segments and reconciliation to PPL's consolidated results as of:
As of December 31,2017 2016
Total Assets U.K. Regulated (a) $ 16,813 $ 14,537Kentucky Regulated 14,468 14,037Pennsylvania Regulated 10,082 9,426Corporate and Other (b) 116 315
Total $ 41,479 $ 38,315
(a) Includes $12.5 billion and $10.8 billion of net PP&E as of December 31, 2017 and December 31, 2016. WPD is not subject to accounting for the effects of certain types of regulation as prescribed by GAAP.
(b) Primarily consists of unallocated items, including cash, PP&E and the elimination of inter-segment transactions.
Geographic data for the years ended December 31 are as follows:
2017 2016 2015 Revenues from external customers
U.K. $ 2,091 $ 2,207 $ 2,410U.S. 5,356 5,310 5,259
Total $ 7,447 $ 7,517 $ 7,669
As of December 31,2017 2016
Long-Lived Assets U.K. $ 12,851 $ 11,177U.S. 20,936 19,595
Total $ 33,787 $ 30,772

91
(PPL Electric, LKE, LG&E and KU)
PPL Electric has two operating segments that are aggregated into a single reportable segment. LKE, LG&E and KU are individually single operating and reportable segments.
3. Preferred Securities
(PPL)
PPL is authorized to issue up to 10 million shares of preferred stock. No PPL preferred stock was issued or outstanding in 2017,2016 or 2015.
(PPL Electric)
PPL Electric is authorized to issue up to 20,629,936 shares of preferred stock. No PPL Electric preferred stock was issued or ffoutstanding in 2017, 2016 or 2015.
(LG&E)
LG&E is authorized to issue up to 1,720,000 shares of preferred stock at a $25 par value and 6,750,000 shares of preferred stock without par value. LG&E had no preferred stock issued or outstanding in 2017, 2016 or 2015.
(KU)
KU is authorized to issue up to 5,300,000 shares of preferred stock and 2,000,000 shares of preference stock without par value. KUhad no preferred or preference stock issued or outstanding in 2017, 2016 or 2015.
4. Earnings Per Share
(PPL)
Basic EPS is computed by dividing income available to PPL common shareowners by the weighted-average number of common shares outstanding during the applicable period. Diluted EPS is computed by dividing income available to PPL common shareowners by the weighted-average number of common shares outstanding, increased by incremental shares that would be outstanding if potentially dilutive non-participating securities were converted to common shares as calculated using the Treasury Stock Method. Incremental non-participating securities that have a dilutive impact are detailed in the table below.
Reconciliations of the amounts of income and shares of PPL common stock (in thousands) for the periods ended December 31, used in the EPS calculation are:
2017 2016 2015 Income (Numerator) Income from continuing operations after income taxes $ 1,128 $ 1,902 $ 1,603Less amounts allocated to participating securities 2 6 6Income from continuing operations after income taxes available to PPL commonshareowners - Basic and Diluted $ 1,126 $ 1,896 $ 1,597
Income (loss) from discontinued operations (net of income taxes) available to PPLcommon shareowners - Basic and Diluted $ — $ — $ (921)
NNet income $ 1,128 $ 1,902 $ 682Less amounts allocated to participating securities 2 6 2NNet income available to PPL common shareowners - Basic and Diluted $ 1,126 $ 1,896 $ 680
Shares of Common Stock (Denominator)Weighted-average shares - Basic EPS 685,240 677,592 669,814Add incremental non-participating securities:
Share-based payment awards (a) 2,094 2,854 2,772

92
2017 2016 2015 Weighted-average shares - Diluted EPS 687,334 680,446 672,586
Basic EPSAvailable to PPL common shareowners:
Income from continuing operations after income taxes $ 1.64 $ 2.80 $ 2.38Income (loss) from discontinued operations (net of income taxes) — — (1.37)NNet Income $ 1.64 $ 2.80 $ 1.01
Diluted EPS Available to PPL common shareowners:
Income from continuing operations after income taxes $ 1.64 $ 2.79 $ 2.37Income (loss) from discontinued operations (net of income taxes) — — (1.36) Net Income $ 1.64 $ 2.79 $ 1.01
(a) The Treasury Stock Method was applied to non-participating share-based payment awards.
For the year ended December 31, PPL issued common stock related to stock-based compensation plans and DRIP as follows (inthousands):
2017 Stock-based compensation plans (a) 1,748DRIP 1,552
(a) Includes stock options exercised, vesting of performance units, vesting of restricted stock and restricted stock units and conversion of stock units granted to directors.
See Note 7 for additional information on common stock issued under ATM Program.
For the years ended December 31, the following shares (in thousands) were excluded from the computations of diluted EPSbecause the effect would have been antidilutive:
2017 2016 2015 Stock options 696 696 1,087Performance units — 176 36
5. Income and Other Taxes
(All Registrants)
Tax Cuts and Jobs Act (TCJA)
On December 22, 2017, President Trump signed into law the TCJA. Substantially all of the provisions of the TCJA are effectivefor taxable years beginning after December 31, 2017. The TCJA includes significant changes to the taxation of corporations,including provisions specifically applicable to regulated public utilities. The more significant changes that impact the Registrants are:
• The reduction in the U.S. federal corporate income tax rate from a top marginal rate of 35% to a flat rate of 21%, effective January 1, 2018;
• The exclusion from U.S. federal taxable income of dividends from foreign subsidiaries and the associated "transition tax;" • Limitations on the tax deductibility of interest expense, with an exception to these limitations for regulated public utilities; • Full current year expensing of capital expenditures with an exception for regulated public utilities that qualify for the
exception to the interest expense limitation; and • The continuation of certain rate normalization requirements for accelerated depreciation benefits. For non-regulated
businesses, the TCJA generally provides for full expensing of property acquired after September 27, 2017.
Under GAAP, the tax effect of changes in tax laws must be recognized in the period in which the law is enacted, or December 2017 for TCJA. The changes enacted by the TCJA were recorded as an adjustment to the Registrants' deferred tax provision,ttand have been reflected in "Income Taxes" on the Statement of Income for the year ended December 31, 2017 as follows:

93
PPL PPL Electric LKE LG&E KUIncome tax expense (benefit) $ 321 $ (13) $ 112 $ — $ —
The components of these adjustments are discussed below:
Reduction of U.S. Federal Corporate Income Tax Rate p
GAAP requires deferred tax assets and liabilities to be measured at the enacted tax rate expectedrr to apply when temporaryddifferences are to be realized or settled. Thus, at the date of enactment, the Registrants' deferred taxes were remeasured baseaa d upon the new U.S. federal corporate income tax rate of 21%. For PPL’s regulated entities, the changes in deferred taxes were, in large part, recorded as an offset to either a regulatory asset or regulatory liability and will be reflected in future rates charged to customers. The rate reduction on non-regulated deferred tax assets and liabilities were recorded as an adjustment to theRegistrants' deferred tax provision, and have been reflected in "Income Taxes" on the Statement of Income for the year ended December 31, 2017 as follows:
PPL PPL Electric LKE LG&E KUIncome tax expense (benefit) $ 220 $ (13) $ 112 $ — $ —
As indicated in Note 1 - "Summary of Significant Accounting Policies - Income Taxes", PPL’s U.S. regulated operations' accounting for income taxes are impacted by rate regulation. Therefore, reductions in accumulated deferred income taxbalances due to the reduction in the U.S. federal corporate income tax rate to 21% under the provisions of the TCJA may result in amounts previously collected from utility customers for these deferred taxes to be refundable to such customers over a periodof time. The TCJA includes provisions that stipulate how these excess deferred taxes are to be passed back to customers for certain accelerated tax depreciation benefits. Potential refunds of other deferred taxes will be determined by the Registrants’regulators. The Balance Sheets at December 31, 2017 reflect the increase to the Registrants' net regulatory liabilities as a result of the TCJA as follows:
PPL PPL Electric LKE LG&E KUNNet Increase in Regulatory Liabilities $ 2,185 $ 1,019 $ 1,166 $ 532 $ 634
Prior to the TCJA, PPL Electric had recorded a net regulatory asset related to taxes recoverable on certain property related deferred taxes, the tax benefit of which was received by the customer. The net regulatory asset represents the future taxes owedin excess of taxes paid by the customer to date, with an additional tax gross-up. As a result of the U.S. federal corporate incometax rate reduction enacted by the TCJA, the future taxes expected to be due are now less than taxes funded through rates, resulting in a net regulatory liability.
Transition Tax
The TCJA included a conversion from a worldwide tax system to a territorial tax system, effective January 1, 2018. In the transition to the territorial regime, a one-time transition tax was imposed on PPL’s unrepatriated accumulated foreign earningsin 2017. These earnings were treated as a taxable deemed dividend to PPL of approximately $462 million. As the PPL consolidated U.S. group had a taxable loss for 2017, inclusive of the taxable deemed dividend, the foreign tax credits associated with the deemed dividend were recorded as a deferred tax asset. However, it is expected that under the TCJA, the current and prior year foreign tax credit carryforwards will not be fully realizable.
As a result, the net deferred income tax expense impact of the deemed repatriation was $101 million and was recorded in"Income Taxes" on the PPL Statement of Income for the year ended December 31, 2017 and "Deferred tax liabilities" on thePPL Balance Sheet at December 31, 2017.
SEC Guidance on Accounting for TCJA
On December 22, 2017, the SEC issued guidance for accounting for income taxes in the event that information is not availableor is incomplete for purposes of reflecting the impact of the TCJA. The SEC guidance provides a period of up to one year (themeasurement period) to complete the analysis and accounting to properly reflect the TCJA. The SEC guidance provides a three-step process that companies should apply to each reporting period within the measurement period:
1. A company should record the effects of the TCJA for which the accounting is complete. 2. A company should report provisional amounts (or adjustments to provisional amounts) for the effects of the TCJA for
which the accounting is not complete, but for which a reasonable estimate can be determined. Provisional amounts and any

94
related adjustments to such provisional amounts should be recorded to income tax expense through continuing operations in the period they are identified.
3. A company should continue to apply GAAP based on the tax law in effect just prior to enactment of TCJA if a reasonablettestimate of the specific effect of the TCJA cannot be made.
The measurement period ends at the earlier of the time the company finalizes its accounting for the impact of the TCJA or one year.
The Registrants have completed or made reasonable estimates of the effects of the TCJA and reflected these amounts in their December 31, 2017 financial statements. The Registrants continue to evaluate the application of the TCJA and have madecertain assumptions concerning the application of various components of the law in the calculation of 2017 income tax expense.The current and deferred components of the income tax expense calculations that the Registrants consider provisional within the meaning of the SEC guidance due to uncertainty either with respect to the technical application of the law or thequantification of the impact of the law include (but are not limited to): tax depreciation, deductible executive compensation, and the accumulated foreign earnings used to calculate the deemed dividend included in PPL’s taxable income in 2017 along with the impact of associated foreign tax credits and related valuation allowances. The Registrants believe that classification of these items as provisional is appropriate. The Registrants have accounted for these items based on their interpretation of theTCJA.
Further interpretive guidance on the TCJA from the IRS, Treasury, the Joint Committee on Taxation through its “Blue Book” or from Congress in the form of Technical Corrections may differ from the Registrants' interpretation of the TCJA.aa
(PPL)
"Income from Continuing Operations Before Income Taxes" included the following:
2017 2016 2015 Domestic income $ 874 $ 1,463 $ 968Foreign income 1,038 1,087 1,100
Total $ 1,912 $ 2,550 $ 2,068
Deferred income taxes reflect the net tax effects of temporary differences between the carrying amounts of assets and liabilities for accounting purposes and their basis for income tax purposes and the tax effects of net operating loss and tax credit carryforwards. The provision for PPL's deferred income taxes for regulated assets and liabilities is based upon the ratemakingprinciples of the applicable jurisdiction. See Notes 1 and 6 for additional information.
Net deferred tax assets have been recognized based on management's estimates of future taxable income for the U.S. and theU.K.
Significant components of PPL's deferred income tax assets and liabilities were as follows:

95
2017 (a) 2016 Deferred Tax Assets
Deferred investment tax credits $ 33 $ 51Regulatory liabilities 62 94Income taxes due to customer (b) 499 —Accrued pension costs 159 250Federal loss carryforwards 356 565State loss carryforwards 409 326Federal and state tax credit carryforwards 455 256Foreign capital loss carryforwards 329 302Foreign loss carryforwards 2 3Foreign - pensions (32 ) 41Foreign - regulatory obligations 2 6Foreign - other 7 5Contributions in aid of construction 134 141Domestic - other 104 188Unrealized losses on qualifying derivatives 10 20Valuation allowances (838 ) (593)
Total deferred tax assets 1,691 1,655
Deferred Tax Liabilities
Domestic plant - net (b) 3,168 4,325Taxes recoverable through future rates (b) — 170Regulatory assets 211 343Reacquired debt costs 15 25Foreign plant - net 726 640Domestic - other 9 14
Total deferred tax liabilities 4,129 5,517NNet deferred tax liability $ 2,438 $ 3,862
(a) Deferred tax assets and liabilities at December 31, 2017 reflect the U.S. federal corporate income tax rate reduction from 35% to 21% enacted by the TCJA.
(b) The impact on net deferred tax liabilities as a result of the U.S. federal corporate income tax rate reduction enacted by the TCJA is primarily related to plant (net of net operating losses) and resulted in a regulatory liability for income taxes due to customers, the deferred tax impact of which is reflected as a deferred tax asset.
State deferred taxes are determined on a by entity, by jurisdiction basis. As a resuy lt, $24 million and $27 million of net deferred tax assets are shown as "Other noncurrent assets" on the Balance Sheets for 2017 and 2016.
At December 31, 2017, PPL had the following loss and tax credit carryforwards, related deferred tax assets and valuation allowances recorded against the deferred tax assets.
Gross Deferred Tax
Asset ValuationAllowance Expiration
Loss carryforwards Federal net operating losses (a) $ 1,662 $ 349 $ — 2029-2037Federal charitable contributions (a) 36 7 — 2020-2022State net operating losses (a) 5,512 407 (348) 2018-2037State charitable contributions (a) 26 2 — 2018-2022Foreign net operating losses 10 2 — Indefinite Foreign capital losses 1,938 329 (329 ) Indefinite
Credit carryforwards Federal investment tax credit 133 — 2025-2036
Federal alternative minimum tax credit (b) 30 — Indefinite Federal foreign tax credits (c) 267 (148) 2024-2027Federal - other 24 (8 ) 2019-2037State - other 1 — Indefinite
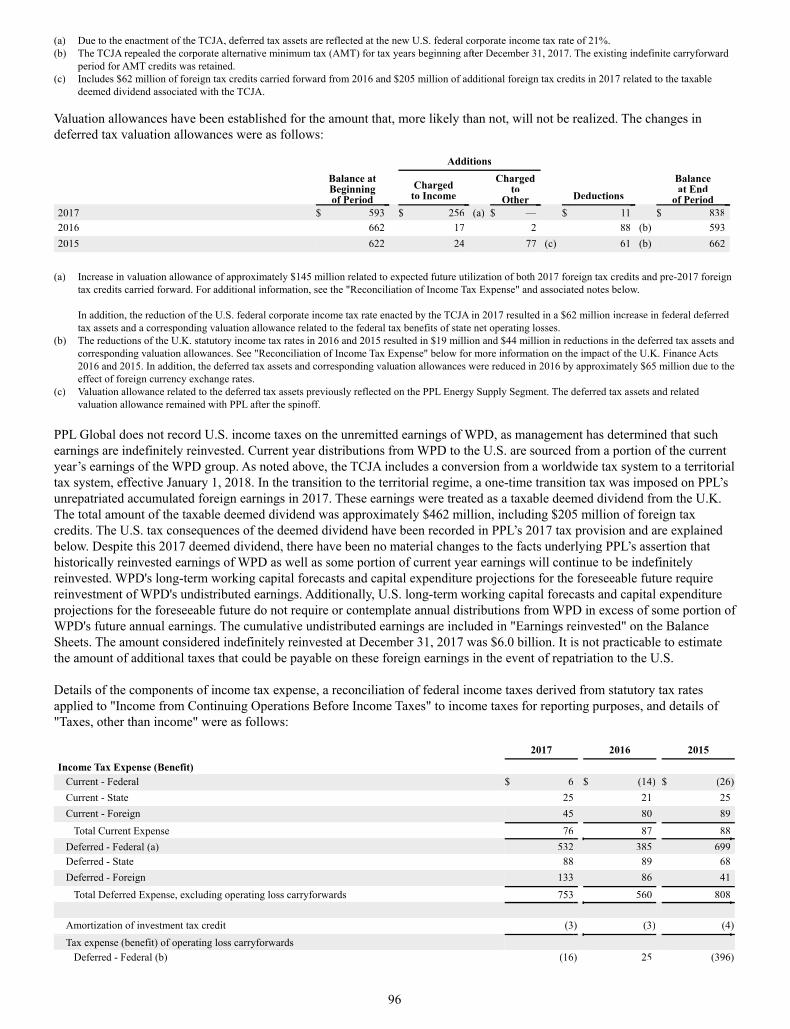
96
(a) Due to the enactment of the TCJA, deferred tax assets are reflected at the new U.S. federal corporate income tax rate of 21%. (b) The TCJA repealed the corporate alternative minimum tax (AMT) for tax years beginning after December 31, 2017. The existing indff efinite carryforward
period for AMT credits was retained. (c) Includes $62 million of foreign tax credits carried forward from 2016 and $205 million of additional foreign tax credits in 2017 related to the taxable
deemed dividend associated with the TCJA.
Valuation allowances have been established for the amount that, more likely than not, will not be realized. The changes indeferred tax valuation allowances were as follows:
Additions Balance atBeginning of Period
Charged to Income
Charged to
Other DeductionsBalance at End
of Period 2017 $ 593 $ 256 (a) $ —— $ 11 $ 8382016 662 17 2 88 (b) 5932015 622 24 77 (c) 61 (b) 662
(a) Increase in valuation allowance of approximately $145 million related to expected future utilization of both 2017 foreign tax credits and pre-2017 foreigntax credits carried forward. For additional information, see the "Reconciliation of Income Tax Expense" and associated notes below.
In addition, the reduction of the U.S. federal corporate income tax rate enacted by the TCJA in 2017 resulted in a $62 million increase in federal deferred tax assets and a corresponding valuation allowance related to the federal tax benefits of state net operating losses.
(b) The reductions of the U.K. statutory income tax rates in 2016 and 2015 resulted in $19 million and $44 million in reductions in the deferred tax assets and corresponding valuation allowances. See "Reconciliation of Income Tax Expense" below for more information on the impact of the U.K. Finance Acts 2016 and 2015. In addition, the deferred tax assets and corresponding valuation allowances were reduced in 2016 by approximately $65 million due to theeffect of foreign currency exchange rates.
(c) Valuation allowance related to the deferred tax assets previously reflected on the PPL Energy Supply Segment. The deferred tax assets and related valuation allowance remained with PPL after the spinoff.
PPL Global does not record U.S. income taxes on the unremitted earnings of WPD, as management has determined that suchearnings are indefinitely reinvested. Current year distributions from WPD to the U.S. are sourced from a portion of the currentyear’s earnings of the WPD group. As noted above, the TCJA includes a conversion from a worldwide tax system to a territorialtax system, effective January 1, 2018. In the transition to the territorial regime, a one-time transition tax was imposed on PPL’s unrepatriated accumulated foreign earnings in 2017. These earnings were treated as a taxable deemed dividend from the U.K.The total amount of the taxable deemed dividend was approximately $462 million, including $205 million of foreign taxcredits. The U.S. tax consequences of the deemed dividend have been recorded in PPL’s 2017 tax provision and are explained below. Despite this 2017 deemed dividend, there have been no material changes to the facts underlying PPL’s assertion that uhistorically reinvested earnings of WPD as well as some portion of current year earnings will continue to be indefinitely reinvested. WPD's long-term working capital forecasts and capital expenditure projections for the foreseeable future requirereinvestment of WPD's undistributed earnings. Additionally, U.S. long-term working capital forecasts and capital expenditureprojections for the foreseeable future do not require or contemplate annual distributions from WPD in excess of some portion ofWPD's future annual earnings. The cumulative undistributed earnings are included in "Earnings reinvested" on the BalanceSheets. The amount considered indefinitely reinvested at December 31, 2017 was $6.0 billion. It is not practicable to estimatethe amount of additional taxes that could be payable on these foreign earnings in the event of repatriation to the U.S.
Details of the components of income tax expense, a reconciliation of federal income taxes derived from statutory tax ratesapplied to "Income from Continuing Operations Before Income Taxes" to income taxes for reporting purposes, and details of "Taxes, other than income" were as follows:
2017 2016 2015 Income Tax Expense (Benefit)
Current - Federal $ 6 $ (14) $ (26) Current - State 25 21 25Current - Foreign 45 80 89
Total Current Expense 76 87 88Deferred - Federal (a) 532 385 699Deferred - State 88 89 68Deferred - Foreign 133 86 41
Total Deferred Expense, excluding operating loss carryforwards 753 560 808
Amortization of investment tax credit (3) (3 ) (4) Tax expense (benefit) of operating loss carryforwards
Deferred - Federal (b) (16) 25 (396)

97
2017 2016 2015 Income Tax Expense (Benefit)
Deferred - State (26) (21) (31) Total Tax Expense (Benefit) of Operating Loss Carryforwards (42) 4 (427)
Total income taxes from continuing operations $ 784 $ 648 $ 465
Total income tax expense - Federal $ 519 $ 393 $ 273Total income tax expense - State 87 89 62Total income tax expense - Foreign 178 166 130
Total income taxes from continuing operations $ 784 $ 648 $ 465
(a) Due to the enactment of the TCJA in 2017, PPL recorded the following:• $220 million of deferred income tax expense related to the impact of the U.S. federal corporate income tax rate reduction from 35% to 21% on
deferred tax assets and liabilities;• $162 million of deferred tax expense related to the utilization of current year losses resulting from the taxable deemed dividend; partially offset by,• $60 million of deferred tax benefits related to the $205 million of 2017 foreign tax credits partially offset by $145 million of valuation allowances.
(b) Increase in federal loss carryforwards for 2015 primarily relates to the extension of bonus depreciation and the impact of bonus depreciation related toprovision to return adjustments.
In the table above, the following income tax expense (benefit) are excluded from income taxes from continuing operations:
2017 2016 2015 Discontinued operations - PPL Energy Supply Segment $ — $ — $ (30) Stock-based compensation recorded to Earnings Reinvested — (7 ) —Other comprehensive income (34) (6) (2) Valuation allowance on state deferred taxes recorded to other comprehensive income (1) 1 (4)
Total $ (35) $ (12) $ (36)
2017 2016 2015 Reconciliation of Income Tax Expense
Federal income tax on Income from Continuing Operations Before Income Taxes at statutory tax rate - 35% $ 669 $ 893 $ 724
Increase (decrease) due to: State income taxes, net of federal income tax benefit 46 46 31Valuation allowance adjustments (a) 36 16 24Impact of lower U.K. income tax rates (b) (176) (177) (176) U.S. income tax on foreign earnings - net of foreign tax credit (c) 47 (42) 8Federal and state tax reserves adjustments (d) — — (22) Foreign income return adjustments (8) 2 —Impact of the U.K. Finance Acts on deferred tax balances (b) (16) (49) (91) Depreciation not normalized (10) (10) (5)Interest benefit on U.K. financing entities (16) (17) (20) Stock-based compensation (e) (3) (10) —Deferred tax impact of U.S. tax reform (f) 220 — —Other (5) (4) (8)
Total increase (decrease) 115 (245) (259) Total income taxes from continuing operations $ 784 $ 648 $ 465Effective income tax rate 41.0% 25.4% 22.5%
(a) During 2017, PPL recorded an increase in valuation allowances of $23 million primarily related to foreign tax credits recorded in 2016. The future utilization of these credits is expected to be lower as a result of the TCJA.
During 2017 and 2016, PPL recorded deferred income tax expense of $16 million and $13 million for valuation allowances primarily related to increased Pennsylvania net operating loss carryforwards expected to be unutilized.
During 2015, PPL recorded $24 million of deferred income tax expense related to deferred tax valuation allowances. PPL recorded state deferred incomedtax expense of $12 million primarily related to increased Pennsylvania net operating loss carryforwards expected to be unutilized and $12 million of federal deferred income tax expense primarily related to federal tax credit carryforwards that are expected to expire as a result of lower future taxable earnings due to the extension of bonus depreciation.
(b) The U.K. Finance Act 2016, enacted in September 2016, reduced the U.K. statutory income tax rate effective April 1, 2020 from 18% to 17%. As a result,PPL reduced its net deferred tax liabilities and recognized a $42 million deferred income tax benefit during 2016.

98
The U.K. Finance Act 2015, enacted in November 2015, reduced the U.K. statutory income tax rate from 20% to 19% effective April 1, 2017 and from 19% to 18% effective April 1, 2020. As a result, PPL reduced its net deferred tax liabilities and recognized a $90 million deferred income tax benefit during 2015, related to both rate decreases.
(c) During 2017, PPL recorded a federal income tax benefit of $35 million primarily attributable to U.K. pension contributions.
During 2017, PPL recorded deferred income tax expense of $83 million primarily related to enactment of the TCJA. The enacted tax law included a conversion from a worldwide tax system to a territorial tax system, effective January 1, 2018. In the transition to the territorial regime, a one-time transition tax was imposed on PPL’s unrepatriated accumulated foreign earnings in 2017. These earnings were treated as a taxable deemed dividend to PPL of approximately $462 million, including $205 million of foreign tax credits. As the PPL consolidated U.S. group had a taxable loss for 2017, ainclusive of the taxable deemed dividend, these credits were recorded as a deferred tax asset. However, it is expected that under the TCJA, only $83 million of the $205 million of foreign tax credits will be realized in the carry forward period. Accordingly, a valuation allowance on the current year foreign tax credits in the amount of $122 million has been recorded to reflect the reduction in the future utilization of the credits. The foreign tax creditsassociated with the deemed repatriation result in a gross carryforward and corresponding deferred tax asset of $205 million offset by a valuation ffallowance of $122 million.
During 2016, PPL recorded lower income taxes primarily attributable to foreign tax credit carryforwards, arising from a decision to amend prior year tax returns to claim foreign tax credits rather than deduct foreign taxes. This decision was prompted by changes to the Company's most recent business plan.
(d) During 2015, PPL recorded a $9 million income tax benefit related to a planned amendment of a prior period tax return and a $12 million income taxbenefit related to the settlement of the IRS audit for the tax years 1998-2011.
(e) During 2016, PPL recorded lower income tax expense related to the application of new stock-based compensation accounting guidance. See Note 1 for additional information.
(f) During 2017, PPL recorded deferred income tax expense related to the U.S. federal corporate income tax rate reduction from 35% to 21% enacted by theTCJA.
2017 2016 2015 Taxes, other than income
State gross receipts (a) $ 102 $ 100 $ 89State capital stock (6) — —Foreign property 127 135 148Domestic Other 69 66 62Total $ 292 $ 301 $ 299
(a) In 2015, the settlement of a 2011 gross receipts tax audit resulted in the reversal of $17 million of previously recognized reserves.
(PPL Electric)
The provision for PPL Electric's deferred income taxes for regulated assets and liabilities is based upon the ratemaking principles reflected in rates established by the PUC and the FERC. The difference in the provision for deferred income taxes for regulated assets and liabilities and the amount that otherwise would be recorded under GAAP is deferred and included in "Regulatory assets" or "Regulatory liabilities" on the Balance Sheets.
Significant components of PPL Electric's deferred income tax assets and liabilities were as follows:
2017 (a) 2016 Deferred Tax Assets
Accrued pension costs $ 63 $ 107Contributions in aid of construction 117 112Regulatory liabilities 25 34Income taxes due to customers (b) 193 —State loss carryforwards 19 22Federal loss carryforwards 91 147Other 45 81
Total deferred tax assets 553 503
Deferred Tax Liabilities Electric utility plant - net (b) 1,544 2,001Taxes recoverable through future rates (b) — 141Reacquired debt costs 8 15Regulatory assets 150 240Other 5 5
Total deferred tax liabilities 1,707 2,402NNet deferred tax liability $ 1,154 $ 1,899

99
(a) Deferred tax assets and liabilities at December 31, 2017 reflect the U.S. federal corporate income tax rate reduction from 35% to 21% enacted by the TCJA.
(b) The impact on net deferred tax liabilities as a result of the U.S. federal tax rate reduction enacted by the TCJA is primarily related to plant (net of net operating losses) and resulted in a regulatory liability for income taxes due to customers, the deferred tax impact of which is reflected as a deferred tax asset.
At December 31, 2017, PPL Electric had the following loss carryforwards and related deferred tax assets:
Gross Deferred Tax
Asset ExpirationLoss carryforwards (a)
Federal net operating losses $ 426 $ 89 2031-2037Federal charitable contributions 8 2 2020-2022State net operating losses 233 18 2030-2032State charitable contributions 13 1 2018-2022
(a) Due to the enactment of the TCJA, deferred tax assets are reflected at the new U.S. federal corporate income tax rate of 21%.
Credit carryforwards were insignificant at December 31, 2017.
Details of the components of income tax expense, a reconciliation of federal income taxes derived from statutory tax ratesapplied to "Income Before Income Taxes" to income taxes for reporting purposes, and details of "Taxes, other than income"TTwere as follows.
2017 2016 2015 Income Tax Expense (Benefit) Current - Federal $ (65) $ (29) $ (80) Current - State 20 19 23
Total Current Expense (Benefit) (45) (10) (57) Deferred - Federal (a) 234 193 287Deferred - State 29 29 12
Total Deferred Expense, excluding operating loss carryforwards 263 222 299
Amortization of investment tax credit — — —Tax expense (benefit) of operating loss carryforwards
Deferred - Federal (5) — (75)Deferred - State — — (3)
Total Tax Expense (Benefit) of Operating Loss Carryforwards (5) — (78)Total income tax expense $ 213 $ 212 $ 164
Total income tax expense - Federal $ 164 $ 164 $ 132Total income tax expense - State 49 48 32
Total income tax expense $ 213 $ 212 $ 164
(a) Due to the enactment of the TCJA in 2017, PPL Electric recorded a $13 million deferred tax benefit related to the impact of the U.S. federal corporate income tax rate reduction from 35% to 21% on deferred tax assets and liabilities.
2017 2016 2015 Reconciliation of Income Taxes
Federal income tax on Income Before Income Taxes at statutory tax rate - 35% $ 201 $ 193 $ 146Increase (decrease) due to:
State income taxes, net of federal income tax benefit 36 36 25Depreciation not normalized (8) (8) (4)Stock-based compensation (a) (2) (6) —Deferred tax impact of U.S. tax reform (b) (13) — —Other (1) (3) (3)
Total increase (decrease) 12 19 18Total income tax expense $ 213 $ 212 $ 164Effective income tax rate 37.0% 38.4% 39.4%

100
(a) During 2016, PPL Electric recorded lower income tax expense related to the application of new stock-based compensation accounting guidance. See Note 1 for additional information.
(b) During 2017, PPL Electric recorded a deferred tax benefit related to the U.S. federal corporate income tax rate reduction from 35% to 21% enacted by theTCJA.
2017 2016 2015 Taxes, other than income
State gross receipts (a) $ 102 $ 100 $ 89Property and other 5 5 5
Total $ 107 $ 105 $ 94
(a) In 2015, the settlement of a 2011 gross receipts tax audit resulted in the reversal of $17 million of previously recognized reserves.
(LKE)
The provision for LKE's deferred income taxes for regulated assets and liabilities is based upon the ratemaking principles reflected in rates established by the KPSC, VSCC and the FERC. The difference in the provision for deferred income taxes for regulated assets and liabilities and the amount that otherwise would be recorded under GAAP is deferred and included in "Regulatory assets" or "Regulatory liabilities" on the Balance Sheets.
Significant components of LKE's deferred income tax assets and liabilities were as follows:
2017 (a) 2016 Deferred Tax Assets
Federal loss carryforwards $ 150 $ 248State loss carryforwards 41 35Federal tax credit carryforwards 181 186Contributions in aid of construction 17 29Regulatory liabilities 37 60Accrued pension costs 29 58Income taxes due to customers (b) 305 15Deferred investment tax credits 33 51Derivative liability 7 12Other 26 49Valuation allowances (8) (11)
Total deferred tax assets 818 732
Deferred Tax Liabilities Plant - net (b) 1,615 2,352Regulatory assets 61 102Other 8 13
Total deferred tax liabilities 1,684 2,467NNet deferred tax liability $ 866 $ 1,735
(a) Deferred tax assets and liabilities at December 31, 2017 reflect the U.S. federal corporate income tax rate reduction from 35% to 21% enacted by the TCJA.
(b) The impact on net deferred tax liabilities as a result of the U.S. federal tax rate reduction enacted by the TCJA is primarily related to plant (net of net operating losses) and resulted in a regulatory liability for income taxes due to customers, the deferred tax impact of which is reflected as a deferred tax asset.
At December 31, 2017, LKE had the following loss and tax credit carryforwards, related deferred tax assets, and valuationallowances recorded against the deferred tax assets.
Gross Deferred Tax
AssetValuationAllowance Expiration
Loss carryforwards (a) Federal net operating losses $ 713 $ 150 $ — 2028-2037Federal charitable contributions 14 3 — 2020-2022State net operating losses 874 41 — 2028-2037

101
Credit carryforwardsFederal investment tax credit 133 — 2025-2036Federal alternative minimum tax credit (b) 27 — Indefinite Federal - other 21 (8) 2019-2037State - other 1 — Indefinite
(a) Due to the enactment of the TCJA, deferred tax assets are reflected at the new U.S. federal corporate income tax rate of 21%. (b) The TCJA repealed the corporate alternative minimum tax (AMT) for tax years beginning after December 31, 2017. The existing indff efinite carryforward
period for AMT credits was retained.
Changes in deferred tax valuation allowances were:
Balance atBeginning of Period Additions Deductions
Balance at End
of Period2017 $ 11 $ 4 (a) $ 7 (b) $ 82016 12 — 1 (b) 112015 — 12 (c) — 12
(a) Federal tax credits expiring in 2021 that are more likely than not to expire before being utilized. (b) Federal tax credit expiring.(c) Federal tax credits expiring in 2016 through 2020 that are more likely than not to expire before being utilized. Details of the components of income tax expense, a reconciliation of federal income taxes derived from statutory tax ratesapplied to "Income from Continuing Operations Before Income Taxes" to income taxes for reporting purposes, and details of "Taxes, other than income" were:
2017 2016 2015 Income Tax Expense (Benefit)
Current - Federal $ 74 $ (36) $ 2Current - State 6 1 1
Total Current Expense (Benefit) 80 (35) 3Deferred - Federal (a) 268 248 405Deferred - State 32 38 32
Total Deferred Expense, excluding benefits of operating loss carryforwards 300 286 437Amortization of investment tax credit - Federal (3) (3) (3) Tax benefit of operating loss carryforwards
Deferred - Federal (2) 10 (198) Deferred - State — (1 ) —
Total Tax Expense (Benefit) of Operating Loss Carryforwards (2) 9 (198) Total income tax expense from continuing operations (b) $ 375 $ 257 $ 239
Total income tax expense - Federal $ 337 $ 219 $ 206Total income tax expense - State 38 38 33
Total income tax expense from continuing operations (b) $ 375 $ 257 $ 239
(a) Due to the enactment of the TCJA in 2017, LKE recorded $112 million of deferred income tax expense, of which $108 million related to the impact of theU.S. federal corporate income tax rate reduction from 35% to 21% on deferred tax assets and liabilities and $4 million related to valuation allowances ontax credits expiring in 2021.
(b) Excludes deferred federal and state tax expense (benefit) recorded to OCI of $(10) million in 2017, $(16) million in 2016 and less than $(1) million in 2015.

102
2017 2016 2015 Reconciliation of Income Taxes
Federal income tax on Income Before Income Taxes at statutory tax rate - 35% $ 242 $ 240 $ 211Increase (decrease) due to:
State income taxes, net of federal income tax benefit 25 25 22Amortization of investment tax credit (3) (3) (3)Valuation allowance adjustment (a) — — 12Stock-based compensation (b) 1 (3) —Deferred tax impact of U.S. tax reform (c) 112 — —Other (2) (2) (3)
Total increase 133 17 28Total income tax expense $ 375 $ 257 $ 239Effective income tax rate 54.3% 37.5% 39.6%
(a) Represents a valuation allowance against tax credits expiring through 2020 that are more likely than not to expire before being utilized. (b) During 2016, LKE recorded lower income tax expense related to the application of new stock-based compensation accounting guidance. See Note 1 for
additional information. (c) During 2017, LKE recorded deferred income tax expense primarily due to the U.S. federal corporate income tax rate reduction from 35% to 21% enacted
by the TCJA.
2017 2016 2015 Taxes, other than income
Property and other $ 65 $ 62 $ 57Total $ 65 $ 62 $ 57
(LG&E)
The provision for LG&E's deferred income taxes for regulated assets and liabilities is based upon the ratemaking principlesreflected in rates established by the KPSC and the FERC. The difference in the provision for deferred income taxes for regulated assets and liabilities and the amount that otherwise would be recorded under GAAP is deferred and included in "Regulatory assets" or "Regulatory liabilities" on the Balance Sheets.Significant components of LG&E's deferred income tax assets and liabilities were as follows:
2017 (a) 2016 Deferred Tax Assets
Federal loss carryforwards $ 29 $ 80Contributions in aid of construction 11 18Regulatory liabilities 21 34Deferred investment tax credits 9 14Income taxes due to customers (b) 142 17Derivative liability 7 12Other 12 17
Total deferred tax assets 231 192
Deferred Tax Liabilities Plant - net (b) 724 1,058Regulatory assets 40 65Accrued pension costs 34 35Other 5 8
Total deferred tax liabilities 803 1,166Net deferred tax liability $ 572 $ 974
(a) Deferred tax assets and liabilities at December 31, 2017 reflect the U.S. federal corporate income tax rate reduction from 35% to 21% enacted by the TCJA.
(b) The impact on net deferred tax liabilities as a result of the U.S. federal tax rate reduction enacted by the TCJA is primarily related to plant (net of net operating losses) and resulted in a regulatory liability for income taxes due to customers, the deferred tax impact of which is reflected as a deferred tax asset.
LG&E expects to have adequate levels of taxable income to realize its recorded deferred income tax assets.

103
At December 31, 2017, LG&E had $140 million of federal net operating loss carryforwards that expire in 2035 and $6 million of federal credit carryforwards that expire from 2034 to 2037.
Details of the components of income tax expense, a reconciliation of federal income taxes derived from statutory tax ratesapplied to "Income Before Income Taxes" to income taxes for reporting purposes, and details of "Taxes, other than income" TTwere:
2017 2016 2015 Income Tax Expense (Benefit)
Current - Federal $ — $ (22) $ (15) Current - State 5 1 3
Total current Expense (Benefit) 5 (21) (12) Deferred - Federal 112 134 190Deferred - State 14 18 13
Total Deferred Expense, excluding benefits of operating loss carryforwards 126 152 203Amortization of investment tax credit - Federal (1) (1) (1) Tax benefit of operating loss carryforwards
Deferred - Federal 1 (4) (76) Total Tax Benefit of Operating Loss Carryforwards 1 (4 ) (76)
Total income tax expense $ 131 $ 126 $ 114
Total income tax expense - Federal $ 112 $ 107 $ 98Total income tax expense - State 19 19 16
Total income tax expense $ 131 $ 126 $ 114
2017 2016 2015 Reconciliation of Income Taxes
Federal income tax on Income Before Income Taxes at statutory tax rate - 35% $ 120 $ 115 $ 105
Increase (decrease) due to: State income taxes, net of federal income tax benefit 13 12 11Amortization of investment tax credit (1) (1) (1)Other (1) — (1)
Total increase 11 11 9Total income tax expense $ 131 $ 126 $ 114Effective income tax rate 38.1% 38.3% 38.1%
2017 2016 2015 Taxes, other than income
Property and other $ 33 $ 32 $ 28Total $ 33 $ 32 $ 28
(KU)
The provision for KU's deferred income taxes for regulated assets and liabilities is based upon the ratemaking principlesreflected in rates established by the KPSC, VSCC and the FERC. The difference in the provision for deferred income taxes for regulated assets and liabilities and the amount that otherwise would be recorded under GAAP is deferred and included in "Regulatory assets" or "Regulatory liabilities" on the Balance Sheets.
Significant components of KU's deferred income tax assets and liabilities were as follows:
2017 (a) 2016 Deferred Tax Assets
Federal loss carryforwards $ 13 $ 79Contributions in aid of construction 6 11Regulatory liabilities 16 26Deferred investment tax credits 24 37Income taxes due to customers (b) 163 —Other 9 11

104
2017 (a) 2016 Total deferred tax assets 231 164
Deferred Tax Liabilities Plant - net (b) 882 1,280Regulatory assets 21 37Accrued pension costs 17 12Other 2 5
Total deferred tax liabilities 922 1,334NNet deferred tax liability $ 691 $ 1,170
(a) Deferred tax assets and liabilities at December 31, 2017 reflect the U.S. federal corporate income tax rate reduction from 35% to 21% enacted by the TCJA.
(b) The impact on net deferred tax liabilities as a result of the U.S. federal tax rate reduction enacted by the TCJA is primarily related to plant (net of net operating losses) and resulted in a regulatory liability for income taxes due to customers, the deferred tax impact of which is reflected as a deferred tax asset.
KU expects to have adequate levels of taxable income to realize its recorded deferred income tax assets.
At December 31, 2017, KU had $61 million of federal net operating loss carryforwards that expire in 2035 and $6 million of federal credit carryforwards that expire from 2034 to 2037.
Details of the components of income tax expense, a reconciliation of federal income taxes derived from statutory tax ratesapplied to "Income Before Income Taxes" to income taxes for reporting purposes, and details of "Taxes, other than income" TTwere:
2017 2016 2015 Income Tax Expense (Benefit)
Current - Federal $ — $ 31 $ (21) Current - State 7 5 1
Total Current Expense (Benefit) 7 36 (20) Deferred - Federal 138 131 240Deferred - State 16 19 19
Total Deferred Expense, excluding benefits of operating loss carryforwards 154 150 259Amortization of investment tax credit - Federal (2) (2) (2) Tax benefit of operating loss carryforwards
Deferred - Federal — (21) (97) Total Tax Benefit of Operating Loss Carryforwards — (21 ) (97)
Total income tax expense (a) $ 159 $ 163 $ 140
Total income tax expense - Federal $ 136 $ 139 $ 120Total income tax expense - State 23 24 20
Total income tax expense (a) $ 159 $ 163 $ 140
(a) Excludes deferred federal and state tax expense (benefit) recorded to OCI of less than $1 million in 2017, and less than $(1) million in 2016 and 2015.
2017 2016 2015 Reconciliation of Income Taxes
Federal income tax on Income Before Income Taxes at statutory tax rate - 35% $ 146 $ 150 $ 131Increase (decrease) due to:
State income taxes, net of federal income tax benefit 15 16 13Amortization of investment tax credit (2) (2) (2)Other — (1) (2)
Total increase 13 13 9Total income tax expense $ 159 $ 163 $ 140Effective income tax rate 38.0% 38.1% 37.4%

105
2017 2016 2015 Taxes, other than income
Property and other $ 32 $ 30 $ 29Total $ 32 $ 30 $ 29
Unrecognized Tax Benefits (All Registrants)
PPL or its subsidiaries file tax returns in four major tax jurisdictions. The income tax provisions for PPL Electric, LG&E and KU are calculated in accordance with an intercompany tax sharing agreement, which provides that taxable income becalculated as if each domestic subsidiary filed a separate consolidated return. Based on this tax sharing agreement, PPL Electricor its subsidiaries indirectly or directly file tax returns in two major tax jurisdictions, and LKE, LG&E and KU or their subsidiaries indirectly or directly file tax returns in two major tax jurisdictions. With few exceptions, at December 31, 2017,these jurisdictions, as well as the tax years that are no longer subject to examination, were as follows.
PPL PPL Electric LKE LG&E KUU.S. (federal) 2013 and prior 2013 and prior 2013 and prior 2013 and prior 2013 and prior Pennsylvania (state) 2011 and prior 2011 and prior Kentucky (state) 2012 and prior 2012 and prior 2012 and prior 2012 and prior U.K. (foreign) 2014 and prior
Other (PPL)
In 2015, PPL recorded a tax benefit of $24 million, related to the settlement of the IRS audit for tax years 1998-2011. Of thisamount, $12 million is reflected in continuing operations. PPL finalized the settlement of interest in 2016 and recorded an additional $3 million tax benefit.
6. Utility Rate Regulation
Regulatory Assets and Liabilities
(All Registrants)
PPL, PPL Electric, LKE, LG&E and KU reflect the effects of regulatory actions in the financial statements for their cost-based rate-regulated utility operations. Regulatory assets and liabilities are classified as current if, upon initial recognition, the entireamount related to an item will be recovered or refunded within a year of the balance sheet date.
(PPL)
WPD is not subject to accounting for the effects of certain types of regulation as prescribed by GAAP and doesy not record regulatory assets and liabilities. See Note 1 for additional information.
(PPL, LKE, LG&E and KU)
LG&E is subject to the jurisdiction of the KPSC and FERC, and KU is subject tof the jurisdiction of the KPSC, FERC and VSCC.
LG&E's and KU's Kentucky base rates are calculated based on a return on capitalization (common equity, long-term debt and short-term debt) including adjustments for certain net investments and costs recovered separately through other means. As such, LG&E and KU generally earn a return on regulatory assets.
As a result of purchase accounting requirements, certain fair value amounts related to contracts that had favorable or runfavorable terms relative to market were recorded on the Balance Sheets with an offsetting regulatory asset or liability. LG&Eand KU recover in customer rates the cost of power purchases. As a result, management believes the regulatory assets and liabilities created to offset the fair value amounts at LKE's acquisition date meet the recognition criteria established by existing accounting guidance and eliminate any rate-making impact of the fair value adjustments. LG&E's and KU's customer rates continue to reflect the original contracted prices for remaining contracts.

106
(PPL, LKE and KU)
KU's Virginia base rates are calculated based on a return on rate base (net utility plant plus working capital less deferred taxes aaand miscellaneous deductions). All regulatory assets and liabilities, except the levelized fuel factor, are excluded from thereturn on rate base utilized in the calculation of Virginia base rates. Therefore, no return is earned on the related assets.
KU's rates to municipal customers for wholesale requirements are calculated based on annual updates to a rate formula that utilizes a return on rate base (net utility plant plus working capital less deferred taxes and miscellaneous deductions). All regulatory assets and liabilities, except regulatory assets recorded for AROs related to certain CCR impoundments, areexcluded from the return on rate base utilized in the development of municipal rates. Therefore, no return is earned on the related assets.
(PPL and PPL Electric)
PPL Electric's distribution base rates are calculated based on recovery of costs as well as a return on distribution rate base (net utility plant plus a working capital allowance less plant-related deferred taxes and other miscellaneous additions and deductions). PPL Electric's transmission revenues are billed in accordance with a FERC tariff that allows for recovery of transmission costs incurred, a return on transmission-related rate base (net utility plant plus a working capital allowance lessplant-related deferred taxes and other miscellaneous additions and deductions) and an automatic annual update. See "Transmission Formula Rate" below for additional information on this tariff. All regulatory assets and liabilities are excludedfrom distribution and transmission return on investment calculations; therefore, generallyn no return is earned on PPL Electric's regulatory assets.
(All Registrants)
The following table provides information about the regulatory assets and liabilities of cost-based rate-regulated utilityoperations at December 31,:
PPL PPL Electric 2017 2016 2017 2016
Current Regulatory Assets: Environmental cost recovery $ 5 $ 6 $ — $ —Generation formula rate 6 11 — —Transmission service charge — 7 — 7Gas supply clause 4 3 — —Smart meter rider 15 6 15 6Storm costs — 5 — 5Other 4 1 1 1
Total current regulatory assets (a) $ 34 $ 39 $ 16 $ 19
Noncurrent Regulatory Assets:
Defined benefit plans $ 880 $ 947 $ 504 $ 549Taxes recoverable through future rates 3 340 3 340Storm costs 33 57 — 9Unamortized loss on debt 54 61 29 36Interest rate swaps 26 31 — —Terminated interest rate swaps 92 98 — —Accumulated cost of removal of utility plant 173 159 173 159AROs 234 211 — —Other 9 14 — 1
Total noncurrent regulatory assets $ 1,504 $ 1,918 $ 709 $ 1,094
Current Regulatory Liabilities:Generation supply charge $ 34 $ 23 $ 34 $ 23Transmission service charge 9 — 9 —Universal service rider 26 14 26 14Transmission formula rate 9 15 9 15Fuel adjustment clauses 3 11 — —Act 129 compliance rider — 17 — 17

107
Storm damage expense rider 8 13 8 13Other 6 8 — 1
Total current regulatory liabilities $ 95 $ 101 $ 86 $ 83
NNoncurrent Regulatory Liabilities:
Accumulated cost of removal of utility plant $ 677 $ 700 $ — $ —Power purchase agreement - OVEC (b) 68 75 — —Net deferred taxes (c) 1,853 23 668 —Defined benefit plans 27 23 — —Terminated interest rate swaps 74 78 — —Other 5 — — —
Total noncurrent regulatory liabilities $ 2,704 $ 899 $ 668 $ —
LKE LG&E KU2017 2016 2017 2016 2017 2016
Current Regulatory Assets: Environmental cost recovery $ 5 $ 6 $ 5 $ 6 $ — $ —Generation formula rate 6 11 — — 6 11Gas supply clause 4 3 4 3 — —Other 3 — 3 — — —
Total current regulatory assets $ 18 $ 20 $ 12 $ 9 $ 6 $ 11
Noncurrent Regulatory Assets:
Defined benefit plans $ 376 $ 398 $ 234 $ 246 $ 142 $ 152Storm costs 33 48 18 26 15 22Unamortized loss on debt 25 25 16 16 9 9Interest rate swaps 26 31 26 31 — —Terminated interest rate swaps 92 98 54 57 38 41AROs 234 211 61 70 173 141Other 9 13 2 4 7 9
Total noncurrent regulatory assets $ 795 $ 824 $ 411 $ 450 $ 384 $ 374
Current Regulatory Liabilities: Demand side management $ — $ 3 $ — $ 2 $ — $ 1Fuel adjustment clause 3 11 — 2 3 9Gas line tracker 3 — 3 — — —Other 3 4 — 1 3 3
Total current regulatory liabilities $ 9 $ 18 $ 3 $ 5 $ 6 $ 13
NNoncurrent Regulatory Liabilities:
Accumulated cost of removal of utility plant $ 677 $ 700 $ 282 $ 305 $ 395 $ 395
Power purchase agreement - OVEC (b) 68 75 47 52 21 23NNet deferred taxes (c) 1,185 23 552 23 633 —Defined benefit plans 27 23 — — 27 23Terminated interest rate swaps 74 78 37 39 37 39Other 5 — 1 — 4 —
Total noncurrent regulatory liabilities $ 2,036 $ 899 $ 919 $ 419 $ 1,117 $ 480
(a) For PPL, these amounts are included in "Other current assets" on the Balance Sheets. (b) This liability was recorded as an offset to an intangible asset that was recorded at fair value upon the acquisition of LKE by PPL.(c) Primarily relates to excess deferred taxes recorded as a result of the TCJA, which lowered the federal corporate income tax rate effective January 1, 2018
requiring deferred tax balances and the associated regulatory liabilities to be remeasured as of December 31, 2017.
Following is an overview of selected regulatory assets and liabilities detailed in the preceding tables. Specific developments with respect to certain of these regulatory assets and liabilities are discussed in "Regulatory Matters."
PPL PPL Electric 2017 2016 2017 2016

108
Defined Benefit Plans
(All Registrants)
Defined benefit plan regulatory assets and liabilities represent prior service cost and net actuarial gains and losses that will be recovered in defined benefit plans expense through future base rates based upon established regulatory practices and, generally,yyare amortized over the average remaining service lives of plan participants. These regulatory assets and liabilities are adjusted at least annually or whenever the funded status of defined benefit plans is remeasured. Of the regulatory asset and liabilitybalances recorded, costs of $68 million for PPL, $30 million for PPL Electric, $38 million for LKE, $26 million for LG&E and$12 million for KU, are expected to be amortized into net periodic defined benefit costs in 2018 in accordance with PPL's, PPL Electric's, LKE's, LG&E's and KU's pension accounting policy.
(PPL, LKE, LG&E and KU)
As a result of the 2014 Kentucky rate case settlement that became effective July 1, 2015, the difference between pension cost calculated in accordance with LG&E's and KU's pension accounting policy and pension cost calculated using a 15-year amortization period for actuarial gains and losses is recorded as a regulatory asset. As of December 31, 2017, the balances were $33 million for PPL and LKE, $18 million for LG&E and $15 million for KU. As of December 31, 2016, the balances were$20 million for PPL and LKE, $11 million for LG&E and $9 million for KU. Of the costs expected to be amortized into net periodic defined benefit costs in 2018, $16 million for PPL and LKE, $10 million for LG&E and $6 million for KU, areexpected to be recorded as a regulatory asset in 2018.
(All Registrants)
Storm Costs
PPL Electric, LG&E and KU have the ability to request from the PUC, KPSC and VSCC, as applicable, the authority to treat expenses related to specific extraordinary storms as a regulatory asset and defer such costs for regulatory accounting and reporting purposes. Once such authority is granted, LG&E and KU can request recovery of those expenses in a base rate case and begin amortizing the costs when recovery starts. PPL Electric can recover qualifying expenses caused by major storm events, as defined in its retail tariff, over three years through the Storm Damage Expense Rider commencing in the applicationyear after the storm occurred. PPL Electric's, LG&E's and KU's regulatory assets for storm costs are being amortized throughvarious dates ending in 2020.
Unamortized Loss on Debt
Unamortized loss on reacquired debt represents losses on long-term debt reacquired or redeemed that have been deferred and rwill be amortized and recovered over either the original life of the extinguished debt or the life of the replacement debt (in thecase of refinancing). Such costs are being amortized through 2029 for PPL Electric, through 2042 for KU, and through 2044 for PPL, LKE and LG&E.
Accumulated Cost of Removal of Utility Plant y
LG&E and KU charge costs of removal through depreciation expense with an offsetting credit to a regulatory liability. Theregulatory liability is relieved as costs are incurred.d
PPL Electric does not accrue for costs of removal. When costs of removal are incurred, PPL Electric records the costs as a regulatory asset. Such deferral is included in rates and amortized over the subsequent five-year period.
Regulatory Liability Associated with Net Deferred Taxesg y y
Regulatory liabilities associated with net deferred taxes represent the future revenue impact from the adjustment of deferred income taxes required primarily for excess deferred taxes and unamortized investment tax credits. At December 31, 2017, excess deferred taxes recorded as a result of the TCJA were $2.2 billion at PPL, $1.0 billion at PPL Electric, $1.2 billion at LKE, $532 million at LG&E and $634 million at KU, which include the gross-up associated with the excess deferred taxes.

109
(PPL and PPL Electric)
Generation Supply Charge (GSC)pp y g ( )
The GSC is a cost recovery mechanism that permits PPL Electric to recover costs incurred to provide generation supply to PLR customers who receive basic generation supply service. The recovery includes charges for generation supply (energy and capacity and ancillary services), as well as administration of the acquisition process. In addition, the GSC contains areconciliation mechanism whereby any over- or under-recovery from prior quarters isr refunded to, or recovered from,customers through the adjustment factor determined for the subsequent rate filing period.
Transmission Service Charge (TSC)g ( )
PPL Electric is charged by PJM for transmission service-related costs applicable to its PLR customers. PPL Electric passes these costs on to customers, who receive basic generation supply service through the PUC-approved TSC cost recovery mechanism. The TSC contains a reconciliation mechanism whereby any over- or under-recovery from customers is either refunded to, or recovered from, customers through the adjustment factor determined for the subsequent year.
Transmission Formula Rate
PPL Electric's transmission revenues are billed in accordance with a FERC-approved Open Access Transmission Tariff that utilizes a formula-based rate recovery mechanism. Under this formula, rates are put into effect in June of each year based uponprior year actual expenditures and current year forecasted capital additions. Rates are then adjusted the following year to reflect ffactual annual expenses and capital additions, as reported in PPL Electric's annual FERC Form 1, filed under the FERC's Uniform System of Accounts. Any difference between the revenue requirement in effect for the prior year and actualexpenditures incurred for that year is recorded as a regulatory asset or regulatory liability.
Storm Damage Expense Rider (SDER) g p ( )
The SDER is a reconcilable automatic adjustment clause under which PPL Electric annuallytt will compare actual storm costs tostorm costs allowed in base rates and refund or recover any differences from customers. In the 2015 rate case settlement approved by the PUC in November 2015, it was determined that reportable storm damage expenses to be recovered annuallythrough base rates will be set at $15 million. The SDER will recover from or refund to customers, as appropriate, only dapplicable expenses from reportable storms that are greater than or less than $15 million recovered annually through base rates. Beginning January 1, 2018, the amortized 2011 storm expense of $5 million will be included in the base rate component of the SDER.
Taxes Recoverable through Future Ratesg
Taxes recoverable through future rates represent the portion of future income taxes that will be recovered through future ratesbased upon established regulatory practices. Accordingly, this regulatory asset is recognized when the offsetting deferred tax liability is recognized. For general-purpose financial reporting, this regulatory asset and the deferred tax liability are not offset;rather, each is displayed separately. This regulatory asset is expected to be recovered over the period that the underlying book-tax timing differences reverse and the actual cash taxes are incurred.
Act 129 Compliance Rider p
In compliance with Pennsylvania's Act 129 of 2008 and implementing regulations, Phase I of PPL Electric's energy efficiency fand conservation plan was approved by a PUC order in October 2009. The order allowed PPL Electric to recover the maximum $250 million cost of the program ratably over the life of the plan, from January 1, 2010 through May 31, 2013. Phase II of PPL's energy efficiency and conservation plan allowed PPL Electric to recover the maximum $185 million cost of the program over the three year period June 1, 2013 through May 31, 2016. Phase III of PPL's energy efficiency and conservation plan allows PPL Electric to recover the maximum $313 million over the next five year period, June 1, 2016 through May 31, 2021.The plan includes programs intended to reduce electricity consumption. The recoverable costs include direct and indirect charges, including design and development costs, general and administrative costs and applicable state evaluator costs. Therates are applied to customers who receive distribution service through the Act 129 Compliance Rider. The Phase II program costs were reconciled at the end of the program and any remaining over- or under-recovery was rolled into Phase III. The actualPhase III program costs are reconcilable after each 12 month period, and any over- or under-recovery from customers will be

110
refunded or recovered over the next rate filing period. See below under "Regulatory Matters - Pennsylvania Activities" for additional information on Act 129.
Smart Meter Rider (SMR) ( )
Act 129, which became effective November 14, 2008, requires each electric distribution company (EDC) with more than 100,000 customers to have a PUC approved Smart Meter Technology Procurement and Installation Plan (SMP). PPL Electric filed its initial SMP in 2009. However, in 2010, the PUC foundn that PPL Electric's "Advanced Metering Infrastructure" (AMI) system did not fully meet the standards of Act 129. In 2014, PPL Electric filed its current SMP, which was approved by the ffPUC in 2015. Under its SMP, PPL Electric will replace its current meters with new meters that meet the Act 129 requirements by the end of 2019. Under Act 129, EDCs are able to recover the costs of providing smart metering technology. PPL Electricuses a mechanism known as the Smart Meter Rider (SMR) to recover the costs to implement its SMP on a full and current basis. The SMR is a reconciliation mechanism whereby any over-or under-recovery from prior years is refunded to, or recovered from, customers through the adjustment factor determined for the subsequent quarters.
Universal Service Rider (USR)( )
The USR provides for recovery of costs associated with universal service programs, OnTrack and Winter Relief AssistanceProgram (WRAP), provided by PPL Electric to residential customers. OnTrack is a special payment program for low-incomehouseholds and WRAP provides low-income customers a means to reduce electric bills through energy saving methods. The USR rate is applied to residential customers who receive distribution service. The actual program costs are reconcilable, and any over- or under-recovery from customers will be refunded or recovered annually in the subsequent year.
(PPL, LKE, LG&E and KU)
Environmental Cost Recovery y
Kentucky law permits LG&E and KU to recover the costs, including a return of operating expenses and a return of and on capital invested, of complying with the Clean Air Act and those federal, state or local environmental requirements, which applyto coal combustion wastes and by-products from coal-fired electricity generating facilities. The KPSC requires reviews of thepast operations of the environmental surcharge for six-month and two-year billing periods to evaluate the related charges, credits and rates of return, as well as to provide for the roll-in of ECR amounts to base rates each two-year period. In rDecember 2017, the KPSC issued orders continuing the use of an authorized return on equity of 9.7% for all existing approved ECR plans and projects. The ECR regulatory asset or liability represents the amount that has been under- or over-recovered due to timing or adjustments to the mechanism and is typically recovered within 12 months.
Fuel Adjustment Clauses j
LG&E's and KU's retail electric rates contain a fuel adjustment clause, whereby variances in the cost of fuel to generate electricity, including transportation costs, from the costs embedded in base rates are adjusted in LG&E's and KU's rates. The dKPSC requires public hearings at six-month intervals to examine past fuel adjustments and at two-year intervals to review past operations of the fuel adjustment clause and, to the extent appropriate, reestablish the fuel charge included in base rates. Theregulatory assets or liabilities represent the amounts that have been under- or over-recovered due to timing or adjustments to the mechanism and are typically recovered within 12 months.
KU also employs a levelized fuel factor mechanism for Virginia customers using an average fuel cost factor based primarily onprojected fuel costs. The Virginia levelized fuel factor allows fuel recovery based on projected fuel costs for the coming yearplus an adjustment for any under- or over-recovery of fuel expenses from the prior year. The regulatory assets or liabilitiesrepresent the amounts that have been under- or over-recovered due to timing or adjustments to the mechanism and are typicallyrecovered within 12 months.
Demand Side Management g
LG&E's and KU's DSM programs consist of energy efficiency programs, intended to reduce peak demand and delay investment in additional power plant construction, provide customers with tools and informrr ation to become better managers of their energy usage and prepare for potential future legislation governing energy efficiency. LG&E's and KU's rates contain a DSMprovision, which includes a rate recovery mechanism that provides for concurrent recovery of DSM costs and incentives, and allows for the recovery of DSM revenues from lost sales associated with the DSM programs. Additionally, LG&E and KU earn

111
an approved return on equity for capital expenditures associated with the residential and commercial load management and demand conservation programs. The cost of DSM programs is assigned only to the class or classes of customers that benefit from the programs.
AROs
As discussed in Note 1, for LKE, LG&E and KU, all ARO accretion and depreciation expenses are reclassified as a regulatory asset. ARO regulatory assets associated with certain CCR projects are amortized to expense in accordance with regulatory approvals. For other AROs, at the time of retirement, the related ARO regulatory asset is offset against the associated cost ofremoval regulatory liability, PP&E and ARO liability.
Power Purchase Agreement - OVEC g
As a result of purchase accounting associated with PPL's acquisition of LKE, the fair values of the OVEC power purchase agreement were recorded on the balance sheets of LKE, LG&E and KU with offsets to regulatory liabilities. The regulatory liabilities are being amortized using the units-of-production method until March 2026, the expiration date of the agreement at the date of the acquisition. See Notes 1, 13 and 18 for additional discussion of the power purchase agreement.
Interest Rate Swapsp
LG&E's unrealized gains and losses are recorded as regulatory assets or regulatory liabilities until they are realized as interest expense. Interest expense from existing swaps is realized and recovered over the terms of the associated debt, which maturesthrough 2033.
Terminated Interest Rate Swaps p
Net realized gains and losses on all interest rate swaps are probable of recovery through regulated rates; as such, any gains and losses on these derivatives are included in regulatory assets or liabilities and are primarily recognized in "Interest Expense" on the Statements of Income over the life of the associated debt.
A net cash settlement of $9 million was paid on a swap that was terminated by LG&E in December 2016. The KPSCauthorized the recording of a regulatory asset and the recovery of such costs. As part of the Stipulation to the 2016 Kentucky rate case that became effective July 1, 2017, the KPSC authorized LG&E to recover the swap termination payment through amortization of the regulatory asset using a straight-line method over 17 years. The amortization of the regulatory asset is drecognized in "Interest Expense" on the Statements of Income.
Plant Outage Costsg
The Stipulation to the 2016 Kentucky rate case that became effective July 1, 2017 provided for the normalization of expensesffassociated with plant outages using an eight-year average. The eight-year average is comprised of four historical years' and four forecasted years' expenses. Plant outage expenses that are greater or less than the eight-year average will be collected from or returned to customers, through future base rates. These amounts are included in other current regulatory assets or other current t regulatory liabilities above.
(PPL, LKE and LG&E)
Gas Line Tracker
The GLT authorizes LG&E to recover its incremental operating expenses, depreciation, property taxes and cost of capital,including a return on equity, for capital associated with the five year gas service riser, leak mitigation and customer service lineownership programs. As part of this program, LG&E makes necessary repairs to the gas distribution system and assumesownership of service lines when replaced. In the 2016 rate case, the KPSC approved additional projects for recovery through the GLT mechanism related to further gas line replacements and transmission pipeline modernizations. Effective July 1, 2017,LG&E is authorized to earn a 9.7% return on equity for the GLT mechanism. As part of the 2016 rate case, LG&E nowannually files a combined application which includes revised rates based on projected costs and a balancing adjustment calculation with rates effective on the first billing cycle in May. After the completion of a plan year, the balancing adjustment,as part of the combined application filing to the KPSC, amends rates charged for the differences between the actual costs and actual GLT charges for the preceding year. The regulatory assets or liabilities represent the amounts that have been under- or over-recovered due to these cost differences.

112
Gas Supply Clausepp y
LG&E's natural gas rates contain a gas supply clause, whereby the expected cost of natural gas supply and variances between actual and expected costs from prior periods are adjusted quarterly in LG&E's rates, subject to approval by the KPSC. The gas supply clause also includes a separate natural gas procurement incentive mechanism, which allows LG&E's rates to be adjusted annually to share savings between the actual cost of gas purchases and market indices with the shareholders and the customersduring each performance-based rate year (12 months ending October 31). The regulatory assets or liabilities represent the totalamounts that have been under- or over-recovered due to timing or adjustments to the mechanisms and are typically recovered within 18 months.
(PPL, LKE and KU)
Generation Formula Rates
KU provides wholesale requirements service to its municipal customers and bills for this service pursuant to a FERC approved generation formula rate. Under this formula, rates are put into effect in July of each year utilizing a return on rate base calculation and actual expenses from the preceding year. The regulatory asset represents the difference between the revenue requirement in effect for the preceding year and actual expenditures incurred for the current year.
Regulatory Matters
(PPL)
U.K. Activities
RIIO-ED1
On April 1, 2015, the RIIO-ED1 eight-year price control period commenced for WPD's four DNOs.
(PPL, LKE, LG&E and KU)
Kentucky Activitiesy
Rate Case Proceedings
In November 2016, LG&E and KU filed requests with the KPSC for increases in annual base electricity and gas rates. LG&E'sand KU's applications included requests for CPCNs for implementing an Advanced Metering System program and a Distribution Automation program.
In April and May 2017, LG&E and KU, along with all intervening parties to the proceeding, filed with the KPSC, stipulation and recommendation agreements (stipulations) resolving all issues with the parties. Among other things, the proposed stipulations provided for increases in annual revenue requirements associated with LG&E base electricity rates of $59 million, LG&E base gas rates of $8 million and KU base electricity rates of $55 million, reflecting a return on equity of 9.75%, thewithdrawal of LG&E's and KU's request for a CPCN for the Advanced Metering System and other changes to the revenue requirements, which dealt primarily with the timing of cost recovery, including depreciation rates.
In June 2017, the KPSC issued orders approving, with certain modifications, the proposed stipulations filed in April and May 2017. The orders modified the stipulations to provide for increases in annual revenue requirements associated with LG&E baseelectricity rates of $57 million, LG&E base gas rates of $7 million, KU base electricity rates of $52 million and incorporated an authorized return on equity of 9.7%. Consistent with the stipulations, the orders approved LG&E's and KU's request for implementing a Distribution Automation program and their withdrawal of a request for a CPCN for the Advanced MeteringSystem program. The orders also approved new depreciation rates for LG&E and KU that resulted in higher depreciation of approximately $15 million ($4 million for LG&E and $11 million for KU) in 2017, exclusive of net additions to PP&E. Theorders resulted in base electricity and gas rate increases of 5.2% and 2.1% at LG&E and a base electricity rate increase of 3.2% at KU. The new base rates and all elements of the orders became effective July 1, 2017. On June 23, 2017, the KPSC issued orders establishing an authorized return on equity of 9.7% for all of LG&E's and KU's existing approved ECR plans and projects, replacing the prior authorized return on equity levels of 9.8% for CCR projects and 10% for all other ECR approved

113
projects, effective with bills issued in August 2017. The annual impact of the new authorized return for ECR projects is not expected to be significant.
CPCN Filing
On January 10, 2018, LG&E and KU filed an application for a CPCN with the KPSC requesting approval for implementing Advanced Metering Systems across their Kentucky service territories, including gas operations for LG&E. The full deployment is expected to be completed in 2021 with estimated capital costs of $155 million and $104 million for KU and LG&E electric service and $62 million for LG&E gas service. The full Advanced Metering Systems deployment will also result in incremental operation and maintenance costs during the deployment phase of $17 million and $11 million for KU and LG&E electric service and $3 million for LG&E gas service.
TCJA Impact on LG&E and KU Rates
On December 21, 2017, Kentucky Industrial Utility Customers, Inc. submitted a complaint with the KPSC against LG&E and KU, as well as other utility companies in Kentucky, alleging that their respective rates would no longer be fair, just and reasonable following the enactment of the TCJA reducing the federal corporate tax rate from 35% to 21%. The complaint requested the KPSC to issue an order requiring LG&E and KU to begin deferring, as of January 1, 2018, the revenuerequirement effect of all income tax expense savings resulting from the federal corporate income tax reduction, including the amortization of excess deferred income taxes by recording those savings in a regulatory liability account and establishing a process by which the federal corporate income tax savings will be passed back to customers.
On December 27, 2017, as a result of the complaint, the KPSC ordered LG&E and KU to satisfy or address the complaint and commence recording regulatory liabilities to reflect the reduction in the federal corporate tax rate to 21% and the associated savings in excess deferred taxes on an interim basis until utility rates are adjusted to reflecttt the federal tax savings. t
On January 8, 2018, LG&E and KU responded to the complaint, denying certain claims in the complaint but concurring that theTCJA will result in savings for their customers. LG&E and KU have stated in their responses that the companies have recorded regulatory liabilities as of December 31, 2017 to reflect the reduction in the federal corporate tax rate and the associated savings in excess deferred taxes and will make changes to their ECR, DSM and LG&E's GLT rate mechanisms to begin providing the applicable savings to customers. LG&E and KU also offered to establish a new bill credit mechanism effective with the April 2018 billing cycle to begin distributing the tax savings associated with base rates to customers. d
On January 29, 2018, LG&E and KU reached a settlement agreement to commence returning savings related to the TCJA to their customers. The savings will be distributed through their ECR, DSM and LG&E's GLT rate mechanisms beginning in March 2018 and through a new bill credit mechanism from April 1, 2018 through April 30, 2019. The estimated impact of therate reduction represents approximately $91 million in KU electricity revenues, $69 million in LG&E electricity revenues and $17 million in LG&E gas revenues for the period January 2018 through April 2019. Ongoing tax savings are expected to alsobe addressed in LG&E's and KU's next Kentucky base rate case. LG&E and KU have indicated their intent to file an application for base rate changes during 2018 to be effective during spring 2019. The settlement agreement is subject to reviewtand approval by the KPSC. An order in the proceeding may occur during the first quarter of 2018.
Additionally, on January 8, 2018, the VSCC ordered KU, as well as other utilities in Virginia, to accrue regulatory liabilitiesreflecting the Virginia jurisdictional revenue requirement impacts of the reduced federal corporate tax rate.
The FERC has not issued any guidance on the effect on rates of the TCJA.
LG&E and KU cannot predict the outcome of these proceedings.
(LKE and LG&E)
Gas Franchise
LG&E’s gas franchise agreement for the Louisville/Jefferson County service area expired in March 2016. In August 2016, xLG&E and Louisville/Jefferson County entered into a revised franchise agreement with a five-year term (with renewaloptions). The franchise fee may be modified at Louisville/Jefferson County's election upon 60 days' notice. However, anyfranchise fee is capped at 3% of gross receipts for natural gas service within the franchise area. The agreement further provides that if the KPSC determines that the franchise fee should be recovered from LG&E's customers, the franchise fee shall revert to

114
zero. In August 2016, LG&E filed an application in a KPSC proceeding to review and rule upon the recoverability of the franchise fee.
In August 2016, Louisville/Jefferson County submitted a motion to dismiss the proceeding filed by LG&E and, in November 2016, filed an amended complaint against LG&E relating to these issues. LG&E submitted KPSC filings to respond to, request dismissal of and consolidate certain claims or aspects of the proceedingr s. In January 2017, the KPSC issued an order denyingLouisville/Jefferson County's motion to dismiss, consolidating the matter with LG&E's filed application and establishing aprocedural schedule for the case. In September 2017, oral arguments were heard by the KPSC and a final order is expected in m2018. Until the KPSC issues a final order in this proceeding, LG&E cannot predict the ultimate outcome of this matter but doesnot anticipate that it will have a material effect on its financial condition or results of operation. LG&E continues to provide gas service to customers in this franchise area at existing rates, but without collecting or remitting a franchise fee.r
(PPL and PPL Electric)
Pennsylvania Activitiesy
Act 129
Act 129 requires Pennsylvania Electric Distribution Companies (EDCs) to meet, by specified dates, specified goals for reduction in customer electricity usage and peak demand. EDCs not meeting the requirements of Act 129 are subject to significant penalties. In November 2015, PPL Electric filed with the PUC its Act 129 Phase III Energy Efficiency and Conservation Plan for the period June 1, 2016 through May 31, 2021. In June 2016, the PUC approved PPL Electric's Phase IIIPlan, allowing PPL Electric to implement its energy efficiency and demand response programs and recover, through the Act 129 compliance rider, the $313 million cost of the programs over the five-year period June 1, 2016 through May 31, 2021.
Act 129 also requires Default Service Providers (DSP) to provide electricity generation supply service to customers pursuant toa PUC-approved default service procurement plan through auctions, requests for proposal and bilateral contracts at the solediscretion of the DSP. PPL Electric is a DSP. Act 129 requires a mix of spot market purchases, short-term contracts and long-term contracts (4 to 20 years), with long-term contracts limited to 25% of load unless otherwise approved by the PUC. A DSP isable to recover the costs associated with its default service procurement plan.
TCJA Impact on PPL Electric Rates (PPL and PPL Electric)
The PUC issued a Secretarial Letter on February 12, 2018 regarding the TCJA. The Commission is requesting comments from interested parties addressing whether the Commission should adjust current customer rates to reflect the reduced federal income tax expense and, if so, the appropriate negative surcharge or other methodology that would permit immediate adjustment to consumer rates, and whether the surcharge or other said methodology should provide that any refunds to customers due to reduced taxes be effective as of January 1, 2018. In addition, the Secretarial Letter requests certain Pennsylvania regulated utilities, including PPL Electric, to provide certain data related to the effect of the TCJA on PPL Electric’s income tax expense and rate base including whether any of the potential tax savings from the reduced federalcorporate tax rate can be used for purposes other than to reduce customer rates. PPL Electric’s responses are due to the PUC not later than March 9, 2018.
The FERC has not issued any guidance on the effect on rates of the TCJA.
Federal Matters
FERC Formula Rate
In April 2017, PPL Electric filed its annual transmission formula rate update with the FERC, reflecting a revised revenuerequirement. The filing establishes the revenue requirement used to set rates that took effect in June 2017. The time period for any challenges to PPL Electric's annual update has expired. No formal challenges were submitted.

115
Other
Purchase of Receivables Program g
(PPL and PPL Electric)
In accordance with a PUC-approved purchase of accounts receivable program, PPL Electric purchases certain accounts receivable from alternative electricity suppliers at a discount, which reflects a provision for uncollectible accounts. The alternative electricity suppliers have no continuing involvement or interest in the purchased accounts receivable. Accounts treceivable that are acquired are initially recorded at fair value on the date of acquisition. During 2017, 2016 and 2015, PPL Electric purchased $1.3 billion, $1.4 billion and $1.3 billion of accounts receivable from unaffiliated third parties. During 2015, PPL Electric purchased $146 million of accounts receivable from PPL EnergyPlus. PPL Electric's purchases from PPL EnergyPlus for 2015 included purchases through May 31, 2015, which is the period during which PPL Electric and PPL EnergyPlus were affiliated entities. As a result of the June 1, 2015 spinoff of PPL Energy Supply and creation of Talen Energy,PPL EnergyPlus (renamed Talen Energy Marketing) is no longer an affiliate of PPL Electric. PPL Electric's purchases from Talen Energy Marketing subsequent to May 31, 2015 are included as purchases from unaffiliated third parties.
7. Financing Activities
Credit Arrangements and Short-term Debt
(All Registrants)
The Registrants maintain credit facilities to enhance liquidity, provide credit support and provide a bau ckstop to commercial paper programs. For reporting purposes, on a consolidated basis, the credit facilities and commercial paper programs of PPL Electric, LKE, LG&E and KU also apply to PPL and the credit facilities and commercial paper programs of LG&E and KUalso apply to LKE. The amounts borrowed below are recorded as "Short-term ded bt" on the Balance Sheets except for borrowings under LG&E's Term Loan Facility which are recorded as "Long-term debt" on the Balance Sheets. The followingcredit facilities were in place at:
December 31, 2017 December 31, 2016
ExpirationDate Capacity Borrowed
Letters of Credit
andCommercial
Paper Issued
UnusedCapacity Borrowed
Letters of Credit
andCommercial
Paper Issued
PPL U.K.
WPD plc Syndicated Credit Facility (a) (c) Jan. 2022 £ 210 £ 148 £ — £ 60 £ 160 £ ——
WPD (South West) Syndicated Credit Facility (a) (c) July 2021 245 — — 245 110 ——
WPD (East Midlands) Syndicated Credit Facility (a) (c) July 2021 300 180 — 120 9 ——
WPD (West Midlands) Syndicated Credit Facility (a) (c) July 2021 300 120 — 180 — ——
Uncommitted Credit Facilities 100 — 4 96 60 4Total U.K. Credit Facilities (b) £ 1,155 £ 448 £ 4 £ 701 £ 339 £ 4
U.S. PPL Capital Funding
Syndicated Credit Facility (c) (d) Jan. 2022 $ 950 $ — $ 230 $ 720 $ — $ 20Syndicated Credit Facility (c) (d) Nov. 2018 300 — — 300 — ——Bilateral Credit Facility (c) (d) Mar. 2018 150 — 18 132 — 17
Total PPL Capital Funding Credit Facilities $ 1,400 $ — $ 248 $ 1,152 $ — $ 37
PPL Electric Syndicated Credit Facility (c) (d) Jan. 2022 $ 650 $ — $ 1 $ 649 $ — $ 296
LKE

116
December 31, 2017 December 31, 2016
ExpirationDate Capacity Borrowed
Letters of Credit
andCommercial
Paper Issued
UnusedCapacity Borrowed
Letters of Credit
andCommercial
Paper Issued
Syndicated Credit Facility (c) (d) Oct. 2018 $ 75 $ — $ — $ 75 $ — $ ——
LG&E Syndicated Credit Facility (c) (d) Jan. 2022 $ 500 $ — $ 199 $ 301 $ — $ 169Term Loan Credit Facility (c) (e) Oct. 2019 200 100 — 100 — —
Total LG&E Credit Facilities $ 700 $ 100 $ 199 $ 401 $ — $ 169
KU Syndicated Credit Facility (c) (d) Jan. 2022 $ 400 $ — $ 45 $ 355 $ — $ 16Letter of Credit Facility (c) (d) (f) Oct. 2020 198 — 198 — — 198
Total KU Credit Facilities $ 598 $ — $ 243 $ 355 $ — $ 214
(a) The facilities contain financial covenants to maintain an interest coverage ratio of not less than 3.0 times consolidated earnings before income taxes, depreciation and amortization and total net debt not in excess of 85% of its RAV, calculated in accordance with the credit facility.
(b) The WPD plc amounts borrowed at December 31, 2017 and 2016 included USD-denominated borrowings of $200 million for both periods, which boreinterest at 2.17% and 1.43%. The unused capacity reflects the amount borrowed in GBP of £150 million as of the date borrowed. The WPD (East Midlands) amount borrowed at December 31, 2017 was a GBP-denominated borrowing, which equated to $244 million and bore interest at 0.89%. The tWPD (West Midlands) amount borrowed at December 31, 2017 was a GBP-denominated borrowing, which equated to $162 million and bore interest at 0.89%. At December 31, 2017, the unused capacity under the U.K. credit facilities was approximately $949 million.
(c) Each company pays customary fees under its respective facility and borrowings generally bear interest at LIBOR-based rates plus an applicable margin.(d) The facilities contain a financial covenant requiring debt to total capitalization not to exceed 70% for PPL Capital Funding, PPL Electric, LKE, LG&E
and KU, as calculated in accordance with the facilities and other customary covenants. Additionally, as it relates to the syndicated and bilateral credit facilities and subject to certain conditions, PPL Capital Funding may request that the capacity of its facilities expiring in November 2018 and March 2018be increased by up to $30 million, LG&E and KU each may request up to a $100 million increase in its facility's capacity and LKE may request up to a$25 million increase in its facility's capacity.
(e) LG&E entered into a term loan credit agreement in October 2017 whereby it may borrow up to $200 million. The outstanding borrowings at December 31, 2017 bore interest at a rate of 2.06%.
(f) KU's letter of credit facility agreement allows for certain payments under the letter of credit facility to be converted to loans rather than requiringimmediate payment.
In January 2018, LG&E borrowed the remaining $100 million available under its $200 million term loan facility. The proceeds were used to repay short-term debt and for general corporate purposes.
In January 2018, the expiration dates for the PPL Capital Funding, PPL Electric, LG&E and KU syndicated credit facilitiesuuexpiring in January 2022 were extended to January 2023.
PPL, PPL Electric, LG&E and KU maintain commercial paper programs to provide an additional financing source to fund short-term liquidity needs, as necessary. Commercial paper issuances, included in "Short-term debt" on the Balance Sheets, are supported by the respective Registrant's Syndicated Credit Facility. The following commercial paper programs were in place at:
December 31, 2017 December 31, 2016 Weighted -
Average Interest Rate Capacity
Commercial Paper
IssuancesUnused
Capacity
Weighted - Average
Interest Rate
CommercialPaper
IssuancesPPL Capital Funding 1.64% $ 1,000 $ 230 $ 770 1.10% $ 20PPL Electric 650 — 650 1.05% 295LG&E 1.83% 350 199 151 0.94% 169KU 1.97% 350 45 305 0.87% 16
Total $ 2,350 $ 474 $ 1,876 $ 500
(PPL Electric, LKE, LG&E and KU)
See Note 14 for discussion of intercompany borrowings.

117
Weighted-Average Rate (g) Maturities (g) 2017 2016
PPL U.S.
Senior Unsecured Notes 3.78% 2020 - 2047 $ 4,575 $ 4,075Senior Secured Notes/First Mortgage Bonds (a) (b) (c) 3.96% 2018 - 2047 7,314 6,849Junior Subordinated Notes 5.10% 2067 - 2073 930 930Term Loan Credit Facility 2.06% 2019 100 —
Total U.S. Long-term Debt 12,919 11,854
U.K.
Senior Unsecured Notes (d) 5.24% 2020 - 2040 6,351 5,707Index-linked Senior Unsecured Notes (e) 1.56% 2026 - 2056 1,012 838
Total U.K. Long-term Debt (f) 7,363 6,545Total Long-term Debt Before Adjustments 20,282 18,399
Fair market value adjustments 21 22Unamortized premium and (discount), net (e) 14 20Unamortized debt issuance costs (122) (115)
Total Long-term Debt 20,195 18,326Less current portion of Long-term Debt 348 518
Total Long-term Debt, noncurrent $ 19,847 $ 17,808
PPL Electric
Senior Secured Notes/First Mortgage Bonds (a) (b) 4.23% 2020 - 2047 $ 3,339 $ 2,864Total Long-term Debt Before Adjustments 3,339 2,864
Unamortized discount (16) (12)Unamortized debt issuance costs (25) (21)
Total Long-term Debt 3,298 2,831Less current portion of Long-term Debt — 224
Total Long-term Debt, noncurrent $ 3,298 $ 2,607
LKE Senior Unsecured Notes 3.97% 2020 - 2021 $ 725 $ 725Term Loan Credit Facility 2.06% 2019 100 —First Mortgage Bonds (a) (c) 3.73% 2018 - 2045 3,975 3,985Long-term debt to affiliate 3.50% 2026 400 400
Total Long-term Debt Before Adjustments 5,200 5,110
Fair market value adjustments — (1) Unamortized discount (14) (15)Unamortized debt issuance costs (27) (29)
Total Long-term Debt 5,159 5,065Less current portion of Long-term Debt 98 194
Total Long-term Debt, noncurrent $ 5,061 $ 4,871
LG&E Term Loan Credit Facility 2.06% 2019 $ 100 $ —First Mortgage Bonds (a) (c) 3.48% 2018 - 2045 1,624 1,634
Total Long-term Debt Before Adjustments 1,724 1,634
Fair market value adjustments — (1) Unamortized discount (4) (4)
Long-term Debt (All Registrants)
December 31,
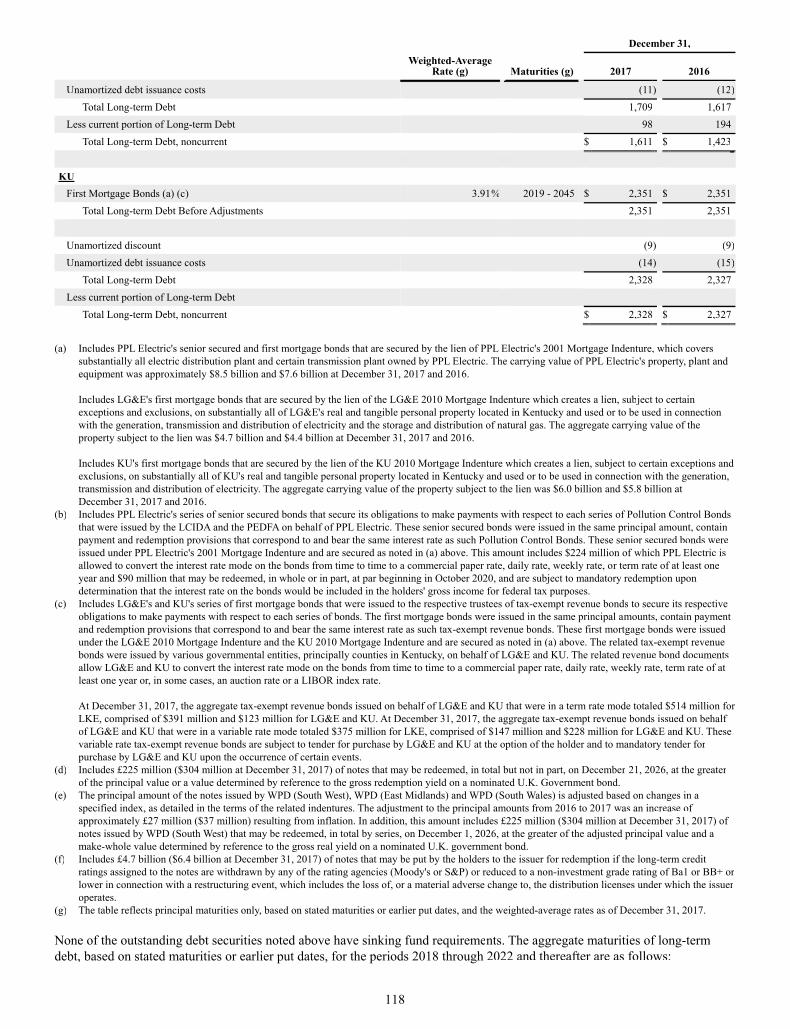
118
December 31, Weighted-Average
Rate (g) Maturities (g) 2017 2016
Unamortized debt issuance costs (11) (12) Total Long-term Debt 1,709 1,617
Less current portion of Long-term Debt 98 194Total Long-term Debt, noncurrent $ 1,611 $ 1,423
KU First Mortgage Bonds (a) (c) 3.91% 2019 - 2045 $ 2,351 $ 2,351
Total Long-term Debt Before Adjustments 2,351 2,351
Unamortized discount (9) (9) Unamortized debt issuance costs (14) (15)
Total Long-term Debt 2,328 2,327Less current portion of Long-term Debt — —
Total Long-term Debt, noncurrent $ 2,328 $ 2,327
(a) Includes PPL Electric's senior secured and first mortgage bonds that are secured by the lien of PPL Electric's 2001 Mortgage Indenture, which coverssubstantially all electric distribution plant and certain transmission plant owned by PPL Electric. The carrying value of PPL Electric's property, plant and equipment was approximately $8.5 billion and $7.6 billion at December 31, 2017 and 2016.
Includes LG&E's first mortgage bonds that are secured by the lien of the LG&E 2010 Mortgage Indenture which creates a lien, subject to certainbexceptions and exclusions, on substantially all of LG&E's real and tangible personal property located in Kentucky and used or to be used in connectionwith the generation, transmission and distribution of electricity and the storage and distribution of natural gas. The aggregate carrying value of theproperty subject to the lien was $4.7 billion and $4.4 billion at December 31, 2017 and 2016.
Includes KU's first mortgage bonds that are secured by the lien of the KU 2010 Mortgage Indenture which creates a lien, subject to certain exceptions and exclusions, on substantially all of KU's real and tangible personal property located in Kentucky and used or to be used in connection with the generation, transmission and distribution of electricity. The aggregate carrying value of the property subject to the lien was $6.0 billion and $5.8 billion atDecember 31, 2017 and 2016.
(b) Includes PPL Electric's series of senior secured bonds that secure its obligations to make payments with respect to each series of Pollution Control Bondsthat were issued by the LCIDA and the PEDFA on behalf of PPL Electric. These senior secured bonds were issued in the same principal amount, containpayment and redemption provisions that correspond to and bear the same interest rate as such Pollution Control Bonds. These senior secured bonds wereissued under PPL Electric's 2001 Mortgage Indenture and are secured as noted in (a) above. This amount includes $224 million of which PPL Electric isfallowed to convert the interest rate mode on the bonds from time to time to a commercial paper rate, daily rate, weekly rate, or term rate of at least oneyear and $90 million that may be redeemed, in whole or in part, at par beginning in October 2020, and are subject to mandatory redemption upondetermination that the interest rate on the bonds would be included in the holders' gross income for federal tax purposes.
(c) Includes LG&E's and KU's series of first mortgage bonds that were issued to the respective trustees of tax-exempt revenue bonds to secure its respectiveobligations to make payments with respect to each series of bonds. The first mortgage bonds were issued in the same principal amounts, contain payment and redemption provisions that correspond to and bear the same interest rate as such tax-exempt revenue bonds. These first mortgage bonds were issued under the LG&E 2010 Mortgage Indenture and the KU 2010 Mortgage Indenture and are secured as noted in (a) above. The related tax-exempt revenue bonds were issued by various governmental entities, principally counties in Kentucky, on behalf of LG&E and KU. The related revenue bond documents allow LG&E and KU to convert the interest rate mode on the bonds from time to time to a commercial paper rate, daily rate, weekly rate, term rate of at least one year or, in some cases, an auction rate or a LIBOR index rate.
At December 31, 2017, the aggregate tax-exempt revenue bonds issued on behalf of LG&E and KU that were in a term rate mode totaled $514 million for LKE, comprised of $391 million and $123 million for LG&E and KU. At December 31, 2017, the aggregate tax-exempt revenue bonds issued on behalf of LG&E and KU that were in a variable rate mode totaled $375 million for LKE, comprised of $147 million and $228 million for LG&E and KU. Thesevariable rate tax-exempt revenue bonds are subject to tender for purchase by LG&E and KU at the option of the holder and to mandatory tender for purchase by LG&E and KU upon the occurrence of certain events.
(d) Includes £225 million ($304 million at December 31, 2017) of notes that may be redeemed, in total but not in part, on December 21, 2026, at the greater of the principal value or a value determined by reference to the gross redemption yield on a nominated U.K. Government bond.
(e) The principal amount of the notes issued by WPD (South West), WPD (East Midlands) and WPD (South Wales) is adjusted based on changes in a specified index, as detailed in the terms of the related indentures. The adjustment to the principal amounts from 2016 to 2017 was an increase of approximately £27 million ($37 million) resulting from inflation. In addition, this amount includes £225 million ($304 million at December 31, 2017) of notes issued by WPD (South West) that may be redeemed, in total by series, on December 1, 2026, at the greater of the adjusted principal value and amake-whole value determined by reference to the gross real yield on a nominated U.K. government bond.
(f) Includes £4.7 billion ($6.4 billion at December 31, 2017) of notes that may be put by the holders to the issuer for redemption if the long-term credit ratings assigned to the notes are withdrawn by any of the rating agencies (Moody's or S&P) or reduced to a non-investment grade rating of Ba1 or BB+ or lower in connection with a restructuring event, which includes the loss of, or a material adverse change to, the distribution licenses under which the issuer operates.
(g) The table reflects principal maturities only, based on stated maturities or earlier put dates, and the weighted-average rates as of December 31, 2017.
None of the outstanding debt securities noted above have sinking fund requirements. The aggregate maturities of long-term debt, based on stated maturities or earlier put dates, for the periods 2018 through 2022 and thereafter are as follows:ff

119
PPLPPL
Electric LKE LG&E KU2018 $ 348 $ — $ 98 $ 98 $ —2019 430 — 430 334 962020 1,278 100 975 — 5002021 1,150 400 250 — —2022 1,274 474 — — —Thereafter 15,802 2,365 3,447 1,292 1,755Total $ 20,282 $ 3,339 $ 5,200 $ 1,724 $ 2,351
(PPL)
In March 2017, WPD (South Wales) issued £50 million of 0.01% Indd ex-linked Senior Notes due 2029. WPD (South Wales)received proceeds of £53 million, which equated to $64 million at the time of issuance, net of fees and including a premium. The principal amount of the notes is adjusted based on changes in a specified index, as detailed in the terms of the related indenture. The proceeds were used for general corporate purposes.
In September 2017, PPL Capital Funding issued $500 million of 4.00% Senior Notes due 2047. PPL Capital Funding received proceeds of $490 million, net of a discount and underwriting fees, which were used tot repay short-term debt obligations and forgeneral corporate purposes.
In November 2017, WPD (South West) issued £250 million of 2.375% Senior Notes due 2029. WPD (South West) received proceeds of £247 million, which equated to $326 million at the time of issuance, net of fees and a discount. The proceeds wereused for general corporate purposes, including the re-financing of existing debt.
In December 2017, WPD repaid the entire $100 million principal amount of its 7.25% Senior Notes upon maturity.
(PPL and PPL Electric)
In May 2017, PPL Electric issued $475 million of 3.95% First Mortgage Bonds due 2047. PPL Electric received proceeds of $466 million, net of a discount and underwriting fees, which were used to repay short-term debt incurred primarily for capitalexpenditures.
In August 2017, the LCIDA remarketed $108 million of Pollution Control Revenue Refunding Bonds (PPL Electric UtilitiesCorporation Project), Series 2016B due 2027 previously issued on behalf of PPL Electric. The bonds were remarketed at along-term rate and will bear interest at 1.80% through their mandatory purchase date of August 15, 2022.
In September 2017, the LCIDA remarketed $116 million of Pollution Control Revenue Refunding Bonds (PPL Electric UtilitiesCorporation Project), Series 2016A due 2029 previously issued on behalf of PPL Electric. The bonds were remarketed at a long-term rate and will bear interest at 1.80% through their mandatory purchase date of September 1, 2022.
(PPL, LKE and LG&E)
In April 2017, the Louisville/Jefferson County Metro Government of Kentucky remarketed $128 million of Pollution Control ttRevenue Bonds, 2003 Series A (Louisville Gas and Electric Company Project) due 2033 previously issued on behalf of LG&E.The bonds were remarketed at a long-term rate and will bear interest at 1.50% through their mandatory purchase date of April 1, 2019.
In June 2017, the County of Trimble, Kentucky issued $60 million of Environmental Facilities Revenue Refunding Bonds, 2017 Series A (Louisville Gas and Electric Company Project) due 2033 on behalf of LG&E. The bonds were issued bearing interest at a rate of 3.75% through their maturity and are subject to an optional redemption ont or after June 1, 2027. The proceeds of the bonds were used to redeem $60 million of Environmental Facilities Revenue Refunding Bonds, 2007 Series A (Louisville Gas and Electric Company Project) due 2033 previously issued by the County of Trimble, Kentucky on behalf of LG&E.
In June 2017, the Louisville/Jefferson County Metro Government of Kentucky remarketed $31 million of Environmental Facilities Revenue Refunding Bonds, 2007 Series A (Louisville Gas and Electric Company Project) due 2033 previously issued

120
on behalf of LG&E. The bonds were remarketed at a long-term rate and will bear interest at 1.25% through their mandatorypurchase date of June 3, 2019. f
In June 2017, the Louisville/Jefferson County Metro Government of Kentucky remarketed $35 million of Environmental Facilities Revenue Refunding Bonds, 2007 Series B (Louisville Gas and Electric Company Project) due 2033 previously issued on behalf of LG&E. The bonds were remarketed at a long-term rate and will bear interest at 1.25% through their mandatorypurchase date of June 3, 2019. f
In October 2017, LG&E entered into a $200 million term loan credit facility with a term expiring in October 2019. As of December 31, 2017, LG&E had outstanding borrowings of $100 million under this agreement at a rate of 2.06%. In January 2018, LG&E borrowed the remaining $100 million available under this facility.
In November 2017, LG&E redeemed, at par, its $10 million Louisville/Jefferson County Metro Government Environmental Facilities Revenue Bonds, 2001 Series A (Louisville Gas and Electric Company Project) due 2027.
Legal Separateness (All Registrants)
The subsidiaries of PPL are separate legal entities. PPL's subsidiaries are not liable for the debts of PPL. Accordingly, creditors of PPL may not satisfy their debts from the assets of PPL's subsidiaries absent a specific contractual undertaking by a subsidiary to pay PPL's creditors or as required by applicable law or regulation. Similarly, PPL is not liable for the debts of its fsubsidiaries, nor are its subsidiaries liable for the debts of one another. Accordingly, creditors of PPL's subsidiaries may not satisfy their debts from the assets of PPL or its other subsidiaries absent a specific contractuaaa l undertaking by PPL or its other ttsubsidiaries to pay the creditors or as required by applicable law or regulation.
Similarly, the subsidiaries of PPL Electric and LKE are each separate legal entities. These subsidiaries are not liable for thedebts of PPL Electric and LKE. Accordingly, creditors of PPL Electric and LKE may not satisfy their debts from the assets of their subsidiaries absent a specific contractual undertaking by a subsidiary to pay the creditors or as required by applicable law or regulation. Similarly, PPL Electric and LKE are not liable for the debts of their subsidiaries, nor are their subsidiaries liable for the debts of one another. Accordingly, creditors of these subsidiaries may not satisfy their debts from the assets of PPL uElectric and LKE (or their other subsidiaries) absent a specifict contractual undertaking by that parent or other subsidiary to paysuch creditors or as required by applicable law or regulation.
(PPL)
ATM Program
In February 2015, PPL entered into two separate equity distribution agreements, pursuant to which PPL may sell, from time toaatime, up to an aggregate of $500 million of its common stock. The compensation paid to the selling agents by PPL may be up to 1% of the gross offering proceeds of the shares sold with respect to each equity distribution agreement. PPL issued the following for the years ended December 31:
2017 2016 2015
NNumber of shares (in thousands) 10,373 710 1,477
Net Proceeds $ 377 $ 25 $ 49
Distributions and Related Restrictions
In November 2017, PPL declared its quarterly common stock dividend, payable January 2, 2018, at 39.5 cents per share (equivalent to $1.58 per annum). On February 22, 2018, PPL announced that the r company is increasing its common stock dividend to 41.0 cents per share on a quarterly basis (equivalent to $1.64 per anaa num). Future dividends, declared at thediscretion of the Board of Directors, will depend upon future earnings, cash flows, financial aaa nd legal requirements and other factors.
See Note 8 for information regarding the June 1, 2015 distribution to PPL's shareowners of a newly formed entity, Holdco, which at closing owned all of the membership interests of PPL Energy Supply and all of the common stock of Talen Energy.

121
Neither PPL Capital Funding nor PPL may declare or pay any cash dividend or distribution on its capital stock during anyperiod in which PPL Capital Funding defers interest payments on its 2007 Series A Junior Subordinated Notes due 2067 or 2013 Series B Junior Subordinated Notes due 2073. At December 31, 2017, no interest payments were deferred.
WPD subsidiaries have financing arrangements that limit their ability to pay dividends. However, PPL does not, at this time,expect that any of such limitations would significantly impact PPL's ability to meet its cash obligations.
(All Registrants)
PPL relies on dividends or loans from its subsidiaries to fund PPL's dividends to its common shareholders. The net assets of certain PPL subsidiaries are subject to legal restrictions. LKE primarily relies on dividends from its subsidiaries to fund itsdistributions to PPL. LG&E, KU and PPL Electric are subject to Section 305(a) of the Federal Power Act, which makes it unlawful for a public utility to make or pay a dividend from any funds "properly included in capital account." The meaning of this limitation has never been clarified under the Federal Power Act. LG&E, KU and PPL Electric believe, however, that this statutory restriction, as applied to their circumstances, would not be construed or applied by the FERC to prohibit the paymentfrom retained earnings of dividends that are not excessive and are for lawful and legitimate business purposes. In February2012, LG&E and KU petitioned the FERC requesting authorization to pay dividends in the future based on retained earnings balances calculated without giving effect to the impact of purchase accounting adjustments for the acquisition of LKE by PPL.In May 2012, the FERC approved the petitions with the further condition that each utility may not pay dividends if such payment would cause its adjusted equity ratio to fall below 30% of total capitalization. Accordingly, at December 31, 2017, netassets of $2.7 billion ($1.1 billion for LG&E and $1.6 billion for KU) were restricted for purposes of paying dividends to LKE,dand net assets of $3.1 billion ($1.4 billion for LG&E and $1.7 billion for KU) were available for payment of dividends to LKE.LG&E and KU believe they will not be required to change their current dividend practices as a result of the foregoingrequirement. In addition, under Virginia law, KU is prohibited from making loans to affiliates without the prior approval of the VSCC. There are no comparable statutes under Kentucky law applicable to LG&E and KU, or under Pennsylvania lawaaapplicable to PPL Electric. However, orders from the KPSC require LG&E and KU to obtain prior consent or approval before lending amounts to PPL.
8. Acquisitions, Development and Divestitures
(All Registrants)
The Registrants from time to time evaluate opportunities for potential acquisitions, divestitures and development projects.Development projects are reexamined based on market conditions and other factors to determine whether to proceed with, modify or terminate the projects. Any resulting transactions may impact future financial results.
(PPL)
Discontinued Operations
Spinoff of PPL Energy Supplyp gy pp y
In June 2014, PPL and PPL Energy Supply executed definitive agreements with affiliates of Riverstone to spin off PPL Energy Supply and immediately combine it with Riverstone's competitive power generation businesses to form a new, stand-alone,publicly traded company named Talen Energy. The transaction was subject to customary closing conditions, including receipt of regulatory approvals from the NRC, FERC, DOJ and PUC, all of which were received by mid-April 2015. On April 29,2015, PPL's Board of Directors declared the June 1, 2015 distribution to PPL's shareowners of record on May 20, 2015 of anewly formed entity, Holdco, which at closing owned all of the membership interests of PPL Energy Supply and all of the common stock of Talen Energy.
Immediately following the spinoff on June 1, 2015, Holdco merged with a special purpose subsidiary of Talen Energy, withHoldco continuing as the surviving company to the merger and as a wholly owned subsidiary of Talen Energy and the soleowner of PPL Energy Supply. Substantially contemporaneous with the spinoff and mey rger, RJS Power was contributed by itsowners to become a subsidiary of Talen Energy. PPL shareowners received approximately 0.1249 shares of Talen Energycommon stock for each share of PPL common stock they owned on May 20, 2015. Following completion of these transactions,PPL shareowners owned 65% of Talen Energy and affiliates of Riverstone owned 35%. The spf inoff had no effect on thenumber of PPL common shares owned by PPL shareowners or the number of shares of PPL common stock outstanding. Thetransaction is intended to be tax-free to PPL and its shareowners for U.S. federal income tax purposes.

122
PPL has no continuing ownership interest in or control of Talen Energy and Talen Energy Supply (formerly PPL Energy fSupply).
Loss on Spinoff
In June 2015, in conjunction with the accounting for the spinoff, PPL evaluated whether the fair value of the Supply segment'snet assets was less than the carrying value as of the June 1, 2015 spinoff date.
PPL considered several valuation methodologies to derive a fair value estimate of its Supply segment at the spinoff date. Thesemethodologies included considering the closing "when-issued" Talen Energy market value on June 1, 2015 (the spinoff date),adjusted for the proportional share of the equity value attributable to the Supply segment, as well as, the valuation methods consistently used in PPL's quantitative goodwill impairment assessments - an income approach using a discounted cash flowanalysis of the Supply segment and an alternative market approach considering marr rket multiples of comparable companies.
Although the Talen Energy market value approach utilized the most observable inputs of the threet approaches, PPL considered certain limitations of the "when-issued" trading market for the spinoff transaction including the shff ort trading duration, lack of liquidity in the market and anticipated initial Talen Energy stock ownership base selling pressure, among other factors, and concluded that these factors limited this input being solely determinative of the fair value of the Supply segment. As such, PPL also considered the other valuation approaches in estimating the overall fair value, but ultimately assigned the highest weighting to the Talen Energy market value approach.
The following table summarizes PPL's fair value analysis:
Approach Weighting
Weighted Fair Value (in billions)
Talen Energy Market Value 50% $ 1.4Income/Discounted Cash Flow 30% 1.1Alternative Market (Comparable Company) 20% 0.7Estimated Fair Value $ 3.2
A key assumption included in the fair value estimate is the application of a control premium of 25% in the two market approaches. PPL concluded it was appropriate to apply a control premium in these approaches as the goodwill impairment testing guidance was followed in determining the estimated fair value of the Supply segment, which had historically been a reporting unit for PPL. This guidance provides that the market price of an individual security (and thus the market capitalization of a reporting unit with publicly traded equity securities) may not be representative of the fair value of thereporting unit. This guidance also indicates that substantial value may arise to a controlling shareholder from the ability to takeadvantage of synergies and other benefits that arise from control over another entity, and that the market price of a company'sindividual share of stock does not reflect this additional value to a controlling shareholder. Therefore, the quoted market price need not be the sole measurement basis for determining the fair value, and including a control premium is appropriate inrmeasuring the fair value of a reporting unit.
In determining the control premium, PPL reviewed premiums received during the prior five years in market sales transactions obtained from observable independent power producer and hybrid utility transactionsr greater than $1 billion. Premiums for these transactions ranged from 5% to 42% with a median of approximately 25%. Given these metrics, PPL concluded a controlpremium of 25% to be reasonable for both of the market valuation approaches used.
Assumptions used in the discounted cash flow analysis included forward energy prices, forecasted generation, and forecasted operation and maintenance expenditures that were consistent with assumptions used in the Energy Supply portion of the TalenEnergy business planning process at that time and a market participant discount rate.
Using these methodologies and weightings, PPL determined the estimated fair value of the Supply segment (classified as Level 3) was below its carrying value of $4.1 billion and recorded a loss on the spinoff of $879 million in the second quarter of 2015, which is reflected in discontinued operations and is nondeductible for tax purposes. This amount served to reduce the basis of the net assets accounted for as a dividend at the June 1, 2015 spinoff date.
Costs of Spinoff
Following the announcement of the transaction to form Talen Energy, efforts were initiated to identify the appropriate staffingfor Talen Energy and for PPL and its subsidiaries following completion of the spinoff. Organizational plans were substantially

123
completed and estimated charges for employee separation benefits were recorded in 2014. In 2015, the organizational structures were finalized for both PPL and Talen Energy, which resulted in an additional charge of $10n million for employee separation benefits. Of this amount, $2 million related to Energy Supply positions and is reflected in discontinued operations. The remaining $8 million is reflected in "Other operation and maintenance" on the 2015 PPL Conn solidated Statement of Income. The separation benefits include cash severance compensation, lump sum COBRA reimbursement payments and outplacement services.
Additional employee-related costs incurred primarily included accelerated stock-based compensation and prorated performance-based cash incentive and stock-based compensation awards, primarily for PPL Energy Supply employees and for PPL Services employees who became PPL Energy Supply employees in connection with the transaction. PPL Energy Supplyrecognized $24 million of these costs at the spinoff closing date in 2015, which are reflected in discontinued operations.
PPL recorded $45 million of third-party costs related to this transaction in 2015. Of these costs, $32 million were primarily for ffbank advisory, legal and accounting fees to facilitate the transaction, and are reflected in discontinued operations. An additional $13 million of consulting and other costs were incurred in 2015, related to the formation of the Tad len Energy organization and to reconfigure the remaining PPL service functions. These costs are recorded primarily in "Other operation and maintenance"on the 2015 Statement of Income.
At the close of the transaction in 2015, $72 million ($42 million after-tax) of cash flow hedges, primarily unamortized losses on PPL interest rate swaps recorded in AOCI and designated as cash flow hedges of PPL Energy Supply's future interest payments,were reclassified into earnings and reflected in discontinued operations. Continuing Involvement (PPL and PPL Electric)
As a result of the spinoff, PPL and PPL Energy Supply entered into a Transition Services Agreement (TSA) that terminated onMay 31, 2017. The TSA set forth the terms and conditions for PPL and Talen Energy to provide certain transition services toone another. PPL provided Talen Energy certain information technoly ogy, financial and accounting, human resource and other specified services. PPL billed Talen Energy $1 million, $35 million and $25 million for these services in 2017, 2016 and 2015. In general, the fees for the transition services allow the provider to recover its cost of the services, including overheads, but without margin or profit.
Additionally, prior to the spinoff, through the annual competitive solicitation process, PPL EnergyPlus was awarded supply contracts for a portion of the PLR generation supply for PPL Electric, which were retained by Talen Energy Marketing as part of the spinoff transaction. PPL Electric's supply contracts with Talen Energy Marketing extended through November 2016.Energy purchases from PPL EnergyPlus were previously included in PPL Electric's Statements of Income as "Energy purchases from affiliate" but were eliminated in PPL's Consolidated Statements of Income.
Subsequent to the spinoff, PPL Electric's energy purchases from Talen Energy Marketing were $106 million and $27 million for y2016 and 2015. There were no energy purchases from Talen Energy Marketing in 2017. These energy purchases are no longer considered affiliate transactions.
(PPL)
Summarized Results of Discontinued Operations
The operations of the Supply segment are included in "Loss from Discontinued Operations (net of income taxes)" on theStatement of Income. Following are the components of Discontinued Operations in the Statement of Income for the period ended December 31:
2015 Operating revenues $ 1,427Operating expenses 1,328Other Income (Expense) - net (21) Interest expense (a) 150Income tax expense (benefit) (30) Loss on spinoff (879) Loss from Discontinued Operations (net of income taxes) $ (921)
(a) Includes interest associated with the Supply segment with no additional allocation as the Supply segment was sufficiently capitalized.

124
Net assets, after recognition of the loss on the spinoff, of $3.2 billion were distributed to PPL shareowners in the June 1, 2015,spinoff of PPL Energy Supply.
Development
Regional Transmission Line Expansion Plan (PPL and PPL Electric)g p
Northeast/Pocono
In October 2012, the FERC issued an order in response to PPL Electric's December 2011 request for ratemaking incentives for the Northeast/Pocono Reliability project (a new 58-mile, 230 kV transmission line that includes three new substations and upgrades to adjacent facilities). The FERC granted the incentive for inclusion in rate base of all prudently incurred construction work in progress costs but denied the requested incentive for a 100 basis point adder to the return on equity.
In December 2012, PPL Electric submitted an application to the PUC requesting permission to site and construct the project. In January 2014, the PUC issued a final order approving the application. The line was energized in April 2016, completing theapproximately $350 million project, which includes additional substation security enhancements. Costs related to the project are included on the Balance Sheets, primarily in "Regulated utility plant."
Capacity Needs (PPL, LKE, LG&E and KU)p y
As a result of environmental requirements and energy efficiency measures, KU anticipates retiring two older coal-fired electricity generating units at the E.W. Brown plant in 2019 with a combined summer rating capacity of 272 MW.
The Cane Run Unit 7 NGCC was put into commercial operation in June 2015. As a result and to meet more stringent EPA regulations, LG&E retired one coal-fired generating unit at the Cane Run plant in March 2015 and retired the remaining twocoal-fired generating units at the plant in June 2015. KU retired the two remaining coal-fired generating units at the GreennRiver plant in September 2015. LG&E and KU incurred costs of $11 million and $6 million directly related to these retirementsincluding inventory write-downs and separation benefits. There were no gains or losses on the retirement of these units.
In December 2014, a final order was issued by the KPSC approving the request to construct a solar generation facility at the E.W. Brown facility. LG&E and KU completed construction activities and placed a 10 MW facility into commercial operation in June 2016 at a cost of $25 million.
9. Leases
(PPL, LKE, LG&E and KU)
PPL and its subsidiaries have entered into various agreements for the lease of office space, vehicles, land, gas storage and other ttequipment.
Rent - Operating Leases p g
Rent expense for the years ended December 31 for operating leases was as follows:
2017 2016 2015 PPL $ 45 $ 50 $ 49LKE 26 26 24LG&E 15 15 12KU 11 11 11
Total future minimum rental payments for all operating leases are estimated to be:

125
PPL LKE LG&E KU2018 $ 32 $ 26 $ 15 $ 102019 19 16 8 82020 13 11 5 62021 10 8 3 52022 8 6 2 4Thereafter 22 15 6 8Total $ 104 $ 82 $ 39 $ 41
10. Stock-Based Compensation
(PPL, PPL Electric and LKE)
Under the ICP, SIP and the ICPKE (together, the Plans), restricted shares of PPL common stock, restricted stock units, performance units and stock options may be granted to officers and other key employees of PPL, PPL Electric, LKE and other affiliated companies. Awards under the Plans are made by the Compensation, Governance and Nominating Committee (CGNC)of the PPL Board of Directors, in the case of the ICP and SIP, and by the PPL Corporate Leadership Council (CLC), in the caseof the ICPKE.
The following table details the award limits under each of the Plans.
Total Plan
Annual Grant LimitTotal As % of Outstanding Annual Grant
Annual Grant Limit For Individual Participants -Performance Based Awards
AwardLimit
PPL Common Stock On First Day of
Limit Options
For awards denominated in
For awardsdenominated in
Plan (Shares) Each Calendar Year (Shares) shares (Shares) cash (in dollars)SIP 15,000,000 2,000,000 750,000 $ 15,000,000ICPKE 14,199,796 2% 3,000,000
Any portion of these awards that has not been granted may be carried over and used in any subsequent year. If any award dlapses, is forfeited or the rights of the participant terminate, the shares of PPL common stock underlying such an award are again available for grant. Shares delivered under the Plans may be in the form of authorized and unissued PPL common stock, common stock held in treasury by PPL or PPL common stock purchased on the open market (including private purchases) in accordance with applicable securities laws.
Restricted Stock Units
Restricted stock units are awards based on the fair value of PPL common stock on the date of grant. Actual PPL common sharesLwill be issued upon completion of a restriction period, generally three years.
Under the SIP, each restricted stock unit entitles the executive to accrue additional restricted stock units equal to the amount of quarterly dividends paid on PPL stock. These additional restricted stock units are deferred and payable in shares of PPL common stock at the end of the restriction period. Dividend equivalents on restricted stock unit awards granted under theICPKE are currently paid in cash when dividends are declared by PPL.
The fair value of restricted stock units granted is recognized on a straight-line basis over the service period or through the dateat which the employee reaches retirement eligibility. The fair value of restricted stock units granted to retirement-eligible employees is recognized as compensation expense immediately upon the date of grant. Recipients of restricted stock units granted under the ICPKE may also be granted the right to receive dividend equivalents through the end of the restriction periodor until the award is forfeited. Restricted stock units are subject to forfeiture or accelerated payout under the plan provisions for termination, retirement, disability and death of employees. Restrictions lapse on ret stricted stock units fully, in certain situations, as defined by each of the Plans.
The weighted-average grant date fair value of restricted stock units granted was:
2017 2016 2015 PPL $ 35.30 $ 33.84 $ 34.50PPL Electric 35.45 34.32 34.41LKE 35.25 33.73 34.89

126
Restricted stock unit activity for 2017 was:
RestrictedShares/Units
Weighted- Average
Grant DateFair
Value PerShare
PPL NNonvested, beginning of period 1,337,025 $ 31.57Granted 538,441 35.30Vested (567,001) 29.28Forfeited (16,816) 34.28NNonvested, end of period (a) 1,291,649 34.10
PPL Electric Nonvested, beginning of period 204,570 $ 31.27Transfer between registrants (5,250) 32.05Granted 79,321 35.45Vested (91,117) 28.83Forfeited (3,108) 34.68NNonvested, end of period 184,416 34.20
LKE Nonvested, beginning of period 243,281 $ 31.53Transfer between registrants 25,337 31.61Granted 97,775 35.25Vested (125,612) 29.68Forfeited (9,224) 34.04NNonvested, end of period 231,557 34.01
(a) Excludes 252,850 restricted stock units for which restrictions lapsed for former PPL Energy Supply employees as a result of the spinoff, but for which distribution will not occur until the end of the original restriction period of the awards.
Substantially all restricted stock unit awards are expected to vest.
The total fair value of restricted stock units vesting for the years ended December 31 was:
2017 2016 2015 PPL $ 20 $ 30 $ 28PPL Electric 3 3 4LKE 4 5 4
Performance Units - Total Shareowner Return
Performance units based on Total Shareowner Return (TSR) are intended to encourage and reward future corporate performance. Performance units represent a target number of shares (Target Award) of PPL's common stock that the recipient would receive upon PPL's attainment of the applicable performance goal. Performance is determined based on TSR during a three-year performance period. At the end of the period, payout is determined by comparing PPL's performance to the TSR of tthe companies included in the Philadelphia Stock Exchange Utility Index. Awards are payable on a graduated basis based onthresholds that measure PPL's performance relative to peers that comprise the applicable index on which each years' awards are measured. Awards can be paid up to 200% of the Target Award or forfeited with no payout if per rformance is below a minimum established performance threshold. Dividends payable during the performance cycle accumulate and are converted intoadditional performance units and are payable in shares of PPL common stock upon completion of the performance period basedon the determination of the CGNC of whether the performance goals have been achieved. Under the plan provisions, TSR performance units are subject to forfeiture upon termination of employment except for retirement, one year or more from commencement of the performance period, disability or death of an employee.
The fair value of TSR performance units granted to retirement-eligible employees is recognized as compensation expense on astraight-line basis over a one-year period, the minimum vesting period required for an employee to be entitled to payout of the

127
awards with no proration. For employees who are not retirement-eligible, compensation expense is recognized over the shorter of the three-year performance period or the period until the employee is retirement-eligible, with a minimum vesting and recognition period of one-year. If an employee retires before the one-year vesting period, the performance units are forfeited.Performance units vest on a pro rata basis, in certain situations, as defined by each of the Plans.
The fair value of each performance unit granted was estimated using a Monte Carlo pricing model that considers stock beta, a risk-free interest rate, expected stock volatility and expected life. The stock beta was calculated comparing the risk of the individual securities to the average risk of the companies in the index group. The risk-free interest rate reflects the yield on a U.S. Treasury bond commensurate with the expected life of the performance unit. Volatility over the expected term of the performance unit is calculated using daily stock price observations for PPL and ally companies in the index group and is evaluated with consideration given to prior periods that may need to be excluded based on eventsd not likely to recur that had impacted PPL and the companies in the index group. PPL uses a mix of historic and implied volatility to value awards.
The weighted-average assumptions used in the model were:
2017 2016 2015 Expected stock volatility 17.40% 19.60% 15.90%Expected life 3 years 3 years 3 years
The weighted-average grant date fair value of TSR performance units granted was:
2017 2016 2015 PPL $ 38.38 $ 35.74 $ 36.76PPL Electric 38.37 35.68 37.93LKE 38.24 35.28 37.10
TSR performance unit activity for 2017 was:
TSR Performance
Units
Weighted- AverageGrant
Date FairValue
Per Share PPL NNonvested, beginning of period 1,070,536 $ 34.65
Granted 293,642 38.38Vested (243,983) 32.42Forfeited (141,964) 32.27
NNonvested, end of period (a) 978,231 36.67
PPL ElectricNonvested, beginning of period 76,726 $ 34.68
Granted 26,086 38.37Vested (14,713) 32.14Forfeited (12,586) 35.45
Nonvested, end of period 75,513 37.00
LKE NNonvested, beginning of period 191,601 $ 34.34
Transfer between registrants 8,307 35.96Granted 64,555 38.24Vested (48,980) 32.09Forfeited (35,194) 35.25
Nonvested, end of period 180,289 36.69
(a) Excludes 41,405 TSR awards for which the service vesting requirement was waived for former PPL Energy Supply employees as a result of the spinoff, but for which the ultimate number of shares to be distributed will depend on the actual attainment of the performance goals at the end of the specified performance periods.

128
The total fair value of TSR performance units vesting for the year ended December 31, 2017, 2016 and 2015 was $8 million, $12 million and $6 million for PPL and insignificant for PPL Electric and LKE.
Performance Units - Return on Equity
Beginning in 2017, PPL changed its executive compensation mix to add performance units based on achievement of a corporateReturn on Equity (ROE). ROE performance units are intended to further align compensation with the company’s strategy and hreward for future corporate performance.
Payout of these performance units will be based on the calculated average of the annual corporate ROE for each year of the three-year performance period for PPL Corporation. ROE performance units represent a target number of shares (Target Award) of PPL'scommon stock that the recipient would receive upon PPL's attainment of the applicable ROE performance goal. ROE performanceunits can be paid up to 200% of the Target Award or forfeited with no payout if performance is below a minimum established performance threshold. Dividends payable during the performance cycle accumulate and are converted into additional performancedunits and are payable in shares of PPL common stock upon completion of the performance period based on the determination of theCGNC of whether the performance goals have been achieved. Under the plan provisions, these performance units are subject toforfeiture upon termination of employment except for retirement, disability or death of an employee.
The fair value of each ROE performance unit is based on the closing price of PPL Common Stock on the date of grant. The fair value of ROE performance units is recognized on a straight-line basis over the service d period or through the date at which theemployee reaches retirement eligibility. The fair value awards granted to retirement-eligible employees is recognized as compensation expense immediately upon the date of grant. As these awards are based on performance conditions, the level of attainment is monitored each reporting period and compensation expense is adjusted based on the expected attainment level.
ROE performance unit activity for 2017 was:
ROEPerformance
Unit
Weighted- AverageGrant
Date FairValue
Per Share PPL
Granted 97,925 $ 34.42Forfeited (997) 34.41
NNonvested, end of period 96,928 34.42
PPL Electric
Granted 8,696 $ 34.41NNonvested, end of period 8,696 34.41
LKE
Granted 21,536 $ 34.29Forfeited (997) 34.41
Nonvested, end of period 20,539 34.29
Stock Options
PPL's CGNC eliminated the use of stock options due to changes in its long-term incentive mix beginning in January 2014.
Under the Plans, stock options had been granted with an option exercise price per sharaa e not less than the fair value of PPL's common stock on the date of grant. Options outstanding at December 31, 2017, are fully vested. All options expire no later than10 years from the grant date. The options become exercisable immediately in certain situations, as defined by each of the Plans.
Stock option activity for 2017 was:

129
Number of Options
Weighted AverageExercisePrice Per
Share
Weighted-Average
Remaining ContractualTerm (years)
AggregateTotal Intrinsic
ValuePPL Outstanding at beginning of period 4,481,160 $ 28.98
Exercised (718,977) 26.67 Outstanding and exercisable at end of period 3,762,183 29.42 3.5 $ 14
PPL ElectricOutstanding at beginning of period 240,939 $ 27.48
Exercised (42,659) 26.99 Outstanding and exercisable at end of period 198,280 27.58 3.8 $ 1
LKE Outstanding at beginning of period 61,896 $ 25.81
Exercised (28,164) 26.59 Outstanding and exercisable at end of period 33,732 25.15 4.1 $ —
For 2017, 2016 and 2015, PPL received $19 million, $52 million and $97 million in cash from stock options exercised. Therelated income tax benefits realized were not significant.
The total intrinsic value of stock options exercised for 2017, 2016 and 2015 were $8 million, $18 million and $21 million.
Compensation Expense
Compensation expense for restricted stock, restricted stock units, performance units and stock options accounted for as equity awards, which for PPL Electric and LKE includes an allocation of PPL Services' expense, was:
2017 2016 2015 PPL $ 32 $ 27 $ 33PPL Electric 18 16 14LKE 8 7 8
See Note 8 for details of the costs recognized in discontinued operations related to thd e accelerated vesting of awards for former PPL Energy Supply employees.
The income tax benefit related to above compensation expense was as follows:
2017 2016 2015 PPL $ 13 $ 12 $ 14PPL Electric 8 7 6LKE 3 3 3
At December 31, 2017, unrecognized compensation expense related to nonvested stock awards was:
Unrecognized Compensation
Expense
Weighted- Average
Period forRecognition
PPL $ 10 1.7PPL Electric 2 1.7 LKE 1 1.6

130
11. Retirement and Postemployment Benefits
(All Registrants)
Defined Benefits
The majority of the employees of PPL's domestic subsidiaries are eligible for pension benefits under non-contributory defined ubenefit pension plans with benefits based on length of service and final average pay, as defined by the plans. Effective January rr1, 2012, PPL's primary defined benefit pension plan was closed to all newly hired salaried employees. Effective July 1, 2014,PPL's primary defined benefit pension plan was closed to all newly hired bargainin ng unit employees. Newly hired employeesare eligible to participate in the PPL Retirement Savings Plan, a 401(k) savings plan with enhanced employer contributions.
The defined benefit pension plans of LKE and its subsidiaries were closed to new salaried and bargaining unit employees hired after December 31, 2005. Employees hired after December 31, 2005 receive additional company contributions above the standard matching contributions to their savings plans.
Effective April 1, 2010, the principal defined benefit pension plan applicable to WPD (South West) and WPD (South Wales) was closed to most new employees, except for those meeting specific grandfathered participation rights. WPD Midlands' defined benefit plan had been closed to new members, except for those meeting specific grandfathered participation rights,prior to acquisition. New employees not eligible to participate in the plans are offered benefits under a defined contribution plan.
PPL and certain of its subsidiaries also provide supplemental retirement benefits to executives and other key management employees through unfunded nonqualified retirement plans.
The majority of employees of PPL's domestic subsidiaries are eligible for certain health care and life insurance benefits uponretirement through contributory plans. Effective January 1, 2014, the PPL Postretirement Medical Plan was closed to all newlyhired salaried employees. Effective July 1, 2014, the PPL Postretirement Medical Plan was closed to all newly hired bargainingunit employees. Postretirement health benefits may be paid from 401(h) accounts established as part of the PPL Retirement Plan and the LG&E and KU Retirement Plan within the PPL Services Corporation Master Trust, funded VEBA trusts and company funds. WPD does not sponsor any postretirement benefit plans other than pensions.
(PPL)
The following table provides the components of net periodic defined benefit costs for PPL's domestic (U.S.) and WPD's (U.K.)pension and other postretirement benefit plans for the years ended December 31.
Pension Benefits U.S. U.K. Other Postretirement Benefits
2017 2016 2015 2017 2016 2015 2017 2016 2015 Net periodic defined benefit costs (credits): Service cost $ 65 $ 66 $ 96 $ 76 $ 69 $ 79 $ 7 $ 7 $ 11Interest cost 168 174 194 178 235 314 23 26 26Expected return on plan assets (231) (228) (258) (514) (504) (523) (22) (22) (26) Amortization of:
Prior service cost (credit) 10 8 7 — — — (1) — 1Actuarial (gain) loss 69 50 84 144 138 158 1 1 —
NNet periodic defined benefit costs (credits) prior to settlements and termination benefits 81 70 123 (116) (62) 28 8 12 12Settlements 1 3 — — — — — — —Termination benefits 1 — — — — — — — ——Net periodic defined benefit costs (credits) $ 83 $ 73 $ 123 $ (116) $ (62) $ 28 $ 8 $ 12 $ 12
Other Changes in Plan Assets andBenefit Obligations Recognized in OCIand Regulatory Assets/Liabilities -Gross: Divestiture (a) $ — $ — $ (353) $ — $ — $ — $ — $ — $ (6)

131
Pension Benefits U.S. U.K. Other Postretirement Benefits
2017 2016 2015 2017 2016 2015 2017 2016 2015 Settlement (1) (3) — — — — — — —NNet (gain) loss 27 253 63 346 7 508 (28) 9 (9) Prior service cost(credit) (1) 15 18 — — — 8 — —Amortization of:
Prior service (cost) credit (10) (8) (7) — — — 1 (1) (1) Actuarial gain (loss) (69) (50) (85) (144) (138) (158) (1) (1) ——
Total recognized in OCI and regulatory assets/liabilities (b) (54) 207 (364) 202 (131) 350 (20) 7 (16)
Total recognized in net periodic defined benefit costs, OCI and regulatoryassets/liabilities (b) $ 29 $ 280 $ (241) $ 86 $ (193) $ 378 $ (12) $ 19 $ (4)
(a) As a result of the spinoff of PPL Energy Supply, amounts in AOCI were allocated to certain former active and inactive employees of PPL Energy Supplyand included in the distribution. See Note 8 for additional details.
(b) WPD is not subject to accounting for the effects of certain types of regulation as prescribed by GAAP. As a result, WPD does not record regulatory assets/liabilities.
For PPL's U.S. pension benefits and for other postretirement benefits, the amounts recognized in OCI and regulatoryassets/liabilities for the years ended December 31 were as follows:
U.S. Pension Benefits Other Postretirement Benefits2017 2016 2015 2017 2016 2015
OCI $ (53) $ 236 $ (269) $ (25) $ 7 $ 12Regulatory assets/liabilities (1 ) (29) (95) 5 — (28)Total recognized in OCI and regulatory assets/liabilities $ (54) $ 207 $ (364) $ (20) $ 7 $ (16)
The estimated amounts to be amortized from AOCI and regulatory assets/liabilities into net periodic defined benefit costs in 2018 are as follows:
Pension Benefits U.S. U.K.
Prior service cost (credit) $ 10 $ —Actuarial (gain) loss 86 152Total $ 96 $ 152
Amortization from Balance Sheet: AOCI $ 28 $ 152Regulatory assets/liabilities 68 —Total $ 96 $ 152

132
(LKE)
The following table provides the components of net periodic defined benefit costs for LKE's pension and other postretirement benefit plans for the years ended December 31.
Pension Benefits Other Postretirement Benefits2017 2016 2015 2017 2016 2015
Net periodic defined benefit costs (credits): Service cost $ 24 $ 23 $ 26 $ 4 $ 5 $ 5Interest cost 68 71 68 9 9 9Expected return on plan assets (92) (91) (88) (7) (6) (6) Amortization of:
Prior service cost 8 8 7 1 3 3Actuarial (gain) loss (a) 31 21 37 — (1) —
NNet periodic defined benefit costs (b) $ 39 $ 32 $ 50 $ 7 $ 10 $ 11
Other Changes in Plan Assets and Benefit Obligations Recognized in OCI and Regulatory Assets/Liabilities - Gross:Net (gain) loss $ 30 $ 119 $ 20 $ (14 ) $ 6 $ (15)Prior service cost 7 — 19 8 — —Amortization of:
Prior service credit (8) (8) (7) (1) (3) (3) Actuarial gain (loss) (32 ) (21) (37) — 1 —
Total recognized in OCI and regulatory assets/liabilities (3) 90 (5) (7) 4 (18)
Total recognized in net periodic defined benefit costs, OCI and regulatory assets/liabilities $ 36 $ 122 $ 45 $ — $ 14 $ (7)
(a) As a result of the 2014 Kentucky rate case settlement that became effective July 1, 2015, the difference between actuarial (gain)/loss calculated inaccordance with LKE's pension accounting policy and actuarial (gain)/loss calculated using a 15 year amortization period was $11 million in 2017, $6 million in 2016 and $9 million in 2015.
(b) Due to the amount of lump sum payment distributions from the LG&E qualified pension plan, a settlement charge of $5 million was incurred. In accordance with existing regulatory accounting treatment, LG&E has maintained the settlement charge in regulatory assets. The amount will be amortized in accordance with existing regulatory practice.
For LKE's pension and other postretirement benefits, the amounts recognized in OCI and regulatory assets/liabilities for theyears ended December 31 were as follows:
Pension Benefits Other Postretirement Benefits2017 2016 2015 2017 2016 2015
OCI $ 33 $ 42 $ 4 $ (2) $ 2 $ (2) Regulatory assets/liabilities (36 ) 48 (9) (5 ) 2 (16)Total recognized in OCI and regulatory assets/liabilities $ (3) $ 90 $ (5) $ (7) $ 4 $ (18)
The estimated amounts to be amortized from AOCI and regulatory assets/liabilities into net periodic defined benefit costs for LKE in 2018 are as follows.
PensionBenefits
OtherPostretirement
BenefitsPrior service cost $ 9 $ 1Actuarial Loss 39 —Total $ 48 $ 1
Amortization from Balance Sheet: AOCI $ 11 $ —Regulatory assets/liabilities 37 1Total $ 48 $ 1

133
(LG&E)
The following table provides the components of net periodic defined benefit costs for LG&E's pension benefit plan for the years ended December 31.
Pension Benefits 2017 2016 2015
Net periodic defined benefit costs (credits): Service cost $ 1 $ 1 $ 1Interest cost 13 15 14Expected return on plan assets (22) (21) (20) Amortization of:
Prior service cost 5 4 3Actuarial loss (a) 9 7 11
NNet periodic defined benefit costs (b) $ 6 $ 6 $ 9
Other Changes in Plan Assets and Benefit ObligationsRecognized in Regulatory Assets - Gross: Net (gain) loss $ (9 ) $ 22 $ 8Prior service cost 7 — 10Amortization of:
Prior service credit (5) (4) (3) Actuarial gain (9 ) (7) (11)
Total recognized in regulatory assets/liabilities (16) 11 4
Total recognized in net periodic defined benefit costs and regulatory assets $ (10) $ 17 $ 13
(a) As a result of the 2014 Kentucky rate case settlement that became effective July 1, 2015, the difference between actuarial (gain)/loss calculated inaccordance with LG&E's pension accounting policy and actuarial (gain)/loss calculated using a 15 year amortization period was $7 million in 2017, $5 million in 2016 and $3 million in 2015.
(b) Due to the amount of lump sum payment distributions from the LG&E qualified pension plan, a settlement charge of $5 million was incurred. In accordance with existing regulatory accounting treatment, LG&E has maintained the settlement charge in regulatory assets. The amount will be amortized in accordance with existing regulatory practice.
The estimated amounts to be amortized from regulatory assets into net periodic defined benefit costs for LG&E in 2018 are as follows.
PensionBenefits
Prior service cost $ 5Actuarial loss 9Total $ 14
(All Registrants)
The following net periodic defined benefit costs (credits) were charged to operating expense or regulatory assets, excluding ramounts charged to construction and other non-expense accounts. The U.K. pension benefits apply to PPL only. uu
Pension Benefits U.S. U.K. Other Postretirement Benefits
2017 2016 2015 2017 2016 2015 2017 2016 2015 PPL $ 59 $ 53 $ 71 $ (151) $ (95) $ (21) $ 5 $ 7 $ 8PPL Electric (a) 12 10 15 — 1 —LKE (b) 28 24 37 6 8LG&E (b) 8 8 12 3 3 4KU (a) (b) 4 5 9 2 2
(a) PPL Electric and KU do not directly sponsor any defined benefit plans. PPL Electric and KU were allocated these costs of defined benefit planssponsored by PPL Services (for PPL Electric) and by LKE (for KU), based on their participation in those plans, which management believes aret

134
reasonable. KU is also allocated costs of defined benefit plans from LKS for defined benefit plans sponsored by LKE. See Note 1m 4 for additional information on costs allocated to KU from LKS.
(b) As a result of the 2014 Kentucky rate case settlement that became effective July 1, 2015, the difference between net periodic defined benefit costs calculated in accordance with LKE's, LG&E's and KU's pension accounting policy and the net periodic defined benefit costs calculated using a 15 year amortization period for gains and losses is recorded as a regulatory asset. Of the costs charged to operating expense or regulatory assets, excluding amounts charged to construction and other non-expense accounts, $4 million for LG&E and $2 million for KU were recorded as regulatory assets in2017, $3 million for LG&E and $2 million for KU were recorded as regulatory assets in 2016 and $4 million for LG&E and $1 million for KU wererecorded as regulatory assets in 2015.
In the table above, LG&E amounts include costs for the specific plans it sponsors and the following allocated costs of defined benefit plans sponsored by LKE. LG&E is also allocated costs of defined benefit plans from LKS for defined benefit plans sponsored by LKE. See Note 14 for additional information on costs allocated to LG&E from LKS. These allocations are based on LG&E's participation in those plans, which management believes are reasonable:
Pension Benefits Other Postretirement Benefits2017 2016 2015 2017 2016 2015
LG&E Non-Union Only $ 5 $ 4 $ 5 $ 3 $ 3 $ 4
(PPL, LKE and LG&E)
PPL, LKE and LG&E adopted the new mortality tables issued by the Society of Actuaries in October 2014 (RP-2014 base tables with collar and factor adjustments, where applicable) for all U.S. defined benefit pension and other postretirement benefit plans. In addition, in 2014, PPL, LKE and LG&E updated the basis for estimating projected mortality improvements and selected the IRS BB-2D two-dimensional improvement scale on a generational basis for all U.S. defined benefit pensionand other postretirement benefit plans. In 2017, PPL, LKE and LG&E updated to the MP-2017 mortality improvement scalefrom 2006 on a generational basis. This new mortality assumption reflects the expectation of lower ongoing improvements in life expectancies.
The following weighted-average assumptions were used in the valuation of the benefit obligations at December 31. The U.K. pension benefits apply to PPL only.
Pension Benefits U.S. U.K. Other Postretirement Benefits
2017 2016 2017 2016 2017 2016 PPL
Discount rate 3.70% 4.21% 2.65% 2.87% 3.64% 4.11%Rate of compensation increase 3.78% 3.95% 3.50% 3.50% 3.75% 3.92%
LKE Discount rate 3.69% 4.19% 3.65% 4.12%Rate of compensation increase 3.50% 3.50% 3.50% 3.50%
LG&E Discount rate 3.65% 4.13%
The following weighted-average assumptions were used to determine the net periodic defined benefit costs for the years ended December 31. The U.K. pension benefits apply to PPL only.
Pension Benefits U.S. U.K. Other Postretirement Benefits
2017 2016 2015 2017 2016 2015 2017 2016 2015 PPL
Discount rate service cost (b) 4.21% 4.59% 4.25% 2.99% 3.90% 3.85% 4.11% 4.48% 4.09%Discount rate interest cost (b) 4.21 % 4.59 % 4.25 % 2.41 % 3.14 % 3.85 % 4.11 % 4.48 % 4.09 %Rate of compensation increase 3.95% 3.93% 3.91% 3.50% 4.00% 4.00% 3.92% 3.91% 3.86%Expected return on plan assets (a) 7.00 % 7.00 % 7.00 % 7.22 % 7.20 % 7.19 % 6.21 % 6.11 % 6.06 %
LKE Discount rate 4.19% 4.56% 4.25% 4.12% 4.49% 4.06%Rate of compensation increase 3.50 % 3.50 % 3.50 % 3.50 % 3.50 % 3.50 %Expected return on plan assets (a) 7.00% 7.00% 7.00% 6.82% 6.82% 6.82%

135
Pension Benefits U.S. U.K. Other Postretirement Benefits
2017 2016 2015 2017 2016 2015 2017 2016 2015
LG&E
Discount rate 4.13 % 4.49 % 4.20 %Expected return on plan assets (a) 7.00% 7.00% 7.00%
(a) The expected long-term rates of return for pension and other postretirement benefits are based on management's projections using a best-estimate of expected returns, volatilities and correlations for each asset class. Each plan's specific current and expected asset allocations are also considered indeveloping a reasonable return assumption.
(b) As of January 1, 2016, WPD began using individual spot rates from the yield curve used to discount the benefit obligation to measure service cost and interest cost. PPL's U.S. plans use a single discount rate derived from an individual bond matching model to measure the benefit obligation, service cost and interest cost. See Note 1 for additional details.
(PPL and LKE)
The following table provides the assumed health care cost trend rates for the years ended December 31:
2017 2016 2015 PPL and LKE
Health care cost trend rate assumed for next year –– obligations 6.6% 7.0% 6.8%– cost 7.0% 6.8% 7.2%
Rate to which the cost trend rate is assumed to decline (the ultimate trend rate) – obligations 5.0% 5.0% 5.0%–– cost 5.0% 5.0% 5.0%
Year that the rate reaches the ultimate trend rate –– obligations 2022 2022 2020– cost 2022 2020 2020
A one percentage point change in the assumed health care costs trend rate assumption would have had the following effects on the other postretirement benefit plans in 2017:
One Percentage PointIncrease Decrease
Effect on accumulated postretirement benefit obligation PPL $ 4 $ (4) LKE 3 (3)

136
(PPL)
The funded status of PPL's plans at December 31 was as follows:
Pension Benefits U.S. U.K. Other Postretirement Benefits
2017 2016 2017 2016 2017 2016 Change in Benefit Obligation Benefit Obligation, beginning of period $ 4,079 $ 3,863 $ 7,383 $ 8,404 $ 591 $ 596
Service cost 65 66 76 69 7 7Interest cost 168 174 178 235 23 26Participant contributions — — 13 14 14 14Plan amendments (1) 14 — — 8 —Actuarial (gain) loss 233 214 293 484 4 11Settlements (6) (9) (1) — — —Termination benefits 1 — — — — —Gross benefits paid (251) (243) (345) (357) (59) (64) Federal subsidy — — — — 1 1Currency conversion — — 622 (1,466) — —
Benefit Obligation, end of period 4,288 4,079 8,219 7,383 589 591
Change in Plan Assets Plan assets at fair value, beginning of period 3,243 3,227 7,211 7,625 378 379
Actual return on plan assets 437 189 480 979 54 25Employer contributions 65 79 486 330 15 19Participant contributions — — 13 14 13 14Settlements (6) (9) (1) — — —Gross benefits paid (251 ) (243) (345) (357 ) (55) (59)Currency conversion — — 646 (1,380) — —
Plan assets at fair value, end of period 3,488 3,243 8,490 7,211 405 378
Funded Status, end of period $ (800 ) $ (836) $ 271 $ (172 ) $ (184) $ (213)
Amounts recognized in the Balance Sheets consist of:
NNoncurrent asset $ — $ — $ 284 $ 10 $ 2 $ 2Current liability (13 ) (17) — — (3) (3) NNoncurrent liability (787) (819) (13) (182) (183) (212)
Net amount recognized, end of period $ (800 ) $ (836) $ 271 $ (172 ) $ (184) $ (213)
Amounts recognized in AOCI and regulatoryassets/liabilities (pre-tax) consist of: Prior service cost (credit) $ 49 $ 59 $ — $ — $ 9 $ —Net actuarial (gain) loss 1,134 1,178 2,755 2,553 16 45Total (a) $ 1,183 $ 1,237 $ 2,755 $ 2,553 $ 25 $ 45
Total accumulated benefit obligationfor defined benefit pension plans $ 4,000 $ 3,807 $ 7,542 $ 6,780
(a) WPD is not subject to accounting for the effects of certain types of regulation as prescribed by GAAP and as a result, does not record regulatory assets/liabilities.
For PPL's U.S. pension and other postretirement benefit plans, the amounts recognized in AOCI and regulatory assets/liabilitiesat December 31 were as follows:
U.S. Pension Benefits Other Postretirement Benefits2017 2016 2017 2016
AOCI $ 374 $ 357 $ 15 $ 20Regulatory assets/liabilities 809 880 10 25Total $ 1,183 $ 1,237 $ 25 $ 45

137
The following tables provide information on pension plans where the projected benefit obligation (PBO) or accumulated benefit obligation (ABO) exceed the fair value of plan assets:
U.S. U.K. PBO in excess of plan assets PBO in excess of plan assets
2017 2016 2017 2016 Projected benefit obligation $ 4,288 $ 4,079 $ 3,083 $ 3,403Fair value of plan assets 3,488 3,243 3,070 3,221
U.S. U.K.
ABO in excess of plan assets ABO in excess of plan assets2017 2016 2017 2016
Accumulated benefit obligation $ 4,000 $ 3,807 $ 10 $ 657Fair value of plan assets 3,488 3,243 — 643
(LKE)
The funded status of LKE's plans at December 31 was as follows:
Pension Benefits Other Postretirement Benefits2017 2016 2017 2016
Change in Benefit ObligationBenefit Obligation, beginning of period $ 1,669 $ 1,588 $ 220 $ 216
Service cost 24 23 4 5Interest cost 68 71 9 9Participant contributions — — 8 7Plan amendments (a) 6 — 8 —Actuarial (gain) loss 113 96 (7) 4Gross benefits paid (a) (109) (109) (19) (21)
Benefit Obligation, end of period 1,771 1,669 223 220
Change in Plan Assets Plan assets at fair value, beginning of period 1,315 1,289 98 88
Actual return on plan assets 175 69 14 4Employer contributions 21 66 15 20Participant contributions — — 8 7Gross benefits paid (109) (109) (19) (21)
Plan assets at fair value, end of period 1,402 1,315 116 98
Funded Status, end of period $ (369) $ (354 ) $ (107) $ (122)
Amounts recognized in the Balance Sheets consist of: NNoncurrent asset $ — $ — $ 2 $ 2Current liability (4) (4 ) (3) (3) NNoncurrent liability (365) (350) (106) (121)
Net amount recognized, end of period $ (369) $ (354 ) $ (107) $ (122)
Amounts recognized in AOCI and regulatory assets/liabilities (pre-tax) consistof:Prior service cost $ 44 $ 45 $ 13 $ 6Net actuarial (gain) loss 434 436 (26) (13)Total $ 478 $ 481 $ (13) $ (7)
Total accumulated benefit obligationfor defined benefit pension plans $ 1,616 $ 1,531
(a) The pension plans were amended in December 2015 to allow active participants and terminated vested participants who had not previously elected a form of payment of their benefit to elect to receive their accrued pension benefit as a one-time lump-sum payment effective January 1, 2016. The projected

138
benefit obligation at December 31, 2016 increased by $19 million as a result of the amendment. Gross benefits paid by the plans include lump-sum cashpayments made to participants during 2017 and 2016 of $50 million and $53 million in connection with these offerings.
The amounts recognized in AOCI and regulatory assets/liabilities at December 31 were as follows:
Pension Benefits Other Postretirement Benefits2017 2016 2017 2016
AOCI $ 144 $ 111 $ 6 $ 8Regulatory assets/liabilities 334 370 (19) (15)Total $ 478 $ 481 $ (13) $ (7)
The following tables provide information on pension plans where the projected benefit obligation (PBO) or accumulated benefit obligations (ABO) exceed the fair value of plan assets:
PBO in excess of plan assets 2017 2016
Projected benefit obligation $ 1,771 $ 1,669Fair value of plan assets 1,402 1,315
ABO in excess of plan assets
2017 2016 Accumulated benefit obligation $ 1,616 $ 1,531Fair value of plan assets 1,402 1,315
(LG&E)
The funded status of LG&E's plan at December 31, was as follows:
Pension Benefits 2017 2016
Change in Benefit Obligation Benefit Obligation, beginning of period $ 329 $ 326
Service cost 1 1Interest cost 13 15Plan amendments (a) 6 —Actuarial (gain) loss 11 15Gross benefits paid (a) (34) (28)
Benefit Obligation, end of period 326 329
Change in Plan Assets Plan assets at fair value, beginning of period 318 297
Actual return on plan assets 41 14Employer contributions — 35Gross benefits paid (34) (28)
Plan assets at fair value, end of period 325 318
Funded Status, end of period $ (1) $ (11)
Amounts recognized in the Balance Sheets consist of: NNoncurrent liability $ (1) $ (11)
Net amount recognized, end of period $ (1) $ (11)
Amounts recognized in regulatory assets (pre-tax) consist of: Prior service cost $ 27 $ 25Net actuarial loss 92 110Total $ 119 $ 135
Total accumulated benefit obligation for defined benefit pension plan $ 326 $ 329

139
(a) The pension plan was amended in December 2015 to allow active participants and terminated vested participants who had not previously elected a form of payment of their benefit to elect to receive their accrued pension benefit as a one-time lump-sum payment effective January 1, 2016. The projected benefit obligation at December 31, 2015 increased by $10 million as a result of the amendment. Gross benefits paid by the plan include lump-sum cash payments made to participants during 2017 and 2016 of $19 million and $14 million in connection with this offering.
LG&E's pension plan had projected and accumulated benefit obligations in excess of plan assets at December 31, 2017 and 2016.
In addition to the plan it sponsors, LG&E is allocated a portion of the funded status and costs of certain defined benefit planssponsored by LKE. LG&E is also allocated costs of defined benefit plans from LKS for defined benefit plans sponsored byLKE. See Note 14 for additional information on costs allocated to LG&E from LKS. These allocations are based on LG&E'sparticipation in those plans, which management believes are reasonable. The actuarially determined obligations of current active employees and retired employees are used as a basis to allocate total plan activity, including active and retiree costs and obligations. Allocations to LG&E resulted in liabilities at December 31 as follows:
2017 2016 Pension $ 44 $ 42Other postretirement benefits 74 76
(PPL Electric)
Although PPL Electric does not directly sponsor any defined benefit plans, it is allocated a portion of the funded status and costs of plans sponsored by PPL Services based on its participation in those plans, which management believes are reasonable. As a result of the spinoff of PPL Energy Supply in 2015, pension and other postretirement plans were remeasured resulting in adjustments to PPL Electric's allocated balances of $56 million, reflected as a non-cash contribution on the Statement of Equity. ttThe actuarially determined obligations of current active employees and retirees are used as a basis to allocate total plan activity, including active and retiree costs and obligations. Allocations to PPL Electric resulted in liabilities at December 31 as follows:
2017 2016 Pension $ 246 $ 281Other postretirement benefits 62 72
(KU)
Although KU does not directly sponsor any defined benefit plans, it is allocated a portion of the funded status and costs of rrplans sponsored by LKE. KU is also allocated costs of defined benefit plans from LKS for defined benefit plans sponsored byLKE. See Note 14 for additional information on costs allocated to KU from LKS. These allocations are based on KU's participation in those plans, which management believes are reasonable. The actuarially determined obligations of current active employees and retired employees of KU are used as a basis to allocate total plan activity, including active and retireeyycosts and obligations. Allocations to KU resulted in liabilities at December 31 as follows.
2017 2016 Pension $ 36 $ 62Other postretirement benefits 32 40
Plan Assets - U.S. Pension Plans
(PPL, LKE and LG&E)
PPL's primary legacy pension plan and the pension plans sponsored by LKE are invested in the PPL Services Corporation Master Trust (the Master Trust) that also includes 401(h) accounts that are restricted for certain other postretirement benefitobligations of PPL and LKE. The investment strategy for the Master Trust is to achieve a risk-adjusted return on a mix of assetr s that, in combination with PPL's funding policy, will ensure that sufficient assets are available to provide long-term growth andliquidity for benefit payments, while also managing the duration of the assets to complement the duration of the liabilities. The TMaster Trust benefits from a wide diversification of asset types, investment fund strategies and external investment fund managers, and therefore has no significant concentration of risk.
The investment policy of the Master Trust outlines investment objectives and defines the responsibilities of the EBPB, externalinvestment managers, investment advisor and trustee and custodian. The investment policy is reviewed annually by PPL's tBoard of Directors.

140
The EBPB created a risk management framework around the trust assets and pension liabilities. This framework considers thetrust assets as being composed of three sub-portfolios: growth, immunizing and liquidity portfolios. The growth portfolio is comprised of investments that generate a return at a reasonable risk, including equity securities, certain debt securities and alternative investments. The immunizing portfolio consists of debt securities, generally with long durations, and derivativepositions. The immunizing portfolio is designed to offset a portion of the change in the pension liabilities due to changes ininterest rates. The liquidity portfolio consists primarily of cash and cash equivalents.
Target allocation ranges have been developed for each portfolio based on input from external consultants with a goal of limiting funded status volatility. The EBPB monitors the investments in each portfolio, and seeks to obtain a target portfolio that emphasizes reduction of risk of loss from market volatility. In pursuing that goal, the EBPB establishes revised guidelines from time to time. EBPB investment guidelines as of the end of 2017 are presented below.
The asset allocation for the trust and the target allocation by portfolio at December 31 are as follows:
Percentage of trust assets 2017
2017 (a) 2016 Target Asset
Allocation (a) Growth Portfolio 56% 52% 55%
Equity securities 32 % 30 %Debt securities (b) 14 % 12 %Alternative investments 10 % 10 %
Immunizing Portfolio 43% 46% 43%Debt securities (b) 39 % 43 %Derivatives 4 % 3 %
Liquidity Portfolio 1% 2% 2%Total 100 % 100 % 100 %
(a) Allocations exclude consideration of a group annuity contract held by the LG&E and KU Retirement Plan.(b) Includes commingled debt funds, which PPL treats as debt securities for asset allocation purposes.
(LKE)
LKE has pension plans, including LG&E's plan, whose assets are invested solely in the Master Trust, which is fully disclosed below. The fair value of these plans' assets of $1.4 billion and $1.3 billion at December 31, 2017 and 2016 represents an interest of approximately 40% and 41% in the Master Trust.
(LG&E)
LG&E has a pension plan whose assets are invested solely in the Master Trust, which is fully disclosed below. The fair value ofthis plan's assets of $325 million and $318 million at December 31, 2017 and 2016 represents an interest of approximately 9%and 10% in the Master Trust.
(PPL, LKE and LG&E)
The fair value of net assets in the Master Trust by asset class and level within the fair value hierarchy was:
December 31, 2017 December 31, 2016
Fair Value Measurements Using Fair Value Measurements Using Total Level 1 Level 2 Level 3 Total Level 1 Level 2 Level 3
PPL Services Corporation Master Trust Cash and cash equivalents $ 301 $ 301 $ — $ — $ 181 $ 181 $ — $ ——Equity securities:
U.S. Equity 229 229 — — 152 152 — ——U.S. Equity fund measured at NAV (a) 364 — — — 272 — — —International equity fund at NAV (a) 538 — — — 551 — — ——Commingled debt measured at NAV (a) 611 — — — 546 — — —
Debt securities: U.S. Treasury and U.S. government sponsored agency 186 186 — — 381 381 — —

141
December 31, 2017 December 31, 2016Fair Value Measurements Using Fair Value Measurements Using
Total Level 1 Level 2 Level 3 Total Level 1 Level 2 Level 3Corporate 883 — 870 13 850 — 837 13Other 10 — 10 — 8 — 8 —
Alternative investments:Real estate measured at NAV (a) 109 — — — 102 — — —Private equity measured at NAV (a) 80 — — — 80 — — ——Hedge funds measured at NAV (a) 175 — — — 167 — — —
Derivatives: Interest rate swaps and swaptions 50 — 50 — 61 — 61 —Other 1 — 1 — 3 — 3 ——
Insurance contracts 24 — — 24 27 — — 27PPL Services Corporation Master Trust assets, atfair value 3,561 $ 716 $ 931 $ 37 3,381 $ 714 $ 909 $ 40
Receivables and payables, net (b) 72 (15)401(h) accounts restricted for other ppostretirement benefit obligations (145) (123) Total PPL Services Corporation Master Trust pension assets $ 3,488 $ 3,243
(a) In accordance with accounting guidance certain investments that are measured at fair value using the net asset value per share (NAV), or its equivalent, practical expedient have not been classified in the fair value hierarchy. The fair value amounts presented in the table are intended to permit reconciliationof the fair value hierarchy to the amounts presented in the statement of financial position.
(b) Receivables and payables represent amounts for investments sold/purchased but not yet settled along with interest and dividends earned but not yet received.
A reconciliation of the Master Trust assets classified as Level 3 at December 31, 2017 is as follows:
Corporatedebt
Insurance contracts Total
Balance at beginning of period $ 13 $ 27 $ 40Actual return on plan assets
Relating to assets still held at the reporting date — 1 1Purchases, sales and settlements — (4) (4)
Balance at end of period $ 13 $ 24 $ 37
A reconciliation of the Master Trust assets classified as Level 3 at December 31, 2016 is as follows:
Corporatedebt
Insurance contracts Total
Balance at beginning of period $ 10 $ 32 $ 42Actual return on plan assets
Relating to assets still held at the reporting date — 1 1Purchases, sales and settlements 3 (6) (3)
Balance at end of period $ 13 $ 27 $ 40
The fair value measurements of cash and cash equivalents are based on the amounts on deposit.
The market approach is used to measure fair value of equity securities. The fair value measurements of equity securities (excluding commingled funds), which are generally classified as Level 1, are based on quoted prices in active markets. Thesesecurities represent actively and passively managed investments that are managed against various equity indices.
Investments in commingled equity and debt funds are categorized as equity securitiest . Investments in commingled equity funds include funds that invest in U.S. and international equity securities. Investments in commingled debt funds include funds that invest in a diversified portfolio of emerging market debt obligations, as well as funds that invest in investment grade long-duration fixed-income securities.
The fair value measurements of debt securities are generally based on evaluations that reflect observable market information,such as actual trade information for identical securities or for similar securities, adjusted for observable differences. The fair ffvalue of debt securities is generally measured using a market approach, including the use of pricing models, which incorporate

142
observable inputs. Common inputs include benchmark yields, relevant trade data, broker/dealer bid/ask prices, benchmark securities and credit valuation adjustments. When necessary, the fair value of debt securities is measured using the incomeapproach, which incorporates similar observable inputs as well as payment data, future predicted cash flows, collateral performance and new issue data. For the Master Trust, these securities represent investments in securities issued by U.S. Treasury and U.S. government sponsored agencies; investments securitized by residential mortgages, auto loans, credit cardsand other pooled loans; investments in investment grade and non-investment grade bonds issued by U.S. companies acrossseveral industries; investments in debt securities issued by foreign governments and corporations.
Investments in real estate represent an investment in a partnership whose purpose is to manage investments in core U.S. realestate properties diversified geographically and across major property types (e.g., office, industrial, retail, etc.). The manager is focused on properties with high occupancy rates with quality tenants. This results in a focus on high income and stable cash flows with appreciation being a secondary factor. Core real estate generally has a lower degree of leverage when compared with more speculative real estate investing strategies. The partnership has limitations on the amounts that may be redeemed aabased on available cash to fund redemptions. Additionally, the general partner may decline to accept redemptions when necessary to avoid adverse consequences for the partnership, including legal and tax implications, among others. The fair valueof the investment is based upon a partnership unit value.
Investments in private equity represent interests in partnerships in multiple early-stage venture capital funds and private equity fund of funds that use a number of diverse investment strategies. The partnerships have limited lives of at least 10 years, after which liquidating distributions will be received. Prior to the end of each partnership's life, the investment cannot be redeemedwith the partnership; however, the interest may be sold to other parties, subject to the general partner's approval. The MasterTrust has unfunded commitments of $28 million that may be required during the lives of the partnerships. Fair value is based on an ownership interest in partners' capital to which a proportionate share of net assets is attributed.
Investments in hedge funds represent investments in a fund of hedge funds. Hedge funds seekf a return utilizing a number of kdiverse investment strategies. The strategies, when combined aim to reduce volatility and risk while attempting to deliver positive returns under most market conditions. Major investment strategies for the fund of hedge funds include long/short equity, tactical trading, event driven, and relative value. Shares may be redeemed within 45 days prior written notice. The fundis subject to short term lockups and other restrictions. The fair value for the fund has been estimated using the net asset valr ue per share.
The fair value measurements of derivative instruments utilize various inputs that include quoted prices for similar contracts or market-corroborated inputs. In certain instances, these instruments may be valued using models, including standard option dvaluation models and standard industry models. These securities primarily represent investments in interest rate swaps and swaptions (the option to enter into an interest rate swap), which are valued based on the swap details, such as swap curves, notional amount, index and term of index, reset frequency, volatility and payer/receiver credit ratings.
Insurance contracts, classified as Level 3, represent an investment in an immediate participation guaranteedrr group annuitydcontract. The fair value is based on contract value, which represents cost plus interest income less distributions for benefit payments and administrative expenses.
Plan Assets - U.S. Other Postretirement Benefit Plans
The investment strategy with respect to other postretirement benefit obligations is to fund VEBA trusts and/or 401(h) accountswith voluntary contributions and to invest in a tax efficient manner. Excluding the 401(h) accounts included in the Master Trust, other postretirement benefit plans are invested in a mix of assets for long-term growth with an objective of earningreturns that provide liquidity as required for benefit payments. These plans benefit from diversification of asset types,investment fund strategies and investment fund managers, and therefore, have no sit gnificant concentration of risk. Equity securities include investments in domestic large-cap commingled funds. Ownership interests in commingled funds that invest entirely in debt securities are classified as equity securities, but treated as debt securities for asset allocation and targetallocation purposes. Ownership interests in money market funds are treated as cash and cash equivalents for asset allocationand target allocation purposes. The asset allocation for the PPL VEBA trusts, excluding LKE, and the target allocation, by asset class, at December 31 are detailed below.

143
Percentage of plan assets Target Asset Allocation
2017 2016 2017 Asset Class U.S. Equity securities 47% 48% 45%Debt securities (a) 49% 50% 50%Cash and cash equivalents (b) 4% 2% 5%
Total 100% 100% 100%
(a) Includes commingled debt funds and debt securities. (b) Includes money market funds.
LKE's other postretirement benefit plan is invested primarily in a 401(h) account, as disclosed in the PPL Services CorporationMaster Trust, with insignificant amounts invested in money market funds within VEBA trusts for liquidity.
The fair value of assets in the U.S. other postretirement benefit plans by asset class and level within the fair value hierarchy was:
December 31, 2017 December 31, 2016
Fair Value Measurement Using Fair Value Measurement UsingTotal Level 1 Level 2 Level 3 Total Level 1 Level 2 Level 3
Money market funds $ 10 $ 10 $ — $ — $ 5 $ 5 $ — $ ——U.S. Equity securities:
Large-cap equity fund measure at NAV (a) 123 — — — 123 — — ——Commingled debt fund measured at NAV (a) 96 — — — 114 — — —
Debt securities: Corporate bonds 30 — 30 — — — — —Municipalities — — — — 12 — 12 ——
Total VEBA trust assets, at fair value 259 $ 10 $ 30 $ — 254 $ 5 $ 12 $ —Receivables and payables, net (b) 1401(h) account assets 145 123 Total other postretirement benefit plan assets $ 405 378
(a) In accordance with accounting guidance certain investments that are measured at fair value using the net asset value per share (NAV), or its equivalent, practical expedient have not been classified in the fair value hierarchy. The fair value amounts presented in the table are intended to permit reconciliationof the fair value hierarchy to the amounts presented in the statement of financial position.
(b) Receivables and payables represent amounts for investments sold/purchased but not yet settled along with interest and dividends earned but not yet received.
Investments in money market funds represent investments in funds that invest primarily in a diversified portfolio of investmentygrade money market instruments, including, but not limited to, commercial paper, notes, repurchase agreements and other evidences of indebtedness with a maturity not exceeding 13 months from the date of purchase. The primary objective of thefund is a level of current income consistent with stability of principal and liquidity. Redemptions can be made daily on this fund.
Investments in large-cap equity securities represent investments in a passively managed equity index fund that invests inysecurities and a combination of other collective funds. Fair value measurements are not obtained from a quoted price in an active market but are based on firm quotes of net asset values per share as provided by the trustee of the fund. Redemptions canaabe made daily on this fund.
Investments in commingled debt securities represent investments in a fund that invests in a diversified portfolio of investmentgrade long-duration fixed income securities. Redemptions can be made daily on these funds.
Investments in corporate bonds represent investment in a diversified portfolio of investment grade long-duration fixed incomesecurities. The fair value of debt securities are generally based on evaluations that reflect observable market information, such as actual trade information for identical securities or for similar securities, adjusted for observable differences.
Investments in municipalities represent investments in a diverse mix of tax-exempt municipal securities. The fair valuemeasurements for these securities are based on recently executed transactions for identical securities or for similar securities.

144
Plan Assets - U.K. Pension Plans (PPL)
The overall investment strategy of WPD's pension plans is developed by each plan's independent trustees in its Statement of Investment Principles in compliance with the U.K. Pensions Act of 1995 and other U.K. legislation. The trustees' primary focusis to ensure that assets are sufficient to meet members' benefits as they fall due with a loff nger term objective to reduce investment risk. The investment strategy is intended to maximize investment returns while not incurring excessive volatility inthe funding position. WPD's plans are invested in a wide diversification of asset types, fund strategies and fund managers; andtherefore, have no significant concentration of risk. Commingled funds that consist entirely of debt securities are traded asequity units, but treated by WPD as debt securities for asset allocation and target allocation purposes. These includeinvestments in U.K. corporate bonds and U.K. gilts.
The asset allocation and target allocation at December 31 of WPD's pension plans are detailed below.
Target Asset Percentage of plan assets Allocation
2017 2016 2017 Asset Class Cash and cash equivalents 2% 1% —%Equity securities
U.K. 2% 3% 2%European (excluding the U.K.) 1% 2% 1%Asian-Pacific 1% 2% 1%North American 1% 3% 1%Emerging markets 1% 3% 1%Global equities 16% 6% 10%Global Tactical Asset Allocation 33% 33% 41%
Debt securities (a) 37% 41% 38%Alternative investments 6% 6% 5%
Total 100% 100% 100%
(a) Includes commingled debt funds.
The fair value of assets in the U.K. pension plans by asset class and level within the fair value hierarchy was:
December 31, 2017 December 31, 2016
Fair Value Measurement Using Fair Value Measurement UsingTotal Level 1 Level 2 Level 3 Total Level 1 Level 2 Level 3
Cash and cash equivalents $ 216 $ 216 $ — $ — $ 42 $ 42 $ — $ ——Equity securities measured at NAV (a) :
U.K. companies 157 — — — 210 — — ——European companies (excluding the U.K.) 98 — — — 177 — — —Asian-Pacific companies 60 — — — 140 — — ——North American companies 123 — — — 227 — — —Emerging markets companies 62 — — — 209 — — ——Global Equities 1,335 — — — 466 — — —Other 2,807 — — — 2,363 — — ——
Debt Securities: U.K. corporate bonds 3 — 3 — 2 — 2 ——U.K. gilts 3,137 — 3,137 — 2,940 — 2,940 —
Alternative investments:Real estate measured at NAV (a) 492 — — — 435 — — —
Fair value - U.K. pension plans $ 8,490 $ 216 $ 3,140 $ — $ 7,211 $ 42 $ 2,942 $ ——
(a) In accordance with accounting guidance certain investments that are measured at fair value using the net asset value per share (NAV), or its equivalent, practical expedient have not been classified in the fair value hierarchy. The fair value amounts presented in the table are intended to permit reconciliationof the fair value hierarchy to the amounts presented in the statement of financial position.
Except for investments in real estate, the fair value measurements of WPD's pension plan assets are based on the same inputs and measurement techniques used to measure the U.S. pension plan assets described above.

145
Investments in equity securities represent actively and passively managed funds that are measured against various equityindices.
Other comprises a range of investment strategies, which invest in a variety of assets including equities, bonds, currencies, real estate and forestry held in unitized funds, which are considered in the Global Tactical Asset Allocation target.
U.K. corporate bonds include investment grade corporate bonds of companies from diversified U.K. industries.
U.K. gilts include gilts, index-linked gilts and swaps intended to track a portion of the plans' liabilities.
Investments in real estate represent holdings in a U.K. unitized fund that owns and manages U.K. industrial and commercial real estate with a strategy of earning current rental income and achieving capital growth. The fair value measurement of thefund is based upon a net asset value per share, which is based on the value of underlying properties that are independentlyappraised in accordance with Royal Institution of Chartered Surveyors valuation standards at least annually with quarterlyvaluation updates based on recent sales of similar properties, leasing levels, propef rty operations and/or market conditions. Thefund may be subject to redemption restrictions in the unlikely event of a large forced sale in order to ensure other unit holdersare not disadvantaged.
Expected Cash Flows - U.S. Defined Benefit Plans (PPL)
While PPL's U.S. defined benefit pension plans have the option to utilize available prior year credit balances to meet current and future contribution requirements, PPL contributed $145 million to its U.S. pension plans in January 2018. No additional contributions are expected in 2018.
PPL sponsors various non-qualified supplemental pension plans for which no assets are segregated from corporate assets. PPL expects to make approximately $13 million of benefit payments under these plans in 2018.
PPL is not required to make contributions to its other postretirement benefit plans but hastt historically funded these plans in amounts equal to the postretirement benefit costs recognized. Continuation of this past practice would cause PPL to contributet$14 million to its other postretirement benefit plans in 2018.
The following benefit payments, which reflect expected future service, as appropriate, are expected to be paid by the plans andthe following federal subsidy payments are expected to be received by PPL.
Other Postretirement
PensionBenefit
Payment
ExpectedFederalSubsidy
2018 $ 260 $ 51 $ 12019 269 51 —2020 268 50 12021 270 49 —2022 272 48 —2023-2027 1,328 218 2
(LKE)
While LKE's defined benefit pension plans have the option to utilize available prior year credit balances to meet current and future contribution requirements, LKE contributed $105 million to its pension plans in January 2018. No additionalcontributions are expected in 2018.
LKE sponsors various non-qualified supplemental pension plans for which no assets are segregated from corporate assets. LKE mexpects to make $4 million of benefit payments under these plans in 2018.ff
LKE is not required to make contributions to its other postretirement benefit plan but has historically funded this plan in amounts equal to the postretirement benefit costs recognized. Continuation of this past practice would cause LKE to contribute ta projected $14 million to its other postretirement benefit plan in 2018.

146
The following benefit payments, which reflect expected future service, as appropriate, are expected to be paid by the plans andthe following federal subsidy payments are expected to be received by LKE.
Other Postretirement
PensionBenefit
Payment
ExpectedFederalSubsidy
2018 $ 109 $ 14 $ —2019 113 15 —2020 114 16 12021 115 16 —2022 116 16 —2023-2027 573 79 2
(LG&E)
While LG&E's defined benefit pension plan has the option to utilize available prior year credit balances to meet current and future contribution requirements, LG&E contributed $54 million to its pension plan in January 2018. No additionalcontributions are expected in 2018.
The following benefit payments, which reflect expected future service, as appropriate, are expected to be paid by the plan.
Pension2018 $ 262019 262020 262021 252022 242023-2027 104
Expected Cash Flows - U.K. Pension Plans (PPL)
The pension plans of WPD are subject to formal actuarial valuations every three years, which are used to determine funding requirements. Contribution requirements were evaluated in accordance with the valuation performed as of March 31, 2016. WPD expects to make contributions of approximately $191 million in 2018. WPD is currently permitted to recover in current revenues approximately 78% of its pension funding requirements for its primary pension plans.
The following benefit payments, which reflect expected future service, as appropriate, are expected to be paid by the plans.
Pension2018 $ 3432019 3492020 3532021 3562022 3622023-2027 1,843
Savings Plans (All Registrants)
Substantially all employees of PPL's subsidiaries are eligible to participate in deferred savingsaa plans (401(k)s). Employer contributions to the plans were:
2017 2016 2015 PPL $ 36 $ 35 $ 34PPL Electric 6 6 6LKE 18 17 16LG&E 5 5 5KU 4 4 4

147
Separation Benefits
Certain PPL subsidiaries provide separation benefits to eligible employees. These benefits may be provided in the case of separations due to performance issues, loss of job-related qualifications or organizational changes. These benefits include cash severance payments and a single sum payment approximating the dollar amount of premium payments that would be incurred for continuation of group health and welfare coverage based on an employee's years of service along with outplacement services. Separation benefits are recorded when such amounts are probable and estimable.
See Note 8 for a discussion of separation benefits recognized in 2015 related to the spinoff of PPL Energy Supply. Separationbenefits were not significant in 2017 and 2016.
12. Jointly Owned Facilities
(PPL, LKE, LG&E and KU)
At December 31, 2017 and 2016, the Balance Sheets reflect the owned interests in the facilities listed below.
Ownership
Interest Electric Plant Accumulated Depreciation
Construction Work
in ProgressPPL and LKE
December 31, 2017,Generating Plants
Trimble County Unit 1 75.00% $ 427 $ 69 $ 1Trimble County Unit 2 75.00% 1,032 176 198
,Generating Plants
Trimble County Unit 1 75.00% $ 407 $ 55 $ 1Trimble County Unit 2 75.00% 1,026 161 83
LG&E
December 31, 2017,Generating Plants
E.W. Brown Units 6-7 38.00% $ 41 $ 17 $ —Paddy's Run Unit 13 & E.W. Brown Unit 5 53.00% 52 15 —Trimble County Unit 1 75.00% 427 69 1Trimble County Unit 2 14.25% 215 36 102Trimble County Units 5-6 29.00% 32 9 —Trimble County Units 7-10 37.00% 73 21 —Cane Run Unit 7 22.00% 120 8 1E.W. Brown Solar Unit 39.00% 10 1 —
December 31, 2016,Generating Plants
E.W. Brown Units 6-7 38.00% $ 40 $ 15 $ —Paddy's Run Unit 13 & E.W. Brown Unit 5 53.00% 55 12 1Trimble County Unit 1 75.00% 407 55 1Trimble County Unit 2 14.25% 214 32 43Trimble County Units 5-6 29.00% 30 8 1Trimble County Units 7-10 37.00% 71 17 1Cane Run Unit 7 22.00% 114 5 2E.W. Brown Solar Unit 39.00% 10 — —
KU
December 31, 2017,Generating Plants
E.W. Brown Units 6-7 62.00% $ 66 $ 27 $ —Paddy's Run Unit 13 & E.W. Brown Unit 5 47.00% 46 13 —

148
Ownership
Interest Electric Plant Accumulated Depreciation
Construction Work
in ProgressTrimble County Unit 2 60.75% 817 140 96Trimble County Units 5-6 71.00% 76 20 —Trimble County Units 7-10 63.00% 120 34 —Cane Run Unit 7 78.00% 431 31 4E.W. Brown Solar Unit 61.00% 16 1 —
December 31, 2016 ,
Generating PlantsE.W. Brown Units 6-7 62.00% $ 65 $ 23 $ —Paddy's Run Unit 13 & E.W. Brown Unit 5 47.00% 50 11 1Trimble County Unit 2 60.75% 812 129 40Trimble County Units 5-6 71.00% 74 19 —Trimble County Units 7-10 63.00% 121 29 1Cane Run Unit 7 78.00% 412 18 4E.W. Brown Solar Unit 61.00% 15 — —
Each subsidiary owning these interests provides its own funding for its share of the facility. Each receives a portion of the total output of the generating plants equal to its percentage ownership. The share of fuel and other operating costs associated with the plants is included in the corresponding operating expenses on the Statements of Income.
13. Commitments and Contingencies
(PPL)
All commitments, contingencies and guarantees associated with PPL Energy Supply and its subsidiaries were retained by TalenEnergy and its subsidiaries at the spinoff date without recourse to PPL.
Energy Purchase Commitments (PPL, LKE, LG&E and KU)
LG&E and KU enter into purchase contracts to supply the coal and natural gas requirements for generation facilities and LG&E's retail natural gas supply operations. These contracts include the following commitments:
Contract Typeyp
Maximum Maturity
Date NNatural Gas Fuel 2019 Natural Gas Retail Supply 2019Coal 2023 Coal Transportation and Fleeting Services 2024 NNatural Gas Transportation 2026
LG&E and KU have a power purchase agreement with OVEC expiring in June 2040. See footnote (f) to the table in x"Guarantees and Other Assurances" below for information on the OVEC power purchase contract, including recent developments in credit or debt conditions relating to OVEC. Future obligations for power purchases from OVEC areunconditional demand payments, comprised of debt-service payments and contractuf ally-required reimbursements of plant operating, maintenance and other expenses, and are projected as follows:
LG&E KU Total2018 $ 20 $ 9 $ 292019 19 8 272020 18 8 262021 19 8 272022 19 8 27Thereafter 316 141 457
Total $ 411 $ 182 $ 593

149
LG&E and KU had total energy purchases under the OVEC power purchase agreement for the years ended December 31 asfollows:
2017 2016 2015 LG&E $ 14 $ 16 $ 15KU 6 7 7
Total $ 20 $ 23 $ 22
Legal Matters
(All Registrants)
PPL and its subsidiaries are involved in legal proceedings, claims and litigation in the ordinary course of business. PPL and its subsidiaries cannot predict the outcome of such matters, or whether such matters may result in material liabilities, unlessotherwise noted.
WKE Indemnification (PPL and LKE)
See footnote (e) to the table in "Guarantees and Other Assurances" below for informaa ation on an LKE indemnity relating to itsformer WKE lease, including related legal proceedings.
(PPL, LKE and LG&E)
Cane Run Environmental Claims
In December 2013, six residents, on behalf of themselves and others similarly situated, filed a class action complaint against LG&E and PPL in the U.S. District Court for the Western District of Kentucky alleging violations of the Clean Air Act, RCRA, tand common law claims of nuisance, trespass and negligence. These plaintiffs seek injunctive relief and civil penalties, plus costs and attorney fees, for the alleged statutory violations. Under the common law claims, these plaintiffs seek monetary compensation and punitive damages for property damage and diminished property values for a class consisting of residentswithin four miles of the Cane Run plant. In their individual capacities, these plaintiffs sought compensation for alleged adverse health effects. In July 2014, the court dismissed the RCRA claims and all but one Clean Air Act claim, but declined to dismiss the common law tort claims. In November 2016, the plaintiffs filed an amended complaint removing the personal injury claimsand removing certain previously named plaintiffs. In February 2017, the District Court issued an order dismissing PPL as a ddefendant and dismissing the final federal claim against LG&E. On April 13, 2017, the federal District Court issued an order declining to exercise supplemental jurisdiction on the state law claims and dismissed the case in its entirety. On June 16, 2017, the plaintiffs filed a class action complaint in Jefferson Circuit Court, Kentucky, against LG&E alleging state law nuisance,negligence and trespass tort claims. The plaintiffs seek compensatory and punitive damages for alleged property damage due to purported plant emissions on behalf of a class of residents within one to three miles of the plant. Proceedings are currently underway regarding potential class certification, for which a decision may occur in late 2018 or in 2019. PPL, LKE and LG&Ecannot predict the outcome of this matter. LG&E retired one coal-fired unit at the Cane Run plant in March 2015 and the remaining two coal-fired units at the plant in June 2015.
(PPL, LKE and KU)
E.W. Brown Environmental Claims
On July 12, 2017, the Kentucky Waterways Alliance and the Sierra Club filed a citizen suit complaint against KU in the U.S. District Court for the Eastern District of Kentucky alleging discharges at the E.W. Brown plant in violation of the Clean WaterfAct and the plant's water discharge permit and alleging contamination that may present an imminent and substantial endangerment in violation of the RCRA. The plaintiffs' suit relates to prior notices of intent to file a citizen suit submittedf in dOctober and November 2015 and October 2016. These plaintiffs sought injunctive relief ordering KU to take all actionsnecessary to comply with the Clean Water Act and RCRA, including ceasing the discharges in question, abating effectsassociated with prior discharges and eliminating the alleged imminent and substantial endangerment. These plaintiffs alsosought assessment of civil penalties and an award of litigation costs and attorney fees. On December 28, 2017 the U.S. DistrictCourt for the Eastern District of Kentucky issued an order dismissing the Clean Water Act and RCRA complaints against KU in rtheir entirety. On January 26, 2018, the plaintiffs appealed the dismissal order to the U.S. Court of Appeals for the Sixth Circuit. KU is undertaking extensive remedial measures at the Brown plant including closure of the former ash pond,t

150
implementation of a groundwater remedial action plan, and performance of a corrective action plan including aquatic study of adjacent surface waters and risk assessment. PPL, LKE and KU cannot predict the outcome of these matters. KK
(PPL, LKE, LG&E and KU)
Trimble County Water Discharge Permit y g
In May 2010, the Kentucky Waterways Alliance and other environmental groups filed a petition with the Kentucky Energy and Environment Cabinet (KEEC) challenging the Kentucky Pollutant Discharge Elimination System permit issued in April 2010, which covers water discharges from the Trimble County plant. In November 2010, the KEEC issued a final order upholding the permit, which was subsequently appealed by the environmental groups. In September 2013y , the Franklin Circuit Court reversed the KEEC order and remanded the permit to the agency for further proceedings. LG&E and the KEEC appealed the order to theKentucky Court of Appeals. In July 2015, the Court of Appeals upheld the lower court ruling. LG&E and the KEEC moved for discretionary review by the Kentucky Supreme Court. In February 2016, the Kentucky Supreme Court issued an order grantingydiscretionary review and oral arguments were held in September 2016. On April 27, 2017, the Kentucky Supreme Court issued an order reversing the decision of the appellate court and upholding the permit issued to LG&E by the KEEC.
Trimble County Landfill y
Various state and federal permits and regulatory approvals are required in order to construct a landfill at the Trimble Countyplant to be used for disposal of CCRs. In October 2016, the Kentucky Division of Water issued a water quality certification andin February 2017, the Kentucky Division of Waste Management issued a "special waste" landfill permit. In March 2017, theSierra Club and a resident adjacent to the plant filed administrative challenges to the landfill permit which were subsequentlydismissed by agreed order entered in August 2017. In June 2017, the U.S. Army Corps of Engineers issued a dredge and fillpermit, the final approval required for construction of the landfill. PPL, LKE, LG&E and KU believe that all permits and regulatory approvals issued for the project comply with applicable state and federal laws.
(All Registrants)
Regulatory Issues
See Note 6 for information on regulatory matters related to utility rate regulation.
Electricity - Reliability Standards y y
The NERC is responsible for establishing and enforcing mandatory reliability standards (Reliability Standards) regarding thebulk electric system in North America. The FERC oversees this process and independently enforces the Reliability Standards.
The Reliability Standards have the force and effect of law and apply to certain users of the bulk electric system, includingelectric utility companies, generators and marketers. Under the Federal Power Act, the FERC may assess civil penalties for certain violations.
PPL Electric, LG&E and KU monitor their compliance with the Reliability Standards and self-report or self-log potentialviolations of applicable reliability requirements whenever identified, and submit accompanying mitigation plans, as required.The resolution of a small number of potential violations is pending. Penalties incurred to date have not been significant. Any Regional Reliability Entity (including RFC or SERC) determination concerning the resolution of violations of the ReliabilityStandards remains subject to the approval of the NERC and the FERC.
In the course of implementing their programs to ensure compliance with the Reliability Standards by those PPL affiliates subject to the standards, certain other instances of potential non-compliance may be identified from time to time. TheRegistrants cannot predict the outcome of these matters, and cannot estimate a range of reasonably possible losses, if any.
Environmental Matters
(All Registrants)
Due to the environmental issues discussed below or other environmental matters, it may be necessary for the Registrants to modify, curtail, replace or cease operation of certain facilities or performance of certain operations to comply with statutes,regulations and other requirements of regulatory bodies or courts. In addition, legal challenges to new environmental permits or

151
rules add to the uncertainty of estimating the future cost of these permits and rules. Finally, the regulatory reviews specified in the President's March 2017 Executive Order (the March 2017 Executive Order) promoting energy independence and economic growth could result in future regulatory changes and additional uncertainty.
WPD's distribution businesses are subject to certain statutory and regulatory environmental requirements. It may be necessaryfor WPD to incur significant compliance costs, which costs may be recoverable through rates subject to the approval of Ofgem. PPL believes that WPD has taken and continues to take measures to comply with all applicable environmental laws and regulations.
LG&E and KU are entitled to recover, through the ECR mechanism, certain costs of complying with the Clean Air Act, as amended, and those federal, state or local environmental requirements applicable to coal combustion wastes and by-products from facilities that generate electricity from coal in accordance with approved compliance plans. Costs not covered by the ECR mechanism for LG&E and KU and all such costs for PPL Electric are subject to rate recovery before the companies' respectivestate regulatory authorities, or the FERC, if applicable. Because neither WPD nor PPL Electric owns any generating plants,their exposure to related environmental compliance costs is reduced. PPL, PPL Electric, LKE, LG&E and KU can provide noassurances as to the ultimate outcome of future environmental or rate proceedings before regulatory authorities.
Air
(PPL, LKE, LG&E and KU)
NAAQS
The Clean Air Act, which regulates air pollutants from mobile and stationary sources in the United States, has a significant impact on the operation of fossil fuel generation plants. Among other things, the Clean Air Act requires the EPA periodically toreview and establish concentration levels in the ambient air for six pollutants to protect public health and welfare. The six pollutants are carbon monoxide, lead, nitrogen dioxide, ozone (contributed to by nitrogen oxide emissions), particulate matter and sulfur dioxide. The established concentration levels for these six pollutants are known as NAAQS. Under the Clean Air Act, the EPA is required to reassess the NAAQS on a five-year schedule.
Federal environmental regulations of these six pollutants require states to adopt implementation plans, known as stateimplementation plans, which detail how the state will attain the standards that are mandated by the relevant law or regulation.Each state identifies the areas within its boundaries that meet the NAAQS (attainment areas) and those that do not (non-attainment areas), and must develop a state implementation plan both to bring non-attainment areas into compliance with theNAAQS and to maintain good air quality in attainment areas. In addition, for attainment of ozone and fine particulates standards, states in the eastern portion of the country, including Kentucky, are subject to a regional program developed by theEPA known as the Cross-State Air Pollution Rule. The NAAQS, future revisions to the NAAQS and state implementationplans, or future revisions to regional programs, may require installation of additional pollution controls, the costs of which PPL,LKE, LG&E and KU believe are subject to cost recovery.
Although PPL, LKE, LG&E and KU do not anticipate significant costs to comply with these programs, changes in market or operating conditions could result in different costs than anticipated.
Ozone
The EPA issued the current ozone standard in October 2015. The states and the EPA are required to determine (based onambient air monitoring data) those areas that meet the standard and those that are in non-attainment. The EPA was scheduled to designate areas as being in attainment or nonattainment of the current ozone standard by no later than October 2017 which wasuuto be followed by further regulatory proceedings identifying compliance measures and deadlines. However, the current implementation and compliance schedule is uncertain because the EPA failed to make nonattainment demonstrations by the applicable deadline. In addition, some industry groups have requested the EPA to defer implementation of the 2015 ozone standard, but the EPA has not yet acted on this request. While implementation of the 2015 ozone standard could potentially require the addition of SCRs at some LG&E and KU generating units, PPL, LKE, LG&E and KU are currently unable to determine what the compliance measures and deadlines may ultimately be with respect to the new standard.
States are also obligated to address interstate transport issues associated with ozone standards through the establishment of "good neighbor" state implementation plans for those states that are found to contribute significantly to another state's non-ttattainment. As a result of a partial consent decree addressing claims regarding federal implementation, the EPA and severalstates, including Kentucky, are evaluating the need for further nitrogen oxide reductions from fossil-fueled plants to address

152
interstate impacts. While PPL, LKE, LG&E, and KU are unable to predict the outcome of ongoing and future evaluations bythe EPA and the states, such evaluations could potentially result in requirements for nitrogen oxide reductions beyond thosecurrently required under the Cross State Air Pollution Rule.
Sulfur Dioxide
In 2010, the EPA issued the current NAAQS for sulfur dioxide and required states to identify areas that meet those standards and areas that are in "non-attainment". In July 2013, the EPA finalized non-attainment designations for parts of the country,including part of Jefferson County in Kentucky. Attainment must be achieved by 2018tt . As a result of scrubber replacements completed by LG&E at the Mill Creek plant in 2016, all Jeffersok n County monitors now indicate compliance with the sulfur dioxide standards. Additionally, LG&E accepted a new sulfur dioxide emission limit to ensure continuing compliance with the NAAQS. PPL, LKE, LG&E and KU do not anticipate any further measures to achieve compliance with the new sulfur dioxidestandards.
Climate Change
There is continuing world-wide attention focused on issues related to climate change. In June 2016, President Obamaannounced that the United States, Canada and Mexico established the North American Climate, Clean Energy, and Environment Partnership Plan, which specifies actions to promote clean energy, address climate change and protect theenvironment. The plan includes a goal to provide 50% of the energy used in North America from clean energy sources by 2025.The plan does not impose any nation-specific requirements.
In December 2015, 195 nations, including the U.S., signed the Paris Agreement on Climate, which establishes a comprehensiveframework for the reduction of GHG emissions from both developed and developing nations. Although the agreement does not establish binding reduction requirements, it requires each nation to prepare, communicate, and maintain GHG reduction commitments. Reductions can be achieved in a variety of ways, including energy conservation, power plant efficiencyimprovements, reduced utilization of coal-fired generation or replacing coal-fired generation with natural gas or renewablegeneration. Based on the EPA's rules issued in 2015 imposing GHG emission standardsd for both new and existing power plants,the U.S. committed to an initial reduction target of 26% to 28% below 2005 levels by 2025. However, on June 1, 2017, President Trump announced a plan to withdraw from the Paris Agreement and undertake negotiations to reenter the current agreement or enter a new agreement on terms more favorable to the U.S. Under the terms of the Paris Agreement, any U.S. withdrawal would not be complete until November 2020.
Additionally, the March 2017 Executive Order directed the EPA to review its 2015 greenhouse gas rules for consistency with certain policy directives and suspend, revise, or rescind those rules as appropriate. The March 2017 Executive Order alsodirects rescission of specified guidance, directives, and prior Presidential actions regarding climate change. PPL, LKE, LG&E, rand KU cannot predict the outcome of such regulatory actions or the impact, if any, on plant operations, rate treatment or future ucapital or operating needs.
The U.K. has enacted binding carbon reduction requirements that are applicable to WPD. Under the U.K. law, WPD must purchase carbon allowances to offset emissions associated with WPD's operations. The cost of these allowances is not significant and is included in WPD's current operating expenses.
The EPA's Rules under Section 111 of the Clean Air Act
There continues to be uncertainty around the EPA's regulation of existing coal-fired power plf ants. In 2015 the EPA had finalized rules imposing GHG emission standards for both new and existing power plants and had proposed a federal implementation plan that would apply to any states that failed to submit an acceptable state implementation plan to reduce GHG emissions on a state-by-state basis (the 2015 EPA Rules).
Following legal challenges to the 2015 EPA Rules, a stay of those rules by the U.S. Supreme Court, and the President's March2017 Executive Order (requiring the EPA to review the 2015 EPA Rules), however, in October 2017, the EPA proposed to rescind the 2015 EPA Rules and in December 2017, released an advanced notice of proposed rulemaking for a replacement rule (Replacement Rules) which contemplates GHG reductions based on "inside the fence" measures implemented at individualplants. The contemplated approach in the Replacement Rules is a more limited approach than that taken in the 2015 EPA Rules which had included assumed increased levels of fuel switching and renewable energy in determining the level of emissionreduction required by each state. At present, the 2015 EPA Rules remain stayed and the Replacement Rules have not yet been published.

153
In April 2014, the Kentucky General Assembly passed legislation limiting the measures that the Kentucky Energy and Environment Cabinet may consider in setting performance standards to comply with the 2015 EPA Rules, if enacted. Thelegislation provides that such state GHG performance standards will be based on emission reductions, efficiency measures and other improvements available at each power plant, rather than renewable energy, end-use energy efficiency, fuel switching and re-dispatch. These statutory restrictions are consistent with the EPA's notice of proposed rulemaking on the Replacement Rules.
LG&E and KU are monitoring developments at the state and federal level. Until there is more clarity about the potential requirements that may be imposed under the Replacement Rules and Kentucky's implementation plan, PPL, LKE, LG&E and KU cannot predict the potential impact, if any, on plant operations, future capital or operating costs. PPL, LKE, LG&E and KUbelieve that the costs, which could be significant, would be subject to rate recovery.
Sulfuric Acid Mist Emissions (PPL, LKE and LG&E)
In June 2016, the EPA issued a notice of violation under the Clean Air Act alleging that LG&E violated applicable rules relating to sulfuric acid mist emissions at its Mill Creek plant. The notice alleges failure to install proper controls, failure to operate the facility consistent with good air pollution control practice, and causing emissions exceeding applicable requirements or constituting a nuisance or endangerment. LG&E believes it has complied with applicable regulations during the relevant time period. Discussions between the EPA and LG&E are ongoing. The parties have entered into a tolling agreement with respect tothis matter through December 2018. PPL, LKE and LG&E are unable to predict the outcome of this matter or the potential impact on operations of the Mill Creek plant, including increased capital or operating costs, and potential civil penalties or remedial measures, if any.
Water/Waste
(PPL, LKE, LG&E and KU)
CCRs
In April 2015, the EPA published its final rule regulating CCRs. CCRs include fly ash, bottom ash and sulfur dioxide scrubber wastes. The rule became effective in October 2015. It imposes extensive new requirements, including location restrictions, design and operating standards, groundwater monitoring and corrective action requirements, and closure and post-closure carerequirements on CCR impoundments and landfills that are located on active power plantsff in the United States and not closed.Under the rule, CCRs are regulated as non-hazardous under Subtitle D of RCRA and beneficial use of CCRs is allowed, with some restrictions. The rule's requirements for covered CCR impoundments and landfills include implementation of groundwater monitoring and commencement or completion of closure activities generally between three and ten years from certain triggering events. The rule requires posting of compliance documentation on a publicly accessible website. Industry groups, environmental groups, individual companies and others have filed legal challenges to the final rule, which are pending before the D.C. Circuit Court of Appeals. The EPA has advised the court that it expects to reconsider certain aspects of the CCR Rule in the near future.
In January 2017, Kentucky issued a new state rule relating to CCR matters, effective May 2017, aimed at reflecting therequirements of the federal CCR Rule. In May 2017, a resident adjacent to LG&E's and KU's Trimble County plant filed alawsuit in Franklin County, Kentucky Circuit Court against the Kentucky Energy and Environmental Cabinet and LG&Eseeking to invalidate the new rule. On January 31, 2018, the state court issued an opinion invalidating certain elements of thenew rule. PPL, LKE, LG&E and KU cannot predict the ultimate outcomet of the litigation. LG&E and KU presently operatetheir Trimble County facilities under continuing permits authorized via the formern program and do not currently anticipate material impacts as a result of the challenge to the new rule. Separately, in December 2016, federal legislation was enacted that authorized the EPA to approve equally protective state programs that would operate in lieu of the CCR Rule. The KentuckyEnergy and Environmental Cabinet indicated it may propose rules under such authority in the future.
LG&E and KU received KPSC approval for a compliance plan providing for construction of additional landfill capacity at the E.W. Brown station, closure of impoundments at the Mill Creek, Trimble County, E.W. Brown, and Ghent stations, and construction of process water management facilities at those plants. In addition to the foregoing measures required for compliance with federal CCR rule requirements, KU also received KPSC approval for its plans to close impoundments at theretired Green River, Pineville and Tyrone plants to comply with applicable state law requirements. See Note 6 for additionalinformation.

154
In connection with the final CCR rule, LG&E and KU recorded adjustments to existing AROs during 2015, 2016uu and 2017. See Note 19 for additional information. Further changes to AROs, current capital plans or operating costs may be required as estimates are refined based on closure developments, groundwater monitoring results, and regulatory or legal proceedings.Costs relating to this rule are subject to rate recovery.
Clean Water Act
Regulations under the federal Clean Water Act dictate permitting and mitigation requirements for facilities and construction projects in the United States. Many of those requirements relate to power plant operations, including requirements related to the tttreatment of pollutants in effluents prior to discharge, the temperature of effluent discharges and the location, design and construction of cooling water intake structures at generating facilities, standards intended to protect aquatic organisms that become trapped at or pulled through cooling water intake structures at generating facilities. The requirements could impose significant costs for LG&E and KU, which are subject to rate recovery.
ELGs
In September 2015, the EPA released its final ELGs for wastewater discharge permits for new and existing steam electricgenerating facilities. The rule provides strict technology-based discharge limitations for control of pollutants in scrubber wastewater, fly ash and bottom ash transport water, mercury control wastewater, gasification wastewater and combustion residual leachate. The new guidelines require deployment of additional control technologies providing physical, chemical and biological treatment of wastewaters. The guidelines also mandate operational changes including "no discharge" requirementsfor fly ash and bottom ash transport waters and mercury control wastewaters. The implementation date for individualgenerating stations will be determined by the states on a case-by-case basis according to criteria provided by the EPA. Industry rrgroups, environmental groups, individual companies and others have filed legal challenges to the final rule, which have beenconsolidated before the U.S. Court of Appeals for the Fifth Circuit. In April 2017, the EPA announced that it would grant PPpetitions for reconsideration of the rule. In September 2017, the EPA published in the Federal Register a proposed rule that would postpone the compliance date for requirements relating to bottom ash transport waters and scrubber wastewatersdischarge limits. The EPA expects to complete its reconsideration of best available technology standards by the fall of 2020. fUpon completion of the ongoing regulatory proceedings, the rule will be implemented by the states in the course of their normal permitting activities. LG&E and KU are developing compliance strategies and schedules. PPL, LKE, LG&E and KU are unable to predict the outcome of the EPA's pending reconsideration of the rule or fully estimate compliance costs or timing. Additionally, certain aspects of these compliance plans and estimates relate to developments in state water quality standards,which are separate from the ELG rule or its implementation. Costs to comply with ELGs or other discharge limits, which areexpected to be significant, are subject to rate recovery.
Seepages and Groundwater Infiltration
Seepages or groundwater infiltration have been detected at active and retired wastewater basins and landfills at various LG&E and KU plants. LG&E and KU have completed, or are completing, assessments of seepages or groundwater infiltration at various facilities and have completed, or are working with agencies to implement, further testing, monitoring or abatement measures, where applicable. A range of reasonably possible costs cannot currently be estimated. Depending on the circumstances in each case, certain costs, which may be subject to rate recovery, could be significant.
(All Registrants)
Other Issues
In June 2016, the "Frank Lautenberg Chemical Safety Act" took effect as an amendment to the Toxic Substance Control Act (TSCA). The Act made no changes to the pre-existing TSCA rules as it pertains to polychlorinated biphenyls (PCB). The EPA continues to reassess its PCB regulations as part of the 2010 Advanced Notice of Proposed Rulemaking (ANPRM). The EPA'sANPRM rulemaking is to occur in two phases. Only the second part of the rule, currently scheaa duled for November 2017, is applicable to PPL operations. This part of the rule relates to the use of PCBs in electrical equipment and natural gas pipelines, as well as continued use of PCB-contaminated porous surfaces. Although the first rulemaking will not directly affect the Registrants' operations, it may indicate certain approaches or principles to occur in the later rulemaking which may affect Registrants' facilities in the United States, including phase-out of some or all equipment containing PCBs. Should such a phase-out be required, the costs, which are subject to rate recovery, could be significant.t

155
Superfund and Other Remediation p
PPL Electric is potentially responsible for a share of the costs at several sites listed by the EPA under the federal Superfundprogram, including the Columbia Gas Plant site and the Brodhead site. Clean-up actions have been or are being undertaken at all of these sites, the costs of which have not been, and are not expected to be, significant to PPL Electric.
PPL Electric, LG&E and KU are investigating, responding to agency inquiries, taking various measures, remediating, or havecompleted the remediation of, for several sites that were not addressed under a regulatory program such as Superfund, but for which PPL Electric, LG&E and KU may be liable for remediation. These include a number of former coal gas manufacturing plants in Pennsylvania and Kentucky previously owned or operated or currently owned by predecessors or affiliates of PPL Electric, LG&E and KU. To date, the costs of these sites have not been significant.
There are additional sites, formerly owned or operated by PPL Electric, LG&E and KU predecessors or affiliates. PPL Electric, LG&E and KU lack sufficient information on such additional sites and are therefore unable to estimate any potential liability they may have or a range of reasonably possible losses, if any, related to these matters.
At December 31, 2017, PPL Electric had a recorded liability of $10 million representing its best estimate of the probable loss incurred to remediate the sites noted above. Depending on the outcome of investigations at sites where investigations have not begun or been completed, or developments at sites for which information is incomplete, additional costs of remediation could be incurred; however, such costs are not expected to be significant.
The EPA is evaluating the risks associated with polycyclic aromatic hydrocarbons and naphthalene, chemical by-products of coal gas manufacturing. As a result of the EPA's evaluation, individual states may establish stricter standards for water qualityand soil cleanup. This could require several PPL subsidiaries to take more extensive assessment and remedial actions at former coal gas manufacturing plants. PPL, PPL Electric, LKE, LG&E and KU cannot estimate a range of reasonably possible losses,if any, related to these matters.
From time to time, PPL's subsidiaries in the United States undertake testing, monitoring or remedial action in response to notices of violations, spills or other releases at various on-site and off-site locations, negotiate with the EPA and state and local dagencies regarding actions necessary for compliance with applicable requirements, negotiate with property owners and other third parties alleging impacts from PPL's operations and undertake similar actions necessary toaa resolve environmental mattersthat arise in the course of normal operations. Based on analyses to date, resolution of these environmental matters is not expected to have a significant adverse impact on the operations of PPL Electric, LG&E and KU.
Future cleanup or remediation work at sites under review, or at sites not yet identified, may result in significant additional costsfor PPL, PPL Electric, LKE, LG&E and KU. Insurance policies maintained by LKE, LG&E and KU may be applicable to certain of the costs or other obligations related to these matters but the amount of insurance coverage or reimbursement cannotbe estimated or assured.
Other
Labor Union Agreements g
(PPL and PPL Electric)
In March 2017, members of the IBEW ratified a new five-year labor agreement with PPL. The contract covers nearly 1,400employees and was effective May 22, 2017. The terms of the new labor agreement are not expected to have a significant impact on the financial results of PPL or PPL Electric.
(LKE and KU)
In August 2017, KU and the United Steelworkers of America ratified a three-year labor agreement through August 2020. The agreement covers approximately 54 employees. The terms of the new labor agreement do not have a significant impact on thefinancial results of LKE or KU.
(LKE and LG&E)

156
In November 2017, LG&E and the IBEW ratified a three-year labor agreement through Novembr er 2020. The agreement coversapproximately 671 employees. The terms of the new labor agreement do not have a significant impact on the financial results of LKE or LG&E.
The Registrants cannot predict the outcome of future union labor negotiations.
Guarantees and Other Assurances
(All Registrants)
In the normal course of business, the Registrants enter into agreements that provide financial performance assurance to third parties on behalf of certain subsidiaries. Such agreements include, for example, guarantees, stand-by letters of credit issued by financial institutions and surety bonds issued by insurance companies. These agreements are entered into primarily to support or enhance the creditworthiness attributed to a subsidiary on a stand-alone basis or to facilitate the commercial activities inwhich these subsidiaries engage.
(PPL)
PPL fully and unconditionally guarantees all of the debt securities of PPL Capital Funding. f
(All Registrants)
The table below details guarantees provided as of December 31, 2017. "Exposure" represents the estimated maximum potential amount of future payments that could be required to be made under the guarantee. The probability of expected payment/performance under each of these guarantees is remote except for "WPD guarantee of pension and other obligations of unconsolidated entities" and "Indemnification of lease termination and other divestitures." The total recorded liability at December 31, 2017 was $17 million for PPL and $11 million for LKE. The $11 million recorded at LKE represents the settlement amount related to WKE's excess power matter. See footnote (e) for additional information. The total recorded liability at December 31, 2016 was $22 million for PPL and $17 million for LKE. For reporting purposes, on a consolidated basis, all guarantees of PPL Electric, LKE, LG&E and KU also apply to PPL, and all guarantees of LG&E and KU also applyto LKE.
Exposure atDecember 31,
2017 Expiration
DatePPL Indemnifications related to the WPD Midlands acquisition (a)WPD indemnifications for entities in liquidation and sales of assets $ 11 (b) 2020 WPD guarantee of pension and other obligations of unconsolidated entities 95 (c)
PPL Electric Guarantee of inventory value 16 (d) 2018
LKE Indemnification of lease termination and other divestitures 201 (e) 2021-2023
LG&E and KU LG&E and KU guarantee of shortfall related to OVEC (f)
(a) Indemnifications related to certain liabilities, including a specific unresolved tax issue and those relating to properties and assets owned by the seller that were transferred to WPD Midlands in connection with the acquisition. A cross indemnity has been received from the seller on the tax issue. Themaximum exposure and expiration of these indemnifications cannot be estimated because the maximum potential liability is not capped and the expiration date is not specified in the transaction documents.
(b) Indemnification to the liquidators and certain others for existing liabilities or expenses or liabilities arising during the liquidation process. The indemnifications are limited to distributions made from the subsidiary to its parent either prior or subsequent to liquidation or are not explicitly stated in the agreements. The indemnifications generally expire two to seven years subsequent to the date of dissolution of the entities. The exposure noted only includes those cases where the agreements provide for specific limits.
In connection with their sales of various businesses, WPD and its affiliates have provided the purchasers with indemnifications that are standard for suchtransactions, including indemnifications for certain pre-existing liabilities and environmental and tax matters or have agreed to continue their obligations under existing third-party guarantees, either for a set period of time following the transactions or upon the condition that the purchasers make reasonableefforts to terminate the guarantees. Additionally, WPD and its affiliates remain secondarily responsible for lease payments under certain leases that theyhave assigned to third parties.
(c) Relates to certain obligations of discontinued or modified electric associations that were guaranteed at the time of privatization by the participating members. Costs are allocated to the members and can be reallocated if an existing member becomes insolvent. At December 31, 2017, WPD has recorded an estimated discounted liability for which the expected payment/performance is probable. Neither the expiration date nor the maximum amount of potential payments for certain obligations is explicitly stated in the related agreements, and as a result, the exposure has been estimated.

157
(d) A third party logistics firm provides inventory procurement and fulfillment services. The logistics firm has title to the inventory, however, upon termination of the contracts, PPL Electric has guaranteed to purchase any remaining inventory that has not been used or sold. In January 2018, this agreement was superseded by a new contract which extends the guarantee until 2020.
(e) LKE provides certain indemnifications covering the due and punctual payment, performance and discharge by each party of its respective obligations. The most comprehensive of these guarantees is the LKE guarantee covering operational, regulatory and environmental commitments and indemnifications made by WKE under a 2009 Transaction Termination Agreement. This guarantee has a term of 12 years ending July 2021, and a maximum exposure of $200 million, exclusive of certain items such as government fines and penalties that may exceed the maximum. Another WKE-related LKE guarantee formerly covered other indemnifications related to the purchase price of excess power, had a term expiring in 2023, and amaximum exposure of $100 million, which excess power matter and related indemnifications had been the subject of a dispute and legal proceedingamong the parties. In December 2017, the parties executed settlement agreements which resolved all claims relating to the excess power matter, and terminated such guarantee, for $11 million. Additionally, LKE has indemnified various third parties related to historical obligations for other divested subsidiaries and affiliates. The indemnifications vary by entity and the maximum exposures range from being capped at the sale price to no specified maximum. LKE could be required to perform on these indemnifications in the event of covered losses or liabilities being claimed by an indemnified party. LKE cannot predict the ultimate outcomes of the various indemnification scenarios, but does not expect such outcomes to result in significant losses above the amounts recorded.
(f) Pursuant to the OVEC power purchase contract, LG&E and KU are obligated to pay for their share of OVEC's excess debt service, post-retirement and decommissioning costs, as well as any shortfall from amounts included within a demand charge designed and expected to cover these costs over the term of the contract. LKE's proportionate share of OVEC's outstanding debt was $117 million at December 31, 2017, consisting of LG&E's share of $81 million and KU's share of $36 million. The maximum exposure and the expiration date of these potential obligations are not presently determinable. See"Energy Purchase Commitments" above for additional information on the OVEC power purchase contract. In connection with recent credit market related developments at OVEC or certain of its sponsors, such parties, including LG&E and KU, have allowed implementation of a limited, partial OVECreserve fund for debt costs and are analyzing certain potential additional credit support actions to preserve OVEC's access to credit markets or mitigate risks or adverse impacts relating thereto, including increased interest costs and accelerated maturities of OVEC's existing short and long-term debt. The ultimate outcome of these matters, including any potential impact on LG&E's and KU's obligations relating to OVEC debt under the power purchase contract cannot be predicted.
The Registrants provide other miscellaneous guarantees through contracts entered into in the normal course of business. These guarantees are primarily in the form of indemnification or warranties related to services or equipment and vary in duration. Theamounts of these guarantees often are not explicitly stated, and the overall maximum amount of the obligation under suchguarantees cannot be reasonably estimated. Historically, no significant payments have been made with respect to these types of guarantees and the probability of payment/performance under these guarantees is remote.
PPL, on behalf of itself and certain of its subsidiaries, maintains insurance that covers liability assumed under contract for bodily injury and property damage. The coverage provides maximum aggregate coverage of $225 million. This insurance may be applicable to obligations under certain of these contractual arrangements.
14. Related Party Transactions
PLR Contracts/Purchases of Accounts Receivable (PPL Electric)
PPL Electric holds competitive solicitations for PLR generation supply. PPL EnergyPlus was awarded a portion of the PLR generation supply through these competitive solicitations. The purchases from PPL EnergyPlus are included in PPL Electric's Statements of Income as "Energy purchases from affiliate" through May 31, 2015, the period through which PPL Electric and PPL EnergyPlus were affiliated entities. As a result of the June 1, 2015 spinoff of PPL Energy Supply and creation of TalenEnergy, PPL EnergyPlus (renamed Talen Energy Marketing) is no longer an affiliate of PPL Electric. PPL Electric's purchasesfrom Talen Energy Marketing subsequent to May 31, 2015 are included as purchases from an unaffiliated third party. PPL Electric's customers may choose an alternative supplier for their generation supply. See Note 1 for additional information regarding PPL Electric's purchases of accounts receivable from alternative suppliers, including Talen Energy Marketing. SeeNote 8 for additional information regarding the spinoff of PPL Energy Supply.
Wholesale Sales and Purchases (LG&E and KU)
LG&E and KU jointly dispatch their generation units with the lowest cost generation used to serve their retail customers. When LG&E has excess generation capacity after serving its own retail customers and its generation cost is lower than that of KU,KU purchases electricity from LG&E and vice versa. These transactions are reflected in the Statements of Income as "Electricrevenue from affiliate" and "Energy purchases from affiliate" and are recorded at a price equal to the seller's fuel cost plus anysplit savings. Savings realized from such intercompany transactions are shared equally between both companies. The volume of energy each company has to sell to the other is dependent on its retail customers' needs and its available generation.

158
Support Costs (PPL Electric, LKE, LG&E and KU)
PPL Services, PPL EU Services and LKS provide PPL, PPL Electric and LKE, their respective subsidiaries, including LG&E and KU, and each other with administrative, management and support services. For all service companies, the costs of these services are charged to the respective recipients as direct support costs. General costs that cannot be directly attributed to t a specific entity are allocated and charged to the respective recipients as indirect r support costs. PPL Services and PPL EU Services use a three-factor methodology that includes the applicable recipients' invested capital, operation and maintenance expenses and number of employees to allocate indirect costs. PPL Services may also use a ratio of overall direct and indirect costs. LKS bases its indirect allocations on the subsidiaries' number of employees, total assets, revenues, number of customersand/or other statistical information. PPL Services, PPL EU Services and LKS charged the following amounts for the yearsended December 31, including amounts applied to accounts that are further distributed between capital and expense on thebooks of the recipients, based on methods that are believed to be reasonable.
2017 2016 2015 PPL Electric from PPL Services $ 182 $ 132 $ 125LKE from PPL Services 20 18 16PPL Electric from PPL EU Services 64 69 60LG&E from LKS 169 178 155KU from LKS 190 194 185
In addition to the charges for services noted above, LKS makes payments on behalf of LG&E and KU for fuel purchases and other costs for products or services provided by third parties. LG&E and KU also provide services to each other and to LKS. Billings between LG&E and KU relate to labor and overheads associated with union and hourly employees performing work for the other company, charges related to jointly-owned generating units and other miscellaneous charges. Tax settlements between LKE and LG&E and KU are reimbursed through LKS.
Intercompany Borrowings
(PPL Electric)
PPL Energy Funding maintains a $400 million revolving line of credit with a PPL Electric subsidiary. No balance was Loutstanding at December 31, 2017 and 2016. The interest rates on borrowings are equal to one-month LIBOR plus a spread. Interest income on the revolving line of credit was not significant for 2017, 2016 or 2015.
(LKE)
LKE maintains a revolving line of credit with a PPL Energy Funding subsidiary wherh eby LKE can borrow funds on a short-term basis at market-based rates. In December 2017, the revolving line of credit was increased by $50 million and the limit asof December 31, 2017 was $275 million. The interest rates on borrowings are equal to one-month LIBOR plus a spread. At December 31, 2017 and 2016, $225 million and $163 million were outstanding and reflected in "Notes payable with affiliates"on the Balance Sheets. The interest rate on the outstanding borrowings at December 31, 2017 and 2016 was 2.87% and 2.12%. Interest expense on the revolving line of credit was not significant for 2017, 2016 or 2015.
LKE maintains an agreement with a PPL affiliate that has a $300 million borrowing limit whereby LKE can loan funds on a short-term basis at market-based rates. No balance was outstanding at December 31, 2017 and 2016. The interest rate on the loan based on the PPL affiliates credit rating is currently equal to one-month LIBOR plus a spread. Interest income on this note was not significant for 2017, 2016 or 2015.
LKE maintains a $400 million ten-year-note with a PPL affiliate with an interest rate of 3.5%. At December 31, 2017 and 2016,the note was reflected in "Long-term debt to affiliate" on the Balance Sheets. Interest expense on this note was $14 million for 2017 and 2016 and not significant for 2015.
(LG&E)
LG&E participates in an intercompany money pool agreement whereby LKE and/or KU make available to LG&E funds up to $500 million at an interest rate based on a market index of commercial paper issues. No baf lances were outstanding at December 31, 2017 and 2016. Interest expense incurred on the money pool agreement with KU was not significant for 2017 or 2016. There was no money pool activity with KU in 2015.

159
(KU)
KU participates in an intercompany money pool agreement whereby LKE and/or LG&E make available to KU funds up to$500 million at an interest rate based on a market index of commercial paper issues. No bf alances were outstanding at December 31, 2017 and 2016. Interest income incurred on the money pool agreement with LG&E was not significant for 2017 and 2016. There was no money pool activity with LG&E in 2015.
Intercompany Derivatives (LKE, LG&E and KU)
Periodically, LG&E and KU enter into forward-starting interest rate swaps with PPL. These hedging instruments have termsidentical to forward-starting swaps entered into by PPL with third parties.
Other (PPL Electric, LKE, LG&E and KU)
See Note 1 for discussions regarding the intercompany tax sharing agreement (for PPL Electric, LKE, LG&E and KU) and intercompany allocations of stock-based compensation expense (for PPL Electric and LKE). For PPL Electric, LG&E and KU, see Note 11 for discussions regarding intercompany allocations associated with defined benefits. y
15. Other Income (Expense) - net
(PPL)
The breakdown of "Other Income (Expense) - net" for the years ended December 31, was: 2017 2016 2015
Other Income Economic foreign currency exchange contracts (Note 17) $ (261) $ 384 $ 122Interest income 2 3 4AFUDC - equity component 16 19 14Miscellaneous 17 6 6Total Other Income (226) 412 146
Other Expense Charitable contributions 8 9 21Miscellaneous 21 13 17Total Other Expense 29 22 38
Other Income (Expense) - net $ (255 ) $ 390 $ 108
16. Fair Value Measurements
(All Registrants)
Fair value is the price that would be received to sell an asset or paid to transfer a liability in an orderly transaction between market participants at the measurement date (an exit price). A market approach (generally, data from market transactions), anincome approach (generally, present value techniques and option-pricing models), and/or a cost approach (generally, replacement cost) are used to measure the fair value of an asset or liability, as appropriate. These valuation approaches incorporate inputs such as observable, independent market data and/or unobservable data that management believes are predicated on the assumptions market participants would use to price an asset or liability. These inputs may incorporate, as applicable, certain risks such as nonperformance risk, which includes credit risk. The fair value of a group of financial assets and liabilities is measured on a net basis. Transfers between levels are recognized at end-of-reporting-period values. During d2017 and 2016, there were no transfers between Level 1 and Level 2. See Note 1 for information on the levels in the fair value hierarchy.
Recurring Fair Value Measurements
The assets and liabilities measured at fair value were:

160
December 31, 2017 December 31, 2016 Total Level 1 Level 2 Level 3 Total Level 1 Level 2 Level 3
PPL Assets
Cash and cash equivalents $ 485 $ 485 $ — $ — $ 341 $ 341 $ — $ —Restricted cash and cash equivalents (a) 26 26 — — 26 26 — —Price risk management assets (b):
Foreign currency contracts 163 — 163 — 211 — 211 —Cross-currency swaps 101 — 101 — 188 — 188 —
Total price risk management assets 264 — 264 — 399 — 399 —Total assets $ 775 $ 511 $ 264 $ — $ 766 $ 367 $ 399 $ —
Liabilities
Price risk management liabilities (b): Interest rate swaps $ 26 $ — $ 26 $ — $ 31 $ — $ 31 $ —Foreign currency contracts 148 — 148 — 27 — 27 —
Total price risk management liabilities $ 174 $ — $ 174 $ — $ 58 $ — $ 58 $ —
PPL Electric Assets
Cash and cash equivalents $ 49 $ 49 $ — $ — $ 13 $ 13 $ — $ —Restricted cash and cash equivalents (a) 2 2 — — 2 2 — —
Total assets $ 51 $ 51 $ — $ — $ 15 $ 15 $ — $ —
LKE Assets
Cash and cash equivalents $ 30 $ 30 $ — $ — $ 13 $ 13 $ — $ —Cash collateral posted to counterparties (c) — — — — 3 3 — —
Total assets $ 30 $ 30 $ — $ — $ 16 $ 16 $ — $ —
Liabilities
Price risk management liabilities: Interest rate swaps $ 26 $ — $ 26 $ — $ 31 $ — $ 31 $ —
Total price risk management liabilities $ 26 $ — $ 26 $ — $ 31 $ — $ 31 $ —
LG&E Assets
Cash and cash equivalents $ 15 $ 15 $ — $ — $ 5 $ 5 $ — $ —Cash collateral posted to counterparties (c) — — — — 3 3 — —
Total assets $ 15 $ 15 $ — $ — $ 8 $ 8 $ — $ —
Liabilities Price risk management liabilities:
Interest rate swaps $ 26 $ — $ 26 $ — $ 31 $ — $ 31 $ —Total price risk management liabilities $ 26 $ — $ 26 $ — $ 31 $ — $ 31 $ —
KUAssets
Cash and cash equivalents $ 15 $ 15 $ — $ — $ 7 $ 7 $ — $ —Total assets $ 15 $ 15 $ — $ — $ 7 $ 7 $ — $ —
(a) Current portion is included in "Other current assets" and long-term portion is included in "Other noncurrent assets" on the Balance Sheets. (b) Current portion is included in "Price risk management assets" and "Other current liabilities" and noncurrent portion is included in "Price risk management
assets" and "Other deferred credits and noncurrent liabilities" on the Balance Sheets. (c) Included in "Other noncurrent assets" on the Balance Sheets. Represents cash collateral posted to offset the exposure with counterparties related to certain
interest rate swaps under master netting arrangements that are not offset.

161
Price Risk Management Assets/Liabilities - Interest Rate Swaps/Foreign Currency Contracts/Cross-Currency g p g y ySwaps (PPL, LKE, LG&E and KU)p
To manage interest rate risk, PPL, LKE, LG&E and KU use interest rate contracts such as forward-starting swaps, floating-to-fixed swaps and fixed-to-floating swaps. To manage foreign currency exchange risk, PPL uses foreign currency contracts such as forwards, options, and cross-currency swaps that contain characteristics of both interest rate and foreign currency contracts. An income approach is used to measure the fair value of these contracts, utilizing readily observable inputs, such as forward interest rates (e.g., LIBOR and government security rates) and forward foreign currency exchange rates (e.g., GBP), as well asinputs that may not be observable, such as credit valuation adjustments. In certain cases, market information cannot practicably be obtained to value credit risk and therefore internal models are relied upon. Thesr e models use projected probabilities of default and estimated recovery rates based on historical observances. When the credit valuation adjustment is significant to the overall valuation, the contracts are classified as Level 3.
Nonrecurring Fair Value Measurements (PPL)
See Note 8 for information regarding the estimated fair value of the Supply segment's net assets as of the June 1, 2015 spinoffdate.
Financial Instruments Not Recorded at Fair Value (All Registrants)
The carrying amounts of long-term debt on the Balance Sheets and their estimated fair values are set forth below. The fair values were estimated using an income approach by discounting future cash flows at estimated current cost of funding rates,which incorporate the credit risk of the Registrants. Long-term debt is classified as Level 2. The effd ect of third-party creditffenhancements is not included in the fair value measurement.
December 31, 2017 December 31, 2016 Carrying
Amount (a) Fair Value Carrying
Amount (a) Fair Value PPL $ 20,195 $ 23,783 $ 18,326 $ 21,355PPL Electric 3,298 3,769 2,831 3,148LKE 5,159 5,670 5,065 5,439LG&E 1,709 1,865 1,617 1,710KU 2,328 2,605 2,327 2,514
(a) Amounts are net of debt issuance costs.
The carrying amounts of other current financial instruments (except for long-term debt due within one year) approximate their fair values because of their short-term nature.
17. Derivative Instruments and Hedging Activities
Risk Management Objectives
(All Registrants)
PPL has a risk management policy approved by the Board of Directors to manage market risk associated with commodities, interest rates on debt issuances and foreign exchange (including price, liquidity and volumetric risk) and credit risk (includingnon-performance risk and payment default risk). The Risk Management Committee, comprised of senior management and chaired by the Senior Director-Risk Management, oversees the risk management function. Key risk control activities designed to ensure compliance with the risk policy and detailed programs include, but are not limited to, credit review and approval,validation of transactions, verification of risk and transaction limits, value-at-risk analyses (VaR, a statistical model that attempts to estimate the value of potential loss over a given holding period under normal market conditions at a given confidence level) and the coordination and reporting of the Enterprise Risk Management program.
Market Risk
Market risk includes the potential loss that may be incurred as a result of price changes associated with a particular financial or commodity instrument as well as market liquidity and volumetric risks. Forward contracts, futures contracts, options, swapsttand structured transactions are utilized as part of risk management strategies to minimize unanticipated fluctuations in earnings

162
caused by changes in commodity prices, interest rates and foreign currency exchange rates. Many of these contracts meet thedefinition of a derivative. All derivatives are recognized on the Balance Sheets at their fair value, unless NPNS is elected.
The following summarizes the market risks that affect PPL and its subsidiaries.
Interest Rate Risk
• PPL and its subsidiaries are exposed to interest rate risk associated with forecasted fixed-rate and existing floating-rate debt issuances. PPL and WPD hold over-the-counter cross currency swaps to limit exposure to market fluctuations oninterest and principal payments from changes in foreign currency exchange rates and interest rates. PPL, LKE and LG&E utilize over-the-counter interest rate swaps to limit exposure to market fluctuations on floating-rate debt. PPL, LKE, LG&E and KU utilize forward starting interest rate swaps to hedge changes in benchmark interest rates, when appropriate, in connection with future debt issuances.
• PPL and its subsidiaries are exposed to interest rate risk associated with debt securities and derivatives held by defined benefit plans. This risk is significantly mitigated to the extent that the plans are sponsored at, or sponsored on behalf of, the regulated domestic utilities and for certain plans at WPD due to the recovery methods in place.
Foreign Currency Risk (PPL)
• PPL is exposed to foreign currency exchange risk primarily associated with its investments in and earnings of U.K.affiliates.
(All Registrants)
Commodity Price Risk
PPL is exposed to commodity price risk through its domestic subsidiaries as described below.
• PPL Electric is required to purchase electricity to fulfill its obligation as a PLR. Potential commodity price risk is mitigatedthrough its PUC-approved cost recovery mechanism and full-requirement supply agreements to serve its PLR customerswhich transfer the risk to energy suppliers. k
• LG&E's and KU's rates include certain mechanisms for fuel, fuel-related expenses and energy purchases. In addition, LG&E's rates include a mechanism for natural gas supply expenses. These mechanisms generally provide for timely recovery of market price fluctuations associated with these expenses.
Volumetric Risk
PPL is exposed to volumetric risk through its subsidiaries as described below.
• WPD is exposed to volumetric risk which is significantly mitigated as a result of the method of regulation in the U.K. Under the RIIO-ED1 price control regulations, recovery of such exposure occurs on a two year lag. See Note 1 for additional information on revenue recognition under RIIO-ED1.
• PPL Electric, LG&E and KU are exposed to volumetric risk on retail sales, mainly due to weather and other economicconditions for which there is limited mitigation between rate cases. d
Equity Securities Price Risk
• PPL and its subsidiaries are exposed to equity securities price risk associated with the fair value of the defined benefit plans' assets. This risk is significantly mitigated at the regulated domestic utilities and for certain plans at WPD due to therecovery methods in place.
• PPL is exposed to equity securities price risk from future stock sales and/or purchases. k
Credit Risk
Credit risk is the potential loss that may be incurred due to a counterparty's non-performance.
PPL is exposed to credit risk from "in-the-money" interest rate and foreign currency derivatives with financial institutions, as well as additional credit risk through certain of its subsidiaries, as discussed below.

163
In the event a supplier of PPL Electric, LG&E or KU defaults on its obligation, those Registrants would be required to seek replacement power or replacement fuel in the market. In general, subject to regulatory review or other processes, appropriateincremental costs incurred by these entities would be recoverable from customers through applicable rate mechanisms, thereby mitigating the financial risk for these entities.
PPL and its subsidiaries have credit policies in place to manage credit risk, including the use of an established credit approvalprocess, daily monitoring of counterparty positions and the use of master netting agreements or provisions. These agreements generally include credit mitigation provisions, such as margin, prepayment or collateral requirements. PPL and its subsidiariesmay request additional credit assurance, in certain circumstances, in the event that the counterparties' credit ratings fall belowinvestment grade, their tangible net worth falls below specified percentages or their exposures exceed an established credit limit.
Master Netting Arrangements (PPL, LKE, LG&E and KU)
Net derivative positions on the balance sheets are not offset against the right to reclaim cash collateral (a receivable) or the obligation to return cash collateral (a payable) under master netting arrangements.
PPL had a $20 million and $19 million obligation to return cash collateral under master netting arrangements at December 31, 2017 and 2016.
LKE, LG&E and KU had no obligation to return cash collateral under master netting arrangements at December 31, 2017 and 2016.
PPL, LKE, and LG&E had no cash collateral posted under master netting arrangements at December 31, 2017. PPL, LKE and LG&E posted $3 million of cash collateral under master netting arrangements at December 31, 2016.
KU did not post any cash collateral under master netting arrangements at December 31, 2017 and 2016.
See "Offsetting Derivative Instruments" below for a summary of derivative positions presented in the balance sheets where a right of setoff exists under these arrangements.
Interest Rate Risk
(All Registrants)
PPL and its subsidiaries issue debt to finance their operations, which exposa es them to interest rate risk. A variety of financial derivative instruments are utilized to adjust the mix of fixed and floating interest ratest in their debt portfolios, adjust theduration of the debt portfolios and lock in benchmark interest rates in anticipation of future financing, when appropriate. Risk limits under PPL's risk management program are designed to balance risk exposure to volatility in interest expense and changesin the fair value of the debt portfolio due to changes in benchmark interest rates. In addition, the interest rate risk of certainsubsidiaries is potentially mitigated as a result of the existing regulatory framework or the timing of rate cases.
Cash Flow Hedges (PPL)g
Interest rate risks include exposure to adverse interest rate movements for outstanding variable rate debt and for futureanticipated financings. Financial interest rate swap contracts that qualify as cash flow hedges may be entered into to hedgefloating interest rate risk associated with both existing and anticipated debt issuances. PPL held no such contracts at December 31, 2017.
For 2017, PPL had no hedge ineffectiveness associated withff interest rate derivatives. For 2016 and 2015, hedge ineffectiveness associated with interest rate derivatives was insignificant.
At December 31, 2017, PPL held an aggregate notional value in cross-currency interest rate swap contracts of $702 million that range in maturity from 2021 through 2028 to hedge the interest payments and principal of WPD's U.S. dollar-denominated senior notes. In December 2017, $100 million of WPD’s U.S. dollar-denominated senior notes were repaid upon maturity and $100 million notional value of cross-currency interest rate swap contracts matured. PPL recorded a $19 million gain upon

164
settlement of the cross-currency interest rate swap contracts, which largely offset a loss recorded on the revaluation of U.S. ddollar-denominated senior notes.
Cash flow hedges are discontinued if it is no longer probable that the original forecasted transaction will occur by the end of theforiginally specified time period and any amounts previously recorded in AOCI are reclassified into earnings once it isdetermined that the hedged transaction is not probable of occurring.
PPL had an insignificant amount of cash flow hedges reclassified into earnings associated with discontinued cash flow hedges in 2017 and 2016.
As a result of the June 1, 2015 spinoff of PPL Energy Supply, all PPL cash flow hedges associated with PPL Energy Supplywere ineffective and discontinued and therefore, reclassified into earnings during the second quarter of 2015 and reflected inrdiscontinued operations for 2015. See Note 8 for additional information. PPL had no other cash flow hedges reclassified intoearnings associated with discontinued cash flow hedges in 2015.
At December 31, 2017, the accumulated net unrecognized after-tax gains (losses) on qualifying derivatives expected to be reclassified into earnings during the next 12 months is insignificant. Amounts are reclassified as the hedged interest expense is recorded.
Economic Activity (PPL, LKE and LG&E)y
LG&E enters into interest rate swap contracts that economically hedge interest payments on variable rate debt. Becauserealized gains and losses from the swaps, including terminated swap contracts, are recoverable through regulated rates, anysubsequent changes in fair value of these derivatives are included in regulatory assets or liabilities until they are realized as interest expense. Realized gains and losses are recognized in "Interest Expense" on the Statements of Income at the time theunderlying hedged interest expense is recorded. In December 2016, a swap with a notional amount of $32 million wasterminated. A cash settlement of $9 million was paid on the terminated swap. The settlement is included in noncurrent regulatory assets on the Balance Sheet and in "Cash Flows from Operating Activities" on the Statement of Cash Flows. At December 31, 2017, LG&E held contracts with a notional amount of $147 million that range in maturity through 2033.
Foreign Currency Risk
(PPL)
PPL is exposed to foreign currency risk, primarily through investments in and earnings of U.K. affiliates. PPL has adopted a foreign currency risk management program designed to hedge certain foreign currency exposures, including firm commitments,recognized assets or liabilities, anticipated transactions and net investments. In addition, PPL enters into financial instrumen nts to protect against foreign currency translation risk of expected GBP earnings.
Net Investment Hedgesg
PPL enters into foreign currency contracts on behalf of a subsidiary to protect the value of a portion of its net investment inWPD. There were no contracts outstanding at December 31, 2017.
At December 31, 2017 and 2016, PPL had $22 million and $21 million of accumulated net investment hedge after tax gains (losses) that were included in the foreign currency translation adjustment component of AOCI.
Economic Activityy
PPL enters into foreign currency contracts on behalf of a subsidiary to economically hedgeu GBP-denominated anticipated earnings. At December 31, 2017, the total exposure hedged by PPL was approximately £2.6 billion (approximately $3.5 billion based on contracted rates). These contracts had termination dates ranging from January 2018 through June 2020.
In the third quarter of 2016, PPL settled foreign currency hedges related to 2017 and 2018 anticipated earnings, resulting in receipt of $310 million of cash and entered into new hedges at current market rates. The notional amount of the settled hedges was approximately £1.3 billion (approximately $2.0 billion based on contracted rates) with termination dates from January2017 through November 2018. The settlement did not have a significant impact on net income as the hedge values were previously marked to fair value and recognized in "Other Income (Expense) - net" on the Statement of Income.

165
Accounting and Reporting
(All Registrants)
All derivative instruments are recorded at fair value on the Balance Sheet as an asset or liability unless NPNS is elected. NPNS contracts for PPL and PPL Electric include certain full-requirement purchase contracts and other physical purchase contracts. Changes in the fair value of derivatives not designated as NPNS are recognized in earnings unless specific hedge accountingcriteria are met and designated as such, except for the changes in fair values of LG&E's interest rate swaps that are recognized as regulatory assets or regulatory liabilities. See Note 6 for amounts recorded in regulatory assets and regulatory liabilities at December 31, 2017 and 2016.
See Note 1 for additional information on accounting policies related to derivative instruments.
(PPL)
The following table presents the fair value and location of derivative instruments recorded on the Balance Sheets.
December 31, 2017 December 31, 2016 Derivatives designated
as hedging instruments
Derivatives notdesignated
as hedging instruments
Derivatives designated as
hedging instruments
Derivatives notdesignated
as hedging instrumentsAssets Liabilities Assets Liabilities Assets Liabilities Assets Liabilities
Current: Price Risk Management
Assets/Liabilities (a): Interest rate swaps (b) $ — $ — $ — $ 4 $ — $ — $ — $ 4Cross-currency swaps (b) 4 — — — 32 — — —Foreign currency contracts — — 45 67 — — 31 21
Total current 4 — 45 71 32 — 31 25NNoncurrent:
Price Risk Management Assets/Liabilities (a):
Interest rate swaps (b) — — — 22 — — — 27Cross-currency swaps (b) 97 — — — 156 — — ——Foreign currency contracts — — 118 81 — — 180 6
Total noncurrent 97 — 118 103 156 — 180 33Total derivatives $ 101 $ — $ 163 $ 174 $ 188 $ — $ 211 $ 58
(a) Current portion is included in "Price risk management assets" and "Other current liabilities" and noncurrent portion is included in "Price risk management assets" and "Other deferred credits and noncurrent liabilities" on the Balance Sheets.
(b) Excludes accrued interest, if applicable.
The following tables present the pre-tax effect of derivative instruments recognized in income, OCI or regulatory assets and regulatory liabilities.
Derivative Relationships
Derivative Gain (Loss) Recognized in
OCI (Effective Portion)
Location of Gain (Loss) Recognized in Income
on Derivative
Gain (Loss) Reclassified from AOCI into Income
(Effective Portion)
Gain (Loss) Recognizedin Income on Derivative(Ineffective Portion andAmount Excluded from Effectiveness Testing)
2017 Cash Flow Hedges:
Interest rate swaps $ — Interest Expense $ (9) $ —Cross-currency swaps (98 ) Other Income (Expense) - net (82) —
Total $ (98) $ (91) $ —Net Investment Hedges:
Foreign currency contracts $ 1
2016
Cash Flow Hedges:
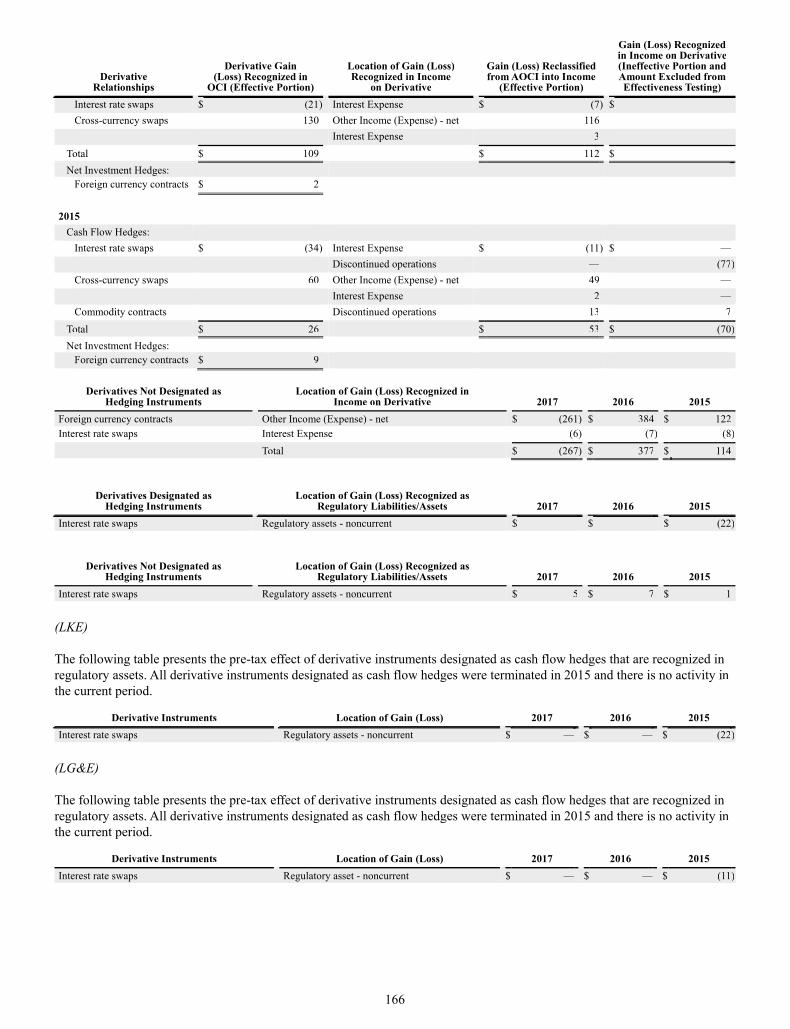
166
Derivative Relationships
Derivative Gain (Loss) Recognized in
OCI (Effective Portion)
Location of Gain (Loss) Recognized in Income
on Derivative
Gain (Loss) Reclassified from AOCI into Income
(Effective Portion)
Gain (Loss) Recognizedin Income on Derivative(Ineffective Portion andAmount Excluded from Effectiveness Testing)
Interest rate swaps $ (21) Interest Expense $ (7) $ —Cross-currency swaps 130 Other Income (Expense) - net 116 —
Interest Expense 3 —Total $ 109 $ 112 $ —NNet Investment Hedges:
Foreign currency contracts $ 2 2015
Cash Flow Hedges: Interest rate swaps $ (34 ) Interest Expense $ (11) $ —
Discontinued operations — (77) Cross-currency swaps 60 Other Income (Expense) - net 49 —
Interest Expense 2 —Commodity contracts Discontinued operations 13 7
Total $ 26 $ 53 $ (70) Net Investment Hedges:
Foreign currency contracts $ 9
Derivatives Not Designated as Hedging Instruments
Location of Gain (Loss) Recognized in Income on Derivative 2017 2016 2015
Foreign currency contracts Other Income (Expense) - net $ (261) $ 384 $ 122Interest rate swaps Interest Expense (6) (7) (8)
Total $ (267) $ 377 $ 114
Derivatives Designated asHedging Instruments
Location of Gain (Loss) Recognized asRegulatory Liabilities/Assets 2017 2016 2015
Interest rate swaps Regulatory assets - noncurrent $ — $ — $ (22)
Derivatives Not Designated as Hedging Instruments
Location of Gain (Loss) Recognized asRegulatory Liabilities/Assets 2017 2016 2015
Interest rate swaps Regulatory assets - noncurrent $ 5 $ 7 $ 1
(LKE)
The following table presents the pre-tax effect of derivative instruments designated as cash flow hedges that are recognized inregulatory assets. All derivative instruments designated as cash flow hedges were terminated in 2015 and there is no activity in the current period.
Derivative Instruments Location of Gain (Loss) 2017 2016 2015 Interest rate swaps Regulatory assets - noncurrent $ — $ — $ (22)
(LG&E)
The following table presents the pre-tax effect of derivative instruments designated as cash flow hedges that are recognized inregulatory assets. All derivative instruments designated as cash flow hedges were terminated in 2015 and there is no activity in the current period.
Derivative Instruments Location of Gain (Loss) 2017 2016 2015 Interest rate swaps Regulatory asset - noncurrent $ — $ — $ (11)

167
(KU)
The following table presents the pre-tax effect of derivative instruments designated as cash flow hedges that are recognized inregulatory assets. All derivative instruments designated as cash flow hedges were terminated in 2015 and there is no activity inthe current period.
Derivative Instruments Location of Gain (Loss) 2017 2016 2015 Interest rate swaps Regulatory assets - noncurrent $ — $ — $ (11)
(LKE and LG&E)
The following table presents the fair value and the location on the Balance Sheets of derivatives not designated as hedginginstruments.
December 31, 2017 December 31, 2016
Assets Liabilities Assets LiabilitiesCurrent:
Price Risk Management Assets/Liabilities:
Interest rate swaps $ — $ 4 $ — $ 4Total current — 4 — 4
NNoncurrent:Price Risk Management
Assets/Liabilities:Interest rate swaps — 22 — 27
Total noncurrent — 22 — 27Total derivatives $ — $ 26 $ — $ 31
The following tables present the pre-tax effect of derivatives not designated as cash flow hedges that are recognized in incomeor regulatory assets.
Derivative Instruments Location of Gain (Loss) 2017 2016 2015 Interest rate swaps Interest Expense $ (6) $ (7) $ (8)
Derivative Instruments Location of Gain (Loss) 2017 2016 2015 Interest rate swaps Regulatory assets - noncurrent $ 5 $ 7 $ 1
(PPL, LKE, LG&E and KU)
Offsetting Derivative Instruments
PPL, LKE, LG&E and KU or certain of their subsidiaries have master netting arrangements in place and also enter into agreements pursuant to which they purchase or sell certain energy and other products. Under the agreements, upon termination of the agreement as a result of a default or other termination event, the non-defaulting party typically would have a right to set off amounts owed under the agreement against any other obligations arising between the two parties (whether under the agreement or not), whether matured or contingent and irrespective of the currency, place of payment or place of booking of the obligation.
PPL, LKE, LG&E and KU have elected not to offset derivative assets and liabilities and not to offset net derivative positions against the right to reclaim cash collateral pledged (an asset) or the obligation to return cash collateral received (a liability)under derivatives agreements. The table below summarizes the derivative positions presented in the balance sheets where aright of setoff exists under these arrangements and related cash collateral received or pledged.

168
Assets Liabilities
Eligible for Offset Eligible for Offset
Gross Derivative
Instruments
CashCollateralReceived Net Gross
Derivative Instruments
Cash CollateralPledged Net
Treasury Derivativesy PPL $ 264 $ 107 $ 20 $ 137 $ 174 $ 107 $ — $ 67LKE — — — — 26 — — 26LG&E — — — — 26 — — 26
December 31, 2016 , Treasury Derivativesy
PPL $ 399 $ 27 $ 19 $ 353 $ 58 $ 27 $ 3 $ 28LKE — — — — 31 — 3 28LG&E — — — — 31 — 3 28
Credit Risk-Related Contingent Features
Certain derivative contracts contain credit risk-related contingent features, which when in a net liability position, would permit rrthe counterparties to require the transfer of additional collateral upon a decrease in r the credit ratings of PPL, LKE, LG&E andKU or certain of their subsidiaries. Most of these features would require the transfer of additional collateral or permit thecounterparty to terminate the contract if the applicable credit rating were to fall below investment grade. Some of these featuresuualso would allow the counterparty to require additional collateral upon each downgrade in credit rating at levels that remain above investment grade. In either case, if the applicable credit rating were to fall below investment grade, and assuming no assignment to an investment grade affiliate were allowed, most of these credit contingent features require either immediate payment of the net liability as a termination payment or immediate and ongoing full collateralization on derivative instrumentsin net liability positions.
Additionally, certain derivative contracts contain credit risk-related contingent features that require adequate assurance of performance be provided if the other party has reasonable concerns regarding the performance of PPL's, LKE's, LG&E's and ttKU's obligations under the contracts. A counterparty demanding adequate assurance could require a transfer of additionalcollateral or other security, including letters of credit, cash and guarantees from a creditworthy entity. This would typicallyinvolve negotiations among the parties. However, amounts disclosed below represent assumed immediate payment or immediate and ongoing full collateralization for derivative instruments in net liability positions with "adequate assurance"features.
(PPL, LKE and LG&E)
At December 31, 2017, derivative contracts in a net liability position that contain credit risk-related contingent features,collateral posted on those positions and the related effect of a decrease in credit ratings below investment grade are summarizt ed as follows:
PPL LKE LG&EAggregate fair value of derivative instruments in a net liability position with credit risk-related contingent features $ 51 $ 10 $ 10Aggregate fair value of collateral posted on these derivative instruments — — —Aggregate fair value of additional collateral requirements in the event of a credit downgrade below investment grade (a) 51 10 10
(a) Includes the effect of net receivables and payables already recorded on the Balance Sheet.
18. Goodwill and Other Intangible Assets
Goodwill
(PPL)
The changes in the carrying amount of goodwill by segment were:
December 31, 2017 ,

169
U.K. Regulated Kentucky Regulated Total2017 2016 2017 2016 2017 2016
Balance at beginning of period (a) $ 2,398 $ 2,888 $ 662 $ 662 $ 3,060 $ 3,550Effect of foreign currency exchange rates 198 (490) 198 (490)
Balance at end of period (a) $ 2,596 $ 2,398 $ 662 $ 662 $ 3,258 $ 3,060
(a) There were no accumulated impairment losses related to goodwill.
Other Intangible Assets
(PPL)
The gross carrying amount and the accumulated amortization of other intangible assets were:
December 31, 2017 December 31, 2016 Gross
Carrying Amount
Accumulated Amortization
Gross Carrying Amount
Accumulated Amortization
Subject to amortization:Contracts (a) $ 138 $ 67 $ 405 $ 325Land and transmission rights 382 120 362 115Emission allowances/RECs (b) 1 — 2 —Licenses and other 7 3 6 2
Total subject to amortization 528 190 775 442
Not subject to amortization due to indefinite life:
Land and transmission rights 12 — 19 —Easements 347 — 348 —
Total not subject to amortization due to indefinite life 359 — 367 —
Total $ 887 $ 190 $ 1,142 $ 442
(a) Gross carrying amount in 2017 and 2016 includes the fair value at the acquisition date of the OVEC power purchase contract with terms favorable tomarket recognized as a result of the 2010 acquisition of LKE by PPL. Gross carrying amount in 2016 also includes the fair value at the acquisition date of coal contracts with terms favorable to market recognized as a result of the 2010 acquisition of LKE by PPL. At December 31, 2016, these coal contractswere fully amortized. Offsetting regulatory liabilities were recorded related to these contracts, which are being amortized over the same period as theintangible assets, eliminating any income statement impact. This is referred to as "regulatory offset" in the tables below. See Note 6 for additional information.
(b) Emission allowances/RECs are expensed when consumed or sold; therefore, there is no accumulated amortization.
Current intangible assets are included in "Other current assets" and long-term intangible assets arem included in "Other intangibles" on the Balance Sheets.
Amortization Expense was as follows: 2017 2016 2015
Intangible assets with no regulatory offset $ 6 $ 6 $ 6Intangible assets with regulatory offset 9 24 51
Total $ 15 $ 30 $ 57
Amortization expense for each of the next five years, excluding insignificant amounts for consumption of emission allowances/RECs, is estimated to be:
2018 2019 2020 2021 2022 Intangible assets with no regulatory offset $ 6 $ 6 $ 6 $ 6 $ 6Intangible assets with regulatory offset 9 9 8 8 8
Total $ 15 $ 15 $ 14 $ 14 $ 14

170
(PPL Electric)
The gross carrying amount and the accumulated amortization of other intangible assets were:
December 31, 2017 December 31, 2016 Gross
Carrying Amount
Accumulated Amortization
Gross Carrying Amount
Accumulated Amortization
Subject to amortization:Land and transmission rights $ 361 $ 117 $ 341 $ 112Licenses and other 3 1 3 1
Total subject to amortization 364 118 344 113
Not subject to amortization due to indefinite life:
Land and transmission rights 13 — 20 —
Total $ 377 $ 118 $ 364 $ 113
Intangible assets are shown as "Intangibles" on the Balance Sheets.
Amortization expense was insignificant in 2017, 2016 and 2015 and is expected to be insignificant in future years.
(LKE)
The gross carrying amount and the accumulated amortization of other intangible assets were:
December 31, 2017 December 31, 2016 Gross
Carrying Amount
Accumulated Amortization
Gross Carrying Amount
Accumulated Amortization
Subject to amortization:Coal contracts (a) $ — $ — $ 269 $ 269Land and transmission rights 21 3 21 3OVEC power purchase agreement (b) 126 58 126 49
Total subject to amortization $ 147 $ 61 $ 416 $ 321
(a) Gross carrying amount represents the fair value at the acquisition date of coal contracts with terms favorable to market recognized as a result of the 2010acquisition by PPL. An offsetting regulatory liability was recorded related to these contracts, which was amortized over the same period as the intangible asset, eliminating any income statement impact.
(b) Gross carrying amount represents the fair value at the acquisition date of the OVEC power purchase contract recognized as a result of the 2010acquisition by PPL. An offsetting regulatory liability was recorded related to this contract, which is being amortized over the same period as the intangible asset, eliminating any income statement impact. See Note 6 for additional information.
Long-term intangible assets are presented as "Other intangibles" on the Balance Sheets.
Amortization expense was as follows:
2017 2016 2015 Intangible assets with no regulatory offset $ — $ 1 $ —Intangible assets with regulatory offset 9 24 51
Total $ 9 $ 25 $ 51
Amortization expense for each of the next five years is estimated to be:
2018 2019 2020 2021 2022 Intangible assets with regulatory offset $ 9 $ 9 $ 8 $ 8 $ 8

171
(LG&E)
The gross carrying amount and the accumulated amortization of other intangible assets were:
December 31, 2017 December 31, 2016 Gross
Carrying Amount
Accumulated Amortization
Gross Carrying Amount
Accumulated Amortization
Subject to amortization:Coal contracts (a) $ — $ — $ 124 $ 124Land and transmission rights 7 1 7 1OVEC power purchase agreement (b) 87 40 87 34
Total subject to amortization $ 94 $ 41 $ 218 $ 159
(a) Gross carrying amount represents the fair value at the acquisition date of coal contracts with terms favorable to market recognized as a result of the 2010acquisition by PPL. An offsetting regulatory liability was recorded related to these contracts, which was amortized over the same period as the intangible asset, eliminating any income statement impact.
(b) Gross carrying amount represents the fair value at the acquisition date of the OVEC power purchase contract recognized as a result of the 2010acquisition by PPL. An offsetting regulatory liability was recorded related to this contract, which is being amortized over the same period as the intangible asset, eliminating any income statement impact. See Note 6 for additional information.
Long-term intangible assets are presented as "Other intangibles" on the Balance Sheets.
Amortization expense was as follows:
2017 2016 2015 Intangible assets with regulatory offset $ 6 $ 13 $ 24
Amortization expense for each of the next five years is estimated to be:
2018 2019 2020 2021 2022 Intangible assets with regulatory offset $ 6 $ 6 $ 6 $ 6 $ 6
(KU)
The gross carrying amount and the accumulated amortization of other intangible assets were:
December 31, 2017 December 31, 2016 Gross
Carrying Amount
Accumulated Amortization
Gross Carrying Amount
Accumulated Amortization
Subject to amortization:Coal contracts (a) $ — $ — $ 145 $ 145Land and transmission rights 14 2 14 2OVEC power purchase agreement (b) 39 18 39 15
Total subject to amortization $ 53 $ 20 $ 198 $ 162
(a) Gross carrying amount represents the fair value at the acquisition date of coal contracts with terms favorable to market recognized as a result of the 2010acquisition by PPL. An offsetting regulatory liability was recorded related to these contracts, which was amortized over the same period as the intangible asset, eliminating any income statement impact.
(b) Gross carrying amount represents the fair value at the acquisition date of the OVEC power purchase contract recognized as a result of the 2010acquisition by PPL. An offsetting regulatory liability was recorded related to this contract, which is being amortized over the same period as the intangible asset, eliminating any income statement impact. See Note 6 for additional information.
Long-term intangible assets are presented as "Other intangibles" on the Balance Sheets.
Amortization expense was as follows:
2017 2016 2015 Intangible assets with no regulatory offset $ — $ 1 $ —Intangible assets with regulatory offset 3 11 27
Total $ 3 $ 12 $ 27

172
Amortization expense for each of the next five years is estimated to be:
2018 2019 2020 2021 2022 Intangible assets with regulatory offset $ 3 $ 3 $ 2 $ 2 $ 2
19. Asset Retirement Obligations
(PPL)
WPD has recorded conditional AROs required by U.K. law related to treated wood poles, gas-filled switchgear and fluid-filled cables.
(PPL and PPL Electric)
PPL Electric has identified legal retirement obligations for the retirement of certain transmission assets that could not bereasonably estimated due to indeterminable settlement dates. These assets are located on rights-of-way that allow the grantor torequire PPL Electric to relocate or remove the assets. Since this option is at the discretion of the grantor of the right-of-way,aaPPL Electric is unable to determine when these events may occur.
(PPL, LKE, LG&E and KU)
LG&E's and KU's AROs are primarily related to the final retirement of assets associated with generating units. LG&E also has AROs related to natural gas mains and wells. LG&E's and KU's transmission and distribution lines largely operate under perpetual property easement agreements, which do not generally require restoration upon removal of the property. Therefore, no material AROs are recorded for transmission and distribution assets. As described in Notes 1 and 6, for LKE, LG&E and KU, all ARO accretion and depreciation expenses are reclassified as a regulatory asset. ARO regulatory assets associated with ffcertain CCR projects are amortized to expense in accordance with regulatory approvals. For other AROs, at the time of retirement, the related ARO regulatory asset is offset against the associated cost of removal regulatory liability, PP&E and ARO liability.
The changes in the carrying amounts of AROs were as follows:
PPL LKE LG&E KU2017 2016 2017 2016 2017 2016 2017 2016
ARO at beginning of period $ 488 $ 586 $ 433 $ 535 $ 145 $ 175 $ 288 $ 360Accretion 21 24 20 22 7 7 13 15Changes in estimated timing or cost (a) (73) (84) (54) (95) (8) (19) (46) (76) Effect of foreign currency exchange rates 4 (9) — — — — — —Obligations settled (43) (29) (43) (29) (23) (18) (20) (11)
ARO at end of period $ 397 $ 488 $ 356 $ 433 $ 121 $ 145 $ 235 $ 288
(a) LKE recorded decreases of $60 million ($52 million at KU and $8 million at LG&E) and $114 million ($90 million at KU and $24 million at LG&E) tothe existing AROs during 2017 and 2016 related to the closure of CCR impoundments. These revisions are the result of changes in closure plans related to expected costs and timing of closures. Further changes to AROs, capital plans or operating costs may be required as estimates of future cash flows are refined based on closure developments and regulatory or legal proceedings.
See Note 13 for information on the final CCR rule and Note 6 for information on the rate recovery applications.
20. Accumulated Other Comprehensive Income (Loss)
(PPL and LKE)
The after-tax changes in AOCI by component for the years ended December 31 were as follows:

173
Unrealized gains (losses) Defined benefit plans Foreign currency
translationadjustments
Available- for-sale
securities Qualifying derivatives
Equity investees'
AOCI
Prior service costs
Actuarialgain (loss) Total
PPL December 31, 2014 $ (286) $ 201 $ 20 $ 1 $ 3 $ (2,213) $ (2,274) Amounts arising during the year (234) 8 26 — (9 ) (366) (575) Reclassifications from AOCI — (2) 2 (1) — 146 145Net OCI during the year (234) 6 28 (1) (9 ) (220) (430) Distribution of PPL EnergySupply (See Note 8) — (207) (55) — — 238 (24)
December 31, 2015 $ (520) $ — $ (7) $ — $ (6 ) $ (2,195) $ (2,728)
Amounts arising during the year (1,107) — 91 — (3 ) (61) (1,080) Reclassifications from AOCI — — (91) (1) 1 121 30Net OCI during the year (1,107) — — (1) (2 ) 60 (1,050) December 31, 2016 $ (1,627) $ — $ (7) $ (1) $ (8) $ (2,135) $ (3,778)
Amounts arising during the year 538 — (79) — — (308) 151Reclassifications from AOCI — — 73 1 1 130 205NNet OCI during the year 538 — (6) 1 1 (178) 356December 31, 2017 $ (1,089) $ — $ (13) $ — $ (7 ) $ (2,313) $ (3,422)
LKE
December 31, 2014 $ — $ (8) $ (37) $ (45)
Amounts arising during the year — (3 ) (4) (7)
Reclassifications from AOCI — 1 5 6
Net OCI during the year — (2 ) 1 (1)
December 31, 2015 $ — $ (10) $ (36) $ (46)
Amounts arising during the year — — (27) (27)
Reclassifications from AOCI (1) 2 2 3
NNet OCI during the year (1) 2 (25) (24)
December 31, 2016 $ (1) $ (8 ) $ (61) $ (70)
Amounts arising during the year — (2 ) (23) (25)
Reclassifications from AOCI 1 1 5 7
Net OCI during the year 1 (1 ) (18) (18)
December 31, 2017 $ — $ (9) $ (79) $ (88)
The following table presents PPL's gains (losses) and related income taxes for reclassifications from AOCI for the years ended December 31, 2017, 2016 and 2015. LKE amounts are insignificant for the years ended December 31, 2017, 2016 and 2015. The defined benefit plan components of AOCI are not reflected in their entirety in the statement of income; rather, they are included in the computation of net periodic defined benefit costs (credits) and subject to capitalization. See Note 11 for additional information.
PPL
Details about AOCI 2017 2016 2015 Affected Line Item on the
Statements of IncomeAvailable-for-sale securities $ — $ — $ 4 Other Income (Expense) - net Total Pre-tax — — 4 Income Taxes — — (2) Total After-tax — — 2 Qualifying derivatives

174
PPL
Details about AOCI 2017 2016 2015 Affected Line Item on the
Statements of IncomeInterest rate swaps (9) (7) (11) Interest Expense
— — (77) Discontinued operations Cross-currency swaps (82) 116 49 Other Income (Expense) - net
— 3 2 Interest ExpenseCommodity contracts — — 20 Discontinued operations
Total Pre-tax (91) 112 (17) Income Taxes 18 (21) 15
Total After-tax (73) 91 (2)
Equity Investees' AOCI (1) 1 1 Other Income (Expense) - net Total Pre-tax (1) 1 1Income Taxes — — — Total After-tax (1) 1 1
Defined benefit plans
Prior service costs (2) (2) — NNet actuarial loss (167) (156) (192)
Total Pre-tax (169) (158) (192) Income Taxes 38 36 46Total After-tax (131) (122) (146)
Total reclassifications during the year $ (205) $ (30) $ (145)
21. New Accounting Guidance Pending Adoption
(All Registrants)
Accounting for Revenue from Contracts with Customersg
In May 2014, the Financial Accounting Standards Board (FASB) issued accounting guidance that establishes a comprehensive new model for the recognition of revenue from contracts with customers. This model is based on the core principle that revenueshould be recognized to depict the transfer of promised goods or services to customers in an amount that reflects the consideration to which the entity expects to be entitled in exchange for those goods or services.
The Registrants have completed an assessment of their revenue under this new guidance and have determined it will not have a material impact on their current revenue recognition policies. The Registrants' operating revenues are derived primarily from tariff-based sales that result from providing electricity and natural gas to customers with no defined contractual term. Tariff-ffbased sales are within the scope of the new guidance, and operating revenues under the new guidance will be equivalent to theelectricity and natural gas delivered and billed in that period (including estimated billings), which is consistent with currenh t nnpractice.
The disclosure requirements included in the standard will result in increased information being provided to enable the users ofthe financial statements to understand the nature, amount, timing and uncertainty of revenue arising from contracts with customers. The Registrants will include disaggregation of revenues by geographic location, customer class or type of service, as applicable. Some revenue arrangements, including alternative revenue programs and lease income, are excluded from the scope of the new guidance and will be accounted for and disclosed separately from revenues from contracts with customers. TheRegistrants will also disclose the opening and closing balances of accounts receivable and any contract assets or contract liabilities resulting from contracts with customers.
The Registrants adopted this guidance effective January 1, 2018 using the modified retrospective transition method.
Accounting for Leasesg
In February 2016, the FASB issued accounting guidance for leases. This new guidance requires lessees to recognize a right-of-use asset and a lease liability for virtually all of their leases (other than leases that meet the definition of a short-term lease). For income statement purposes, the FASB retained a dual model for lessees, requiring leases to be classified as either operating or

175
finance. Operating leases will result in straight-line expense (similar to current operating leases) while finance leases will result in a front-loaded expense pattern (similar to current capital leases). Classification wr ill be based on criteria that are largely lsimilar to those applied in current lease accounting, but without explicit bright line tests.
Lessor accounting under the new guidance is similar to the current model, but updated to align with certain changes to thelessee model and the new revenue recognition standard. Similar to current practice, lessors will classify leases as operating,direct financing, or sales-type.
The standard is effective for public business entities for fiscal years, and interim periods within those fiscal years, beginning after December 15, 2018. Early adoption is permitted. The new standard must be adopted using a modified retrospective transition, and provides for certain practical expedients. One of these practical expedients allows entities to elect to not evaluate land easements as leases that exist or expired before the adoption date and were not previously accounted for as leases under current lease guidance. Transition will require application of the new guidance at the beginning of the earliest comparative period presented.
The Registrants are currently assessing the impact of adopting this guidance. The Registrants will adopt this guidance effective January 1, 2019.
Accounting for Financial Instrument Credit Losses g
In June 2016, the FASB issued accounting guidance that requires the use of a current expected credit loss (CECL) model for the measurement of credit losses on financial instruments within the scope of this guidance, which includes accounts receivable.The CECL model requires an entity to measure credit losses using historical information, current information and reasonable and supportable forecasts of future events, rather than the incurred loss impairment model required under current GAAP.
For public business entities, this guidance will be applied using a modified retrospective approach and is effective for fiscalyears beginning after December 15, 2019, and interim periods within those years. All entities may early adopt this guidance beginning after December 15, 2018, including interim periods within those years.
The Registrants are currently assessing the impact of adopting this guidance and the period they will adopt it.
Presentation of Net Periodic Pension Cost and Net Periodic Postretirement Benefit Cost
In March 2017, the FASB issued accounting guidance that changes the income statement presentation of net periodic benefit cost. This new guidance requires the service cost component to be disaggregated from other components of net benefit cost and presented in the same income statement line items as other employee compensation costs arisingmm from services rendered during the period. The other components of net periodic benefits will be presented separately from the line items that include the service cost and outside of any subtotal of operating income. Only the service cost component is eligible for capitalization. y
For public business entities, the guidance on the presentation of the components of net periodic benefit costs will be applied retrospectively. The guidance that limits the capitalization to the service cost component of net periodic benefit costs will be applied prospectively. This guidance is effective for fiscal years beginning after December 15, 2017 and interim periods withinthose years. The Registrants adopted this guidance effective January 1, 2018.
For PPL’s, LKE’s and LG&E’s U.S. defined benefit pension and PPL's and LKE's other postretirement benefit plans, the adoption of this new guidance is not expected to have a material impact on either the presentation on the income statements or aathe amounts capitalized and related impact to expense, as the difference between the service cost and the non-service cost components of net periodic benefit costs has not historically been and is not expected to be material in 2018. y
For PPL’s U.K. defined benefit pension plans, the non-service cost components of net periodic benefit cost has been in a net-tcredit position for the current reporting periods and is expected to continue to be in a net-credit position for 2018. Therefore, the estimated impact of adopting this new guidance related to the non-service cost component credits to be reclassified from “Other operation and maintenance” to “Other Income (Expense)-net” on the Statements of Income is approximately $175 million and $120 million for the years ended 2017 and 2016.
The Registrants are finalizing the expected 2018 impacts of adopting the guidance as the amounts are affected by market conditions and assumptions selected at December 31, 2017.

176
In August 2017, the FASB issued accounting guidance that reduces complexity when applying hedge accounting as well as improves transparency about an entity's risk management activities. This guidance eliminates recognizing hedge ineffectivenessfor cash flow and net investment hedges and provides for the ability to perform subsequent effectiveness assessments qualitatively. The guidance also makes certain changes to allowable methodologies such as allowing entities to apply the short-cut method to partial-term fair value hedges of interest rate risk as well as expands the ability to apply the critical terms match method to cash flow hedges of groups of forecasted transactions. The guidance also updates certain recognition and presentation requirements as well as disclosure requirements.
For public business entities, this guidance is effective for fiscal years, and interim periods within those fiscal years, beginning after December 15, 2018. Early adoption is permitted. This standard must be adopted using a modified retrospective approach and provides for certain transition elections that must be made prior to the first effectiveness testing date after adoption.
The Registrants are currently assessing the impact of adopting this guidance and the period they will adopt it.
(PPL, LKE, LG&E and KU)
Simplifying the Test for Goodwill Impairment p y g p
In January 2017, the FASB issued accounting guidance that simplifies the test for goodwill impairment by eliminating thesecond step of the quantitative test. The second step of the quantitative test requires a calculation of the implied fair value of goodwill, which is determined in the same manner as the amount of goodwill in a business combination. Under this new guidance, an entity will now compare the estimated fair value of a reporting unit with its carrying value and recognize an impairment charge for the amount the carrying amount exceeds the fair value of the reporting unit. t
For public business entities, this guidance will be applied prospectively and is effective for annual or any interim goodwill impairment tests for fiscal years beginning after December 15, 2019. All entities may early adopt this guidance for interim or annual goodwill impairment tests performed on testing dates after January 1, 2017. d
The Registrants are currently assessing the impact of adopting this guidance and the period they will adopt it.
(PPL and LKE)
Reclassification of Certain Tax Effects from Accumulated Other Comprehensive Income p
In February 2018, the FASB issued accounting guidance that gives entities the option to reclassify tax effects stranded withinAOCI as a result of the TCJA to retained earnings. The reclassification applies only torr those stranded tax effects arising fromthe TCJA enactment. Certain disclosures related to the stranded tax effects, including a description of the accounting policy for ffreleasing income tax effects from AOCI, are required.
For all entities, this guidance is effective for fiscal years beginning after December 15, 2018 and interim periods within those fiscal years. Early adoption is permitted, including adoption in any interim period. The amendments should be applied either inthe period of adoption or retrospectively to each period in which the effect of the change in the U.S. federal corporate incometax rate in the TCJA is recognized.
The Registrants are currently assessing this guidance and the period in which they will adopt it.
Improvements to Accounting for Hedging Activities p g g g

177
QUARTERLY FINANCIAL, COMMON STOCK PRICE AND DIVIDEND DATA (Unaudited) PPL Corporation and Subsidiaries (Millions of Dollars, except per share data)
For the Quarters Ended (a)March 31 June 30 Sept. 30 Dec. 31
2017 Operating revenues $ 1,951 $ 1,725 $ 1,845 $ 1,926Operating income 796 702 777 793NNet income 403 292 355 78Net income available to PPL common shareowners: (b)
Basic EPS 0.59 0.43 0.52 0.11Diluted EPS 0.59 0.43 0.51 0.11
Dividends declared per share of common stock (c) 0.3950 0.3950 0.3950 0.3950Price per common share:
High $ 37.70 $ 40.06 $ 39.83 $ 38.37Low 33.94 37.11 37.36 30.76
2016 Operating revenues $ 2,011 $ 1,785 $ 1,889 $ 1,832Operating income 823 725 786 714NNet income 481 483 473 465Net income available to PPL common shareowners: (b)
Basic EPS 0.71 0.71 0.70 0.68Diluted EPS 0.71 0.71 0.69 0.68
Dividends declared per share of common stock (c) 0.38 0.38 0.38 0.38Price per common share:
High $ 38.07 $ 39.68 $ 37.71 $ 34.74Low 32.80 36.27 33.63 32.19
(a) Quarterly results can vary depending on, among other things, weather. Accordingly, comparisons among quarters of a year may not be indicative of toverall trends and changes in operations.
(b) The sum of the quarterly amounts may not equal annual earnings per share due to changes in the number of common shares outstanding during the year or rounding.
(c) PPL has paid quarterly cash dividends on its common stock in every year since 1946. Future dividends, declared at the discretion of the Board of Directors, will be dependent upon future earnings, cash flows, financial requirements and other factors.

178
Management's Report on Internal Control over Financial Reporting
PPL's management is responsible for establishing and maintaining adequate internal control over financial reporting, as such term is defined in Exchange Act Rule 13a-15(f) or 15d-15(f). PPL's internal control over financial reporting is a process designed to provide reasonable assurance to PPL's management and Board of Directors regarding the reliability of financial reporting and the preparation of financial statements for external purposes in accordance with generally accepted accounting principles. Because of its inherent limitations, internal control over financial reporting may not prevent or detect misstatements.
Under the supervision and with the participation of our management, including our principal executive officer and principal financial officer, we conducted an evaluation of the effectiveness of our internal control over financial reporting based on the framework in "Internal Control - Integrated Framework" (2013) issued by the Committee of SponsoringOrganizations of the Treadway Commission. Based on our evaluation under the framework in "Internal Control -Integrated Framework" (2013), our management concluded that our internal control over financial reporting was effectiveDecember 31, 2017. The effectiveness of our internal control over financial reporting has been audited by Deloitte &Touche LLP, an independent registered public accounting firm.
179
GLOSSARY OF TERMS AND ABBREVIATIONS
PPL Corporation and its subsidiaries p
KU - Kentucky Utilities Company, a public utility subsidiary of U LKE engaged in the regulated generation, transmission, ddistribution and sale of electricity, primarily in Kentucky.
LG&E - Louisville Gas and Electric Company, a public utility subsE idiary of LKE engaged in the regulated generation, transmission, distribution and sale of electricity and the distribution and sale of natural gas in Kentucky.
LKE - LG&E and KU Energy LLC, a subsidiary of PPL and the parent of LG&E, KU and other subsidiaries.
LKS - LG&E and KU Services Company, a subsidiary of LKE that provides administrative, management and support servicesprimarily to LKE and its subsidiaries.
PPL - PPL Corporation, the parent holding company of PPL Electric, PPL Energy Funding, PPL Capital Funding, LKE and ttother subsidiaries.
PPL Capital Funding - PPL Capital Funding, Inc., a financing subsidiary g of PPL that provides financing for the operationsof PPL and certain subsidiaries. Debt issued by PPL Capital Funding ist guaranteed as to payment by PPL.
PPL Electric - PPL Electric Utilities Corporation, a public utility subsidiaryc of PPL engaged in the regulated transmission and distribution of electricity in its Pennsylvania service area and that provides electricity supply to its retail customers in this area as a PLR.
PPL Energy Funding - PPL Energy Funding Corporation, a subsidiary of PPL and the parent holding company of PPL gGlobal and other subsidiaries.
PPL EU Services - PPL EU Services Corporation, a subsidiary of PPL that provides administrative, management and support services primarily to PPL Electric.
PPL Global - PPL Global, LLC, a subsidiary of PPL Energy Fundingl that primarily through its subsidiaries, owns and operates WPD, PPL's regulated electricity distribution businesses in the U.K.y
PPL Services - PPL Services Corporation, a subsidiary of PPL that provides administrative, management and support services to PPL and its subsidiaries.
PPL WPD Limited - an indirect U.K. subsidiary of PPL Global, which d carries a liability for a closed defined benefit pension plan and a receivable from WPD plc. Following a reorganization in October 2015 and October 2017, PPL WPD Limited is an indirect parent to WPD plc having previously been a sister company.
WPD - refers to PPL WPD Limited and its subsidiaries.
WPD (East Midlands) - Western Power Distribution (East Midlands) plc, a British regional electricity distribution utilitycompany.
WPD plc - Western Power Distribution plc, an c indirect U.K. subsidiary of PPL WPD Limited. Its principal indirectly owned subsidiaries are WPD (East Midlands), WPD (South Wales), WPD (South West) and WPD (West Midlands).h
WPD Midlands - refers to WPD (East Midlands) and WPD (West Midlands), collectively.
WPD (South Wales) - Western Power Distribution (South Wales) plc, a British regional electricity distribution utilitycompany.
WPD (South West) - Western Power Distribution (South West) plc, a British regional electricity distribution utility company.
WPD (West Midlands) - Western Power Distribution (West Midlands) plc, a British regional electricity distribution utility company.

180
WKE - Western Kentucky Energy Corp., a subsidiary of LKE E that leased certain non-regulated utility generating plants inwestern Kentucky until July 2009.
Other terms and abbreviations
£ - British pound sterling.
401(h) account(s) - a sub-account established within a qualified pension trust to provide for the payment of retiree medical costs.
Act 11 - Act 11 of 2012 that became effective on April 16, 2012. The Pennsylvania legislation authorized the PUC to approvetwo specific ratemaking mechanisms: the use of a fully projected future test year in base rate proceedings and, subject to certain conditions, a DSIC.
Act 129 - Act 129 of 2008 that became effective in October 2008. The law amended the Pennsylvania Public Utility Code and created an energy efficiency and conservation program and smart metering technology requirements, adopted new PLR electricity supply procurement rules, provided remedies for market misconduct and changed the Alternative Energy Portfolio Standard (AEPS).
Act 129 Smart Meter program - PPL Electric's system-wide meter replacement program that installs wireless digital metersthat provide secure communication between PPL Electric and the meter as well as all related infrastructure.
Advanced Metering System - meters and meter-reading systems that provide two-way communication capabilities, whichcommunicate usage and other relevant data to LG&E and KU at regular intervals, and are alsot able to receive information from LG&E and KU, such as software upgrades and requests to provide meter readings in real time.
AFUDC - allowance for funds used during construction. The cost of C equity and debt funds used to finance construction projects of regulated businesses, which is capitalized as part of construction costs.
AIP - annual iteration process.P
AOCI - accumulated other comprehensive income or loss.I
ARO - asset retirement obligation.O
ATM Program - at-the-market stock offering program.
Cane Run Unit 7 - a natural gas combined-cycle generating un7 it in Kentucky, jointly owned by LG&E and KU.
CCR(s) - coal combustion residual(s). CCRs include fly ash, bottom ash and sulfur dioxide scrubber wastes.
Clean Air Act - federal legislation enacted to address certain environmental issues related to air emissions, including acid rain,tozone and toxic air emissions.
Clean Water Act - federal legislation enacted to address certain et nvironmental issues relating to water quality includingeffluent discharges, cooling water intake, and dredge and fill activities.
COBRA - Consolidated Omnibus Budget Reconciliation Act, which provides individuals the option to temporarily continueemployer group health insurance coverage after termination of employment.
CPCN - Certificate of Public ConvenienceN and Necessity. Authority granted by the KPSC pursuant to Kentucky Revised Statute 278.020 to provide utility service to or for the public or the construction of certain plant, equipment, property or facility for furnishing of utility service to the public.
Customer Choice Act - the Pennsylvania Electricity Generation Customer t Choice and Competition Act, legislation enacted to restructure the state's electric utility industry to create retail access to a competitive market for generation of electricity.

181
Depreciation not normalized - the flow-through incomed tax impact related to the state regulatory treatment of depreciation-related timing differences.
Distribution Automation - advanced grid intelligence enabling LG&E and KU to perform remote monitoring and control, circuit segmentation and "self-healing" of select distribution system circuits, improving grid reliability and efficiency.
DNO - Distribution Network Operator in the U.K.O
DOJ - U.S. Department of Justice.J
DPCR5 - Distribution Price Control Review 5 5, the U.K. five-year rate review period applicable to WPD that commenced April 1, 2010.
DRIP - PPL Amended and Restated Dividend ReinP vestment and Direct Stock Purchase Plan.
DSIC - the Distribution System Improvement ChC arge authorized under Act 11, which is an alternative ratemaking mechanism providing more-timely cost recovery of qualifying distribution system capital expenditures.ff
DSM - Demand Side Management. Pursuant to Kentucky Revised Statute 278.285, the KPSC may determine thereasonableness of DSM programs proposed by any utility under its jurisdiction. DSM programs consist of energy efficiencyprograms intended to reduce peak demand and delay the investment in additional power plant construction, provide customers twith tools and information regarding their energy usage and support energy efficiency.
Earnings from Ongoing Operations - a non-GAAP financial measure of earnings adjusted for the impact of special items and used in " Combined Management's Discussion and Analysis of Financial Condition and Results of Operations" (MD&A).f
EBPB - Employee Benefit Plan Board. The administrator of PPL's U.S. qualified retirement plans, which is charged with the fiduciary responsibility to oversee and manage those plans and the investments associated with those plans.
ECR - Environmental Cost Recovery. Pursuant to Kentucky Revised Statute 278.183, Kentucky electric utilities are entitled to the current recovery of costs of complying with the Clean Air Act, as amended, and those federal, state or local environmentalrequirements that apply to coal combustion wastes and by-products from the production of energy from coal.
ELG(s) - Effluent Limitation Guidelines, re- gulations promulgated by the EPA.
EPA - Environmental Protection Agency, a U.S. government agency.
EPS - earnings per share.S
Fast pot - Under RIIO-ED1, Totex costs that are ret covered in the period they are incurred.
FERC - Federal Energy Regulatory Commission, the U.S. federaC l agency that regulates, among other things, interstatetransmission and wholesale sales of electricity, hydroelectric power projects and related matters.
GAAP - Generally Accepted Accounting Principles in the U.S.P
GBP - British pound sterling.P
GHG - greenhouse gas(es).G
GLT -T gas line tracker. The KPSC approved mechanism for LG&E's recovery of costs associated with gas transmission lines, gas service lines, gas risers, leak mitigation, and gas main replacements. GWh - gigawatt-hour, one million kilowatt hours.
Holdco - Talen Energy Holdings, Inc., a Delaware corporation, which was formed for the purposes of the June 1, 2015 spinoff of PPL Energy Supply, LLC.

182
IBEW - International Brotherhood of Electrical Workers.d
ICP - The PPL Incentive Compensation Plan. This plan provides for incentive compensation to PPL's executive officers and Pcertain other senior executives. New awards under the ICP were suspended in 2012 upon adoption of PPL's 2012 Stock Incentive Plan.
ICPKE - The PPL Incentive Compensation Plan for Key Employees. The ICPKE provides for incentive compensation to certain employees below the level of senior executive.
IRS - Internal Revenue Service, a U.S. government agency.
KPSC - Kentucky Public Service Commission, the state agency that has jurisdiction over the regulation of rates and service of utilities in Kentucky.
KU 2010 Mortgage Indenture - KU's Indenture, dated as of October 1, 2010, to The Bank of New York Mellon, assupplemented.
kVA - kilovolt ampere.
kWh - kilowatt hour, basic unit of electrical energy.
LCIDA - Lehigh County Industrial Development Authority.
LG&E 2010 Mortgage Indenture - LG&E's Indenture, dated as of October 1, 2010, to The Bank of New York Mellon, as supplemented.
LIBOR - London Interbank Offered Rate.
Margins - a non-GAAP financial measure of performance used in "Combined Management's Discussion and Analysis of Financial Condition and Results of Operations" (MD&A).
MMBtu - one million British Thermal Units.
MOD - a mechanism applied in the U.K. to adjust allowed baseD demand revenue in future periods for differences in prior periods between actual values and those in the agreed business plan.
Moody's - Moody's Investors Service, Inc., a credit rating agency.
MPR- Mid-period review, which is a review of output requirements in RIIO-ED1 that can be initiated by Ofgem halfway athrough the price control covering material changes to existing outputs that can be justified by clear changes in government policy or new outputs that may be needed to meet the needs of consumers and other network users.
MW - megawatt, one thousand kilowatts.W
NAAQS - National Ambient Air Quality Standards periodically adopted pursuant to the Clean Air Act.S
NERC - North American Electric Reliability Corporation.C
NGCC - natural gas-fired combined-cycle generating plant.C
NPNS - the normal purchases and normal sales exception as permitteS d by derivative accounting rules. Derivatives that qualify for this exception may receive accrual accounting treatment.
NRC - Nuclear Regulatory Commission, the U.S. federaC l agency that regulates nuclear power facilities.
OCI - other comprehensive income or loss.I

183
Ofgem - Office of Gas and Electricity Markets, the British agency that regulates transmission, distribution and wholesale salesof electricity and related matters.
OVEC -C Ohio Valley Electric Corporation, located in Piketon, Ohio, an entity in which LKE indirectly owns an 8.13% interest (consists of LG&E's 5.63% and KU's 2.50% interests), which is accounted for as a cost-method investment. OVEC owns and operates two coal-fired power plants, the Kyger Creek plant in Ohio and the Clifty Creek plant in Indiana, with combined capacities of 2,120 MW.
PEDFA - Pennsylvania Economic Development Financing Authority.
Performance unit - stock-based compensation award that represents a vat riable number of shares of PPL common stock that aa recipient may receive based on PPL's attainment of (i) total shareowner return (TSR) over a three-year performance period as compared to companies in the Philadelphia Stock Exchange Utility Index; or (ii) corporate return on equity (ROE) based on theaverage of the annual ROE for each year of the three-year performance period.
PJM - PJM Interconnection, L.L.C., operator of the electricity tranM smission network and electricity energy market in all or parts of Delaware, Illinois, Indiana, Kentucky, Maryland, Michigan, New Jersey, North Carolina, Ohio, Pennsylvania,Tennessee, Virginia, West Virginia and the District of Columbia.
PLR - Provider of Last Resort, the role of R PPL Electric in providing default electricity supply within its delivery area to retailucustomers who have not chosen to select an alternative electricity supplier under the Customer Choice Act.
PP&E - property, plant and equipment.
PPL Energy Supply - prior to the June 1, 2015 spinoff, PPL Energyy Supply, LLC, a subsidiary of PPL Energy Funding and ythe parent company of PPL EnergyPlus and other subsidiaries.
PUC - Pennsylvania Public Utility Commission, the state agency that regulates certain ratemaking, services, accounting and operations of Pennsylvania utilities.
RAV - regulatory asset value. This term, usV ed within the U.K. regulatory environment, is also commonly known as RAB or regulatory asset base. RAV is based on historical investment costs at time of privatization, plus subsequent allowed additionsless annual regulatory depreciation, and represents the value on which DNOs earn a return in accordance with the regulatory cost of capital. RAV is indexed to Retail Price Index (RPI) in order to allow for the effects of inflation. RAV additions have been based on a percentage of annual total expenditures that have a long-term benefit to WPD (similar to capital projects for tthe U.S. regulated businesses that are generally included in rate base).
RCRA - Resource Conservation and Recovery Act of 1976.
RECs - renewable energy credits.s
Regional Transmission Expansion Plan - PJM conducts a long-range Regional Transmission Expansion Planningprocess that identifies changes and additions to the PJM grid necessary to ensure future needs are met for both the reliabilityand the economic performance of the grid. Under PJM agreements, transmission owners are obligated to build transmission projects assigned to them by the PJM Board.
Registrant(s) - refers to the Registrants named on the cover of this Report (each a "Registrant" and collectively, the"Registrants").
RFC - ReliabilityFirst Corporation, one of eight regional entities wC ith delegated authority from NERC that work to safeguard the reliability of the bulk power systems throughout North America.
RIIO - Ofgem's framework for setting U.K. regulated gas and elO ectric utility price controls which stands for "Revenues = Incentive + Innovation + Outputs." RIIO-1 refers to the first generation of price controls under the RIIO framework. RIIO-ED1refers to the RIIO regulatory price control applicable to the operators of U.K. electricity distribution networks, the duration of nwhich is April 2015 through March 2023. RIIO-2 refers to the second generation of price controls under the RIIO framework. RIIO-ED2 refers to the second regulatory price control applicable to the operators of U.K. electricity distribution networks,which will begin in April 2023.

184
Riverstone - Riverstone Holdings LLC, a Delaware limited liability company and, as of December 6, 2016, ultimate parent company of the entities that own the competitive power generation business contributed to Talen Energy.
RJS Power - RJS Generation Holdings LLC, a Delaware limited liabilitr y company controlled by Riverstone, that owns thecompetitive power generation business contributed by its owners to Talen Energy.
RPI - retail price index, is a measure of inflation in the UniteI d Kingdom published monthly by the Office for National Statistics.
Sarbanes-Oxley - Sarbanes-Oxley Act of 2002, which sets requirements for management's assessment of internal controlsfor financial reporting. It also requires an independent auditor to make its own assessment.
SCRs - selective catalytic reduction, a pollution cos ntrol process for the removal of nitrogen oxide from exhaust gas.
Scrubber - an air pollution control device that can remove particulatr es and/or gases (primarily sulfur dioxide) from exhaust gases.
SEC - the U.S. Securities and Exchange Commission, a U.S. governC ment agency primarily responsible to protect investors and maintain the integrity of the securities markets.
SERC - SERC Reliability Corporation, one of C eight regional entities with delegated authority from NERC that work tosafeguard the reliability of the bulk power systemf s throughout North America.
SIP - PPL Corporation's Amended and Restated 2012 Stock Incentive Plan.P
Slow pot - Under RIIO-ED1, Totex costs that are added (capitalized) to RAV and recovered through depreciation over a 20 tot45 year period.
Smart metering technology - technology that can measure, among other things, time of electricity consumption to permit yoffering rate incentives for usage during lower cost or demand intervals. The use of this technology also has the potential tostrengthen network reliability.
S&P - Standard & Poor's Ratings Services, a credit rating agency.P
Superfund - federal environmental statute that addresses remediation of contaminated sites; states also have similar statutes.d
Talen Energy - Talen Energy Corporation, the Delawarey corporation formed to be the publicly traded company and owner of the competitive generation assets of PPL Energy Supply and certain affiliates of Riverstone.
Talen Energy Marketing - Talen Energy Marketing, LLC, the new name of g PPL EnergyPlus subsequent to the spinoff of PPL Energy Supply.
TCJA - Tax Cuts and Jobs Act. Comprehensive U.S. federal tax legislation enacted on December 22, 2017.d
Total shareowner return - the change in market value of a share of the Company's common stock plus the value of alldividends paid on a share of the common stock during the applicable performance period, divided by the price of the common stock as of the beginning of the performance period. The price used for purposes of this calculation is the average share pricefor the 20 trading days at the beginning and end of the applicable period.
Totex (total expenditures) - Totex generally consists of all the expenditures relating to WPD's regulated activities with theexception of certain specified expenditure items (Ofgem fees, National Grid transmission charges, property and corporateincome taxes, pension deficit funding and cost of capital). The annual net additions to RAV are calculated as a percentage of Totex. Totex can be viewed as the aggregate net network investment, net network operating costs and indirect costs, less any ttcash proceeds from the sale of assets and scrap.

185
Treasury Stock Method - a method applied to calculate diluted EPS thatd assumes any proceeds that could be obtained upontexercise of options and warrants (and their equivalents) would be used to purchase common stock at the average market priceduring the relevant period.
TRU - a mechanism applied in the U.K.U to true-up inflation estimates used in determining base demand revenue.
U.K. Finance Acts - refers to U.K. Finance Act of 2015 and 2016, enacted in November 2015 and September 2016 respectively, which collectively reduced the U.K. statutory corporate income tax rate from 20% to 19%, effective April 1, 2017ffand from 19% to 17%, effective April 1, 2020.
VEBA - Voluntary Employee Benefit Association Trust, accounts for health and welfare plans for future benefit payments for employees, retirees or their beneficiaries.
VSCC - Virginia State Corporation Commission, the state agencyC that has jurisdiction over the regulation of Virginia corporations, including utilities.

[THIS PAGE INTENTIONALLY LEFT BLANK]

The 2018 forecast range for earnings is $2.20 to $2.40 per share, with a midpoint of $2.30 per share. PPL's 2018 forecast includes the full impact of U.S. tax reform.
2018 Earnings 2017 Earnings fromPer share Forecast Midpoint Ongoing OperationsU.K. Regulated $1.32 $1.28Kentucky Regulated 0.52 0.57Pennsylvania Regulated 0.57 0.51Corporate and Other (0.11) (0.11)Total $2.30 $2.25
U.K. Regulated Segment PPL projects higher segment earnings in 2018 compared with 2017. The increase in reported earnings reflects the 2017 unfavorable impact of U.S. tax reform and unrealized losses on foreign currency economic hedges. Excluding these 2017 special items, the increase is expected to be driven primarily by higher foreign currency exchange rates andhigher pension income, partially offset by higher taxes and the effect of share dilution. The remaining 2018 foreign currency exposure for this segment is 100 percent hedged at an average rate of $1.34 per pound, compared to an average rate of $1.20 per pound in 2017.
Kentucky Regulated Segment PPL projects higher reported segment earnings in 2018 compared with 2017, which reflects the 2017 unfavorable impact of U.S. tax reform.Excluding this 2017 special item, earnings in 2018 compared with 2017are projected to be lower, driven primarily by higher operation and maintenance expense, higher depreciation expense, higher interest expense, a lower tax shield on holding company interest and expenses, and the effect of share dilution, partially offset by an assumed return tonormal weather and higher base electricity and gas rates effective July 1, 2017.
Pennsylvania Regulated Segment PPL projects higher segment earnings in 2018 compared with 2017, driven primarily by higher transmission earnings and lower operationand maintenance expense, partially offset by higher depreciationexpense, higher interest expense and the effect of share dilution.
Corporate and Other PPL projects lower reported costs in 2018 compared with 2017, whichreflects the 2017 unfavorable impact of U.S. tax reform. Excluding this 2017 special item, PPL projects costs to be flat in this category in 2018compared with 2017 with a lower tax shield on holding companyinterest expense offset by lower financing costs.
RECONCILIATION OF FINANCIAL MEASURES (UNAUDITED) AND 2018 EARNINGS FORECAST
PPL Corporation 2017 Annual Report v
2018 Earnings Forecast by Segment
Reconciliation of Net Income to Earnings from Ongoing Operations
(Per Share - Diluted)
U.K. Reg. KY Reg. PA Reg. Corp. & OtherOther Total 2017 Total 2016
Net Income $0.95 $0.42 $0.52 $(0.25) $1.64 $2.79
Less: Special Items (expense) benefit:*
Foreign currency economic hedges (0.15) - - - (0.15) (0.01)
U.S. tax reform (0.18) (0.16) 0.01 (0.14) (0.47) -
Settlement of foreign currency contracts - - - - - 0.30
Change in U.K. tax rate - - - - - 0.05
Settlement of indemnification agreement - 0.01 - - 0.01 -
Total Special Items (0.33) (0.15) 0.01 (0.14) (0.61) 0.34
Earnings from Ongoing Operations $1.28 $0.57 $0.51 $(0.11) $2.25 $2.45
*See Combined Management's Discussion and Analysis of Financial Condition and Results of Operations for additional information on special items.

DIRECTORS & OFFICERS
VI PPL Corporation 2017 Annual Report
DIRECTORS
Rodney C. Adkins, 59, President of 3RAM Group, LLC, an investment, consulting and property management firm. He retired as a Senior Vice President of International Business Machines Corporation, a globally integrated technology and consulting company.
John W. Conway, 72, retired Chief Executive Officer of Crown Holdings, Inc., an international manufacturer of packaging products for consumer goods. He remains Chairman of the Board of Crown Holdings.
Steven G. Elliott, 71, retired as Senior Vice Chairman of The Bank of New York Mellon Corporation, an investment management and investment servicing company.
Raja Rajamannar, 56, Chief Marketing & Communications Officer and President, Heathcare, of MasterCard International Incorporated, a technology company in theglobal payments industry.
Craig A. Rogerson, 61, Chairman, President and Chief Executive Officer of Hexion Inc.,a global producer of thermoset resins as well as other chemical platforms serving awide range of market applications.
William H. Spence, 61, Chairman, President and Chief Executive Officer of PPL Corporation.
Natica von Althann, 67, a founding partner of C&A Advisors, a consulting firm in the areas of financial services and risk management, from 2009 until 2013. She retired in 2008 as the Senior Credit Risk Management Executive for Bank of America and Chief Credit Officer of U.S. Trust, an investment management company.
Keith H. Williamson, 65, Executive Vice President, Secretary and General Counsel of Centene Corporation, a provider of Medicaid-managed care and specialty healthcare services for under-insured and uninsured individuals.
Phoebe A. Wood, 64, principal of CompaniesWood, a consulting firm specializing inearly stage investments. She is the former Vice Chairman and Chief Financial Officer of Brown-Forman Corporation, a diversified consumer products manufacturer.
Armando Zagalo de Lima, 59, retired as an Executive Vice President of Xerox Corporation, a multinational enterprise for business process and document management.
BOARD COMMITTEES
Executive CommitteeWilliam H. Spence, ChairJohn W. ConwaySteven G. ElliottCraig A. RogersonNatica von Althann
Audit CommitteeSteven G. Elliott, ChairRodney C. AdkinsRaja RajamannarCraig A. RogersonKeith H. WilliamsonArmando Zagalo de Lima
Compensation, Governanceand Nominating CommitteeCraig A. Rogerson, ChairJohn W. ConwayRaja RajamannarNatica von AlthannPhoebe A. Wood
Finance CommitteeNatica von Althann, ChairRodney C. AdkinsJohn W. ConwaySteven G. ElliottKeith H. WilliamsonArmando Zagalo de Lima
EXECUTIVE OFFICERS
William H. Spence, Chairman, President and Chief Executive Officer, PPL CorporationJoanne H. Raphael, Senior Vice President, General Counsel and Corporate Secretary, PPL CorporationVincent Sorgi, Senior Vice President and Chief Financial Officer, PPL CorporationGregory N. Dudkin, President, PPL Electric Utilities CorporationRobert A. Symons, Chief Executive, Western Power DistributionPaul W. Thompson, Chairman of the Board, Chief Executive Officer and President, LG&E and KU Energy LLCStephen K. Breininger, Vice President and Controller, PPL CorporationTadd J. Henninger, Vice President and Treasurer, PPL Corporation

SHAREOWNER INFORMATION
PPL Corporation 2017 Annual Report VII
Annual Meeting Shareowners are invited to attend PPL Corporation's AnnualMeeting on Wednesday, May 16, 2018, at the PPL Center, 701 Hamilton Street, Allentown, Pa. The meeting will begin at9 a.m. Eastern time.
Stock Exchange Listing PPL Corporation common stock is listed on the New York Stock Exchange (NYSE). The symbol is PPL. On March 16, 2018, the closing price per share was $28.12, and there were 55,200 shareowners of record.
2017
High Low DividendsDeclared
1st quarter $37.95 $33.72 $0.395
2nd quarter 40.20 36.91 0.395
3rd quarter 39.90 37.19 0.395
4th quarter 38.55 30.74 0.395
2016
High Low DividendsDeclared
1st quarter $38.09 $32.18 $0.38
2nd quarter 39.92 36.14 0.38
3rd quarter 37.88 33.52 0.38
4th quarter 35.07 32.08 0.38
The company has paid cash dividends on its common stock in every quarter since 1946. The annualized dividend was $1.58per share in 2017 and $1.52 per share in 2016. On February 22, 2018, PPL declared a quarterly dividend of $0.41 per share (equivalent to $1.64 annualized), effective with the dividendpaid April 2, 2018, to shareowners of record on March 9, 2018.
Dividend Calendar Subject to the declaration of dividends on PPL Common Stock by the PPL Board of Directors or its Executive Committee, dividends are paid on the first business day of April, July,October and January. The record dates for dividends for thebalance of 2018 are expected to be June 8, September 10 andDecember 10.
PPL's Website: www.pplweb.com Shareowners can access PPL publications such as annual and quarterly reports to the Securities and Exchange Commission (SEC Forms 10-K and 10-Q), other PPL filings, corporate governance materials, news releases, stock quotes andhistorical performance. Visitors to our website may subscribe to receive automated email alerts for SEC filings, earnings news releases, daily stock prices and other financial news.
Financial reports, which are available at www.pplweb.com, will be mailed without charge upon request by contacting:
PPL Treasury Dept.Two North Ninth Street Allentown, PA 18101Email: [email protected]: PPL Corporate Offices, 610-774-5151, orEQ Shareowner Services, 1-800-345-3085
Lost Dividend Checks Dividend checks lost by investors, or those that may be lost in the mail, will be replaced if the check has not been located bythe 10th business day following the payment date.
Direct Stock Purchase and Dividend Reinvestment Plan (Plan) PPL offers investors the opportunity to invest up to $25,000 per calendar month to acquire shares of PPL common stock through its Plan. Shareowners may choose to have their dividends fully or partially reinvested in PPL common stock, or to receive full payment of cash dividends by check or EFT.Participants in the Plan may choose to have their commonstock certificates deposited into their Plan account.
Direct Registration System PPL participates in the Direct Registration System (DRS). Shareowners may choose to have their common stock certificates converted to book entry form within the DRS by submitting their certificates to PPL's transfer agent.
Online Account Access Registered shareowners can activate their account for online access by visiting shareowneronline.com.
Shareowner Inquiries, Transfer Agent and Registrar; Dividend Disbursing Agent; Plan Administrator EQ Shareowner Services
1110 Centre Pointe Curve, Suite 101Mendota Heights, MN 55120Toll-free: 1-800-345-3085Outside U.S.: 1-651-450-4064Website: shareowneronline.com
Corporate Offices PPL Corporation
Two North Ninth StreetAllentown, PA 18101610-774-5151
PPL and the PPL logo are trademarks of PPL Corporationor an affiliate. S&P 500 is a registered trademark of McGraw-Hill, Inc.
© 2018 PPL Corporation. All rights reserved.

PPL Corporation | Two North Ninth Street, Allentown PA 18101-1179 | www.pplweb.com